Abstract
As a classic nonlinear filtering method, Spectral Amplitude Modulation (SAM) is widely used in the field of bearing fault characteristic frequency identification. However, when the vibration signal contains high-intensity noise interference, the accuracy of SAM in identifying fault characteristic frequencies is greatly reduced. To solve the above problems, a Data Enhancement Spectral Amplitude Modulation (DA-SAM) method is proposed. This method further processes the modified signal through improved wavelet transform (IWT), calculates its logarithmic maximum square envelope spectrum to replace the original square envelope spectrum, and finally completes SAM. By highlighting signal characteristics and strengthening feature information, interference information can be minimized, thereby improving the robustness of the SAM method. In this paper, this method is verified through fault data sets. The research results show that this method can effectively reduce the interference of noise on fault diagnosis, and the fault characteristic information obtained is clearer. The superiority of this method compared with the SAM method, Autogram method, and fast spectral kurtosis diagram method is proved.
1. Introduction
Rolling bearings are widely used in rotating machinery and are one of the parts most prone to failure. Their working environment is relatively complex and harsh. Once a failure occurs, it will cause major safety accidents and even casualties. According to the statistics, in rotating machinery failure cases, 40–45% are caused by rolling bearing failure [1]. Therefore, the importance of fault detection in rolling bearings is self-evident [2]. It is precisely because of the complexity of its working conditions that the interference of various noises brings great difficulties to the detection of faults, and it is difficult to identify faults in the early stages; therefore, identifying weak faults under complex conditions is a top priority.
Among the currently known fault diagnosis techniques, the resonance demodulation technique [3] is undoubtedly one of the most classic methods, also known as envelope analysis. The corresponding fault information can be obtained by band-pass filtering the resonance band with a high signal-to-noise ratio and then demodulating it using the Hilbert transform [4,5]. However, the selection of the resonance band is a relatively empirical process and is difficult in practical engineering applications. Therefore, in order to overcome this problem, Antoni et al. proposed fast spectral kurtosis [6,7,8], which calculates the kurtosis value of narrowband filtered signals, uses the dichotomy and trisection methods to divide the frequency band, and selects the frequency band with the largest kurtosis value for demodulation. However, with the deepening of research, the shortcomings of this method have gradually been exposed, and its kurtosis index is susceptible to noise and random pulses [9]. In order to solve this problem, scholars have proposed a large number of improvement methods, such as Protrugram [10], Infogram [11], enhanced Kurtogram [12], improved Kurtogram [13] and Autogram [14], and Antoni et al. [15] discussed a fast calculation method of Spectral Correlation (SC), all of which have achieved good results. In addition, other kurtosis methods based on the period index have been proposed [16,17,18,19,20]. These methods can specify the frequency band in which the periodic component is located, and all suppress noise and irrelevant pulses to a certain extent. At present, finding the best demodulation band is still an arduous task. Various kurtosis diagram methods can only extract one best band, and much important information may be lost due to the impact signal generated by the fault. If the working conditions are complex, fault characteristic information cannot be effectively extracted.
So, in order to solve the above problems, Moshrefzadeh [21] proposed a new nonlinear filtering method, namely spectral amplitude modulation (Spectral Amplitude Modulation (SAM)), which performs Fourier transformation on the acquired vibration signal to obtain its amplitude spectrum and phase spectrum, and then assigns different weight indices to its phase spectrum (Magnitude order (MO)); the resulting edit spectrum is then inverse Fourier transformed to obtain a series of modified signals. Finally, the square spectrum of the modified signal is Fourier transformed to obtain the square envelope spectrum to view the fault characteristic information. SAM is not only efficient, but also simple to calculate, and has achieved remarkable results in the field of fault diagnosis. However, because it amplifies both fault components and interference components, its effectiveness is greatly reduced. In this regard, Qin et al. [22] studied how to use the improved empirical wavelet transform (EWT) to diagnose complex weak faults in rolling bearings; Chen et al. [23] studied a blind signal deconvolution method guided by generalized statistical indicators for fault diagnosis of railway vehicle axle box bearings; Shi et al. [24] studied a new adaptive multi-parameter unsaturated bistable stochastic resonance (AMUBSR) system for weak signal enhancement in mechanical fault diagnosis; Han et al. [25] studied a bearing fault diagnosis method based on clustering and frequency domain sparse representation; and Chen et al. [26] studied the probability distribution and typical sparsity measures of the generalized envelope based on the Hilbert transform and their application in mechanical condition monitoring.
Although the above work has achieved excellent results, the application of SAM in practical projects still faces some challenges. First, while SAM enhances the weight of fault components, noise components with similar amplitudes also increase, which will lead to invalid SAM diagnosis results; second, in a strong interference environment, the interference component may be the dominant component of the signal. Although the signal has been modified, it is still possible to drown fault information in interference. Based on this, a data-enhanced spectral amplitude modulation method (DA-SAM) is proposed. In this research, first, the signal is transferred from the time domain to the frequency domain through Fourier transform to obtain the amplitude and phase, and the amplitude is assigned different weight indices to obtain the modified amplitude; then, the obtained modified amplitude is combined with its original phase to obtain the modified signal, and the improved wavelet transform is used to further reduce noise and reconstruct; finally, its logarithmic maximum square envelope spectrum is generated to complete the DA-SAM diagnosis. The feasibility and superiority of this study compared with some of the classic methods are verified.
2. Spectral Amplitude Modulation
SAM, as a nonlinear filtering method [27], extracts frequency components of different energies in the signal by setting different MOs and does not need to input any parameters in advance, thereby realizing bearing fault diagnosis.
First, define as the original input signal, transform the vibration signal from the time domain to the frequency domain through Fourier transform, and obtain its phase Φ and amplitude , as follows:
(1) where is the imaginary unit and FT is the Fourier transform. The phase is unchanged and different weight indices are assigned to the amplitude spectrum to adjust the amplitude in different frequency bands; then, the original phase is combined with the modulated amplitude to obtain the edited spectrum, and finally inverse Fourier transform is performed to obtain the corrected signal. This nonlinear filtering process is as follows:
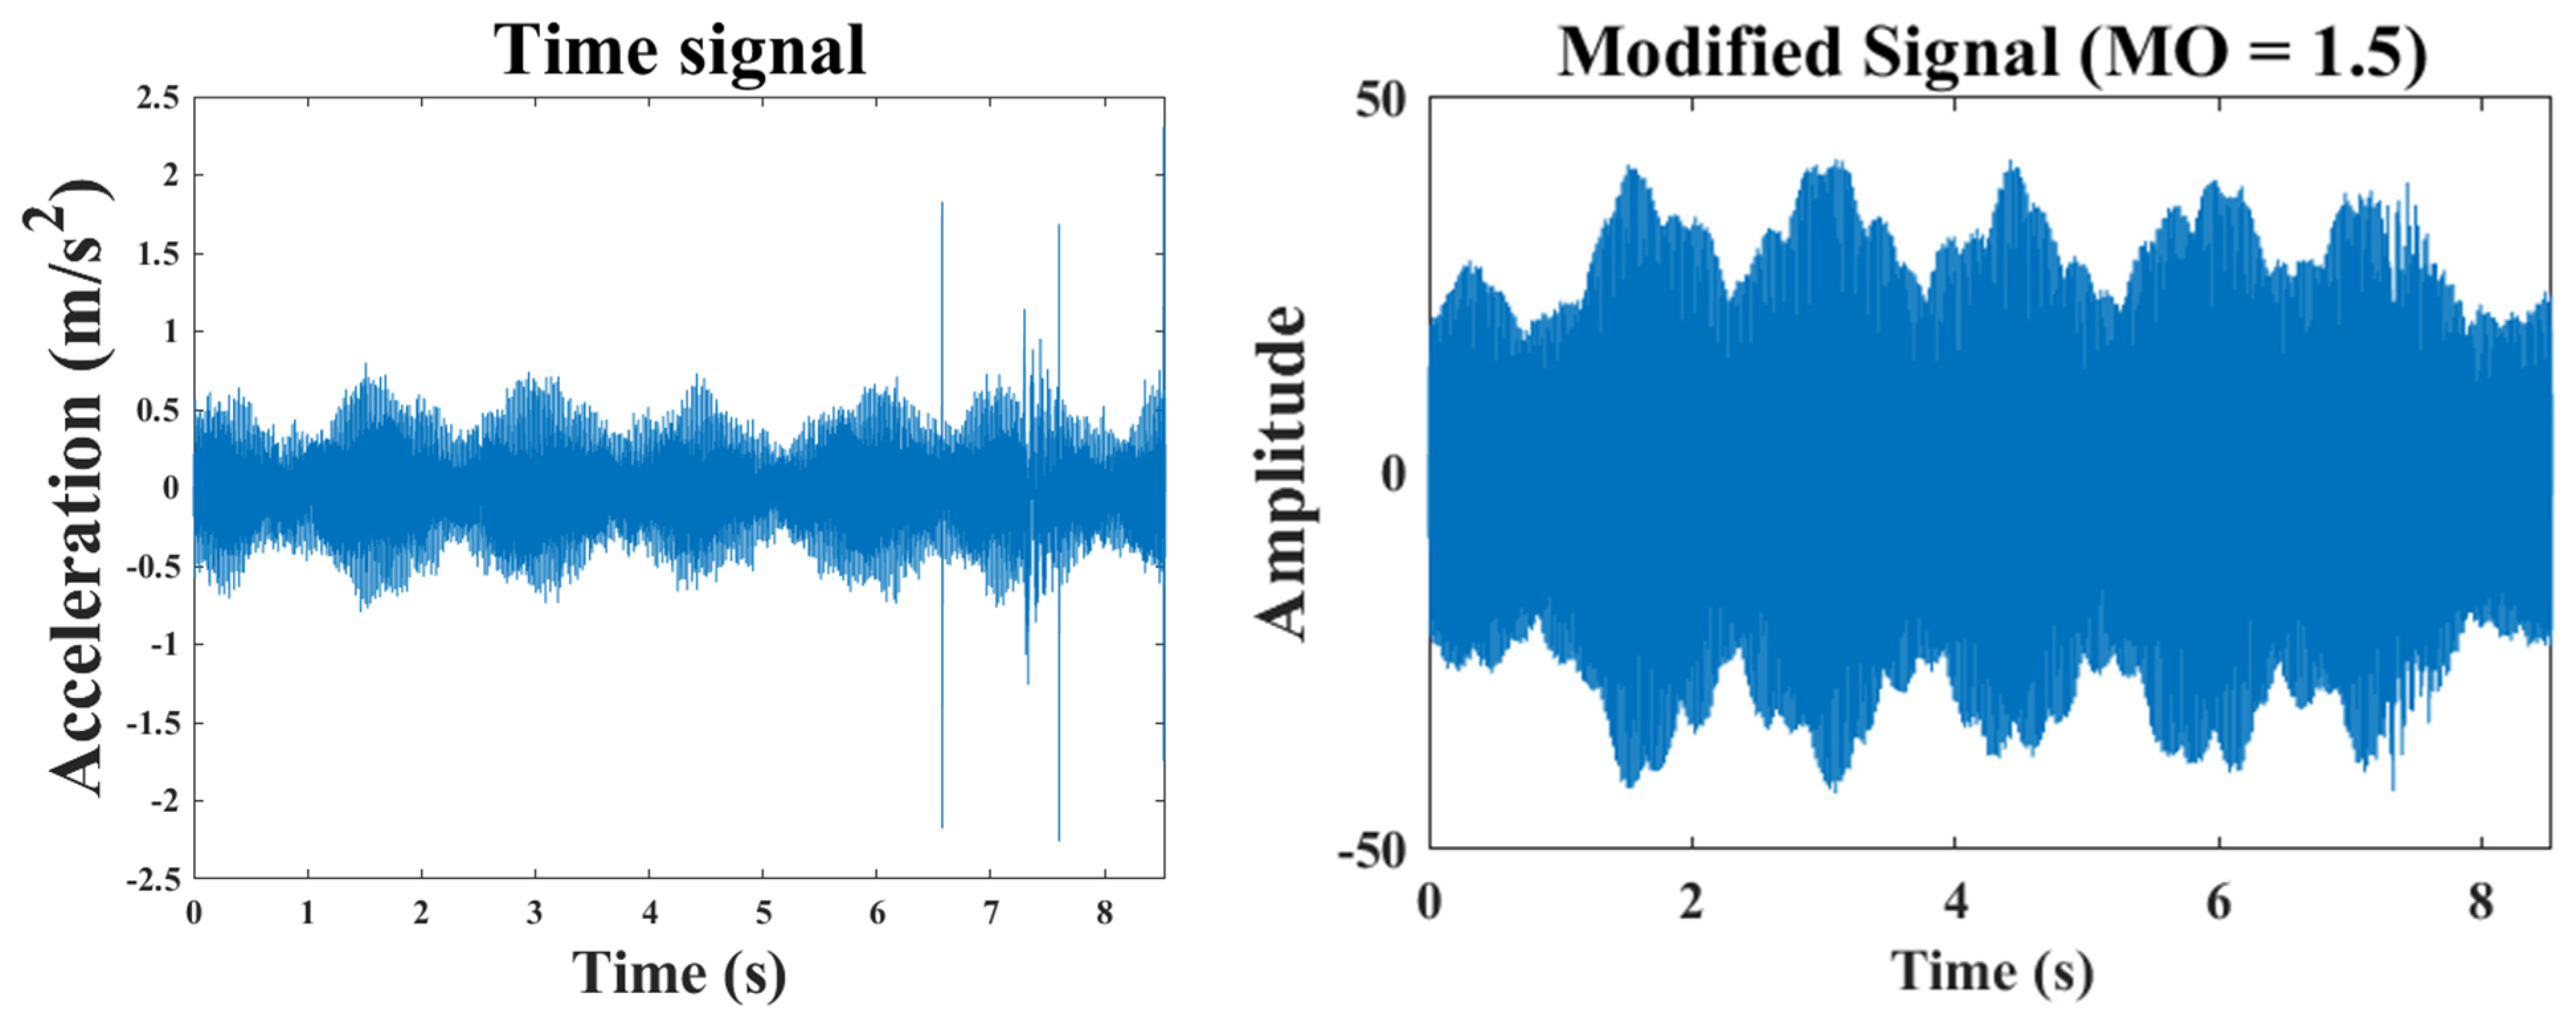
In Equation (2), represents the corrected signal under different weight exponents, and IFT stands for the inverse Fourier transform. The recommended range for is with a step size of 0.1. The advantage of this approach is that it allows for fault diagnosis in different situations by adjusting the value of , effectively shielding interference components. The effects of different values on the signal can be categorized into three main types: When , the parts of the original signal with relatively small amplitudes are amplified, which is most suitable when the noise interference is low. When , this range weakens the components with larger amplitudes while enhancing those with smaller amplitudes, while still retaining the relative levels of all components. When , this range is most suitable for cases with significant amplitude disturbances. The effects are illustrated in Figure 1.
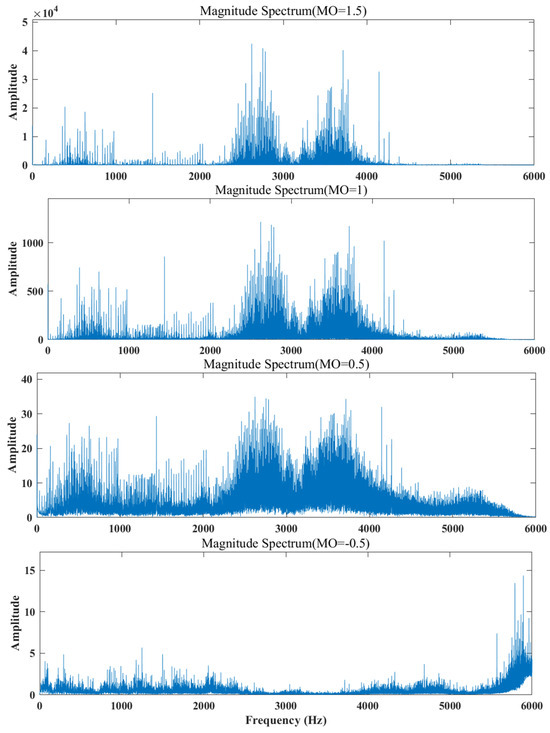
Figure 1.
Signal spectrum under different MOs.
After obtaining the corrected signal, the Hilbert transform is then used to calculate its analytic signal, as shown in the following equation:
In Equation (3), represents the analytic signal, denotes the Hilbert transform, and finally, the Fourier transform is performed to obtain the squared envelope spectrum, as shown in the following equation:
3. Defects in Spectral Amplitude Modulation
SAM reconstructs the modified signal by assigning different weights to the amplitude of the original signal, which has proven to be a convenient, efficient, and automated method to identify frequencies at different energy levels. However, a square envelope is obtained using a Fourier transform, which, although the Fourier transform provides the frequency components of the signal, does not provide information about these frequency components over time. It is only suitable for analyzing steady-state signals (signal characteristics do not change with time). As we all know, the vibration signal of rolling bearings is a classic unstable signal. Although it has been corrected, its nature remains unchanged. Non-stationary signals often contain nonlinear and transient features, which cannot be effectively captured and represented in the Fourier transform. Moreover, it requires the signal to be periodically processed or subjected to window function processing before analysis, but window function processing will lead to spectrum leakage and affect the frequency resolution. The beginning and end parts of the signal may have edge effects in the Fourier transform, resulting in inaccurate analysis results. Moreover, the Fourier transform always assumes that the signal is stationary, and cannot provide an accurate description of non-stationary processes.
4. Enhanced Spectral Amplitude Modulation Method
The method mentioned in this article solves the above shortcomings and improves the SAM method. It processes the modified signal by replacing FT with IWT. IWT can provide time–frequency-localized information about the signal, which means that it can reveal the changes in frequency components in the signal with time, making it very suitable for analyzing non-stationary signals. By selecting different wavelet bases and adjusting the scale of the transformation, IWT can adapt to different types of signals and data, making its application in different fields more flexible and extensive. Moreover, IWT performs well in denoising. It can effectively distinguish between abrupt parts and noise in the signal, thereby realizing the removal of non-stationary signals. Although its computational complexity may be higher than that of Fourier transform, it is implemented through fast algorithms, making it of high practical value in practical applications.
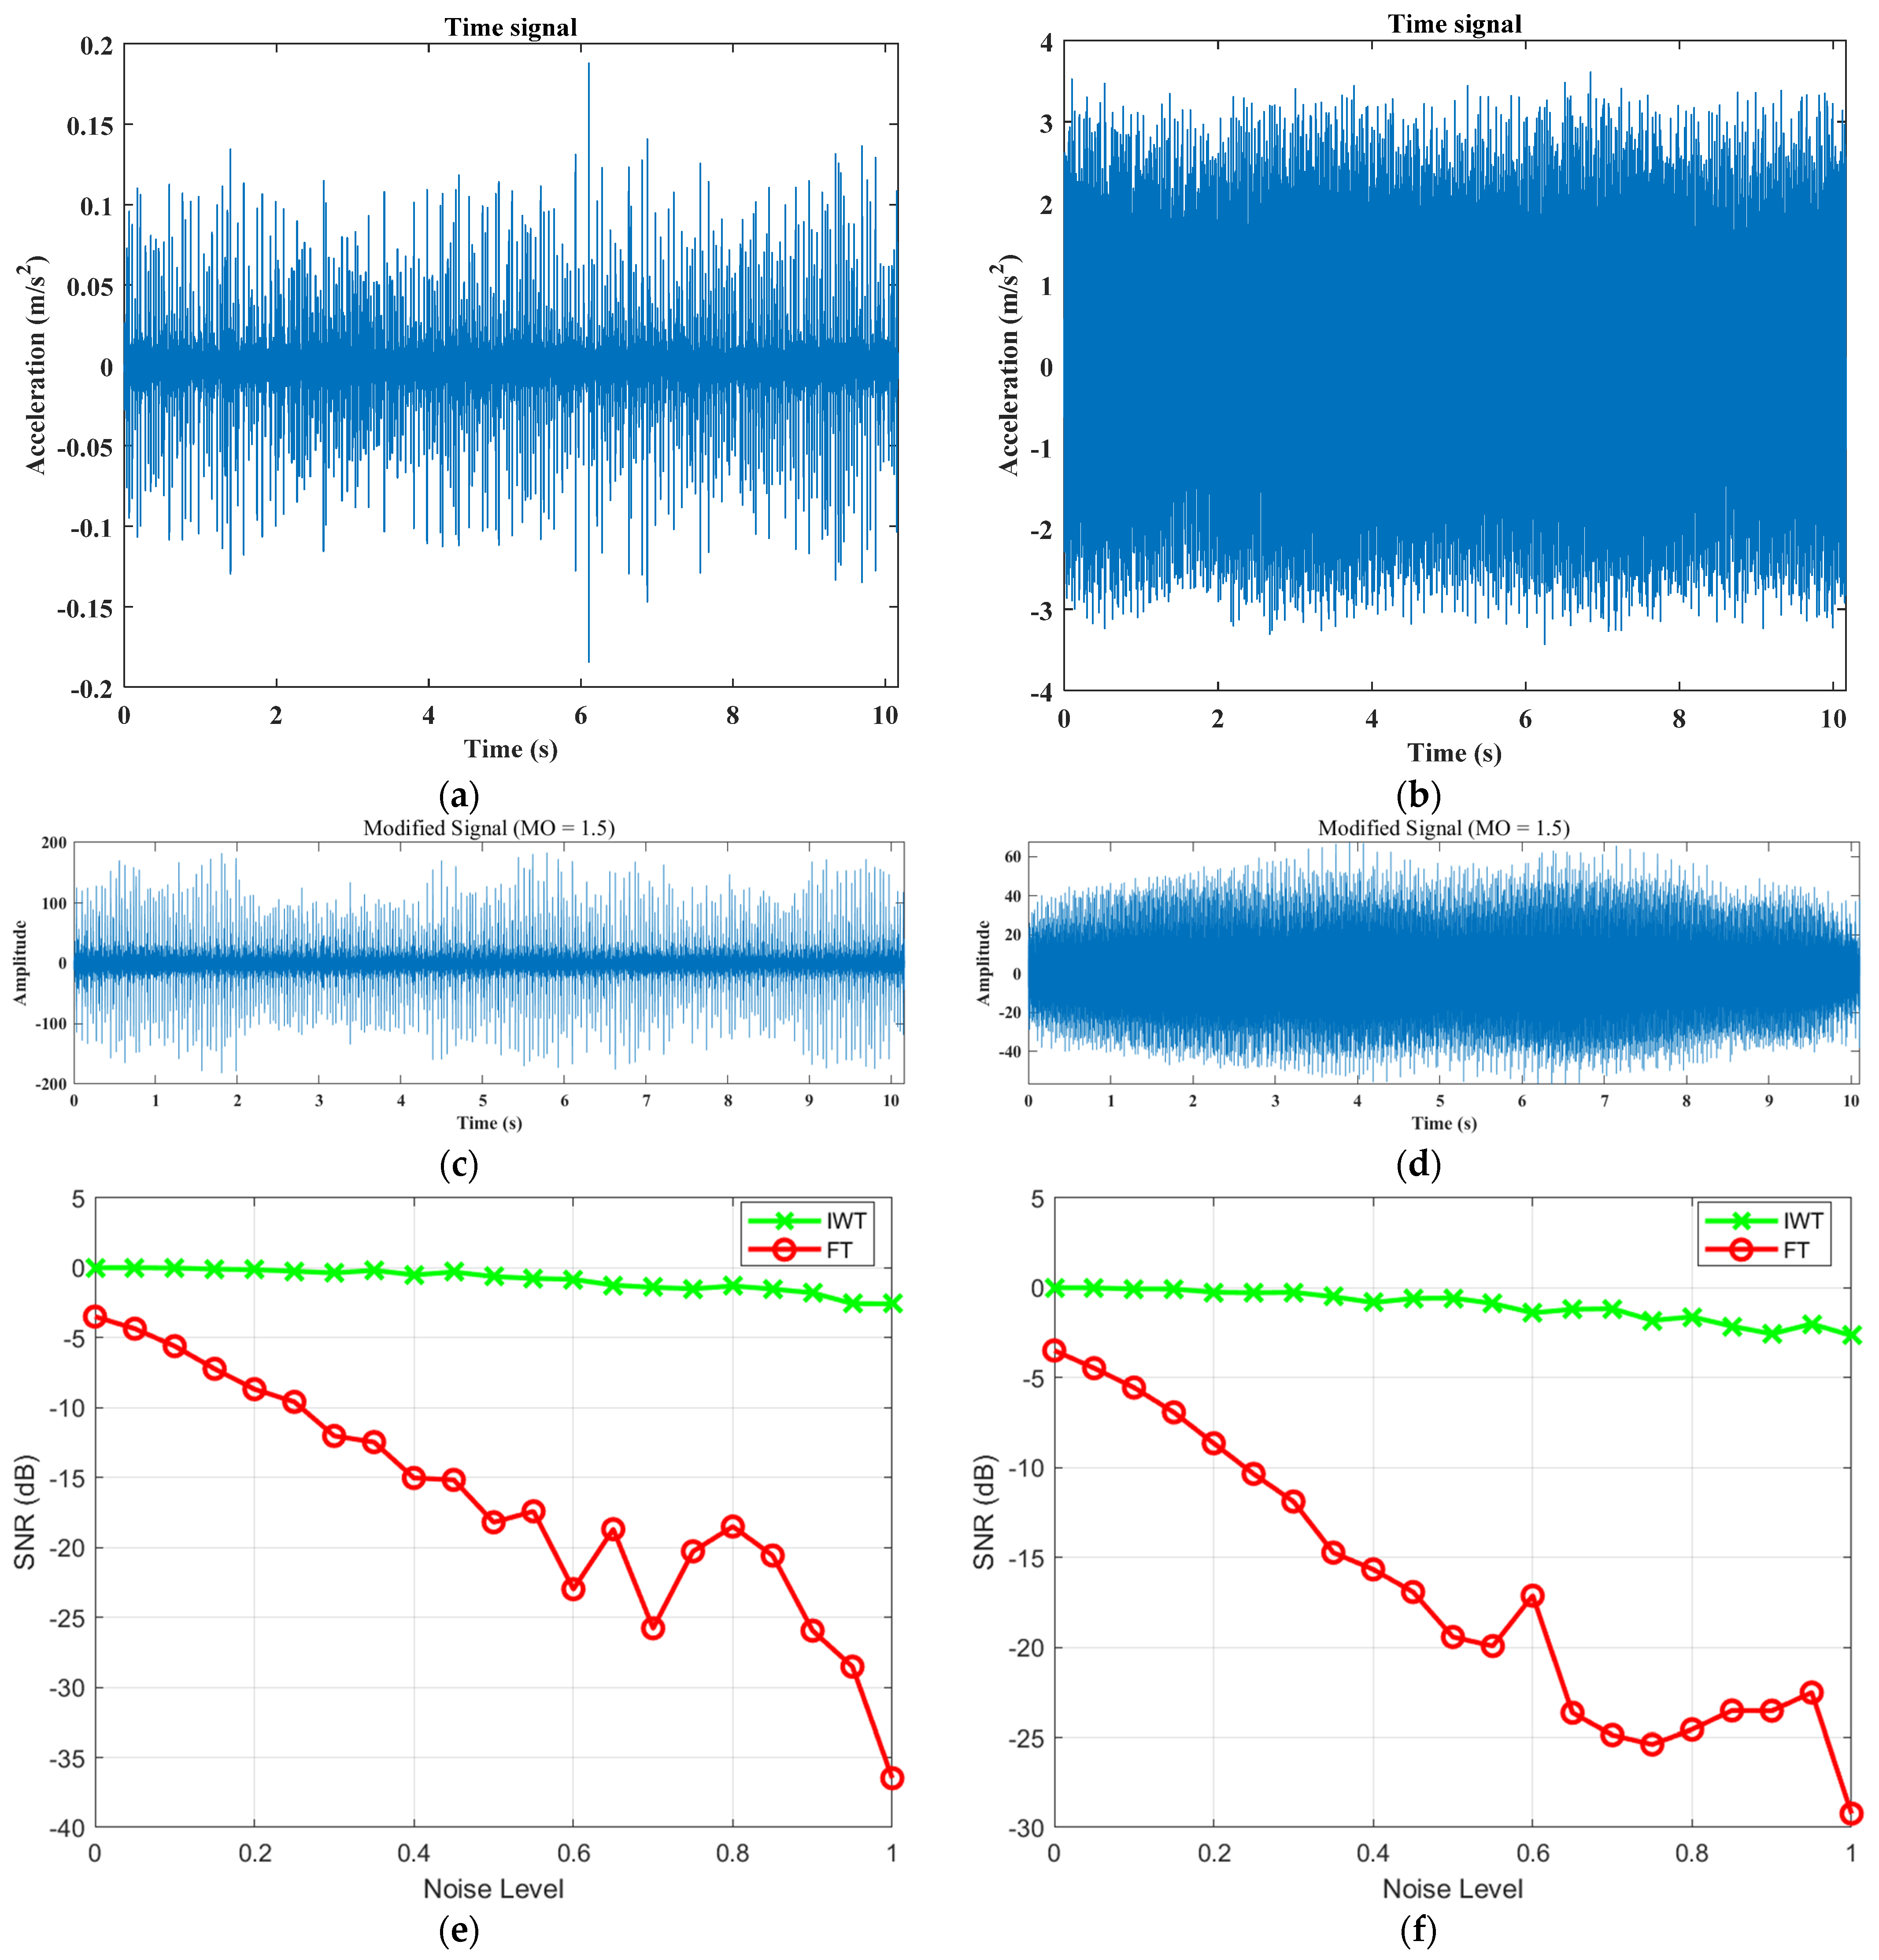
In order to further verify the superiority of IWT over FT, the signal-to-noise ratio (SNR) obtained between the two was compared with the increasing noise intensity. The noise intensity is set to [0, 1] and the step size is 0.05. Two sections of corrected fault signals with strong noise are used for testing, as shown in Figure 2c,d. In the figure, (e) and (f) show a comparison of the signal-to-noise ratio of the two signals processed by FT and IWT, respectively. It can clearly be seen that the signal-to-noise ratio after IWT processing is significantly higher than that of FT and is stable. The above results once again prove the feasibility of the proposed method.
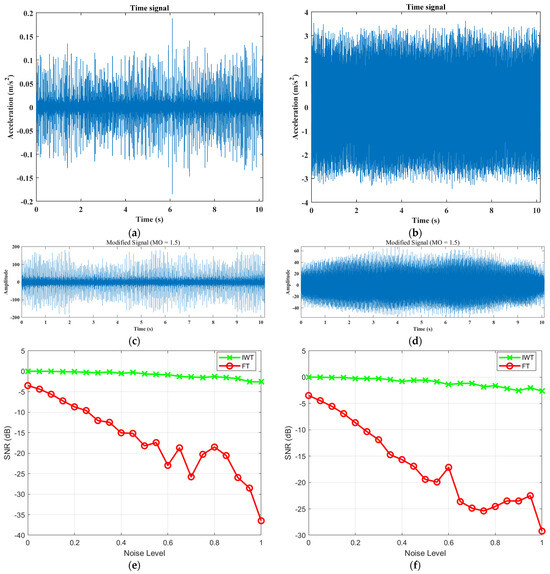
Figure 2.
Comparison chart of modified signal-to-noise ratio results. (a) Original signal 1; (b) original signal 2; (c) modified signal 1; (d) modified signal 2; (e) signal 1 comparison; (f) signal 2 comparison.
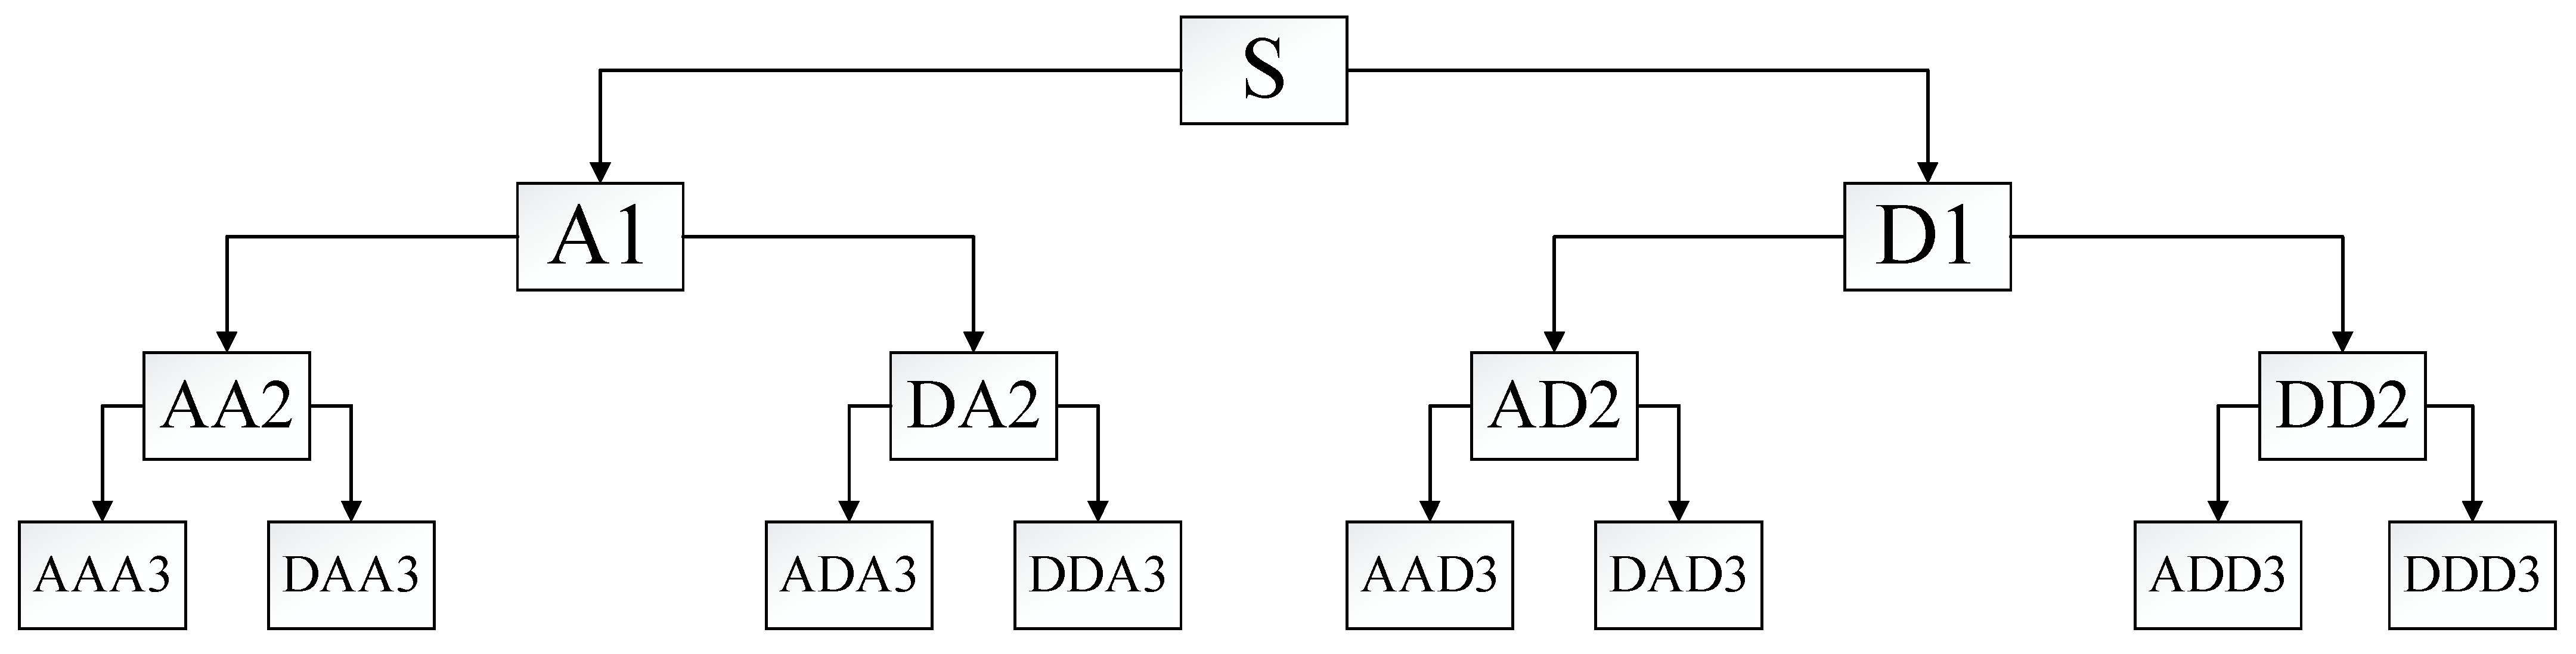
Therefore, this paper performs improved wavelet transform [28] processing on the square envelope of the corrected signal, and uses a tree structure embedding algorithm to decompose and calculate the noisy signal layer by layer, as shown in Figure 3 (where S is the original signal, and A1 and D1 are high-frequency and low-frequency signals, respectively. Subsequently, the decomposed frequency band will be divided into high and low halves to match with the signal spectrum, thereby obtaining a more refined decomposition). The noise signal is decomposed by selecting the appropriate number of layers and wavelet bases, and then selecting the appropriate threshold to quantify each layer system; finally, the denoised signal is obtained by reconstructing the wavelet coefficients.
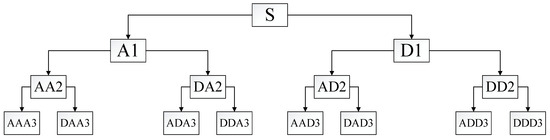
Figure 3.
Wavelet tree structure diagram.
The expression for the improved wavelet threshold function is as follows:
In (5), represents the wavelet coefficients of the vibration signal at the level of decomposition, while is the threshold for the wavelet coefficients at each level. When , in order to simulate a real environment, a decaying sine function is used for denoising; when , the noise is relatively large, so an exponential denoising method is employed. is the adjustment factor for the threshold function, obtained by calculating the mean and standard deviation of the wavelet coefficients, and then determining the range by adding or subtracting a multiple of the standard deviation from the mean, with a range of , and is a constant equal to 0.02. In Equation (6), is the average value of the wavelet coefficients, is the standard deviation of the wavelet coefficients, and is a constant used to determine how many standard deviations deviate from the average value to determine the range of .
Let be the vibration signal and perform wavelet decomposition, then the threshold calculation formula [29] corresponding to each layer of wavelet coefficients is:
In (7), represents the standard deviation of the noise for the wavelet coefficient; is the length of the signal. The definition [30] of is as follows:
In (8), the threshold decreases as the decomposition scale increases, which aligns with the characteristic that the wavelet coefficients of the vibration signal diminish with larger decomposition scales, resulting in improved denoising effects.
Next, the modified signal is reconstructed. First, select an appropriate wavelet basis function and scale function , which define the characteristics of the improved wavelet transform. Secondly, at each scale , the signal is decomposed into approximation coefficients and detail coefficients :
where is the translation coefficient; and are defined as follows:
Subsequently, signal is reconstructed from the IWT coefficients:
is the maximum scale of decomposition, and is the reconstructed modified signal.
Finally, the square envelope spectrum of the reconstructed signal is obtained, as shown in the following equation:
Since the human eye is more sensitive to changes on the logarithmic scale, in order to more clearly display the energy distribution on different frequency components, the obtained square envelope is subjected to further processing to obtain the logarithmic maximum square envelope spectrum:
First, obtain the frequency domain representation by performing a fast Fourier transform (FFT) on the square envelope signal:
where represents the square envelope signal and represents the FFT.
Then, take the logarithm of the FFT result to obtain the logarithmic square envelope spectrum:
where represents the log-squared envelope spectrum.
Finally, find the maximum value in the log-squared envelope spectrum, and the corresponding frequency is the maximum log-squared envelope spectrum.
where represents the maximum log-squared envelope spectrum.
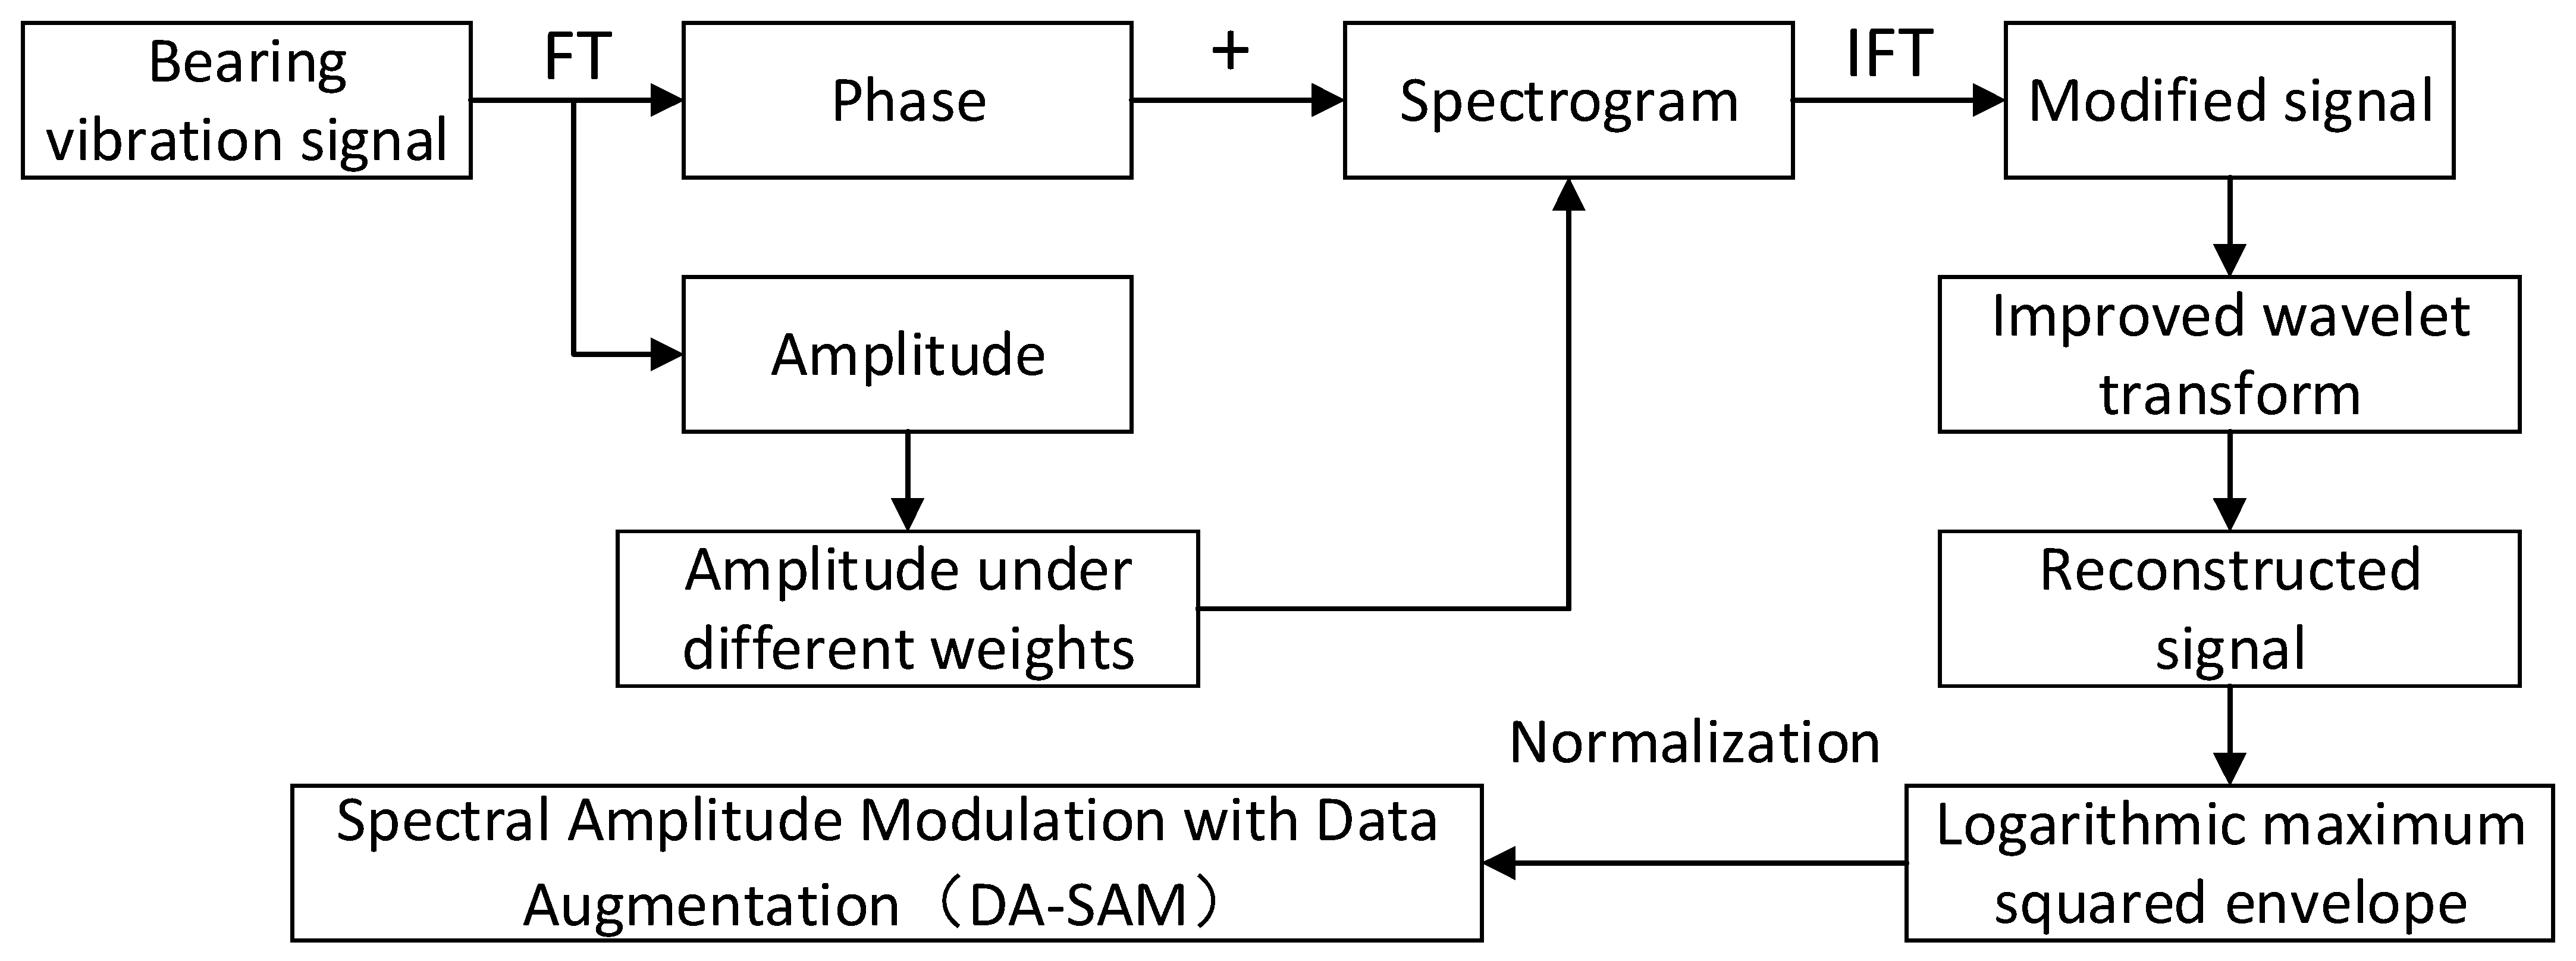
After the above processing, not only are the characteristics of the fault signal highlighted and the fault feature information enhanced, but the periodic impact components are also further amplified, significantly improving the resolution of the modulation results. Moreover, the proposed method retains the advantages of the original method, which is simple and efficient, making it applicable for bearing fault diagnosis in high-noise environments. The specific process of the DA-SAM method is as follows:
Step 1: Perform a Fourier transform on the bearing vibration signal to obtain the magnitude and phase of the original signal.
Step 2: Keep the phase information unchanged and assign different weight exponents to the magnitude to obtain , where .
Step 3: Combine the spectral amplitudes under different modes () with the original phase to obtain the edited spectrum. Then, an inverse Fourier transform is performed on this edited spectrum to obtain a series of corrected signals.
Step 4: Process the square envelope of the modified signal with improved wavelet transform to further reduce the noise interference.
Step 5: Calculate the logarithmic maximum square envelope spectrum of the noise-reduced signal, perform normalization processing (eliminate the influence of signal amplitude), and obtain data-enhanced spectral amplitude modulation; calculate the fault frequency through the given data to complete the diagnosis.
In this study, it is necessary to explain the reasons for the normalization process. First, normalization can eliminate dimensional differences between different features and ensure that the data are within the same scale range, which is crucial for the comparison and analysis of features; second, the normalized data can improve the adaptability of the algorithm, allowing the algorithm to effectively process data of different magnitudes; third, in complex interference environments, normalization can help reduce irrelevant random noise interference generated by the nonlinear filtering process, thereby improving the identification effect of fault features; fourth, normalization can make fault features more obvious in the data, helping to highlight fault-related components and improve the accuracy of fault diagnosis. To sum up, normalization processing is crucial to the research in this paper. If normalization is not carried out, dimensional differences in different features may cause some features to dominate the analysis, thereby concealing different important fault information and even causing the algorithm’s performance to degrade; and under different exponential weights, unnormalized data may cause a large number of interference frequency components to be amplified, thereby reducing the effectiveness of identifying fault features, and may also lead to deviations in the feature extraction process and affect subsequent fault diagnosis and analysis.
The flow chart is shown in Figure 4.
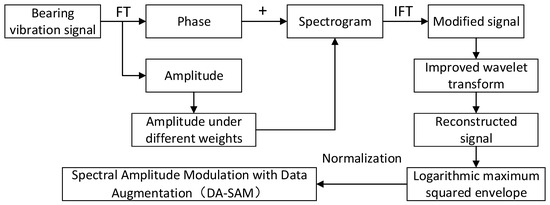
Figure 4.
DA-SAM method flow chart.
5. Experimental Verification
5.1. Bearing Failure Experimental Device
The bearing failure experimental device from Southeast University is shown in Figure 5. The vibration signals collected are created at a motor speed of 1800 r/min and a sampling frequency of 12 kHz. The experiment will be carried out under three conditions: outer ring, inner ring, and composite fault. The outer ring fault frequency is 70 Hz, and the inner ring fault frequency is 188 Hz. The specific fault types are shown in Table 1 [30]. In order to effectively verify the effectiveness of this method, a data set with large noise interference is used, so the weight index MO is uniformly set to 1.5. All data sets used in Section 5 are from the gearbox data set provided by Southeast University [30].
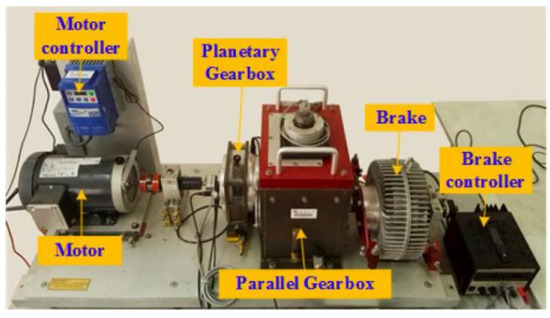
Figure 5.
Experimental setup.

Table 1.
Description of SEU bearing faults.
The calculation formula for the fault frequency is as follows, where represents the bearing rotation speed, and is the number of rolling elements:
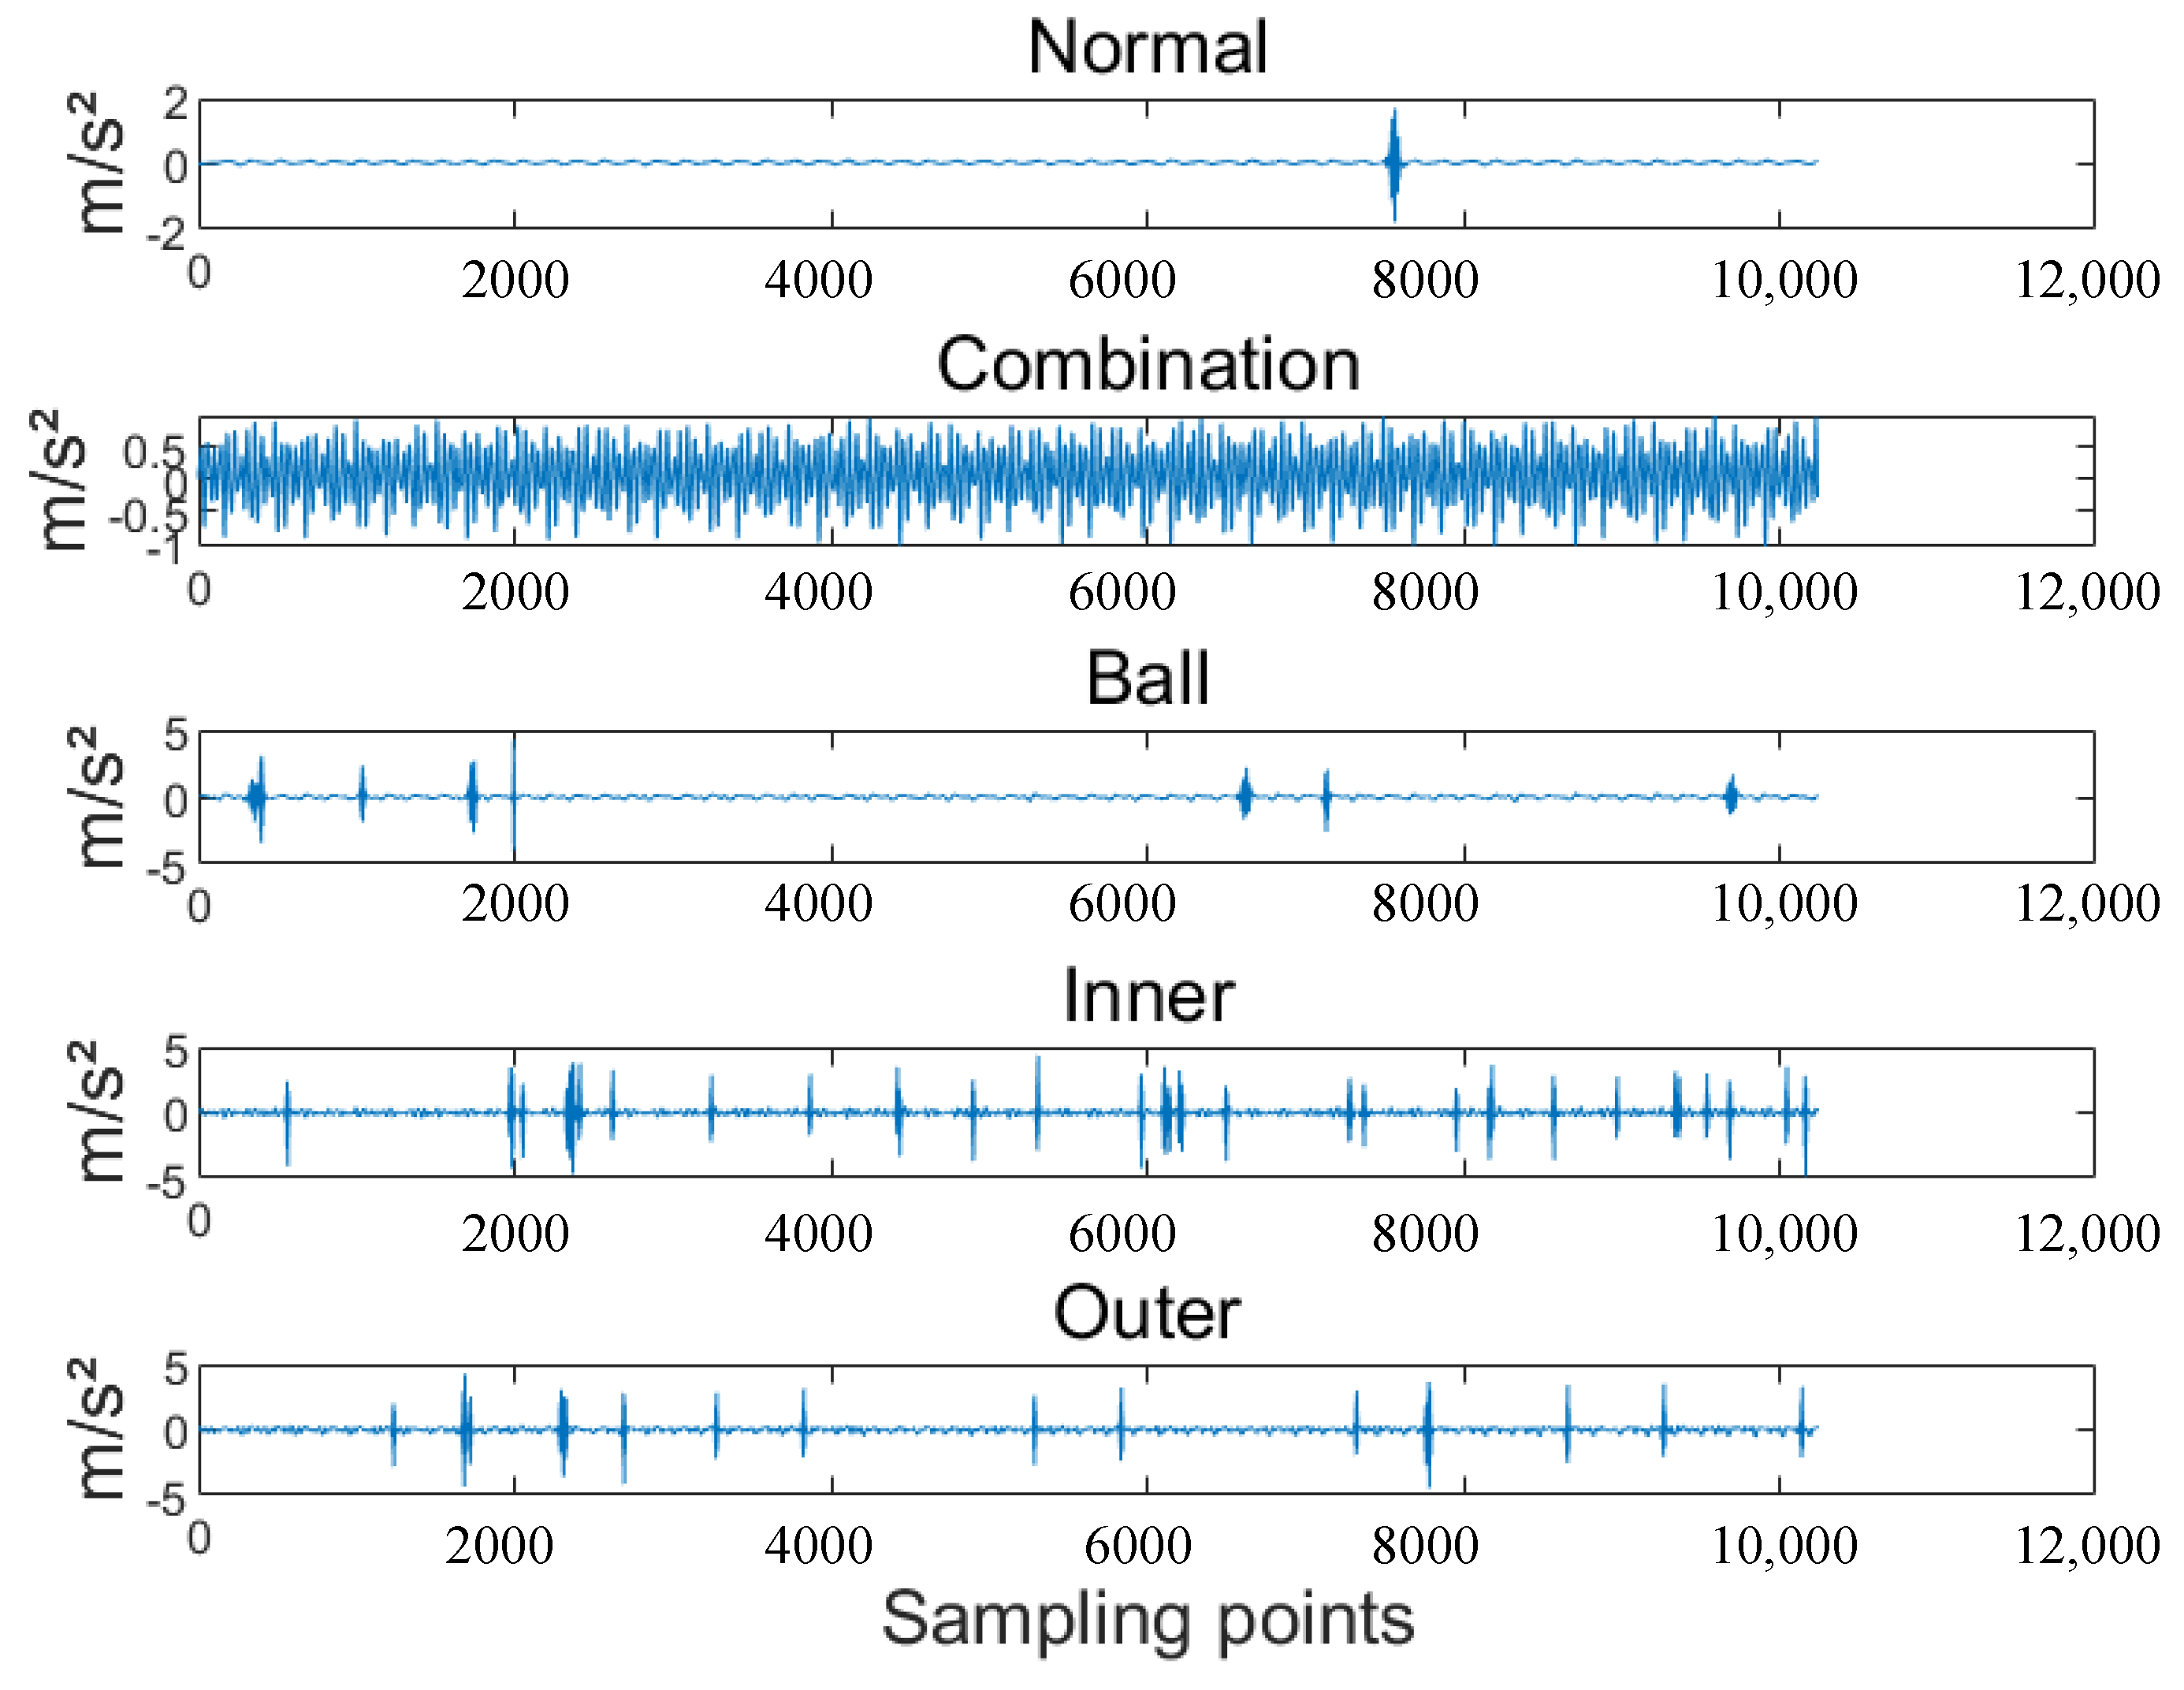
In this paper, the length of the samples in the data set is 102,400, and a load of 30 HZ-2 V is used; fault types as shown in Figure 6.
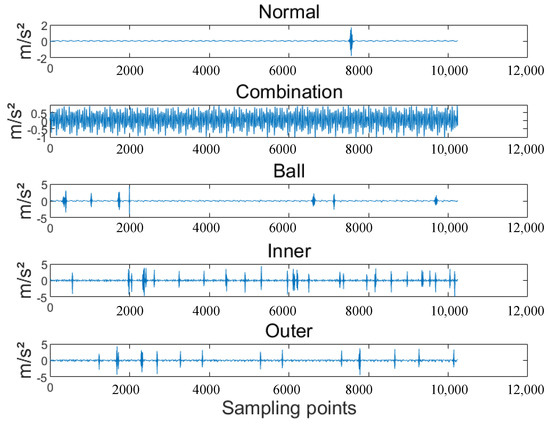
Figure 6.
Diagram of 30 HZ−2 V fault signal.
5.2. Outer Ring Failure Experiment
A time domain diagram of the outer ring fault signal and a time domain diagram of the corrected signal are shown in Figure 7. To facilitate the next comparison, the envelope spectrum of the original signal of the outer ring fault is given first, as shown in Figure 8.
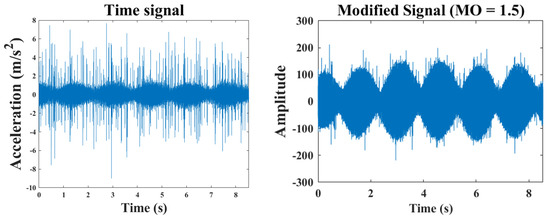
Figure 7.
Original and modified signals of outer ring fault.
Figure 8.
Outer ring original signal envelope spectrum.
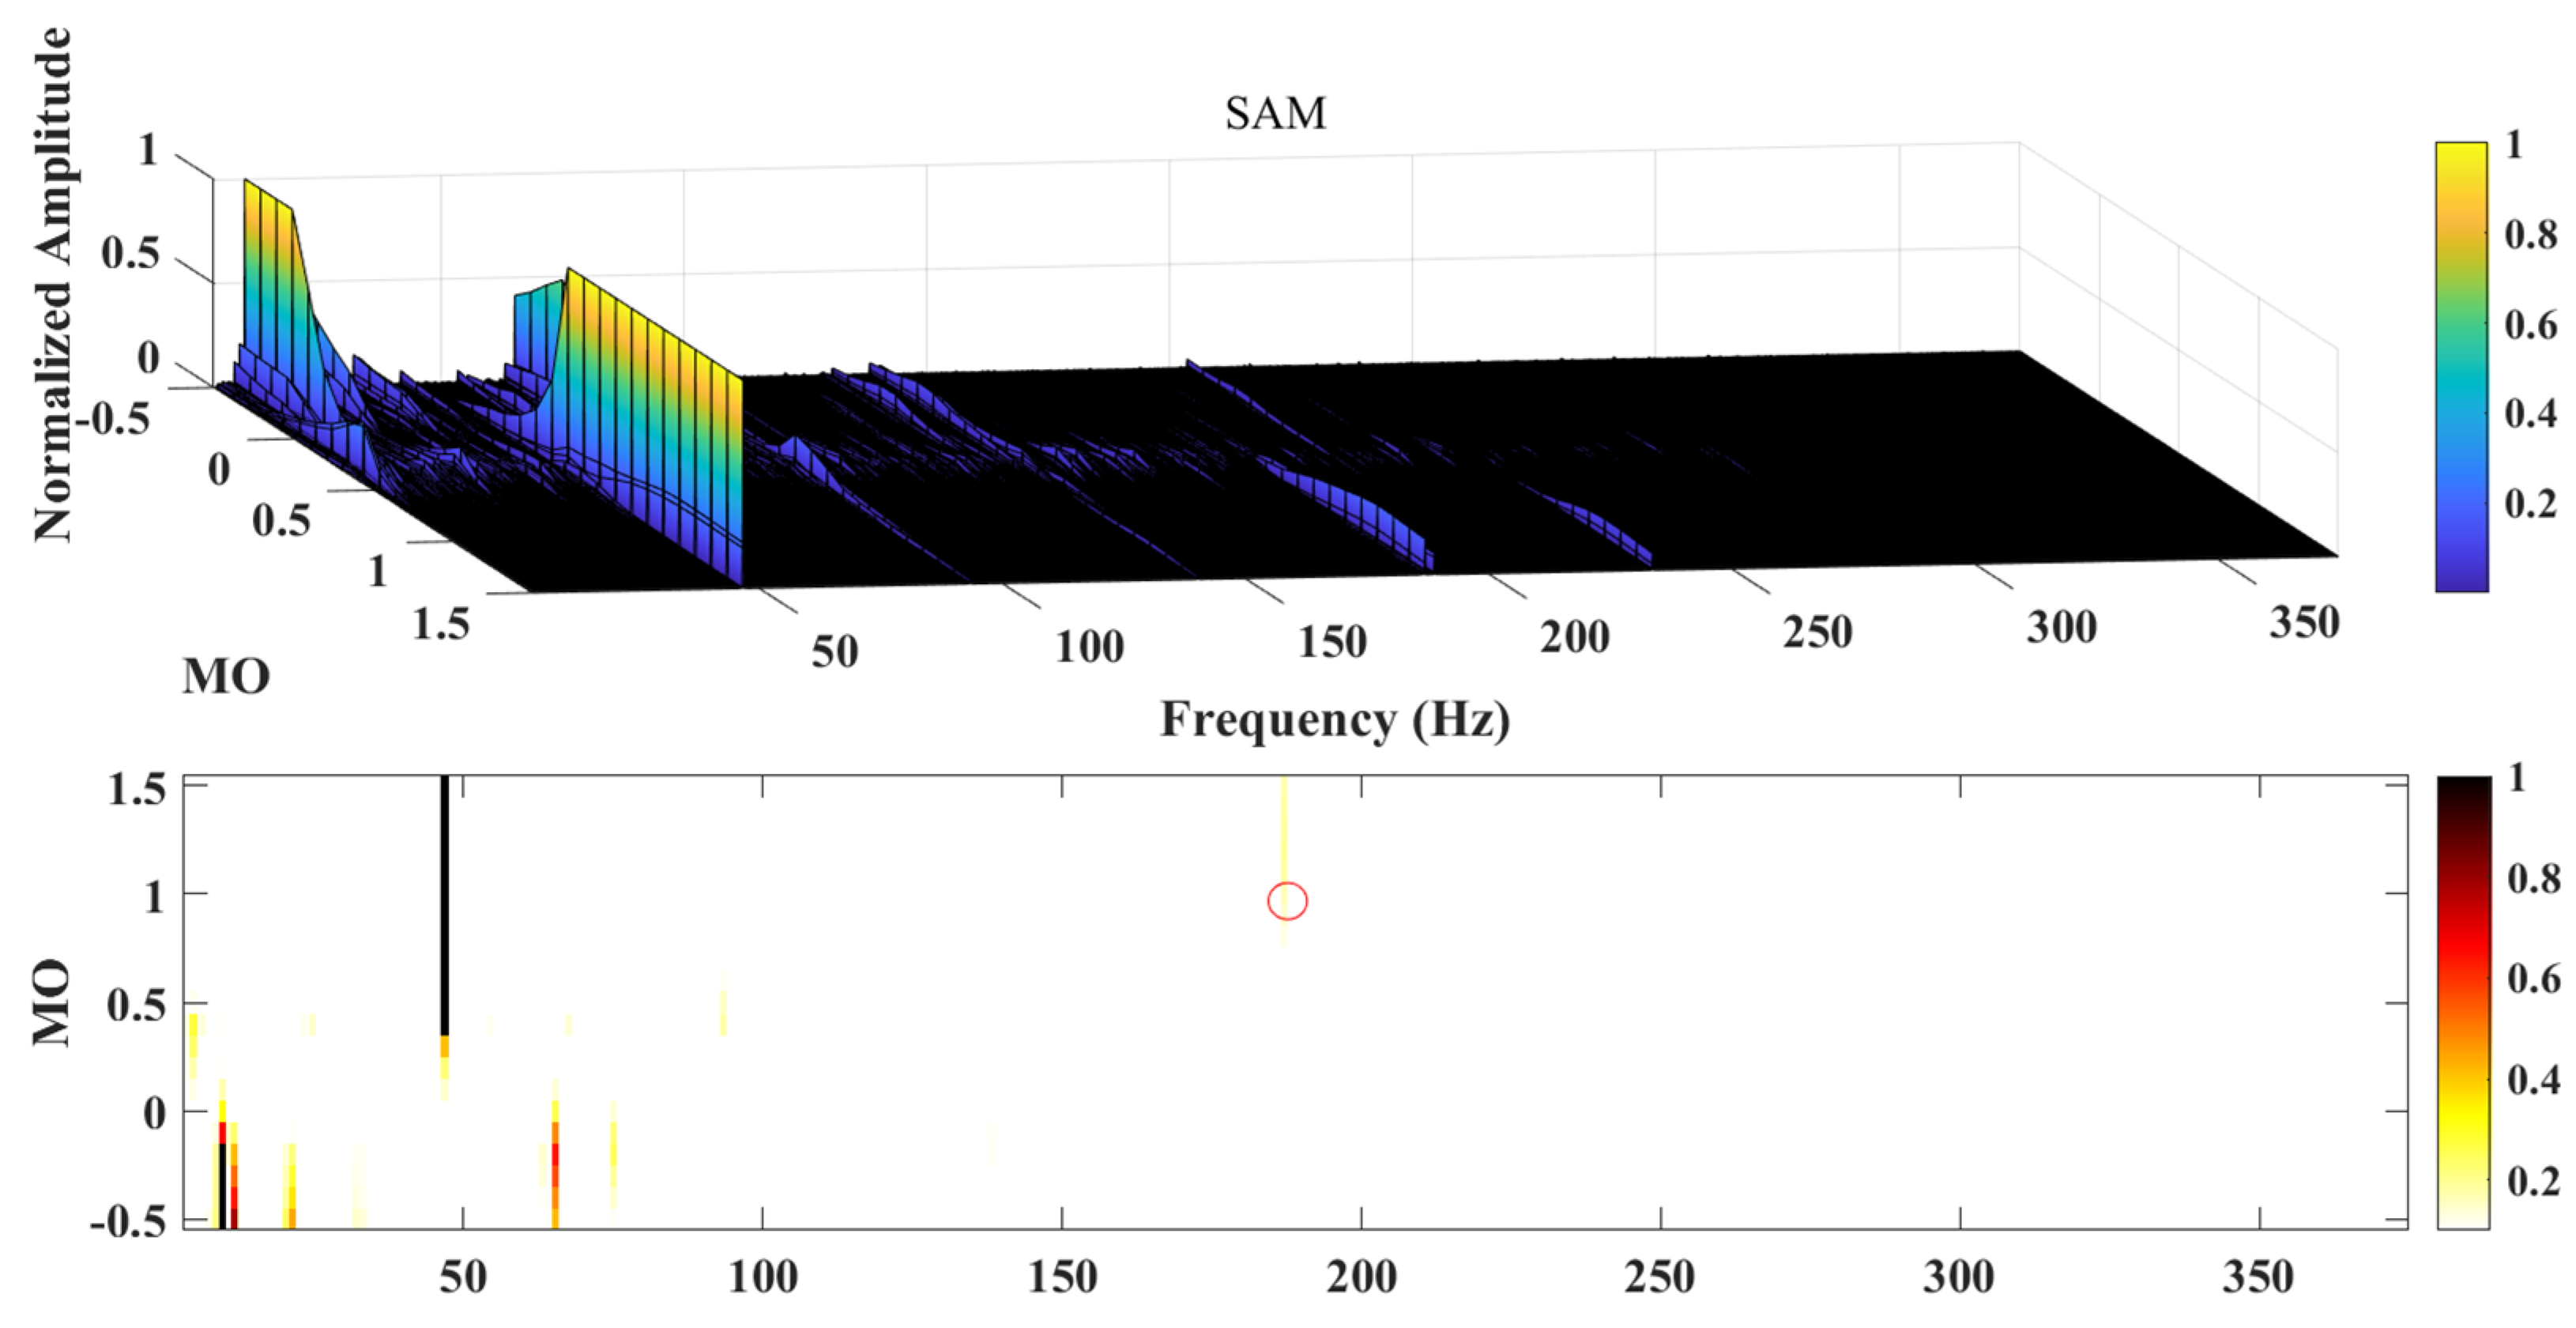
First, the SAM method was used for the analysis, and the results are shown in Figure 9. The blue arrow represents the frequency and doubling of the outer ring fault signal. For convenience of comparison, the three-dimensional map, the two-dimensional map and the square envelope spectrum diagram are given, where the two-dimensional map is the top view of the three-dimensional map. Under the condition of the set weight index , it can be clearly be observed from the two-dimensional graph that there is basically no interference component when , and and are observed, but they are not obvious enough. This is because the fault component is interfered with by irrelevant components, but the irrelevant components do not fully dominate. We can also see and in the square envelope spectrum, and the other doubling frequencies are covered up by noise.
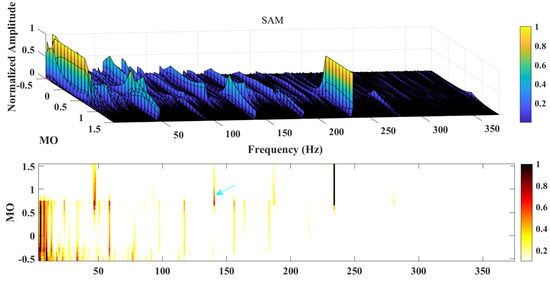

Figure 9.
Outer ring fault analysis results based on SAM method.
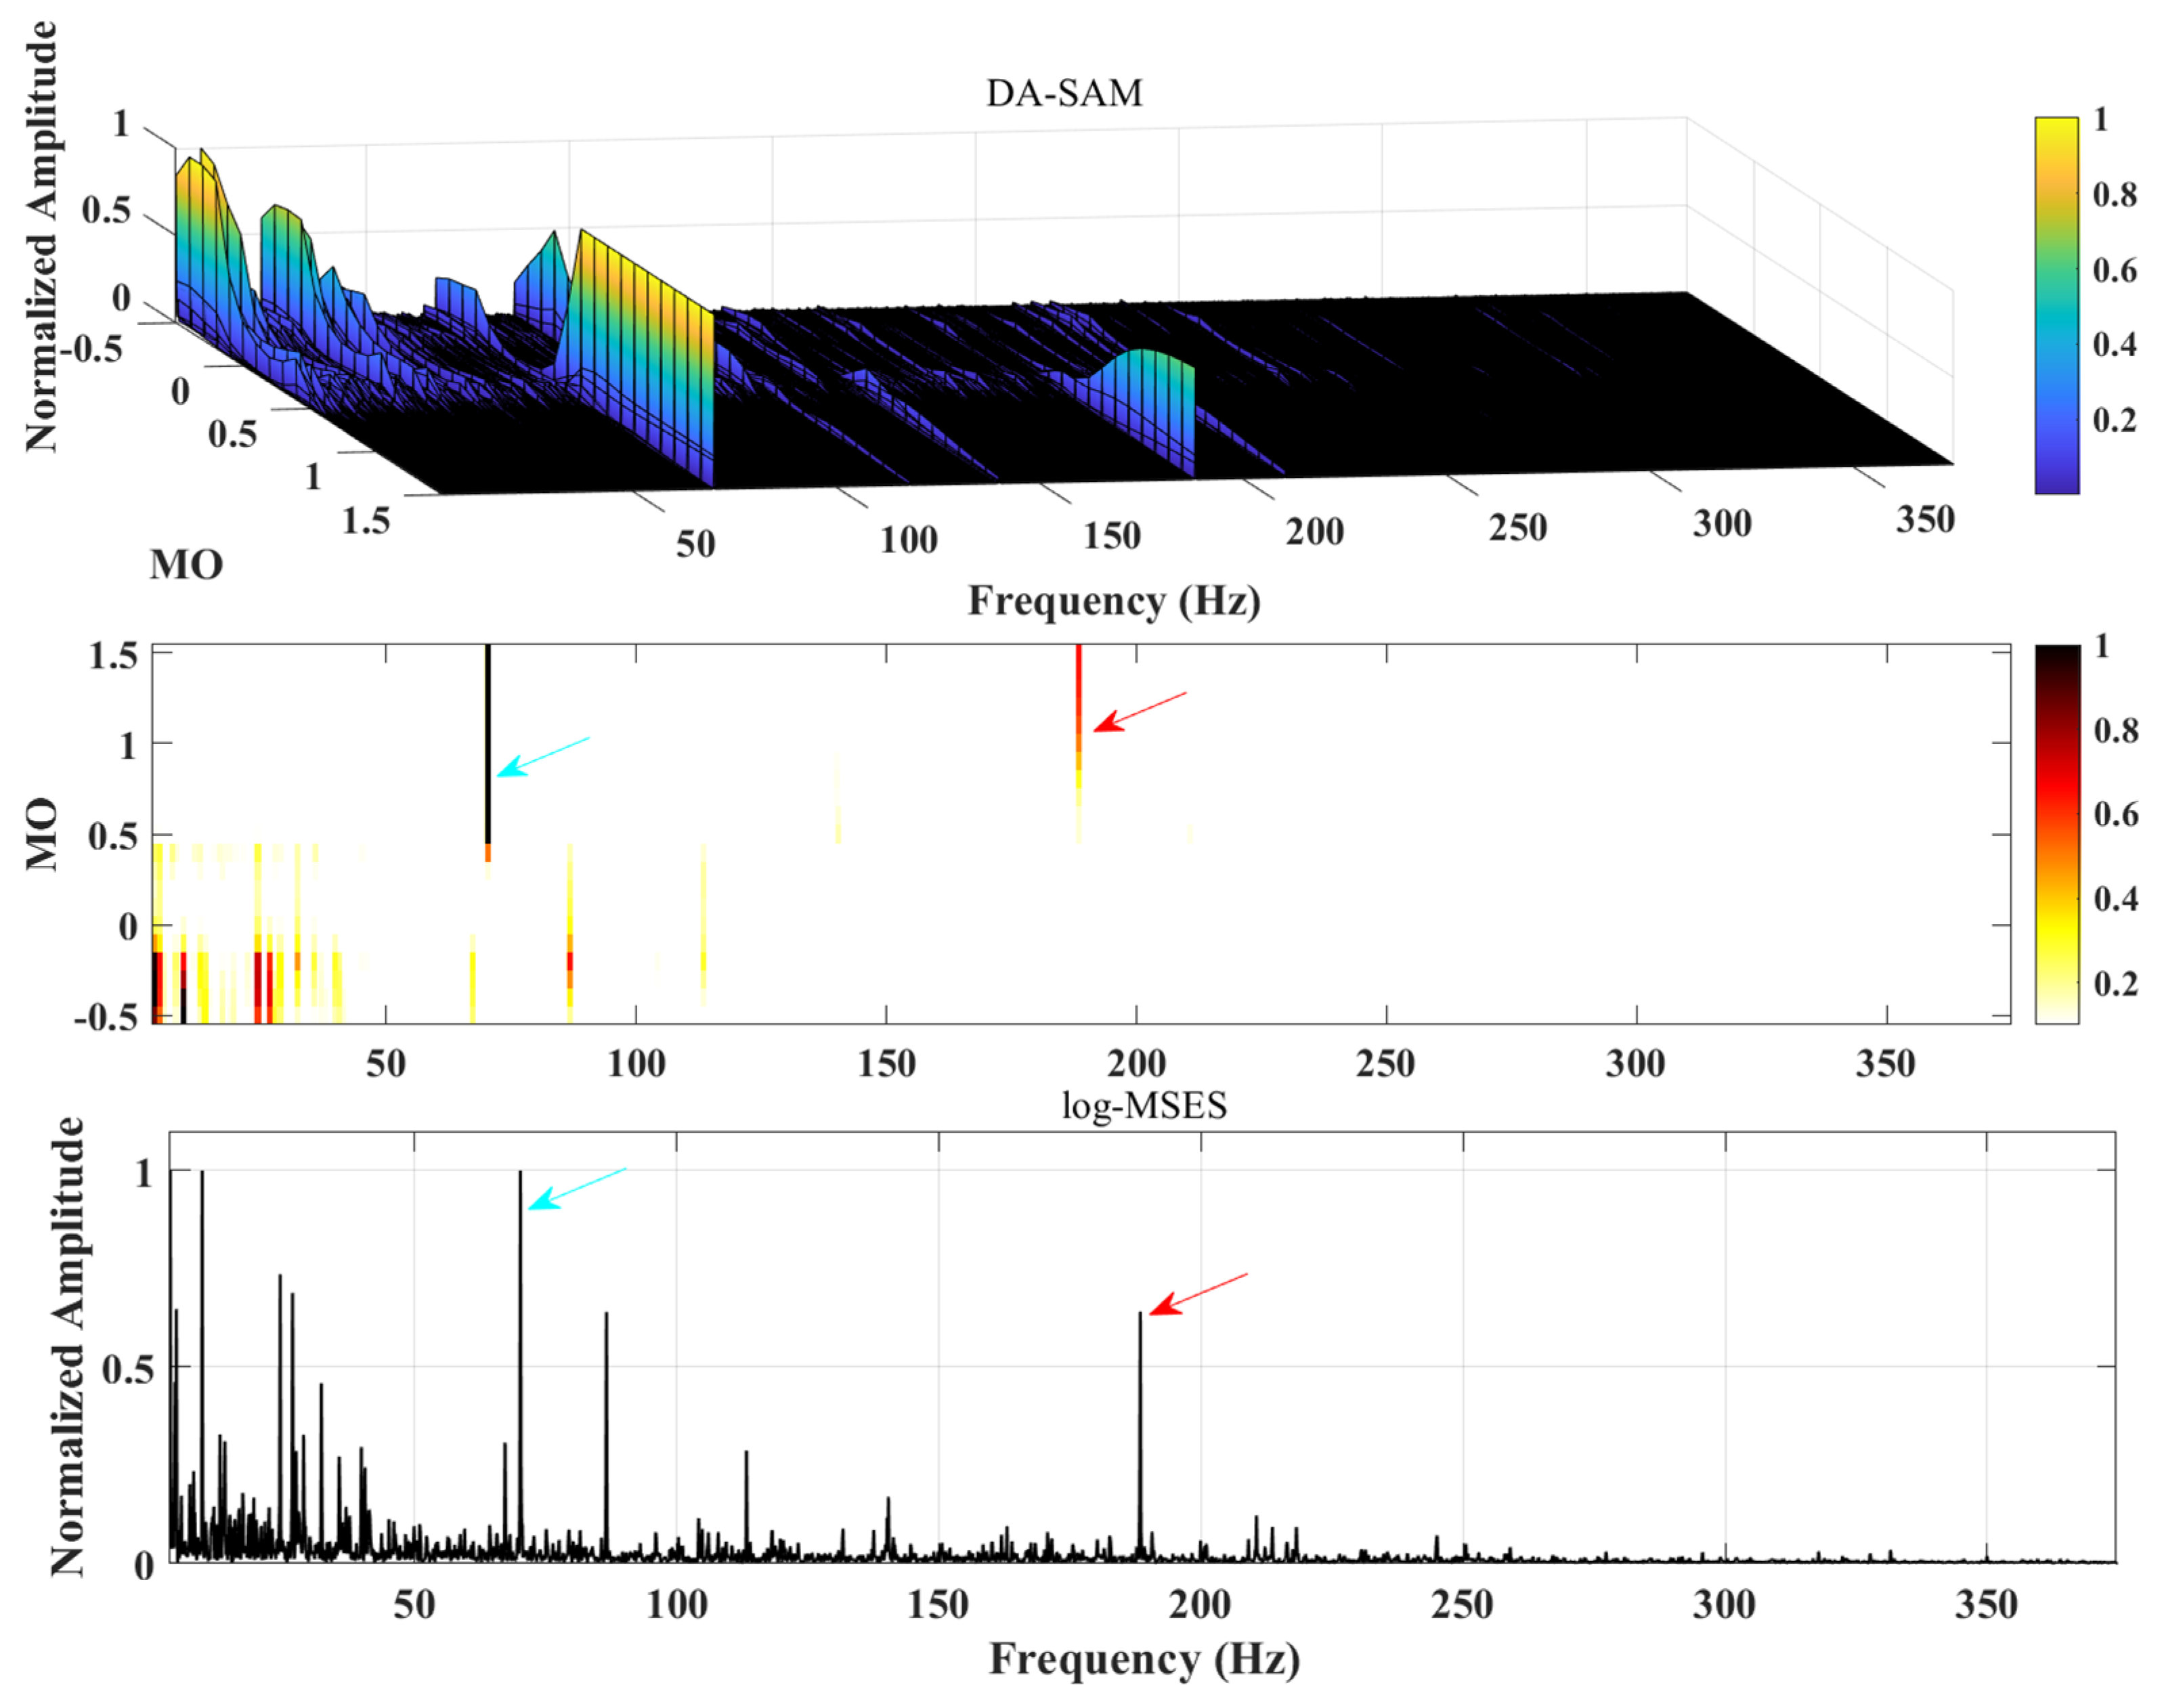
Then, the vibration signal was analyzed using the DA-SAM method proposed in this paper, and the results are shown in Figure 10. The blue arrow represents the frequency and doubling of the outer ring fault signal. To control the variable, the weight index was still set to 1.5. It can be observed that the bearing failure frequency occupies an absolute dominant position in the range of , without any other interference components. , , and can be clearly observed in the two-dimensional graph, and , , , and can be observed in the logarithmic maximum square envelope spectrum. Compared with those in Figure 9, the analysis results are significantly improved.
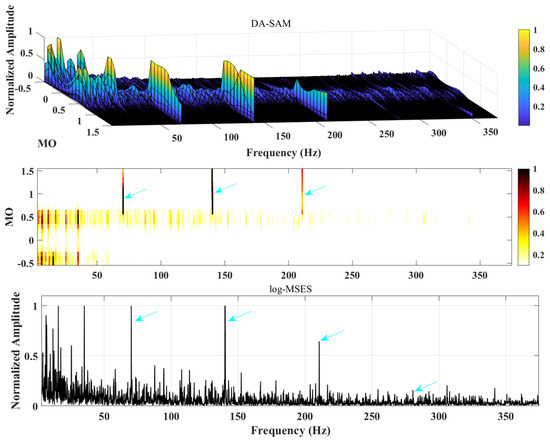
Figure 10.
Outer ring fault analysis results based on DA-SAM method.
It can be seen from the signal analysis results from the outer ring that the accuracy of the SAM method is significantly reduced under high-intensity interference; the DA-SAM method proposed in this paper strengthens the fault characteristic information by improving the logarithmic maximum square envelope obtained after wavelet threshold denoising, and minimizes the weakening of the interference information, thereby improving the robustness of the original method. The accuracy of fault characteristic frequency identification has been significantly improved.
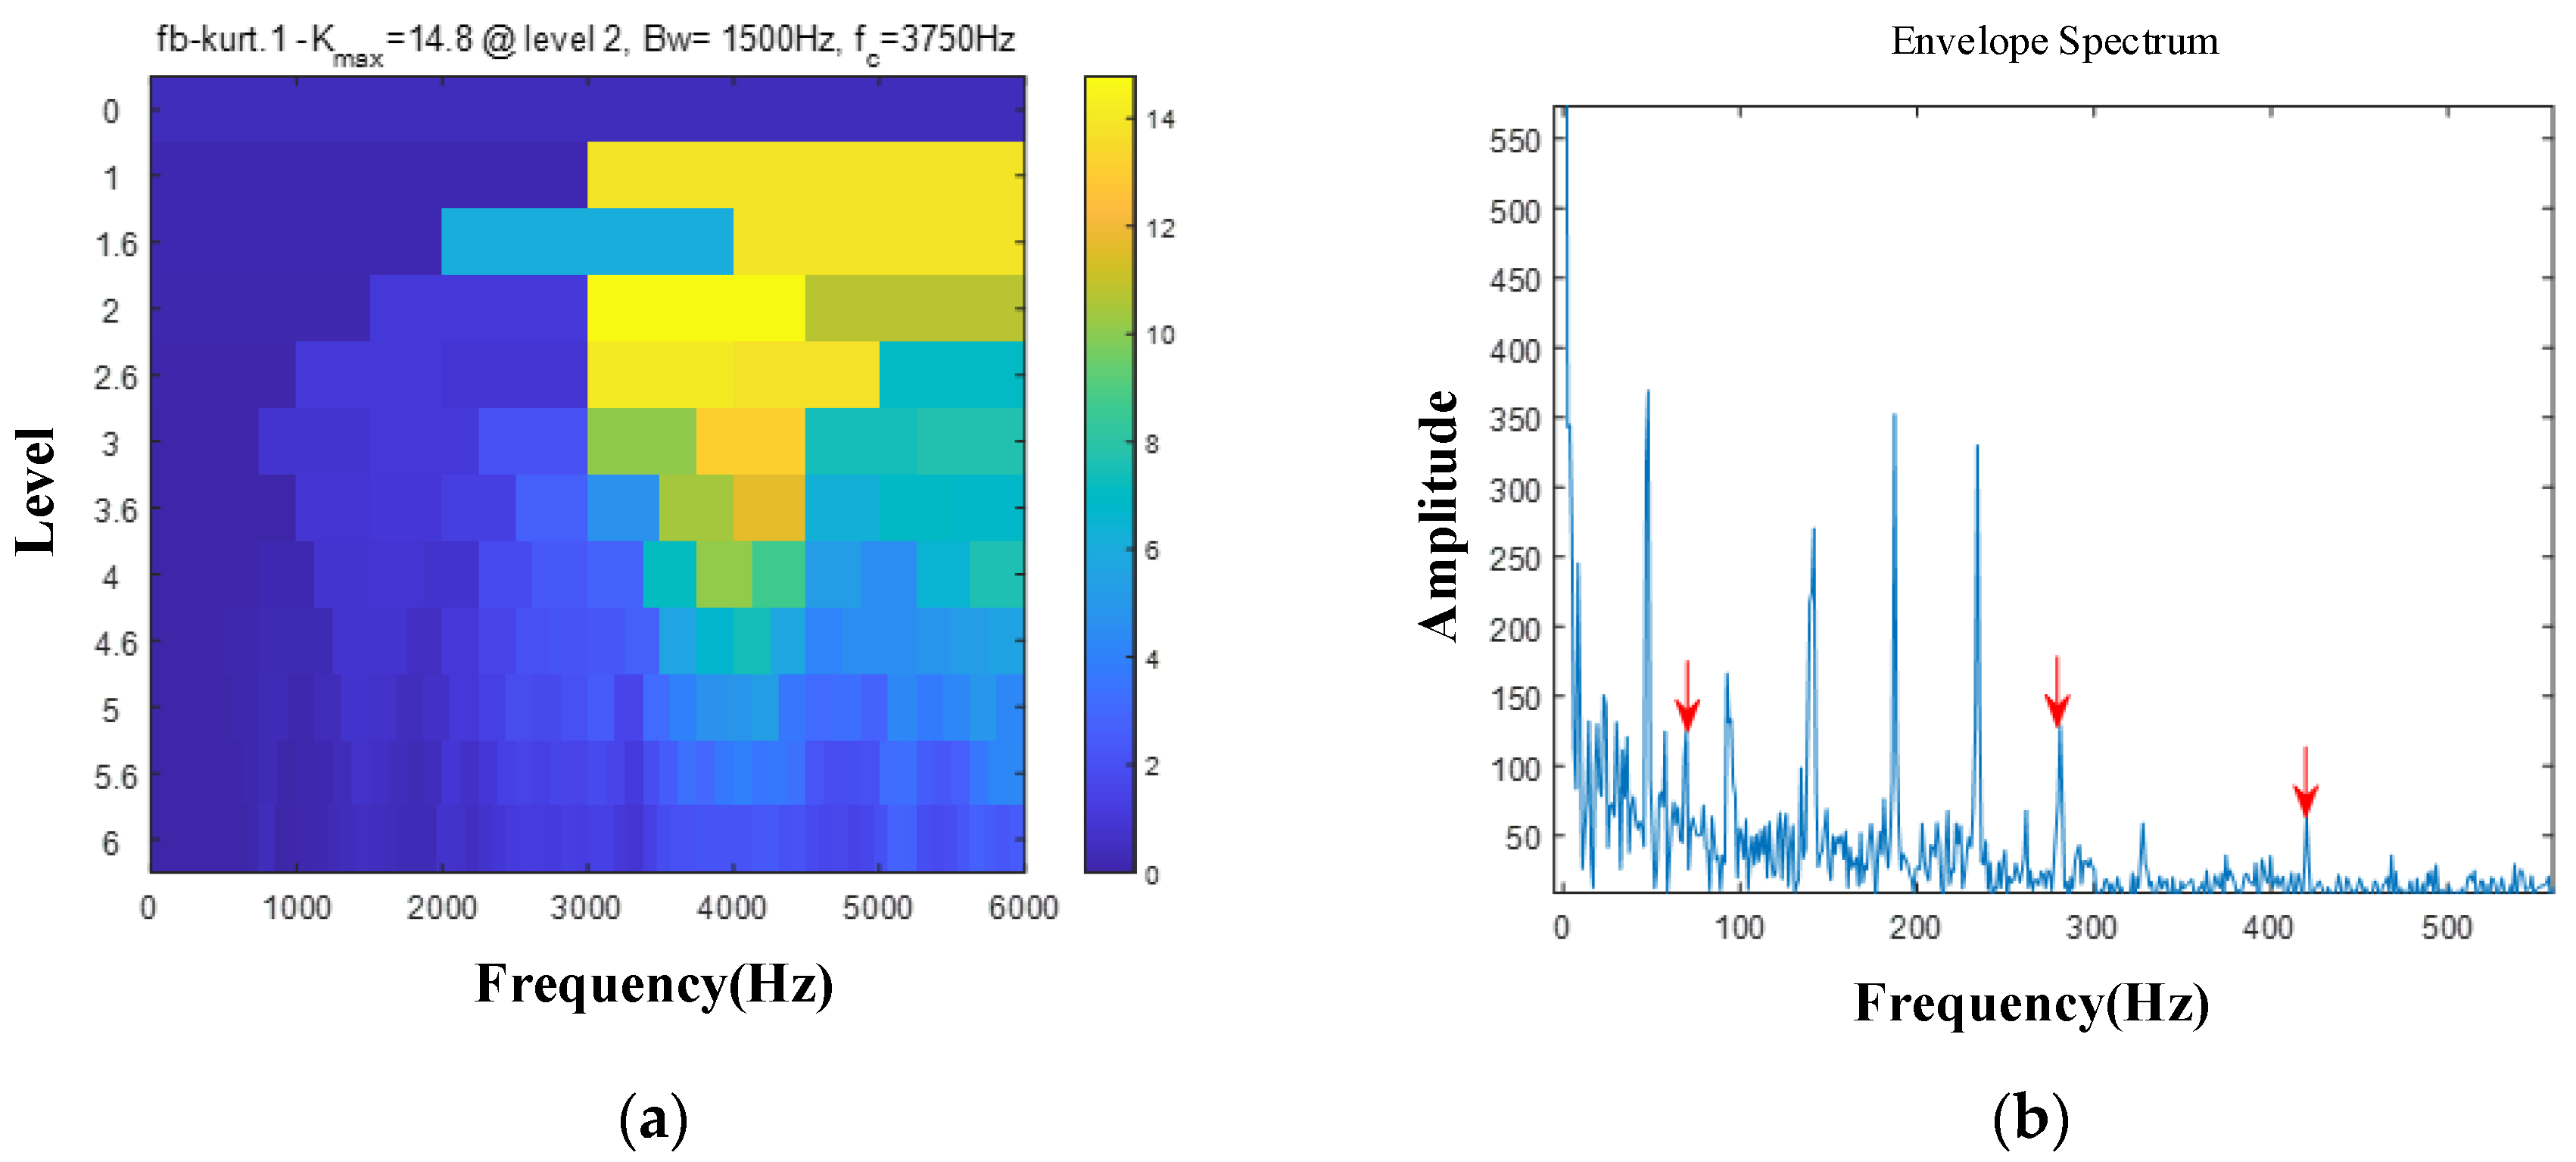
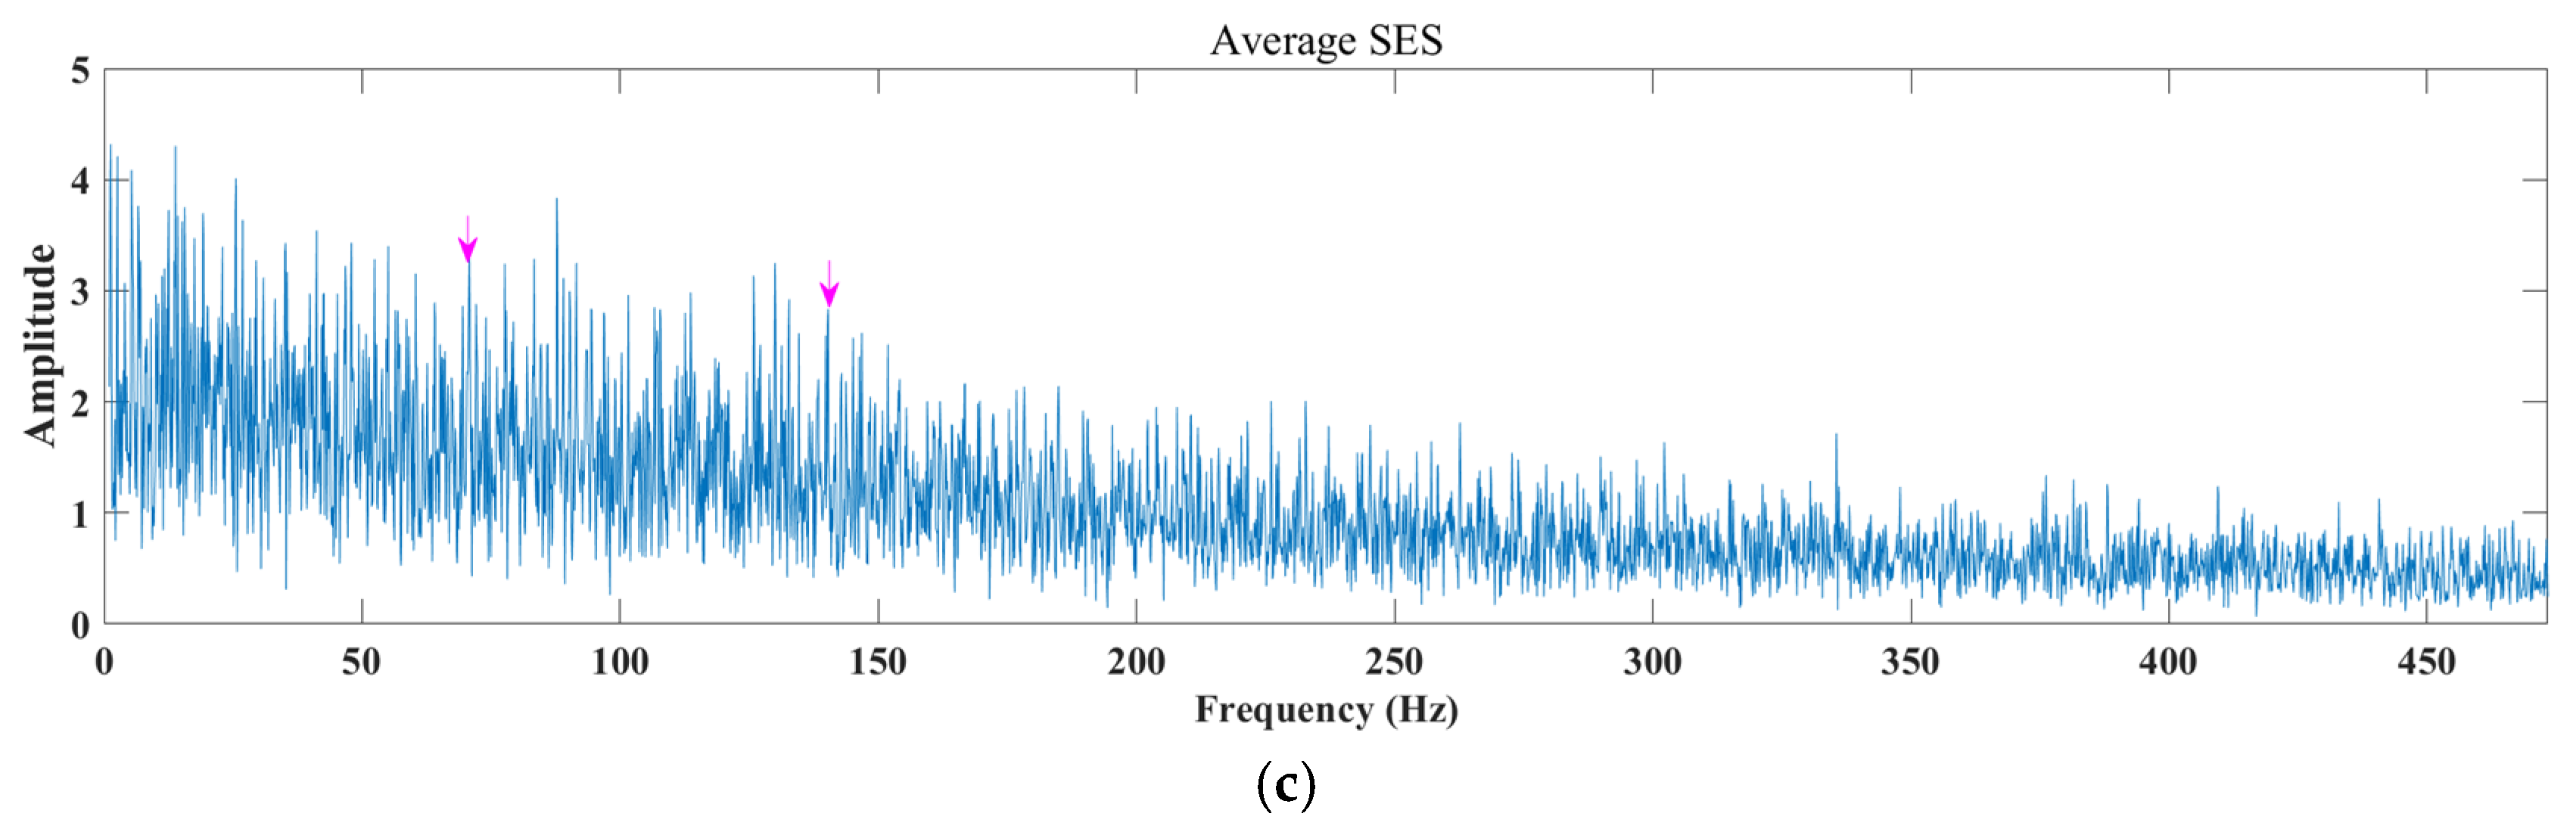
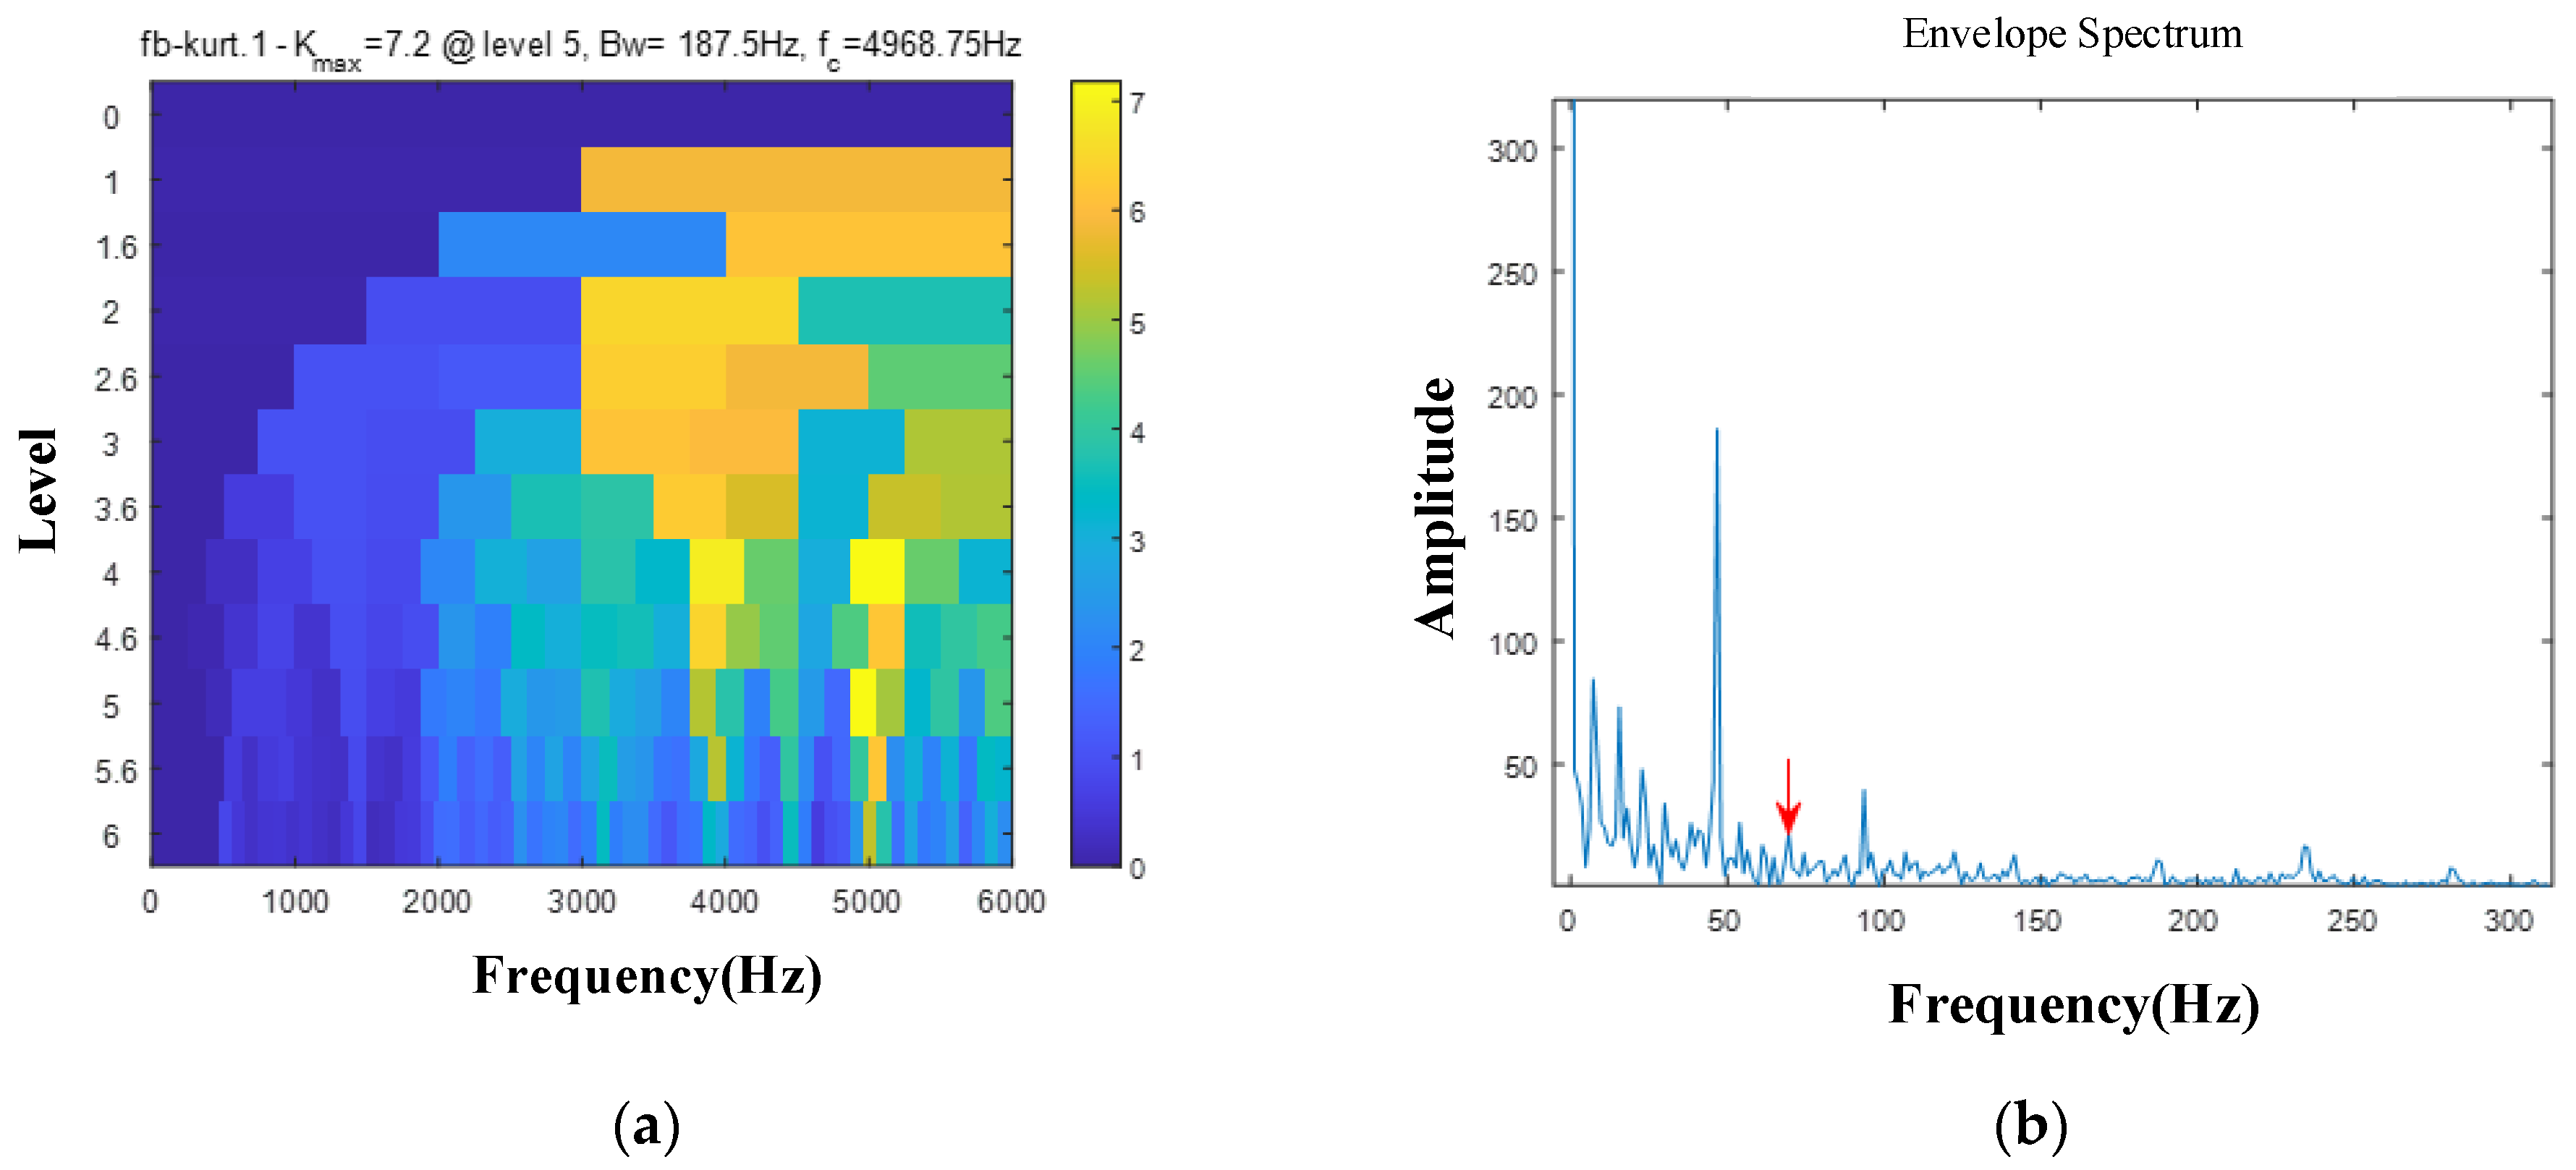
In order to further prove the effectiveness of this method, the experimental signal is analyzed by the Autogram method and the fast spectral kurtosis method. The red arrow and pink arrow represent the outer ring fault frequency and doubling. The fast kurtosis diagram method is shown in Figure 11 (where Bw is the bandwidth and fc is the center frequency). The optimal center frequency found is 3750 Hz. Although some fault doubling can also be observed in the envelope spectrum, it does not dominate. The results of the Autogram method are shown in Figure 12. According to the determined optimal filtering parameters, its square envelope spectrum can be observed, which includes the results at the maximum kurtosis value and after the threshold increase and decrease operations, respectively, as shown in Figure 12b. Combined with Figure 12a, the optimal center frequency fc found is 5625 Hz. Although a lot of processing has been carried out, no obvious fault frequencies are observed in the envelope spectrum, and they are concealed by a lot of noise. For further observation, another averaging step is performed to obtain the average square envelope spectrum. As shown in Figure 12c, there is still a large amount of noise and the fault frequency is concealed.

Figure 11.
Outer ring fault analysis results based on the fast spectral kurtosis method. (a) Fast kurtosis plot; (b) envelope spectrum.
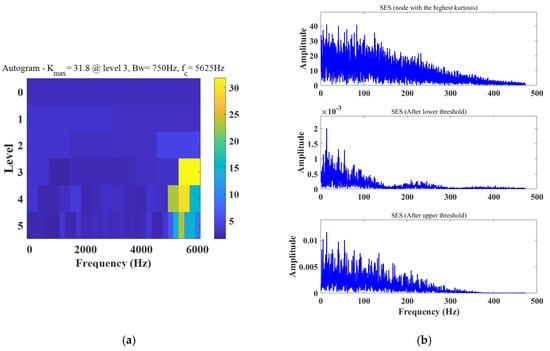

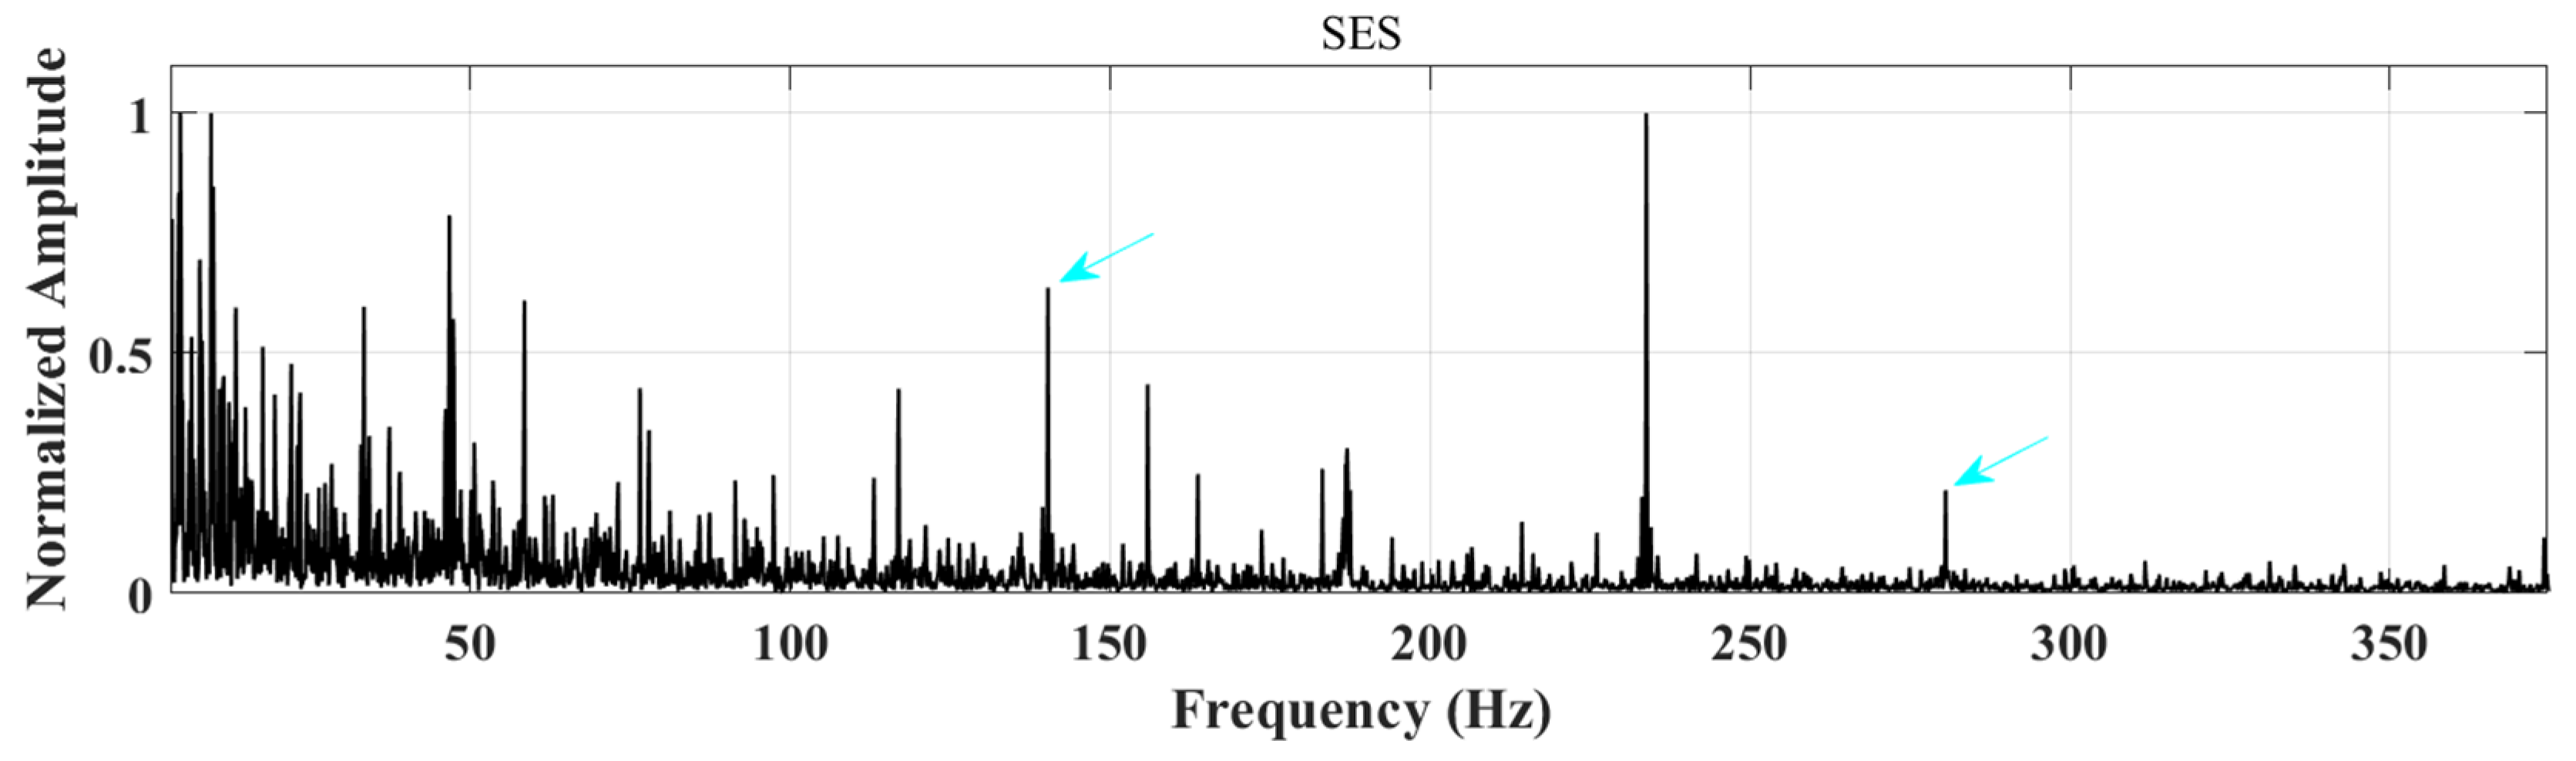
Figure 12.
Outer ring fault analysis results based on the Autogram method. (a) Kurtosis plot; (b) SES; (c) mean squared envelope spectrum.
5.3. Inner Ring Failure Experiment
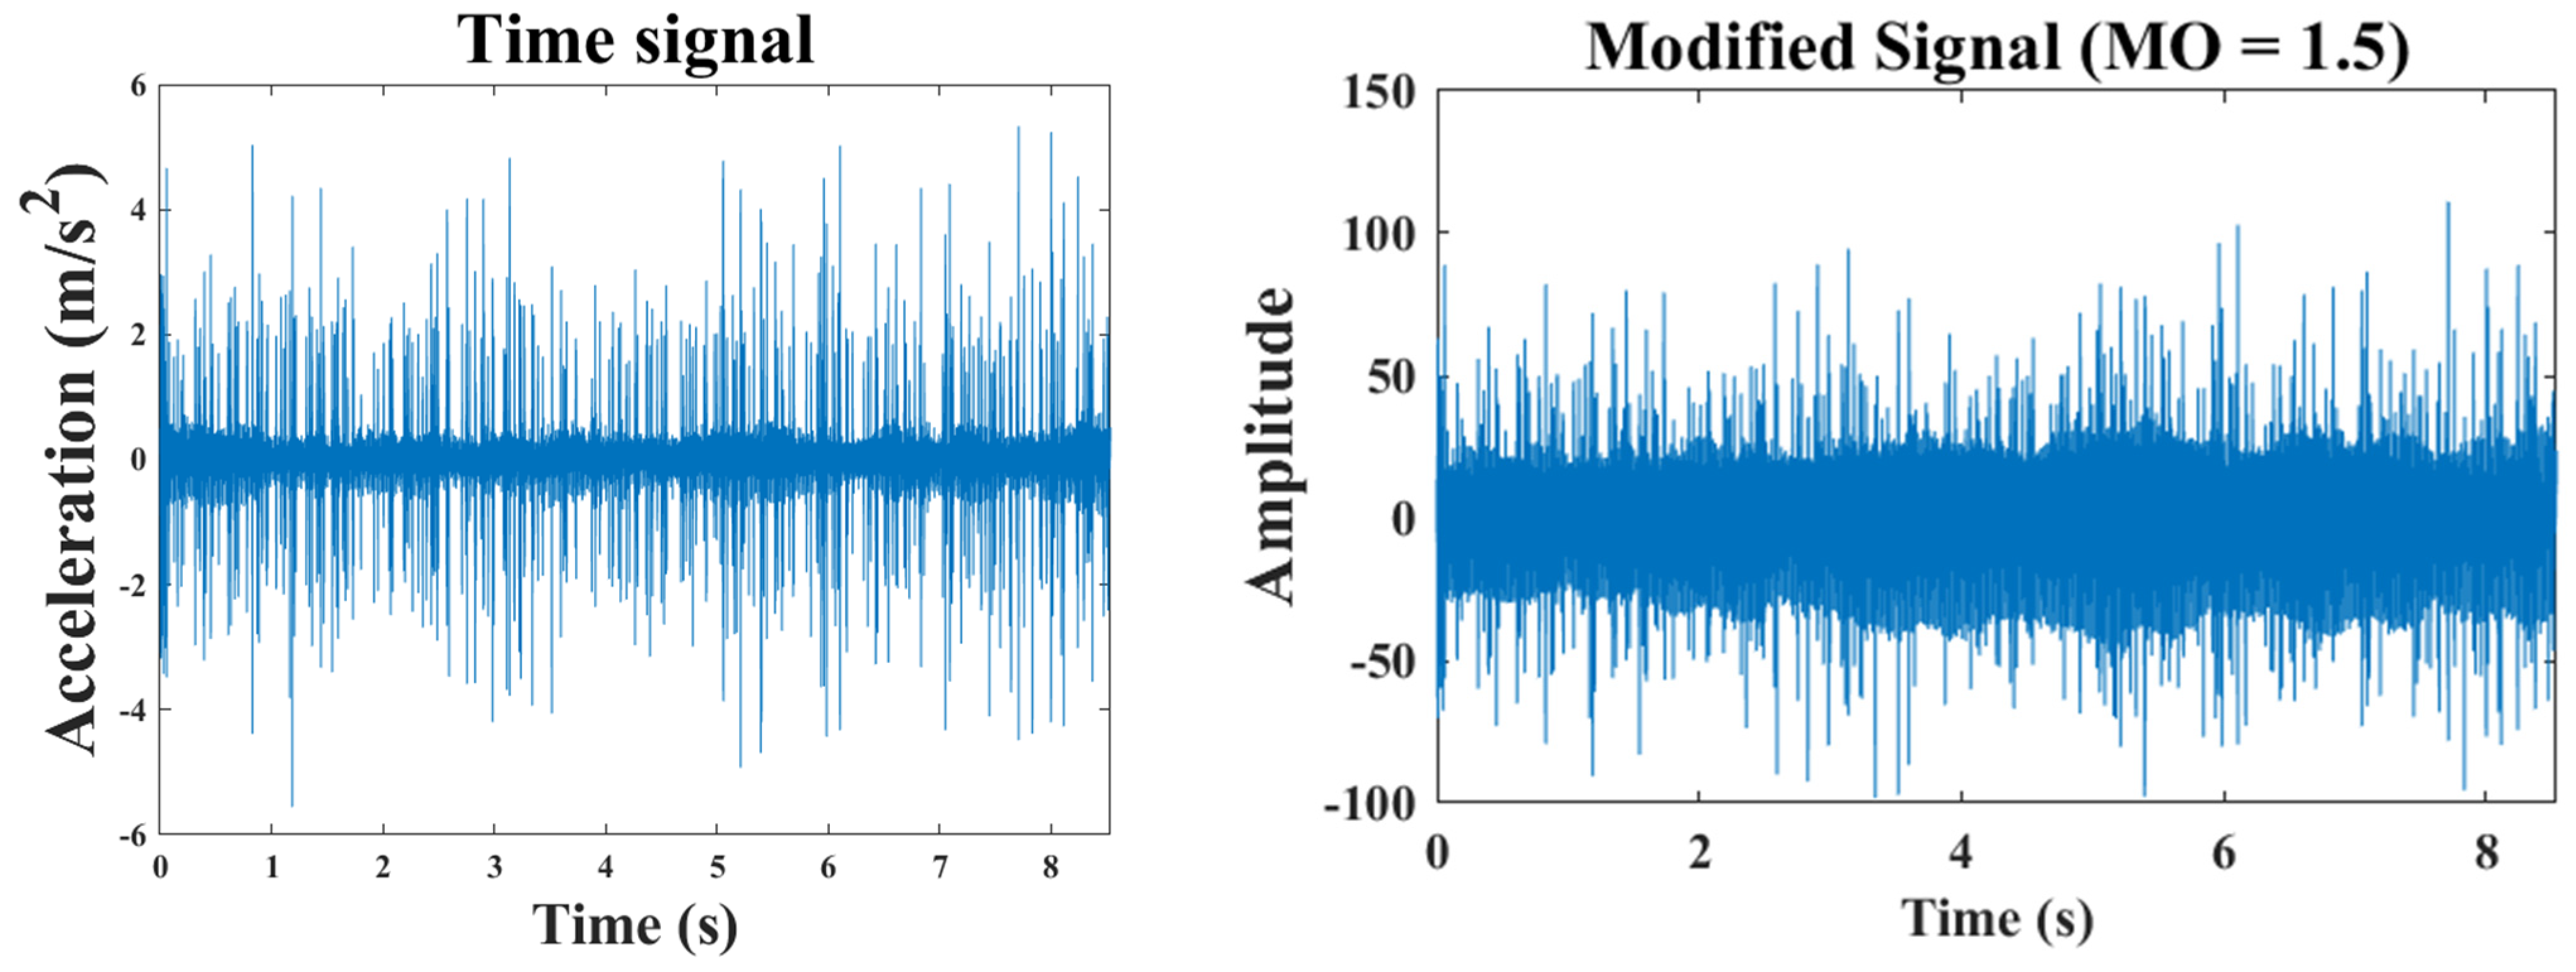
The time domain diagram of the inner ring fault signal and the time domain diagram of the correction signal are shown in Figure 13. The envelope spectrum of the original fault signal in the inner ring is shown in Figure 14.
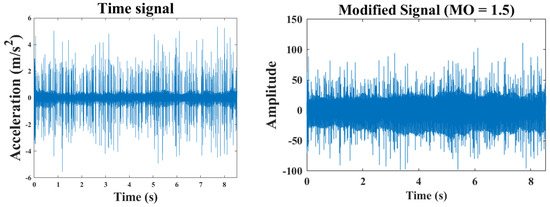
Figure 13.
Original signal and modified signal of inner circle fault.
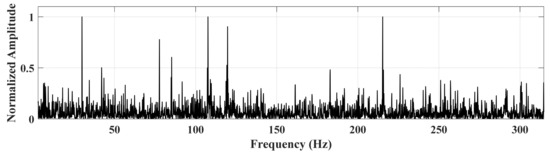
Figure 14.
Inner ring original signal envelope spectrum.
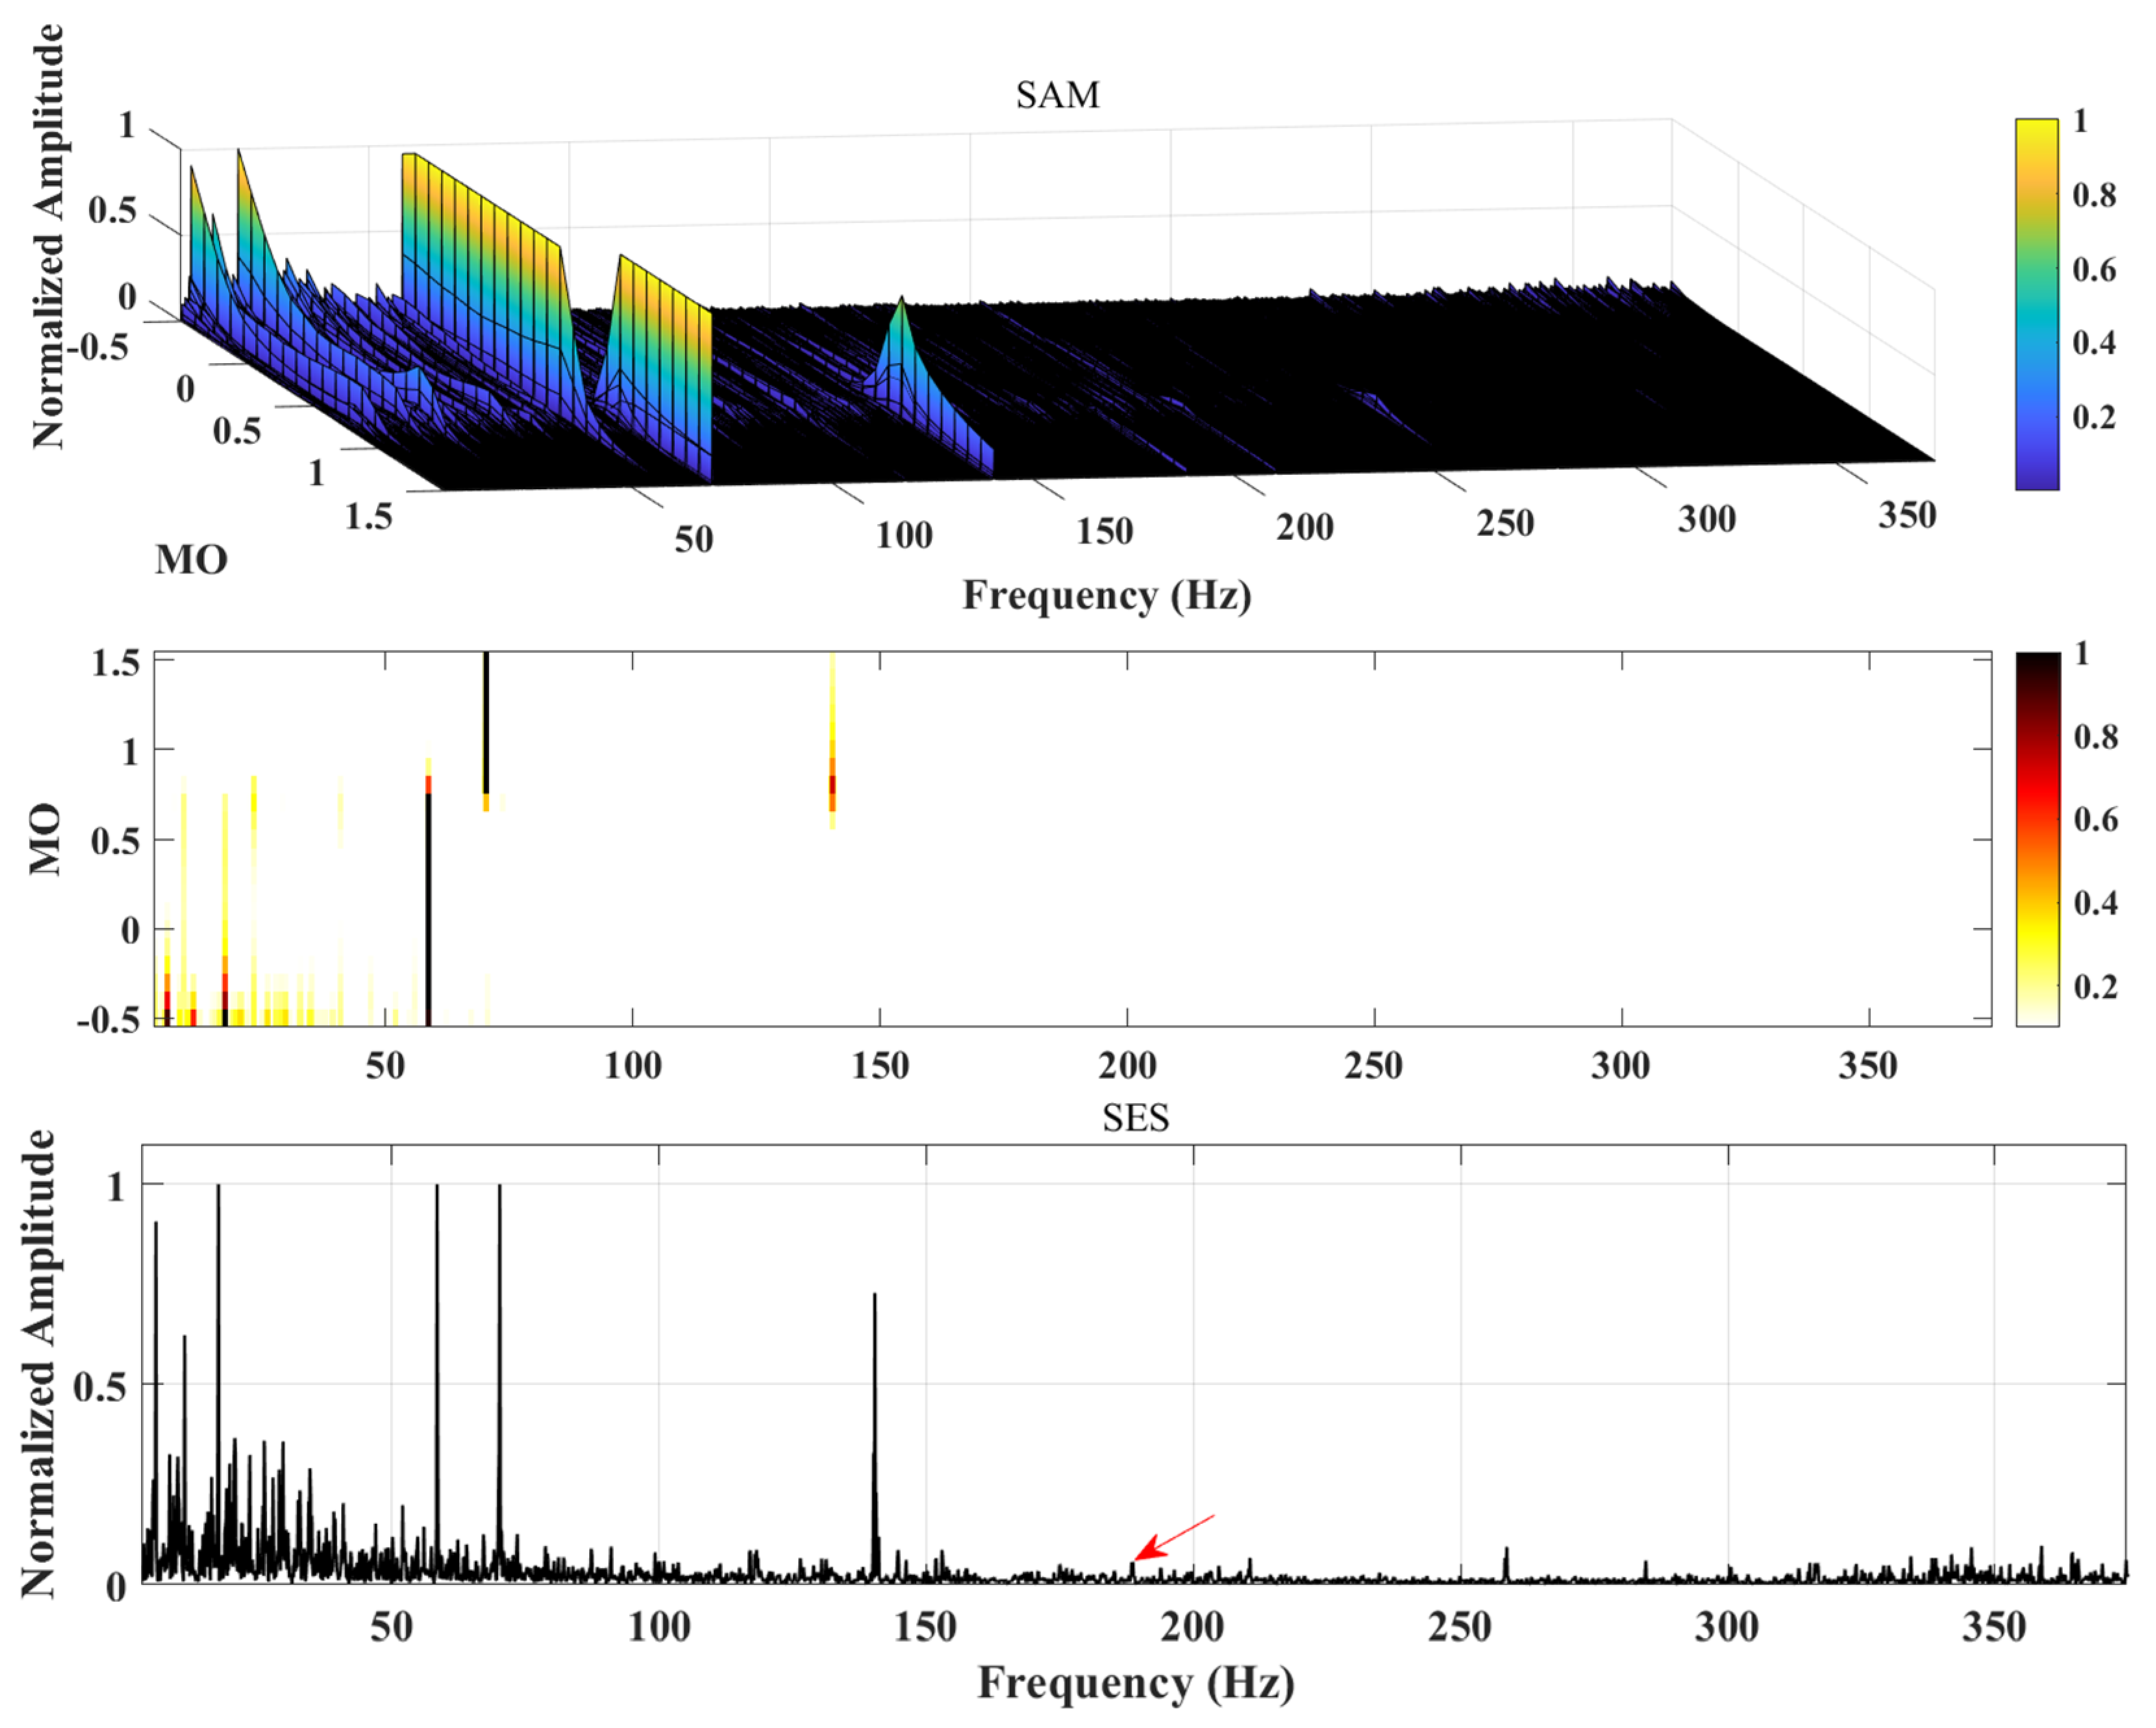
The results of the SAM method are shown in Figure 15. The red arrow represents the inner ring fault frequency and doubling. For convenience of comparison, the three-dimensional graph, two-dimensional graph, and square envelope spectrum diagram are still given, and the weight index is still set to 1.5. From the two-dimensional graph, it can be observed that the irrelevant components dominate the interval , no doubling of the fault frequency can be observed, and only a weak is present in the square envelope spectrum.

Figure 15.
Inner ring fault analysis results based on SAM method.
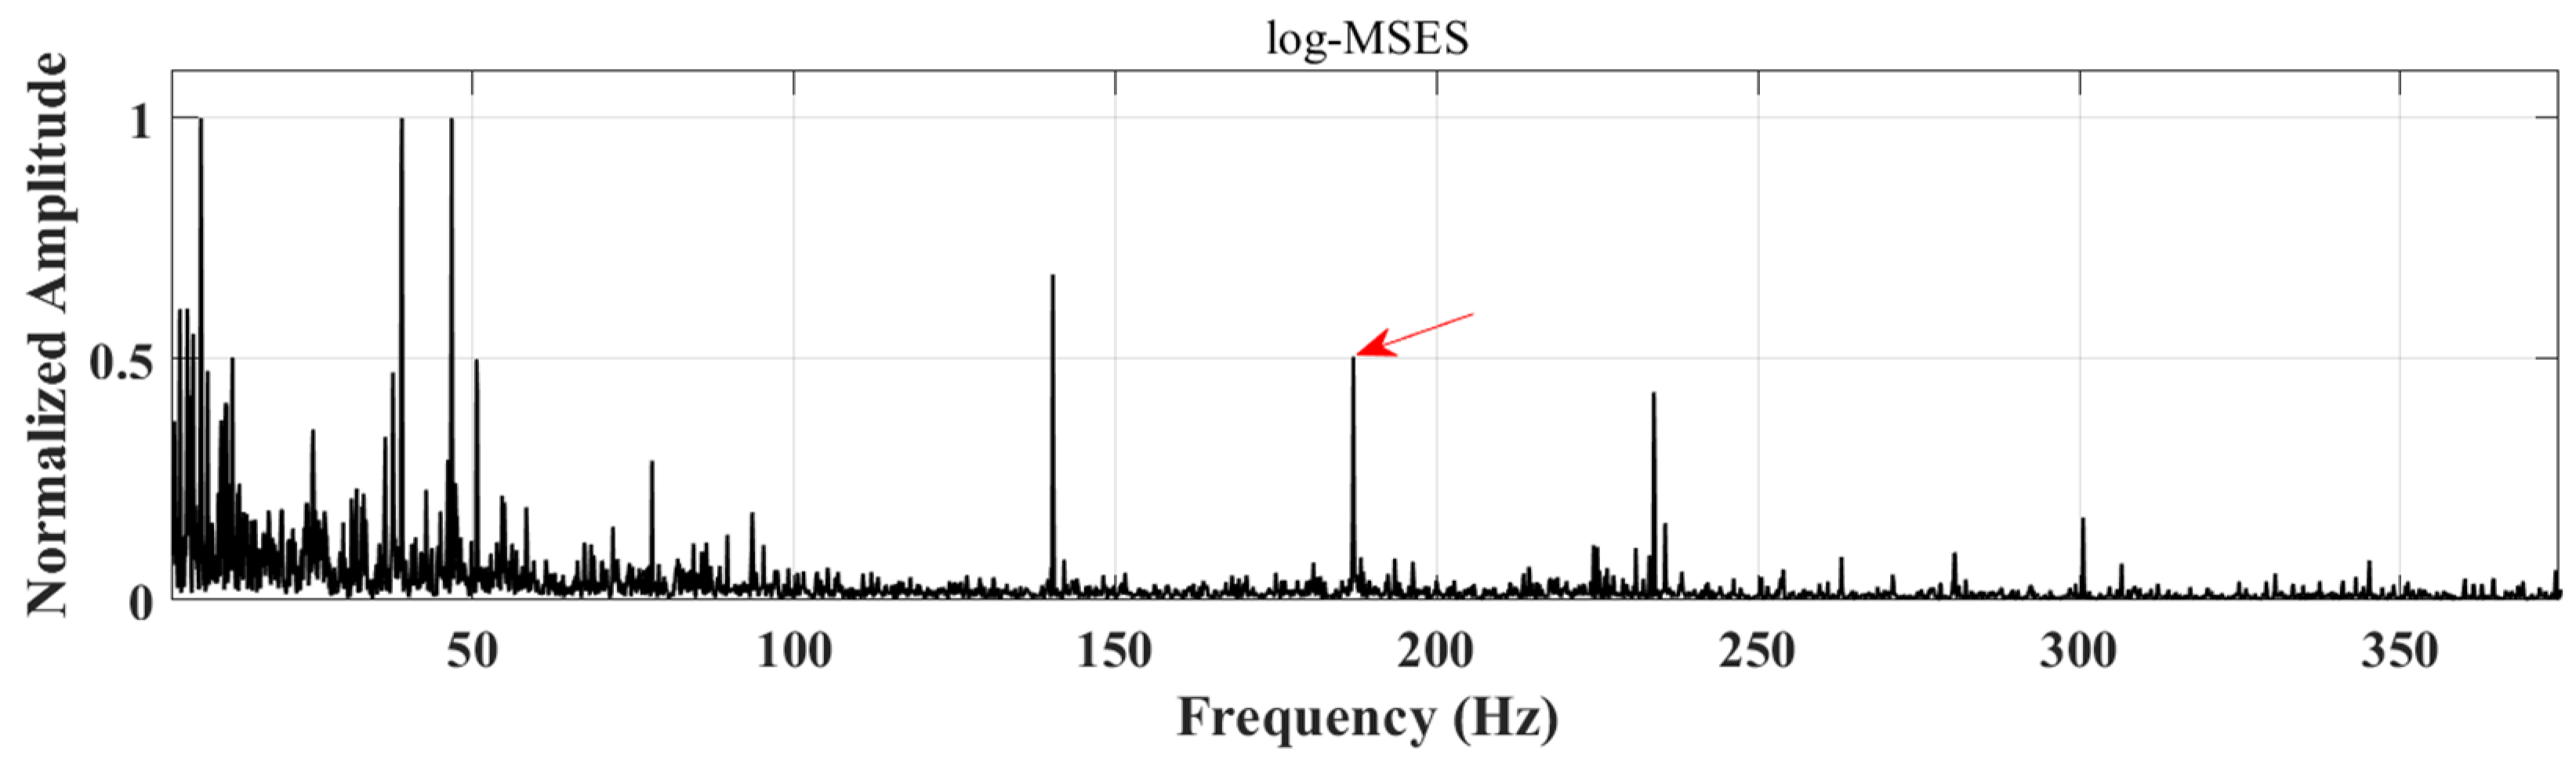
The results of the DA-SAM method proposed in this paper are shown in Figure 16. The red arrow represents the inner ring fault frequency and doubling. The is 1.5. From the two-dimensional graph, it can be observed that although the fault component in the interval is disturbed to a certain extent, the fault frequency can be detected and recognized, and is also observed in the logarithmic maximum square envelope spectrum. Compared with Figure 15, the effect is improved.
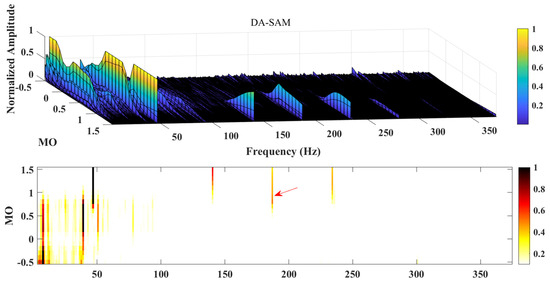
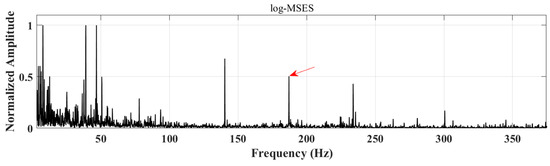
Figure 16.
Inner ring fault analysis results based on DA-SAM method.
Through the inner circle analysis of the signal results, it can be seen that the effectiveness of the SAM method is significantly reduced under complex interference; the effectiveness of the DA-SAM method is significantly improved by further processing to improve the wavelet threshold noise reduction.
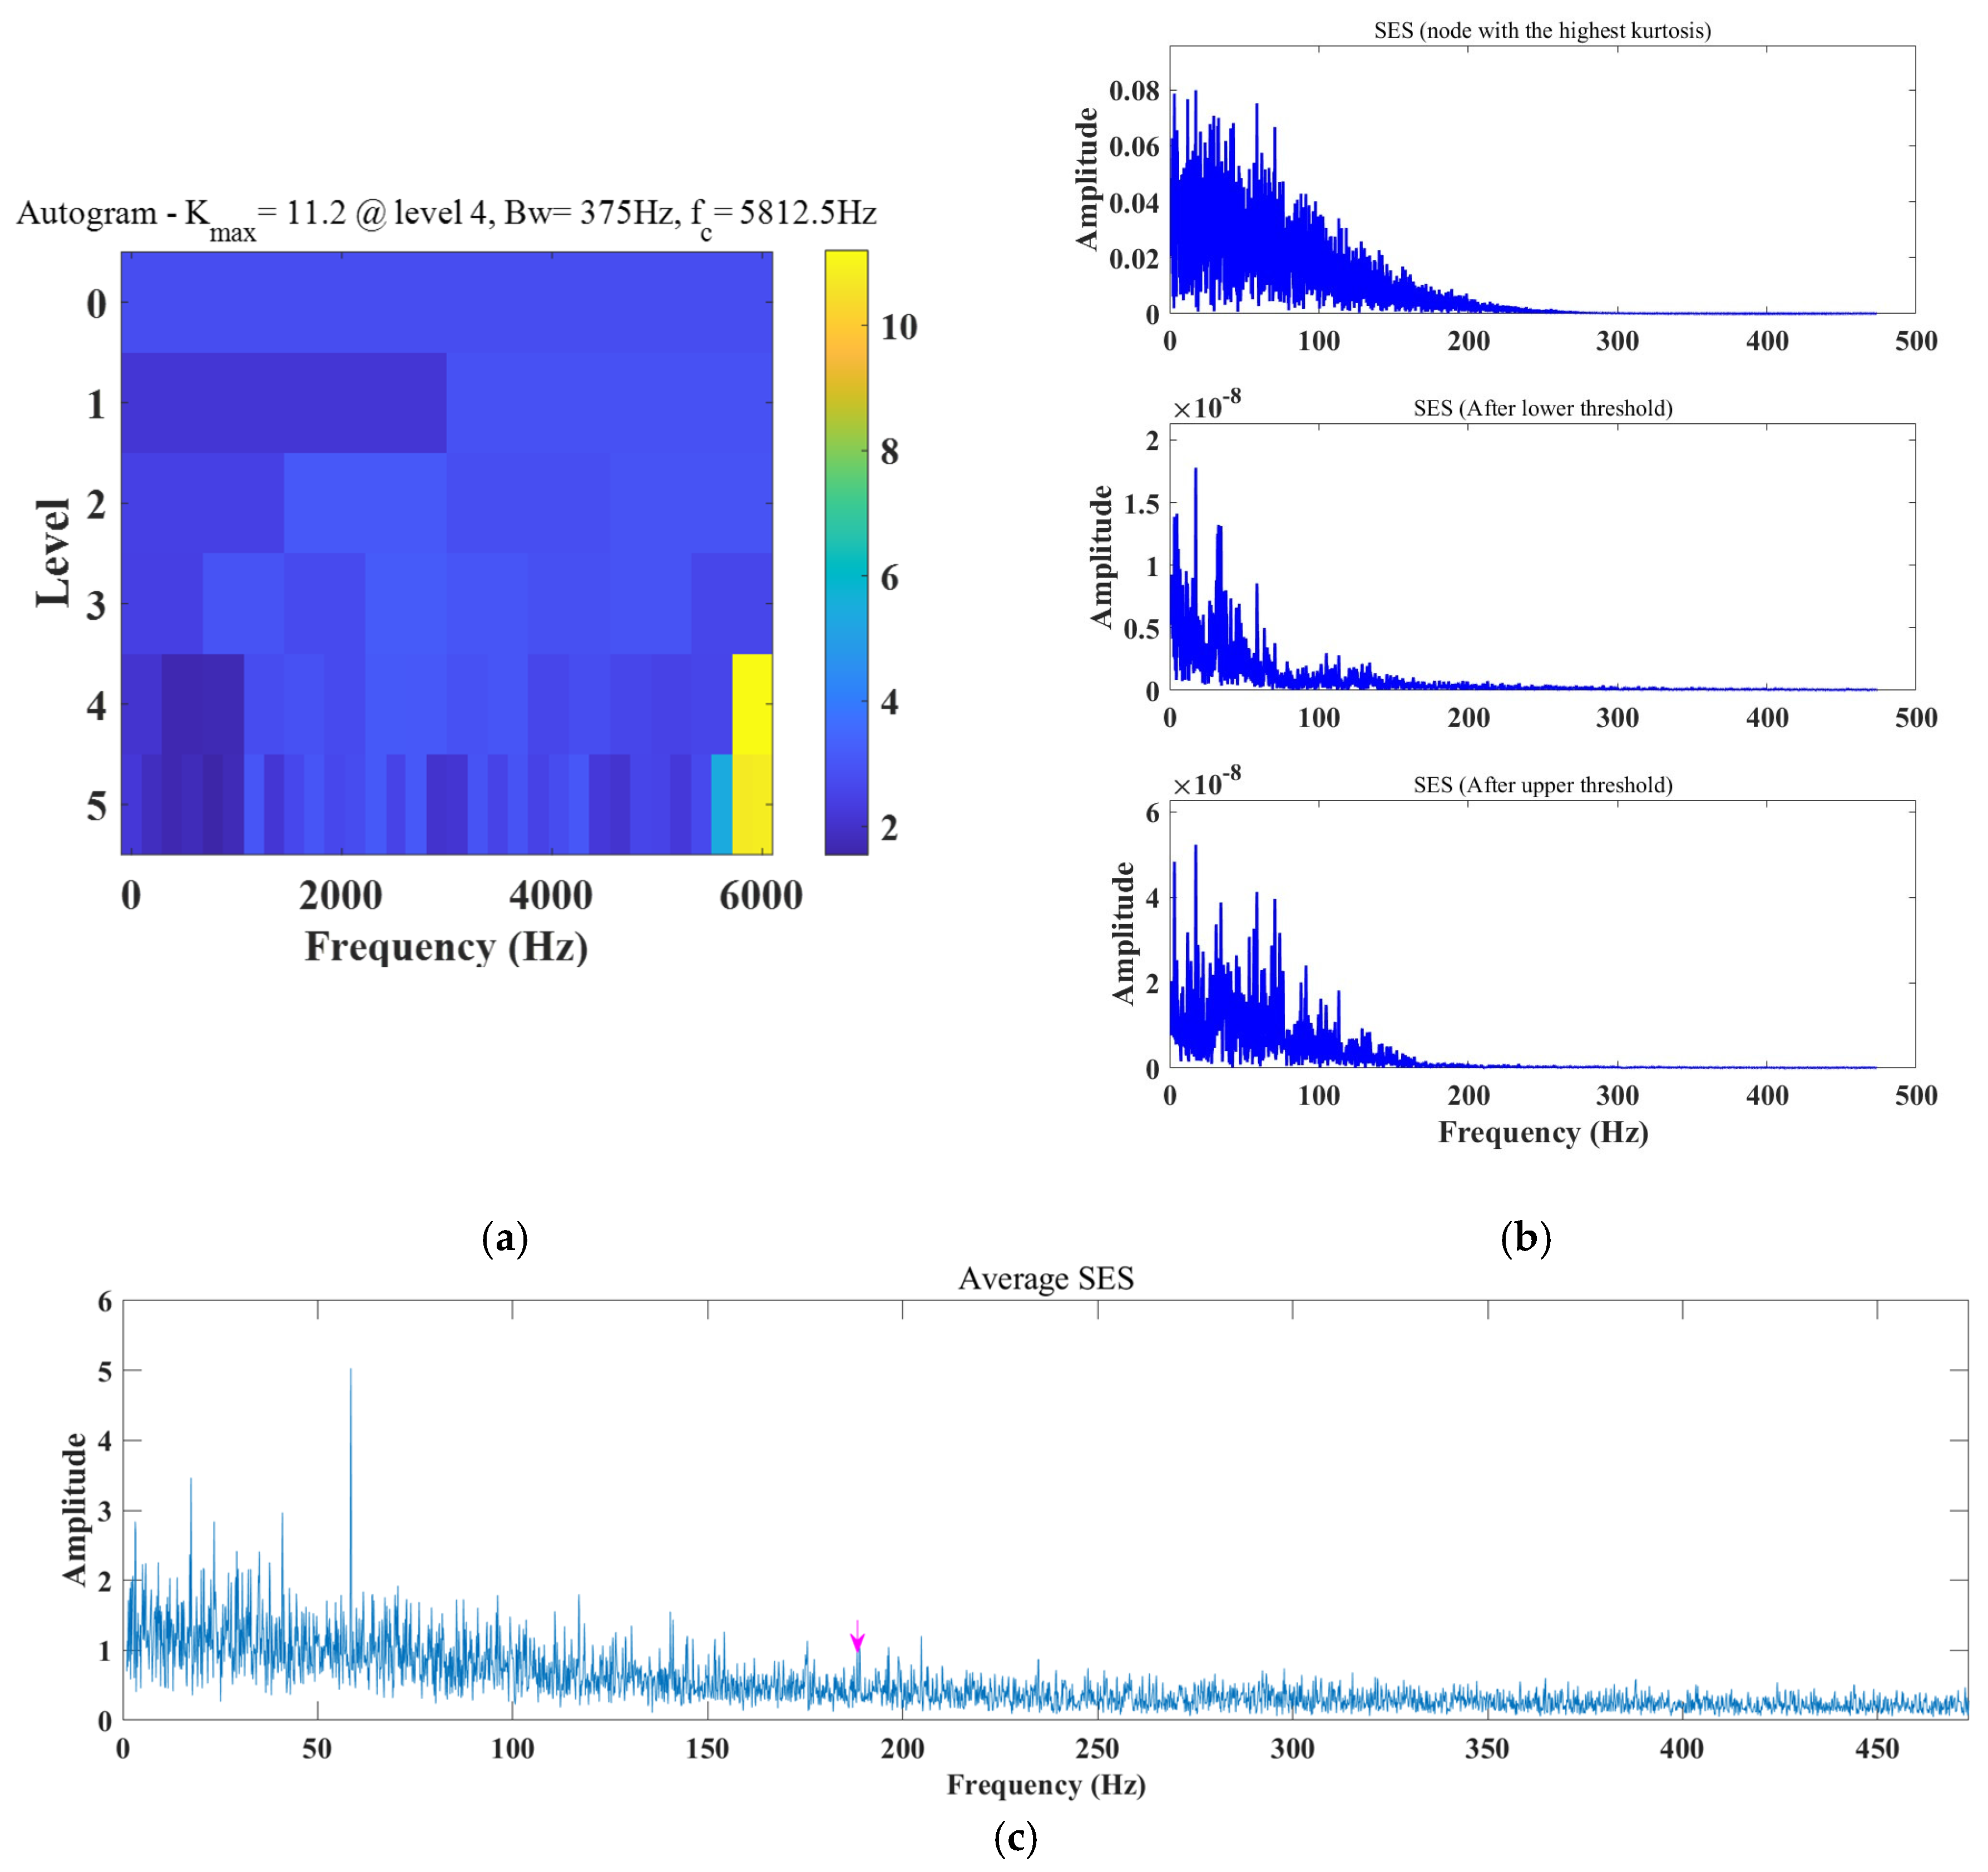
Next, we continue to analyze the experimental signal through the Autogram method and the fast spectral kurtosis method. The red arrow and pink arrow represent the inner ring fault frequency and doubling. The fast kurtosis diagram method is shown in Figure 17 (where Bw is the bandwidth and fc is the center frequency). The optimal center frequency fc found is 3750 Hz. The envelope spectrum can show the fault frequency fi, but it is not in absolute dominance. The results of the Autogram method are shown in Figure 18. Its square envelope spectrum according to the determined optimal filtering parameters can be seen, which shows the results at the maximum kurtosis value and after the threshold increase and decrease operations, respectively, as shown in Figure 18b. The optimal center frequency fc found is 5812.5 Hz, the envelope spectrum and the average envelope spectrum are dominated by noise components, and no faults can be observed.
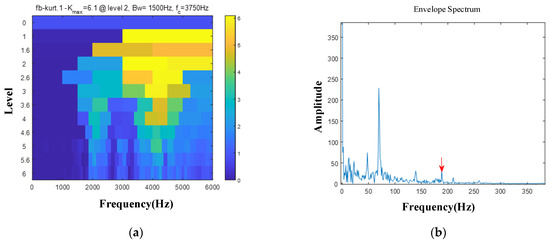
Figure 17.
Inner ring fault analysis results based on the fast spectral kurtosis method. (a) Fast kurtosis plot; (b) envelope spectrum.

Figure 18.
Inner ring fault analysis results based on the Autogram method. (a) Kurtosis plot; (b) SES; (c) mean squared envelope spectrum.
5.4. Composite Fault Experiment
To further illustrate the advantages of the method proposed in this paper, this section applies the DA-SAM method to the composite fault diagnosis of rolling bearings. Compared with single fault diagnosis, composite fault diagnosis has more irrelevant components and is more difficult, so the requirements for noise filtering are more stringent. The time domain diagram of the composite fault signal and the time domain diagram of the modified signal are shown in Figure 19. The envelope spectrum of the original signal of the composite fault is shown in Figure 20.

Figure 19.
Composite fault original signal and modified signal.
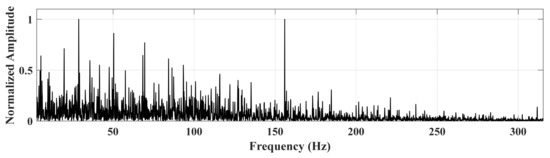
Figure 20.
Composite fault original signal envelope spectrum.
The results of the SAM method analysis are shown in Figure 21. The red arrow and red circle both represent the outer ring fault frequency and frequency doubling. For the convenience of comparison, the three-dimensional graph, two-dimensional graph, and square envelope spectrum diagram are still given, and the weight index is set to 1.5. No obvious fault information can be seen in the three-dimensional image. The two-dimensional image shows that, in the interval of , irrelevant components dominate, with only weak a , and no can be observed. Only can be observed in the square envelope spectrum, but it is extremely weak and cannot be observed in any other frequency doubling.

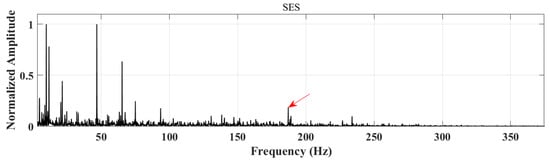
Figure 21.
Composite fault analysis results of SAM method.
The vibration signal is analyzed by using the DA-SAM method given in this paper, and the results are shown in Figure 22. The blue arrow and the red arrow represent the inner and outer ring fault frequencies and frequency doubling respectively. The is 1.5. From the two-dimensional graph, it can be seen that the fault component occupies an absolute dominant position in the interval , and quite clear and can be observed, and an with higher peaks can also be observed in the logarithmic maximum square envelope spectrum. Compared with Figure 18, the effect is significantly improved.
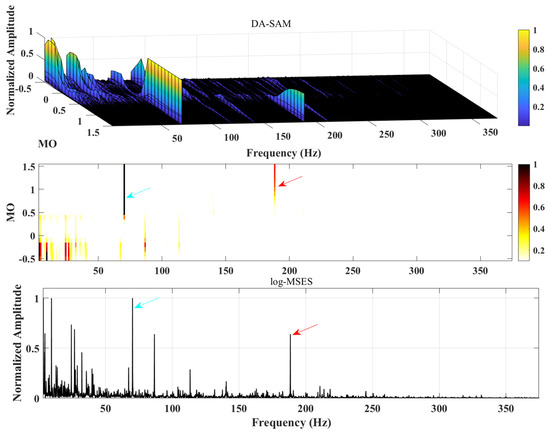
Figure 22.
Composite fault analysis results of DA-SAM method.
Through the composite analysis of the signal results, it can be seen that, under the conditions of complex interference and multiple fault components, the effectiveness of the SAM method is significantly reduced, while the DA-SAM method can still effectively distinguish fault information and detect it, and its effectiveness and accuracy have been significantly improved.
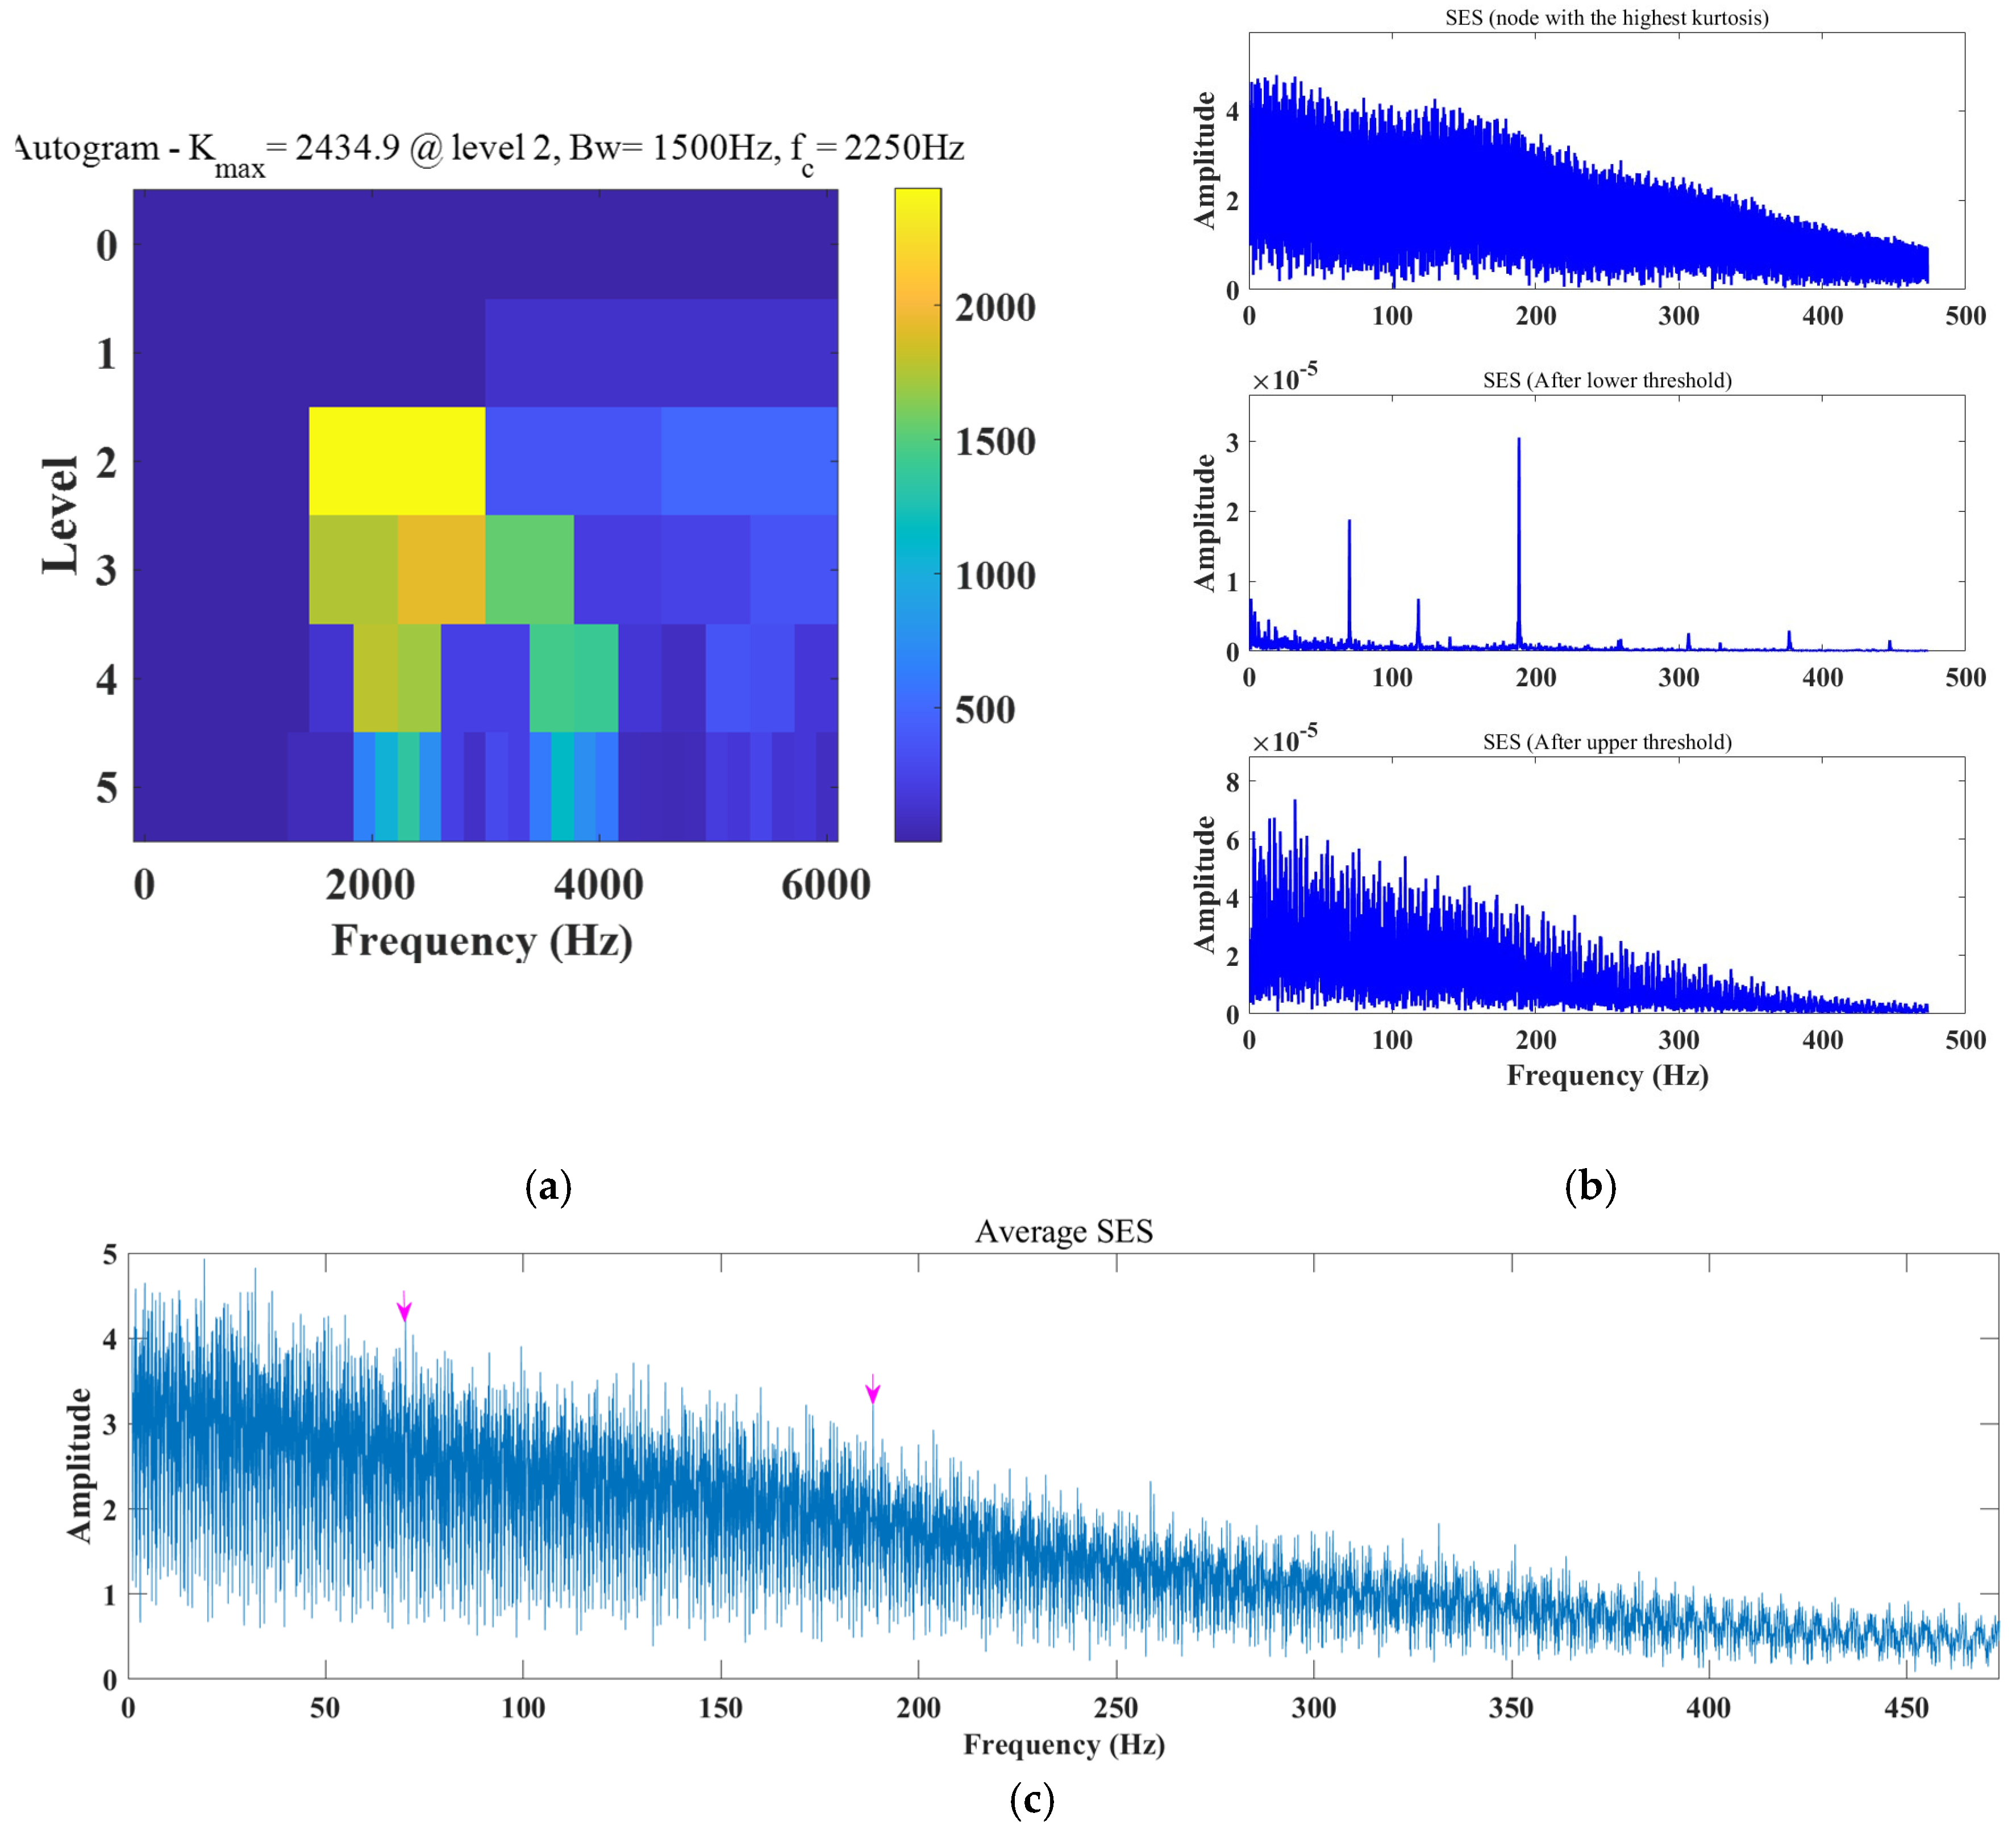
We went on to analyze the experimental signal with the Autogram method and fast spectral kurtosis method. The red arrow and pink arrow represent the fault frequency and doubling. The fast kurtosis diagram method is shown in Figure 23 (where Bw is the bandwidth and fc is the center frequency). The optimal center frequency fc found is 4968.75 Hz. Only an extremely weak fo can be observed in the envelope spectrum, but no fi. The results of the Autogram method are shown in Figure 24. Its square envelope spectrum according to the determined optimal filtering parameters can be seen, which are the results at the maximum kurtosis value and after the threshold increase and decrease operations, respectively, as shown in Figure 24b. The optimal center frequency fc was found to be 2250 Hz, among which only fo and fi were observed in the square envelope spectrum after lowering the threshold, and no frequency doubling was observed in the other two treatments. The average square envelope spectrum also has a large number of irrelevant components and is dominant.
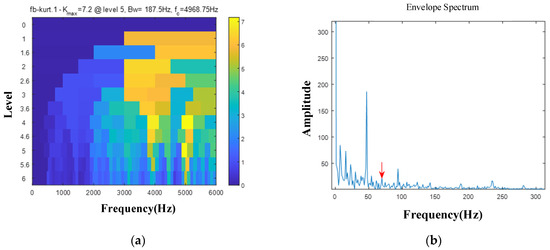
Figure 23.
Fast spectral kurtosis composite fault analysis results. (a) Fast kurtosis plot; (b) envelope spectrum.
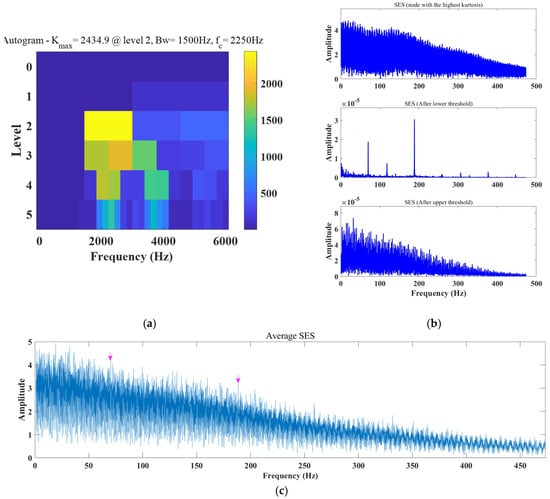
Figure 24.
Autogram composite fault analysis results. (a) Kurtosis plot; (b) SES; (c) Mean squared envelope spectrum.
6. Conclusions
Aimed at solving the problem that the effectiveness of the SAM method is seriously reduced under complex interference, this paper proposes a data-enhanced spectral amplitude modulation method. By performing improved wavelet transform noise reduction on a series of corrected signals obtained after modulation, the irrelevant components in the reconstructed corrected signals under different MOs are further reduced and the accuracy of the original method is improved. The method is verified by a set of outer ring fault data sets, a set of inner ring fault data sets, and a set of composite fault data sets containing a large number of interference components, and is compared with the original SAM method, the Autogram method, and the fast kurtosis diagram method. The results show that the DA-SAM method has a better overall performance, providing a new possibility for extracting rolling bearing fault characteristics under complex interference conditions.
Author Contributions
Z.M.: Writing—Original Draft; Conceptualization; Formal Analysis; Methodology; Data collection; Equipment debugging; Manuscript revision; Software; Charting. Y.C.: Conceptualization; Funding Acquisition; Resources; Supervision; Writing—Review & Editing. T.Z.: Formal Analysis; Investigation; Data collection; Equipment debugging. Z.L.: Data collection; Equipment debugging. All authors have read and agreed to the published version of the manuscript.
Funding
This research work was supported by the National Natural Science Foundation of China (611175054); Natural Science Foundation of Zhejiang Province (LY16E050001).
Data Availability Statement
Data are contained within the article.
Conflicts of Interest
The authors declare no conflict of interest.
References
- Rai, A.; Upadhyay, S.H. A review on signal prcessing techniques utilized in the fault diagnosis of rolling element bearings. Tribol. Int. 2016, 96, 289–306. [Google Scholar] [CrossRef]
- Zhang, K.; Xu, Y.; Ma, C.; Zhang, H.; Sheng, Z. Empirical Fast Spectral Kurtosis and Its Application in Fault Diagnosis of Rolling Bearings. J. Vib. Eng. 2020, 33, 636–642. [Google Scholar]
- Liu, Y.; Yang, S.; Liao, Y.; Wang, C. An adaptive resonance demodulation method and its application in early fault diagnosis of rolling bearings. J. Vib. Eng. 2016, 29, 366–370. [Google Scholar]
- Wang, X.; Zheng, J.; Ni, Q.; Pan, H.; Zhang, J. Traversal index enhanced-gram (TIEgram): A novel optimal demodulation frequency band selection method for rolling bearing fault diagnosis under non-stationary operating conditions. Mech. Syst. Signal Process. 2022, 172, 109017. [Google Scholar] [CrossRef]
- Cai, B.; Zhang, L.; Tang, G. Encogram: An autonomous weak transient fault enhancement strategy and its application in bearing fault diagnosis. Measurement 2023, 206, 112333. [Google Scholar] [CrossRef]
- Antoni, J. Fast computation of the kurtogram for the detection of transient faults. Mech. Syst. Signal Process. 2007, 21, 108–124. [Google Scholar] [CrossRef]
- Antoni, J.; Randall, R.B. The spectral kurtosis: Application to the vibratory surveillance and diagnostics of rotating machines. Mech. Syst. Signal Process. 2006, 20, 308–331. [Google Scholar] [CrossRef]
- Antoni, J. The spectral kurtosis: A useful tool for characterising non-stationary signals. Mech. Syst. Signal Process. 2006, 20, 282–307. [Google Scholar] [CrossRef]
- Ma, C.; Sheng, Z.; Xu, Y.; Zhang, K. Fault diagnosis of rolling bearings based on adaptive frequency slice wavelet transform. J. Agric. Eng. 2019, 35, 34–41. [Google Scholar]
- Barszcz, T.; JabŁoński, A. A novel method for the optimal band selection for vibration signal demodulation and comparison with the kurtogram. Mech. Syst. Signal Process. 2011, 25, 431451.370. [Google Scholar] [CrossRef]
- Antoni, J. The infogram: Entropic evidence of the signature of repetitive transients. Mech. Syst. Signal Process. 2016, 74, 73–94. [Google Scholar] [CrossRef]
- Wang, D.; Tse, P.W.; Tsui, K.L. An enhanced kurtogram method for fault diagnosis of rolling element bearings. Mech. Syst. Signal Process. 2013, 35, 176–199. [Google Scholar] [CrossRef]
- Lei, Y.; Lin, J.; He, Z.; Zi, Y. Application of an improved kurtogram method for fault diagnosis of rolling element bearings. Mech. Syst. Signal Process. 2011, 25, 1738–1749. [Google Scholar] [CrossRef]
- Ali, M.; Fasana, A. The Autogram: An effective approach for selecting the optimal demodulation band in rolling element bearings diagnosis. Mech. Syst. Signal Process. 2018, 105, 294–318. [Google Scholar]
- Antoni, J.; Xin, G.; Hamzaoui, N. Fast computation of the spectral correlation. Mech. Syst. Signal Process. 2017, 92, 248–277. [Google Scholar] [CrossRef]
- Borghesani, P.; Pennacchi, P.; Chatterton, S. The relationship between kurtosis- and envelope-based indexes for the diagnostic of rolling element bearings. Mech. Syst. Signal Process. 2014, 43, 25–43. [Google Scholar] [CrossRef]
- Zhang, X.; Kang, J.; Xiao, L.; Zhao, J.; Teng, H. A new improved kurtogram and its application to bearing fault diagnosis. Shock Vib. 2015, 2015, 385412. [Google Scholar] [CrossRef]
- Liao, Y.; Sun, P.; Wang, B.; Qu, L. Extraction of repetitive transients with frequency domain multipoint kurtosis for bearing fault diagnosis. Meas. Sci. Technol. 2018, 29, 055012. [Google Scholar] [CrossRef]
- Liu, W.; Liu, Y.; Yang, S.; Gu, X. Fault diagnosis method for rolling bearings based on typical spectral correlation kurtosis diagram. Vib. Shock 2018, 37, 87–92. [Google Scholar]
- Gu, X.; Yang, S.; Liu, Y.; Hao, R. Rolling element bearing faults diagnosis based on kurtogram and frequency domain correlated kurtosis. Meas. Sci. Technol. 2016, 27, 125019. [Google Scholar] [CrossRef]
- Moshrefzadeh, A.; Fasana, A.; Antoni, J. The spectral amplitude modulation: A nonlinear filtering process for diagnosis of rolling element bearings. Mech. Syst. Signal Process. 2019, 132, 253–276. [Google Scholar] [CrossRef]
- Qin, C.; Wang, D.; Xu, Z.; Tang, G. Improved Empirical Wavelet Transform for Compound Weak Bearing Fault Diagnosis with Acoustic Signals. Appl. Sci. 2020, 10, 682. [Google Scholar] [CrossRef]
- Chen, B.; Cheng, Y.; Cao, H.; Song, S.; Mei, G.; Gu, F.; Zhang, W.; Ball, A.D. Generalized Statistical Indicators-Guided Signal Blind Deconvolution for Fault Diagnosis of Railway Vehicle Axle-box Bearings. IEEE Trans. Veh. Technol. 2024; Early Access. [Google Scholar] [CrossRef]
- Shi, P.; Zhang, W.; He, D.; Han, L. Weak signal enhancement for machinery fault diagnosis based on a novel adaptive multi-parameter unsaturated stochastic resonance. Appl. Acoust. 2022, 189, 108609. [Google Scholar] [CrossRef]
- Han, C.; Lu, W.; Wang, P.; Song, L.; Wang, H. Bearing Fault Diagnosis Based on Clustering and Sparse Representation in Frequency Domain. IEEE J. Mag. 2021, 70, 3513914. [Google Scholar]
- Chen, B.; Smith, W.A.; Cheng, Y.; Gu, F.; Chu, F. Probability distributions and typical sparsity measures of Hilbert transform-based generalized envelopes and their application to machine condition monitoring. Mech. Syst. Signal Process. 2024, 160, 107844. [Google Scholar] [CrossRef]
- Yu, Y.; Li, Y.; Yang, P.; Pu, F.; Ben, Y. Feature extraction of acoustic emission signals for rolling bearing faults using improved wavelet threshold function and ACEWT method. Vib. Shock 2023, 42, 194–202. [Google Scholar]
- Chen, P.; Zhao, X. Early fault feature extraction of rolling bearings based on optimized VMD and improved threshold denoising. Vib. Shock 2021, 40, 146153. [Google Scholar]
- Yang, Z.; Huo, Y. Research on bearing signal denoising based on improved wavelet algorithm. Chin. J. Eng. Mach. 2020, 18, 40–44. [Google Scholar]
- Shao, S.Y.; Mcaleer, S.; Yan, R.Q.; Baldi, P. Highly accurate machine fault diagnosis using deep transfer learning. IEEE Trans. Ind. Inform. 2019, 15, 2446–2455. [Google Scholar] [CrossRef]


Disclaimer/Publisher’s Note: The statements, opinions and data contained in all publications are solely those of the individual author(s) and contributor(s) and not of MDPI and/or the editor(s). MDPI and/or the editor(s) disclaim responsibility for any injury to people or property resulting from any ideas, methods, instructions or products referred to in the content. |
© 2024 by the authors. Licensee MDPI, Basel, Switzerland. This article is an open access article distributed under the terms and conditions of the Creative Commons Attribution (CC BY) license (https://creativecommons.org/licenses/by/4.0/).