Abstract
Cable-hole transmission is widely applied in cable-driven mechanisms to reduce the mechanical size. However, the driving tension is attenuated with the cable threading through the hole caused by uncertain factors such as local deformation, friction, and other effects, and errors in cable-hole transmission occur. To improve the transmission accuracy of cable-driven mechanisms, a tension distribution model considering the cable lateral extrusion is established. Then, an analytical tension ratio of the cable-hole transmission is derived based on the perturbation method and tension distribution model. Parameters of the tension ratio are identified using a particle swarm optimization algorithm. An adaptive tension control method considering the cable lateral extrusion is designed and compared with the method excluding the cable lateral extrusion in the cable-hole transmission. Finally, a cable-hole transmission experimental device was constructed to verify the tension ratio, parameter identification, and servo control method of the cable-hole transmission. The results show the motion control accuracy of the cable-driven mechanism can be significantly improved with the tension ratio considering the cable lateral extrusion. Compared to the case excluding the cable lateral extrusion, the errors in cable-hole transmission considering the lateral extrusion are reduced by an order of magnitude, and the tension vibration is significantly weakened.
1. Introduction
The cable-driven mechanism is widely applied in fields such as robotics, aerospace, and medical devices [1,2,3]. Compared to cable transmission mechanisms like cable wheels and winches, the cable-hole transmission device is easily installed due to the compact structure. Therefore, cable-driven mechanisms are predominantly used in confined spaces, such as cable-driven dexterous manipulators and cable barrier systems, etc. [4,5]. However, the cable tension in contact with the hole is subject to complex friction and extrusion effects, causing the cable transmission tension to attenuate. To ensure the precision of cable transmission in the cable-driven mechanism, an accurate model of the cable-hole transmission tension and the tension ratio are required.
Cable-hole structures are widely used in cable-driven robotic arms, and the friction effects cannot be ignored. Therefore, researchers have enhanced the accuracy of force calculation by developing a cable-hole friction model, which can effectively simulate the dynamic properties of the mechanisms or provide compensation for motion control. Muneaki Miyasaka et al. established a cable-pulley network friction model to calculate the tension decay in cable-pulley transmission, which was validated on the RAVEN II robotic surgery platform, significantly reducing dynamic error in the mechanism [6]. In [7], an improved Coulomb friction model was used to establish the dynamic model of a cable-driven continuum manipulator, demonstrating that the constant curvature bending of the segments does not remain. Since the LuGre friction model can effectively simulate static and dynamic friction effects, it is often used in cable transmission modeling, as seen in [8,9]. Zhuo Liang et al. used the Euler–Eytelwein equation to model the friction effects between cables and cable routing holes, which can analyze the force closure effect in multilink cable-driven redundant manipulators accurately [10]. Miha Dežman et al. calculated the adhesion between a cable and sheath based on Stribeck and Coulomb friction and optimized the drive system of an upper-limb exoskeleton, improving the overall performance by 15% [11]. However, the existing friction models are relatively simple, and the calculation accuracy of the cable-hole friction is not high enough. By constructing a more precise cable-hole transmission model, the dynamic properties of the cable-driven mechanism can be further improved.
At present, most researchers establish the model of the cable transmission tension ratio based on the cable-pulley or cable-slot contact phenomenon. Initially, according to the Coulomb friction and cable-wheel contact, the capstan equation (also known as Euler’s equation), which is a DEM (Differential Equation Model) to calculate the transmission tension of belt or ropes, was established. Researchers often overlook cable bending stiffness in the capstan equation, leading to inaccurate boundary conditions. Therefore, Jae Ho Jung, Pan, Kang et al. improved the capstan equation based on the nonlinear Amonton friction [12]. Yafei Lu et al. further revised the cable transmission ratio model to account for factors such as bending stiffness, shear stiffness, and initial tension, and derived the analytical solution [13]. Gao X et al. introduced the lateral extrusion effect of the cable into the cable transmission model, further enhancing the calculation accuracy of the cable transmission tension [14]. Shudong Guo et al. established a quasi-static model of the cable-pulley system adopted in China’s Lunar Exploration Project for kinematic modelling of the mechanism [15]. The analysis results show that the matching of the cable axis compensation speed with the winch rotation speed directly affects the positioning accuracy of the mechanism. A cable-pulley transmission theory called “Global Dynamic Wrap Angle” was proposed. This method precisely models and analyzes the friction at the cable-pulley contact position, and is applicable to the kinematic analysis of high-speed and heavy-load friction hoisting systems [16]. Yun Peng et al. developed a variable-length cable element using the arbitrary-Lagrangian–Eulerian (ALE) formulation and derived the law of tension decay caused by pulley friction, which was the Coulomb model [17]. A cable tension equation considering the flexible groove was designed to calculate the load variation of the multi-cable friction winding machine and can be used to formulate a new standard allowing for groove depth variation [18]. A cable-slot contact surface model based on the Taylor series was proposed and used to derive the analytical model of the lifting force of a flexible cable-sheave hoisting mechanism, which optimized the sheave groove angle and gear teeth of the hoisting mechanism [19]. José L. Escalona conducted a detailed analysis of the friction between cable wheels under static conditions and verified the analytical solution of the cable-wheel contact force, including cable tension [20]. The Curve-to-Solid Beam (CTSB) contact algorithm was developed to calculate the tension ratio and the cable position on the rigid surface [21]. A cable-hole contact dynamic model considering stick–slip friction was established. This model derived the friction at the Eulerian nodes based on the Coulomb model and uses a model smoothing method to solve the contact stiffness problem caused by high-stiffness ropes [22]. A finite element model (FEM) of the cable transmission considering the cable surface wear was established and used to analyze the cable transmission error and tension under the variation of the cable-pulley friction coefficient, elastic modulus, and Poisson’s ratio. An FEM of the cable-wheel transmission considering the boundary conditions of co-position and tangential conditions was established, thereby effectively improving the computational efficiency of the cable transmission dynamics model [23]. Jing Wang et al. calculated the contact force between the cable and pulley based on the principle of virtual work and corrected the transmission force of the cable-pulley [24]. A contact model based on ANCF (Absolute Nodal Coordinate Formulation) and integrating hydrodynamic drag, added mass, and internal cable damping was established to analyze the cable-wheel contact and detachment [25]. After establishing the analytical model of the static cable-wheel contact, José L. Escalona proposed a cable-hole contact model based on new cubic ANCF-ALE contact elements, which can accurately simulate the contact force with fewer elements [26]. Yunting Han et al. discovered that the cable tension decreases with the increase in core elasticity by analyzing an FEM of fiber cable winding around the wheel; meanwhile, it was found that the cable traction force is related to the cable’s interwire friction through experiments [27]. A fast computation of dry contact based on multigrid techniques was designed for obtaining the pressure and stress distribution between the wire cable and friction lining [28]. Hye-Won Lee et al. established and verified an interference model between wire ropes and blocks including contact, sliding, and friction to avoid overload and collision accidents [29]. In addition, data-driven methods such as long short-term memory neural networks and genetic algorithms have also been utilized to modify the cable transmission model and effectively improve the model accuracy [30,31,32]. These data-driven algorithms are directly based on data for modeling, and the calculation accuracy conforms highly to experiments. However, they require a large number of parameters and a large number of data, with high demand for computing resources and weak interpretability.
From the above research content, it can be known that the common cable transmission modeling methods can be summarized as the DEM and the FEM. The DEM deduces the distribution of the tension along the contact surface based on the force balance principle of the micro-element of the cable segments, and analytical solutions of the tension ratio can be obtained in most cases. Although the existing differential equations of cable transmission include various factors such as axial deformation, friction, and bending stiffness of the cable, the effect of the lateral extrusion is mostly ignored. The cable lateral extrusion will cause variations in the boundary conditions, thereby affecting the calculation accuracy of the model. The FEM improves the calculation accuracy of the transmission tension by establishing cable elements and rigid-flexible coupling boundary conditions. However, the FEM with high demand of computing resources is difficult to meet the requirements of real-time calculation and control. Furthermore, in the cable transmission model based on cable-wheel contact or belt-wheel contact, the cable diameter is much smaller than the wheel diameter, which is mostly regarded as 0. However, for cable-hole transmission, the cable diameter is close to the hole diameter, and the diameter ratio of cable-hole transmission cannot be ignored. Thus, it is necessary to develop a cable transmission model that considers diameter variations of the cable due to extrusion to meet the requirements of high accuracy and efficient calculation of the cable-hole transmission tension. Based on the cable-hole transmission model, the transmission tension ratio of the cable threading through the hole can be calculated. However, due to the discontinuity of the friction at the zero speed, there is a sudden change in the cable tension ratio [33,34,35]. The error of the control method based on error compensation is large, and model compensation is essential. However, the model parameters are generally unknown. Therefore, it is necessary to design a servo control law of cable-hole transmission to compensate the parameter uncertainty.
To address these problems, a tension ratio model and the servo transmission properties of the cable-hole transmission, considering the cable lateral extrusion, are proposed and verified. A cable-hole transmission differential equation considering the cable lateral extrusion is established in Section 2. Based on the cable-hole transmission differential equation, an approximate analytical tension ratio is obtained using the parameter perturbation method in Section 3. Cable tension ratio parameters are identified utilizing the PSO (Particle Swarm Optimization) algorithm, and the servo control law for the cable-hole transmission is developed using the adaptive control algorithm presented in Section 4. The tension ratio model and servo control law of the cable-hole transmission designed in this paper are verified by an experimental prototype in Section 5. The conclusion is given in Section 6.
2. Mechanical Model of Cable-Hole Contact Surface
2.1. Cable-Hole Contact Surface
The cable-hole structure is used to guide the cable transmission direction and constrain the cable position in the narrow installation space. The direction of the cable segments located at both sides of the hole is generally different, represented by the transmission wrap angle. Due to the bending stiffness, the contact wrap angle of the cable threading through the hole is smaller than that of an ideal cable with zero bending stiffness, as shown in Figure 1 and Figure 2. Only when the cable tensions and are sufficiently high, it can be considered that about the wrap angle, as shown in Equation (1). The cable-hole wrap angle considering the cable bending stiffness is represented as Equations (A1)–(A11) in Appendix A.1 and calculated as:
where, is the cable-hole wrap angle without considering the cable bending stiffness; and represent the cable segment tension at both ends of the hole; represents the cable bending stiffness.
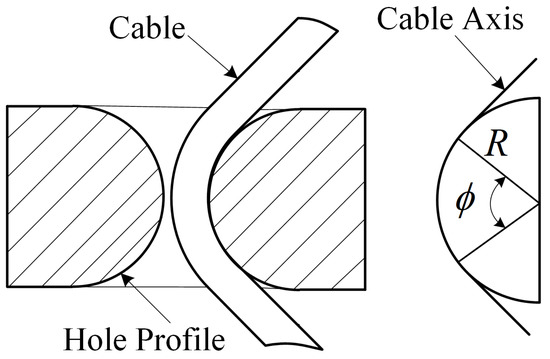
Figure 1.
Schematic of Cable Threading through the Hole without Bending Stiffness.
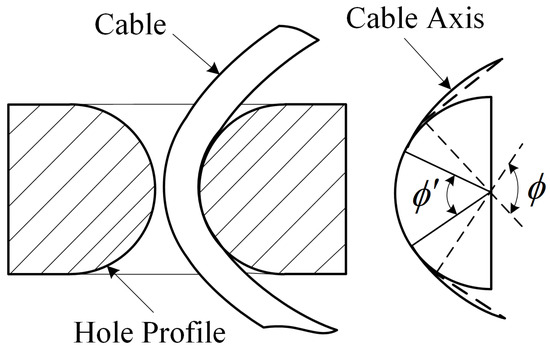
Figure 2.
Schematic of Cable Threading through the Hole with Bending Stiffness.
At the cable-hole contact area, the cable adheres to the inner surface of the hole and generates sliding friction with the hole. Besides the wrap angle, another parameter that represents the geometric properties of the cable-hole or cable-wheel contact surface is the diameter ratio, as shown in Equation (2). Unlike the cable-wheel contact, the inner diameter of the hole cannot be ignored compared to the diameter of the cable. Therefore, the cable-hole diameter ratio is an important parameter that cannot be ignored when evaluating the tension attenuation properties.
where, is the cable radius and represents the hole radius.
There is an extrusion effect between the cable and the hole. In fact, due to the cable being composed of multiple strands of wire spirally wound together, there are multitudinous gaps between these strands, leading to the actual radial stiffness being quite lower than that of the equal diameter structure with the same material. With the cable-hole extrusion effect, the spatial arrangement of the strands becomes denser, causing the cable to be prone to lateral deformation. Hence, in Equation (2), will not be equal to the cable diameter.
2.2. Compression Effect of Cable through Hole
With the pressure on the contact surface, the diameter of the cable in contact with the hole is smaller than that of the cable outside the hole. Therefore, when sliding friction occurs between the cable and hole, the cable material at the contact position is compressed by the hole and pushed to both sides, as can be seen in Figure 3. The compression of the cable at the contact point of the cable holes will cause the contact between the cable holes to change from line contact to surface contact. The micro-element of the cable at the contact point of the cable hole is selected for analysis. Since the stiffness of the hole is much greater than the radial stiffness of the cable, the hole is equivalent to a rigid body and the cable is equivalent to a flexible body. Then, the width of the compressed cable element can be calculated according to the Hertz contact theory. The traditional Hertz contact model can be rewritten as:
where, b is the width of the lateral contact surface of the cable hole; is the lateral elastic modulus of the cable; is the coefficient related to the cable and hole material; is Poisson’s ratio; N is the pressure on the cable from the hole; is the corner of the envelope.

Figure 3.
Schematic of Cable Threading through the Hole with Compression Effect.
When the cable is compressed, the cable-hole contact area increases because the hole contour is trapped inside the cable. Using the Kik–Piotrowski theory of virtual penetration, the width of the compressed part of the cable can be regarded as the string length of the virtual penetration of the cable and hole, as shown in Figure 4. Therefore, according to the cross-sectional characteristics of the cable hole contact, the virtual penetration can be calculated as:
where, is the virtual permeability, and also represents the lateral compression of the cable.
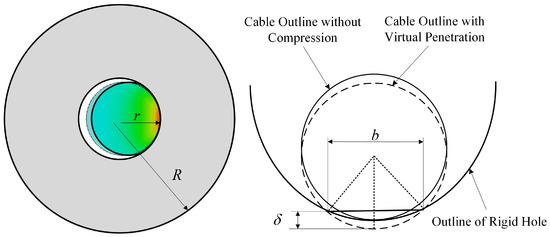
Figure 4.
Schematic of Lateral Profile of the Cable Hole Contact.
The longitudinal profile of the cable hole contact is shown in the Figure 5. As the cable is compressed, the contact surface between the cable element and the cable hole contour increases. The contact arc length between the compressed cable element and the hole contour is as follows:
where, l is the contact arc length between the cable profile and the hole profile; represents the arc length of the cable element in contact with the hole contour.
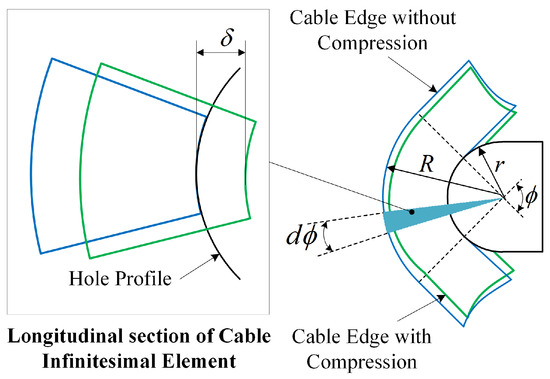
Figure 5.
Schematic of Longitudinal Profile of the Cable Hole Contact.
According to Equations (4) and (5), the contact area between the cable element and the hole contour can be calculated as follows:
According to Taylor’s formula, can be obtained by expanding Equation (4) about . Therefore, Equation (6) can be expressed as:
It can be seen from Equation (7) that the contact area between the cable micro-element and the hole is proportional to the pressure. The contact area increases with the increase in pressure. Besides, when the contact area increases, the friction resistance of the cable increases significantly.
2.3. Differential Equation of Cable Tension Threading through Hole
The external forces acting on the cable in the hole include the tension at both ends of the hole, the pressure, the friction, and the indentation resistance as shown in Figure 6 and Figure 7. With these force functions, the cable element in contact with the hole undergoes bending, shearing, and axial compression. The cable mass in the hole is small enough and can be ignored. Therefore, the force balance equation of the cable element can be written as:
where, , , , and represent the tangential force, shear force, normal force, bending moment and friction force acting on the cable element, respectively.
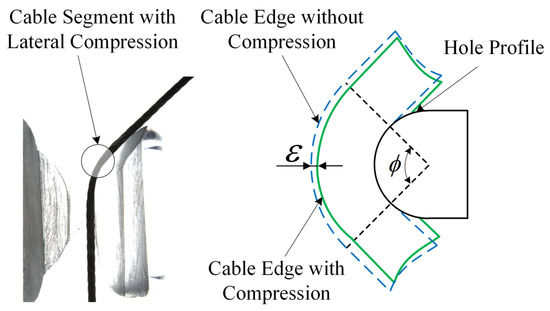
Figure 6.
Schematic of Cable Threading through the Hole with Lateral Extrusion.
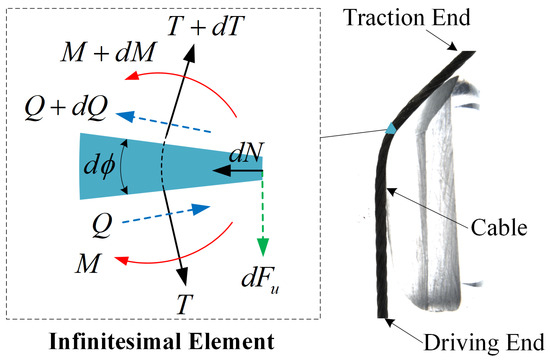
Figure 7.
Schematic of Cable Micro-element Force.
When the lateral extrusion of the cable is not considered, the friction of the cable element is generally expressed as Coulomb friction by the friction coefficient and the pressure , that is . In this case, there is an analytical solution to Equation (8), and the tension ratio of cable threading through the hole is derived as Equations (A12)–(A19) in Appendix A.2 and obtained as follows:
When considering the lateral extrusion of the cable, the viscous friction related to the contact area of the cable hole can not be ignored due to the increase in the contact area. According to the theory of viscous friction, the viscous friction force is proportional to the contact area and is the power exponent of the velocity. Therefore, in reference to Equation (7), the viscous friction resistance of the cable element can be expressed as:
where represents the cable indentation resistance; k and is the resistance coefficients and represents the relative sliding speed between the cable and hole; represents the compression deformation of cable diameter and can be calculated as:
Substituting , , and into Equation (8) and eliminating , the differential equations representing the cable-hole tension distribution can be obtained as:
3. Tension Ratio Model of Cable-Hole Transmission Based on Perturbation Method
3.1. Perturbation Model
Equation (13) is an implicit nonlinear differential equation that lacks an analytical solution. Its numerical solution requires extensive computation and cannot effectively represent the relationships among various physical parameters. Thus, a perturbation method is employed to derive an approximate analytical solution for the tension distribution and ratio. According to the force balance Equation (8), it can be obtained that:
Due to the lateral extrusion force, the cable diameter changes in the hole, meaning that the in Equation (2) varies with the wrap angle . Hence, a dimensionless small parameter can be isolated from the diameter ratio :
where, is a constant, representing the diameter ratio without extrusion; represents the variation rate of the diameter ratio caused by extrusion.
3.2. Tension Ratio of Cable Threading through Holes
According to the perturbation solution method of differential equations, the solution of Equation (17) can be expressed as:
where, and are coefficients of ; represents the high-order small term about .
Substituting Equation (18) into Equation (17) and ignoring the high-order small term containing , and setting the coefficients of the small parameter tend to 0, the decoupled differential equations for and can be obtained:
Since C and can be considered independent of , Equations (19) and (20) can be treated as linear constant coefficient differential equations with analytical solutions. According to the solution method of canonical perturbation, , , and can be determined, and an approximate analytical solution for the cable tension can be obtained as follows:
where, A, B, , , , , are coefficients independent of .
According to Equation (21), the tension ratio of the cable threading through holes can be calculated as:
where, , ,
, ,
, ,
,
.
4. Tension Control of the Cable-Drive End
4.1. Control Frame for the Cable-Drive End Tension
Due to the tension attenuation with the cable threading through the hole, the driving force cannot be accurately transmitted to the load. To reduce the motion control error and compensate for the tension attenuation of the cable-drive mechanisms, the control law of the driving end tension can be designed based on the tension ratio model of cable-hole transmission. The control frame of the driving end tension designed in this paper mainly consists of two parts: the cable-hole parameters identification and the tension adaptive compensation, as shown in Figure 8. The cable-hole parameters identification is used to reduce the parameter uncertainty, utilizing the PSO algorithm to calculate unknown parameters of the tension ratio. The adaptive compensation of cable tension is applied to reduce the model uncertainty. Based on the model reference adaptive control method, a control law of the driving end tension is designed to ensure the position error of the towed end asymptotic stability.
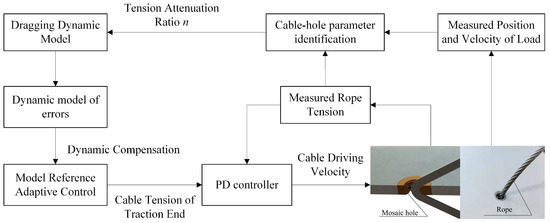
Figure 8.
Control Framework of the Cable-hole Transmission.
4.2. Cable-Hole Parameter Identification Based on the PSO Algorithm
Equation (22) contains four unknown parameters, namely , k, included in and . The Equation (22) is the nonlinear model with respect to the wrap angle and velocity v, so traditional methods, such as least squares and maximum likelihood estimation, are challenging for identifying the cable-hole parameters. This paper utilizes the particle swarm optimization algorithm to identify the cable-hole parameters in Equation (22). The optimization function for the PSO algorithm is designed as:
where, is the measured value of the transmission ratio; N represents the sample size, and represents the transmission ratio calculated according to Equation (22).
In the PSO algorithm, the position of the particle with the index i can be represented as:
where, , , and represent the values of the unknown parameters , , K and corresponding to the i-th particle, respectively.
When the initial position and initial velocity of the particle i are set, the iteration increment of is represented by :
where, w is the inertia weight factor; and represent positive learning factors; represents the optimal value of the i-th particle up to step , which is the value of guaranting g of Equation (23) minimization from to ; represents the optimal value among all particles up to step , which is the position of the particle guaranteeing g of Equation (23) minimization from step 0 to step k among all particles; are random parameters of PSO algorithm.
Using the iterative method shown in equation Equation (25), when the maximum number of iterations is reached or the global optimal position meets the error requirement, the iterative calculation stops. At this time, the obtained global optimal value of particle swarm is the parameter to be identified, and the specific calculation process is shown in Figure 9.
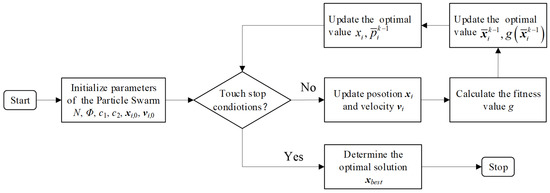
Figure 9.
Identification Process of the PSO Algorithm.
The particle motion difference equation model can be approximated by a random motion differential equation as follows:
where, , and are the continuous equivalent form of , and ; and are the position and velocity vectors of particle i; w is inertial factor; is cognitive leaning factor; is social learning factor.
Analyzing Equation (26) according to the linear system stability theory [36], the constraint conditions of PSO parameters for a mean square convergence of can be obtained as follows:
4.3. Adaptive Control Based on the Compensation of Cable-Drive Tension
The traction dynamic model of the cable threading through the hole can be represented as:
where, m is the equivalent towed mass; y represents the load position, and G represents the computable resistance including gravity; is the cable tension of the driving end.
Based on nonlinear compensation, the driving end tension is obtained as follows:
where, is the position error of the towed end; represents the proportional coefficient; represents the differential coefficient; represents the expected position acceleration of the towed end, and w represents the uncertainty term.
Due to the inevitable uncertainty of parameters in actual institutions, the coefficient matrix in Equation (30) is unknown. The actual dynamic model can be represented as:
where, is the uncertain state matrix, and b represents the uncertain input gain.
Due to the uncertainty of the actual system shown in Equation (31), it is difficult to ensure system stability by designing feedback parameters and . Based on the adaptive control strategy, the reference model can be designed as follows:
where, is the state matrix of the reference model; represents the input gain of the reference model; represents the reference position error; r represents reference input.
By adjusting and , the transient and steady-state properties of the towed end can be designed. Due to the expected position error of the towed end being 0, there is .
The uncertain compensation can be designed as:
where, is the error gain matrix, and represents the feedforward gain.
To ensure that the actual response in Equation (31) is consistent with the reference model in Equation (32), and can be designed based on the model reference adaptive control method:
where, and are the initial values of and , respectively; represents a symmetric positive definite matrix; is positive; represent the second column submatrices of matrix ; is the solution of the Lyapunov equation , where is a symmetric positive definite matrix.
Based on the measured cable tension at the driving end, the stable driving tension of the cable-drive mechanism can be realized by adjusting the cable driving speed rapidly:
where, is tracking value of the cable tension at the driving end, calculated by Equation (29); represents the measured cable tension at the driving end; and are the scaling coefficient and damping coefficient, respectively.
The adaptive control law designed based on the cable-hole compensation can ensure the motion error of the towed object to be gradually stable, and achieve accurate position control for the cable-driven mechanism with cable-hole uncertainties.
5. Experiment
5.1. Experimental Prototype
To validate the cable tension ratio model and the cable tension adaptive compensation method, a cable-hole validation prototype was designed and manufactured, as shown in Figure 10. The prototype mainly consists of a cable pulling mechanism, a special fabricated hole, a vision camera and a tension sensor. The cable pulling mechanism is a ball–screw pair driven by a high-precision stepper motor (AZM46AC, Oriental Motor, Tokyo, Japan) which can ensure accurate tracking for revolution velocity and position, and the accuracy can reach 0.01°. The special fabricated hole is made of transparent organic glass, which is convenient for light transmission and visual measurement. A 40-megapixel color industrial camera (MV-CS050-10GC, Hikrobot, Hangzhou, China) is used for visual measurement, which can ensure the cable deformation measurement accuracy of 0.01 mm. The measurement range of the tension sensor is 0 N-10 0N (LCM100-FSH03827, Futek, Irvine, CA, USA), and the measurement accuracy of the tension can reach 0.1 N. The tension at the driving end of the cable is measured by the tension sensor, and the tension ratio of the cable-hole transmission can be calculated in conjunction with the towed weight:
where Kg is the mass of the towed weight; g represents the gravity acceleration; T is the tension of the cable measured by the tension sensor.
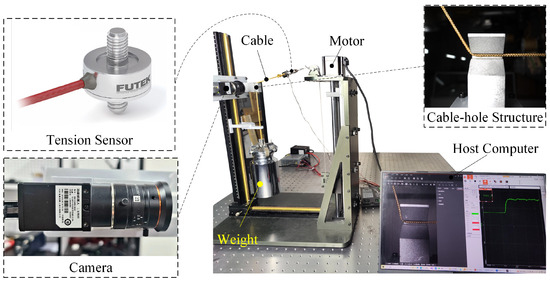
Figure 10.
Experimental Prototype of Cable-hole Transmission.
In order to verify the effect of lateral extrusion of cable-hole transmission, the braided fiber rope, multi-strand cable and uniform rubber cable were experimented, the diameters of which are 1 mm, 2 mm and 3 mm. The 30°, 60° and 90° wrap angles were experimented corresponding to each cable, and the specific test data and pictures are shown in Appendix A.3.
5.2. Identification of Cable-Hole Parameters
The cable in the hole is extruded by the cable-hole contact force, as shown in Figure 11. It can be seen that the lateral extrusion of the cable increases with the increase in the cable-hole wrap angle, thereby validating the cable extrusion effect illustrated. The cable in the hole is compressed by the cable-hole contact force, as shown in Figure 10. It is observed that the lateral compression of the cable increases with the cable-hole wrap angle, thereby validating the cable compression effect illustrated in Figure 6.

Figure 11.
Cable Extrusion Measurement.
Equation (22) indicates that the tension attenuation ratio of the cable is determined by structural parameters (, , K, ) and motion parameters (, v). For most cable-driven mechanisms, the motion parameters can be obtained through direct measurements or indirect calculations, while the structural parameters cannot be obtained. In this paper, the wrap angle of the cable segment is measured by a visual camera, and the cable traction speed is calculated by the encoder of the driving motor.
The motor drives the towed weight to move at a constant speed during the parameter identification process, and the precision of the constant speed motion control of the cable-driven mechanism is high enough, which can ensure the position of the towed weight tracking the desired trajectory stably based on the error compensation strategy. Utilizing the cable-hole transmission prototype, the tension ratio of the cable threading through the hole under 75 groups of the kinematic parameters (, v) were tested and calculated, respectively, based on Equation (36) and the calculation results are shown in Figure 12.
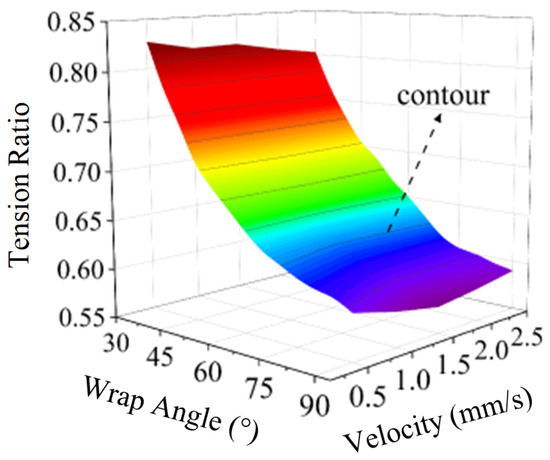
Figure 12.
Tension Ratio of Cable-hole Transmission.
It can be seen from Figure 12 that when the wrap angle is small (30–60°), the cable tension transmission ratio is not significantly affected by the speed, which is reflected in the tension transmission ratio contour being basically a straight line. When the wrap angle is larger (60–90°), the cable tension transmission ratio contour increases and then decreases with speed.
Using the visual camera in Figure 10, the cable extrusion deformation can be measured, as shown in Figure 13. In the figure, the cable diameter extrusion increases with the increasing of wrap angle within the range of 30–60°. When the wrap angle is within 60–90°, the cable diameter extrusion fluctuates significantly with the variation in speed. The initial diameter of the cable is 1.5 mm, the diameter extrusion is within 0.125 mm, and the cable extrusion ratio ranges from 0 to 0.083.
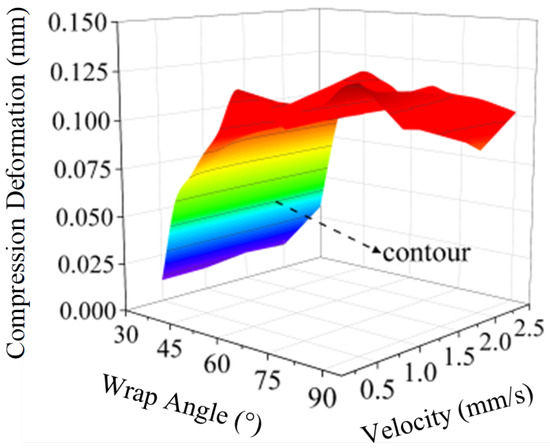
Figure 13.
Extruded Deformation of Cable Diameter.
Based on the experimental results shown in Figure 12 and the optimization algorithm shown in Equation (25), the structural parameters (, , K, ) are identified. The parameter settings of the PSO algorithm are shown in Table 1. After 550 iterations, the structural parameters calculated by the PSO algorithm stabilize to nearly constant values, and the final identification results are shown in Table 2 and Figure 14. The extrusion ratio obtained from the parameter identification is 0.061, within the range of 0–0.083 calculated from the visual measurement data. In Figure 15, Figure 16 and Figure 17, the optimization target which is the identification error of structural parameters as given by the tension ratio error (Equation (23)), tends to stabilize with the increase in iterations and remains sufficiently small enough, which is within .

Table 1.
Parameters of the PSO Algorithm (Unit System: International Units).

Table 2.
Identified Results of the PSO Algorithm (Unit System: International Units).
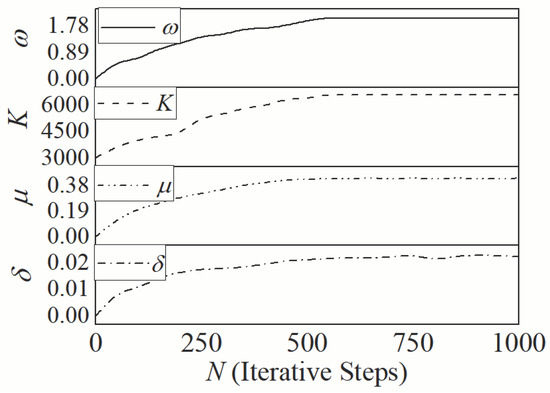
Figure 14.
Identified Parameters.
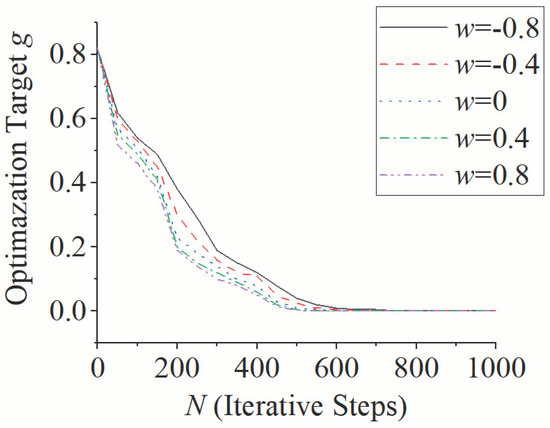
Figure 15.
Optimazation Target with Different Inertial Factor.
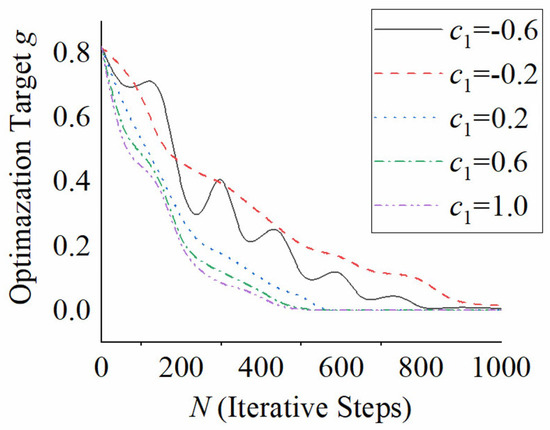
Figure 16.
Optimazation Target with Different Cognitive Leaning Factor.
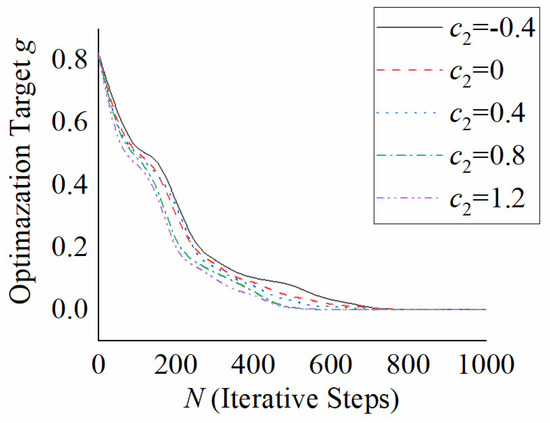
Figure 17.
Optimazation Target with Different Social Learning Factor.
Based on the stability condition of the PSO algorithm limited by Equation (27), the particle swarm parameters selected are shown in Table 1. In order to verify the stability and convergence of the PSO algorithm, we select five groups of data from the value interval of inertia factor, cognitive learning factor and social learning factor under the condition that other parameters remain unchanged; the optimization target is calculated, as shown in Figure 15, Figure 16 and Figure 17. As can be seen from Figure 15, with the increase in inertia, the variation trend of the optimization target value is basically unchanged, and the numerical difference is not large. The number of iteration steps required for the optimization goal to converge to 0 is about 600, so the cable-hole parameters are not sensitive to the inertia factor of the PSO algorithm. As can be seen from Figure 16, with the increase in the cognitive learning factor, there is a large difference in the data of the optimization target value, with the maximum difference exceeding 50%. Meanwhile, the variation trend of the optimization target value changes from vibration convergence to progressive convergence. The number of iteration steps required to converge to 0 varies widely. For example, about 500 steps are required when , and 1000 steps are required when . Therefore, the cable-hole parameters are highly sensitive to the cognitive learning factors of the PSO algorithm. It can be seen from Figure 17 that the convergence of the optimization target value with the social learning factor parameters is similar to that of Figure 15, so the cable-hole parameters are not highly sensitive to the particle swarm optimization algorithm. From the above analysis, it can be seen that when the PSO algorithm is used to identify the cable-hole parameters, the cognitive learning factors need to be highly subdivided to prevent the optimization target from falling into the local optima.
5.3. Cable Traction Control
Based on the experimental equipment shown in Figure 10, the cable tension control method is verified with a wrap angle of 60°. The control method based on the traditional position error compensation enables the towed weight position to track the desired signal accurately during the uniform motion, because the resistance at the cable-hole contact area remains basically constant. However, when the desired signal varies with time, tracking the trajectory becomes challenging due to changes in resistance at the cable-hole contact area, resulting from variations in cable tension and inertia forces.
The tracking ability of the adaptive control method, considering cable-hole resistance, is validated in this study using two typical signals: the step signal shown and the sinusoidal signal, as shown in Figure 18 and Figure 19, respectively. Based on the control laws presented in Equations (29) and (33)–(35), the control parameters are set as shown in Table 3. The cable-hole tension ratio models described in Equation (22) and Equation (9) are utilized to compensate for the attenuation tension of the cable-hole transmission with and without considering the cable lateral extrusion, respectively.
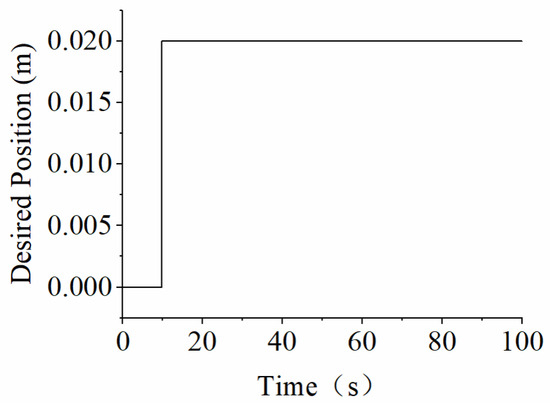
Figure 18.
Desired Step Signal.
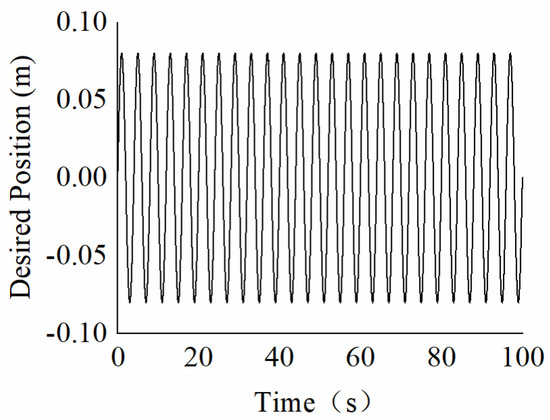
Figure 19.
Desired Sin Position.

Table 3.
Control parameters (unit system: International System of Units.)
When the towed weight tracks a step signal, the cable-hole transmission error considering the lateral extrusion is reduced by an order of magnitude compared to the case without considering the lateral extrusion shown in Figure 20. At t = 10 s, a sudden step occurs in the desired position, as shown in Figure 18. The control law designed based on the tension transmission ratio model considering the lateral extrusion (Equation (22)) shows an asymptotic stabilization trend and the final steady state error tends to 0. When the tension transmission ratio model excludes the cable lateral extrusion (Equation (9)), the adaptive control law cannot effectively compensate for the model nonlinearity and uncertainty, resulting in a steady-state error, as shown in Figure 20. The cable tension obtained based on the designed control law is shown in Figure 21. In the figure, when the control law excludes the cable lateral extrusion, it cannot effectively eliminate the steady-state error, and the friction discontinuity exists when the speed is 0. Therefore, the cable tension derived from the control law based on the tension transmission ratio model Equation (9) exhibits significant chatting.
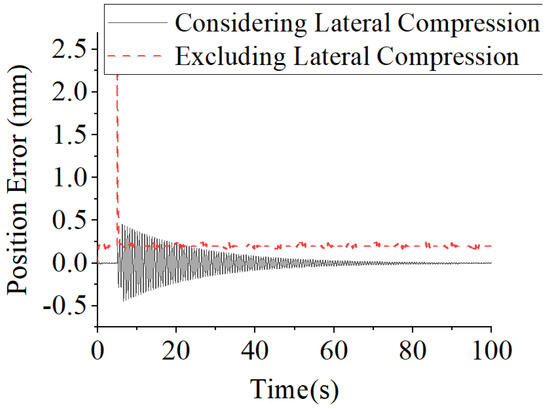
Figure 20.
Position Error of Step Signal.
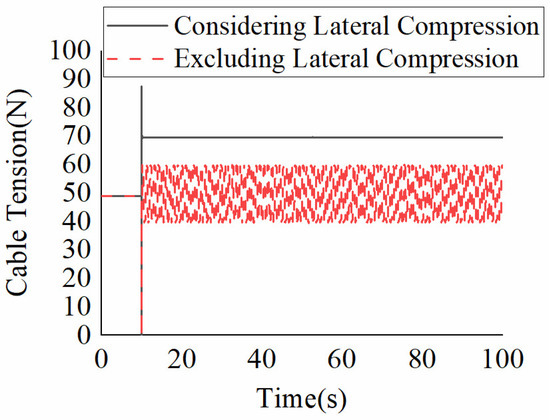
Figure 21.
Cable Tension with Step Signal.
When the towed weight tracks a sinusoidal signal, the adaptive control laws with and without considering the lateral extrusion are shown in Figure 22. In the figure, the control law designed based on the tension transmission ratio model (Equation (22)) ensures the position tracking error is asymptotically stable, while the control law designed based on the tension transmission ratio model (Equation (9)) exhibits a larger steady-state error and periodic oscillations. This indicates that the dynamic model of cable-driven mechanisms, when not considering lateral extrusion, is less effective in compensating the motion control nonlinearity and uncertainty. The cable tension based on the adaptive control is shown in Figure 23. In the figure, the control laws designed based on the tension transmission ratio models described in Equations (9) and (22) maintain the same trend for the cable tension. However, the tension variation considering the cable lateral extrusion is approximately twice that of the case without considering the lateral extrusion, as shown by the tension range of 33–73 N for the tension ratio model described in Equation (22) compared to 40–62 N for the tension ratio model described in Equation (9). The primary reason is that the improved accuracy of cable-hole compensation increases cable tension variation. When the cable lateral extrusion is considered, the calculated resistance increases in the hole. Consequently, when the acceleration of the towed weight is in the same direction as gravity, the traction force increases; conversely, when the directions are opposite, the traction force decreases.
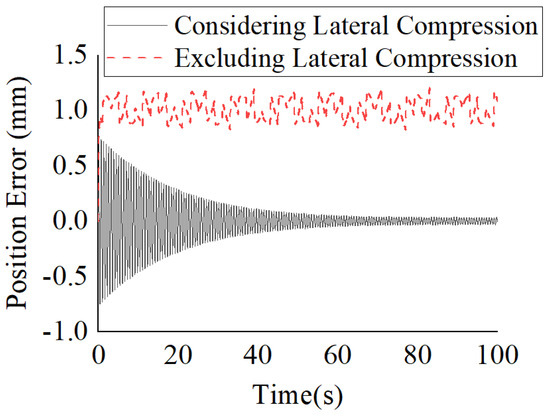
Figure 22.
Position Error of Sin Signal.
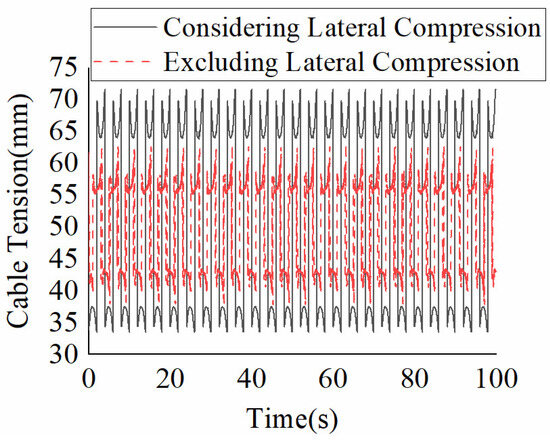
Figure 23.
Cable Tension with Sin Signal.
The cable tension for the two control methods during half a motion period is shown in Figure 24 and Figure 25. The cable tension based on the tension ratio model described in Equation (22) varies smoothly, while the tension based on the transmission ratio model described in Equation (9) exhibits high-frequency chatting. The primary reason is that during sinusoidal motion, the speed crosses 0 multiple times, and the friction force is discontinuous when the speed is zero, causing disturbances in the motion control of the cable-driven mechanism. The motion control method that accounts for cable extrusion resistance effectively reduces disturbances caused by model uncertainty and discontinuity.
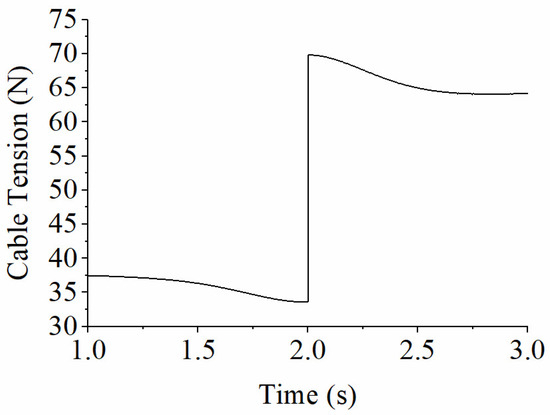
Figure 24.
Cable Tension with the Tension Ratio Model (22).
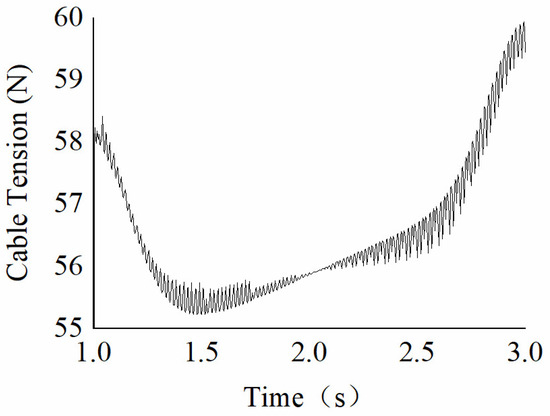
Figure 25.
Cable Tension with the Tension Ratio Model (9).
6. Conclusions
This paper proposed a tension ratio model and motion control method for cable-hole transmission based on the cable lateral extrusion resistance. An extrusion resistance model for the cable threading through the hole is established based on the phenomenon of lateral cable extrusion. A differential equation for the tension distribution within the hole is utilized to derive the tension transmission ratio for cable-hole transmission. The particle swarm optimization algorithm is employed to identify the cable-hole transmission parameters, and an adaptive control method for the cable-hole transmission mechanism is designed. Experimental results demonstrate that the tension ratio model considering the cable lateral extrusion can accurately compensate for the driving force at the driving end and increase the motion control error by more than an order of magnitude. The main reason is that the cable-hole transmission uncertainty of the cable-driven mechanism is reduced by introducing the lateral extrusion to the tension ratio model. Therefore, the adaptive control method designed based on the modified tension ratio significantly improves both the steady-state and transient response characteristics of the mechanism. The designed motion control method ensures asymptotic stability for the motion control error and reduces control force chatting effectively for cable-driven mechanisms.
The cable-hole transmission theory involved in this paper was based on steady-state conditions. Future research can focus on the transient properties of cable-hole transmission, such as creep, lubrication, tension fluctuations, etc., and conduct in-depth research on the effect of force/position control properties of cable transmission mechanisms. Although the research in this paper is executed based on single cable-hole transmission, the tension ratio model and control method can be extended to mechanisms containing multiple holes, which will be conducive to enhancing the control performance of cable-drive mechanisms.
Author Contributions
Conceptualization, H.G. and Y.Y.; methodology, H.G., Z.D. and B.A.; software, H.G.; validation, H.G., Y.Y., Z.D. and X.L.; formal analysis, H.G. and Y.Y.; investigation, H.G.; resources, H.G.; data curation, H.G. and Z.D.; writing—original draft preparation, H.G.; writing—review and editing, Z.D. and X.L.; visualization, H.G.; supervision, H.G. and Y.Y.; project administration, H.G. and Y.Y.; funding acquisition, H.G. and Y.Y. All authors have read and agreed to the published version of the manuscript.
Funding
This research was funded by National Natural Science Foundation of China grant number 5217508 and U23B20105, the Natural Science Foundation of Shandong Province grant number ZR2021ME025.
Institutional Review Board Statement
Not applicable.
Informed Consent Statement
Not applicable.
Data Availability Statement
Data supporting reported results can be found in Section 5.
Conflicts of Interest
The funders had no role in the design of the study; in the collection, analyses, or interpretation of data; in the writing of the manuscript; or in the decision to publish the results.
Abbreviations
The following abbreviations are used in this manuscript:
| DEM | Differential Equation Model |
| CTSB | Curve-to-Solid Beam |
| FEM | finite element model |
| PSO | Particle Swarm Optimization |
Appendix A
Appendix A.1. The Derivation Process of the Cable-Hole Wrap Angle
Suppose a cable bends according to the linear law:
where B is the flexural rigidity of the cable, R is the radius of curvature of the bent cable, and M is the applied couple. The segment can be seen as a cantilever beam fixed at the point , with a force acting on the free end , as shown in Figure A1.
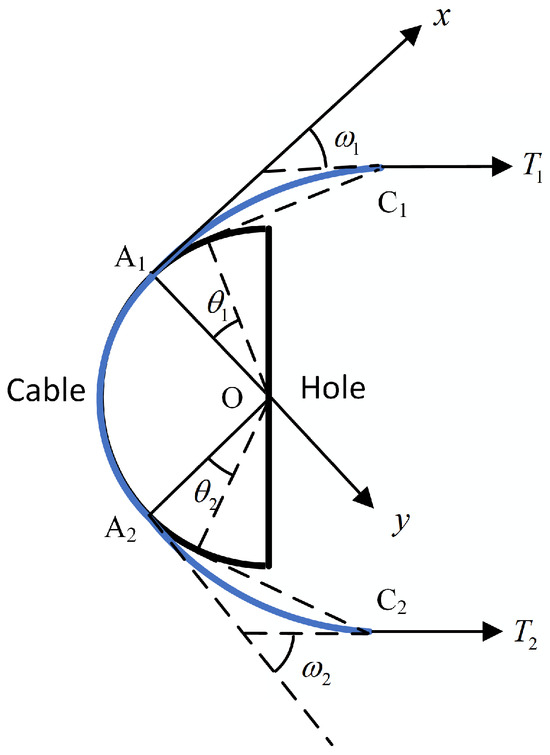
Figure A1.
Forces of deformation out of the contact region.
Assume that the bending deflections of the beam are small. Thus, is small. On making this assumption, the differential equation for the deflection curve of is
where
The boundary conditions at the fixed point and at the free end are
where is the length of the segment , and is the deflection of the free end .
The radius of the cable curvature at the point is equal to , so . In addition, the equilibrium condition of the segment gives
Then, we obtain
Solving these equations yields
When , . Thus,
Due to , the tension and shear forces on the wire cable at the fixed end are obtained
where and , respectively, represent the shear force and tension at the fixed end of the wire cable in the free section, which are also the boundary conditions for the stress of the wire cable in the contact section.
The reduction in the envelope angle due to the presence of bending stiffness can be expressed as
Appendix A.2. The Derivation Process of the Cable Through-Hole Tension Ratio
The differential equation of the tension distribution of the wire cable in the contact section considering the influence of bending stiffness can be expressed as:
The tension differential equation expressed is a two-order linear time-invariant differential equation, and its general solution is expressed as follows:
where
The boundary conditions of the differential equation can be calculated according to the force analysis results on the non-contact free section wire cable
Besides we have
By substituting the general solution expression (A13) into the boundary conditions (A15) and (A16), the undetermined constants in the general solution can be solved as:
The tension at the inlet end can be expressed as:
The ratio between the tension of the incoming cable segment and the tension of the outgoing cable segment of the contact segment can be calculated as follows:
Appendix A.3. Detailed Experimental Data
In this study, braided fiber cables, steel wire cables, and homogeneous rubber cables were selected for testing. Using cable-hole parameter measurement equipment, the radial compression of each type of cable was calculated, as shown in Figure A2. The cable-hole parameters for each cable were determined using the Particle Swarm Optimization (PSO) algorithm, and their traction performance was validated based on Model Reference Adaptive Control. The specific parameters are shown in the Table A1.
It can be seen from the above experimental results that the compression of the cable increases with the increase in the angle between the rope segments of the two sides, which is caused by the pressure exerted by the rope on the hole increasing. As the diameter of the cable increases, the radial stiffness of the cable increases, so the change rate of the cable diameter decreases under pressure. The Coulomb friction coefficient is only related to the material of the cable, so of each material is basically unchanged. As the diameter of the cable increases, the cable-hole contact area increases significantly after compression, so the viscosity coefficient K increases obviously with the increase in the diameter. Under low speed conditions, the velocity index is not obvious, and the viscosity coefficient of each material is basically unchanged. Although the material properties and cable-hole contact parameters of the three kinds of cables are quite different, the control error can be kept in low level under the model reference adaptive control considering the lateral extrusion of cables, which proves the effectiveness of the cable-hole modeling and cable tension compensation method described in this paper.

Table A1.
Compression, Identified Cable-hole Parameters, and Steady-state Tracking Error for Different Cable Types and Diameters.
Table A1.
Compression, Identified Cable-hole Parameters, and Steady-state Tracking Error for Different Cable Types and Diameters.
| Cable Type | Diameter (mm) | Compression (mm) | Identified Cable-Hole Parameters (Unit System: International Units) | Steady-State Tracking Error (mm) | |||||
|---|---|---|---|---|---|---|---|---|---|
| 30° | 60° | 90° | K | ||||||
| Steel Wire Cable | 1 | 0.172 | 0.191 | 0.232 | 0.019 | 0.283 | 1192 | 3.53 | 0.00–0.06 |
| 2 | 0.364 | 0.396 | 0.416 | 0.015 | 0.274 | 2643 | 3.48 | 0.00–0.06 | |
| 3 | 0.371 | 0.402 | 0.433 | 0.009 | 0.297 | 3347 | 3.44 | 0.00–0.07 | |
| Braided Fiber Cable | 1 | 0.211 | 0.312 | 0.340 | 0.028 | 0.425 | 3027 | 2.02 | 0.00–0.10 |
| 2 | 0.365 | 0.485 | 0.561 | 0.020 | 0.430 | 6574 | 2.03 | 0.00–0.10 | |
| 3 | 0.397 | 0.66 | 0.967 | 0.015 | 0.427 | 9982 | 1.99 | 0.00–0.09 | |
| Homogeneous Rubber Cable | 1 | 0.307 | 0.391 | 0.488 | 0.042 | 0.328 | 1918 | 1.67 | 0.00–0.23 |
| 2 | 0.364 | 0.536 | 0.646 | 0.033 | 0.334 | 4622 | 1.66 | 0.00–0.22 | |
| 3 | 0.468 | 0.924 | 1.382 | 0.027 | 0.320 | 6913 | 1.71 | 0.00–0.22 | |
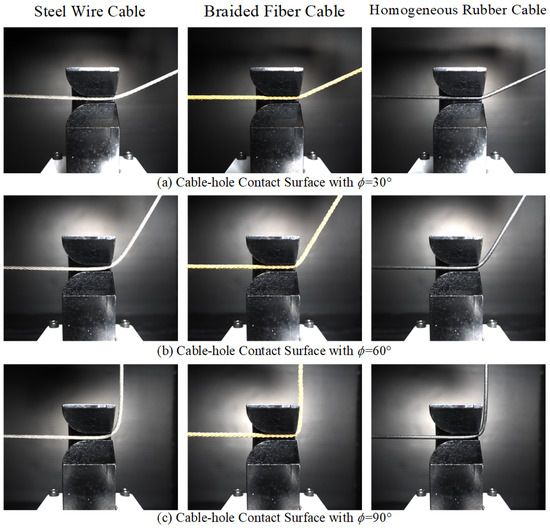
Figure A2.
Cable Extrusion Measurement (Cable-hole Contact Surface with ).
References
- Seo, M.; Yoo, S.; Choi, M.; Oh, J.; Kim, H.S.; Seo, T. Vibration Reduction of Flexible Rope-Driven Mobile Robot for Safe Facade Operation. IEEE-ASME Trans. Mechatron. 2021, 26, 1812–1819. [Google Scholar] [CrossRef]
- Sun, H.; Tang, X.; Cui, Z.; Hou, S. Dynamic Response of Spatial Flexible Structures Subjected to Controllable Force Based on Cable-Driven Parallel Robots. IEEE-ASME Trans. Mechatron. 2020, 25, 2801–2811. [Google Scholar] [CrossRef]
- Xing, K.; Wang, Y.; Chen, D.; Wang, M.; Lu, S. Flexible Ankle-Assisted Robot Technology Based on Rope Drive. In Proceedings of the 2020 IEEE International Conference on Real-Time Computing and Robotics (IEEE-RCAR 2020), Asahikawa, Japan, 28–29 September 2020; pp. 464–468. [Google Scholar] [CrossRef]
- Hua, C.; Tian, Y.; Dai, X.; Peng, G. Study on Terminal Flexibility Control Strategy for the Rope Driven Serpentine Robotic Arm. In Proceedings of the 2023 IEEE International Conference on Mechatronics and Automation (ICMA), Harbin, China, 6–9 August 2023; pp. 871–876. [Google Scholar] [CrossRef]
- Bruski, D. Determination of the Bending Properties of Wire Rope Used in Cable Barrier Systems. Materials 2020, 13, 3842. [Google Scholar] [CrossRef] [PubMed]
- Miyasaka, M.; Haghighipanah, M.; Li, Y.; Matheson, J.; Lewis, A.; Hannaford, B. Modeling cable-driven robot with hysteresis and cable-pulley network friction. IEEE-ASME Trans. Mechatron. 2020, 25, 1095–1104. [Google Scholar] [CrossRef]
- Zheng, X.; Yang, T.; Zhu, X.; Chen, Z.; Wang, X.; Liang, B. Dynamic modeling and experimental verification of a cable-driven continuum manipulator with cable-constrained synchronous rotating mechanisms. Nonlinear Dyn. 2022, 107, 153–172. [Google Scholar] [CrossRef]
- Li, Y.; Liu, Y.; Meng, D.; Wang, X.; Liang, B. Modeling and experimental verification of a cable-constrained synchronous rotating mechanism considering friction effect. Robot. Autom. Lett. 2020, 5, 5464–5471. [Google Scholar] [CrossRef]
- Zhou, Z.; Zheng, X.; Chen, Z.; Wang, X.; Liang, B.; Wang, Q. Dynamics modeling and analysis of cable-driven segmented manipulator considering friction effects. Mech. Mach. Theory 2022, 169, 104633. [Google Scholar] [CrossRef]
- Liang, Z.; Jiang, B.; Quan, P.; Lin, H.; Lou, Y.; Di, S. Force-closure analysis of multilink cable-driven redundant manipulators considering cable coupling and friction effects. IEEE-ASME Trans. Mechatron 2023, 1–12. [Google Scholar] [CrossRef]
- Dezman, M.; Asfour, T.; Ude, A.; Gams, A. Mechanical design and friction modelling of a cable-driven upper-limb exoskeleton. Mech. Mach. Theory 2022, 171, 104746. [Google Scholar] [CrossRef]
- Jung, J.H.; Pan, N.; Kang, T.J. Generalized capstan problem: Bending rigidity, nonlinear friction, and extensibility effect. Tribol. Int. 2008, 41, 524–534. [Google Scholar] [CrossRef]
- Lu, Y.-f.; Fan, D.-P.; Liu, H.; Hei, M. Transmission capability of precise cable drive including bending rigidity. Mech. Mach. Theory 2015, 94, 132–140. [Google Scholar] [CrossRef]
- Gao, X.; Wang, L.; Hao, X. An improved Capstan equation including power-law friction and bending rigidity for high performance yarn. Mech. Mach. Theory 2015, 90, 84–94. [Google Scholar] [CrossRef]
- Guo, S.; Wang, G.; Qi, Z.; Zhuo, Y.; Wu, Z. A quasi-static model for kinematic analysis of a feed driving mechanism. Mech. Mach. Theory 2020, 148, 103780. [Google Scholar] [CrossRef]
- Guo, Y.; Zhang, D.; Zhang, X.; Wang, D.; Wang, S. A New Transmission Theory of “Global Dynamic Wrap Angle” for Friction Hoist Combining Suspended and Wrapped Wire Rope. Appl. Sci. 2020, 10, 1305. [Google Scholar] [CrossRef]
- Peng, Y.; Wei, Y.; Zhou, M. Efficient modeling of cable-pulley system with friction based on arbitrary-Lagrangian-Eulerian approach. Appl. Math. Mech. 2017, 38, 1785–1802. [Google Scholar] [CrossRef]
- Greenway, M.E.; Grobler, S.R.; Bilessuris, S. Analysis of rope load sharing on multi-rope friction winders. J. South. Afr. Inst. Min. Metall. 2021, 121, 513–522. [Google Scholar] [CrossRef]
- Tang, S.; Huang, R.; Zhao, G. Mechanical characteristics and experimental research of a flexible rope-sheave hoisting mechanism. J. Mech. Sci. Technol. 2022, 36, 3329–3339. [Google Scholar] [CrossRef]
- Escalona, J.L. An analytical solution of the rope-sheave contact in static conditions based on a bristle model. Mech. Mach. Theory 2023, 185, 105334. [Google Scholar] [CrossRef]
- Konyukhov, A.; Shala, S. New benchmark problems for verification of the curve-to-surface contact algorithm based on the generalized Euler-Eytelwein problem. Int. J. Numer. Methods Eng. 2022, 123, 411–443. [Google Scholar] [CrossRef]
- Zheng, X.; Yang, T.; Chen, Z.; Wang, X.; Liang, B.; Liao, Q. ALE formulation for dynamic modeling and simulation of cable-driven mechanisms frictions. Mech. Syst. Signal Process. 2022, 168, 108633. [Google Scholar] [CrossRef]
- Chen, Y.; Hu, H.; Tan, H.; Xu, J.; He, Y.; Zhou, J. Effects of tribological and material properties of wire rope on the motion synchronization of a precision flexible transmission device. Structures 2024, 63, 106287. [Google Scholar] [CrossRef]
- Wang, J.; Qi, Z.; Wang, G. Hybrid modeling for dynamic analysis of cable-pulley systems with time-varying length cable and its application. J. Sound Vib. 2017, 406, 277–294. [Google Scholar] [CrossRef]
- Li, Z.; Zhao, Z.; Zhang, H.; Wang, Q. Variable boundary contact problem between pulley and flexible rope. Int. J. Non-Linear Mech. 2023, 152, 104399. [Google Scholar] [CrossRef]
- Westin, C.; Irani, R.A. Modeling dynamic cable-sheave contact and detachment during towing operations. Mar. Struct. 2021, 77, 102960. [Google Scholar] [CrossRef]
- Escalona, J.L. Rope-sheave contact transient analysis in hoisting operations with a bristle model and an arbitrary Lagrangian-Eulerian approach. Multibody Syst. Dyn. 2024. [Google Scholar] [CrossRef]
- Han, Y.; Ma, X.; Zhang, G.; Hu, S.; Shi, X. Numerical investigation of rope-core elasticity effects on rope-sheave traction. J. Braz. Soc. Mech. Sci. Eng. 2024, 46, 90. [Google Scholar] [CrossRef]
- Chen, C.; Guo, Y.; Ma, W. Fast Solution of Pressure and Stress of Dry Contact Using Multigrid Techniques. Processes 2022, 10, 1441. [Google Scholar] [CrossRef]
- Lee, H.-W.; Roh, M.-I.; Ham, S.-H. Block erection simulation considering frictional contact with wire ropes. Ocean. Eng. 2020, 217, 107904. [Google Scholar] [CrossRef]
- Mao, S.; Tao, J.; Xie, J.; Xu, S.; Chen, L.; Yu, H.; Liu, C. A data-driven approach for modifying the rope dynamics model of the flexible hoisting system. J. Low Freq. Noise Vib. Act. Control 2023, 42, 1055–1070. [Google Scholar] [CrossRef]
- Maleki, M.; Ahmadian, H.; Rajabi, M. A modified Bouc-Wen model to simulate asymmetric hysteresis loop and stochastic model updating in frictional contacts. Int. J. Solids Struct. 2023, 269, 112212. [Google Scholar] [CrossRef]
- Marques, F.G.; Garcia, C. Stribeck Parameters Estimation of a Diaphragm Valve Using Quasi Newton Method. IFAC PapersOnLine 2019, 52, 225–230. [Google Scholar] [CrossRef]
- Yan, Y.; Xu, J.; Wiercigroch, M. Modelling of regenerative and frictional cutting dynamics. International J. Mech. Sci. 2019, 156, 86–93. [Google Scholar] [CrossRef]
- Bazrafshan, M.; de Rooij, M.B.; Schipper, D.J. The effect of adhesion and roughness on friction hysteresis loops. Int. J. Mech. Sci. 2019, 155, 9–18. [Google Scholar] [CrossRef]
- Gopal, A.; Sultani, M.M.; Bansal, J.C. On stability analysis of particle swarm optimization algorithm. Arab. J. Sci. Eng. 2020, 45, 2385–2394. [Google Scholar] [CrossRef]
Disclaimer/Publisher’s Note: The statements, opinions and data contained in all publications are solely those of the individual author(s) and contributor(s) and not of MDPI and/or the editor(s). MDPI and/or the editor(s) disclaim responsibility for any injury to people or property resulting from any ideas, methods, instructions or products referred to in the content. |
© 2024 by the authors. Licensee MDPI, Basel, Switzerland. This article is an open access article distributed under the terms and conditions of the Creative Commons Attribution (CC BY) license (https://creativecommons.org/licenses/by/4.0/).