Article

Study on the Influence of Plugging Position and Fit on the Motion Stability of Precision Cross Roller Bearing

1
School of Mechatronics Engineering, Henan University of Science and Technology, Luoyang 471003, China
2
Luoyang Hongyuan Bearing Technology Co., Ltd., Luoyang 471132, China
*
Author to whom correspondence should be addressed.
Machines 2024, 12(10), 678; https://doi.org/10.3390/machines12100678
Submission received: 28 August 2024 / Revised: 23 September 2024 / Accepted: 25 September 2024 / Published: 27 September 2024
(This article belongs to the Section Machine Design and Theory)

Abstract

:
This study addresses the issue of unsatisfactory smoothness in the movement of integrated internal and external cross roller bearings post-assembly, which compromises the movement flexibility of the finished bearing and fails to meet index requirements. Focusing on a specific type of precision cross roller bearing, this paper establishes a finite element explicit dynamic simulation model that takes into account the plugging position and matching relationship. A transient dynamic simulation of the roller blockage process was conducted, yielding insights into the contact pressure and deformation experienced by the roller and plug during this blockage. The results indicate that when both the taper pin are positioned centrally, and the plug matching clearance, plug sag and protruding amount, and plug rotation offset degrees are all set to 0 μm, the contact pressure between the roller and raceway, as well as the roller deformation displacement, are minimized. The plugging position and fit were subsequently validated through testing, which also measured the impact of these parameters on the roundness of the raceway surface and the bearing’s friction torque. The test findings corroborate that when the taper and pin are centrally aligned, and the stopper clearance is 5 μm, with the plug sag, protrusion, and offset all at 0 μm, the roundness of the raceway surface and the bearing’s friction torque reach their lowest values, thereby optimizing the stability of bearing motion. By comparing the simulation and experimental results, it is concluded that during bearing assembly, it is crucial to maintain the taper pin in a central position, control the plug matching clearance to approximately 5 μm, and ensure the plug sag, protrusion, and rotation offset amount are both at 0 μm. This approach guarantees optimal contact conditions and motion stability during operation. The findings of this research offer valuable design guidance for the selection of appropriate plugging positions and fits in precision cross roller bearings.

1. Introduction

The cross roller bearing is a compact bearing featuring rollers that are alternately arranged at right angles between the inner and outer rings. This design enables it to withstand loads from multiple directions and offers characteristics such as high precision, high rigidity, and ease of installation. As a result, it is widely utilized in applications such as robot joints, rotating units, and machining center turntables, where a compact structure, high stiffness, and high rotational accuracy are essential [1]. Integrated cross roller bearings with inner and outer rings offer advantages over separate cross roller bearings, particularly in applications requiring higher rotational accuracy. However, the compact structure and high load capacity of internal and external integrated cross roller bearings necessitate the installation of as many rolling elements as possible by filling the holes, which are then sealed with plugs. The position of these plugs is critical to the overall structure of the bearing. Any significant deviation in the alignment of the plugging position during assembly can adversely affect the motion stability of the entire bearing. Consequently, post-assembly movement may be compromised, resulting in reduced flexibility and lower yield.
Currently, in the research on cross roller bearings, Seong-Ho Kang [2] employed a calculation method based on Hertz theory to conduct theoretical investigations into the bearing stiffness of cross roller and four-point bearings. This method was utilized to analyze the maximum deflection and contact stress of the actuator assembly, and loading conditions for cross roller and four-point bearings of equivalent sizes. Luca Quagliato et al. [3] applied Archard wear and Lemaitre damage models to simulate the wear phenomena associated with cross roller bearings. By utilizing wear and damage models, along with the results from accelerated life experiments, a reliable methodology can be established for predicting bearing life with minimal number of material property tests. Van-Canh Tong et al. [4] considered a quasi-static five-degree-of-freedom model of cross roller bearings, taking into account the roundness deformation of rollers. They derived the inertial load resulting from the effect of rotational speed by factoring in the centrifugal force and gyroscopic moment of the rollers and validated the model’s accuracy through experimental verification. Van-Canh Tong et al. [5] conducted an extensive simulation to investigate the stiffness characteristics of cross roller bearings under varying loads and boundary conditions, taking into account the effects of external load, axial preload, axial clearance, and angular misalignment. MV Prozhega et al. [6] examined the friction torque and friction coefficient of cross roller bearings under different temperatures, cavity pressures, loads, and lubricant dosages, assessing the impact of various factors on the friction torque. Biao Deng et al. [7] developed a partial finite element model of a turntable bearing in ABAQUS, analyzing the distribution characteristics of contact stress between the rolling elements and the raceway of the turntable bearing under axial and radial loads, and comparing the stress conditions of the raceway across different raceway structures. Li He et al. [8] performed an experimental study on the friction characteristics and operational smoothness of ultrasonic suspension bearings. Hwang, So et al. [9] employed two types of wear models, incorporating both linear and nonlinear mechanisms, to predict the wear of thrust bearings. Wu S et al. [10] investigated the influence of the angle of the turntable and bearing stiffness on the system dynamics. Ruben Lostado R et al. [11] proposed a method that integrates the finite element method with multi-response surface optimization to optimize the preload, radial load, and axial load of double-row tapered roller bearings. In the realm of finite element analysis, Yang, Y. et al. [12] established a dynamic model of the rotor-bearing-cartridge system of rolling body bearings. They obtained and analyzed vibration signals from the bearing seat and cartridge, comparing the results of the bearing seat with itself, alongside both simulation and experimental outcomes. Tyagi, S. et al. [13] established a finite element model for transient analysis of bearings, simulating and validating the vibration signals of ball bearings exhibiting faults. Taking into account the effects of centrifugal load and radial clearance, Tadina, M. et al. [14] developed a numerical model of the bearing, assuming that the inner ring possesses only two degrees of freedom while the outer ring is deformable in the radial direction, and conducted finite element modeling. Kuncoro D. et al. [15] employed the unlubricated Hertzian contact model to analyze the rotor, utilizing the finite element method as the foundation for a flexible rotor model to optimize the design of the auxiliary bearing in order to mitigate bearing instability. Shao, Y. et al. [16] employ the finite element analysis (FEA) method to conduct simulation research based on a typical bearing assembly, examining its vibration characteristics from the perspective of small impacts and establishing a vibration response model. Common faults, such as outer ring defects, inner ring defects, and rolling ball defects are simulated, allowing for a comparison of their vibration responses under various fault conditions and different positions of the bearing seat. Schmidt, A.A. et al. [17] utilize nonlinear, transient, three-dimensional finite element analysis (FEA) to simulate complex dynamic behavior in diverse contact situations, subsequently adjusting the mesh by implementing node displacement. This mesh refinement enhances the resolution of the results and facilitates convergence. Safian, A. et al. [18] presents findings from a combination of lumped parameter and finite element models to simulate the strain signals of cylindrical roller bearings under both normal and defective conditions. The contact pressure is derived from the lumped parameter model and applied to the finite element model for transient analysis. A static two-dimensional finite element contact model and theoretical formulas are employed to verify the accuracy of the stress distribution generated by the model. Zeng, S. [19] studied the transient response of active magnetic bearing rotor falling on spare bearing by numerical simulation and experiment, and compared the experimental results with the simulation results. Finally, the conclusion based on simulation and experiment is given.
Huang Jian et al. [20] established a static model of cross roller bearings that accounts for raceway roundness. They derived a fatigue life calculation formula for cross roller bearings affected by raceway roundness errors and analyzed the impact of these errors on rotation accuracy, load distribution, and fatigue life. Oswald F.B. et al. [21] proposed a method for enhancing roller shape, which subsequently improves bearing life and other properties. Deng B. et al. [22] introduced a method for calculating the internal load distribution and contact stress of thrust angular contact ball turntable bearings using the finite element method. Pan Xingyu et al. [23] developed a simulation model based on Romax to investigate how various working conditions affect the life of cross cylindrical roller bearings. He Dongkang et al. [24] proposed a fault diagnosis method for cross roller bearings in industrial robots, utilizing maximum resolution singular value decomposition (MRSVD), singular value decomposition (SVD), and variable prediction model pattern recognition (VPMCD) to identify fault types. Hu Jingyuan et al. [25] addressed the challenges of low assembly efficiency and accuracy in the production process of precision cross cylindrical roller bearings by enhancing bearing performance and production efficiency through stringent control of part accuracy, thereby ensuring the rotation accuracy of the finished bearings. Wang Kunping et al. [26] introduced three common types of cross-cylindrical roller bearing structures and identified factors affecting the repeated positioning accuracy of these bearings from the perspectives of bearing design, processing technology, installation, and maintenance. They proposed corresponding improvement measures. He Peiyu et al. [27] established a local finite element model to analyze the contact between rollers and raceways, investigating the damage conditions of cylindrical rollers in three-row roller type rotary table bearings under sliding, pure rolling, and sliding-rolling conditions. Their study also examined the effects of the friction coefficient, sliding displacement equivalent effect force, alternating stress, and contact stress. Building on the maximum load derived from finite element calculations, Huang Longyi et al. [28] conducted a contact analysis of rollers and raceways, exploring the stress distribution at the contact points under various gap conditions. Qiao Shuxiang et al. [29] addressed issues of abnormal bearing noise and excessive sound resulting from blockages in the angular contact ball turntable bearing’s position. They improved the design of the blocked position, ensuring coherence and consistency in the bearing raceway, which effectively enhanced the stability of the turntable bearing. Lastly, Zhijian Wang et al. [30] developed a quasi-static model that accounts for inner ring dislocation and combined load to enhance the reliability of double-row cylindrical roller bearings.
In summary, the life, load distribution, and fault identification of cross roller bearings have been comprehensively studied, with an analysis of the influence of various factors on bearing motion stability. However, the effects of the plugging position and fit on motion stability have not been addressed in the previous research. For internal and external integrated cross roller bearings, due to their compact structure and high load capacity requirements, it is essential to maximize the number of rolling elements by filling holes and ultimately sealing them with plugs. The plugging position of these bearings is a critical structural aspect. If there is a significant deviation in the plugging position or fit during assembly, it can greatly affect the motion stability of the entire bearing. Following assembly, the movement may often be unsmooth, leading to insufficient flexibility and reduced yield. To address the issue of poor movement in internal and external integrated cross roller bearings, this paper establishes a finite element explicit dynamic simulation model that incorporates the plugging position and fitting relationship. Through simulation, we obtain data on the contact pressure and deformation between the roller and the plug during the plugging process, and analyze how the plugging position and fitting relationship impact bearing motion stability. The findings of this research can provide valuable insights for selecting the optimal location and matching relationship of the plug-in cross roller bearings.

2. Establishment of Cross Roller Bearing Motion Simulation Model

2.1. Roller and Plug Position Motion Process Model

Figure 1a illustrates the geometric structure model of the internal and external separate cross roller bearing, while Figure 1b presents the geometric structure model of the internal and external integrated cross roller bearing. As observed in Figure 1b, the unique design of the roller assembly in the precision cross roller bearing with internal and external integration necessitates the incorporation of corresponding plug holes on the outer ring to facilitate the roller assembly process. The location of these plug holes must be covered with a plug, which is positioned and secured using a taper pin. During the rolling process involving the roller and plug, several factors—including the position of the taper pin, the matching gap between the plug and the plug hole, as well as the sag and protrusion of the plug and its rotation offset—can significantly influence motion stability. To specifically analyze the effects of the plugging position and fit on the outer ring regarding bearing motion stability, the plug’s plugging section of the motion model was locally segmented and refined, resulting in the local roller and plugging motion model depicted in Figure 1c.
The motion model of the precision cross roller bearing was established using the bearing parameter values listed in Table 1, as illustrated in Figure 2. Figure 2a depicts the defect-free model of the cross roller bearing, while Figure 2b presents the sag model of the cross roller bearing plug. Figure 2c illustrates the protrusion model of the cross roller bearing, and Figure 2d shows the rotation offset model of the cross roller bearing.
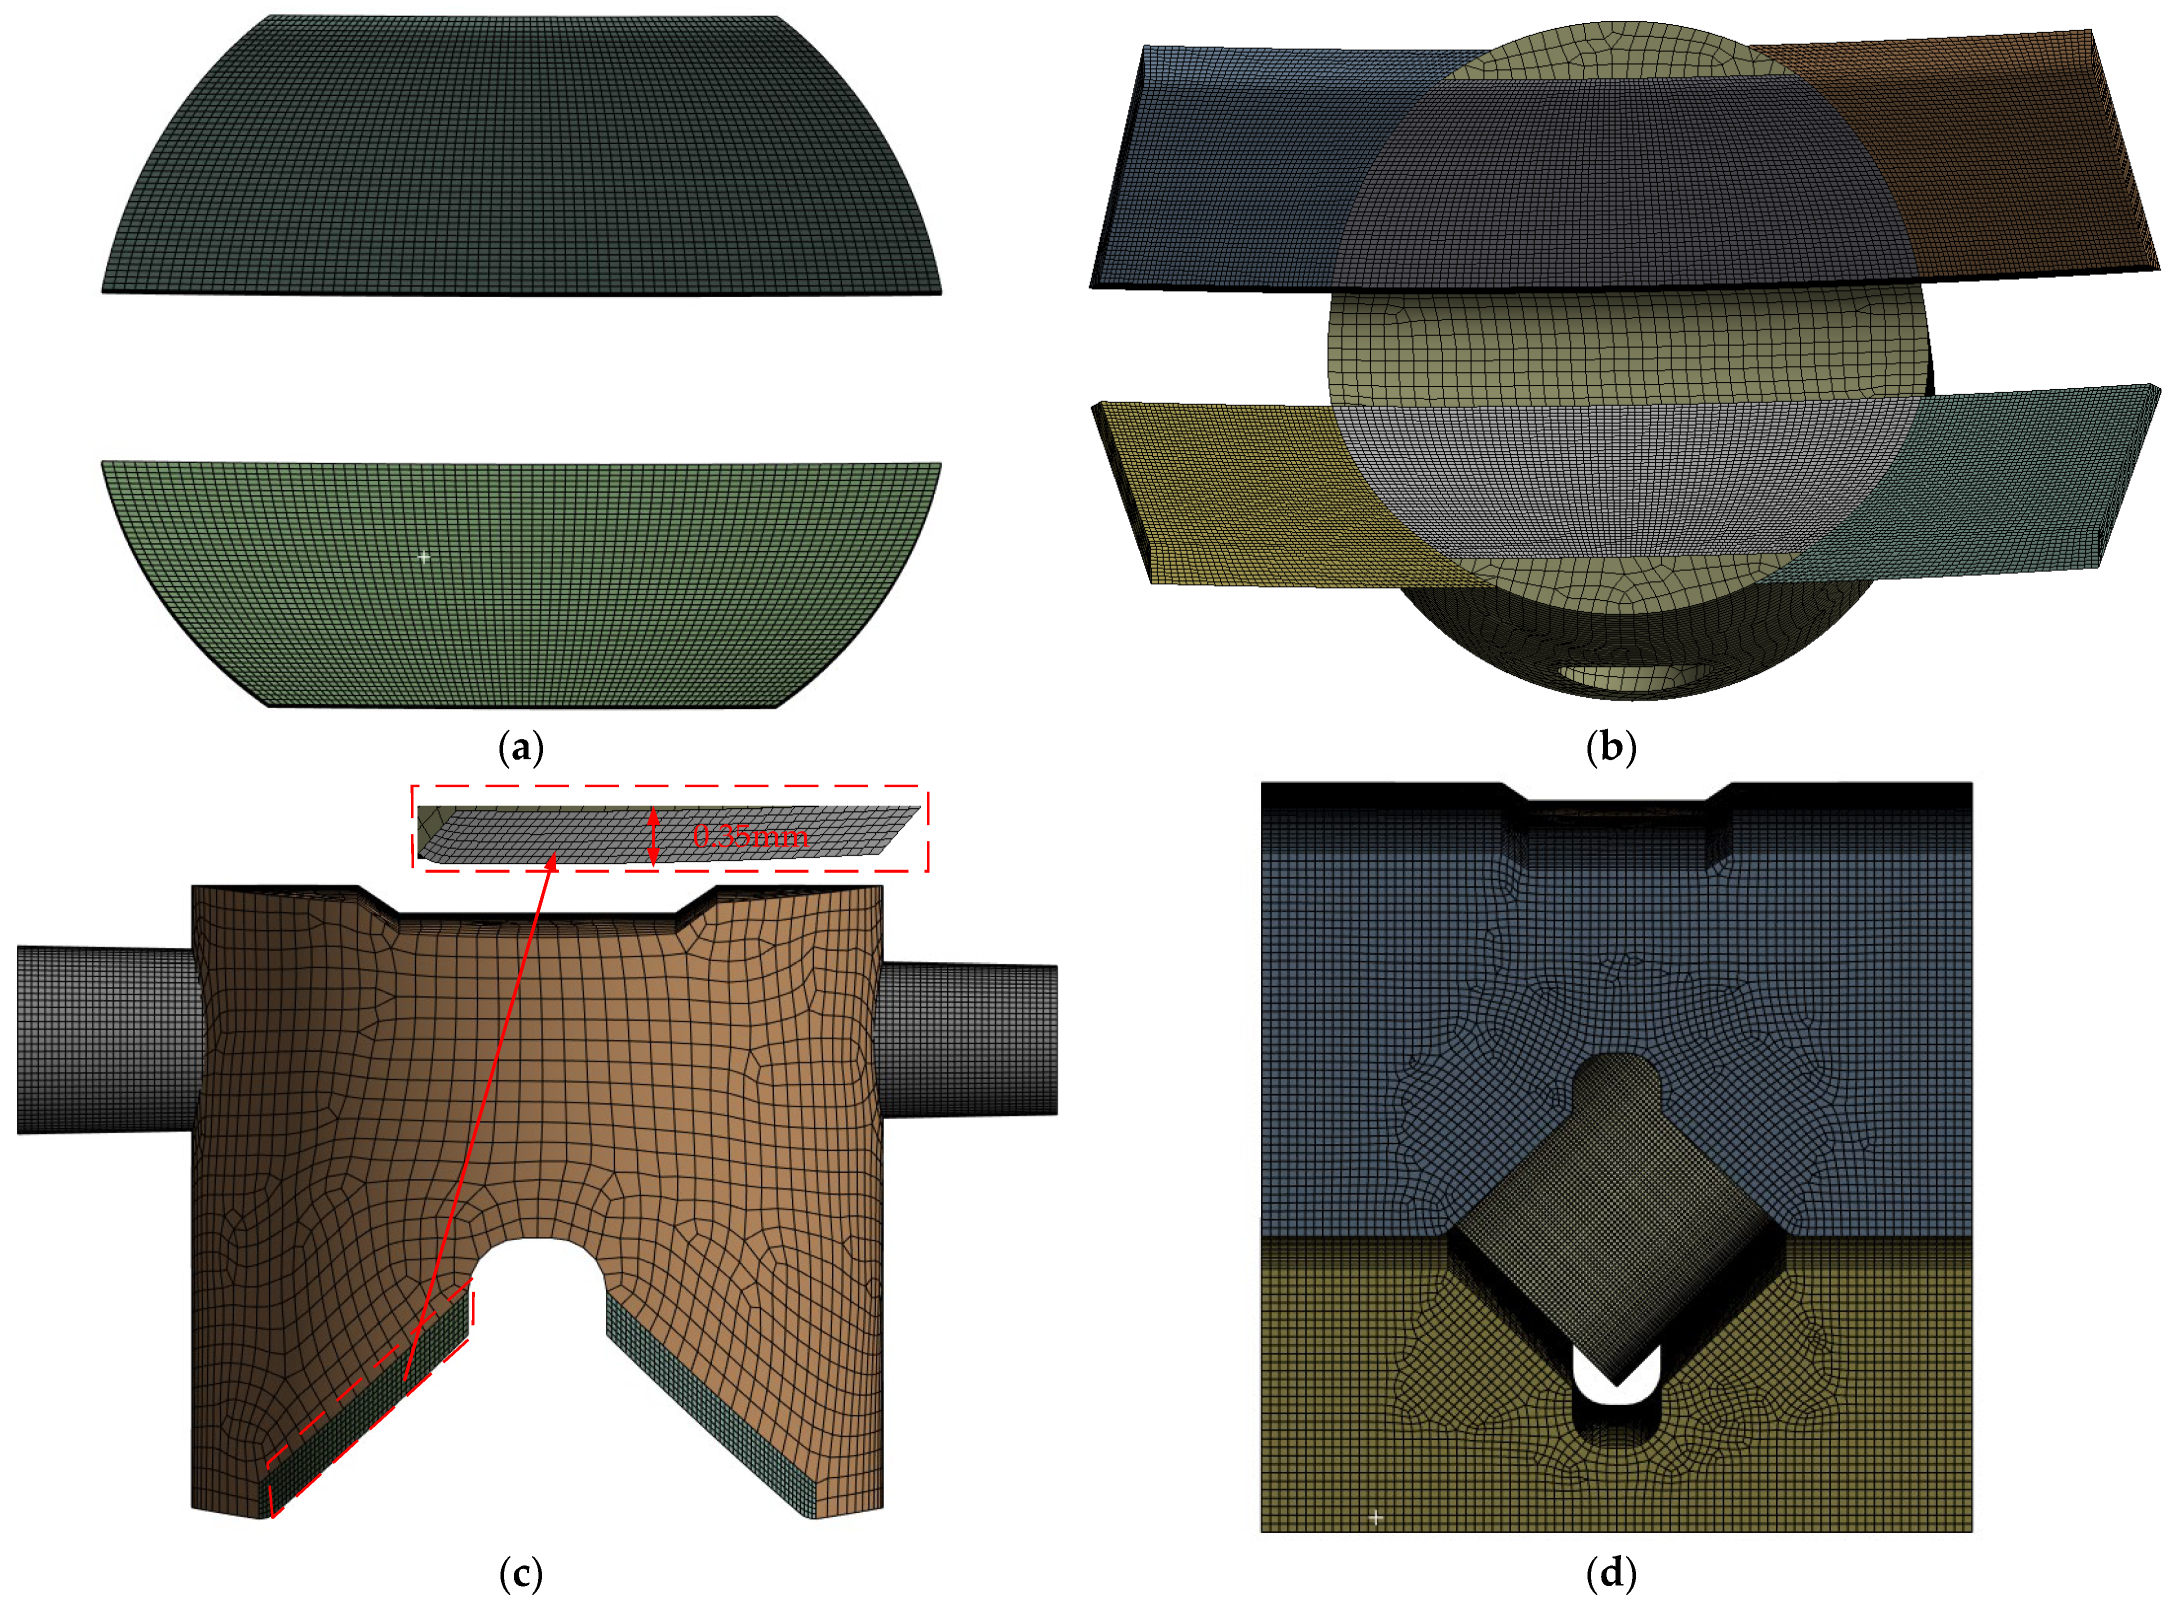
To accurately simulate and solve the bearing motion process model, as well as to obtain the performance parameters of bearing motion, it is essential to refine the mesh of the contact surfaces between the bearing plug and the roller. This refinement enhances the accuracy of the results regarding contact stress and deformation. Consequently, mesh refinement is performed on the local models of both the roller and the blockage, resulting in the mesh division model of the cross roller bearing, as illustrated in Figure 3.
In Figure 3, the structural mesh optimization of the bearing’s outer and inner rings is performed to achieve a finer mesh division for both components. Additionally, the mesh is refined at the contact interface between the plug and the roller. The dimensions of this interface and the roller are maintained at 0.05 mm, while the remaining areas are set to 0.1 mm. The mesh types for the roller and the contact areas of the inner and outer rings are specified as hexahedral mesh, which enhances the accuracy of the simulation results. Finally, the grid properties of the cross roller bearings are presented in Table 2.

2.2. Parameter Setting of Roller and Plug Motion Process

The material utilized in the simulation model calculations is GCr15. The material parameters and boundary conditions are presented in Table 3. This model includes four pairs of friction contact pairs: the roller outer ring and plug, the roller inner ring, the stop-to-plug hole, and the cone-to-cone pin hole. The friction coefficient for these contact pairs is established at 0.05, based on the test results of the friction torque.
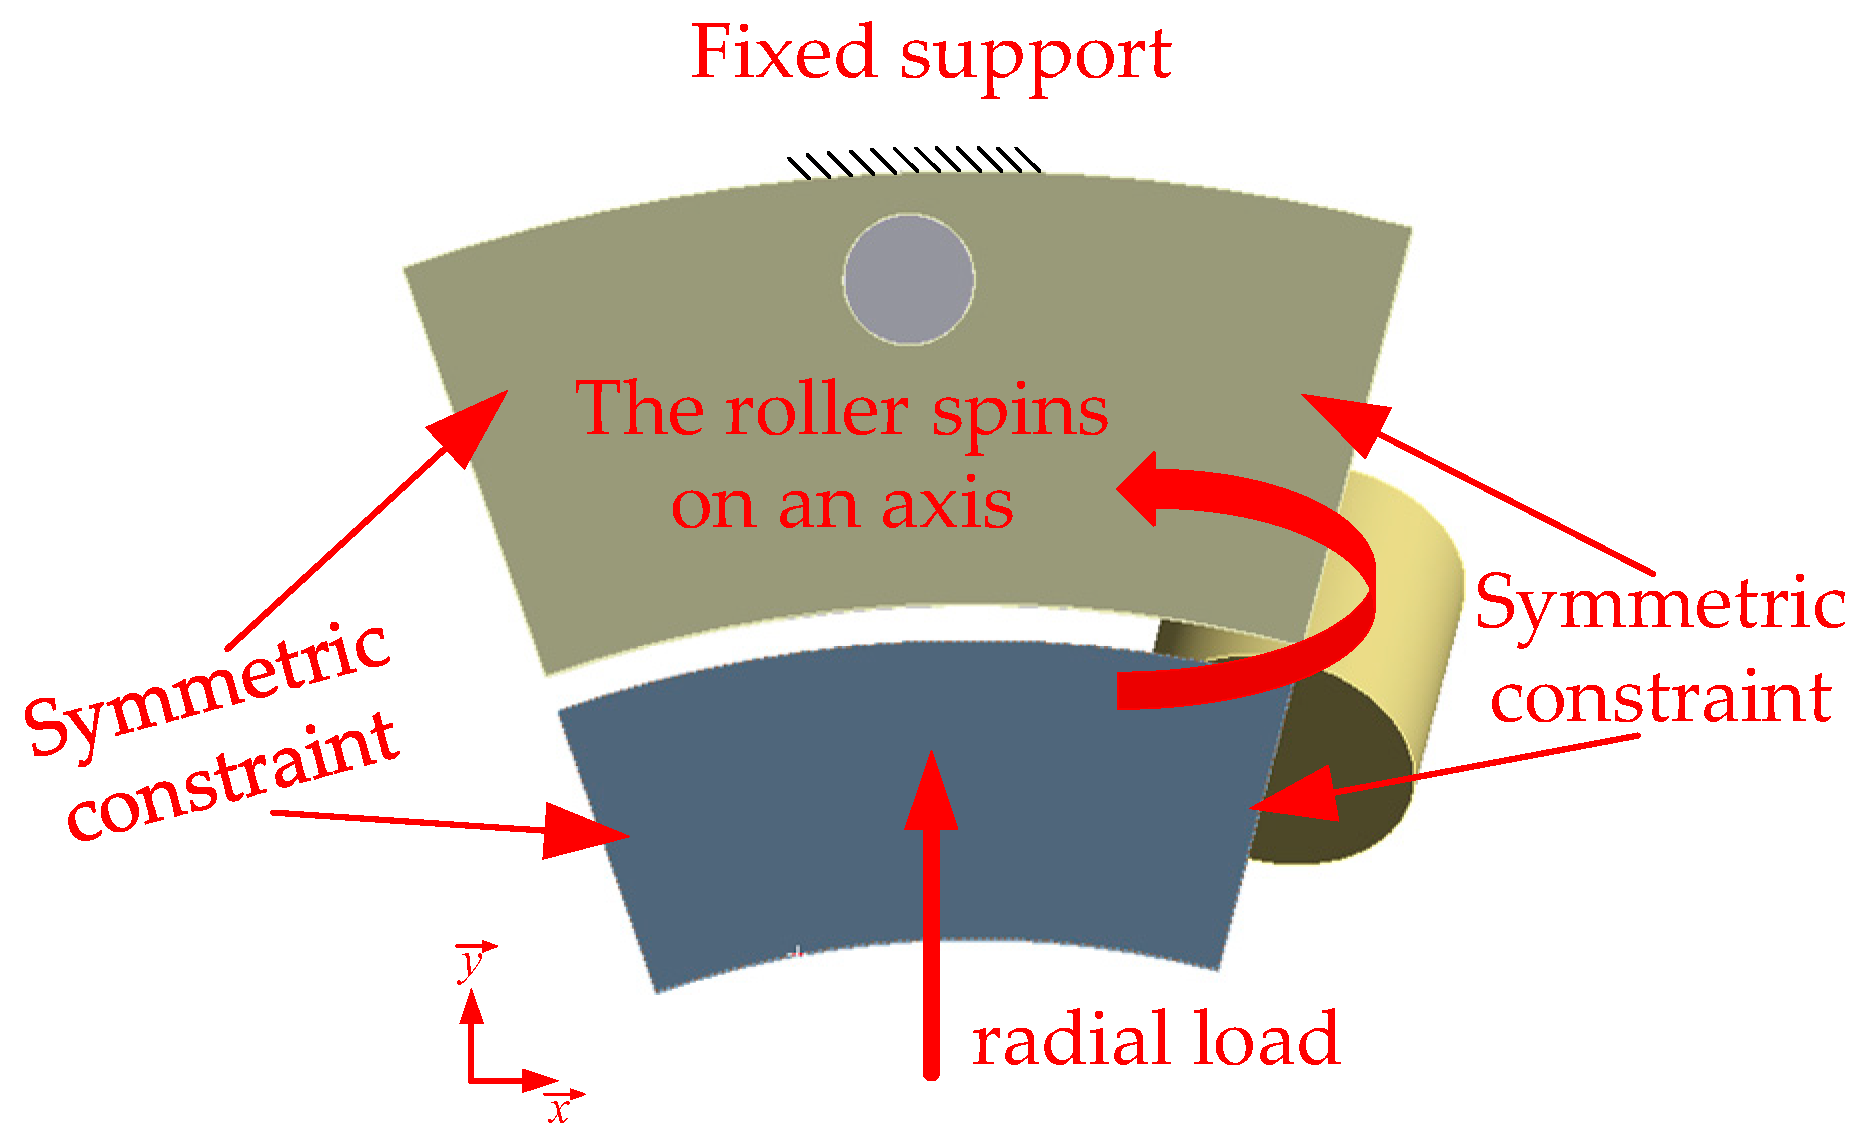
A transient dynamics simulation was conducted on the cross roller bearing, with the boundary conditions illustrated in Figure 4. The outer ring is fixed to constrain all degrees of freedom. Due to the symmetrical nature of the model, both the inner and outer sides of the ring are constrained symmetrically. A vertical upward radial load of 150 N is applied to the inner ring, while a rotational speed of 30 r/min is imposed on the surface of the roller about the Z-axis.
Figure 5 illustrates the interface for dynamic contact settings in the finite element software ANSYS 2024. In this context, the inner roller of the interface contacts both the inner and outer rings, resulting in two distinct contact pairs. A smaller contact normal stiffness factor facilitates convergence; however, it introduces a larger penetration value, which can lead to inaccurate solution results. After debugging, the normal stiffness factor is ultimately set to 1. The extended Lagrange algorithm is employed to mitigate the sensitivity of stiffness during the resolution of the contact algorithm. In the initial phase of contact, a small gap exists between the contact point and the integration point of the target element, preventing contact detection and resulting in rigid body motion between the contacts. Nevertheless, in the case of nonlinear contact, even if the initial gap is disregarded, it will still manifest during the loading process. The function of ‘Adjust to Touch’ is designed to confine the forthcoming contact to the detected range. If a gap and penetration are present prior to contact, they will be disregarded, while all other settings will remain at their default values.

3. Analysis of the Influence of Plugging Position and Fit on Motion Stability

3.1. Influence of Taper Pin Pressing Position on Motion Stability

Figure 6 illustrates the structural diagram of various cone pin pressing positions. The positional relationship between the plug and the plug hole is a critical factor influencing the motion stability of the cross roller bearing. Additionally, the pressing depth of the taper pin can impact the position of the plug to some extent, which in turn affects the contact pressure and deformation displacement of the contact surface between the roller and the plug raceway, ultimately influencing the motion stability of the bearing.
The numbers corresponding to the five positions of the taper pin are presented in Table 4, where position 3 is identified as the defect-free location of the raceway. Through comparative analysis, the contact pressure and deformation displacement of the rollers at each of the five taper pin positions, as well as the contact surface of the raceway, were determined by solving and calculating the simulation model, as illustrated in Figure 7 and Figure 8.
Figure 7 and Figure 8 illustrate the contact pressure and deformation displacement of roller and outer ring raceway contact surface and roller and plug raceway contact surface, when the taper pin is pressed into different positions. From these figures, it is evident that during the movement of the rollers and the occurrence of clogging, the contact pressure and deformation displacement between the rollers and the raceway at the five positions of the taper pin gradually increase from t = 0 to 0.05 s (before the roller contacts the raceway surface of the plug). During the interval of t = 0.05 to 0.15 s (when the roller contacts the raceway surface of the plug), the contact pressure between the roller and the raceway at the five taper pin positions initially decreases before subsequently increasing, while the deformation displacement gradually decreases. Finally, from t = 0.15 to 0.2 s (after the roller has rolled out from the plug raceway surface), both the contact pressure and deformation displacement between the roller and the raceway gradually decrease.
The contact pressure and deformation during movement are influenced by the varying positions of the taper pin within the taper pin hole, which subsequently affects the position of the plug. This misalignment can lead to a defect between the raceway surfaces of the plug and the outer ring of the bearing, forcing a deviation in the normal movement trajectory of the roller. Consequently, this affects the movement stability of the roller, resulting in increased contact pressure as the roller engages and disengages with the plug position. A comparison of the contact pressure and deformation displacement across five positions of the taper pin reveals that positions 1 and 2 exhibit the highest contact pressure and deformation displacement. This is attributed to the poor positioning effect of the taper pin near the larger end, which allows for greater variability in the plug’s position during roller movement. In contrast, when the taper pin is positioned at position 3, the contact pressure and deformation displacement of the roller are minimized. This is due to the taper pin’s central placement, which enhances the stability of both sides of the plug, thereby reducing the contact pressure and deformation displacement experienced by the roller.
To clearly illustrate the contact and deformation changes between the roller and the plug, we present the contact surface between the roller and the outer ring raceway, along with the contact pressure field and deformation displacement field between the roller and the plug raceway at various simulation times corresponding to taper pin position 3, as depicted in Figure 9 and Figure 10.
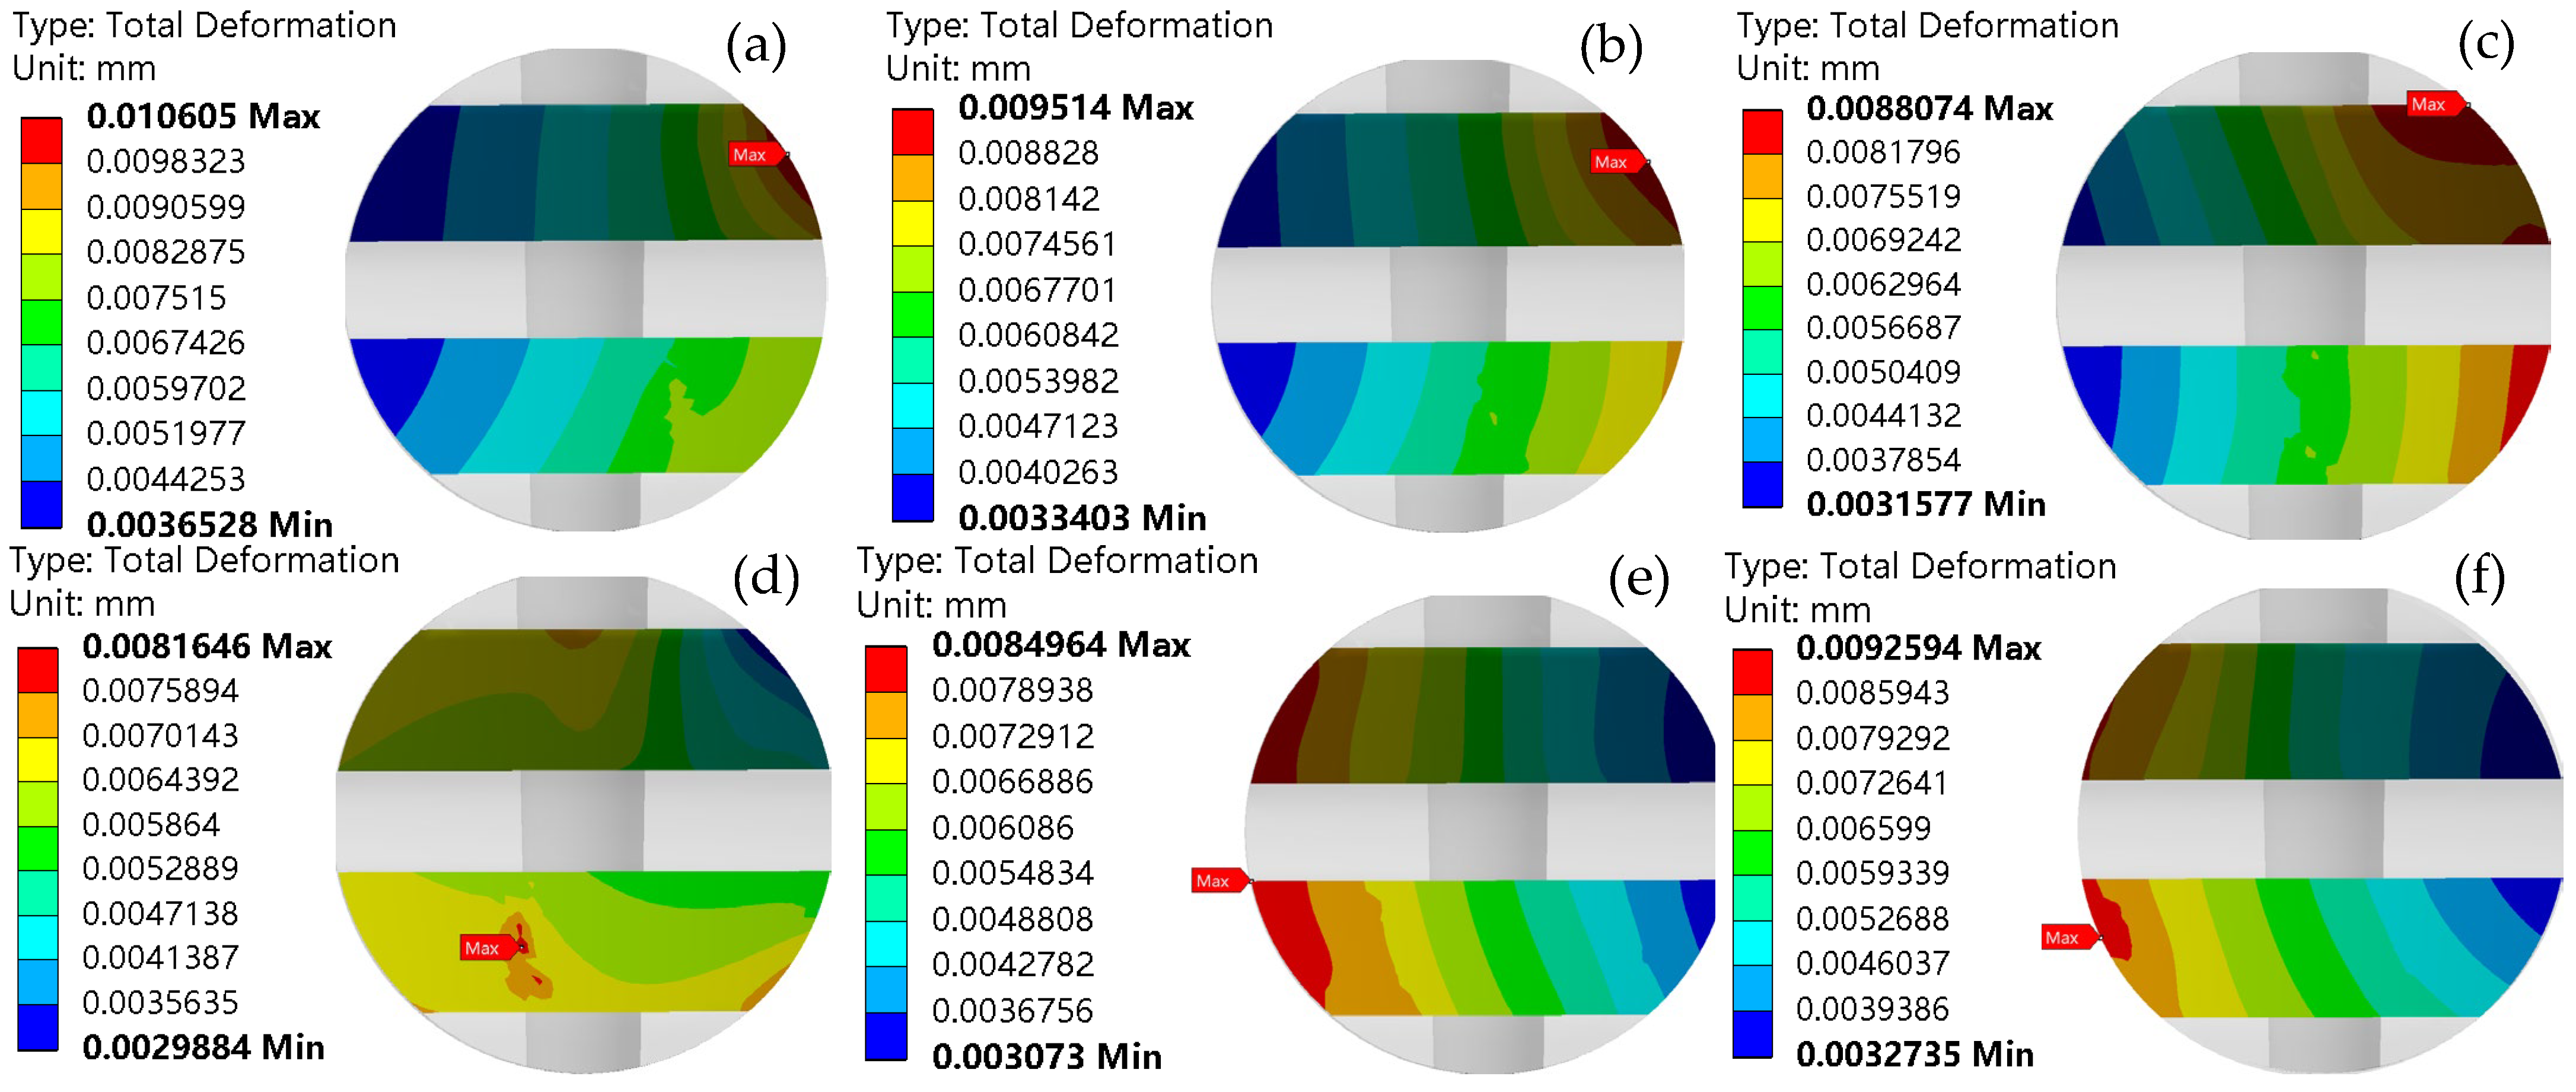
In Figure 9 and Figure 10, panels (a) through (f) illustrate the contact pressure field and deformation displacement field at six intermediate moments, ranging from t = 0.05 s (the time of entering the plug raceway surface) to t = 0.15 s (the time of rolling out of the plug raceway surface).
Figure 9 illustrates that during the movement of the roller on the plug surface, the contact pressure reaches its peak at t = 0.05 s, with a maximum value of 1574.6 MPa. This maximum contact pressure is predominantly concentrated in the area near the plug leading to the oil ditch. Additionally, as shown in Figure 10, at t = 0.05 s, the deformation displacement is at its greatest, with a maximum value of 0.009759 mm. This maximum deformation displacement is primarily observed on the contact surface of the roller’s end face and the plug.
According to the results presented, when other factors are held constant, the contact pressure and deformation displacement of the roller and plug initially decrease and then increase with the depth of the taper pin pressing position. When the taper pin is positioned at the midpoint, both the contact pressure and deformation displacement are minimized. At this position, the non-coincidence defect between the plug raceway and the outer ring raceway is also reduced to the lowest level, resulting in minimal impact on the roundness and motion stability of the raceway. Therefore, this position is deemed the most suitable for the positioning and assembly of the plug.

3.2. Influence of Plug and Plug Hole Matching Clearance on Motion Stability

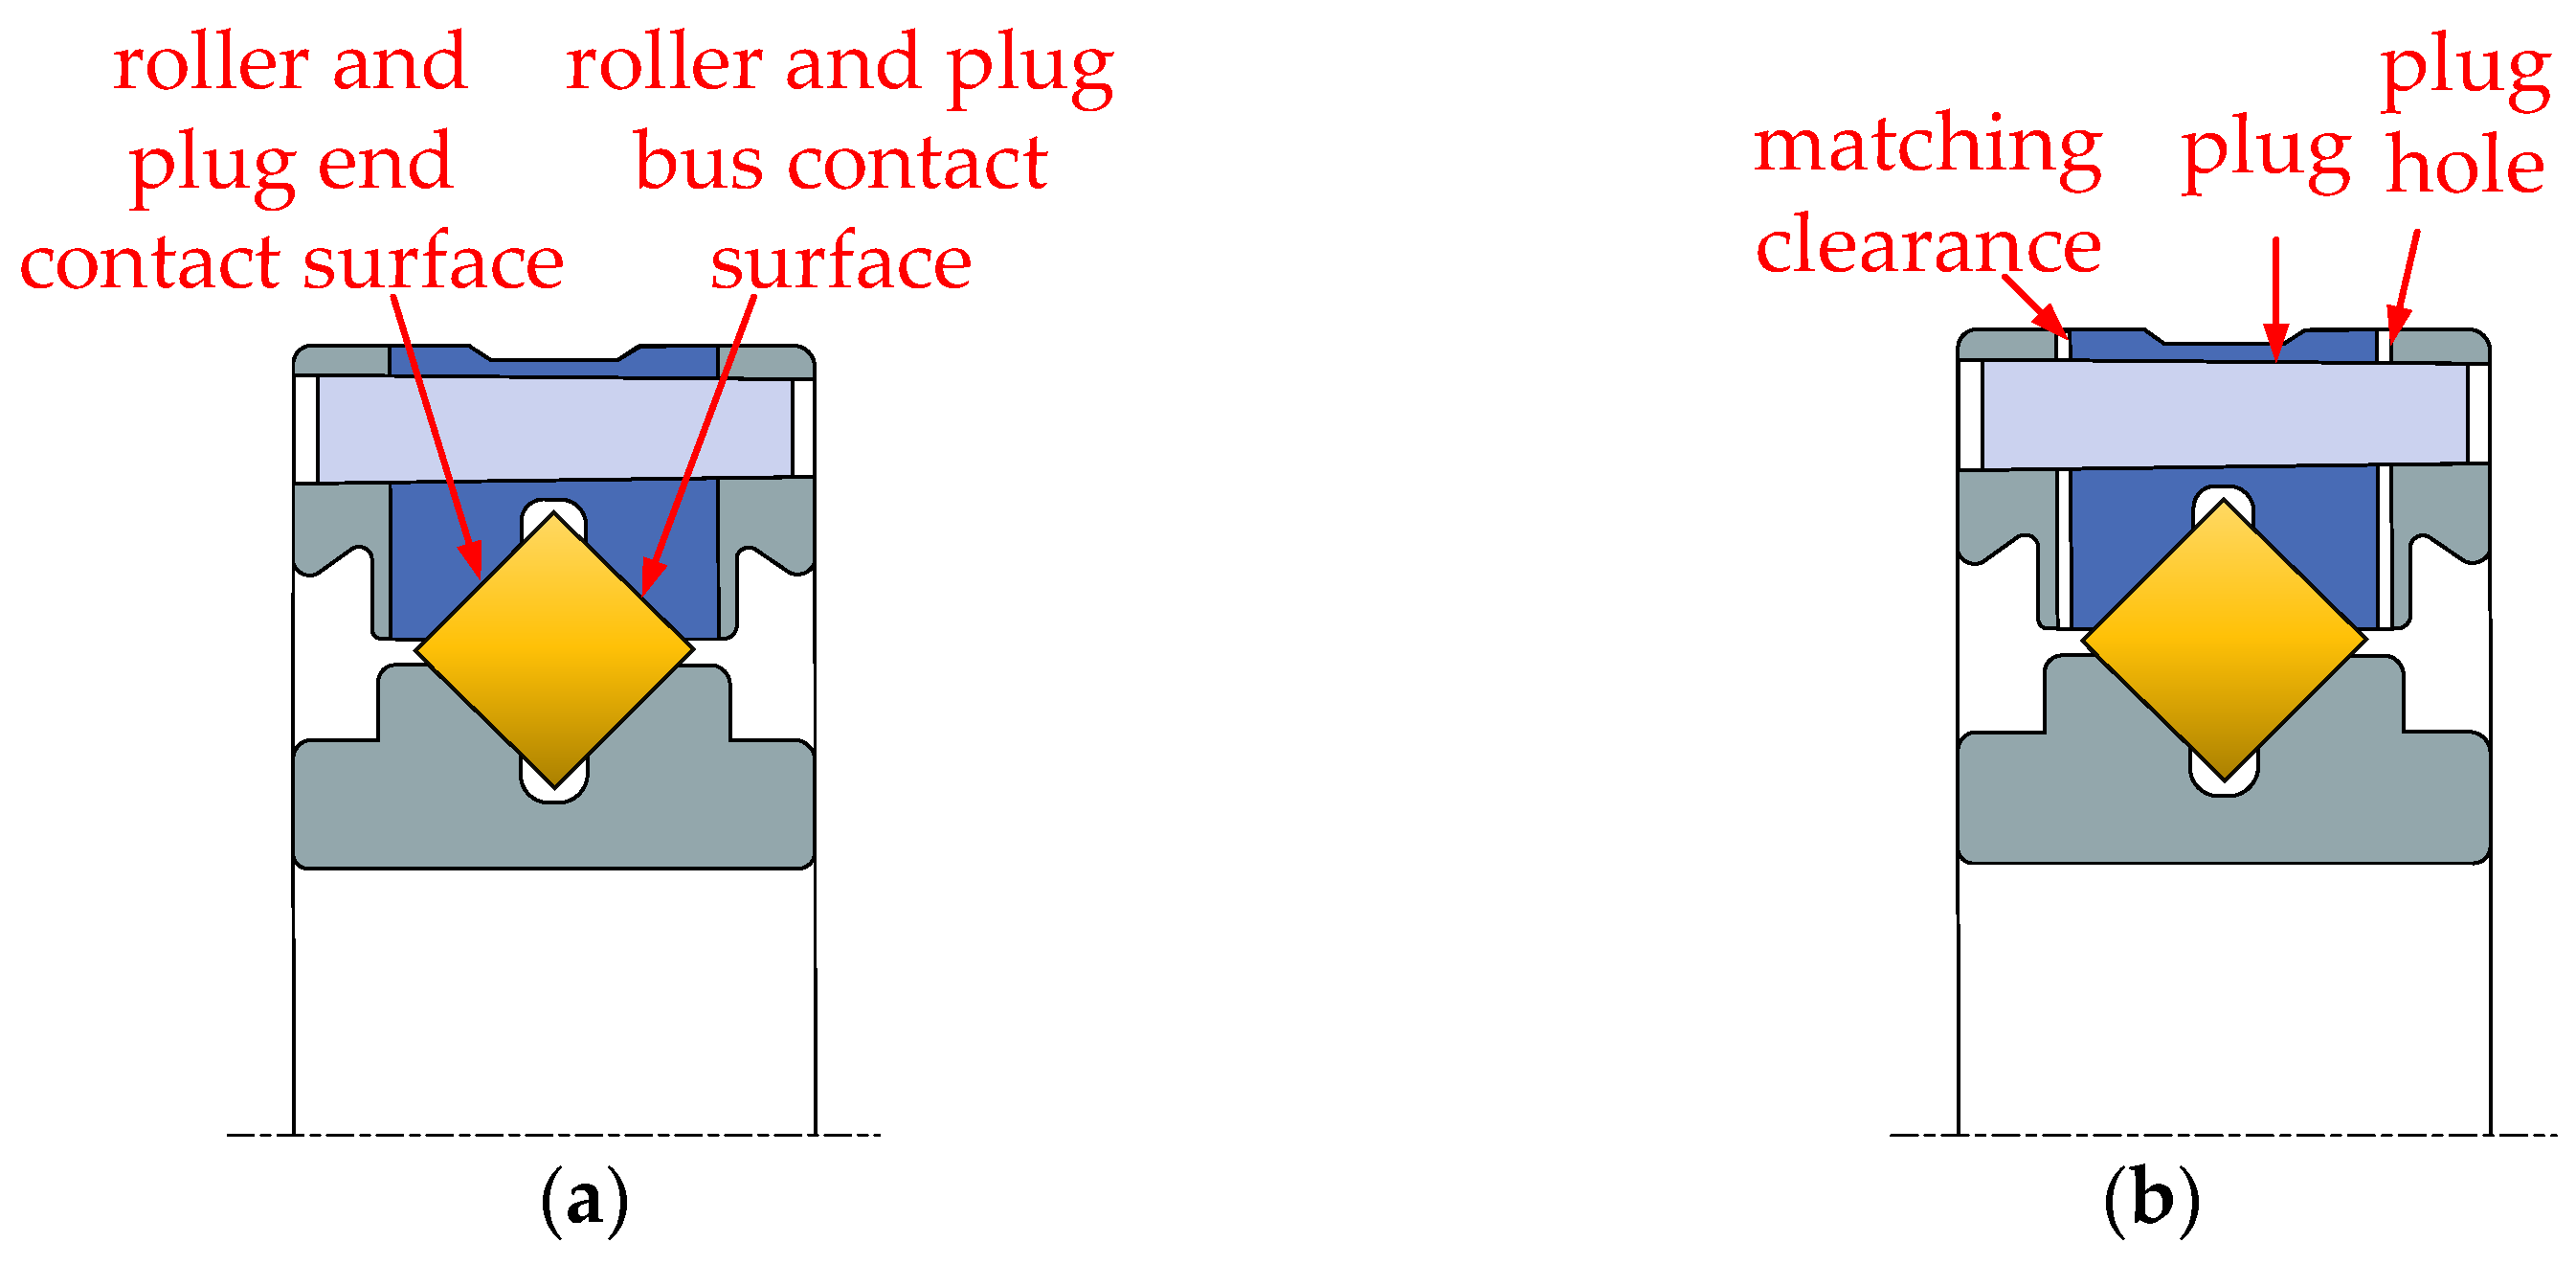
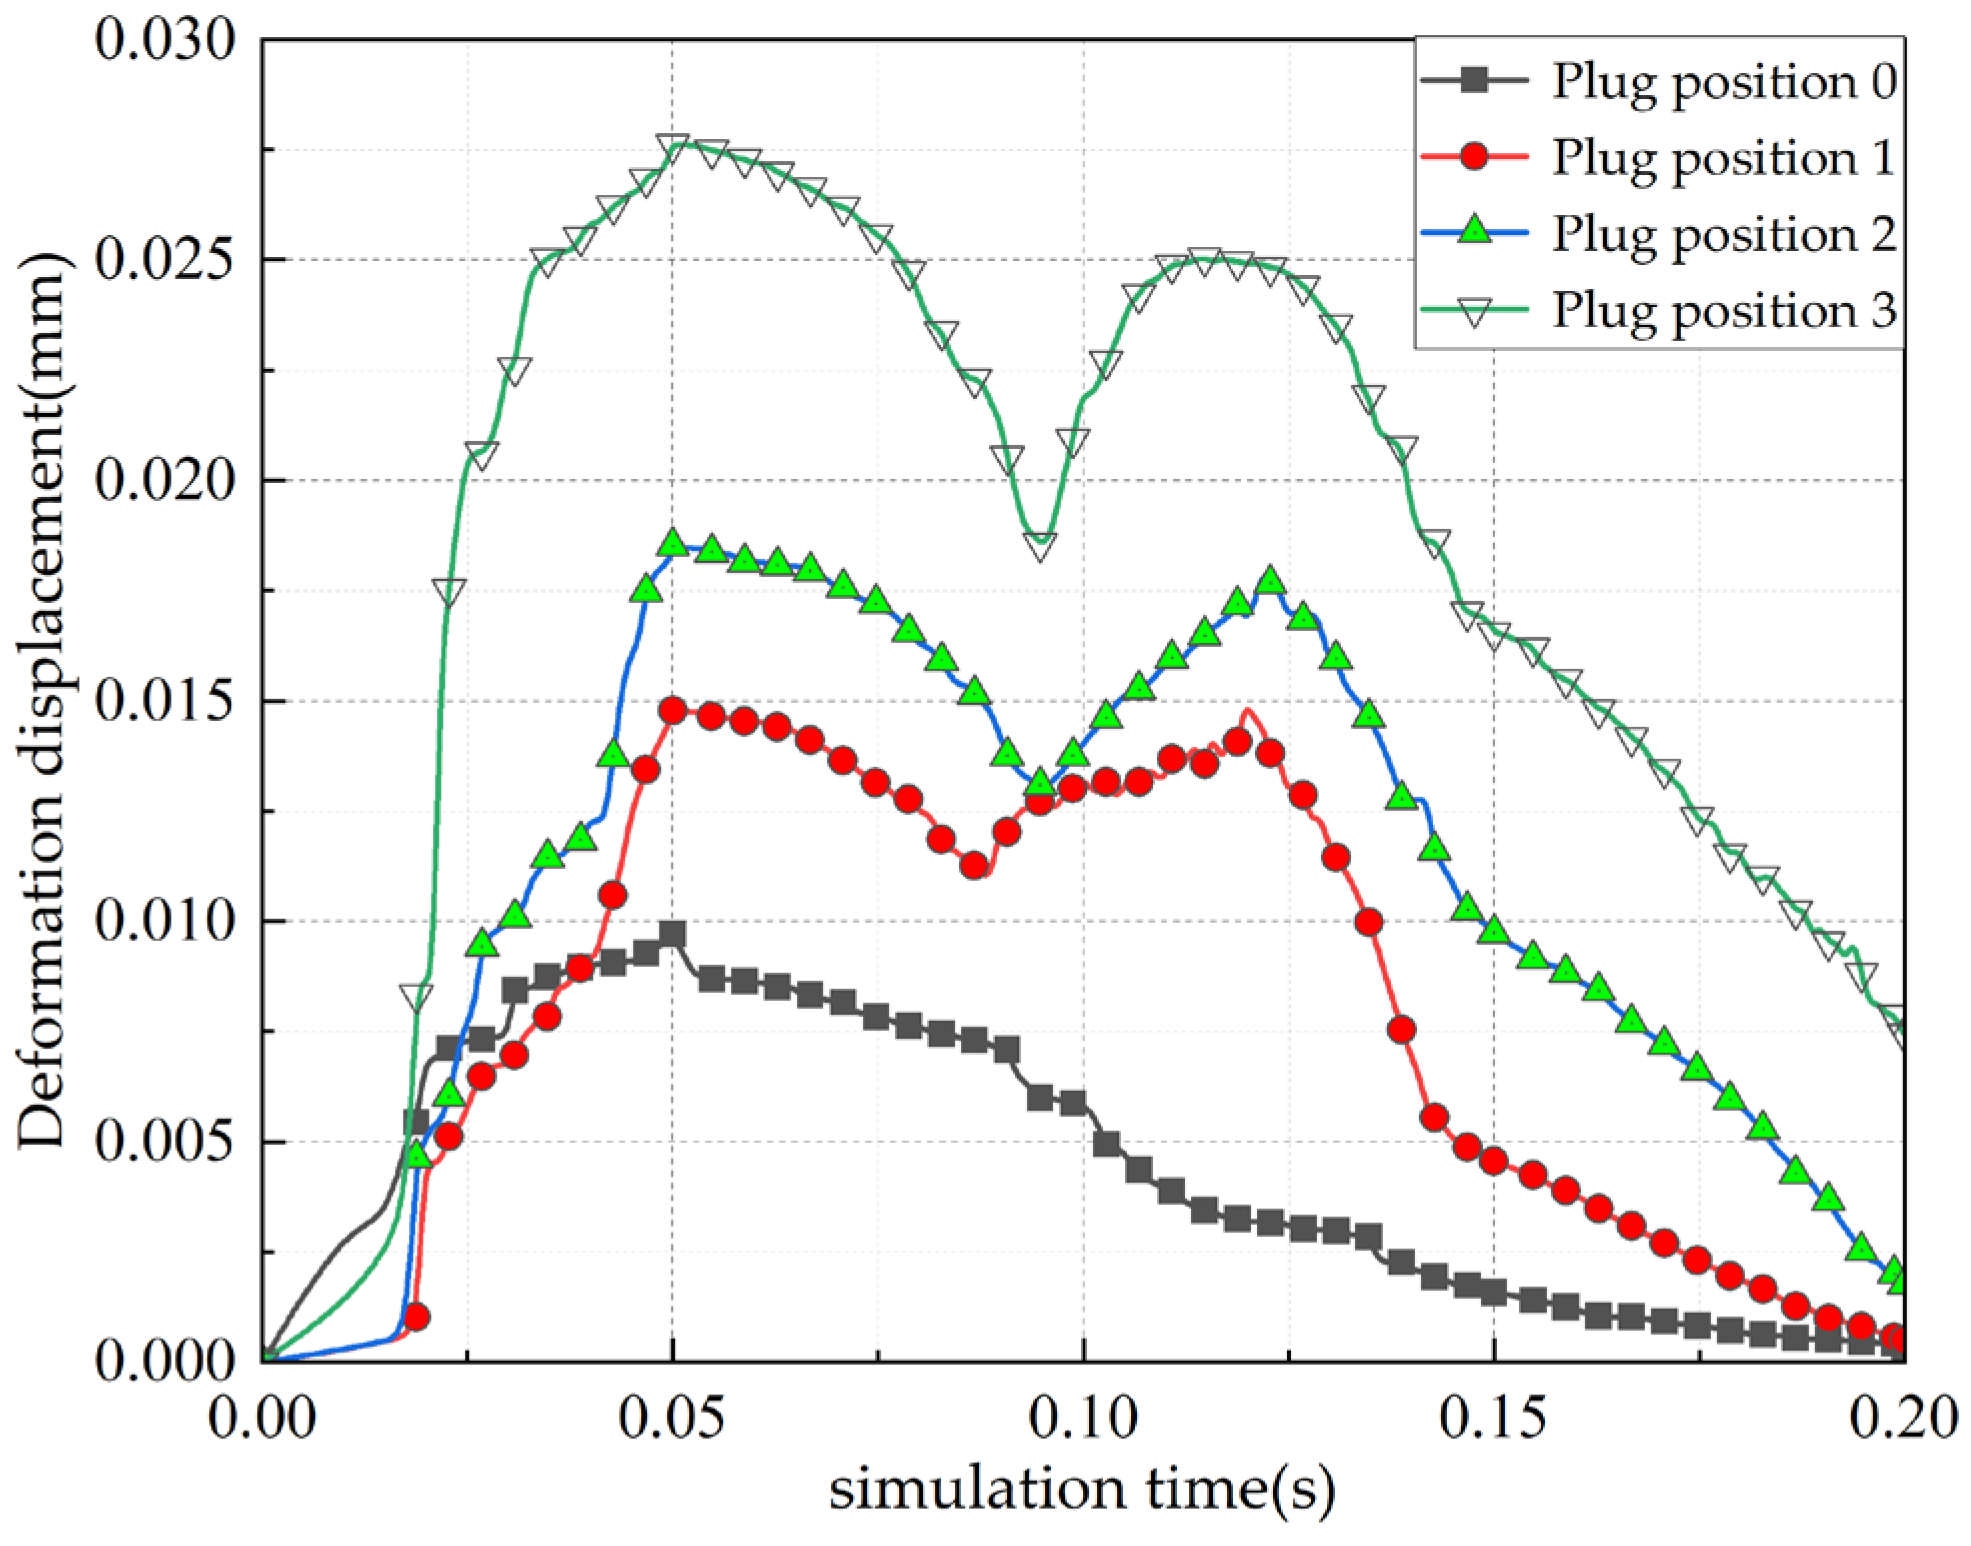
Figure 11 illustrates the structural diagram of the clearance between the plug and the plug hole. Based on the actual processing conditions, the matching clearance between the plug and the plug hole is maintained within the range of 0 to 20 μm. This study examines four typical fitting clearance positions: 0, 5, 10, and 20 μm.
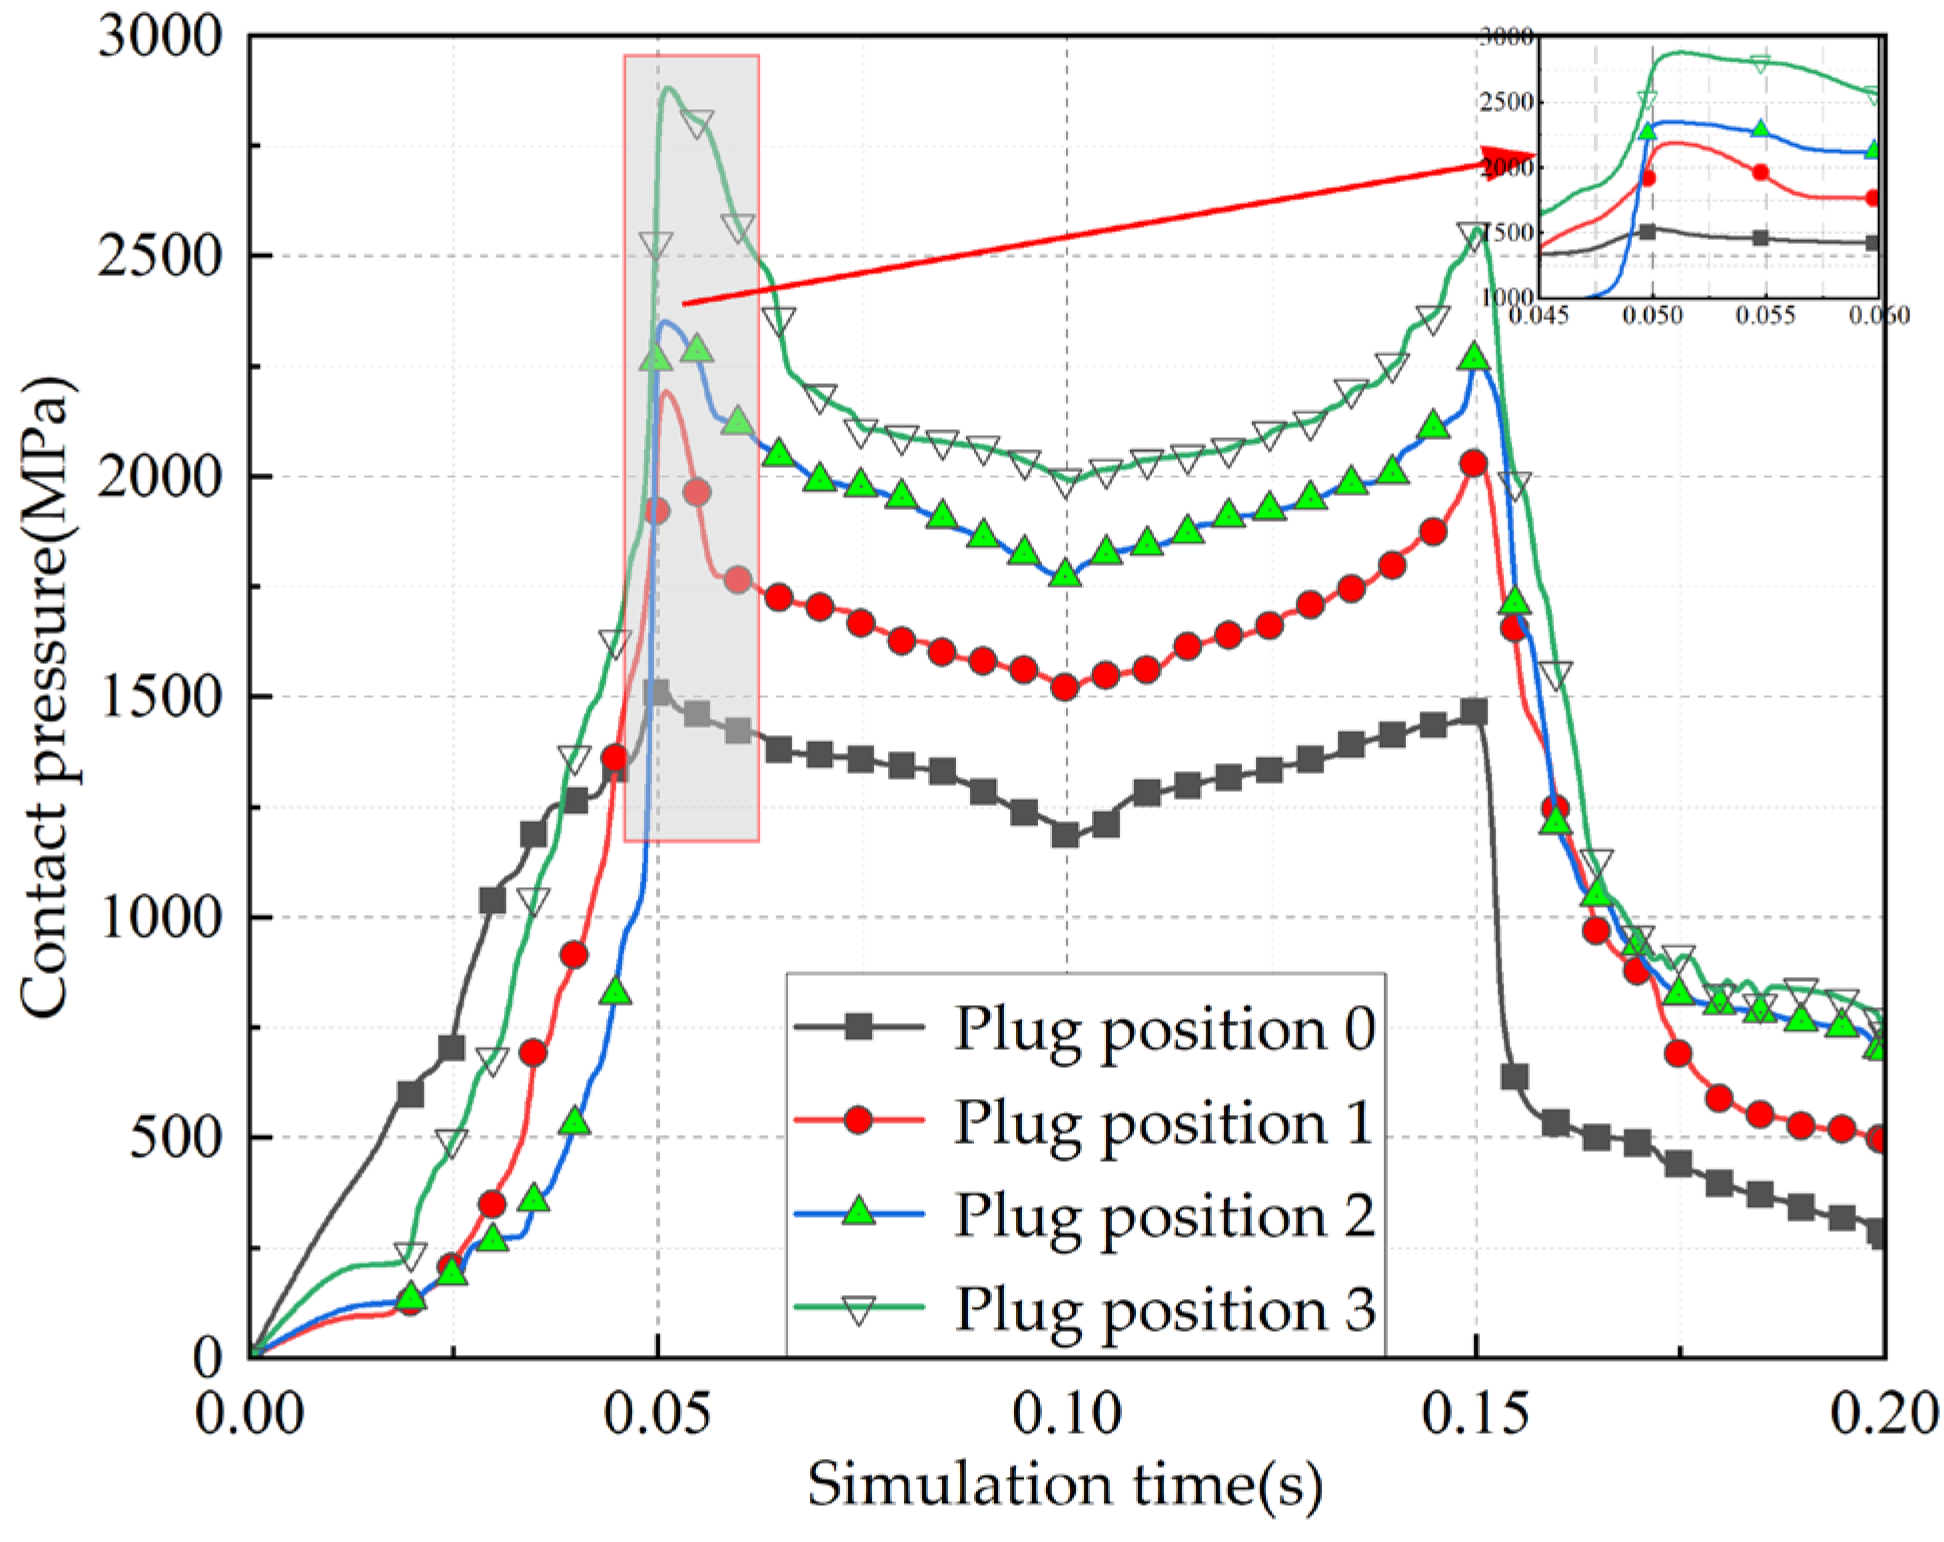
The four positions of the plug are numbered as illustrated in Table 5, with position 0 representing the defect-free condition in the raceway, as determined by comparative analysis. The contact pressure and deformation displacement at each of the four plug positions were obtained through the simulation model of the plug matching clearance on, as depicted in Figure 11 and Figure 12.
Figure 12 and Figure 13 illustrate the changes in contact pressure and deformation displacement of roller and outer ring raceway contact surface and roller and plug raceway contact surface, corresponding to various plug matching clearances. It is evident from these figures that during the movement of the rollers and the occurrence of clogging, the contact pressure and deformation displacement between the rollers and raceways at the four positions of the plug, from t = 0 to 0.05 s, progressively increase. In the interval from t = 0.05 to 0.15 s, the contact pressure and deformation displacement between the rollers and raceway at the three positions of the plug matching clearance initially decrease and then increase. The contact pressure between the rollers at position 0 of the plug and the raceway first decreases and subsequently increases, while the deformation displacement gradually decreases. Finally, from t = 0.15 to 0.2 s, both the contact pressure and deformation displacement between the roller and the raceway exhibit a gradual decrease.
The contact pressure and deformation experienced during movement are influenced by the clearance between the plug and the plug hole, which affects the degree of freedom of the plug and the positioning effect of the taper pin. Consequently, the position of the plug shifts when the roller engages with or disengages from the contact surface of the plug, altering the normal motion state of the roller. This, in turn, impacts the stability of the roller and increases the contact pressure and deformation displacement between the roller and the plug. Notably, the contact pressure and deformation displacement at plug position 3 are the highest, as the matching clearance between the plug and the plug hole is maximal at this point. This condition prevents the taper pin from fully locating the plug, resulting in the greatest contact pressure and deformation displacement of the roller. Additionally, the position of the plug will continue to change during subsequent movements of the roller, thereby affecting the movement stability of the bearing. In contrast, when the plug is at positions 1 and 0, the contact pressure and deformation displacement of the taper pin are minimal. This reduction occurs because the clearance between the plug and the plug hole is smaller in these positions, allowing the taper pin to better locate the plug, thereby enhancing the stability of both the plug and the roller while reducing contact pressure and deformation displacement.
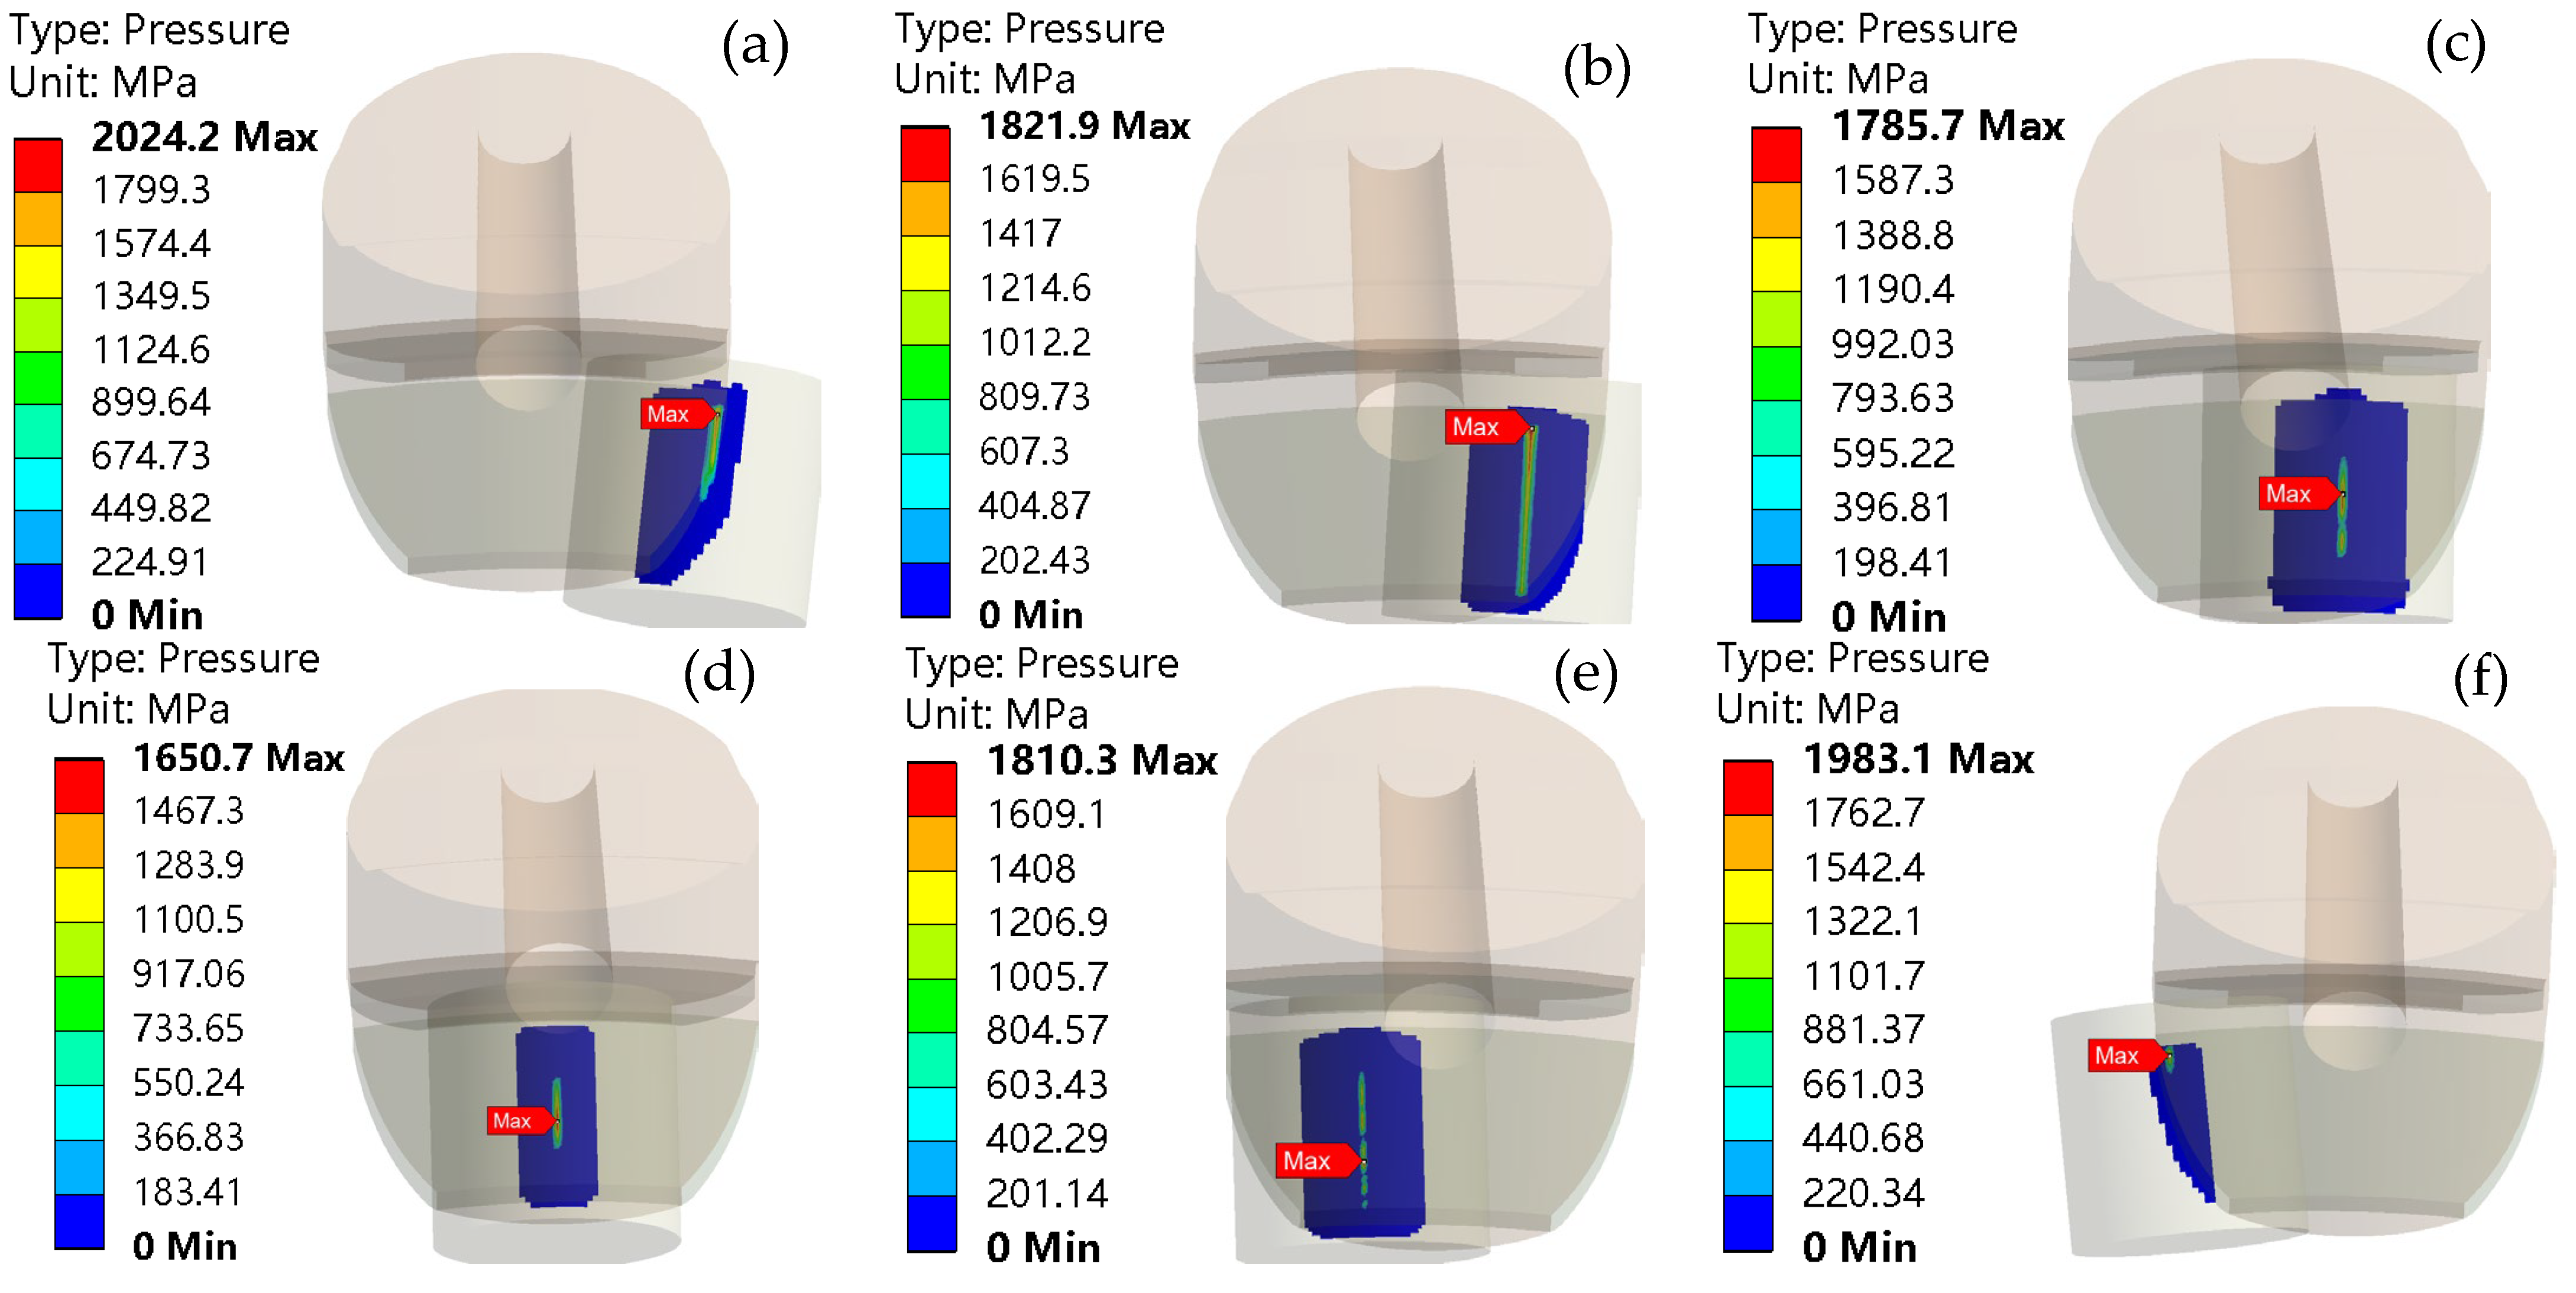
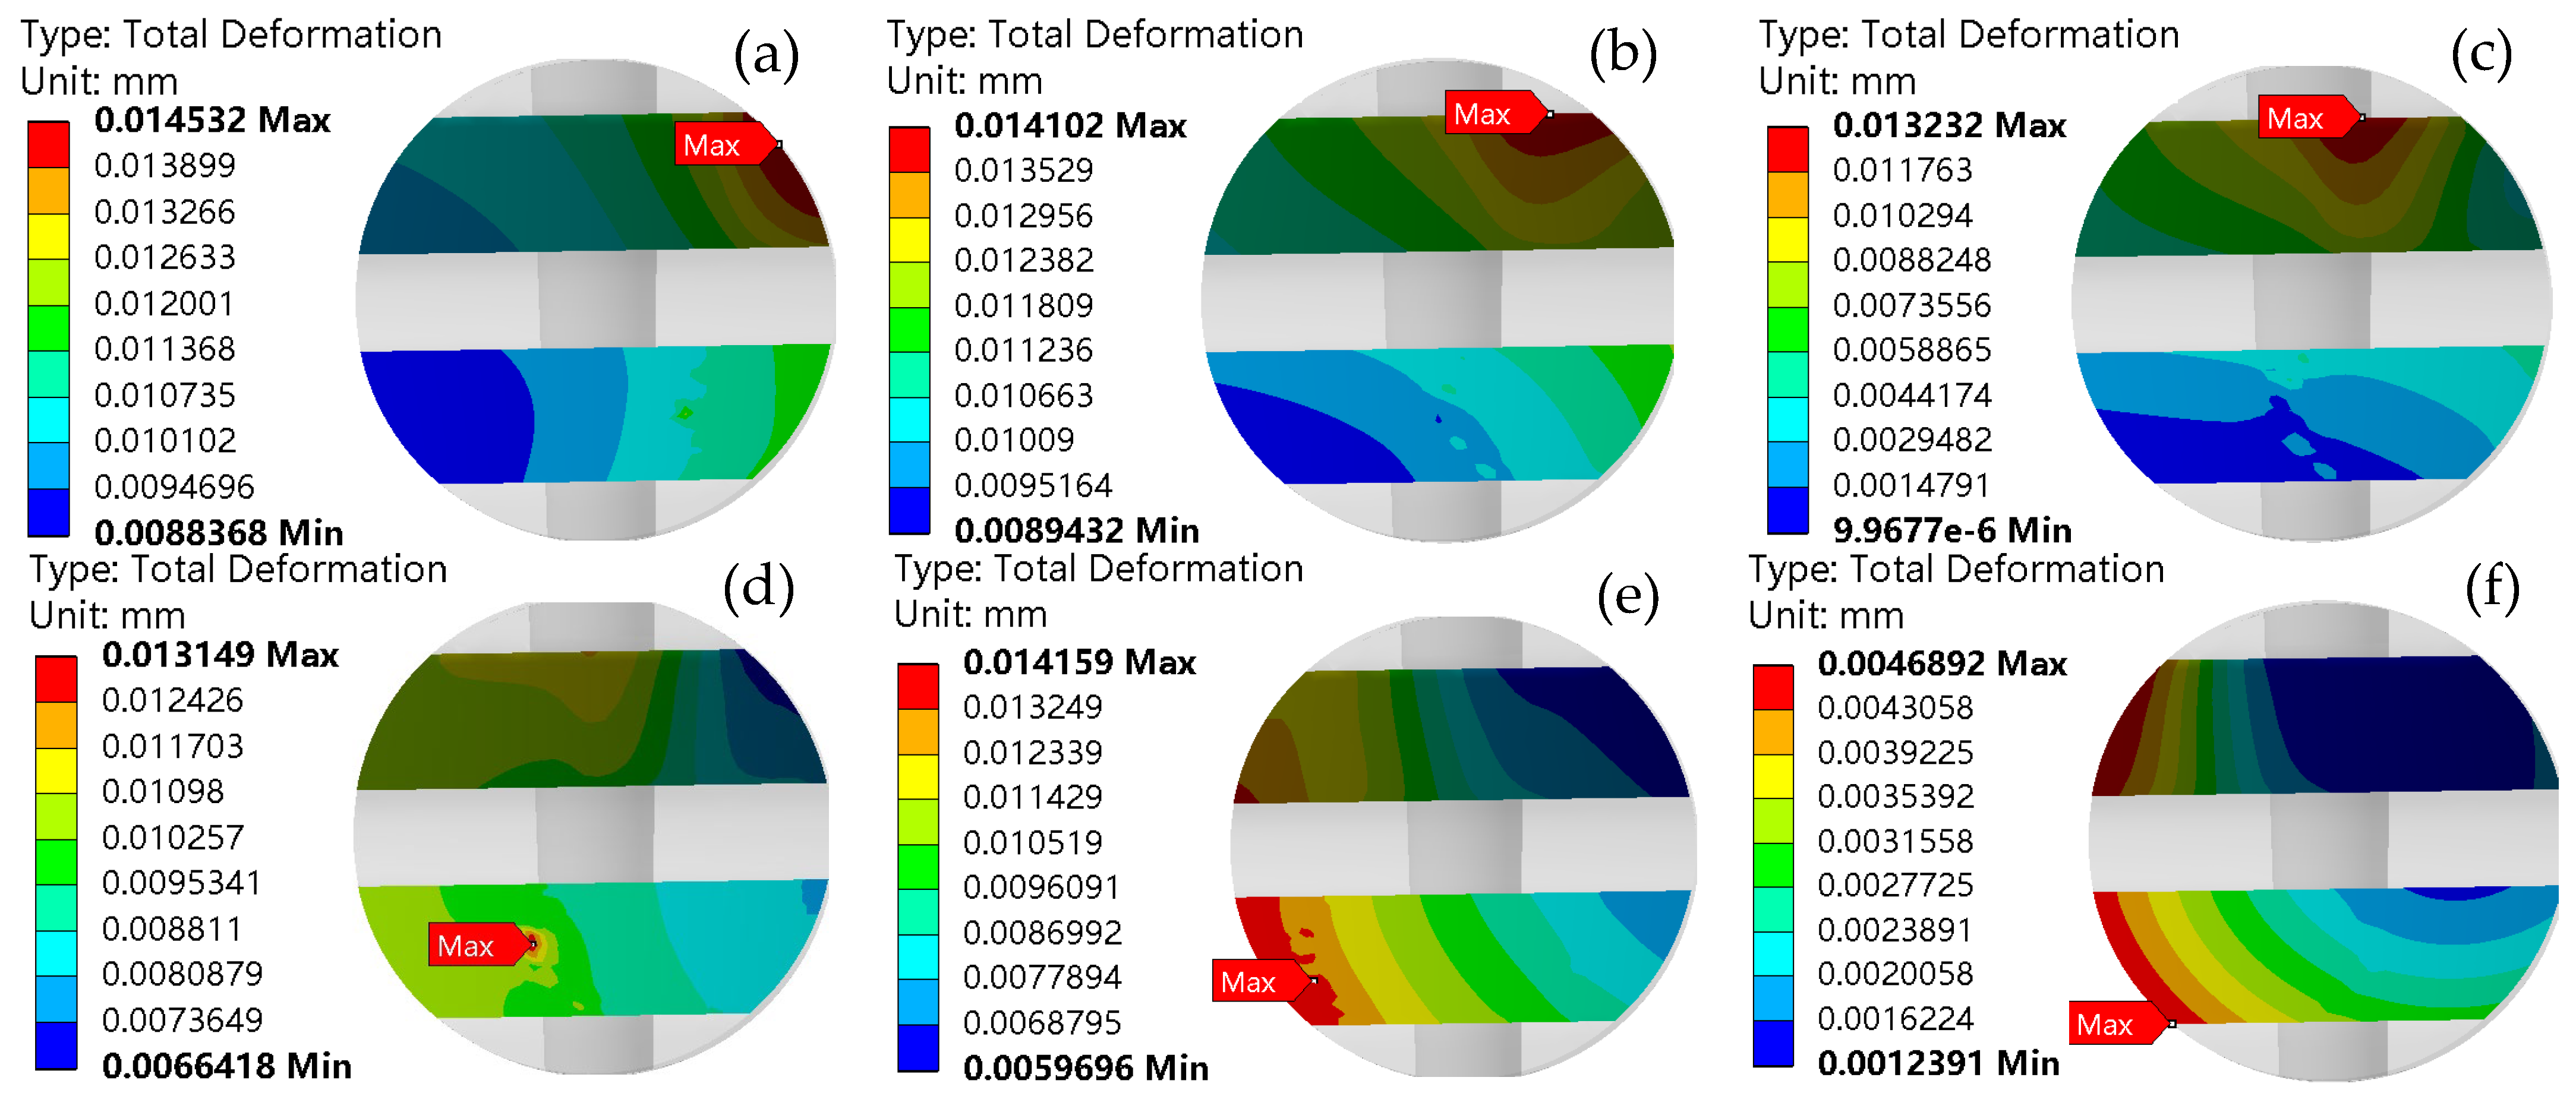
By comparing the contact pressure and deformation displacement at the four positions of the plug, it is evident that both the contact pressure and deformation displacement of the roller are minimized when the plug is positioned at position 1, assuming the presence of a plug matching clearance. To clearly illustrate the contact and deformation changes between the roller and the plug, we present the contact surface between the roller and the outer ring raceway, along with the contact pressure field and deformation displacement field between the roller and the plug raceway at various simulation times corresponding to plug position 1, as shown in Figure 14 and Figure 15.
In Figure 14 and Figure 15, panels (a) through (f) illustrate the contact pressure field and deformation displacement field at six intermediate time points, ranging from t = 0.05 s to t = 0.15 s, at plug position 1.
Figure 14 illustrates that during the movement of the roller on the plug surface, the contact pressure reaches its peak at t = 0.05 s, with a maximum value of 2024.2 MPa. As the roller continues to rotate, the location of the maximum contact pressure shifts from a position near the plug to the central region of the plug. Additionally, Figure 15 demonstrates that the maximum deformation displacement occurs when the roller is at t = 0.05 s, with a maximum displacement of 0.014532 mm. As the roller rotates, the site of maximum deformation displacement transitions from the contact surface between the roller and the plug to the contact surface on the end face between the roller and the plug.
The results indicate that, when other factors remain constant, both the contact pressure and deformation displacement between the roller and the plug progressively increase as the plug clearance widens. Notably, the contact pressure and deformation displacement are minimized when the plug matching clearance is 0 μm. At this position, the plug most effectively enhances the positioning accuracy of the taper pin, ensures the roundness of the entire raceway, minimizes the impact on the stability of bearing movement, and is therefore the most suitable configuration for the positioning and assembly of the plug.

3.3. Influence of Sag and Protrusion of Plug on Motion Stability

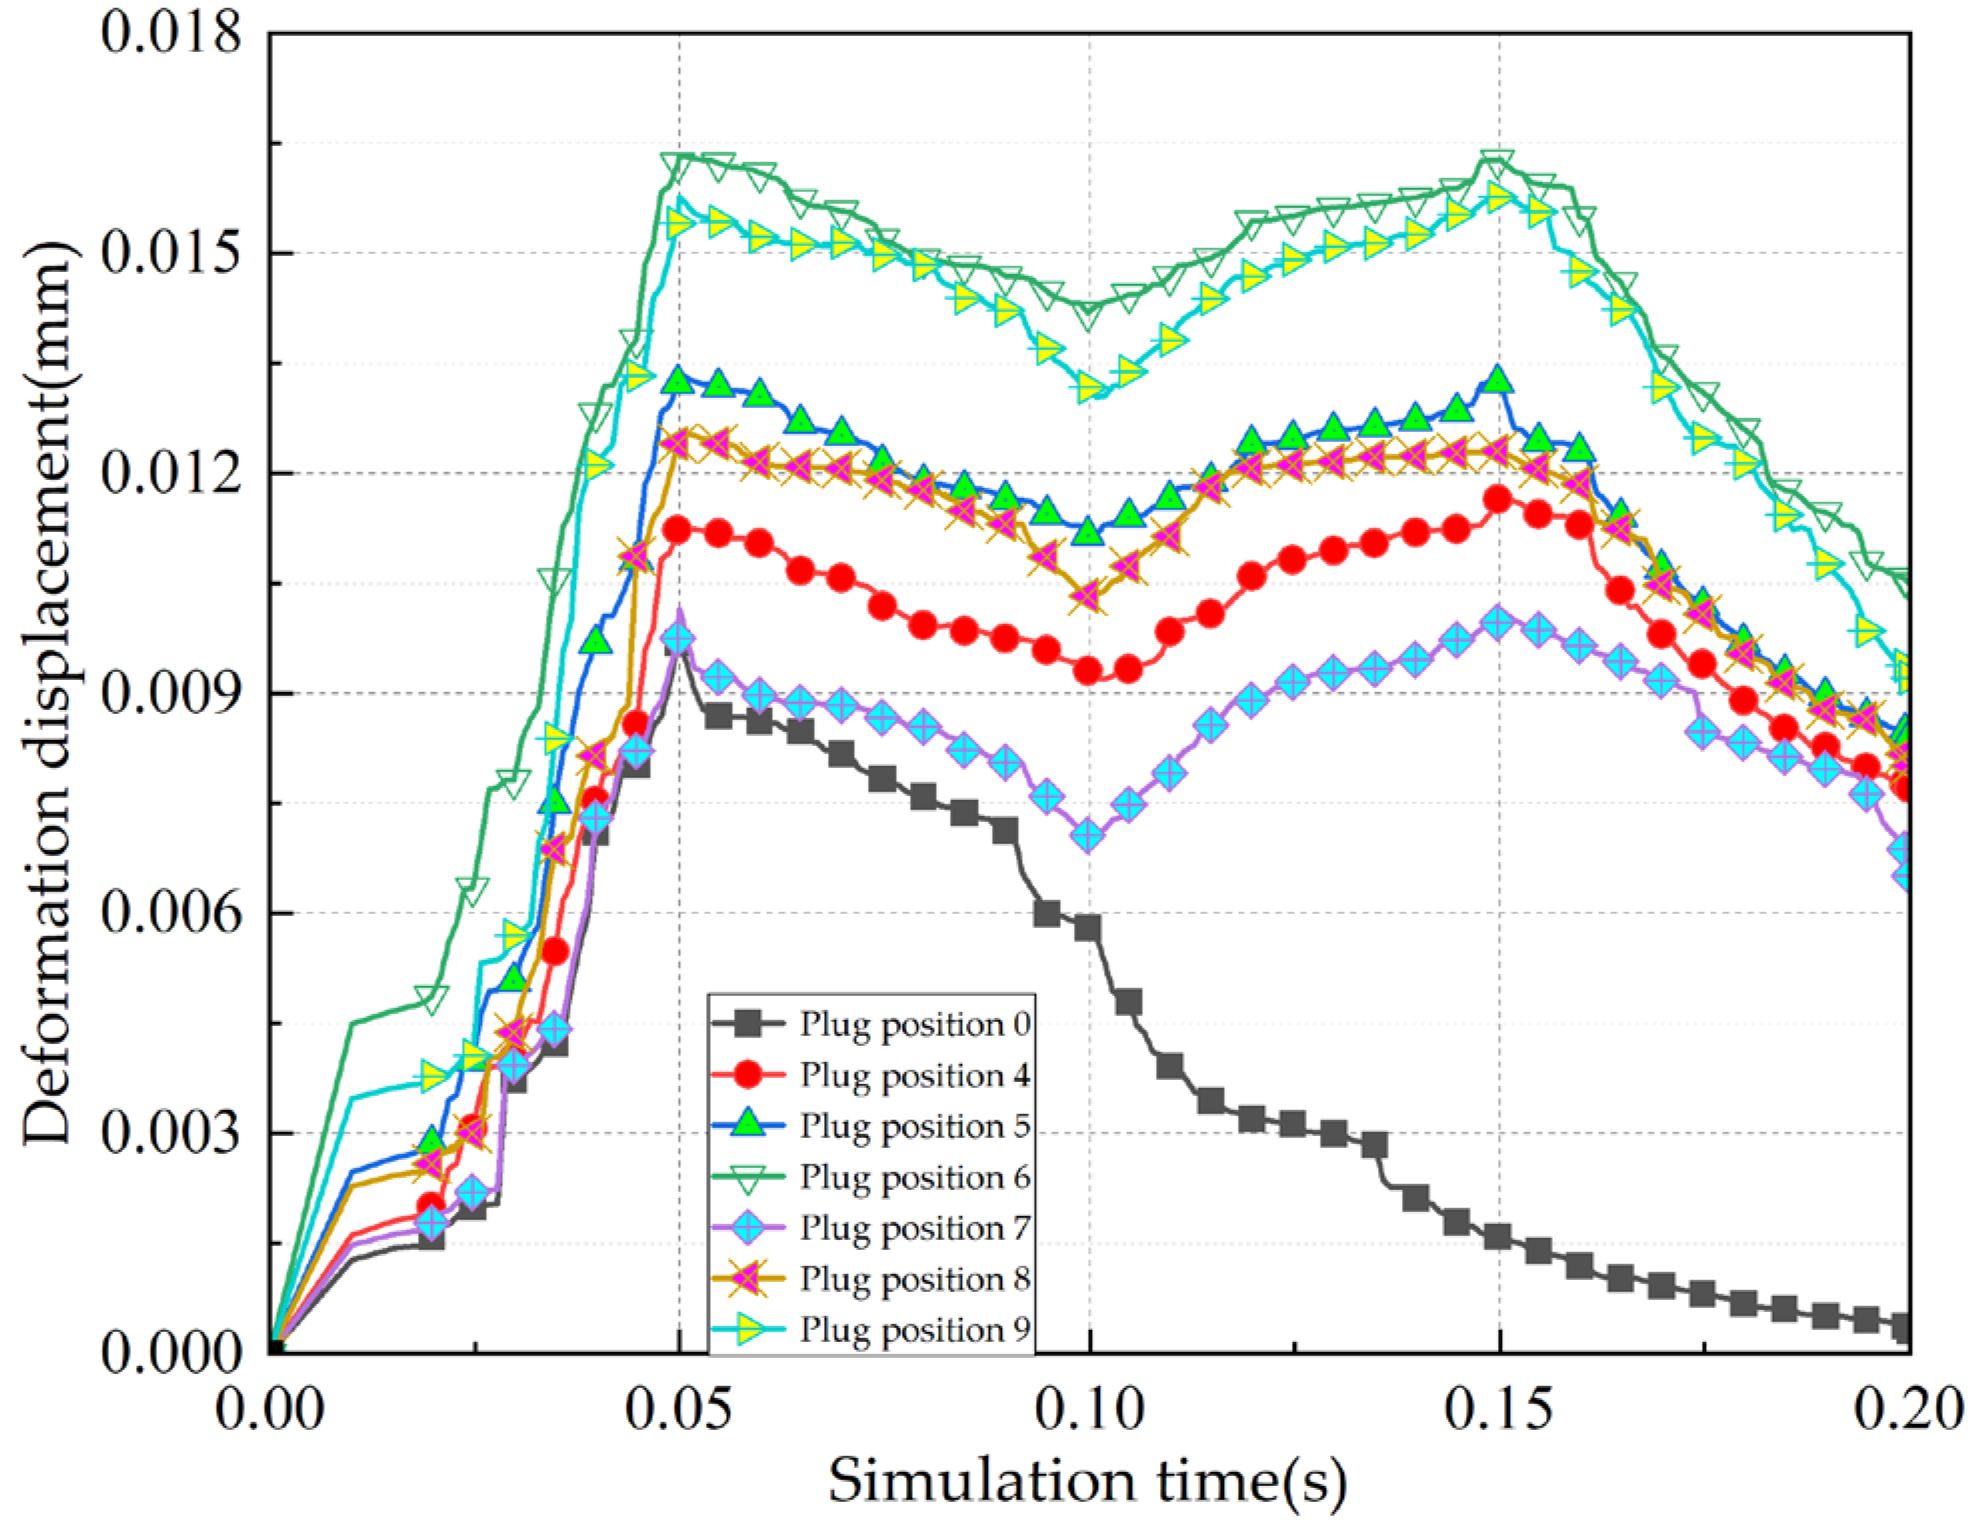
Figure 16 illustrates the structural diagram of the sag and bulge of the plug. As depicted in Figure 16, the distance that the plug moves in the radial direction within the plug hole corresponds to the extent of sag and protrusion of the plug. The range of values for sag and protrusion of the plug is from 0 to 5 μm. For subsequent research, six typical locations of sag and protrusion have been selected within the values of 1 μm, 3 μm, and 5 μm.
The six positions of the plug are numbered as indicated in Table 6. The simulation model for the sag and protrusion of the plug is analyzed to determine the contact pressure and deformation displacement at each of the six positions, as illustrated in Figure 17 and Figure 18.
Figure 17 and Figure 18 illustrate the changes in contact pressure and deformation displacement of roller and outer ring raceway contact surface and roller and plug raceway contact surface, corresponding to various plug sag and protrusion amounts. It is evident from these figures that during the movement of the rollers and the occurrence of clogging, the contact pressure and deformation displacement between the rollers and the raceway at the six positions of the plug gradually increase from t = 0 to 0.05 s. In the interval from t = 0.05 to 0.15 s, the contact pressure and deformation displacement at the six positions of the sag and protrusion of the plug initially decrease before subsequently increasing. Finally, from t = 0.15 to 0.2 s, both the contact pressure and deformation displacement between the rollers and the raceway gradually decrease.
The variation in contact pressure and deformation during movement is primarily attributed to the sagging and protrusion of the plug, which directly leads to a misalignment defect between the raceway surface of the plug and that of the outer ring. This misalignment results in a significant fluctuation in the roundness of the entire raceway, thereby altering the trajectory and state of the roller as it enters and exits the contact surface of the plug, ultimately affecting the stability of roller movement. Additionally, this scenario increases the contact pressure and deformation displacement between the roller and the plug. A comparison of the contact pressure and deformation displacement across six positions of the plug reveals that positions 6 and 9 exhibit the highest values. At these positions, the pitting and protrusion of the plug are most pronounced, leading to greater misalignment defects between the raceway surfaces of the plug and the outer ring. This exacerbates the roundness of the entire raceway and results in maximum contact pressure and deformation displacement on the roller. Conversely, at positions 4 and 7, the contact pressure and deformation displacement of the taper pin are minimized due to the reduced sagging and protrusion of the plug. Consequently, the misalignment defects between the plug’s raceway surface and the outer ring’s raceway surface are diminished, leading to improved roundness of the entire raceway. This stability facilitates smoother roller movement within the raceway, thereby reducing contact pressure and deformation displacement on the roller.
To clearly illustrate the contact and deformation changes between the roller and the plug, we present the contact surface between the roller and the outer ring raceway, along with the contact pressure field and deformation displacement field between the roller and the plug raceway at various simulation times corresponding to plug position 7 in Figure 19 and Figure 20.
In Figure 19 and Figure 20, panels (a) through (f) illustrate the contact pressure field and deformation displacement field at the plug position 7 during six distinct time points, specifically from t = 0.05 s to t = 0.15 s.
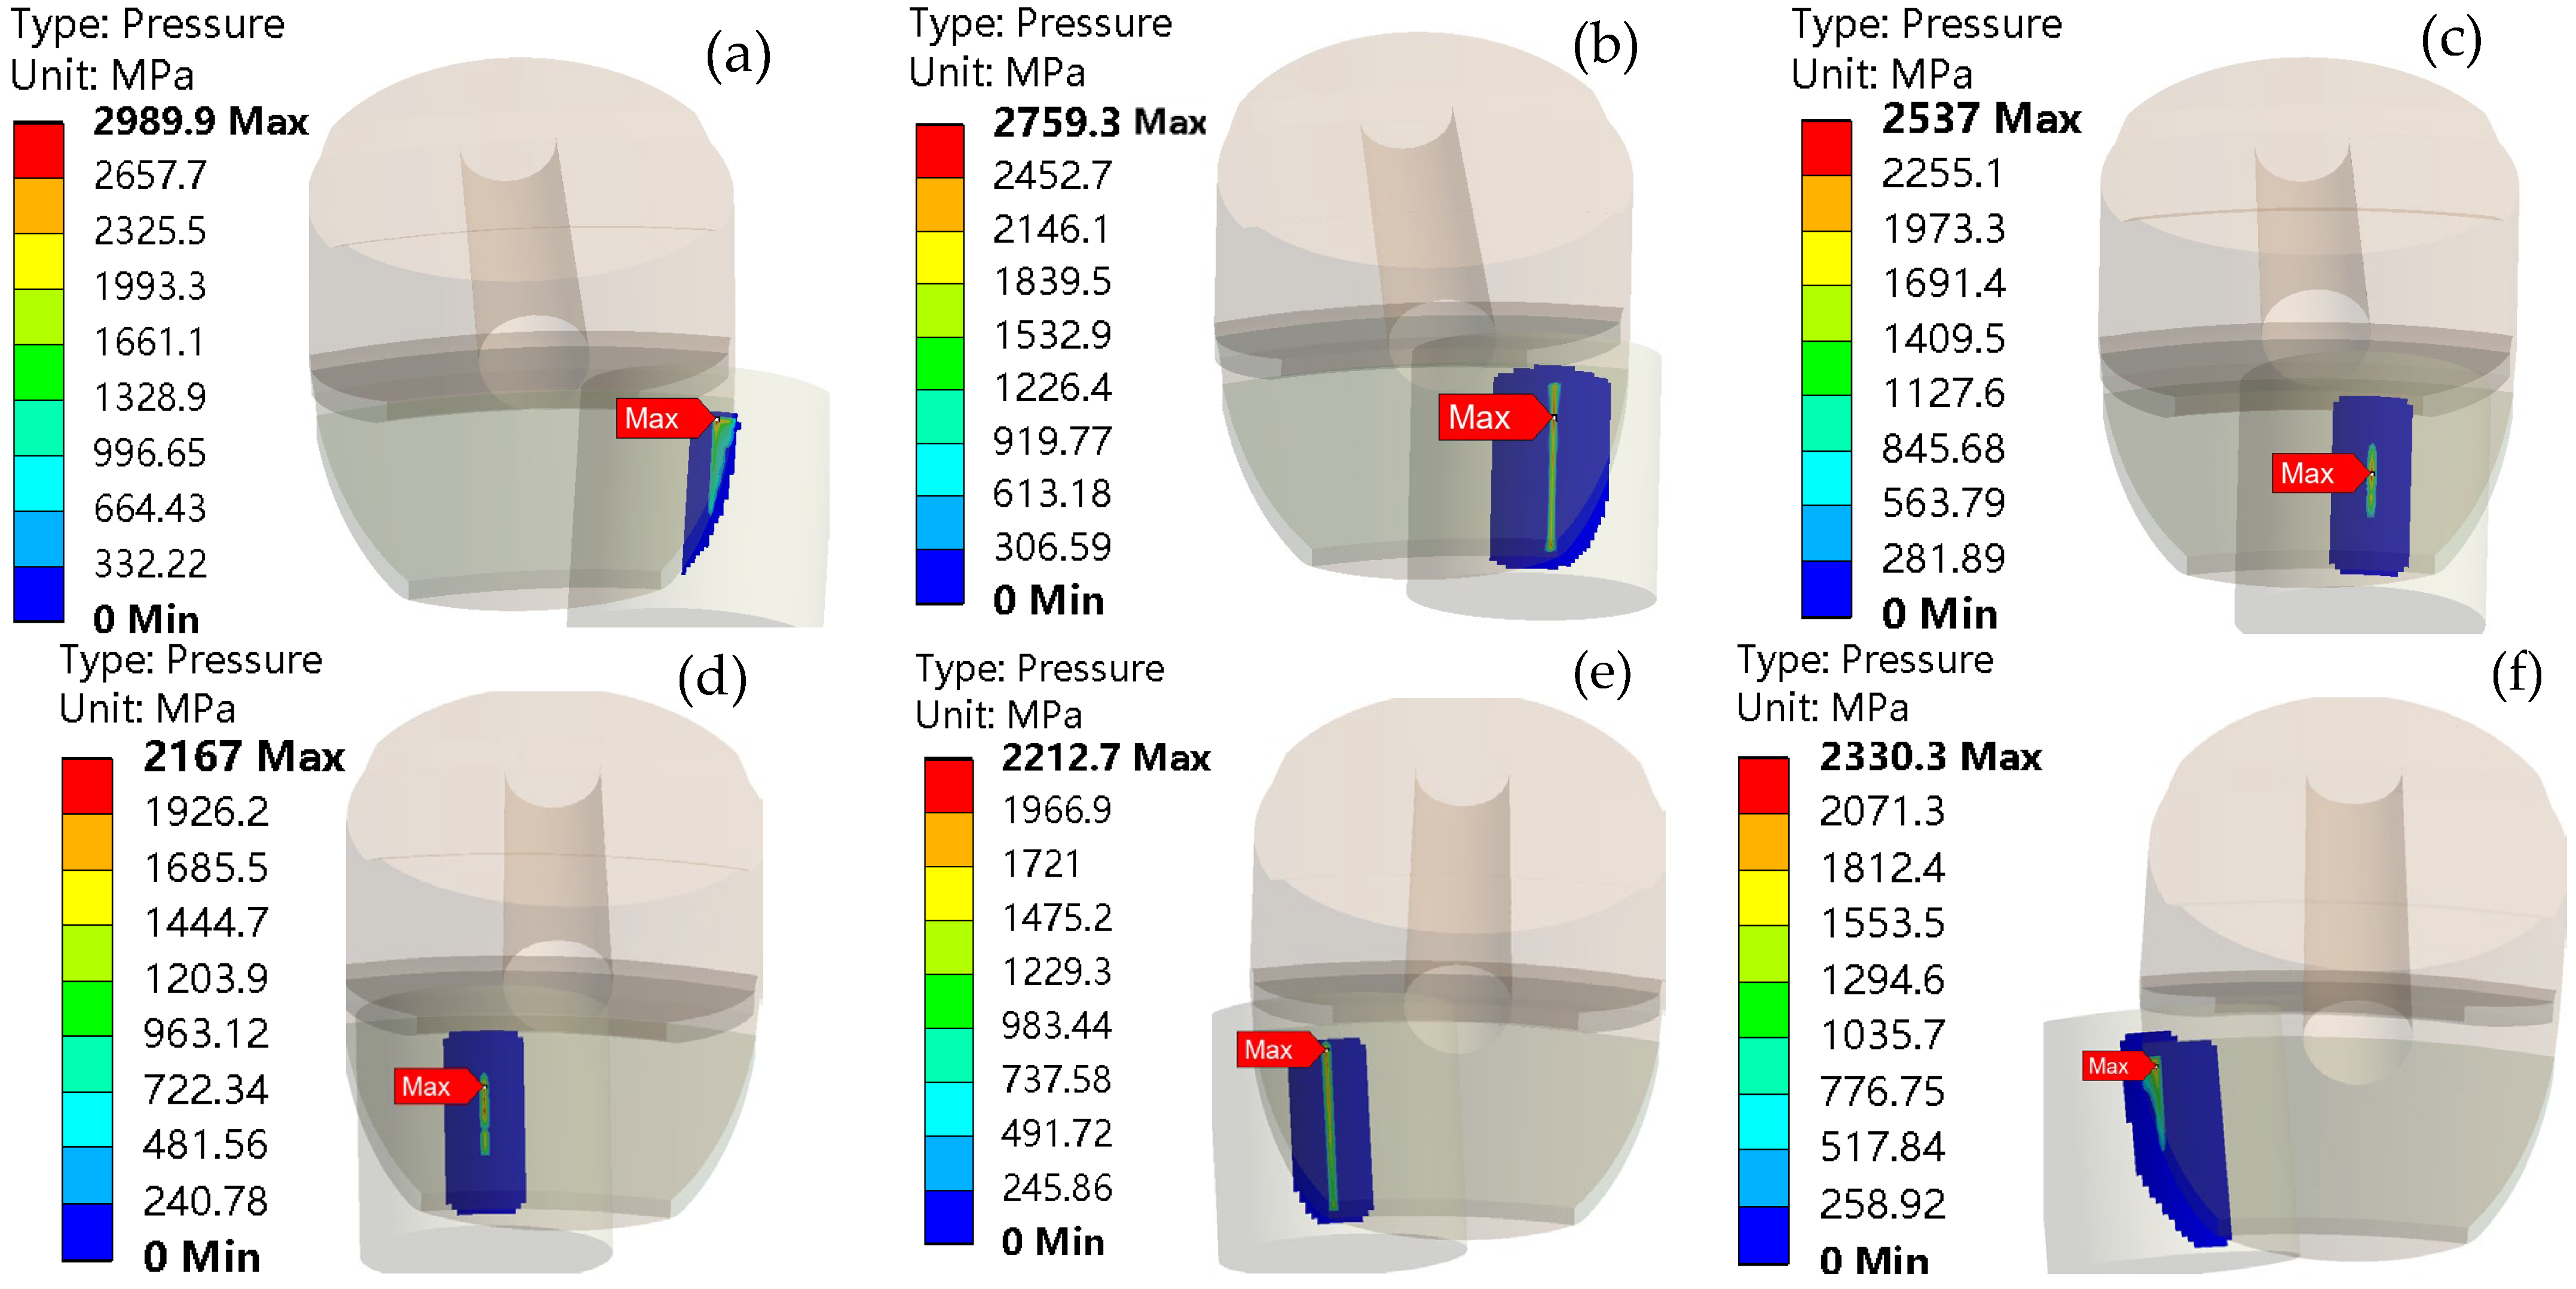
Figure 19 illustrates that during the movement of the roller across the plug surface, the contact pressure reaches its peak at t = 0.05 s, with a maximum value of 2989.9 MPa. As the roller continues to rotate, this maximum contact pressure shifts from a position near the plug to the middle of the plug and then returns to a location near the plug. Furthermore, as shown in Figure 20, the deformation displacement is greatest when the roller is at t = 0.05 s, with a maximum displacement of 0.0091471 mm. This maximum deformation displacement transitions from the contact surface of the busbar between the roller and the plug to the contact surface of the end face as the roller rotates.
According to the results obtained, and assuming that other factors remain constant, the contact pressure and deformation displacement of rollers and plugs initially decrease and then increase with the increase in sag and protrusion amounts. Specifically, when the protrusion amount of plugs is 1 μm, both the contact pressure and deformation displacement of the rollers and plugs reach their minimum values. At this position, the non-coincidence defect between raceways is significantly reduced compared to other positions, resulting in a decrease in the circularity of the entire raceway. This configuration has the least impact on the stability of bearing motion and is therefore the most suitable for the positioning and assembly of plugs. Additionally, it is advisable to minimize the use of the plug during the assembly process.

3.4. The Influence of the Amount of Plug Rotation Offset on the Stability of Motion

Figure 21 illustrates the structural diagram of the plug rotation offset. As depicted in Figure 21, the plug exhibits a rotation offset within the plug hole, following the direction indicated in the figure. The rotation angle of the plug corresponds to its rotation offset. Due to the positioning effect of the taper pin, the rotation offset angle of the plug is minimal, ranging from −1° to 1°. For subsequent research, four typical positions of the rotation offset have been selected within the narrower range of −0.3°, 0.3°, 0.5°, and 0.7°.
The four positions of the plug are numbered as indicated in Table 7. The simulation model for plug deflection has been solved and calculated to determine the contact pressure and deformation displacement at each of the four positions, as illustrated in Figure 22 and Figure 23.
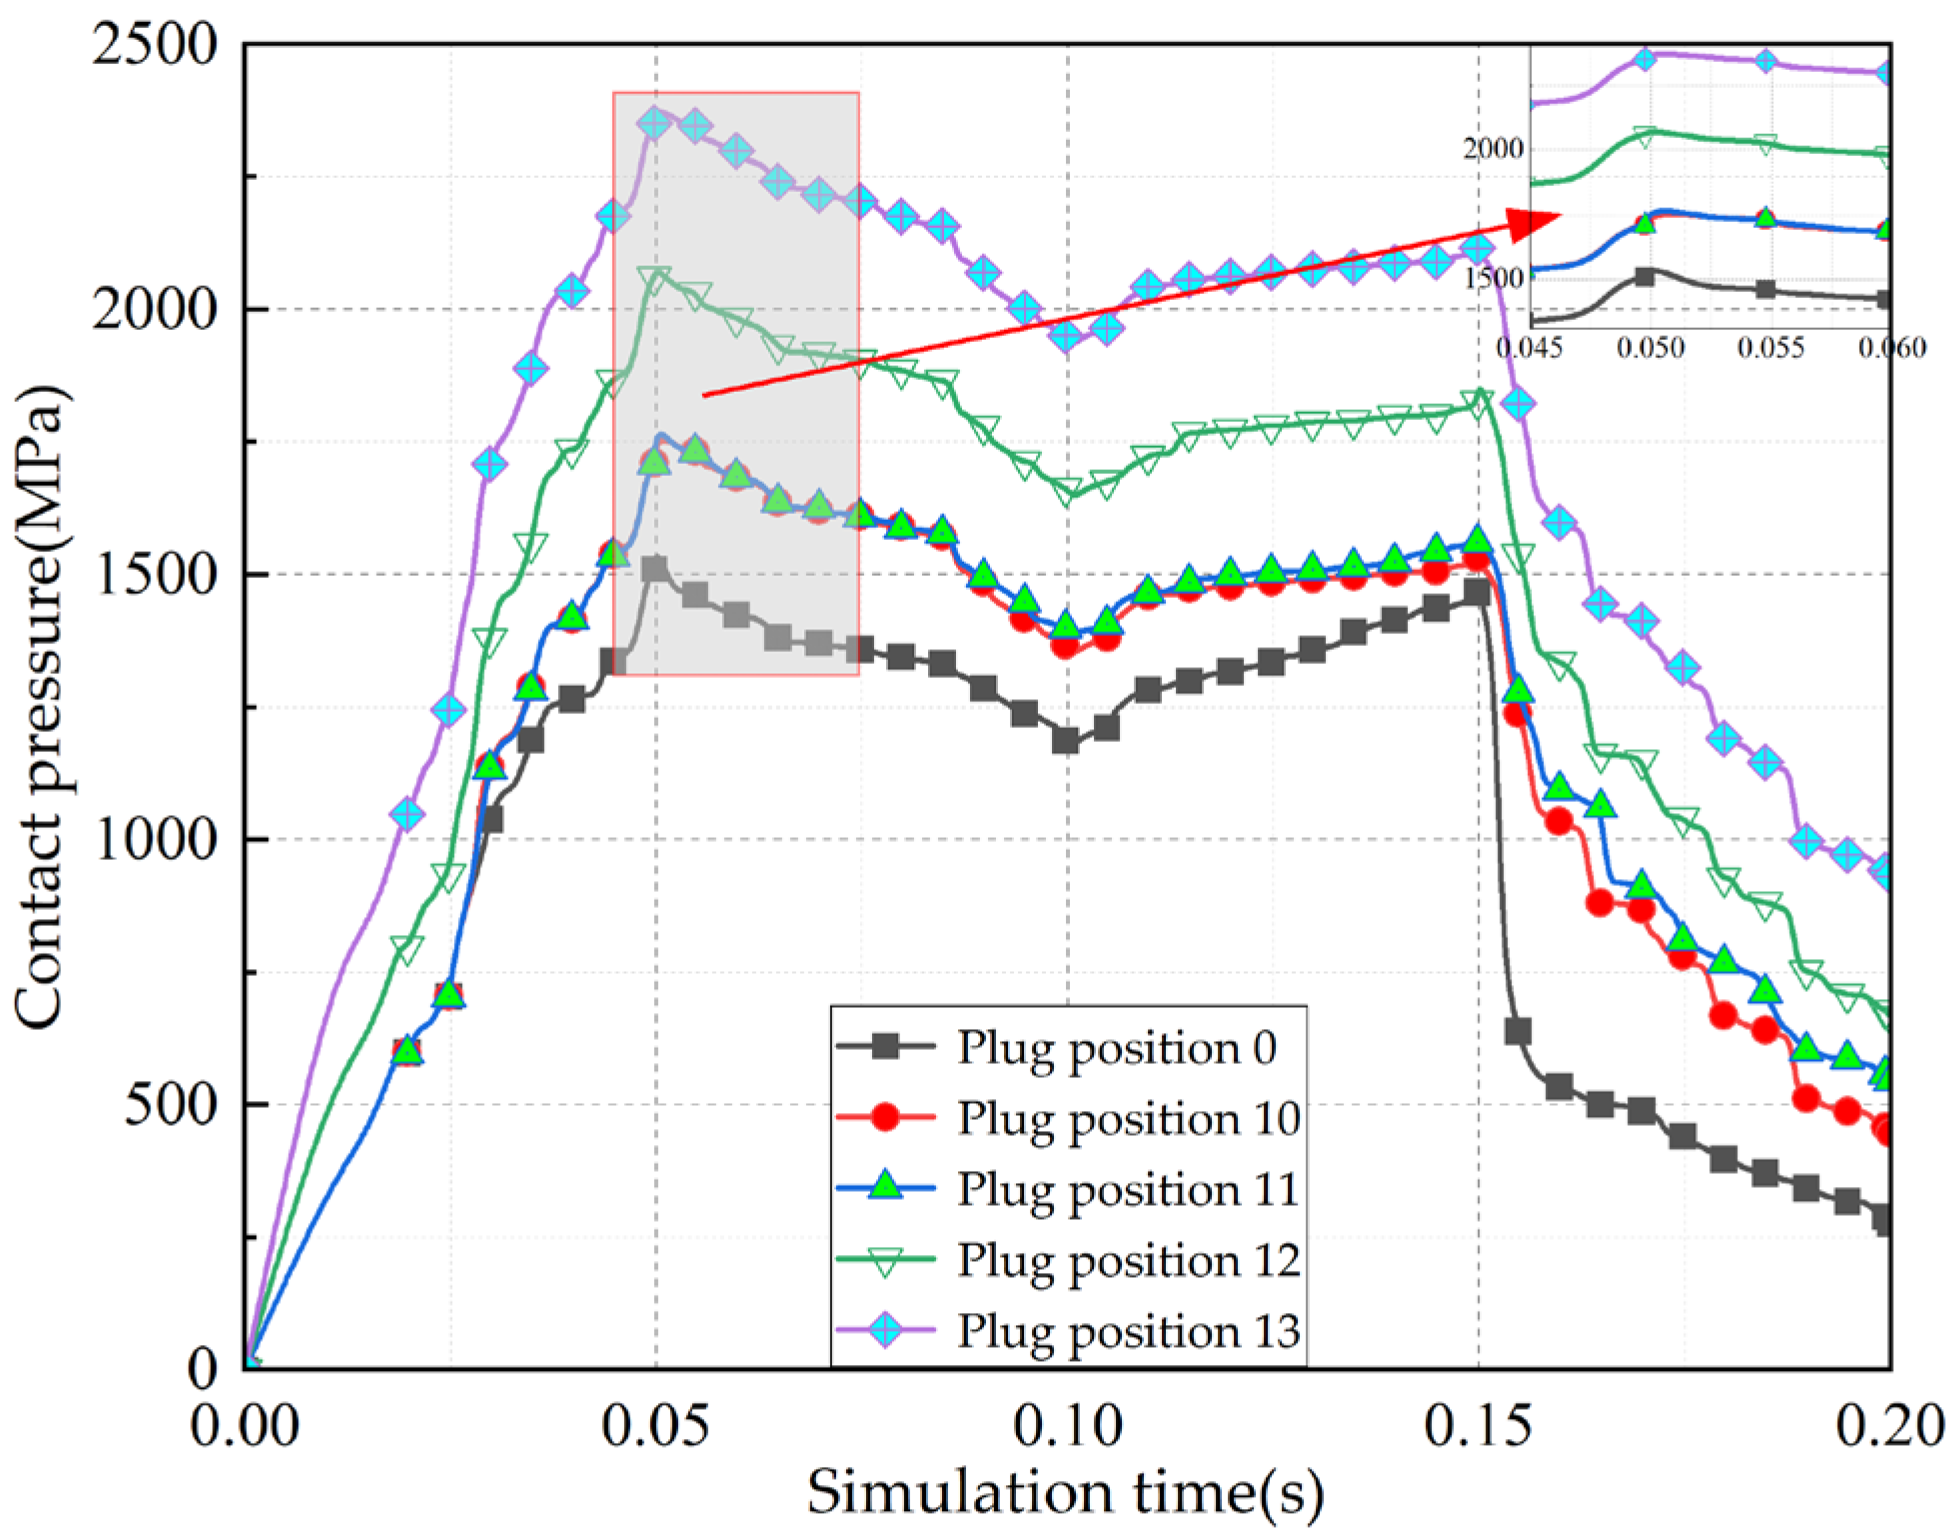
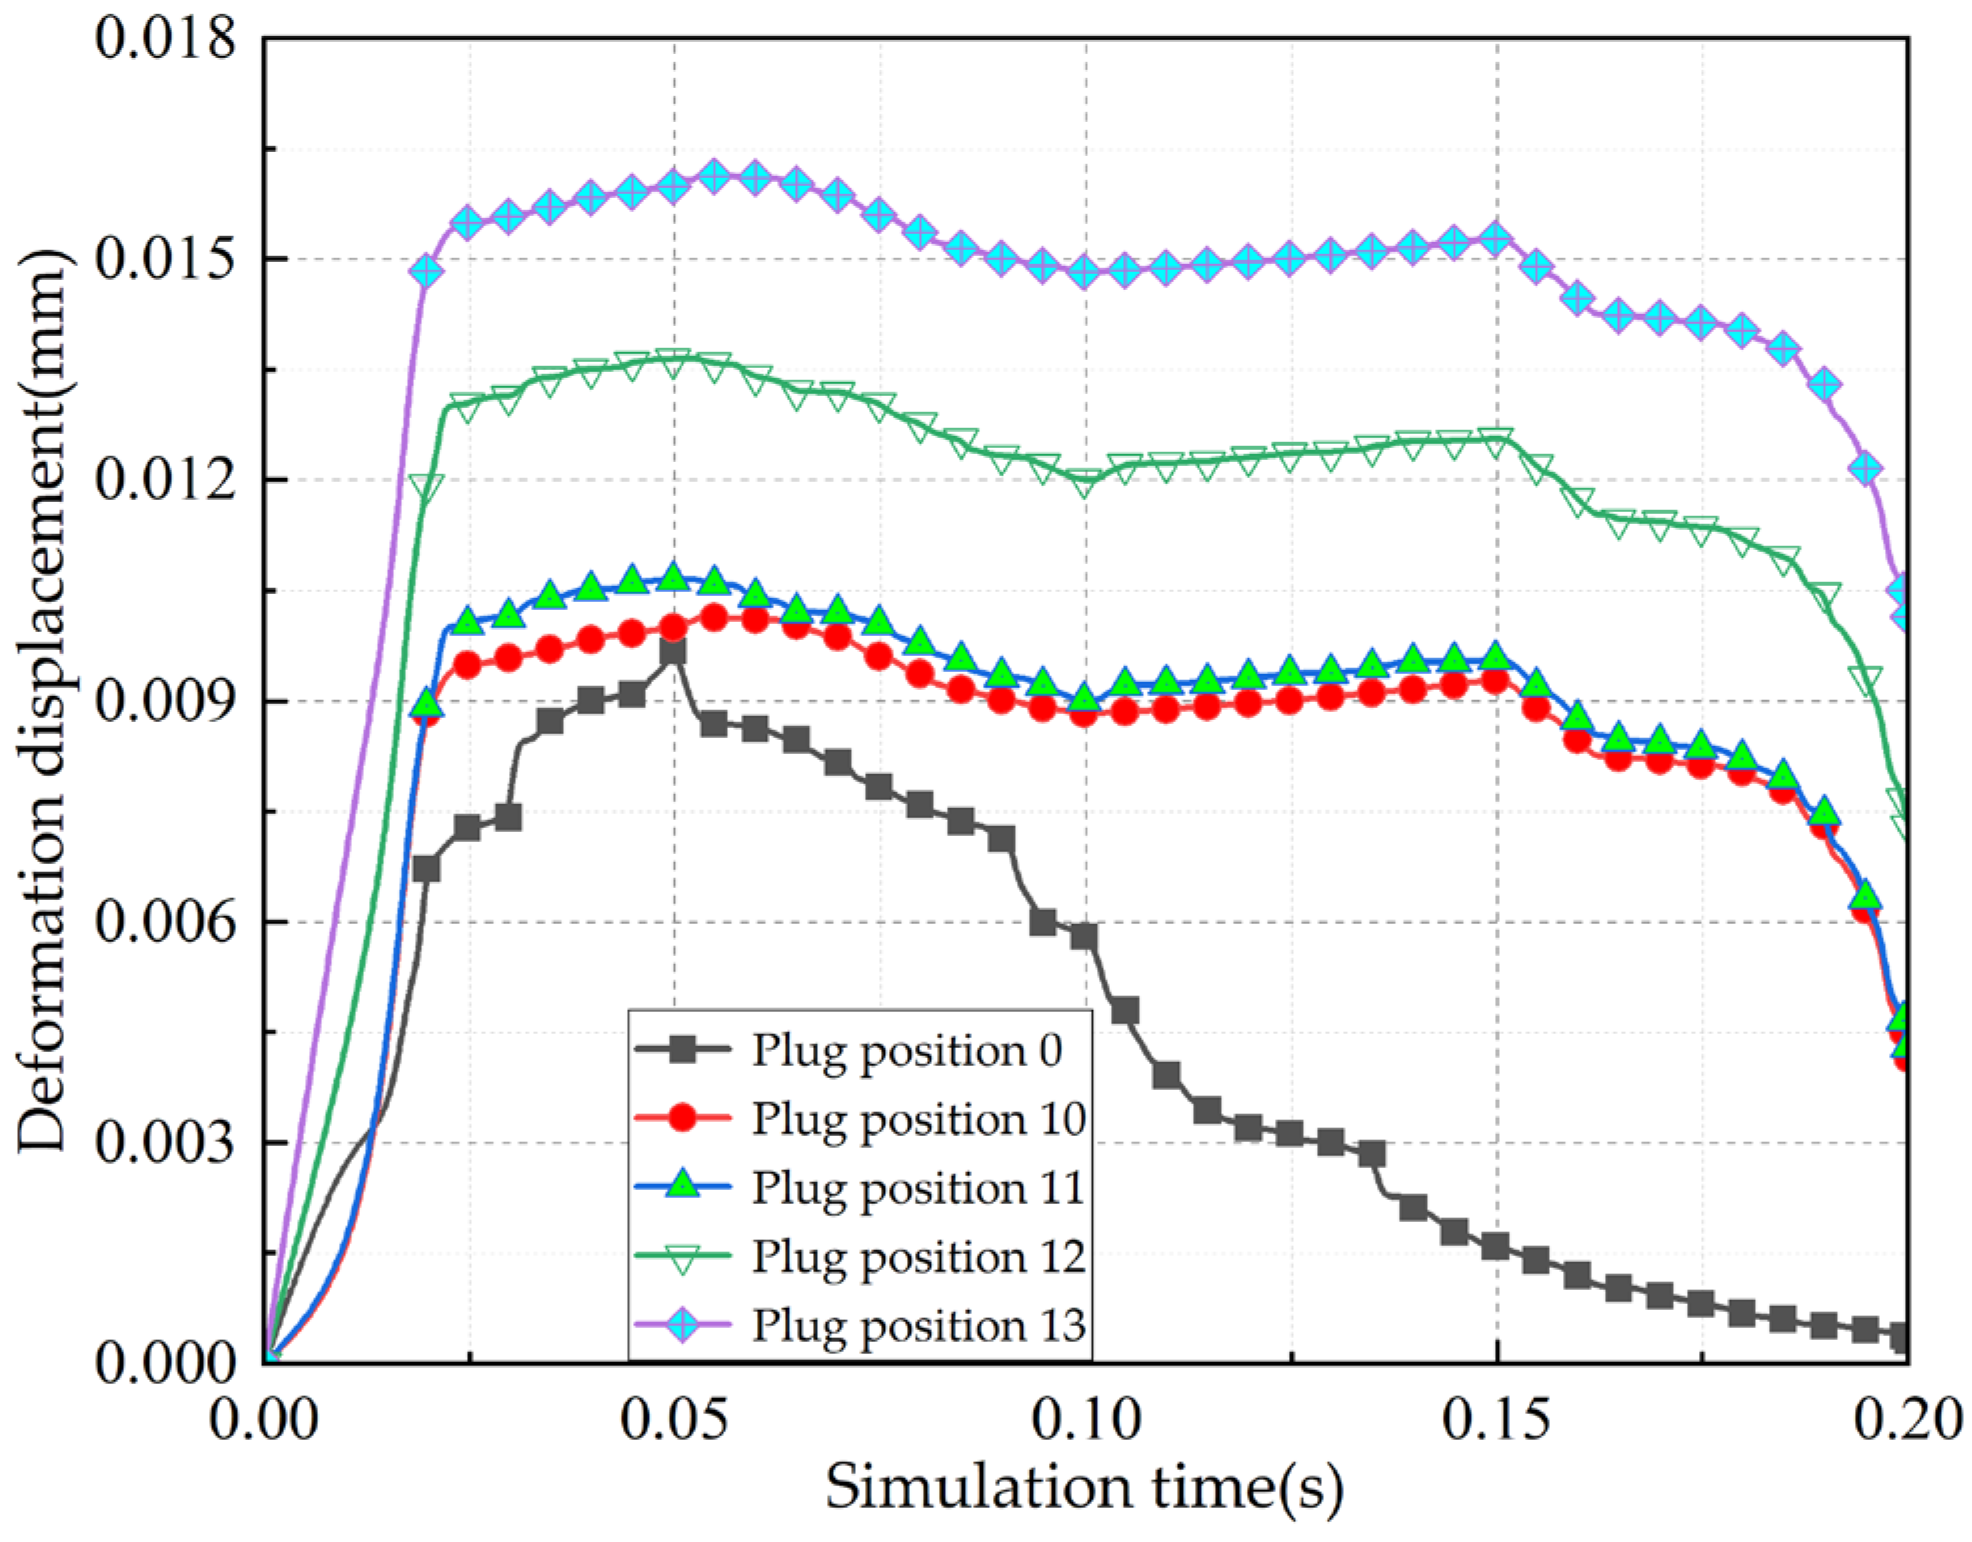
Figure 22 and Figure 23 illustrate the changes in contact pressure and deformation displacement of roller and outer ring raceway contact surface and roller and plug raceway contact surface, corresponding to various plug rotation offset amounts. From these figures, it is evident that as simulation time progresses, the contact pressure and deformation displacement between the roller and the raceway at the four positions of the plug gradually increase from t = 0 to 0.05 s. In the interval from t = 0.05 to 0.15 s, the contact pressure and deformation displacement at the four positions of the rotation offset of the plug initially decrease before subsequently increasing. Between t = 0.15 and 0.2 s, both the contact pressure and deformation displacement gradually decline. These observations can be attributed to the fact that an increase in the deflection of the plug directly leads to a misalignment between the raceway surfaces of the plug and the outer ring. This misalignment results in reduced roundness accuracy of the entire raceway, thereby altering the trajectory and behavior of the roller as it enters and exits the contact surface of the plug. Consequently, this affects the normal stability of roller movement, leading to increased contact pressure and deformation displacement between the roller and the plug.
By comparing the contact pressure and deformation displacement at four positions of the plug, it is evident that there is minimal difference between the contact pressure and deformation displacement at plug positions 11 and 10. This observation suggests that the change in the direction of the deflection amount is not the primary factor influencing the variations in contact pressure and deformation displacement at the interface between the plug and the raceway. However, during the assembly process, if the plug is not positioned correctly, it may experience a rotational offset. While some of this offset can be corrected upon inserting the taper pin, the precision of both the taper pin and the taper pin hole may still result in a residual rotational offset. This small degree of rotational offset can adversely affect the roundness of the entire raceway and compromise the motion stability of the bearing. Consequently, it is crucial to minimize the deflection amount of the plug to ensure the stability of the bearing.
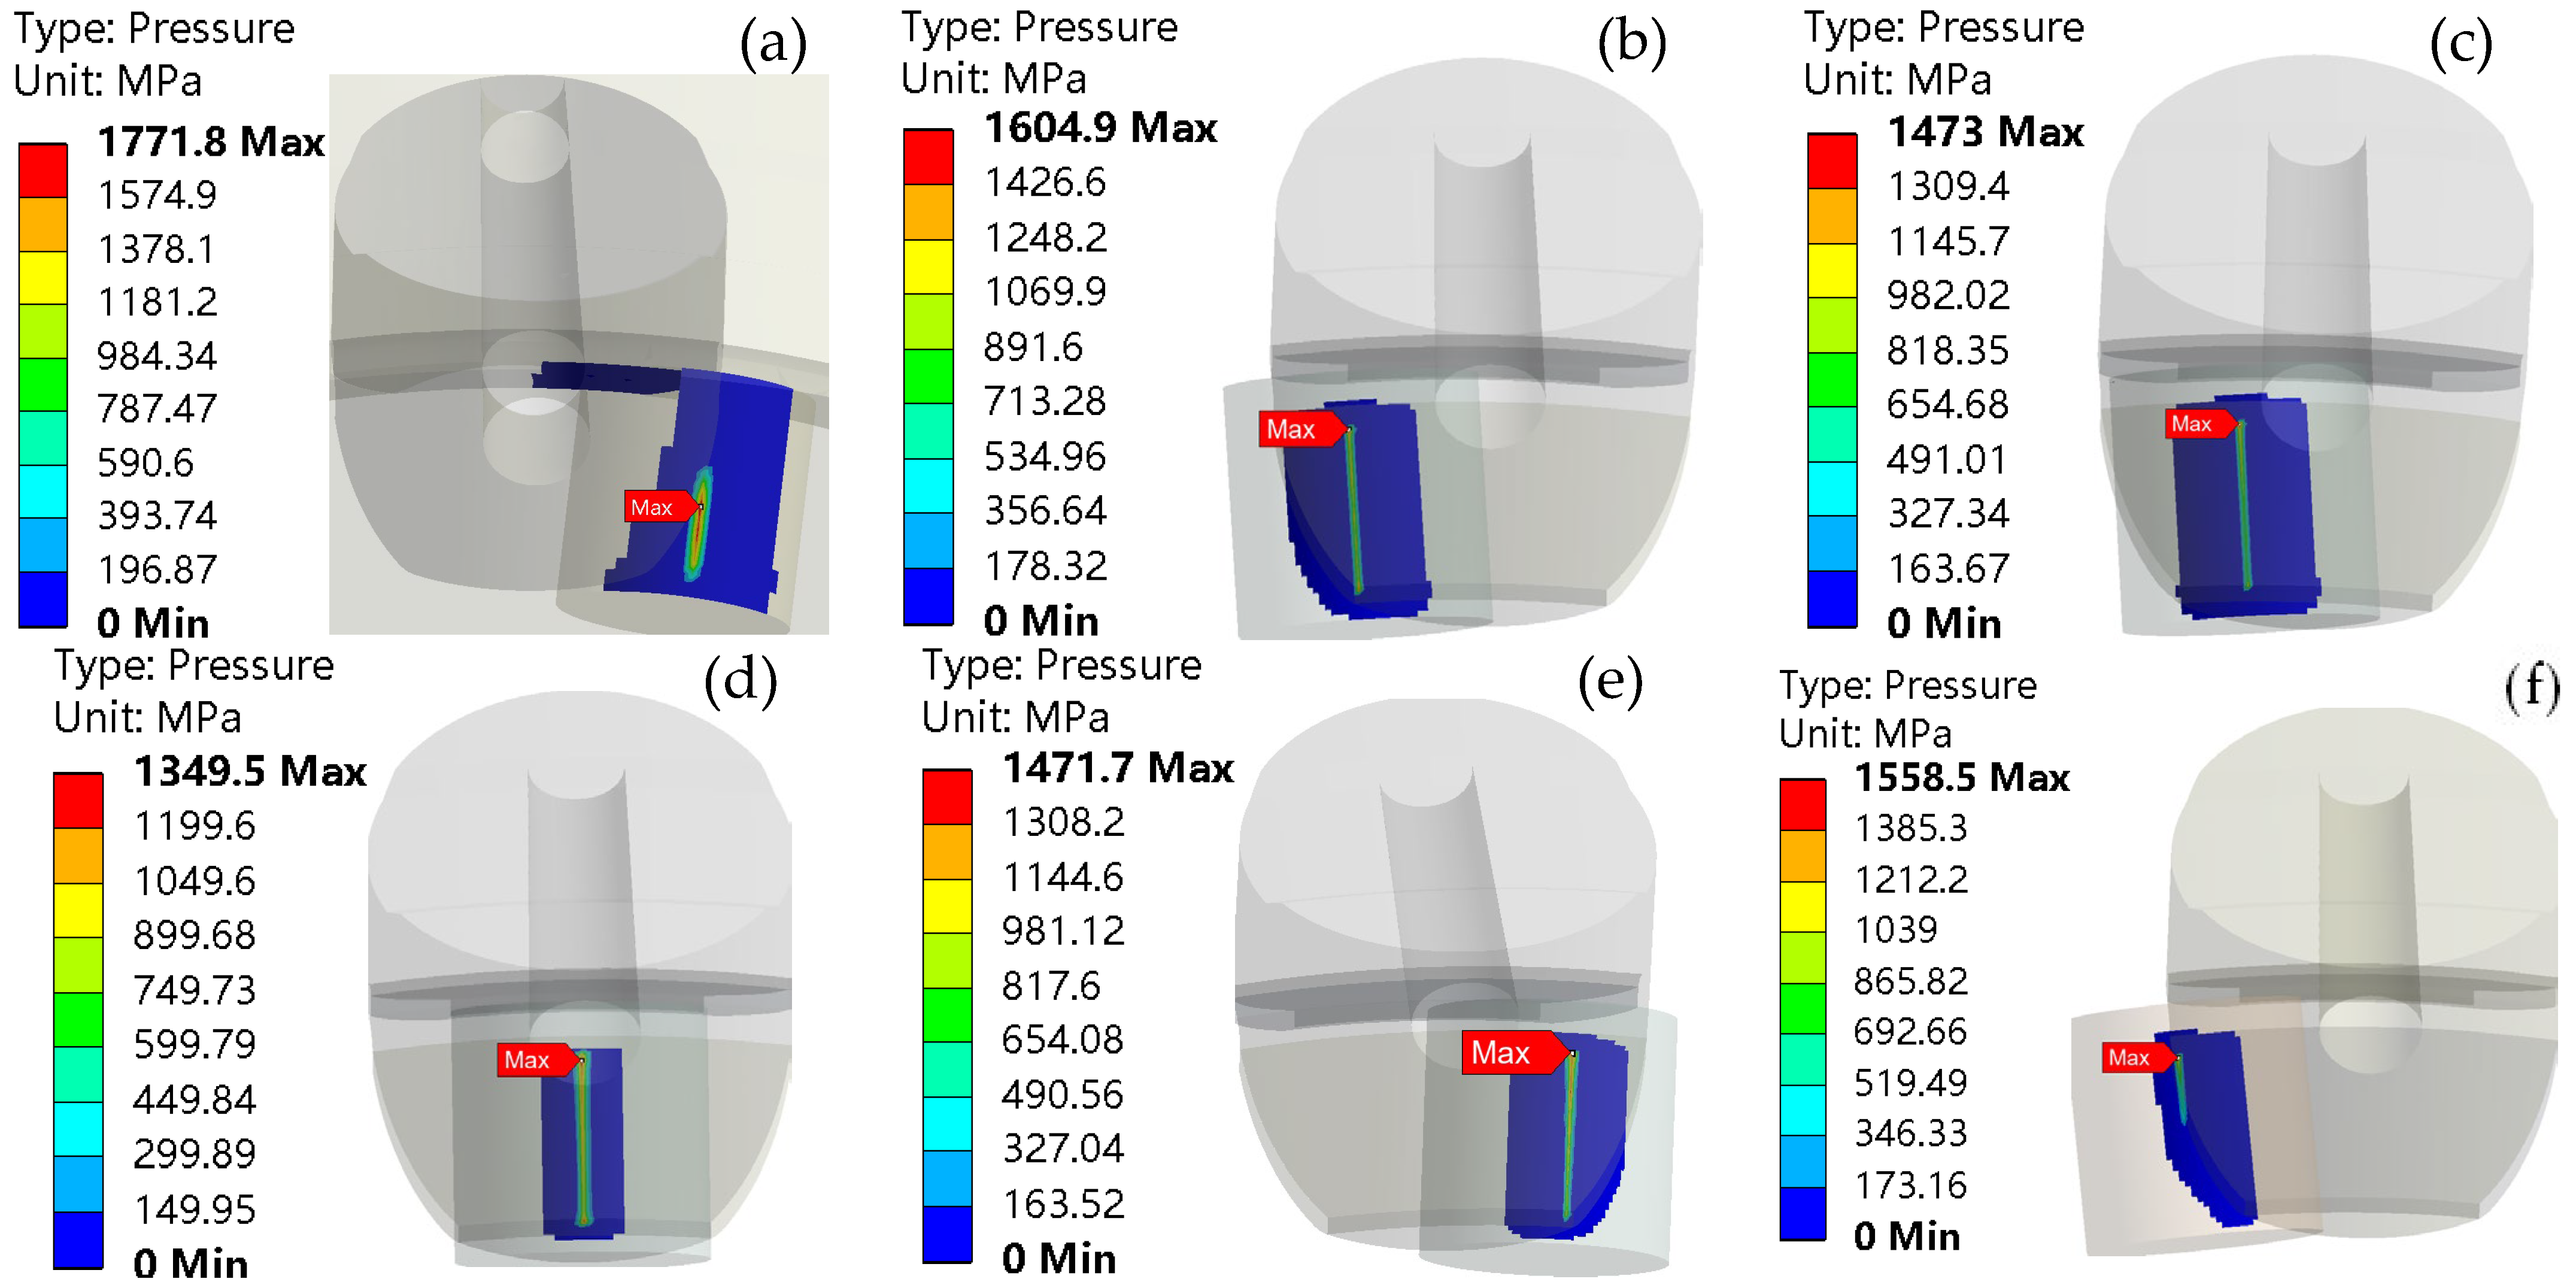
To clearly illustrate the contact and deformation changes between the roller and the plug, panels (a) through (f) in Figure 24 and Figure 25 depict the contact pressure field and deformation displacement field at the plug position 10 during the six intermediate moments from t = 0.05 s to t = 0.15 s.
As illustrated in Figure 24, the maximum contact pressure occurs when the roller is positioned at t = 0.05 s, reaching a peak value of 1771.8 MPa. With the roller’s rotation, this maximum contact pressure shifts from the central region of the plug to an area adjacent to the oil ditch. Furthermore, as depicted in Figure 25, the largest deformation displacement also occurs at t = 0.05 s, with a maximum value of 0.014532 mm. This maximum deformation displacement transitions from the linear contact surface between the roller and the plug to the circular contact surface as the roller continues to rotate.
According to the results presented, when other factors are held constant, the quantity of rotation of the plug directly influences the roundness of the raceway, while the direction of rotation has a negligible effect on this roundness. As the rotation quantity of the plug increases, both the contact pressure and the deformation displacement of the plug also rise. Therefore, during the assembly process, it is essential to minimize the rotation of the plug to reduce its impact on the smoothness of bearing movement.

4. Test Verification of Plug Position and Fit on Motion Stability

4.1. Test Equipment and Test Principle

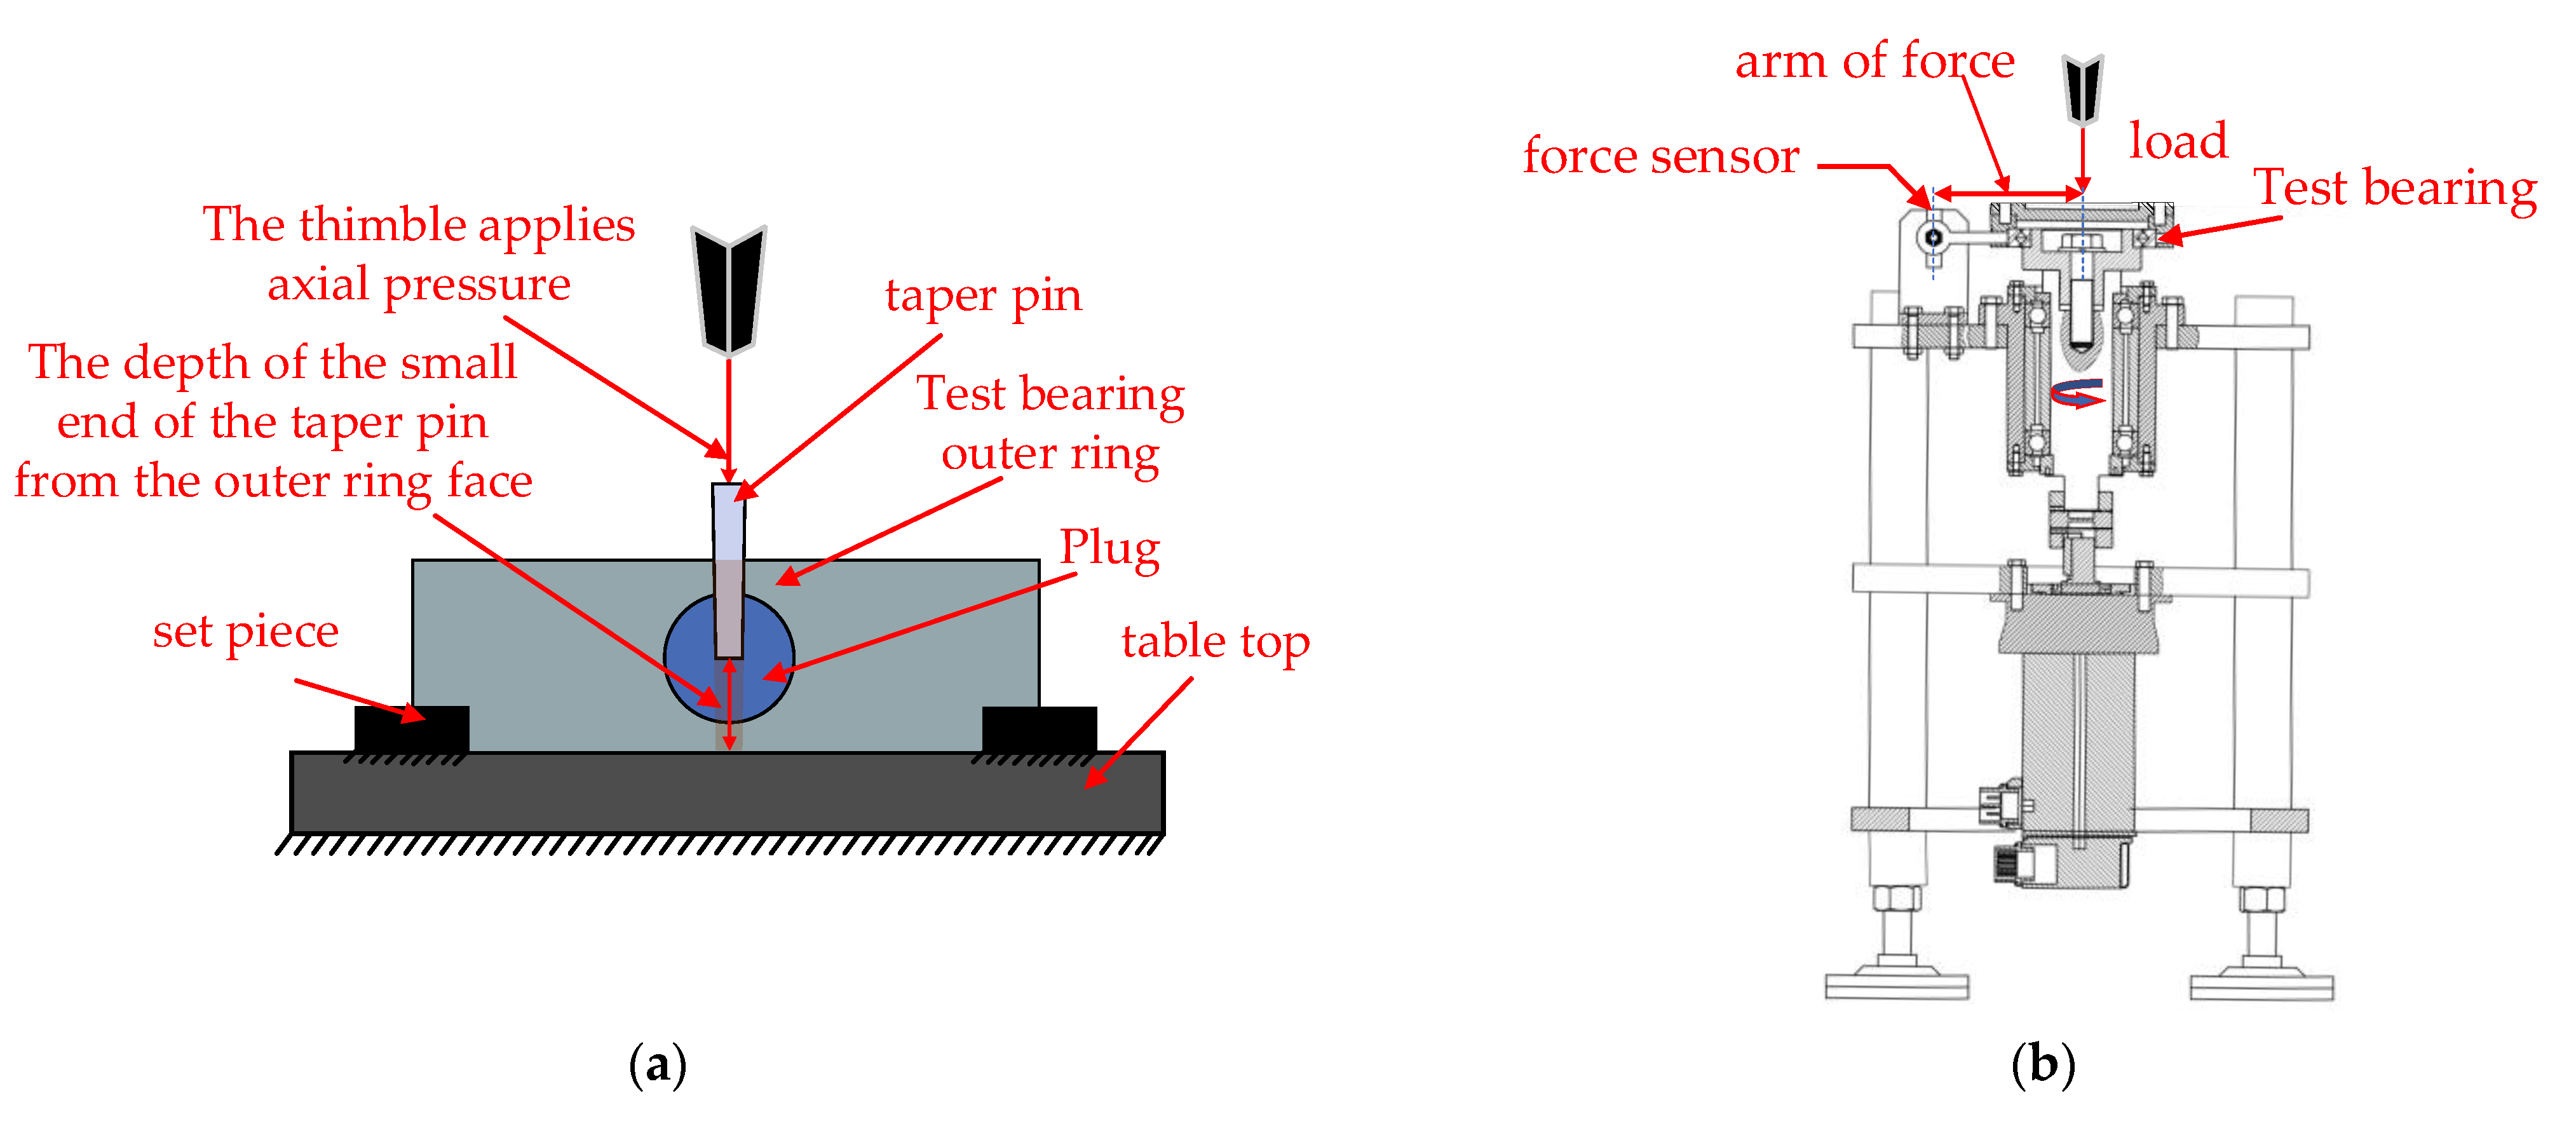
The test instrument and test principle are illustrated in Figure 26. Figure 26a depicts the test bearing press. To conduct the test, place the bearing on the working table of the press and adjust the positioning block accordingly. Once the taper pin and thimble are aligned, different pressures can be input through the control system to enable the thimble to apply varying axial pressures to the test bearing cone pin, thereby controlling the position of the bearing cone pin. Figure 26b presents the friction torque testing machine. During the measurement of friction torque, the bearing is positioned on the test bench, and the loading disc is placed above it. The load is applied to the test bearing via the gravitational force of the loading disc.

4.2. Test Scheme and Result Analysis

4.2.1. Analysis of Test Results of Taper Pin Position and Plug Clearance

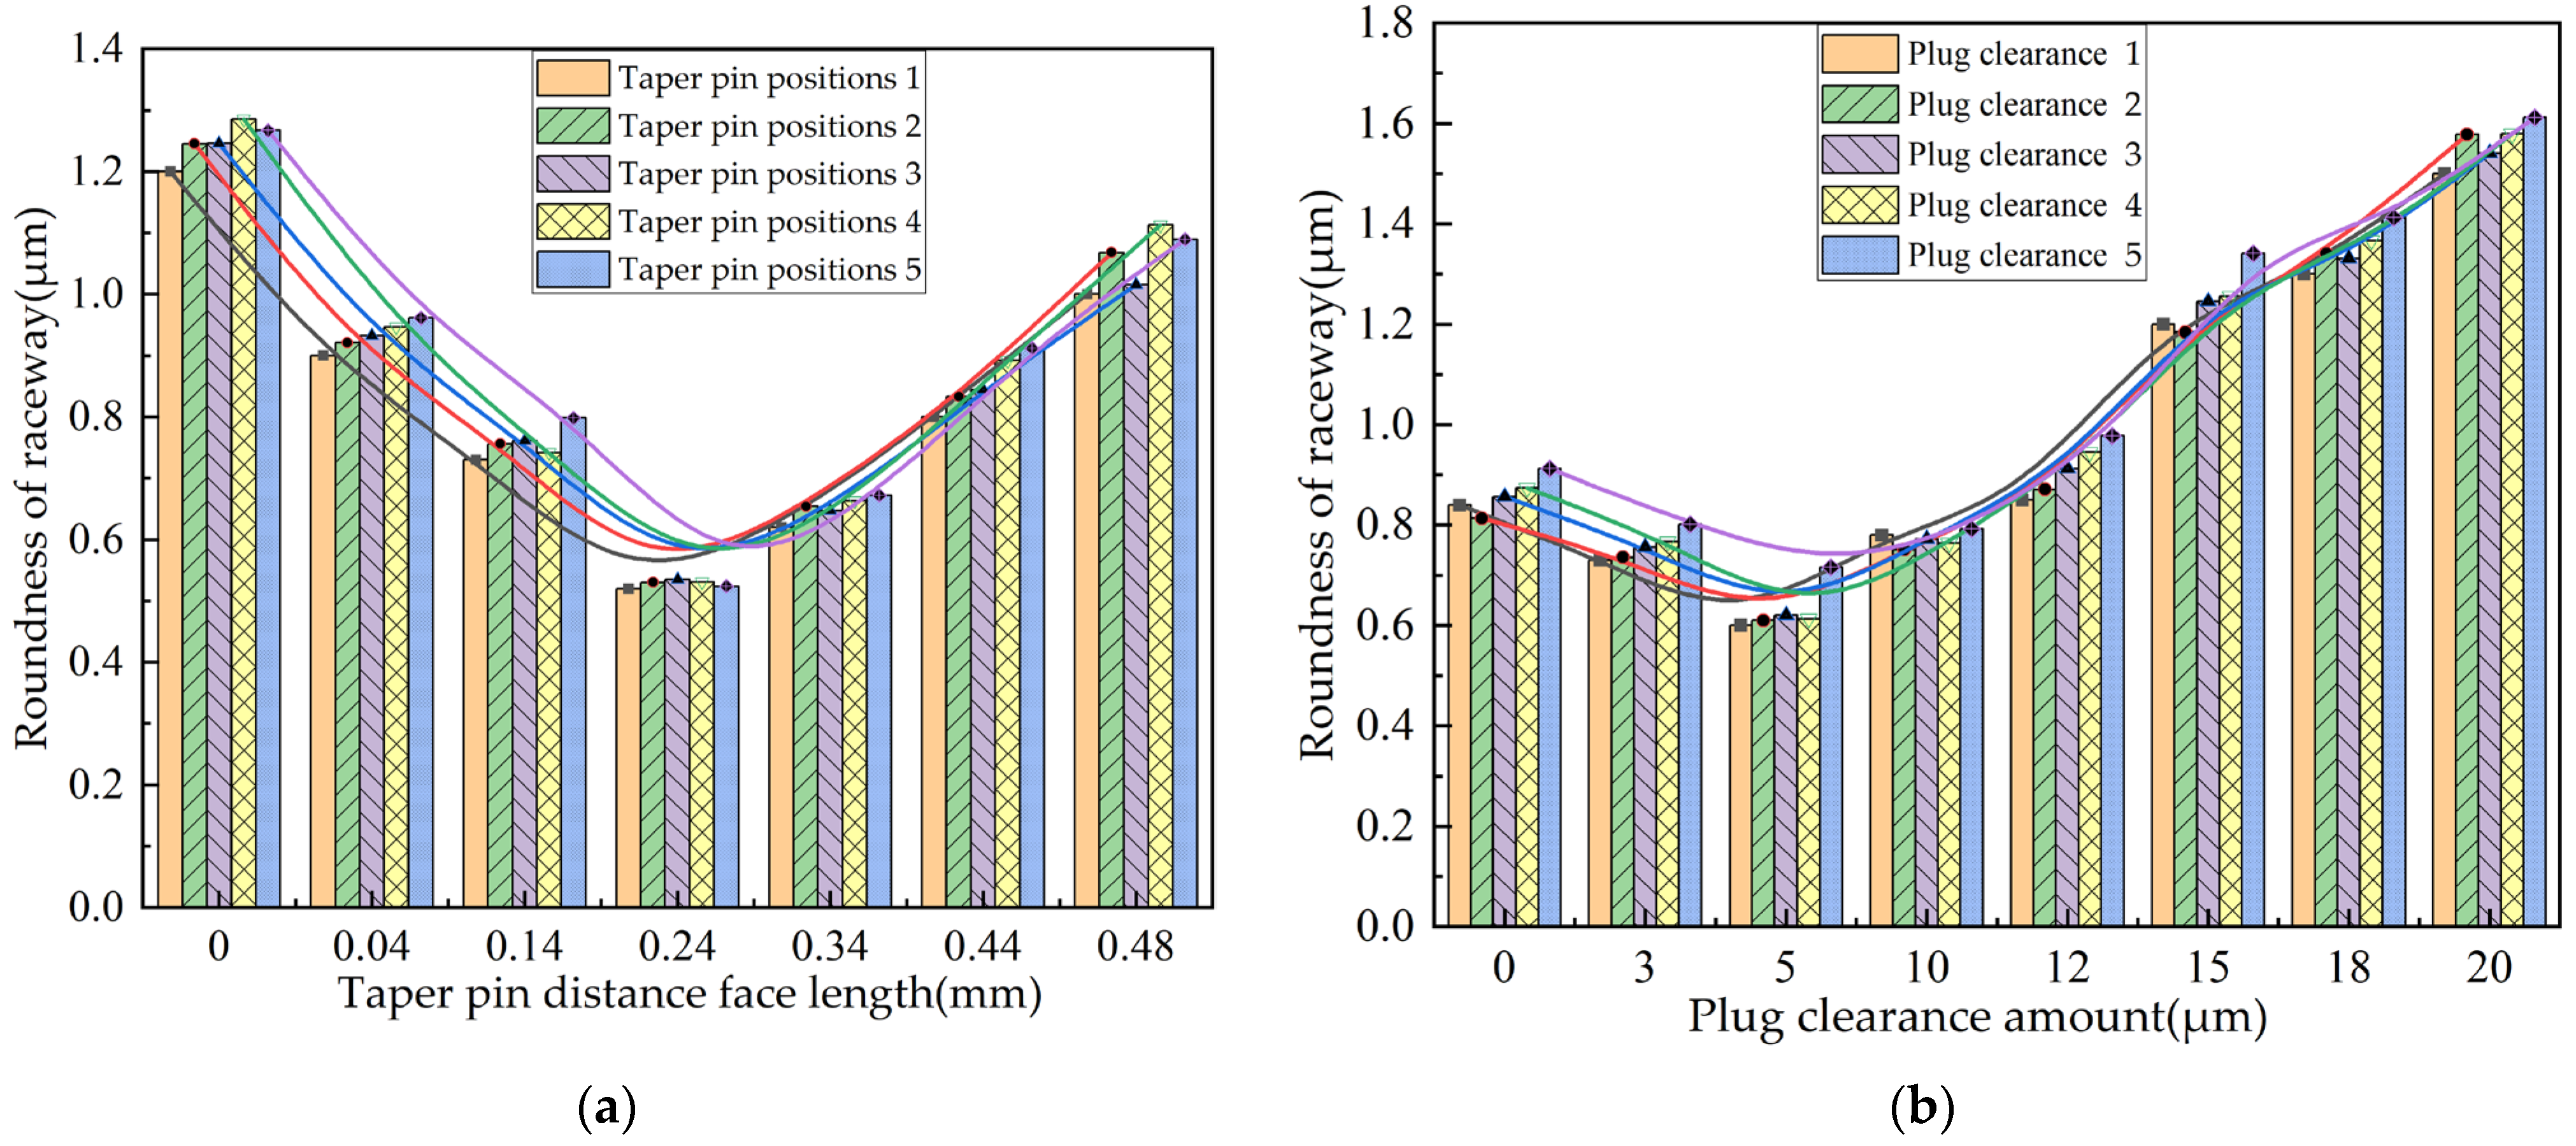
In this test, a total of 10 sets of unassembled test bearings were randomly selected, numbered according to five taper pin positions and five plug clearances. The five sets of test bearing outer rings and plugs were assembled at the taper and pin positions and subsequently placed into the test bench. The press depicted in Figure 26a was utilized to control the depth of the taper and pin by regulating the pressure. After fine grinding and adjusting the clearance of the plugs, the five sets of test bearings were inserted into the bearing outer rings. The raceway roundness of all 10 sets of bearing outer rings was measured, resulting in the data structure illustrated in Figure 27.
As illustrated in the test data results shown in Figure 27a, the roundness of the bearing raceway initially decreases and subsequently increases as the depth of the taper pin in the taper pin hole increases. Excluding accidental factors from the test, it is evident that both excessively deep and shallow positions of the taper pin can adversely affect the roundness of the raceway. An excessively deep taper pin position may prevent the plug from being fully seated, thereby compromising the roundness of the raceway surface. Conversely, a taper pin positioned too shallow can result in incorrect or defective positioning of the plug, which will also negatively impact the roundness of the raceway surface.
As illustrated by the test data results in Figure 27b, the roundness of the bearing raceway exhibits a trend of initially decreasing and then increasing with the increase in plug clearance. Notably, the roundness accuracy of the bearing raceway is optimal when the plug clearance ranges between 3 and 9 μm. The tests indicate that an excessively large plug clearance prevents the plug from being fully positioned, which adversely affects the roundness of the raceway surface. Conversely, if the plug clearance is too small, incorrect positioning of the plug may occur during the assembly process, thereby impacting the roundness of the raceway.
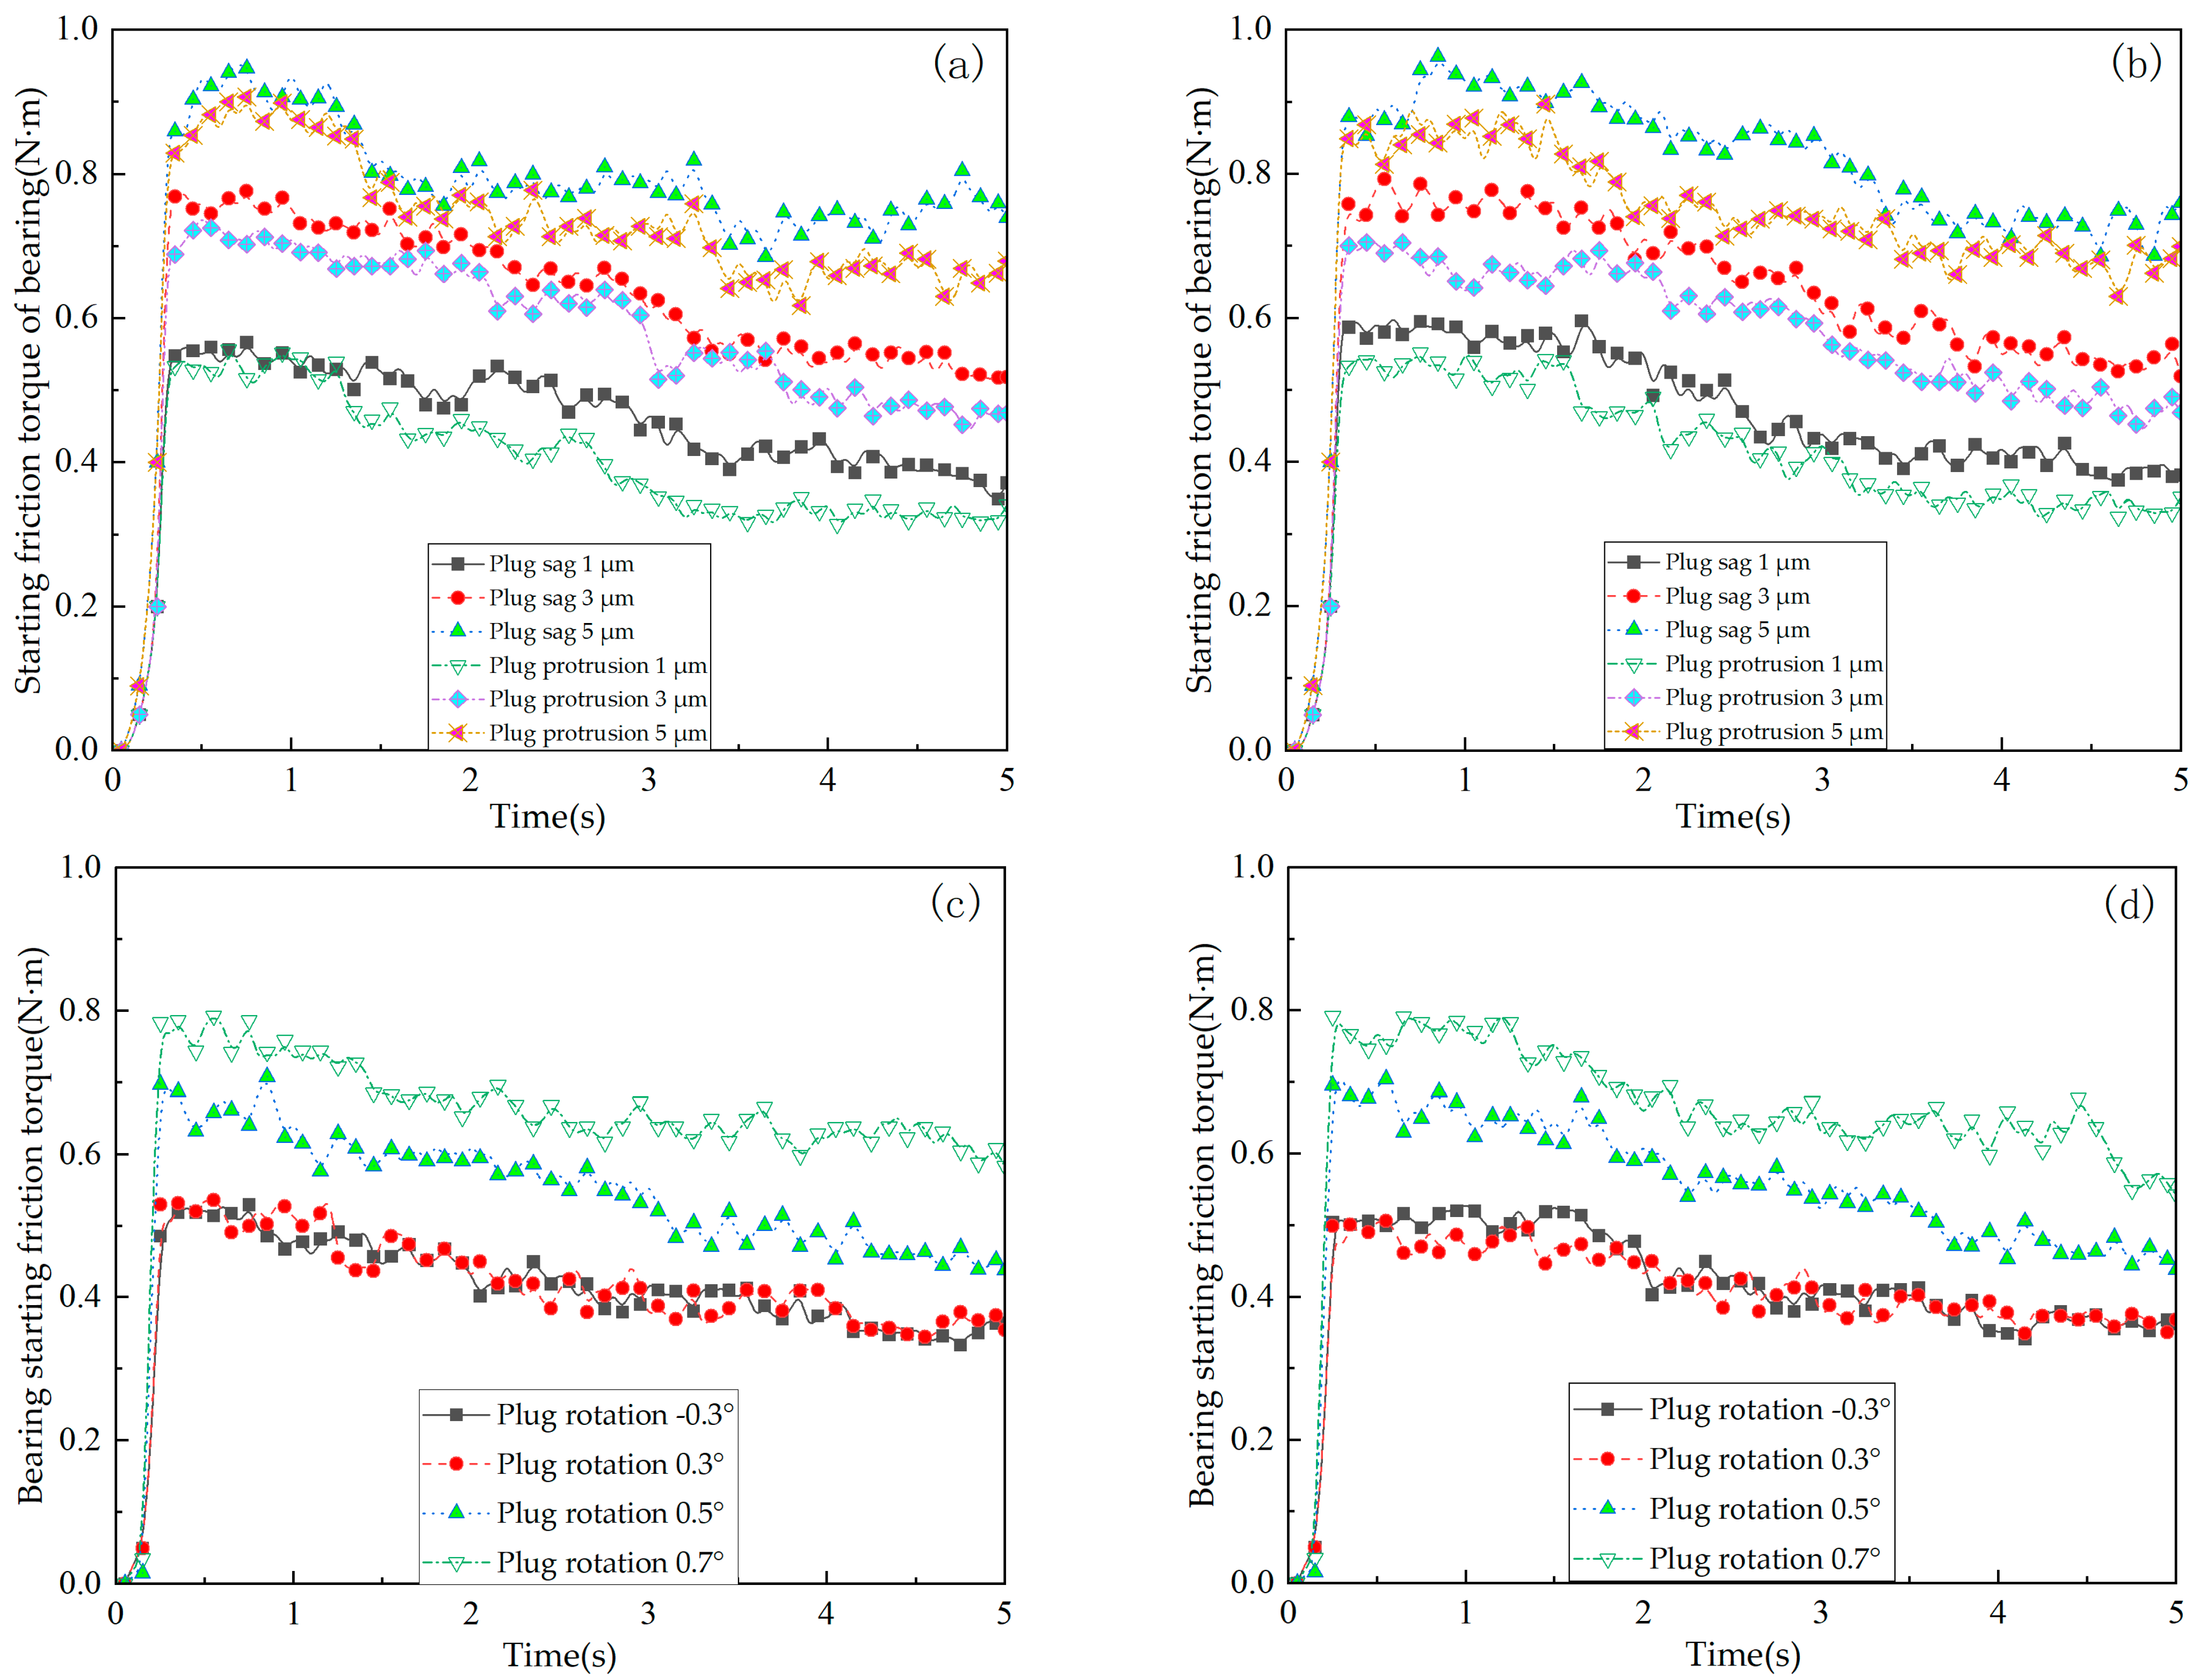
The four sets of bearings at cone and pin positions 1 and 2, as well as plug positions 1 and 2, were subjected to testing. Following adjustments to the positions of the taper pin and plug, the inner ring and roller were assembled and placed into a friction torque test bench, where measurements of the starting friction torque were conducted at a constant rotation speed of 30 r/min. As illustrated in Figure 28, the starting friction torque for the four sets of bearings was measured over a 5-second period, focusing on various taper pin and plug positions. Figure 28a,b indicate that as the taper pin position deepens, the starting friction torque for the two sets of bearings at taper pin positions 1 and 2 initially decreases before subsequently increasing. The smallest starting friction torque occurs at the midpoint of the taper pin, indicating the most stable bearing movement. Furthermore, Figure 28c,d demonstrate that as plug clearance increases, the starting friction torque for the two sets of bearings at plug positions 1 and 2 also initially decreases and then increases. Notably, when the plug clearance is set to 5 μm, the starting friction torque reaches its minimum, corresponding to the most stable bearing movement.
The results of the taper pin position tests are compared with the simulation outcomes. Overall, the simulation results are largely consistent with the test findings. When the taper pins are in the middle position, the contact pressure and deformation displacement between the roller and the plug are minimized, leading to the smallest roundness of the bearing raceway and the lowest friction torque, which in turn results in the most stable bearing movement. Additionally, the results of the plug position tests are compared with the simulation outcomes. It is observed that bearing motion stability is optimized when the plug matching clearance is 0 μm in the simulation results, whereas the best stability in the test results occurs at a plug matching clearance of 5 μm. This discrepancy indicates that the simulation results exhibit a certain deviation from the test results. The underlying reason for these findings is that a small amount of matching clearance between the plug and the plug hole during the bearing assembly process enhances the assembly accuracy of the plug. This improvement in assembly accuracy subsequently contributes to increased motion stability of the bearing. Consequently, the most stable bearing movement is achieved when the plug matching clearance is 5 μm.

4.2.2. Analysis of Test Results of Sag Protrusion and Rotation Offset of Plug

Ten sets of unassembled bearings, all of the same type and size as those used in the previous test, were randomly selected for this experiment. These sets were designated as plug sag 1–5 and plug rotation 1–5. After sequentially adjusting the position of the plug, the outer ring and plug of the test bearing were assembled and placed onto the test bench. The roundness of the raceway of the ten outer ring sets was measured, resulting in the data presented in Figure 29.
As illustrated in the test data presented in Figure 29a, the roundness of the bearing raceway initially decreases and subsequently increases with the increase in plug sag. The roundness accuracy of the bearing raceway is optimal when the plug sag is between −3 and 1 μm. A comparison of the sag and protrusion of the plug reveals that the roundness accuracy of the raceway is greater when the plug is protruding compared to when it is depressed.
As illustrated by the test data results in Figure 29b, the roundness of the bearing raceway increases progressively with the rotation of the plug. Additionally, it was observed that the direction of rotation of the plug has minimal impact on the roundness of the bearing raceway.
The four sets of bearings, categorized by plunger sag (1 and 2) and plunger rotation (1 and 2), were subjected to testing. Following the adjustment of the plunger’s position, the inner ring and roller were assembled and subsequently placed into the friction torque test bench, which operated at a constant rotational speed of 30 r/min. The measurement of the starting friction torque was conducted as illustrated in Figure 30. The results indicated that the starting friction torque of the four sets of bearings, under varying plunger sag protrusions and rotations over a duration of 5 s, is depicted. As shown in Figure 30a,b, the starting friction torque for bearings 1 and 2 initially decreases and then increases with the increase in plunger sag. Notably, when the plunger protrudes by 1 μm, the starting friction torque of the bearing reaches its minimum, resulting in the most stable bearing movement. Furthermore, Figure 30c,d demonstrate that as plunger rotation increases, the starting friction torque for the two sets of bearings at plunger positions 1 and 2 gradually rises. The minimum starting friction torque occurs at a plunger rotation of 0.3°, corresponding to the most stable bearing movement.
The experimental results of plug sag protrusion and rotation offset are compared with the simulation results, which show a high degree of consistency. In the simulation, the contact pressure and deformation displacement between the roller and the plug reach their minimum values when the corresponding position for the protrusion and rotation offset of the plug depression is 0 μm. Similarly, the test results indicate that the position associated with the smallest roundness of the bearing raceway and friction torque also occurs at a protrusion and deflection of the plug depression of 0 μm. This suggests that the bearing contact state is optimal and that bearing movement is most stable when the sag protrusion and rotation offset of the plug are at 0 μm.
In the process of bearing assembly, it is essential to maintain the taper pin in a central position, regulate the plug matching clearance to approximately 5 μm, and ensure that both the amount of sag protrusion and rotation offset of the plug are 0 μm. These measures are crucial for ensuring that the bearing exhibits optimal stability during operation.

5. Conclusions

This paper focuses on a specific type of integrated cross roller bearing as the research object. A finite element calculation model of the bearings was established, considering various plugging positions and matching relationships. The model was solved using Ls-Dyna transient dynamics to calculate the contact pressure and deformation of the contact surface between the bearing roller and the plug. Through a combination of plugging position and fit relationship test analysis, the paper presents findings on how different plugging positions and fit relationships influence the motion stability of the bearing as follows:
  • It is essential to control the pressing position of the taper pin during the assembly process. As the pressing position of the taper pin deepens, the contact pressure and deformation displacement of both the roller and the plug initially decrease, followed by an increase. The contact pressure and deformation displacement reach their minimum when the taper pin is positioned centrally. At this central position, the roundness of the plug raceway, the outer ring raceway, and the bearing friction torque are minimized, resulting in the least impact on the stability of bearing motion. This position is therefore the most suitable for the positioning and assembly of the plug;
  • The contact pressure and deformation displacement between the roller and the plug gradually increase with the widening clearance between the plug and the plug hole, reaching their minimum values when the clearance measures 0 μm. However, during the actual assembly process, a specific matching clearance between the plug and the plug hole is beneficial for adjusting the position of the plug within the hole. Test analyses indicate that a plug clearance within the range of 3 to 9 μm is optimal for positioning and assembling the plug. This range ensures maximum roundness of the entire raceway while minimizing the impact on the stability of bearing motion;
  • The contact pressure and deformation displacement between the roller and the plug initially decrease and then increase with the increasing sag and bulge position of the plug. Notably, the contact pressure and deformation displacement reach their minimum when the bulge amount of the plug is 1 μm. At this position, the non-coincidence defects between the raceways are significantly reduced compared to other positions, leading to a decrease in the roundness of the entire raceway. This configuration has the least impact on the stability of bearing motion, making it the most suitable for the positioning and assembly of plugs. Therefore, it is advisable to minimize the presence of the plug during the assembly process;
  • Under the condition that other influencing factors remain constant, an increase in the rotation amount of the plug will directly impact the roundness of the raceway. Conversely, the rotation direction of the plug has minimal influence on the roundness of the raceway. During the assembly process, it is essential to minimize the rotation amount of the plug to reduce its effect on the smoothness of bearing motion.

Author Contributions

Conceptualization, P.D., R.N. and Y.W.; Data curation, P.D. and R.N.; Formal analysis, P.D. and R.N.; Funding acquisition, R.N.; Investigation, P.D., R.N., Y.W. and R.L.; Methodology, P.D. and R.N.; Project administration, R.N.; Resources, R.N.; Software, P.D. and Y.W.; Supervision, P.D. and R.N.; Validation, R.L., L.L. and W.X.; Writing—original draft, P.D. and Y.W.; Writing—review and editing, P.D. and R.N. All authors have read and agreed to the published version of the manuscript.

Funding

This research was funded by the Ningbo key research and development plan of China (2023Z006).

Data Availability Statement

The data used to support the findings of this study are available from the corresponding author upon request.

Conflicts of Interest

Author Ruifang Lv was employed by the company Luoyang Hongyuan Bearing Technology Co., Ltd. The remaining authors declare that the research was conducted in the absence of any commercial or financial relationships that could be construed as a potential conflict of interest.

References

  1. Song, X.; Zhou, X.; Chaudhari, R.; Johnson, S.P.; Kotzalas, M. Modeling and characterization of lathe spindle cutting patterns with crossed roller bearing installed. Int. J. Mech. Eng. Rob. Res. 2019, 8, 660–666. [Google Scholar] [CrossRef]
  2. Kang, S.H.; Tesar, D. An Analytical Comparison between Ball and Crossed Roller Bearings for Utilization in Actuator Modules for Precision Modular Robots. In Proceedings of the International Design Engineering Technical Conferences, Chicago, IL, USA, 2–6 September 2003. [Google Scholar]
  3. Quagliato, L.; Kim, D.; Lee, N.; Hwang, S.; Domblesky, J.; Kim, N. Run-out based crossed roller bearing life prediction by utilization of accelerated testing approach and FE numerical models. Int. J. Mech. Sci. 2017, 130, 99–110. [Google Scholar] [CrossRef]
  4. Tong, V.C.; Jung, E.W.; Hong, S.W. Modeling of Crossed Roller Bearings Considering Roller Roundness Deformation. J. Tribol. 2020, 142, 121201. [Google Scholar]
  5. Tong, V.C.; Hong, S.W. Stiffness Characteristics of Crossed Roller Bearings with Roller Roundness Deformation. J. Tribol. 2022, 144, 021201. [Google Scholar] [CrossRef]
  6. Prozhega, M.V.; Konstantinov, E.O.; Reschikov, E.O.; Albagachiev, A.Y.; Smirnov, N.I.; Smirnov, N.N. Experimental Evaluation of the Cross Roller Bearing Resistance Moment in Vacuum. J. Frict. Wear. 2023, 44, 97–101. [Google Scholar] [CrossRef]
  7. Deng, B.; Chen, J.; Guo, Y.; Tang, S. Analysis of the influence of raceway structure on contact characteristics of turntable bearing. J. Phys. 2021, 1732, 1742–1859. [Google Scholar] [CrossRef]
  8. Li, H.; Deng, Z. Experimental Study on Friction Characteristics and Running Stability of a Novel Ultrasonic Levitating Bearing. IEEE Access 2018, 6, 21719–21730. [Google Scholar] [CrossRef]
  9. Hwang, S.Y.; Lee, N.R.; Kim, N. Experiment and Numerical Study of Wear in Cross Roller Thrust Bearings. Lubricants 2015, 3, 447–458. [Google Scholar] [CrossRef]
  10. Wu, S.; Lei, W.; Yu, T.; Dong, Z.; Liu, T. Effect of the Stiffness of the Turntable Bearing Joint on the Dynamic Characteristics of the Five-Axis Machine Tool Rotary System. Machines 2023, 16, 389. [Google Scholar] [CrossRef]
  11. Lostado, R.; Escribano García, R.; Fernandez Martinez, R. Optimization of operating conditions for a double-row tapered roller bearing. Int. J. Mech. and Mater. Des. 2016, 12, 353–373. [Google Scholar] [CrossRef]
  12. Yang, Y.; Yang, W.; Jiang, D. Simulation and experimental analysis of rolling element bearing fault in rotor-bearing-casing system. Eng. Fail. Anal. 2018, 92, 205–221. [Google Scholar] [CrossRef]
  13. Tyagi, S.; Panigrahi, S.K. Transient Analysis of Ball Bearing Fault Simulation using Finite Element Method. J. Inst. Eng. India Ser. 2014, 95, 309–318. [Google Scholar] [CrossRef]
  14. Tadina, M.; Boltežar, M. Improved model of a ball bearing for the simulation of vibration signals due to faults during run-up. J. Sound. Vib. 2011, 330, 4287–4301. [Google Scholar] [CrossRef]
  15. Kuncoro, D.; Bambang, C.; Oscar, R.; Liu, C.C.; Chen, C.Y.; Hung, K.S.; Kuan, Y.D. Modeling, Analysis, and Simulation of Auxiliary Bearing for High-speed Rotating Machinery. Sens. Mater. 2021, 33, 3581–3601. [Google Scholar] [CrossRef]
  16. Shao, Y.; Tu, W.; Gu, F. A simulation study of defects in a rolling element bearing using FEA. In Proceedings of the International Conference on Control, Automation and Systems, Goyang, Republic of Korea, 27–30 October 2010. [Google Scholar]
  17. Schmidt, A.A.; Schmidt, T.; Grabherr, O.; Bartel, D. Transient wear simulation based on three-dimensional finite element analysis for a dry running tilted shaft-bushing bearing. Wear 2018, 408, 171–179. [Google Scholar] [CrossRef]
  18. Safian, A.; Zhang, H.; Liang, X.; Wu, N. Dynamic simulation of a cylindrical roller bearing with a local defect by combining finite element and lumped parameter models. Meas. Sci. Technol. 2021, 32, 111–125. [Google Scholar] [CrossRef]
  19. Zeng, S. Modelling and experimental study of the transient response of an active magnetic bearing rotor during rotor drop on back-up bearings. Proc. Inst. Mech. Eng. Part I 2003, 217, 505–517. [Google Scholar] [CrossRef]
  20. Huang, J.; Li, C.Y.; Chen, B.K. Mechanical behaviors of cross roller bearings with raceway roundness error. J. Cent. South Univ. 2021, 28, 2091–2104. (In Chinese) [Google Scholar] [CrossRef]
  21. Oswald, F.B.; Zaretsky, E.V.; Poplawski, J.V. Effect of roller geometry on roller bearing load–life relation. Tribol. Trans. 2014, 57, 928–938. [Google Scholar] [CrossRef]
  22. Deng, B.; Liu, Y.; Guo, Y.; Tang, S.; Su, W.; Lei, Z.; Wang, P. Integral finite element analysis of turntable bearing with flexible rings. IOP Conf. Ser. Mater. Sci. Eng. 2018, 322, 042011. [Google Scholar] [CrossRef]
  23. Pan, X.Y.; Cheng, A.; Tang, Y.Q. Life Analysis of Cross Cylindrical Roller Slewing Bearing based on Romax. Lubr. Eng. 2021, 46, 41–47. (In Chinese) [Google Scholar]
  24. He, D.K.; Gan, L.; Xiang, Z.J. Research on Cross Roller Bearing Fault Diagnosis Based on MRSVD-SVD and VPMCD. J. Mech. Electr. Eng. 2019, 40, 47–54. (In Chinese) [Google Scholar]
  25. Hu, J.Y.; Fan, Y.Q.; Xie, Y.D. Improvement of Assembly Process for Finished Product Inspection of Precision Cross Cylindrical Roller Bearings. Bearing 2022, 7, 33–36. (In Chinese) [Google Scholar]
  26. Wang, K.P.; Fan, Y.Q.; Hu, J.Y. Common Factors affecting repeated positioning accuracy of cross cylindrical roller Bearing and improvement Measures. Bearing 2021, 12, 61–64. (In Chinese) [Google Scholar]
  27. He, P.Y.; Wang, Y.; Wang, H. Fretting Analysis of Three-row Roller Type Turntable Bearing. Mech. Des. Manuf. 2023, 386, 17–21. (In Chinese) [Google Scholar]
  28. Huang, L.Y.; Fu, H.; Wang, Y. Finite Element Analysis of Large Three-row Roller Turntable Bearing. J. Mech. Strength 2022, 44, 627–634. (In Chinese) [Google Scholar]
  29. Qiao, S.X.; Lv, Z.W.; Jia, S.Y. Structural Optimization of Ball Plug for Thrust Angular Contact Ball Turnstable Bearing. Mach. Tool Hydraul. 2021, 49, 136–138. (In Chinese) [Google Scholar]
  30. Wang, Z.; Wu, Q.; Chang, Z.; Yu, Q. Modeling of double-row cylindrical roller bearing under combined loads and angular misalignment. J. Tribol. 2024, 18, 114301. [Google Scholar] [CrossRef]
Figure 1. Geometric structure model of precision cross roller bearing. (a) Geometric structure model of internal and external separate cross roller bearing (b) Geometric structure model of internal and external separate cross roller bearing (c) roller and plugging motion model.
Machines 12 00678 g001
Figure 2. Precision cross roller bearing motion model: (a) Roller and plug motion model; (b) Plug position sag model, (c) Roller and plug protrusion model, (d) Roller and plug rotation offset model.
Machines 12 00678 g002
Figure 3. Cross roller bearing grid model: (a) Meshing of inner ring contact surface; (b) Meshing of outer ring and plug contact surface; (c) Meshing of plug and taper pin (d) Meshing of model overall.
Machines 12 00678 g003
Figure 4. Cross roller bearing model boundary condition setting.
Machines 12 00678 g004
Figure 5. Cross roller bearing model contact setting.
Machines 12 00678 g005
Figure 6. Structure diagram of different taper pin pressing positions: (a) Taper pin near the larger end position; (b) Taper pin near big end drop 0.14 mm position; (c) Middle position of taper pin; (d) Taper pin near small end rise 0.14 mm position; (e) Taper pin near the lesser end position.
Machines 12 00678 g006
Figure 7. Contact pressure variation diagram at different taper pin positions.
Machines 12 00678 g007
Figure 8. Deformation and displacement variation diagram at different taper pin positions.
Machines 12 00678 g008
Figure 9. Contact pressure field of taper pin position 3 at different simulation moments: (a) t = 0.05 s; (b) t = 0.07 s; (c) t = 0.09 s; (d) t = 0.10 s; (e) t = 0.12 s; (f) t = 0.15 s.
Machines 12 00678 g009
Figure 10. Deformation displacement field of taper pin position 3 at different simulation moments: (a) t = 0.05 s; (b) t = 0.07 s; (c) t = 0.09 s; (d) t = 0.10 s; (e) t = 0.12 s; (f) t = 0.15 s.
Machines 12 00678 g010
Figure 11. Plug and plug hole matching clearance structure diagram: (a) Plug matching clearance 0 μm; (b) Plug matching clearance 5 μm.
Machines 12 00678 g011
Figure 12. Contact pressure variation diagram at different plug matching clearances.
Machines 12 00678 g012
Figure 13. Deformation and displacement variation diagram at different plug matching clearances.
Machines 12 00678 g013
Figure 14. Contact pressure field of plug position 1 at different simulation moments: (a) t = 0.05 s; (b) t = 0.07 s; (c) t = 0.09 s; (d) t = 0.10 s; (e) t = 0.12 s; (f) t = 0.15 s.
Machines 12 00678 g014
Figure 15. Deformation displacement field of plug position 1 at different simulation moments: (a) t = 0.05 s; (b) t = 0.07 s; (c) t = 0.09 s; (d) t = 0.10 s; (e) t = 0.12 s; (f) t = 0.15 s.
Machines 12 00678 g015
Figure 16. Plug sag and protruding structure diagram: (a) Normal position of the plug; (b) The plug protrudes in a radial direction; (c) The plug sags in a radial direction.
Machines 12 00678 g016
Figure 17. Contact pressure variation diagram at different plug sags and protrusions.
Machines 12 00678 g017
Figure 18. Deformation and displacement variation diagram at different plug sags and protrusions.
Machines 12 00678 g018
Figure 19. Contact pressure field of plug position 7 at different simulation moments: (a) t = 0.05 s; (b) t = 0.07 s; (c) t = 0.09 s; (d) t = 0.10 s; (e) t = 0.12 s; (f) t = 0.15 s.
Machines 12 00678 g019
Figure 20. Deformation displacement field of plug position 7 at different simulation moments: (a) t = 0.05 s; (b) t = 0.07 s; (c) t = 0.09 s; (d) t = 0.10 s; (e) t = 0.12 s; (f) t = 0.15 s.
Machines 12 00678 g020aMachines 12 00678 g020b
Figure 21. Plug rotation offset structure diagram: (a) Plug rotation offset direction; (b) The plug is offset in the negative direction; (c) The plug is offset in the positive direction.
Machines 12 00678 g021
Figure 22. Contact pressure variation diagram at different plug rotation offset.
Machines 12 00678 g022
Figure 23. Deformation and displacement variation diagram at different plug rotation offset.
Machines 12 00678 g023
Figure 24. Contact pressure field of plug position 10 at different simulation moments: (a) t = 0.05 s; (b) t = 0.07 s; (c) t = 0.09 s; (d) t = 0.10 s; (e) t = 0.12 s; (f) t = 0.15 s.
Machines 12 00678 g024
Figure 25. Deformation displacement field of plug position 10 at different simulation moments: (a) t = 0.05 s; (b) t = 0.07 s; (c) t = 0.09 s; (d) t = 0.10 s; (e) t = 0.12 s; (f) t = 0.15 s.
Machines 12 00678 g025
Figure 26. Schematic diagram of the test instrument: (a) press machine; (b) friction moment tester.
Machines 12 00678 g026
Figure 27. Influence of taper pin position and plug clearance on the roundness of test bearing raceway. (a) Taper pin position; (b) Plug clearance.
Machines 12 00678 g027
Figure 28. Test bearing starting friction torque with different taper pin positions and plug clearances. (a) Taper pin position 1 bearing starting friction torque; (b) Taper pin position 2 bearing starting friction torque; (c) Plug clearance 1 bearing starting friction torque; (d) Plug clearance 2 bearing starting friction torque.
Machines 12 00678 g028aMachines 12 00678 g028b
Figure 29. Influence of sag protrusion and rotation offset of plug on roundness of test bearing raceway: (a) Sag and protrusion of plug; (b) Plug rotation offset.
Machines 12 00678 g029
Figure 30. The starting friction torque of the bearing is tested by different amounts of sag protrusion and rotation offset of the plug. (a) Plug sag 1 bearing starting friction torque; (b) Plug sag 2 bearing starting friction torque, (c) Plug rotation 1 bearing starting friction torque; (d) Plug rotation 2 bearing starting friction torque.
Machines 12 00678 g030
Table 1. Bearing parameter value.
Bearing ParameterSize
Bearing bore diameter20 mm
Bearing outside diameter36 mm
Bearing height8 mm
Taper pin length7.52 mm
Plug diameter5 mm
Roller diameter3 mm
Number of rollers28
Table 2. Mesh properties of the cross roller bearing.
Grid AttributeSize
Number of units912,523
Number of nodes953,307
Contact element size0.05 mm
Table 3. Material parameters and boundary conditions.
Material Parameters and Boundary ConditionsSize
Density7850/kg·m−3
Elasticity modulus2.1 × 1011 Pa
Poisson’s ratio0.3
Shear modulus7.7 × 1010 Pa
Radial load150 N
Rotate speed30/r·min−1
Friction coefficient between roller and raceway0.05
Table 4. Taper pin position and corresponding number.
Taper Pin PositionTaper Pin Number
Taper pin near larger endTaper pin position 1
Taper pin near big end drop 0.14 mmTaper pin position 2
Taper pin middle positionTaper pin position 3
Shear modulusTaper pin position 4
Taper pin near small end rise 0.14 mmTaper pin position 5
Taper pin near lesser endTaper pin position 6
Table 5. Plug position and corresponding number.
Plug matching ClearancePlug Number
Plug matching clearance 0 μmPlug position 0
Plug matching clearance 5 μmPlug position 1
Plug matching clearance 10 μmPlug position 2
Plug matching clearance 20 μmPlug position 3
Table 6. Plug position and corresponding number.
Plug Sag and ProtrusionPlug Number
Plug sag 0 μmPlug position 0
Plug sag 1 μmPlug position 4
Plug sag 3 μmPlug position 5
Plug sag 5 μmPlug position 6
Plug protrudes 1 μmPlug position 7
Plug protrudes 3 μmPlug position 8
Plug protrudes 5 μmPlug position 9
Table 7. Plug position and corresponding number.
Plug Rotation OffsetPlug Number
Plug rotation offset 0 degreesPlug position 0
Plug rotation offset −0.3 degreesPlug position 10
Plug rotation offset 0.3 degreesPlug position 11
Plug rotation offset 0.5 degreesPlug position 12
Plug rotation offset 0.7 degreesPlug position 13
Disclaimer/Publisher’s Note: The statements, opinions and data contained in all publications are solely those of the individual author(s) and contributor(s) and not of MDPI and/or the editor(s). MDPI and/or the editor(s) disclaim responsibility for any injury to people or property resulting from any ideas, methods, instructions or products referred to in the content.