Article

Experimental Investigation of the Effects of Coolant Temperature on Cutting Tool Wear in the Machining Process

1
Department of Mechanical Engineering, Sakarya University of Applied Sciences, Sakarya 54300, Türkiye
2
Department of Mechatronics Engineering, Sakarya Universities of Applied Sciences, Sakarya 54300, Türkiye
*
Author to whom correspondence should be addressed.
Machines 2024, 12(10), 677; https://doi.org/10.3390/machines12100677
Submission received: 28 August 2024 / Revised: 23 September 2024 / Accepted: 25 September 2024 / Published: 27 September 2024
(This article belongs to the Special Issue Precision Manufacturing and Machine Tools)

Abstract

:
In machining processes, the heat generated in the cutting zone varies depending on cutting parameters such as depth of cut, cutting speed and feed rate. On the other hand, in most existing machine tools, the flow rate of the coolant sent to the cutting zone is constant, and there is no additional cooling system in the tank. Therefore, the temperature of the coolant circulating in the closed circuit in the system is constantly increasing, which negatively affects cutting performance. This study aims to investigate the effect of coolant temperature on tool wear in the machining process and to control the coolant temperature. For this purpose, a comprehensive coolant temperature control system was developed and integrated into the CNC machine tool. Thanks to this system, it was possible to automatically control the temperature of the cutting fluid (coolant) and maintain it within a constant temperature range throughout the cutting process. Thus, experiments were conducted at different temperatures with different cutting parameters and coolant emulsion ratios using the developed system. Since the cutting parameters interact with each other, the Taguchi method was used to observe the effect of each parameter and to determine the optimum cutting parameters. As a result, it was observed that tool wear was reduced, tool life was extended and unnecessary coolant use was prevented, especially at low temperatures. In addition, the amount of coolant used is expected to reduce negative environmental impacts.

1. Introduction

In recent years, studies on the effective and efficient use of energy in production processes have increased in order to reduce costs, increase production quality and reduce environmental impacts [1,2]. The effective use of energy both increases the competitiveness of enterprises and contributes to the protection of economic and ecological balances by ensuring that energy resources are used for a longer period of time [3,4]. Due to the nature of machining, there are many factors that directly affect cutting performance, such as the condition of the machine used, tool geometry, cutting parameters and coolant used. Therefore, studies in this area focus more on the sustainability of production processes and the efficiency of the machining process [5,6,7]. Murat Kıyak performed drilling experiments on AISI 1040 steel and Al7075 aluminum materials and examined the hole surface quality and wear on the drill bit [8]. Muhammad Amir et al. performed hole drilling experiments on different aluminum alloys used in the aviation sector according to different parameters. As a result of the experiment, burr formation, tool wear and production quality were analyzed for each material [9]. On the other hand, the temperature of the cutting fluid is critical for machining performance. Because coolant helps manage the heat generated during cutting, it also helps to clear chips from the cutting area, providing lubrication and prevent corrosion. Maintaining the optimum cutting fluid temperature during the process for a given metal cutting operation is important for both machining performance and tool life. Another point is that the cost of cutting fluid accounts for 8–16% of the annual cost of the machining process [10]. Therefore, many researchers have conducted studies analyzing the heat generated during metal cutting and investigating the effects of coolant on cutting performance. Zhigang Jiang et al. prepared a model to optimize machining parameters to minimize the amount and cost of cutting fluid [11]. M. Pradeep Kumar et al. conducted a comprehensive study on heat generation during the metal cutting process. In the study, the heat distribution on the workpiece, tool and chip was analyzed [12]. In another study conducted by Grzesik Wit, the thermal behavior of cutting tools coated with different materials during cutting was analyzed [13]. N. A. Abukhshim et al. reviewed the studies on heat generation, heat distribution and prediction of heat distribution in metal machining [14]. Pei Yan et al. conducted a comprehensive literature review on cutting fluids and analyzed the basic functions of cutting fluids, such as cooling, lubrication, corrosion protection and cleaning [15]. Murat Sarıkaya et al. investigated the effects of parameters such as cutting speed, feed rate and depth of cut on surface roughness, together with coolant, in the turning process [16]. On the other hand, heat generation and temperature increases in the cutting zone during machining depend on many factors. Cutting parameters—such as cutting speed, feed rate, depth of cut—and other factors, such as the type of material to be cut, the geometry of the cutting tool and ambient temperature, are among them [17]. Therefore, these factors need to be controlled to optimize the machining process. In the literature review, it is seen that studies generally aim to analyze the heat generated depending on the cutting parameters and the process conditions [18,19]. However, there are very few studies on controlling the temperature in the cutting zone and maintaining this temperature throughout the cutting process. T. S. Ogedengbe et al. conducted a study to see the effect of coolant temperature on the machining of high carbon steels. In the study, a cooling system was developed to reduce the coolant temperature to 7.9 °C, and experiments were conducted by integrating it into the machine tool. As a result of the experiments, it was observed that the surface quality improved with the decrease in the coolant temperature [20].
However, it is necessary to balance the optimum coolant temperature to provide good cutting performance. From this point of view, it is very important to control the coolant temperature to obtain optimum cutting performance and long tool life. In some advanced machine tools, there are applications in which coolant is cooled by coils placed in cooling chambers. However, the coolant temperature is not under precise control in these machines, and only the cooling process is carried out. This study is produced from a comprehensive doctoral thesis. The doctoral study is based on two main objectives: to investigate the effects of coolant temperature on cutting performance and to assess heat recovery from the coolant. In this study, the effects of coolant temperature on cutting performance are investigated, and heat recovery tests will be carried out as another study in the future. Thus, in this study, the coolant temperature is controlled at a constant value. In this way, the tool wear corresponding to the coolant temperature values is determined. In addition, this approach increases cutting performance and decreases tool wear, thereby extending tool life. On the other hand, the number of tool uses and the amount of coolant used in the machine decrease with the increase in tool life. Therefore, the developed cooling system is expected to make significant contributions to the sector in both economic and environmental terms.

2. Material and Methods

The system used in the experiments was developed and produced in its entirety specifically for this study. The developed system was integrated into the machine tool, and experiments were carried out using this system. Experiments were conducted for different cutting parameters and coolant temperatures, and the results were analyzed in terms of tool wear. In this section, the experimental setup is first discussed in general. Subsequently, the developed system, measuring and control instruments, equipment and methods used in the experiments are explained in detail.

2.1. Experimental Setup

In classical cooling systems, which are still widely used, the heated coolant fluid in the cutting zone flows by gravity to the cooling (cutting) tank located under the bench. In this traditional method, the heated fluid dissipates its energy naturally into the environment during the time in the tank. By applying the developed system to the machine tool, the classical cooling system was upgraded to a new system with a closed circuit cooling system. Consequently, in this study, cutting performance and tool wear are analyzed depending on the cutting fluid temperature using the developed system that includes suitable measuring and control equipment. Accordingly, temperature sensors and flow meters are placed at the relevant parts of the system at the inlet and outlet. In this way, a continuous data acquisition can be provided. In this way, the physical state of the refrigerant in the closed loop between the machine and the cooling system can be controlled effectively. If the return temperature of the cutting fluid exceeds the set value, the control system is activated and makes the necessary adjustments. Meanwhile, the data measured throughout the system are continuously recorded with the help of a data logger at short time intervals, such as 1 min. Eventually, the data received by the data logger is saved in Excel format on a USB flash drive. If desired, it is also possible to connect the data logger directly to the computer. The received data can be analyzed on the interface of the data logger or through different programs. For this purpose, 2 turbine-type flow meters, 12 temperature sensors and a data logger with 16 outputs are used in the system. The experimental design and the setup used are shown simply in Figure 1. As mentioned before, this study is derived from a comprehensive doctoral thesis. The experimental design and setup in Figure 1 are taken verbatim from the thesis. In this figure, the operations on the right side of the machine tool are related to tool wear and machining quality, while the operations on the left side of the machine tool are related to heat recovery from the coolant. Heat recovery is considered the object of a future study and is not examined here. In this study, tool wear, which is one of the operations on the right side of the machine tool, will be discussed.

2.2. Cooling System

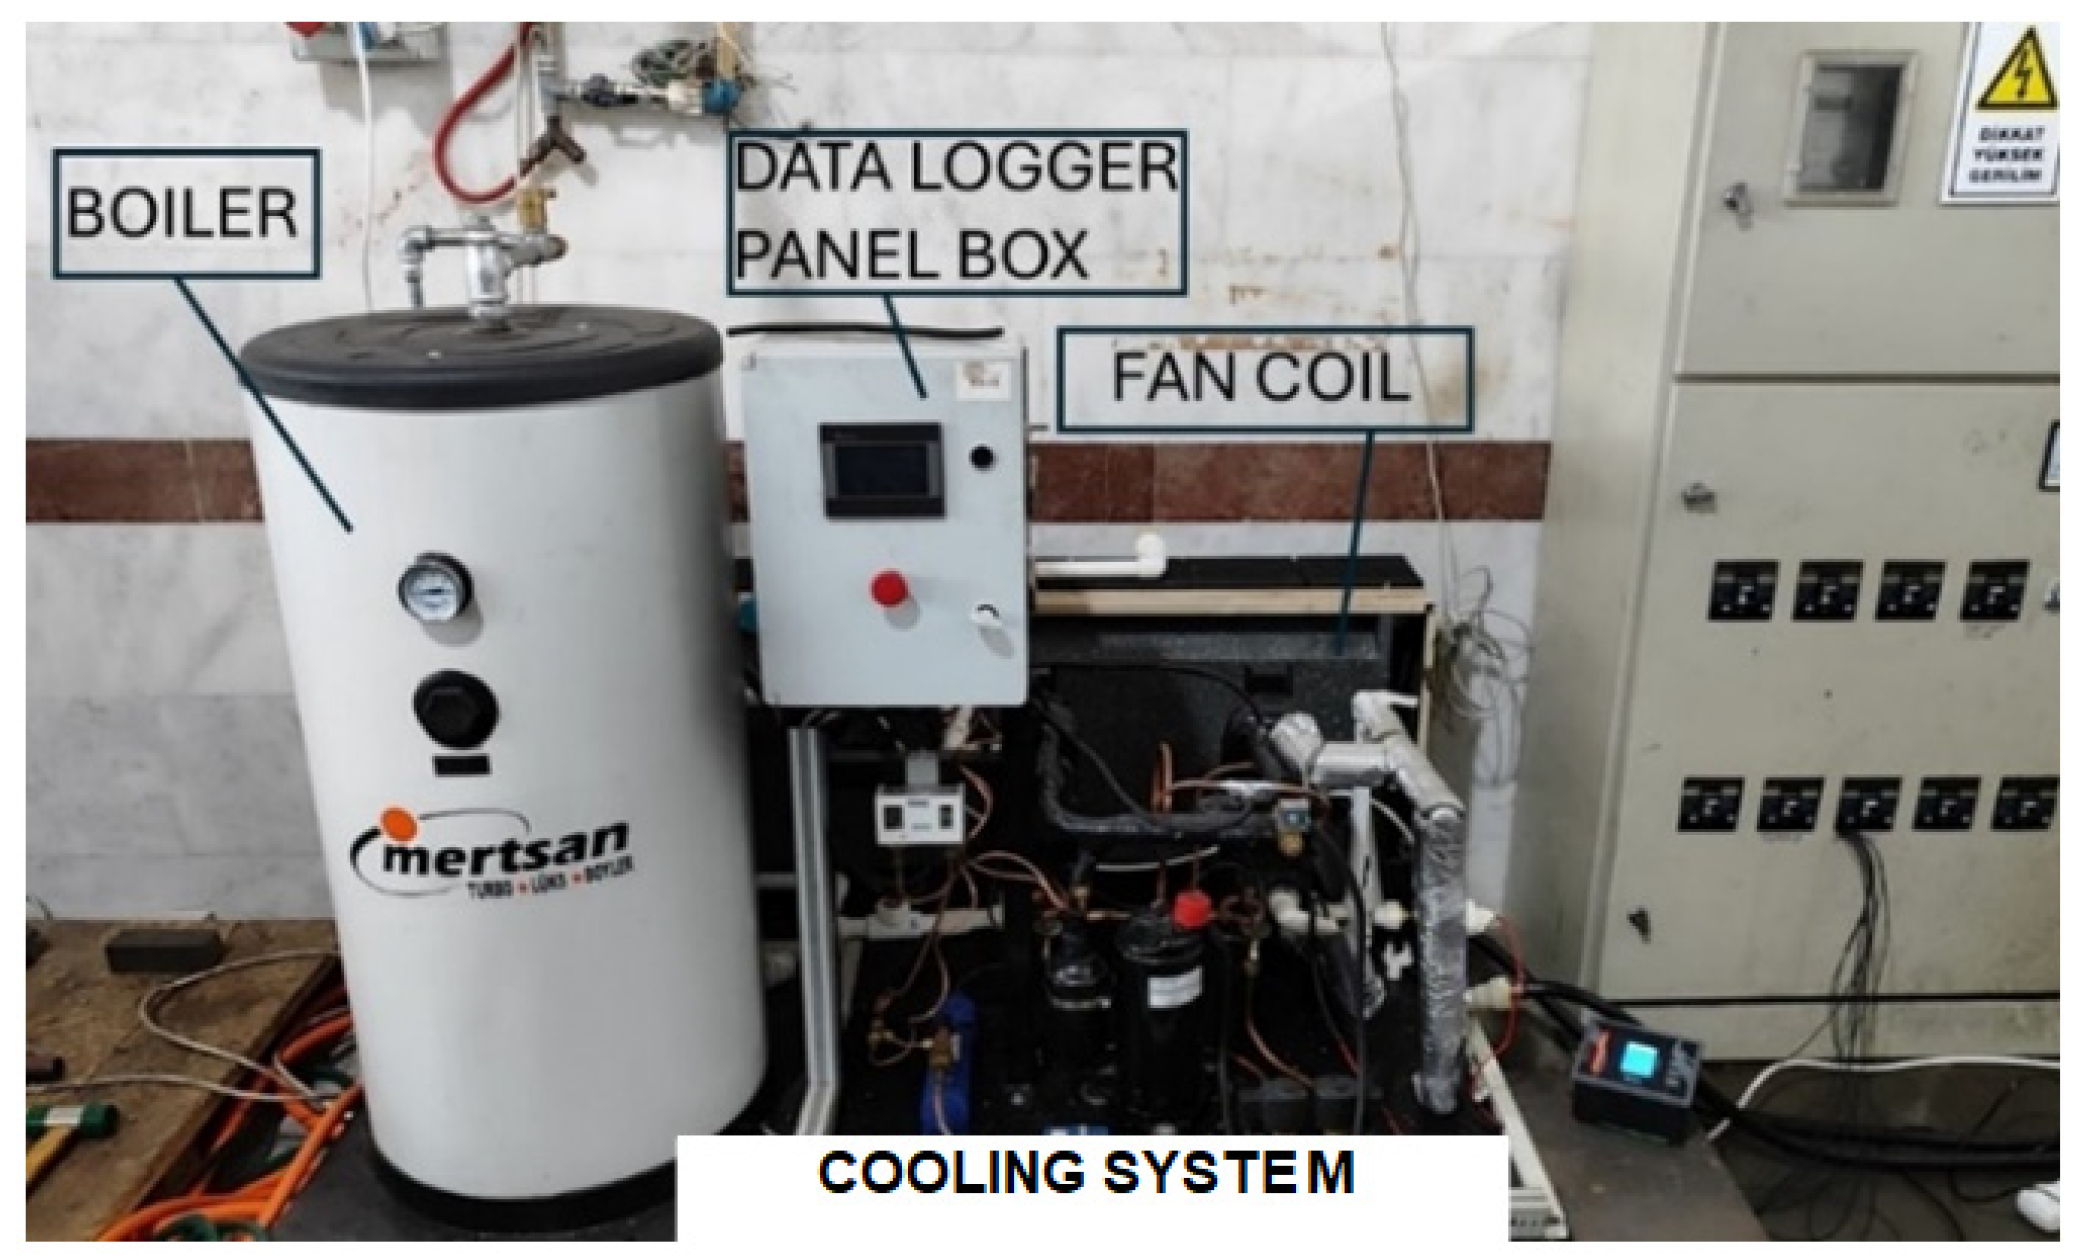
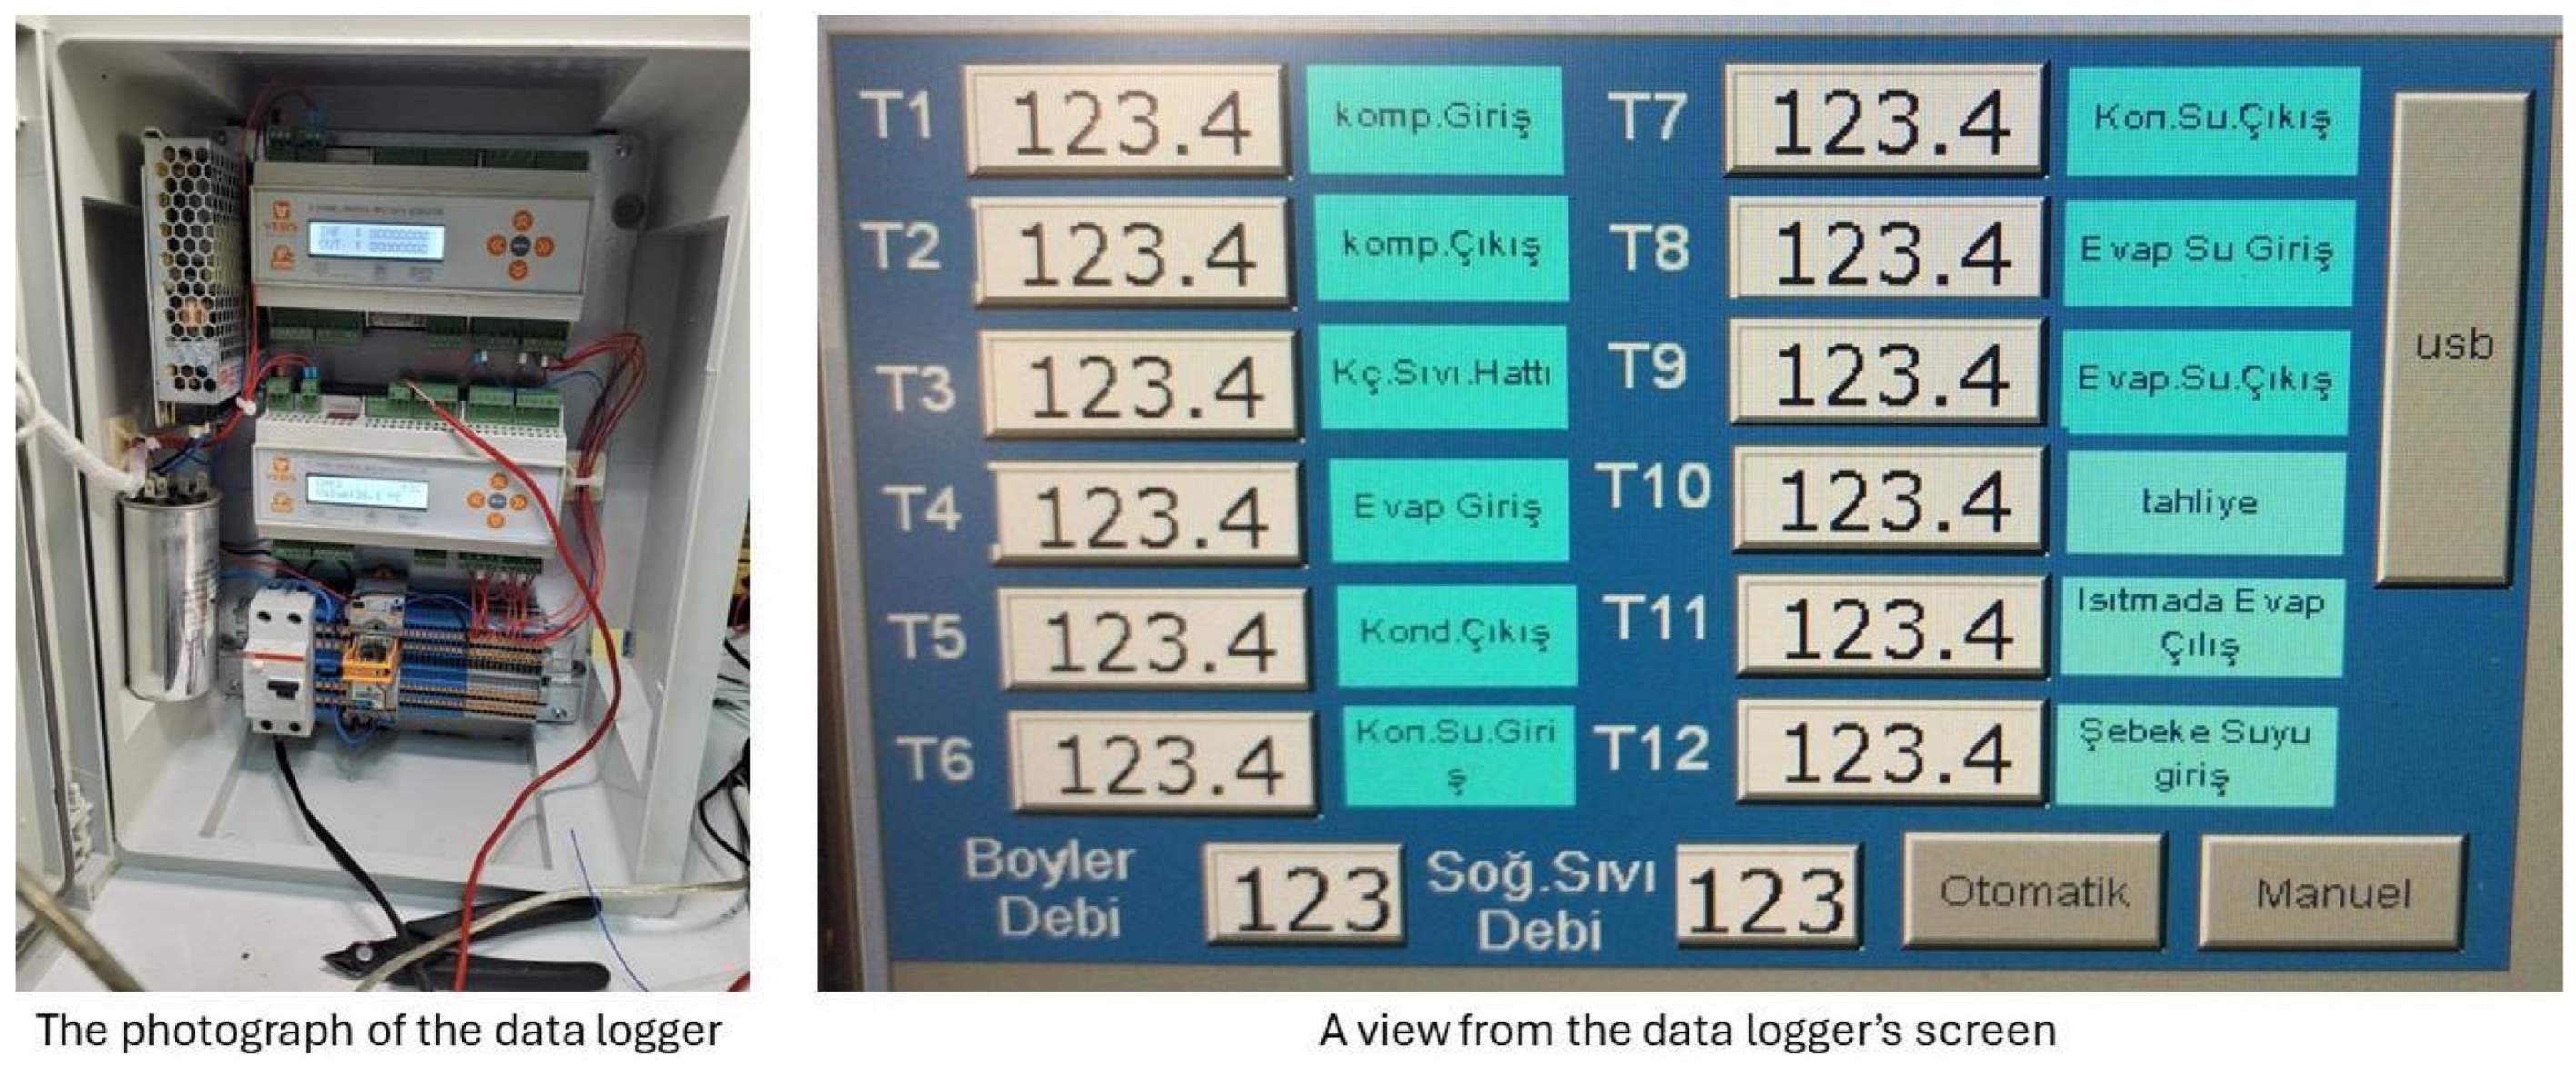
The integrated system developed in this study controls the coolant temperature in the cutting tool–workpiece contact area throughout the process and regulates the temperature of the coolant. This original cooling system was designed and manufactured as a separate system specifically for the study and then integrated into an existing CNC machine tool. In the developed system, the cooling water mixture is pumped directly into the evaporator in the system and then sent back to the work area from the system outlet after being cooled to the appropriate level in the system. The schematic diagram showing the main elements of the developed system is presented in detail in Figure 2. The photograph of the cooling system produced according to the scheme in Figure 2 is shown in Figure 3. The developed system consists of 1 compressor with a capacity of 12,350 BTU, 2 heat exchangers with a capacity of 5 kW, 1 fan coil with a capacity of 5 kW, a boiler with a capacity of 100 L, 1 expansion valve, 1 four-way valve and 1 three-way valve, as well as measurement and control equipment. Data obtained from temperature sensors and flow meters placed in critical areas of the system are recorded continuously at short time intervals, such as 1 min, with the help of a data logger. A photograph of the data logger and a view from the data logger screen are presented in Figure 4.

2.3. Cutting Parameters and Experimental Conditions

Obtaining realistic results in experimental studies depends heavily on the selection of appropriate system parameters and operating conditions. In this study, four different values were determined for each experiment, namely feed rate, drilling speed, coolant temperature and coolant emulsion. The parameters determined for the experiments are presented in Table 1. Experiments were carried out at constant temperatures of 15 °C and 20 °C for the coolant when the developed system was in operation, and at room temperature when the system is inactive. Three different coolant emulsion ratios of 2.5%, 5% and 7.5% were used, respectively. Likewise, experiments were conducted using three different spindle speeds and feed rates as drilling parameters. In the selection of workpiece materials, the most widely used materials in the industry were taken into account. In determining the drilling parameters, the current practices in manufacturing and the literature were taken into account. The process parameters and experimental design matrix are presented in Table 1 and Table 2, respectively.
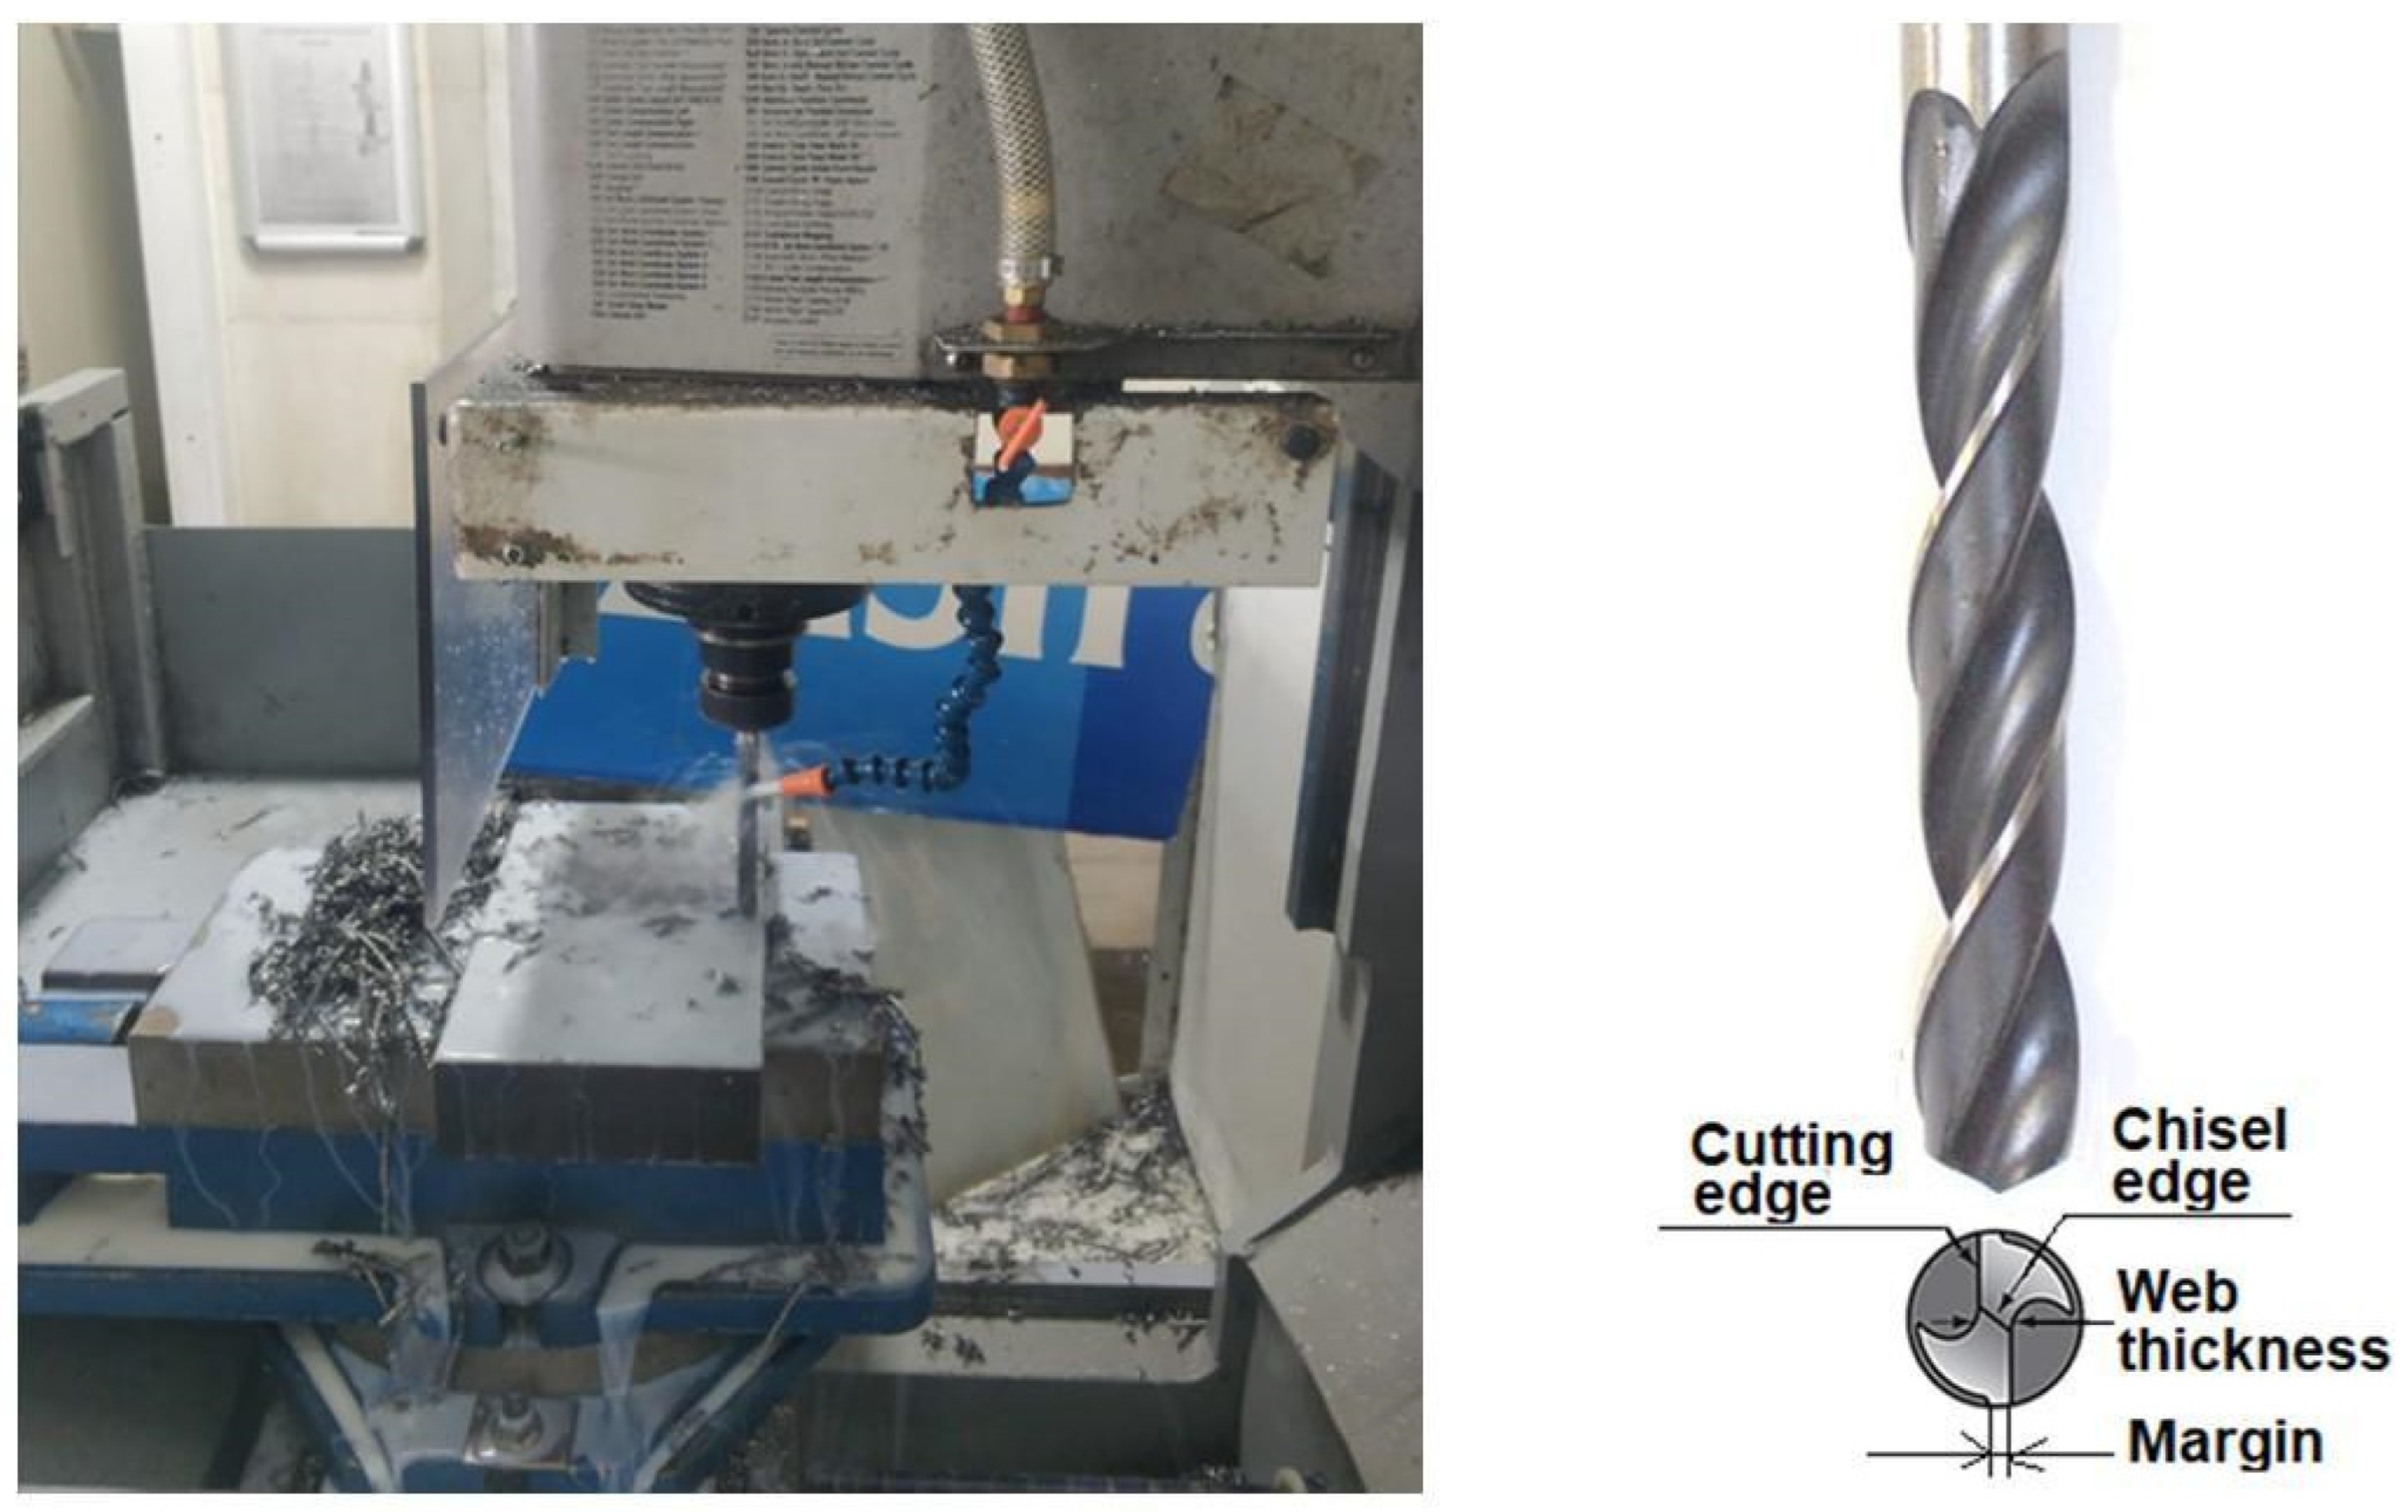
The cooling system was integrated into the machine tool (vertical machining center) to carry out the experiments. The machine tool used in the experiment, the drill bit and its geometry are presented in Figure 5. For the experiments, 27 prismatic test samples were prepared from AISI 1045 (SAE 1050. 1.0503) manufacturing steel with dimensions of 250 × 150 × 50 mm. The specimens prepared for the experiment are shown in Figure 6. The samples were drilled with a 12 mm diameter HSS drill bit using the different parameters shown in Table 1, resulting in 96 holes per part. Thus, a total of 2592 holes were drilled. The drill bit was replaced with a new one at each sample part replacement. In other words, 96 holes were drilled with each drill bit. This also makes tool wear more obvious and provides ease of measurement. Only one drill bit was used per part. The appearance of the drill bit is shown in Figure 5. The HSS drill tip angle was 118°. The G83 peck drilling cycle was used for drilling. Every 5 mm, the drill bit was completely lifted above the part (for example: G83 X31.5 Y-15. Z-55. Q5. F21.2). Thus, the coolant flowing from the nozzle reached the inside of the hole several times.

2.4. Measurement of Drill Bit Wear

As a result of tool wear, cutting tool costs and production losses due to tool changes both increase. On the other hand, surface quality deteriorates and dimensional errors occur due to machining with worn tools. Therefore, cutting parameters and cutting conditions that correspond to minimum tool wear must be selected. This requires exact and accurate measurement of tool wear according to the relevant parameters and conditions. In the literature, generally, in order to evaluate tool wear, flank wear and chisel edge wear are taken as the basis and measured using various methods [21,22,23,24,25].
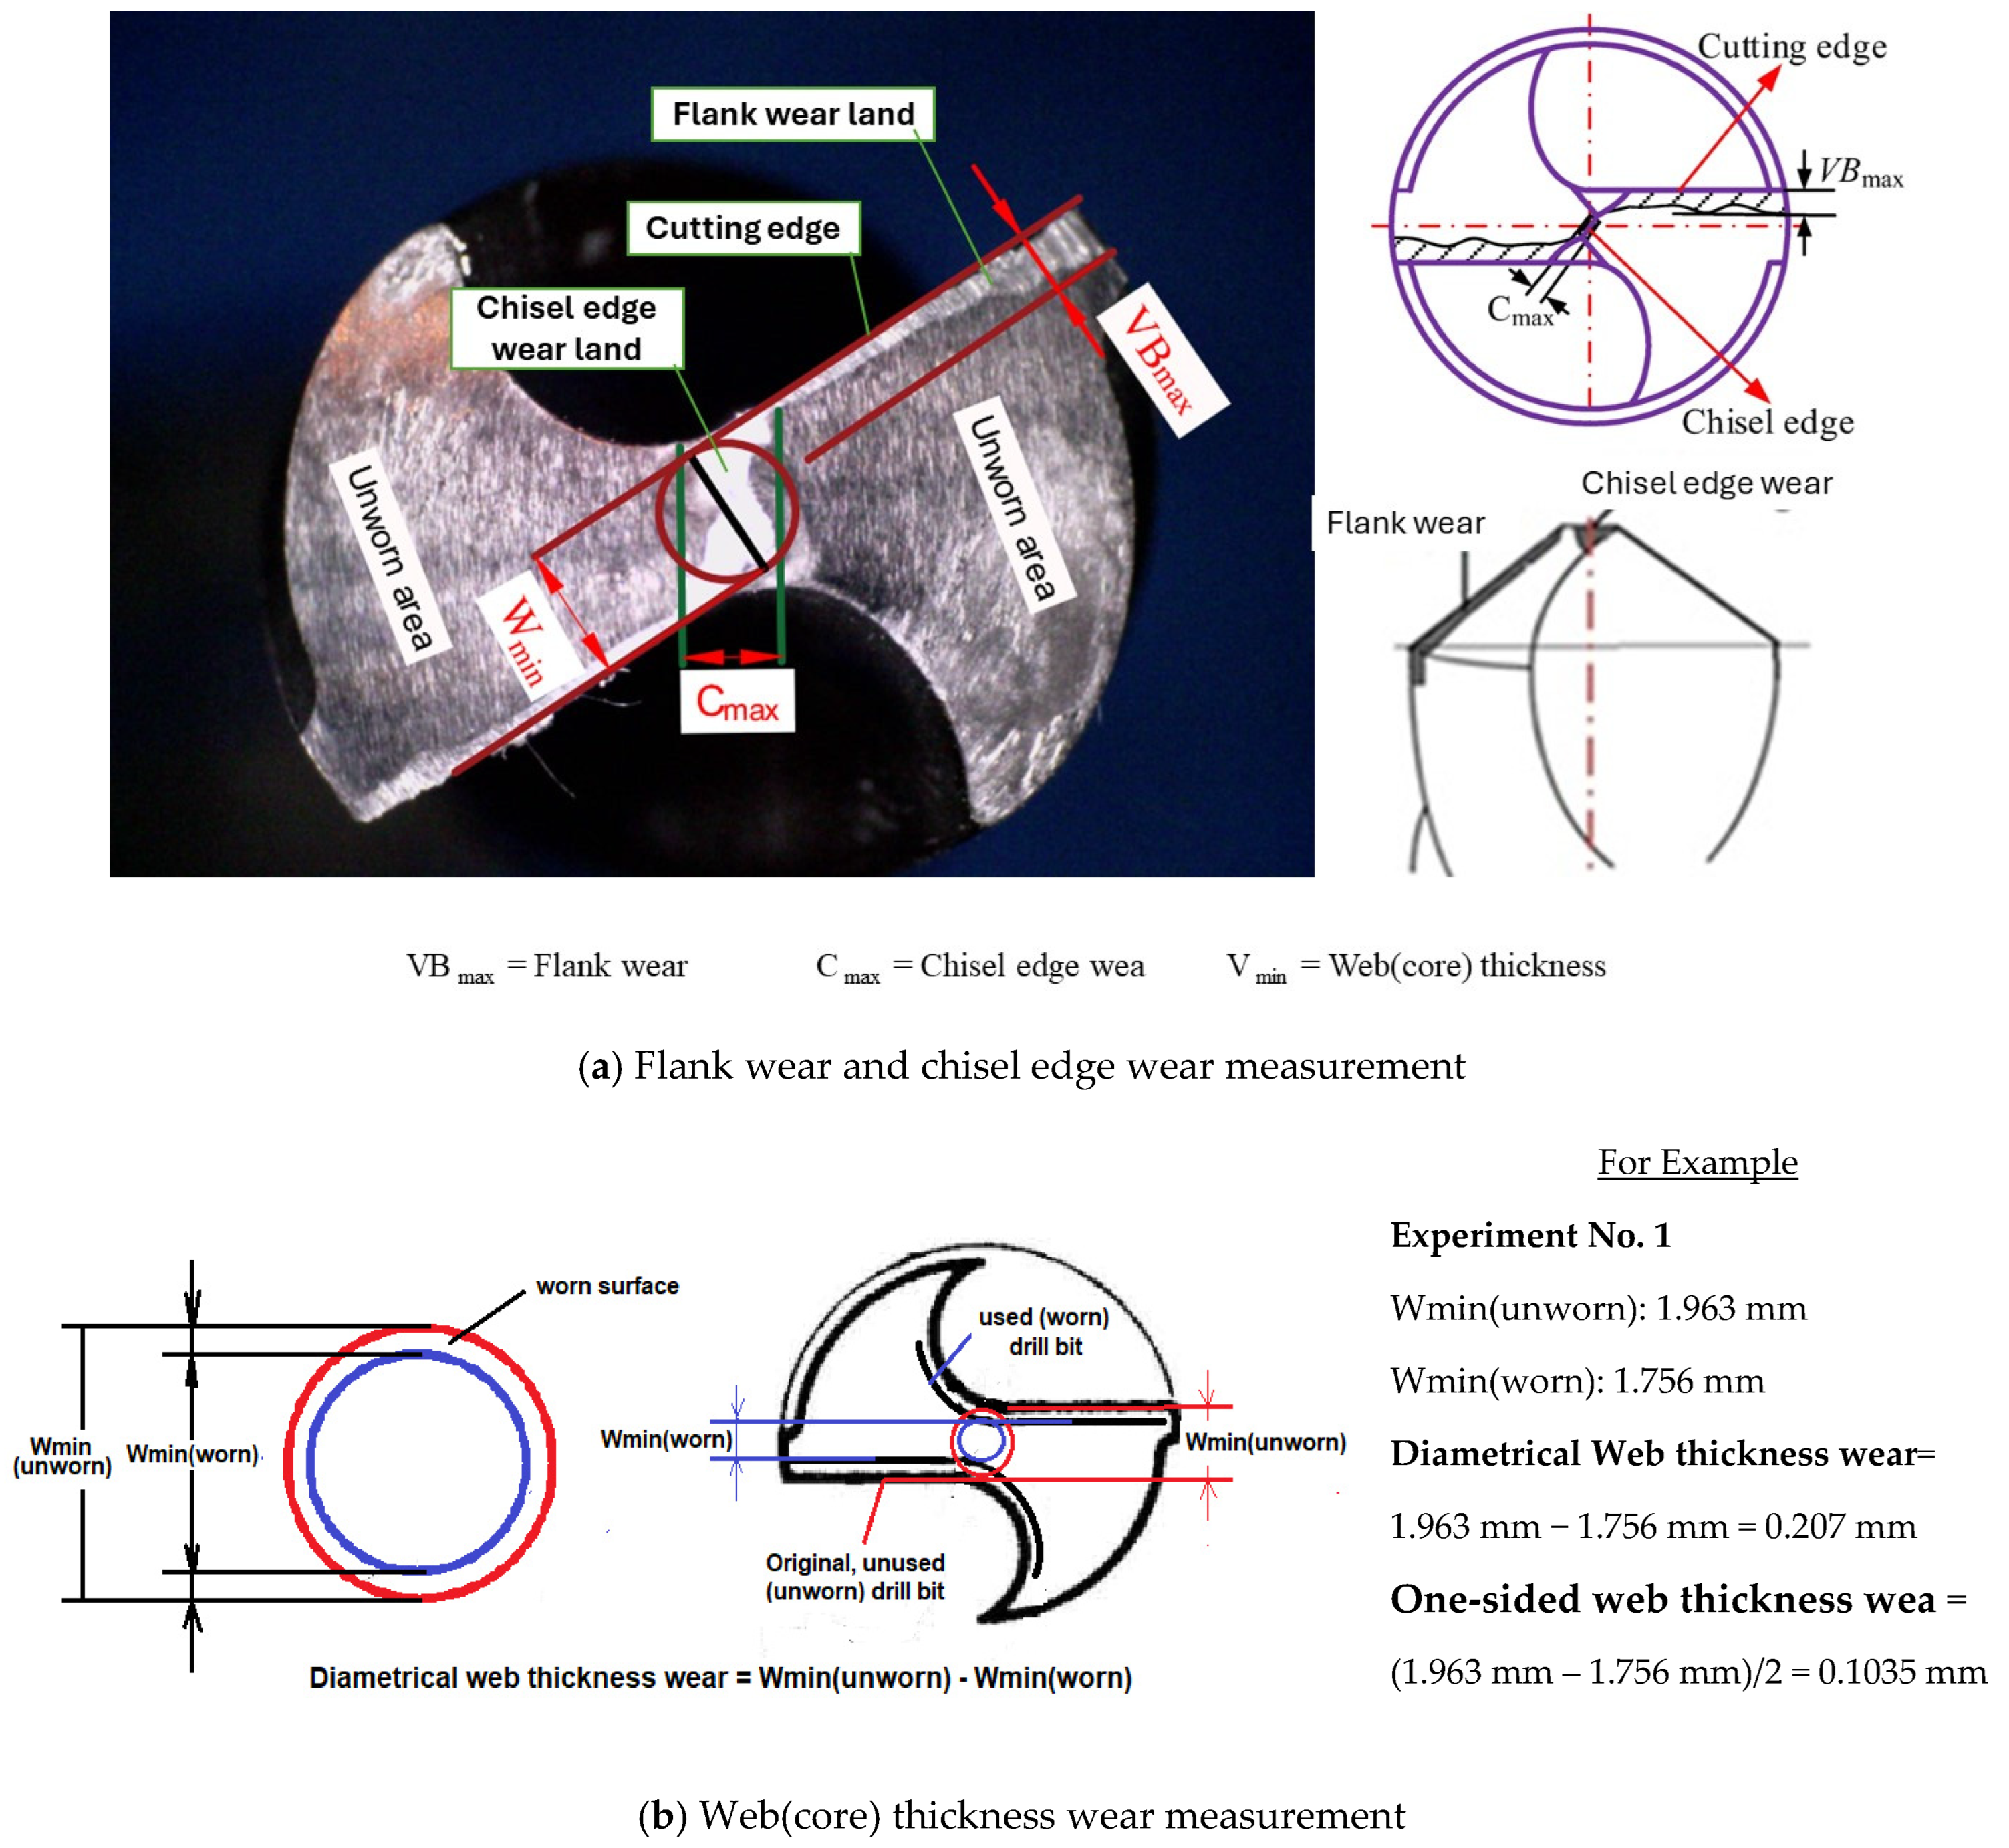
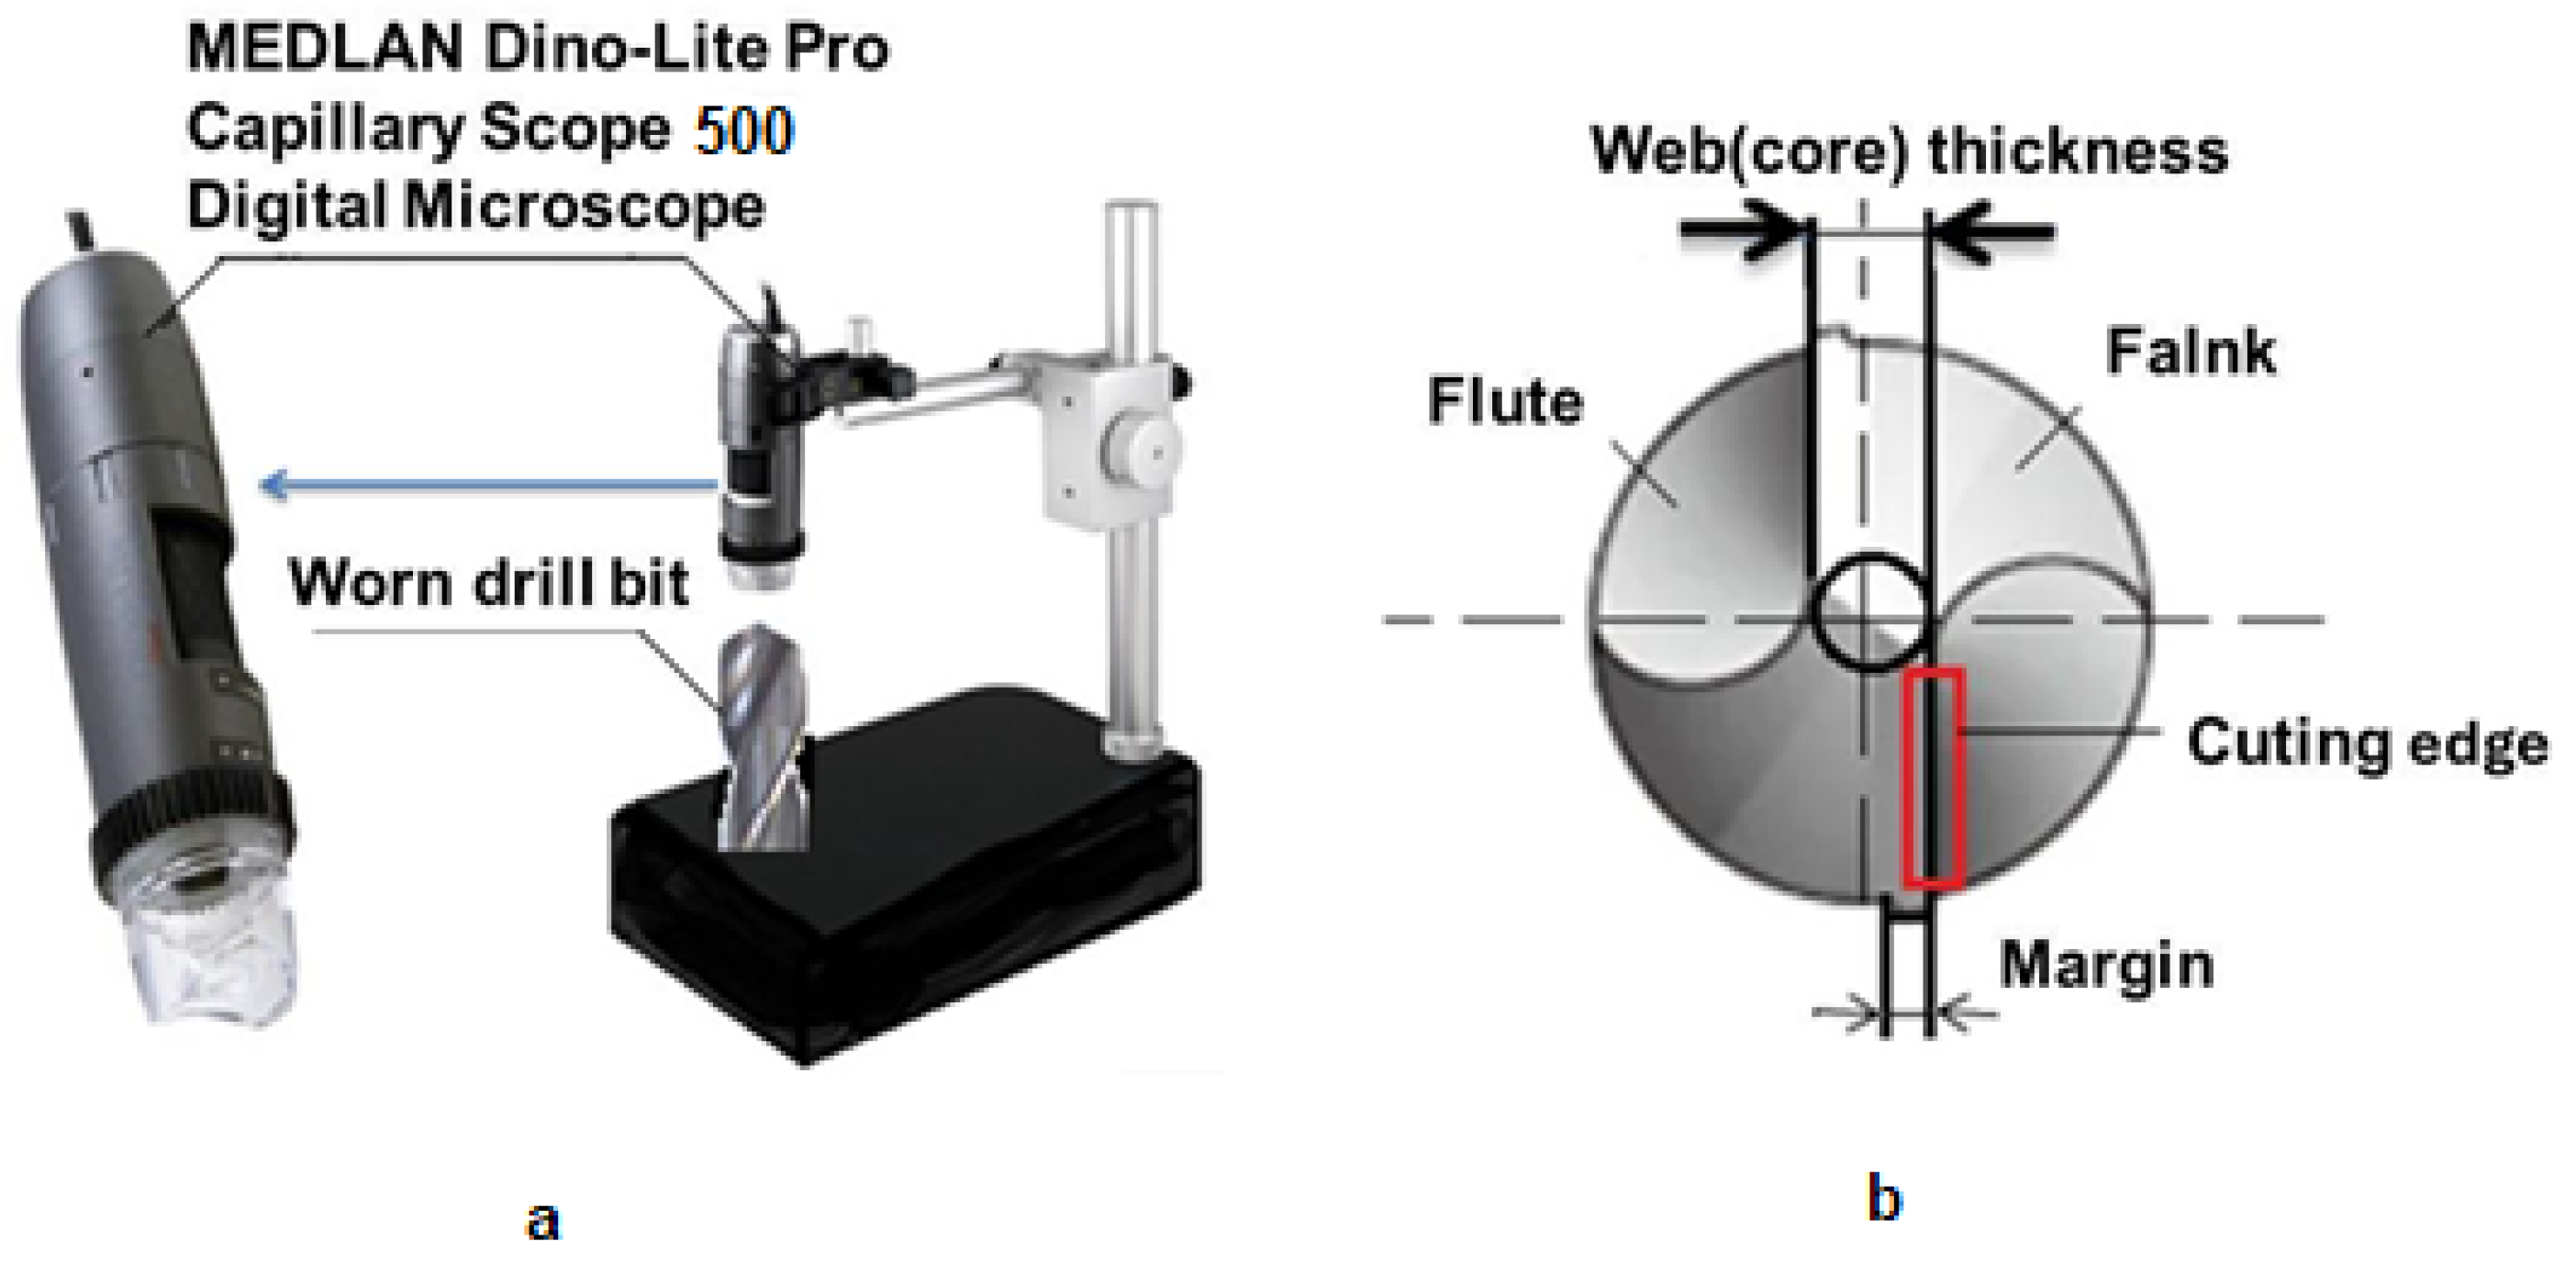
In this study, flange wear and chisel edge wear were chosen as the methods to analyze tool wear. These methods are the most dominant wear mechanisms affecting the service life of the drill bit and are widely used. During the measurement, we noticed that there was also wear on the web (core) thickness dimension of the drill bit. This situation aroused curiosity as to whether this wear magnitude was compatible with other methods. This was the motivation behind using this additional measurement method. When it was realized that the results were compatible with other methods, this method was also included in the study. A diameter decrease due to wear was observed in the web (core) thickness dimensions of the drill bits used in the experiments. Of course, this decrease directly corresponds to wear. However, it was not possible to directly measure this decrease, i.e., the decrease in diameter. For this purpose, the web (core) thickness dimensions of the original (unused, unworn) and used drills were measured, respectively, and the difference between the determined measurement results was taken to determine the diametrical web (core) thickness wear of the drill bit. This process was carried out for each experiment and included in the wear table as a separate column. Since it is not available in the existing literature, this method can also be seen as a new and original method. These wear forms are shown in Figure 7. To measure this wear, a visual-based system that has already been employed successfully by many researchers was used [26,27]. The system consists of a digital microscope with superior image quality [Capillary Scope 500 Pro (MEDL4N5 Pro)], and a stand on which the microscope is fixed. The digital microscope has the ability to capture and store detailed images at high magnifications.
The visualization system is shown in Figure 8a, and the drill bit geometry is shown in Figure 8b. Each sample was drilled using a new drill bit of the same specification and size, using different parameters. At the end of the drilling process, the wear images of each worn drill bit were captured one by one with a digital microscope and stored toa USB flash drive. These images were transferred to the computer from the USB memory stick and wear measurements were carried out for each image using three different methods, including flank wear, chisel edge wear and web (core) thickness wear.

2.5. The Method and Approaches

In this study, the Taguchi method, which is widely used in experimental design and optimization studies, was applied. Thanks to the Taguchi method, we had the opportunity to analyze the effect of each parameter independently by using orthogonal design in the planning phase of the experiments and by performing a minimum number of experiments. The results were evaluated considering the signal/noise (S/N) ratio. The performance of the design is measured by the S/N ratio, taking into account the average (signal) and variation (noise) of the performance. The formulas used to determine the S/N ratio vary depending on the solution criterion. The design formulas of the S/N ratio models are shown in Table 3 below.
In the study, the hole drilling process was carried out using different feed rates, cutting speeds and cooling emulsion rates. After the hole drilling process, tool wear was taken into account. Since the aim of tool wear was to provide minimum wear, the solution was made with the logic of “Smaller is Better”. The data obtained from the solutions were evaluated by taking into account the S/N ratios. Using the data obtained with the Taguchi Method, the optimum parameters affecting the minimum tool wear were determined.

3. Results and Discussion

This chapter investigates the complex relationship between coolant temperatures and drill bit wear in the drilling process. As noted in the abstract, this study focuses on how changes in coolant temperature and emulsion affect cutting tool wear and overall machining performance. This chapter aims to explain the subtle effects of coolant temperature and its interaction with cutting parameters and coolant emulsion by meticulously analyzing drill bit wear. The comprehensive coolant temperature system integrated into the CNC machine tool provides a robust platform for performing drilling tests and evaluating the impact of cutting parameters on coolant temperature dynamics and product quality. Data received through sensors placed at critical measurement points of this system were collected by the data logger developed specifically for this study. These data were then transferred to the computer and evaluated.

3.1. Drill Bit Wear

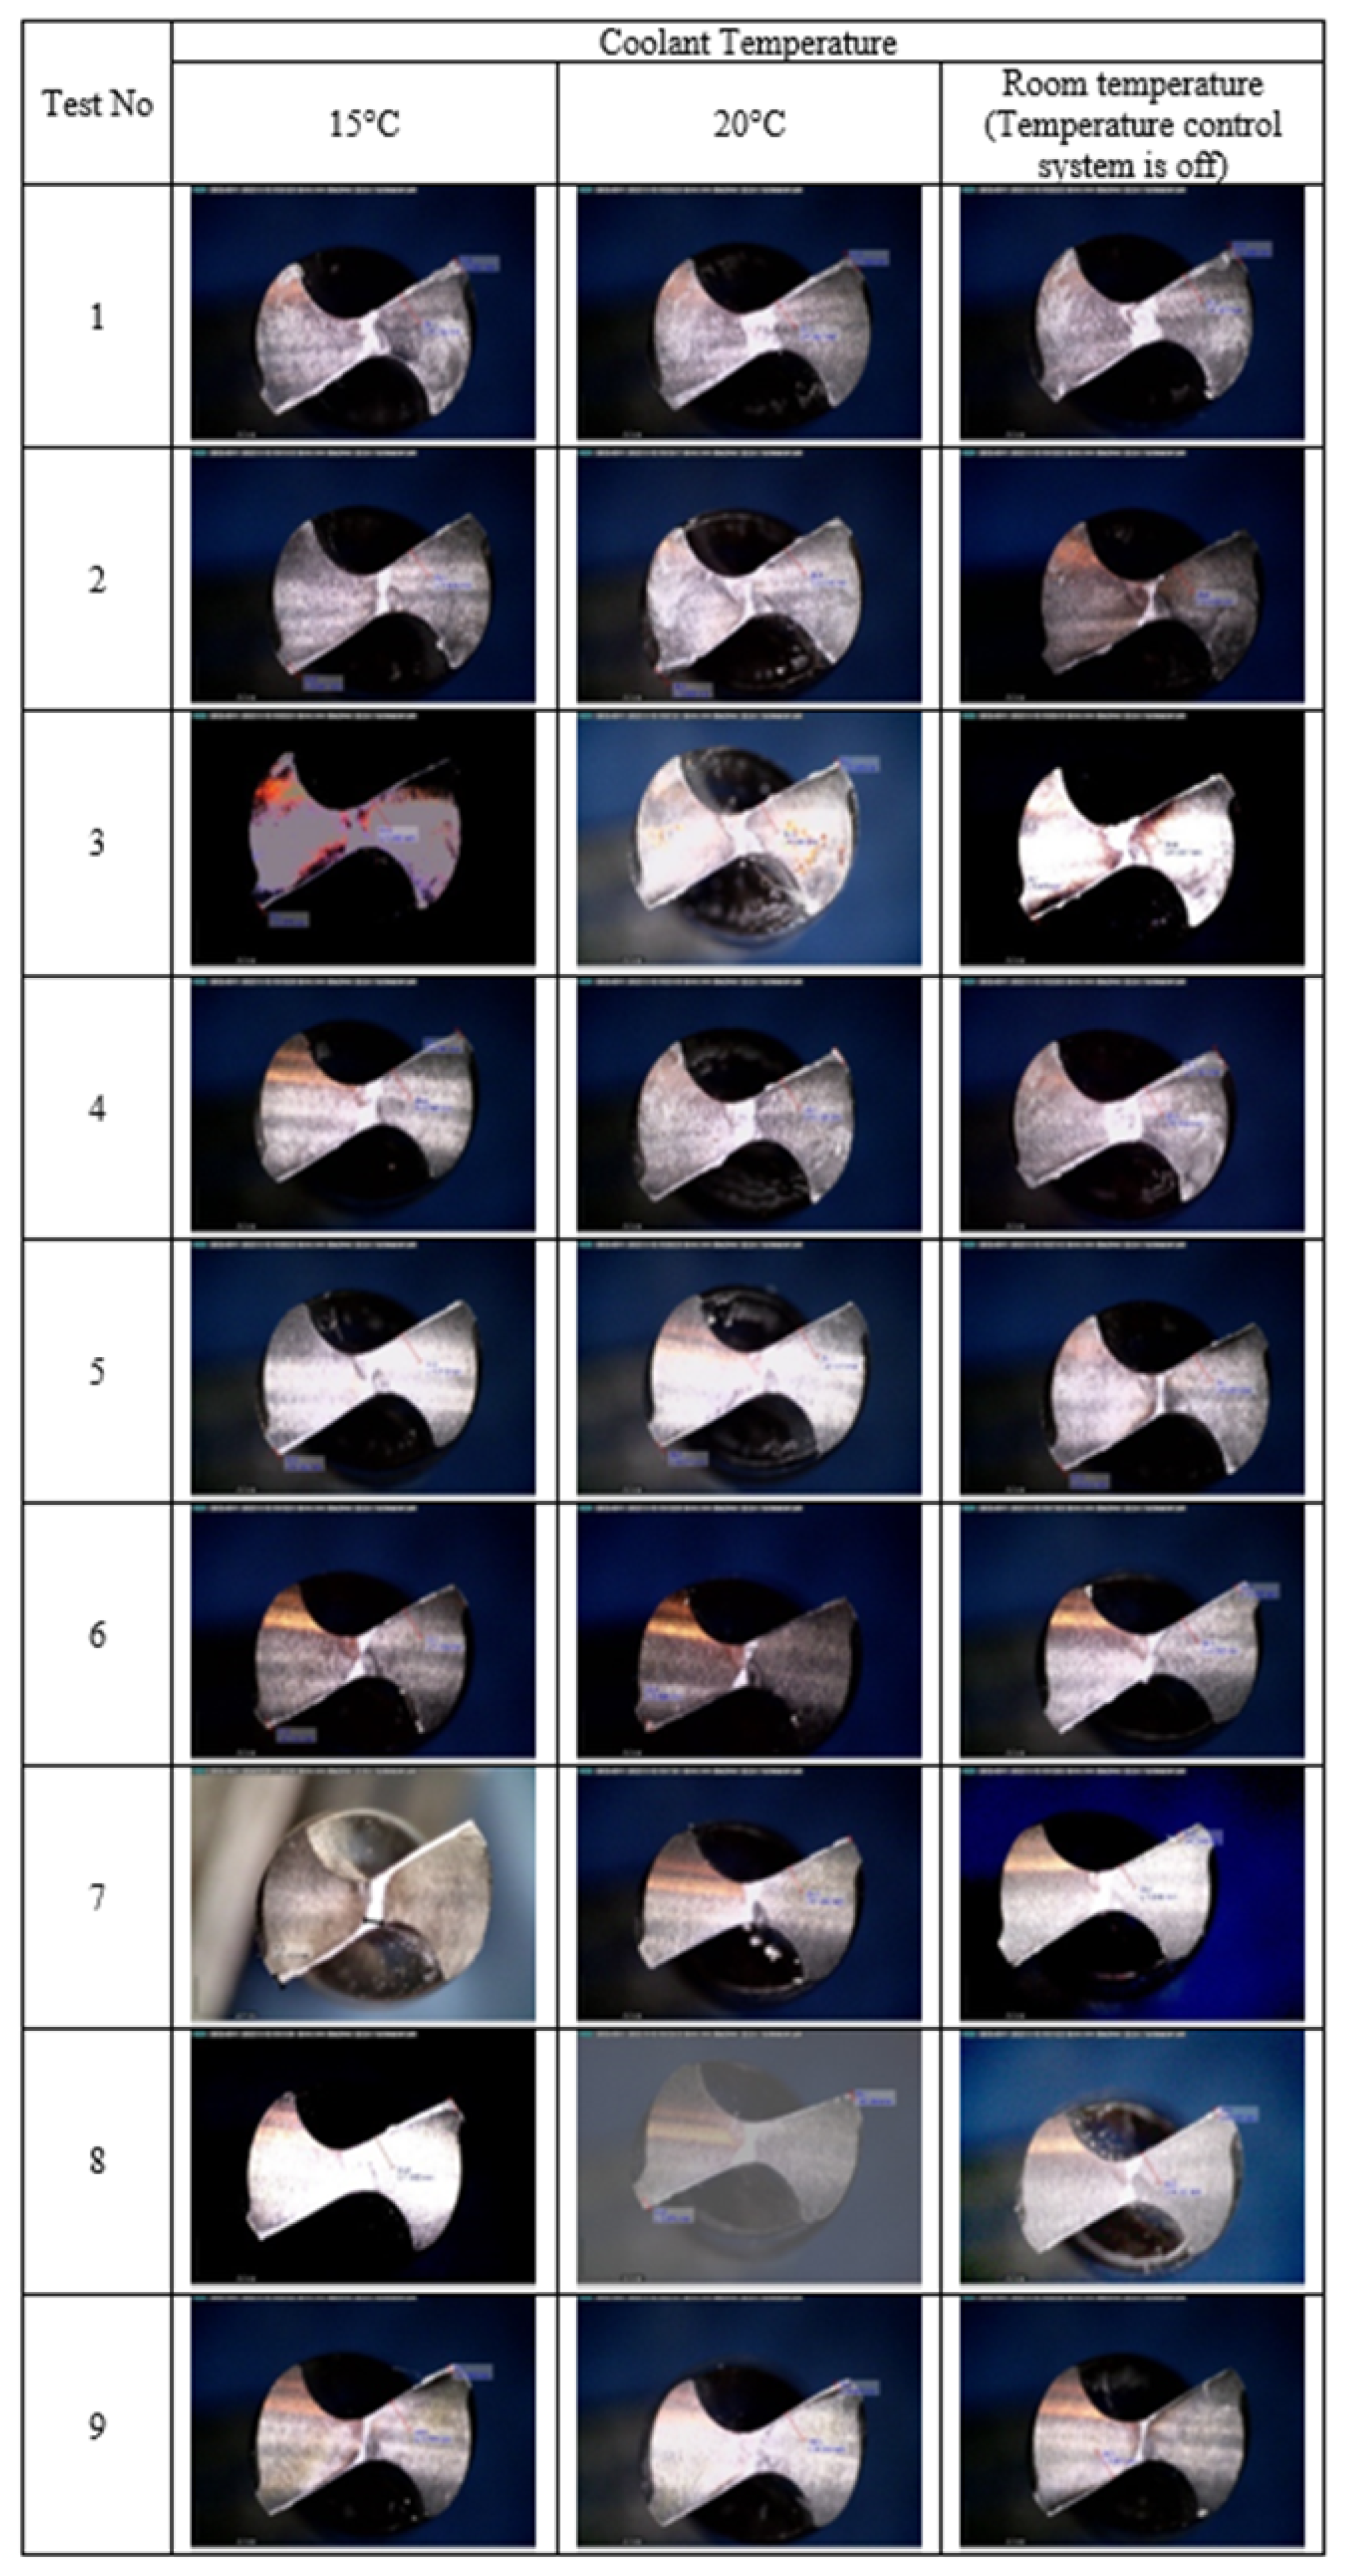
In the experiment, each part was drilled with a separate drill bit and a total of 27 drill bits was used. In order to evaluate tool wear, all drills used were viewed with the digital microscope introduced in the material method section. The images obtained are shown in Figure 9.
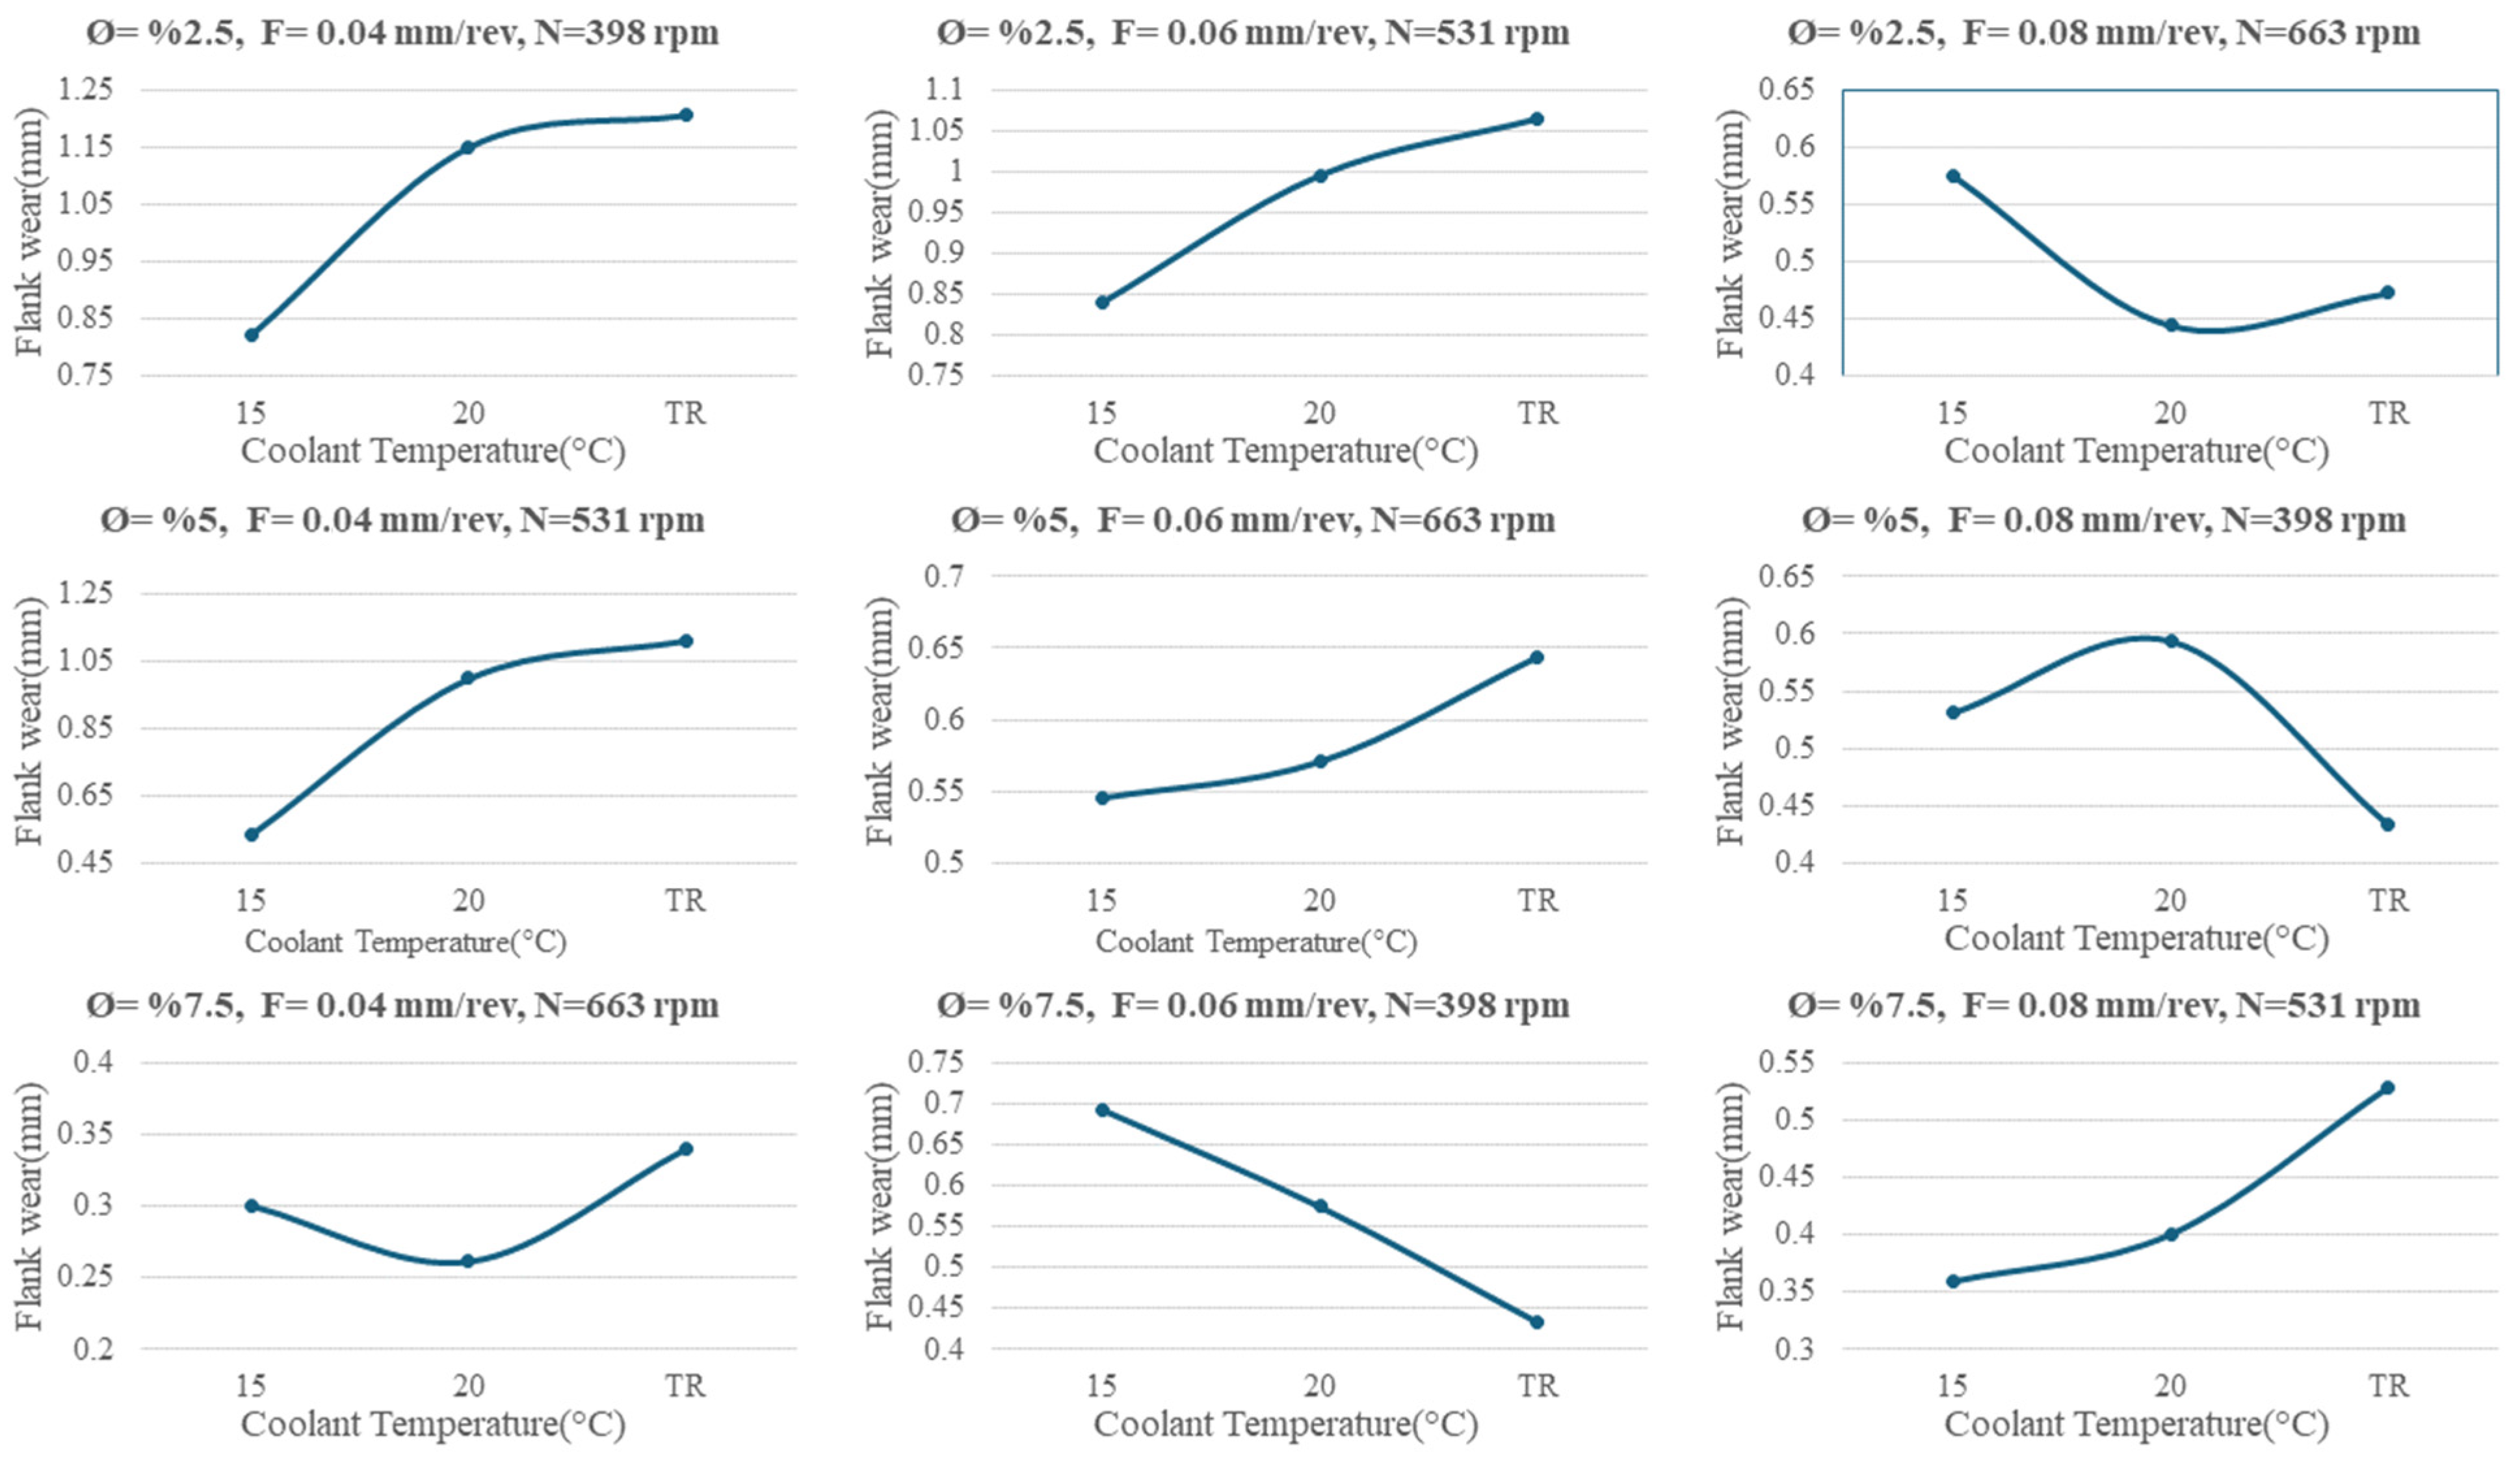
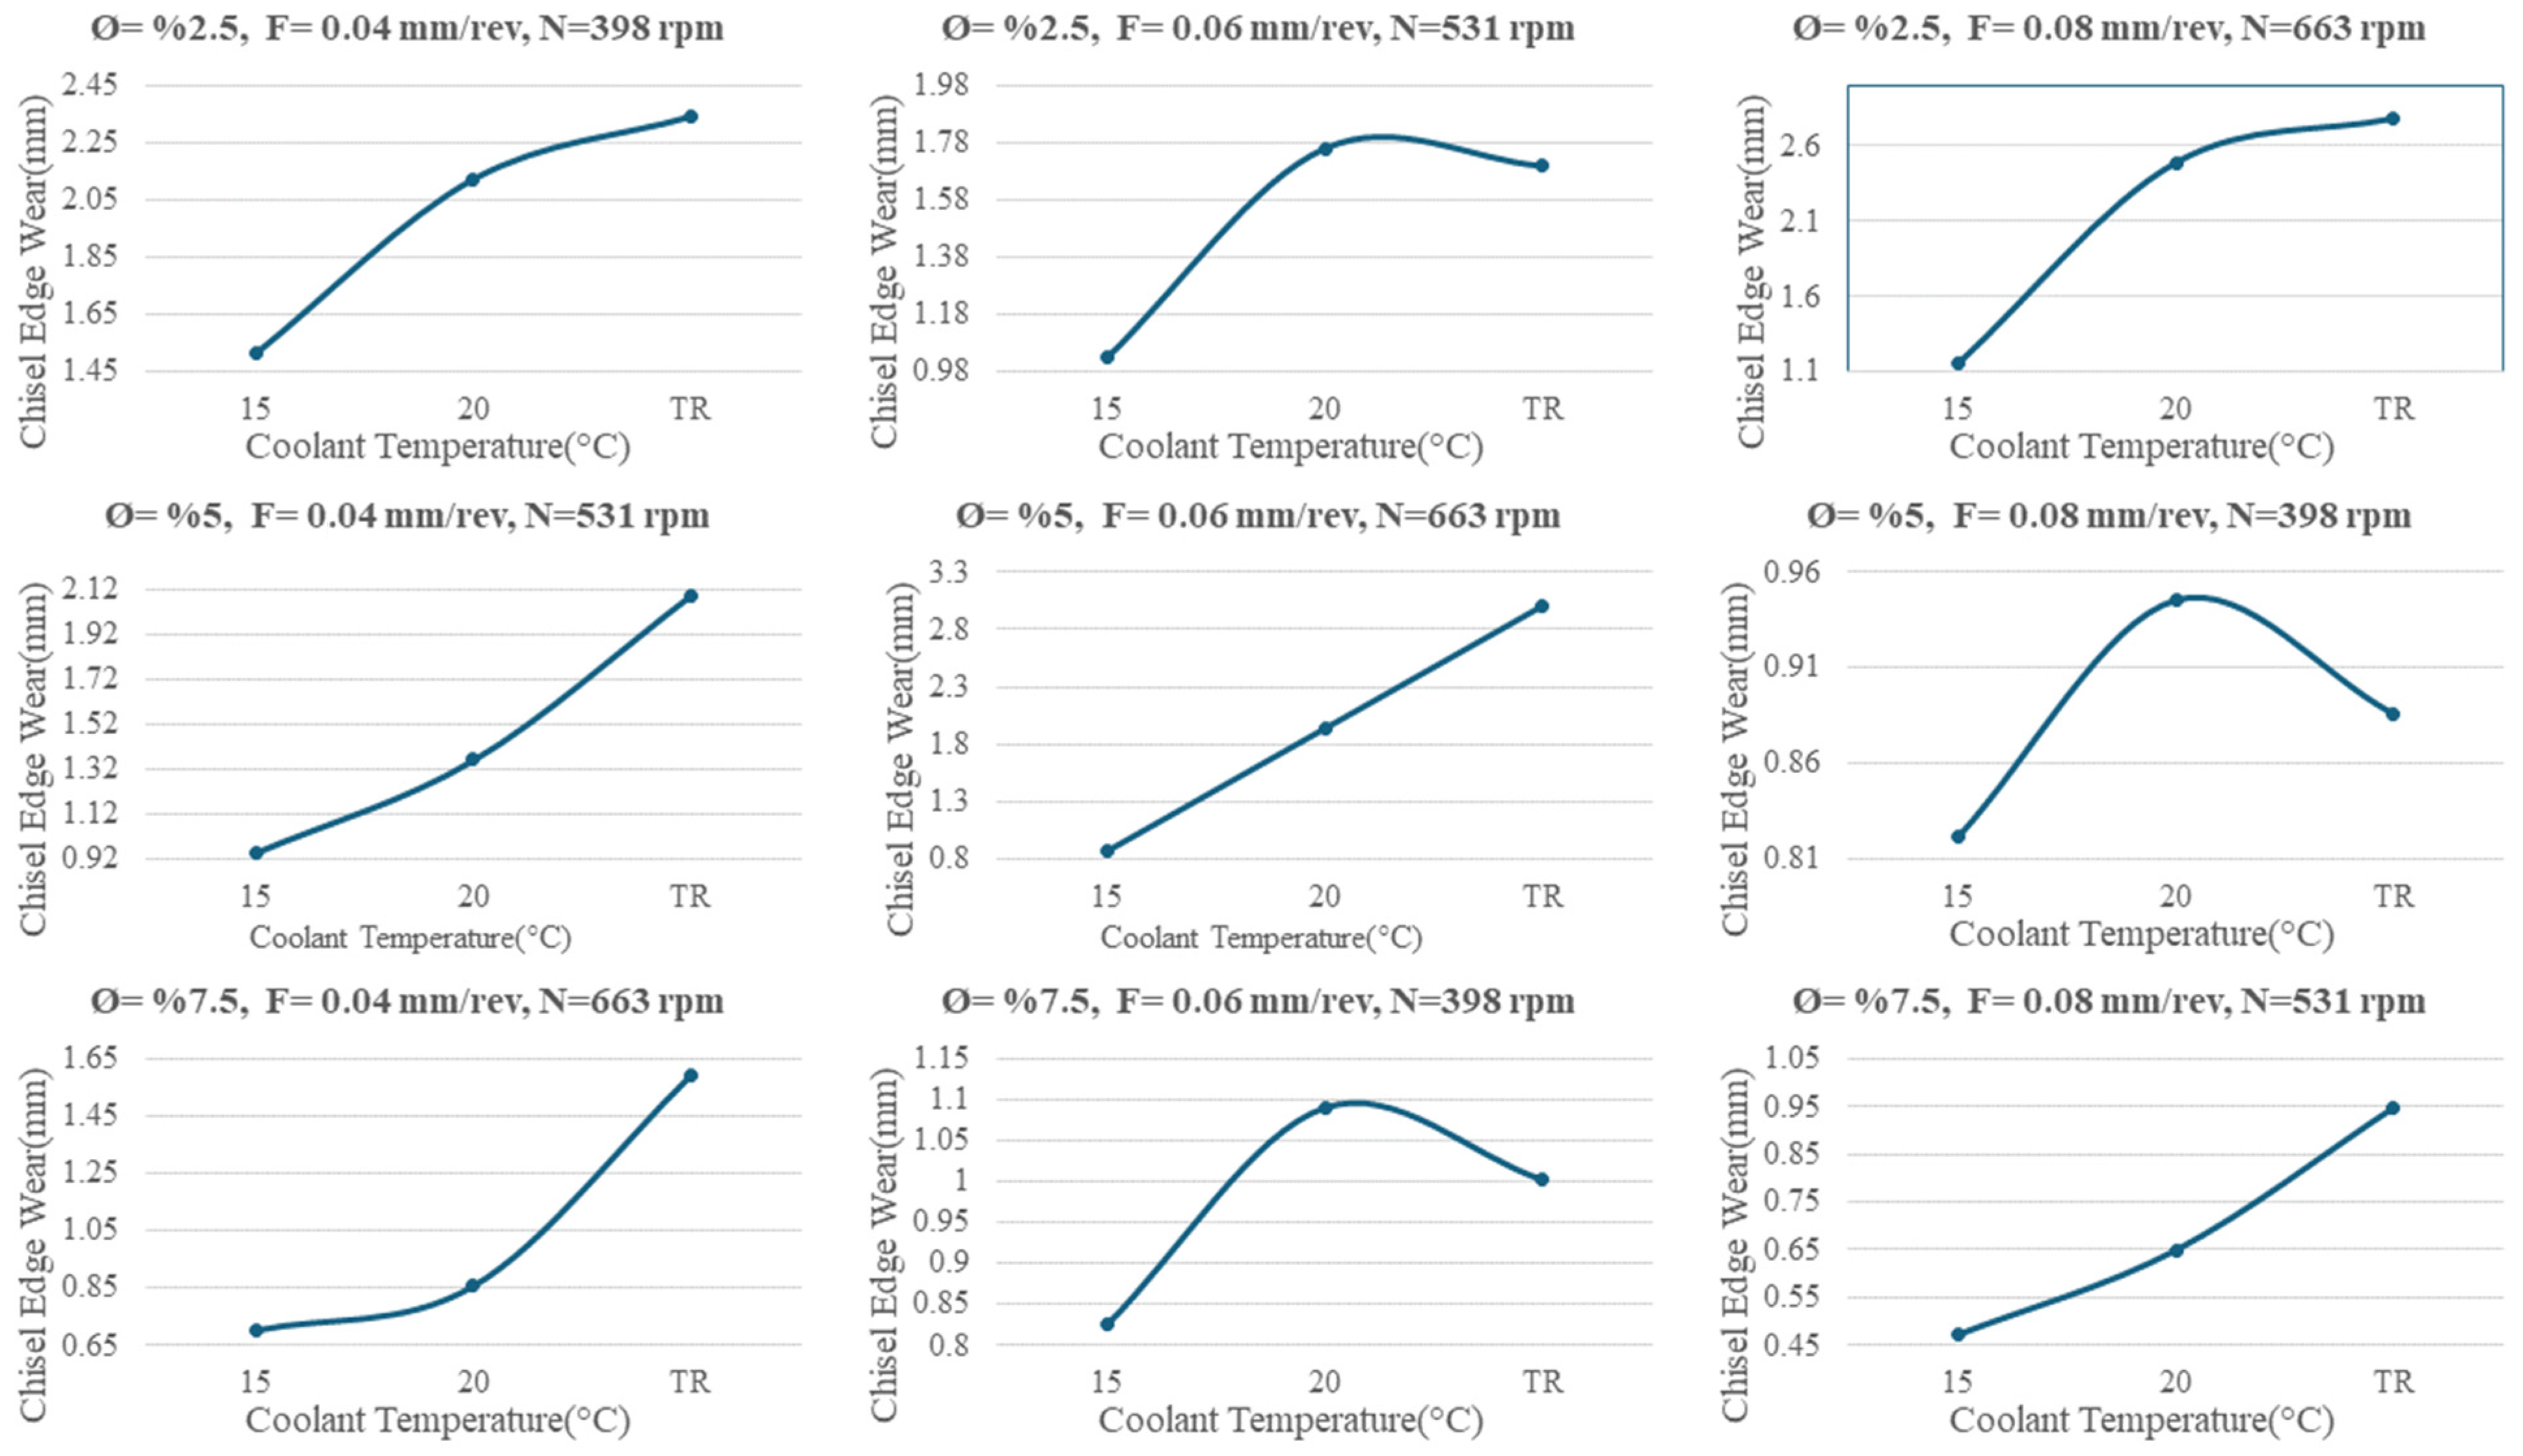
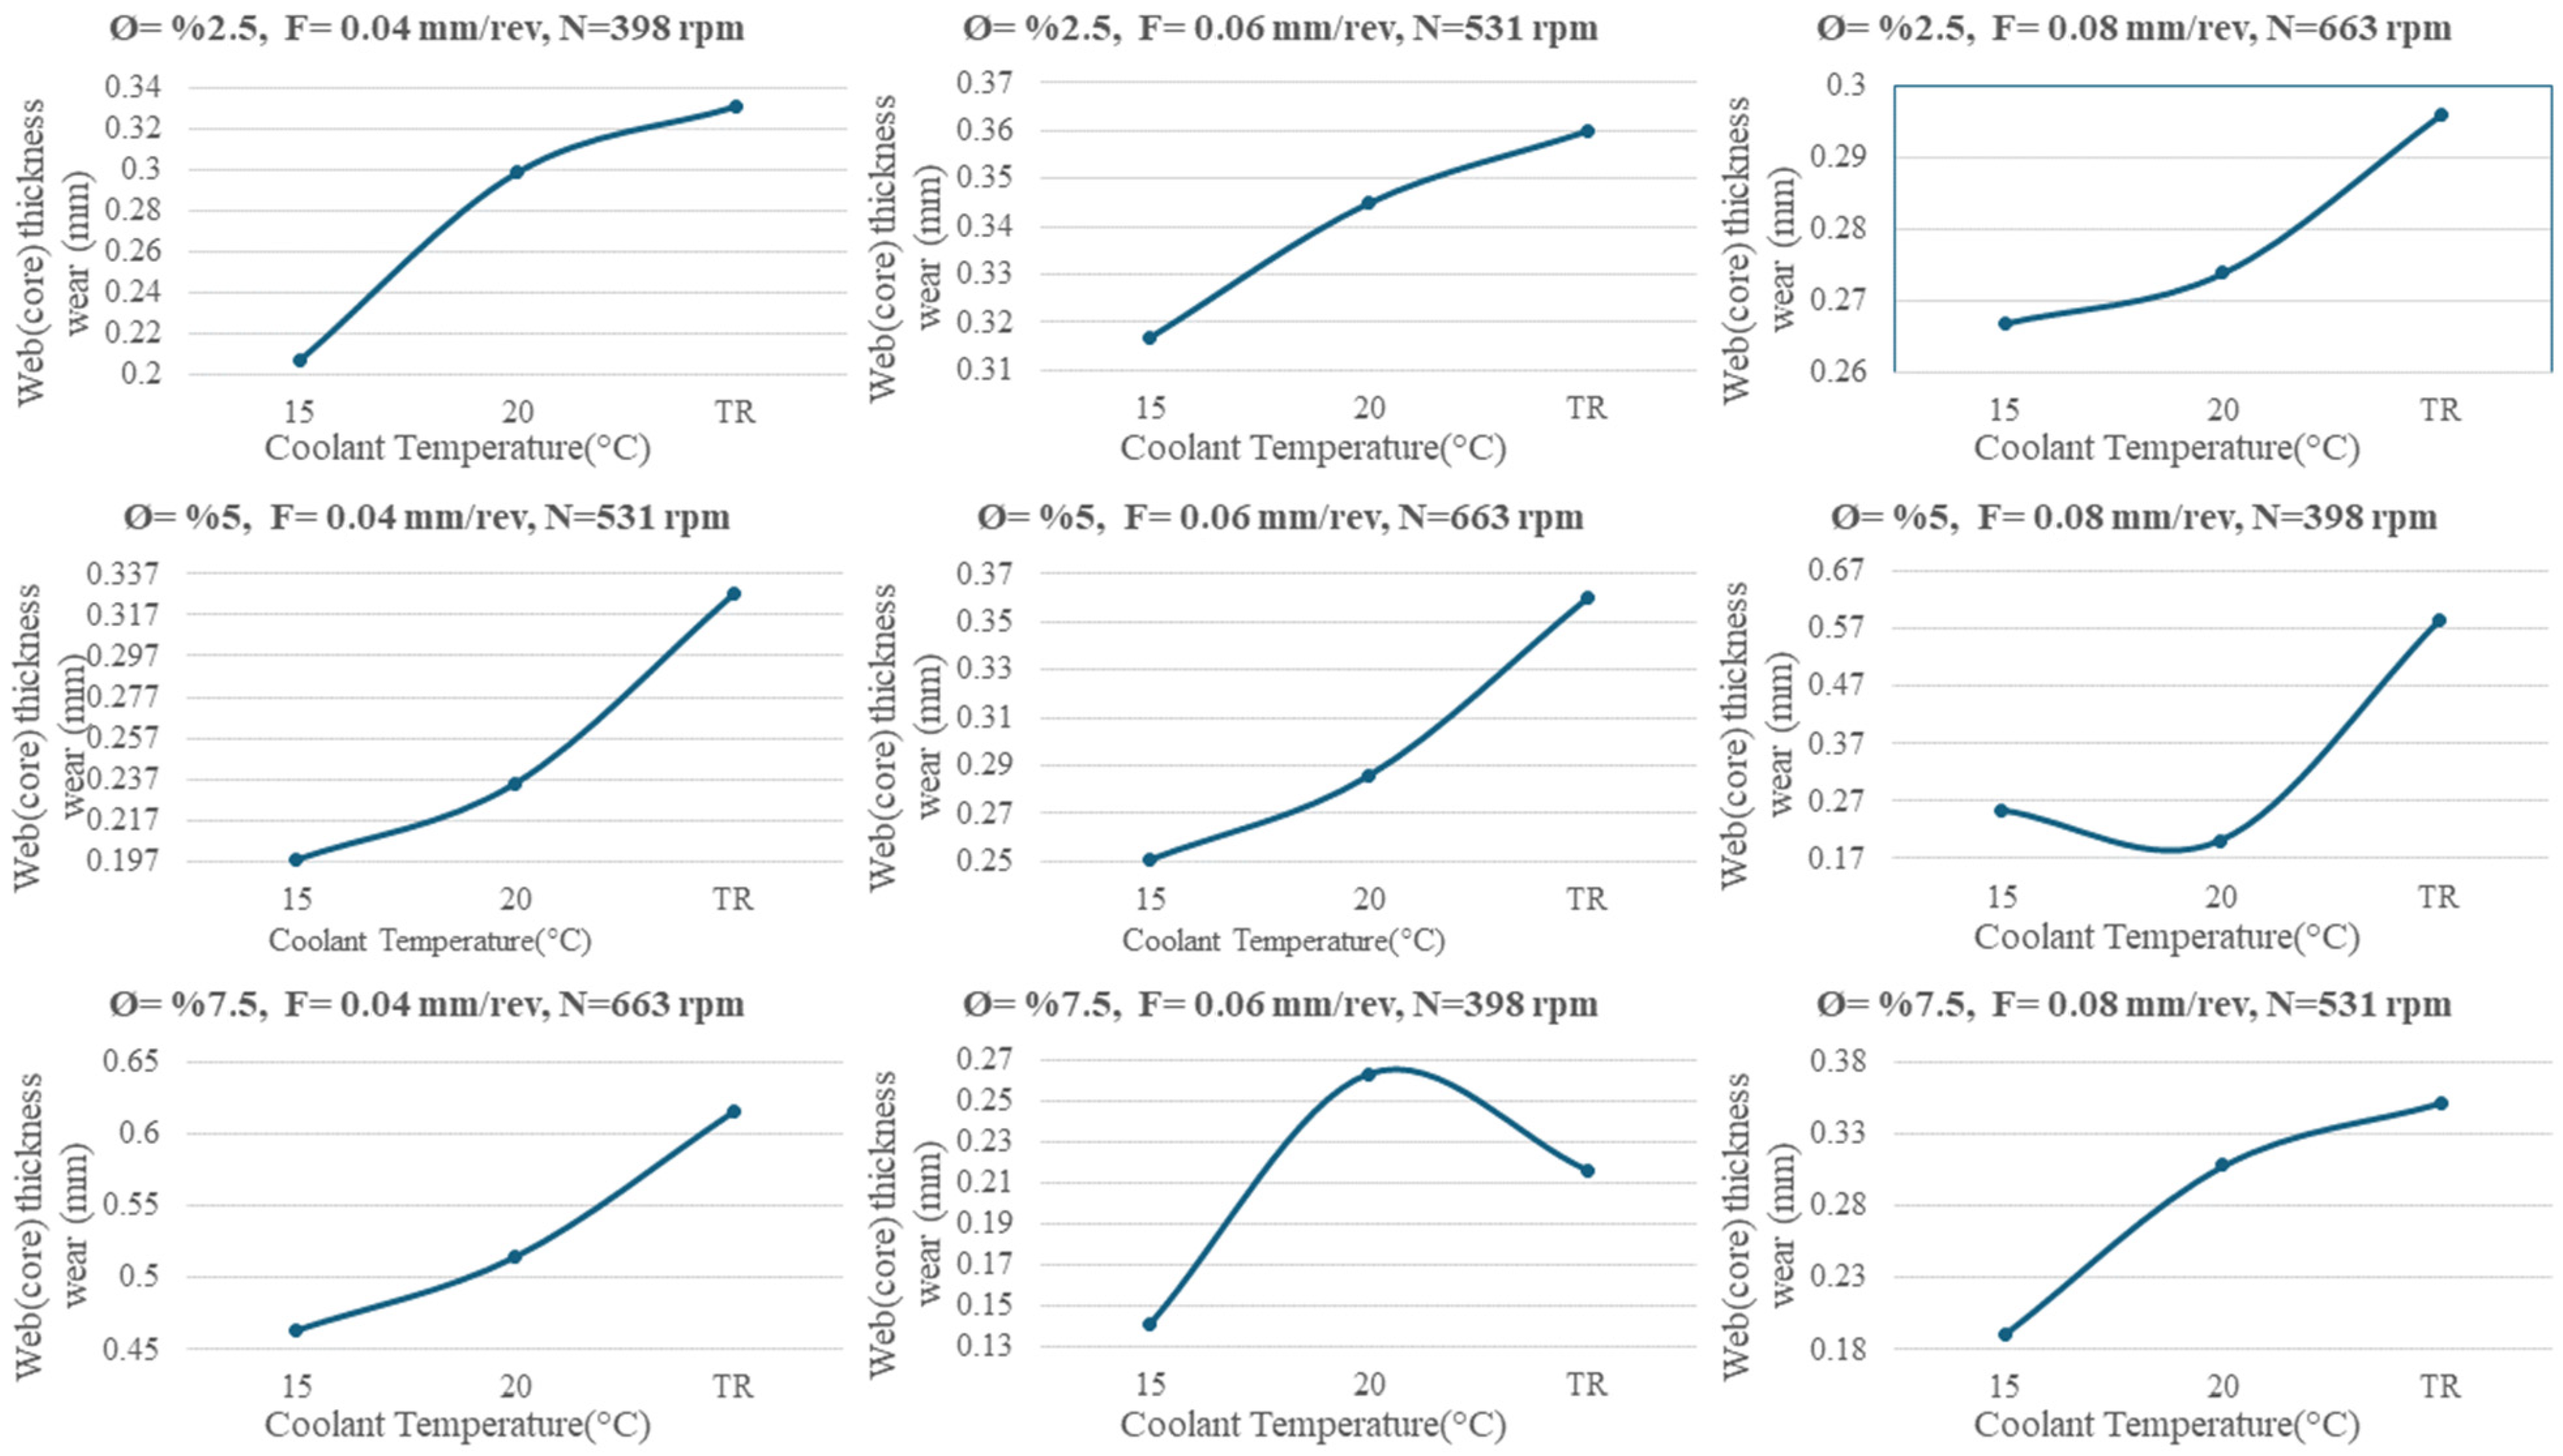
In this section, the three most important dominant wear mechanisms affecting drill bit lifespan are analyzed. These are flank wear, chisel edge wear and web (core) thickness wear. Thanks to the developed heat recovery system, experiments were carried out at constant coolant temperatures of 15 °C and 20 °C using the control system, and at room temperature without operating the control system. Cutting parameters, such as cutting speed, feed rate and coolant emulsion ratio, are varied for each coolant temperature. The results show that drill bit wear increases with increasing temperature in almost all wear types. In other words, it is observed that tool life increases significantly in drilling operations performed at low constant temperatures 15 °C. This situation is clearly seen in Table 4 and Figure 10, Figure 11 and Figure 12. This general result is consistent with similar studies in the literature [28,29,30].
In Figure 10, Figure 11 and Figure 12, respectively, flank wear, chisel edge wear and web (core) thickness wear graphs are given separately depending on the coolant temperature. Here, there are nine graphs for each wear type. Two to three of them are different from the expected general results. In these graphs, drilling parameters and coolant emulsion rates change with temperature, and all of them interact with each other. Thus, in some cases, other parameters may have a more dominant effect on tool wear than coolant temperature. Therefore, the fact that some graphs differ from the general trend can be interpreted as such. In this study, the Taguchi method is used to observe the effect of each parameter on tool wear in comparison with each other. Thus, the optimum cutting parameters for minimum tool wear can be determined.

3.2. Statistical Analysis of Tool Wear

The Taguchi Method is used for the statistical analysis of the experimental results. The Taguchi Method is a powerful tool used in experimental design, and enables systematic and efficient evaluation of the effects of different parameter combinations used in experiments on tool wear. Thus, by analyzing experimental results with signal/noise (S/N) ratios, it is possible to determine the most appropriate parameter combinations that minimize tool wear and extend tool life. For the statistical evaluation of tool wear, only flank wear is considered given the page limitation of this article. On the other hand, flank wear is widely accepted as one of the most critical types of tool wear affecting tool life. Flank wear is the type of wear that determines when a tool needs to be replaced and affects cutting performance the most. This situation is discussed in many studies [31].

3.2.1. Tool Wear for 15 °C Coolant Temperature

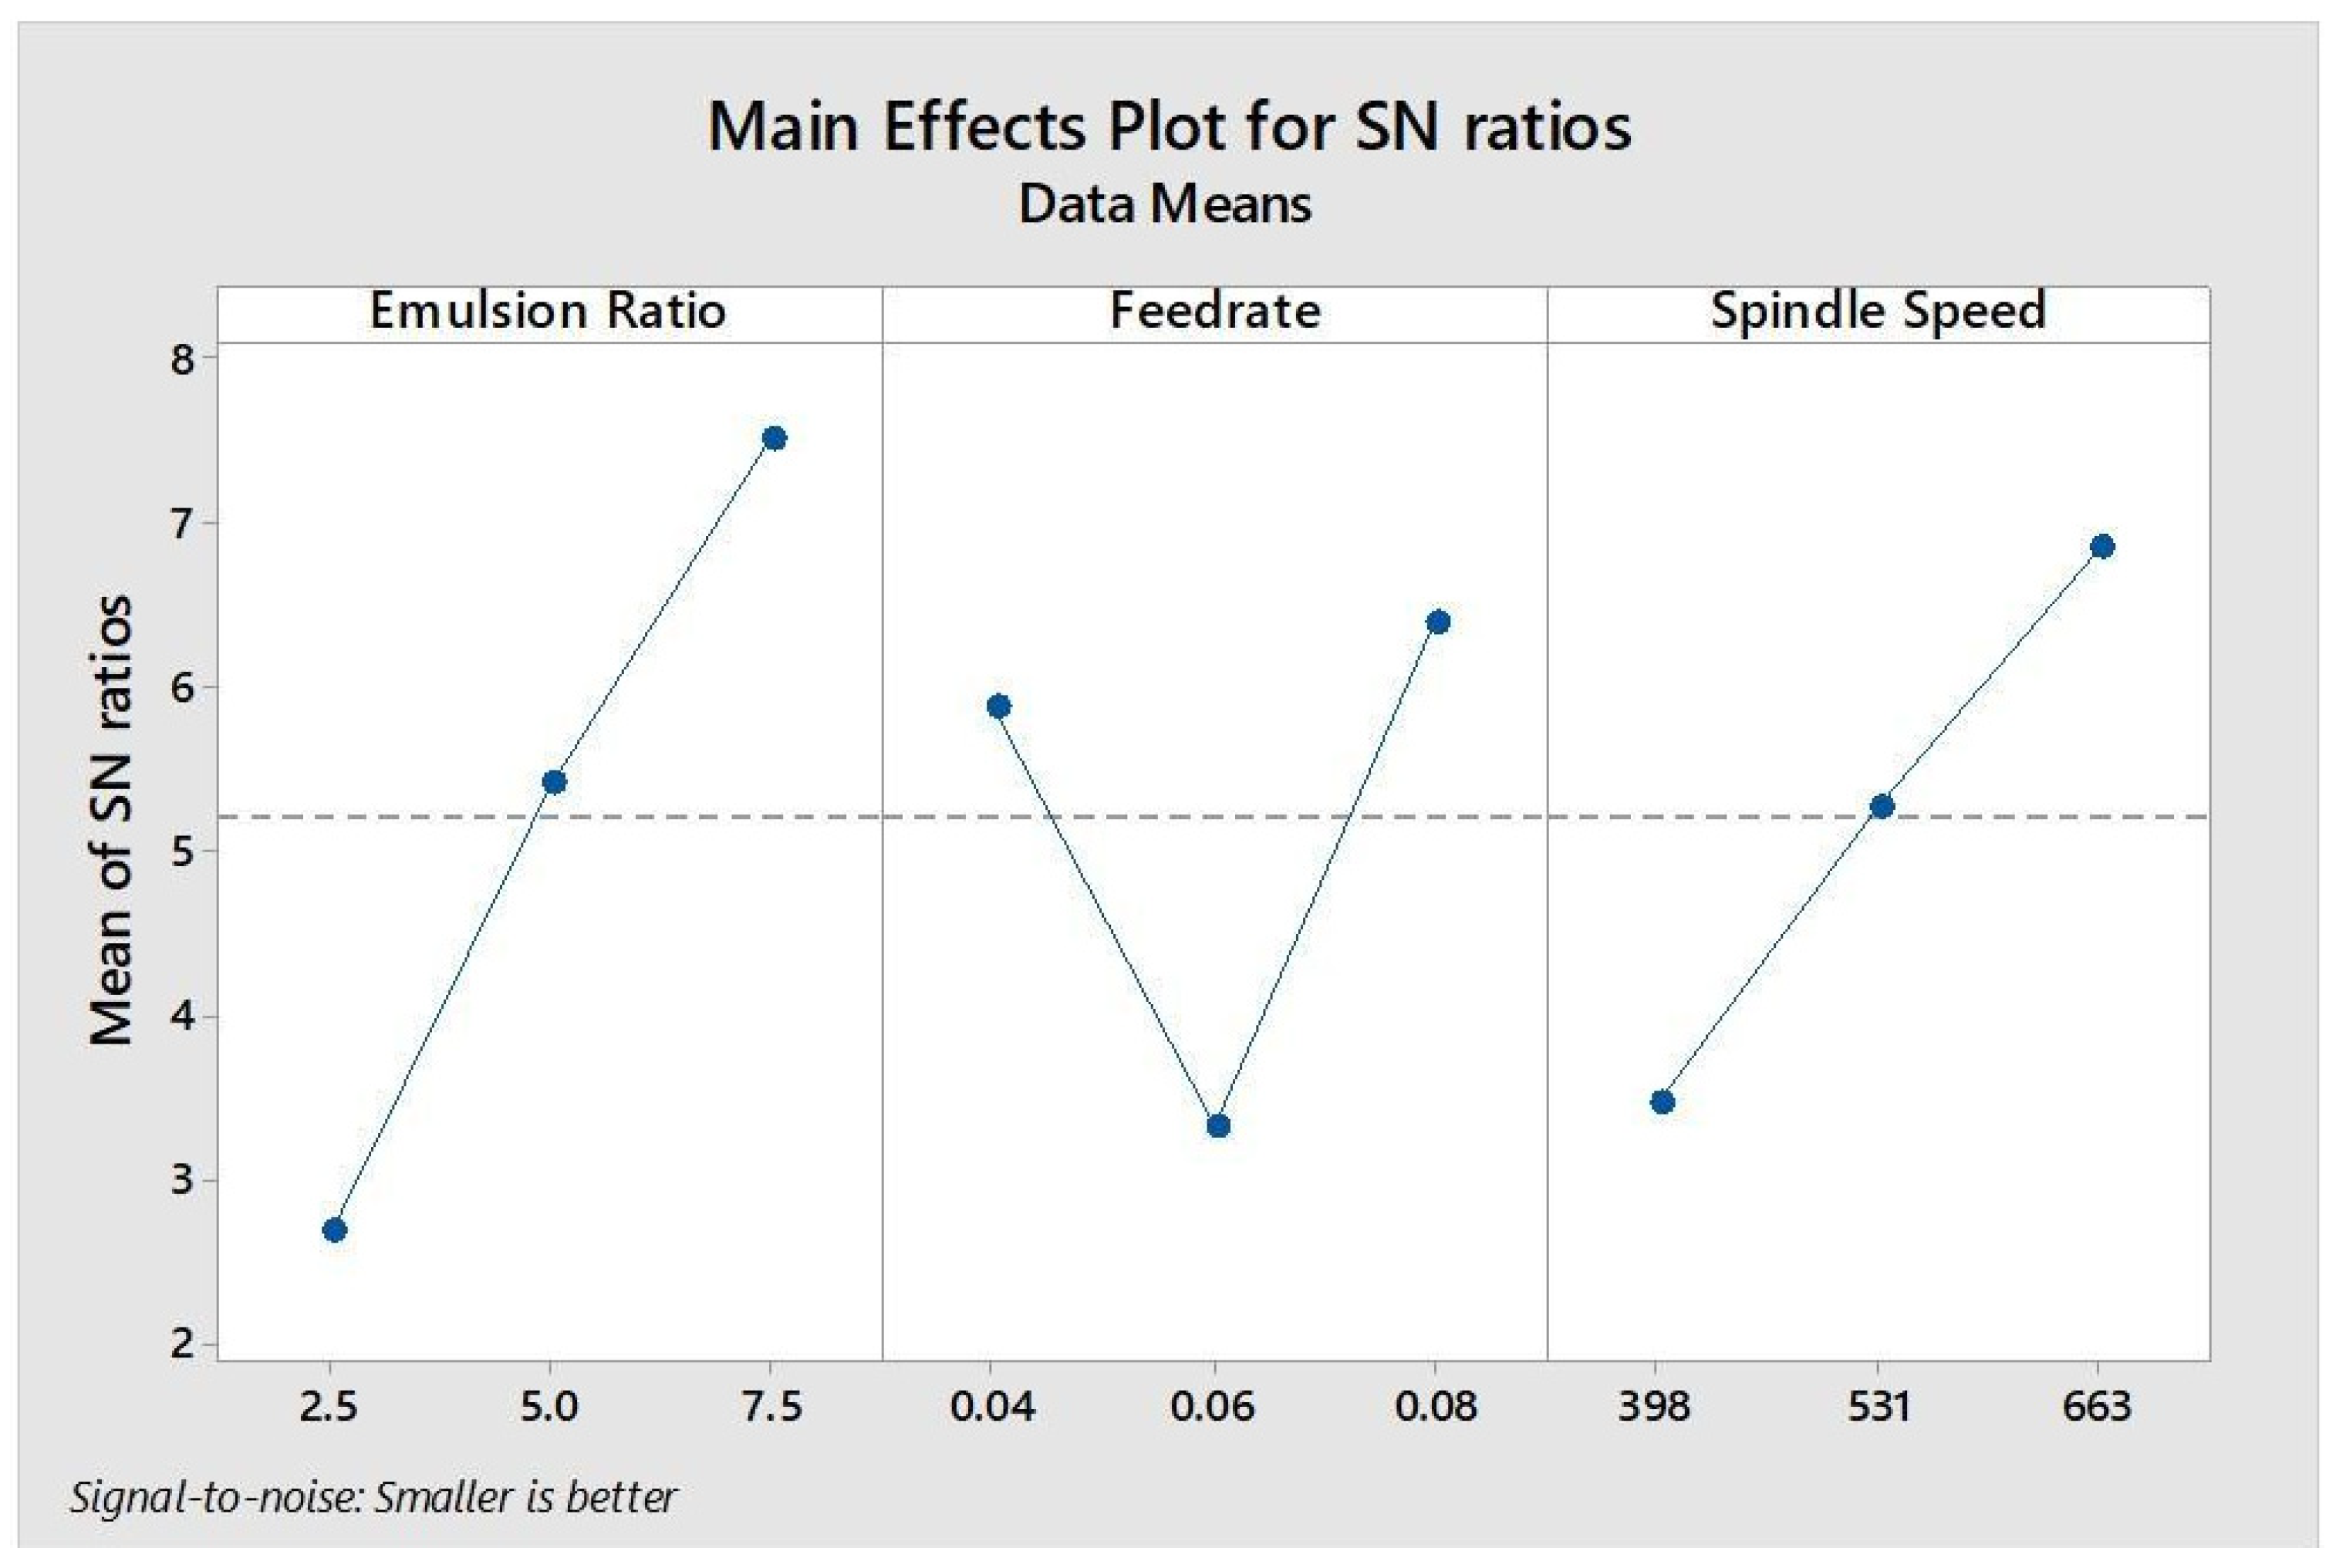
The variance table of S/N ratios is evaluated according to the p column. The smallest value in the p column provides the most significant impact on the results of the analysis. The variance analysis of S/N ratios for flank wear in the drilling process where the coolant is set to 15 °C is given in Table 5. The analysis was performed with 96.2% accuracy. The values in the p column in this table show the effect of each variable on flank wear. It can be seen from the table that the most effective parameter on flank wear is the emulsion ratio (p = 0.071).
Figure 13 shows the flank wear S/N analysis graph. In this graph, the value that gives the largest signal/noise ratio for each parameter is the optimum. Accordingly, the optimum values for 15 °C are as follows: emulsion ratio: 7.5%; feed rate: 0.08 mm/rev; and spindle speed: 663 rpm. In addition, when the difference between the maximum and minimum S/N ratios of the parameters in this graph is examined separately, it is seen that the parameter with the maximum difference is the most effective parameter as a result of the analysis. Accordingly, the emulsion ratio was determined to be the most effective parameter. This result is consistent with variance analysis.
Figure 14 shows contour graphs for the same analysis values. As can be clearly seen in these graphs, wear decreases significantly as the emulsion ratio increases.

3.2.2. Tool Wear for 20 °C Coolant Temperature

When the coolant is set to 20 °C, the variance analysis of S/N ratios for flank wear in the drilling process is presented in Table 6. The analysis was performed with 96.84% accuracy. In this table, the values in the p column show the effect of each variable on flank wear. As can be seen from the table, the most effective parameter for flank wear is the emulsion ratio (p = 0.065). Figure 15 also shows the flank wear S/N analysis graph. In this graph, the value that gives the largest signal/noise ratio for each parameter is optimum. Accordingly, the optimum values for 20 °C are as follows: emulsion ratio: 7.5%; feed rate: 0.08 mm/rev; and spindle speed: 663 rev/minute. In addition, when the difference between the maximum and minimum S/N ratios of the parameters is examined separately in this graph, the parameter with the largest difference gives the most effective parameter as a result of the analysis. Accordingly, the emulsion ratio was determined as the most effective parameter. This result is also consistent with the results of variance analysis. Contour graphs for 20 °C are shown in Figure 16. As can be clearly seen from these graphs, wear decreases significantly as the emulsion ratio increases.

3.2.3. Tool Wear When Coolant Temperature Is Not Controlled (At Room Temperature)

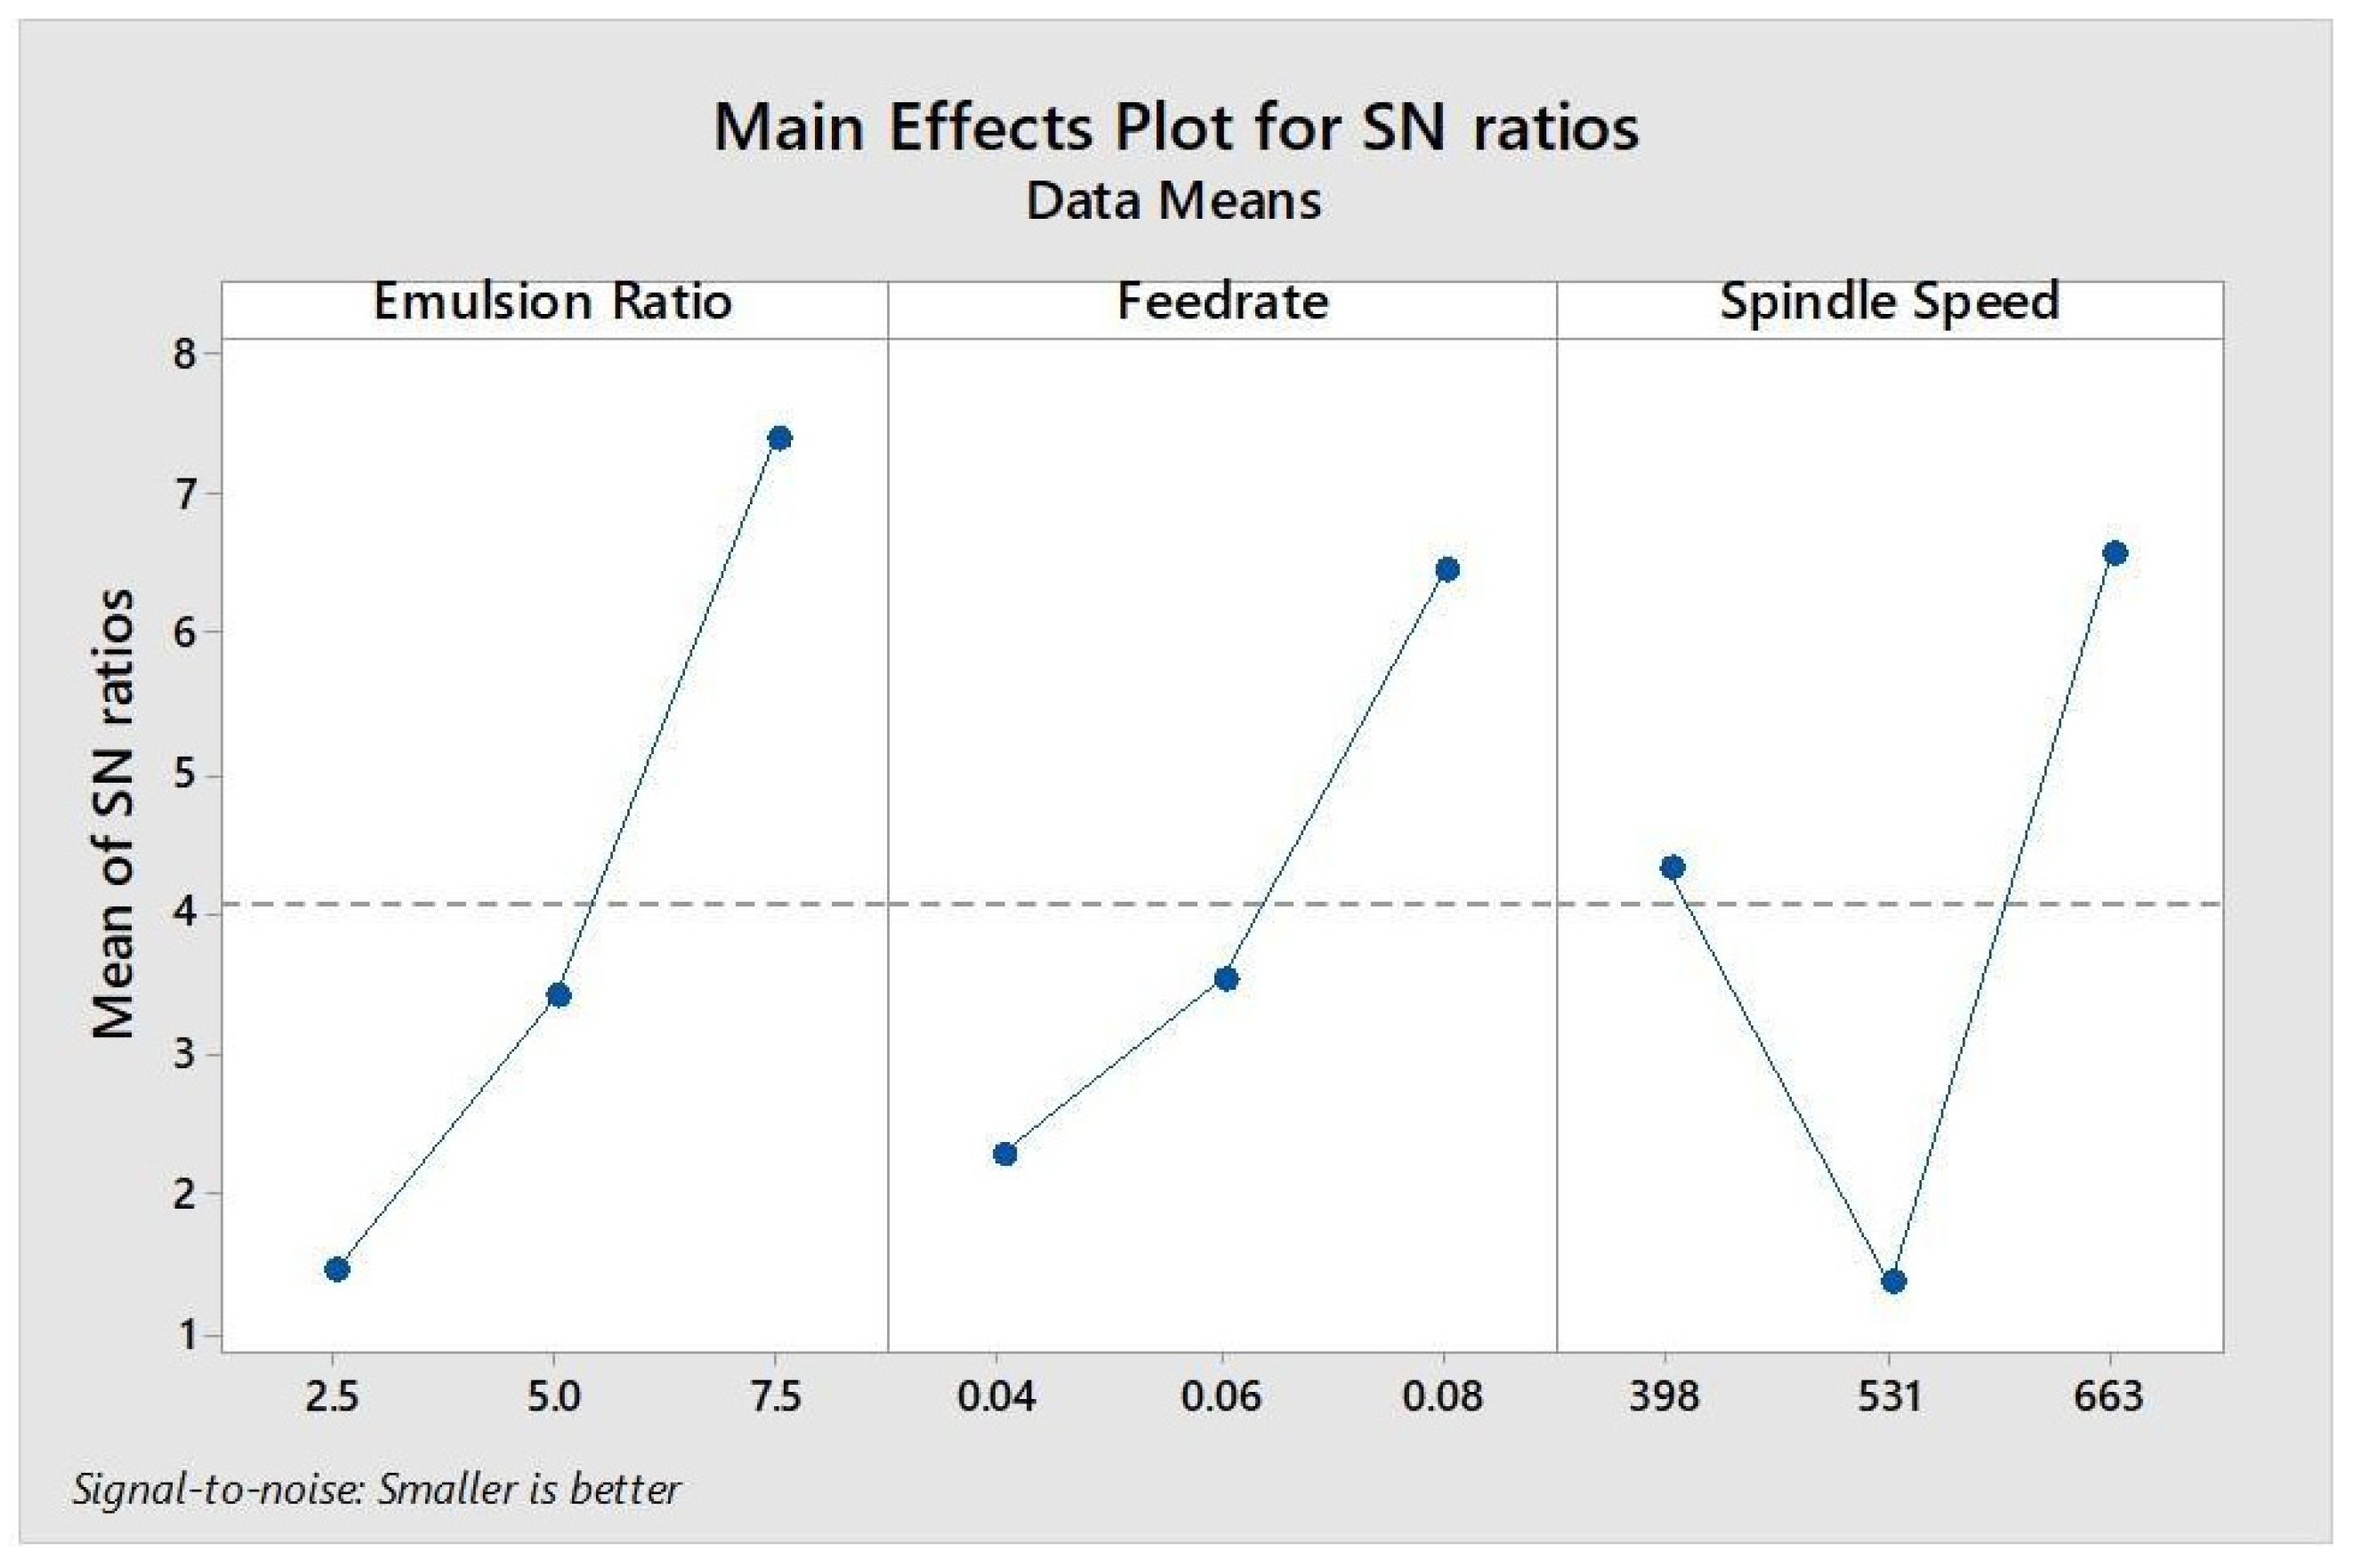
The variance analysis of S/N ratios for flank wear in the drilling process when the heat recovery system was not in operation (in room temperature conditions) is shown in Table 7. The analysis was performed with 91.26% accuracy. The values in the p column in this table show the effect of each variable on flank wear. As can be seen from the table, the most effective parameter on flank wear is the emulsion ratio (p = 0.177).
Figure 17 shows the S/N analysis graphs of flank wear. In these graphs, the value that gives the largest signal/noise ratio for each parameter is optimum. Accordingly, the optimum values for the drilling process where the cooling system device is not operated (at room temperature) were as follows: emulsion ratio: 7.5; feed rate: 0.08; and spindle speed: 663. In addition, when the difference between the maximum and minimum S/N ratios of the parameters is examined separately in this graph, the parameter with the largest difference gives the most effective value. Accordingly, it seems that the emulsion ratio is the most effective parameter. This result is also consistent with the results of analysis of variance.
Contour graphs of the drilling process are shown in Figure 18 for when the heat recovery system was not in operation (at room temperature). It is clearly seen from these graphs that wear decreases significantly as the emulsion ratio increases.

4. Conclusions

This study provides an important contribution to the field of machining by developing and implementing a comprehensive coolant temperature control system. The findings highlight the profound effect of controlled coolant temperature on cutting performance, tool wear and tool life. In particular, keeping the coolant at a lower temperature (15 °C) has led to significant improvements in these areas. The effective management of coolant temperature significantly reduces wear on cutting tools and extends tool life. On the other hand, it has been observed that the coolant emulsion ratio is the most effective parameter for tool wear at all coolant temperatures. With the widespread use of the coolant temperature control system, the number of tools used in the machine and the amount of coolant used will decrease. Thus, the negative effects of waste from machining on the environment will also decrease.
As a result, it is clear that significant benefits will be provided in terms of cutting performance and extending tool life by integrating this coolant system into CNC machining processes. It is expected that the innovative approach of this study will not only improve the machining process but also make significant contributions to sustainable production goals. Furthermore, it is hoped that the system will have a more widespread impact if it is adapted to other relevant means of production.

5. Future Studies

In this context, the following studies can be carried out in the future:
  • Using coolant at extremely low temperatures, especially when machining steel, can pose risks such as thermal shock, increased tool wear and changes in material behavior. In this regard, it would be beneficial to conduct tests at coolant temperatures lower than 15 °C in the future.
  • A new study can be conducted with different optimization techniques, including heuristic optimization algorithms using experimental data from this study. In this context, a multi-objective optimization study can also be carried out to ensure that tool life is maximized.
  • According to the obtained results, a programmable cooling system that can automatically adjust the cooling system of the machine tool according to the cutting parameters and processing conditions can be developed and adapted to the machine tool. This application study can be formatted as a scientific publication and presented as a case study.
  • Studies can be carried out to adapt the developed system to other related production tools, such as lathes and milling and injection machines.

6. Patents

The inventions developed during this study are protected by the patent titled [Coolant Temperature Compensation and Heat Recovery Device in Machining] with the patent number [201922131] registered under the name of [Osman Şahin].

Author Contributions

Methodology, M.A.E., E.N. and Ö.S.; Formal analysis, Ö.S.; Investigation, O.Ş.; Resources, O.Ş. and M.A.E.; Data curation, O.Ş. and Ö.S.; Writing—original draft, O.Ş. and D.K.; Supervision, D.K.; Project administration, D.K. All authors have read and agreed to the published version of the manuscript.

Funding

This research received no external funding.

Data Availability Statement

The original contributions presented in the study are included in the article, further inquiries can be directed to the corresponding author.

Acknowledgments

This research was supported by Sakarya University of Applied Sciences Scientific Research Projects Coordination within the scope of the project numbered [066-2022] and titled [Analysis of Cooling Process and Heat Recovery in Machining]. We thank our institution for their funding and support.

Conflicts of Interest

The authors declare that they have no known competing financial interests or personal relationships that could have appeared to influence the work reporte d in this paper.

References

  1. Wang, Q.; Zhang, D.; Chen, B.; Zhang, Y.; Wu, B. Energy Consumption Model for Drilling Processes Based on Cutting Force. Appl. Sci. 2019, 9, 4801. [Google Scholar] [CrossRef]
  2. Balogun, V.A.; Mativenga, P.T. Modelling of Direct Energy Requirements in Mechanical Machining Processes. J. Clean. Prod. 2013, 41, 179–186. [Google Scholar] [CrossRef]
  3. Bi, Z.M.; Wang, L. Optimization of Machining Processes from the Perspective of Energy Consumption: A Case Study. J. Manuf. Syst. 2012, 31, 420–428. [Google Scholar] [CrossRef]
  4. Moradnazhad, M.; Unver, H.O. Energy Efficiency of Machining Operations: A Review. Proc. Inst. Mech. Eng. B J. Eng. Manuf. 2017, 231, 1871–1889. [Google Scholar] [CrossRef]
  5. Li, C.; Xiao, Q.; Tang, Y.; Li, L. A Method Integrating Taguchi, RSM and MOPSO to CNC Machining Parameters Optimization for Energy Saving. J. Clean. Prod. 2016, 135, 263–275. [Google Scholar] [CrossRef]
  6. Li, L.; Li, C.; Tang, Y.; Li, L. An Integrated Approach of Process Planning and Cutting Parameter Optimization for Energy-Aware CNC Machining. J. Clean. Prod. 2017, 162, 458–473. [Google Scholar] [CrossRef]
  7. Li, L.; Li, C.; Tang, Y.; Yi, Q. Influence Factors and Operational Strategies for Energy Efficiency Improvement of CNC Machining. J. Clean. Prod. 2017, 161, 220–238. [Google Scholar] [CrossRef]
  8. KIYAK, M. Investigation of the Effect of Drill Bit Feature on Hole Surface Quality and Tool Wear. DÜMF Mühendislik Derg. 2021, 12, 661–667. [Google Scholar] [CrossRef]
  9. Aamir, M.; Giasin, K.; Tolouei-Rad, M.; Vafadar, A. A Review: Drilling Performance and Hole Quality of Aluminium Alloys for Aerospace Applications. J. Mater. Res. Technol. 2020, 9, 12484–12500. [Google Scholar] [CrossRef]
  10. Gaitonde, V.N.; Karnik, R.S.; Davim, J.P. Minimum Quantity Lubrication in Machining. In Sustainable Manufacturing; Wiley: Hoboken, NJ, USA, 2013; pp. 79–110. [Google Scholar]
  11. Jiang, Z.; Zhou, F.; Zhang, H.; Wang, Y.; Sutherland, J.W. Optimization of Machining Parameters Considering Minimum Cutting Fluid Consumption. J. Clean. Prod. 2015, 108, 183–191. [Google Scholar] [CrossRef]
  12. Pradeepkumar, M.; Amarnath, K.; Sunilkumar, M. A Review on Heat Generation in Metal Cutting. Int. J. Eng. Manag. Res. 2015, 5, 193–197. [Google Scholar]
  13. Grzesik, W. Modelling of Heat Generation and Transfer in Metal Cutting: A Short Review. J. Mach. Eng. 2020, 20, 24–33. [Google Scholar] [CrossRef]
  14. Abukhshim, N.A.; Mativenga, P.T.; Sheikh, M.A. Heat Generation and Temperature Prediction in Metal Cutting: A Review and Implications for High Speed Machining. Int. J. Mach. Tools Manuf. 2006, 46, 782–800. [Google Scholar] [CrossRef]
  15. Yan, P.; Rong, Y.; Wang, G. The Effect of Cutting Fluids Applied in Metal Cutting Process. Proc. Inst. Mech. Eng. B J. Eng. Manuf. 2016, 230, 19–37. [Google Scholar] [CrossRef]
  16. Sarıkaya, M.; Güllü, A. Taguchi Design and Response Surface Methodology Based Analysis of Machining Parameters in CNC Turning under MQL. J. Clean. Prod. 2014, 65, 604–616. [Google Scholar] [CrossRef]
  17. Akhil, C.S.; Ananthavishnu, M.H.; Akhil, C.K.; Afeez, P.M.; Akhilesh, R.; Rahul, R. Measurement of Cutting Temperature during Machining. IOSR J. Mech. Civ. Eng. 2016, 13, 108–122. [Google Scholar]
  18. Manel, S.; Kumar, S. Heat Generation and Temperature in Orthogonal Machining. Int. J. Sci. Eng. Res. 2017, 8, 31–33. [Google Scholar]
  19. Yashiro, T.; Ogawa, T.; Sasahara, H. Temperature Measurement of Cutting Tool and Machined Surface Layer in Milling of CFRP. Int. J. Mach. Tools Manuf. 2013, 70, 63–69. [Google Scholar] [CrossRef]
  20. Ogedengbe, T.S.; Abdulkareem, S.; Aweda, J.O.; Ogedengbe, T.S.; Abdulkareem, S. Effect of Coolant Temperature on Machining Characteristics of High Carbon Steel. 2018; Volume 1. Available online: http://repository.elizadeuniversity.edu.ng/handle/20.500.12398/1081 (accessed on 24 September 2024).
  21. Wang, W.; Wong, Y.S.; Hong, G.S. Flank Wear Measurement by Successive Image Analysis. Comput. Ind. 2005, 56, 816–830. [Google Scholar] [CrossRef]
  22. Zakeri, V.; Pourmostaghimi, V. Tool Wear Modelling in Drilling Process of AISI1020 and AISI8620 using Genetic Programming. Int. J. Adv. Des. Manuf. Technol. 2017, 10, 93–100. [Google Scholar]
  23. Zhou, J.; Yu, J. Chisel Edge Wear Measurement of High-Speed Steel Twist Drills Based on Machine Vision. Comput. Ind. 2021, 128, 103436. [Google Scholar] [CrossRef]
  24. Xu, J.; Ji, M.; Chen, M. On the Quantitative Analysis of Drill Edge Wear When Machining CFRP/Ti6Al4V Stacks. Int. J. Adv. Manuf. Technol. 2020, 108, 1463–1472. [Google Scholar] [CrossRef]
  25. Liang, Z.; Guo, H.; Wang, X.; Ma, Y.; Zhou, T.; Sun, X.; Jiang, L. Influence of Chisel Edge Axial Rake Angle on the Drilling Performance of Helical Point Micro-Drill. Int. J. Adv. Manuf. Technol. 2020, 107, 2137–2149. [Google Scholar] [CrossRef]
  26. Abdelrahman Elkaseer, A.M.; Dimov, S.S.; Popov, K.B.; Minev, R.M. Tool Wear in Micro-Endmilling: Material Microstructure Effects, Modeling, and Experimental Validation. J. Micro Nanomanuf 2014, 2, 044502. [Google Scholar] [CrossRef]
  27. Yıldırım, Ç.V.; Sarıkaya, M.; Kıvak, T.; Şirin, Ş. The Effect of Addition of HBN Nanoparticles to Nanofluid-MQL on Tool Wear Patterns, Tool Life, Roughness and Temperature in Turning of Ni-Based Inconel 625. Tribol. Int. 2019, 134, 443–456. [Google Scholar] [CrossRef]
  28. Dhar, N.R.; Rashid, M.H.; Siddiqui, A.T. Effect Of High Pressure Coolant On Chip, Roundness Deviation And Tool Wear In Drilling Aisi-4340 Steel. ARPN J. Eng. Appl. Sci. 2006, 1, 53–59. [Google Scholar]
  29. Jessy, K.; Satish kumar, S.; Dinakaran, D.; Seshagiri Rao, V. Influence of Different Cooling Methods on Drill Temperature in Drilling GFRP. Int. J. Adv. Manuf. Technol. 2015, 76, 609–621. [Google Scholar] [CrossRef]
  30. Thirukkumaran, K.; Menaka, M.; Mukhopadhyay, C.K.; Venkatraman, B. A Study on Temperature Rise, Tool Wear, and Surface Roughness During Drilling of Al–5%SiC Composite. Arab. J. Sci. Eng. 2020, 45, 5407–5419. [Google Scholar] [CrossRef]
  31. Wang, X.; Kwon, P.Y.; Sturtevant, C.; Kim, D.; Dae, W.; Lantrip, J. Comparative Tool Wear Study Based on Drilling Experiments on CFRp/Ti Stack and Its Individual Layers. Wear 2014, 317, 265–276. [Google Scholar] [CrossRef]
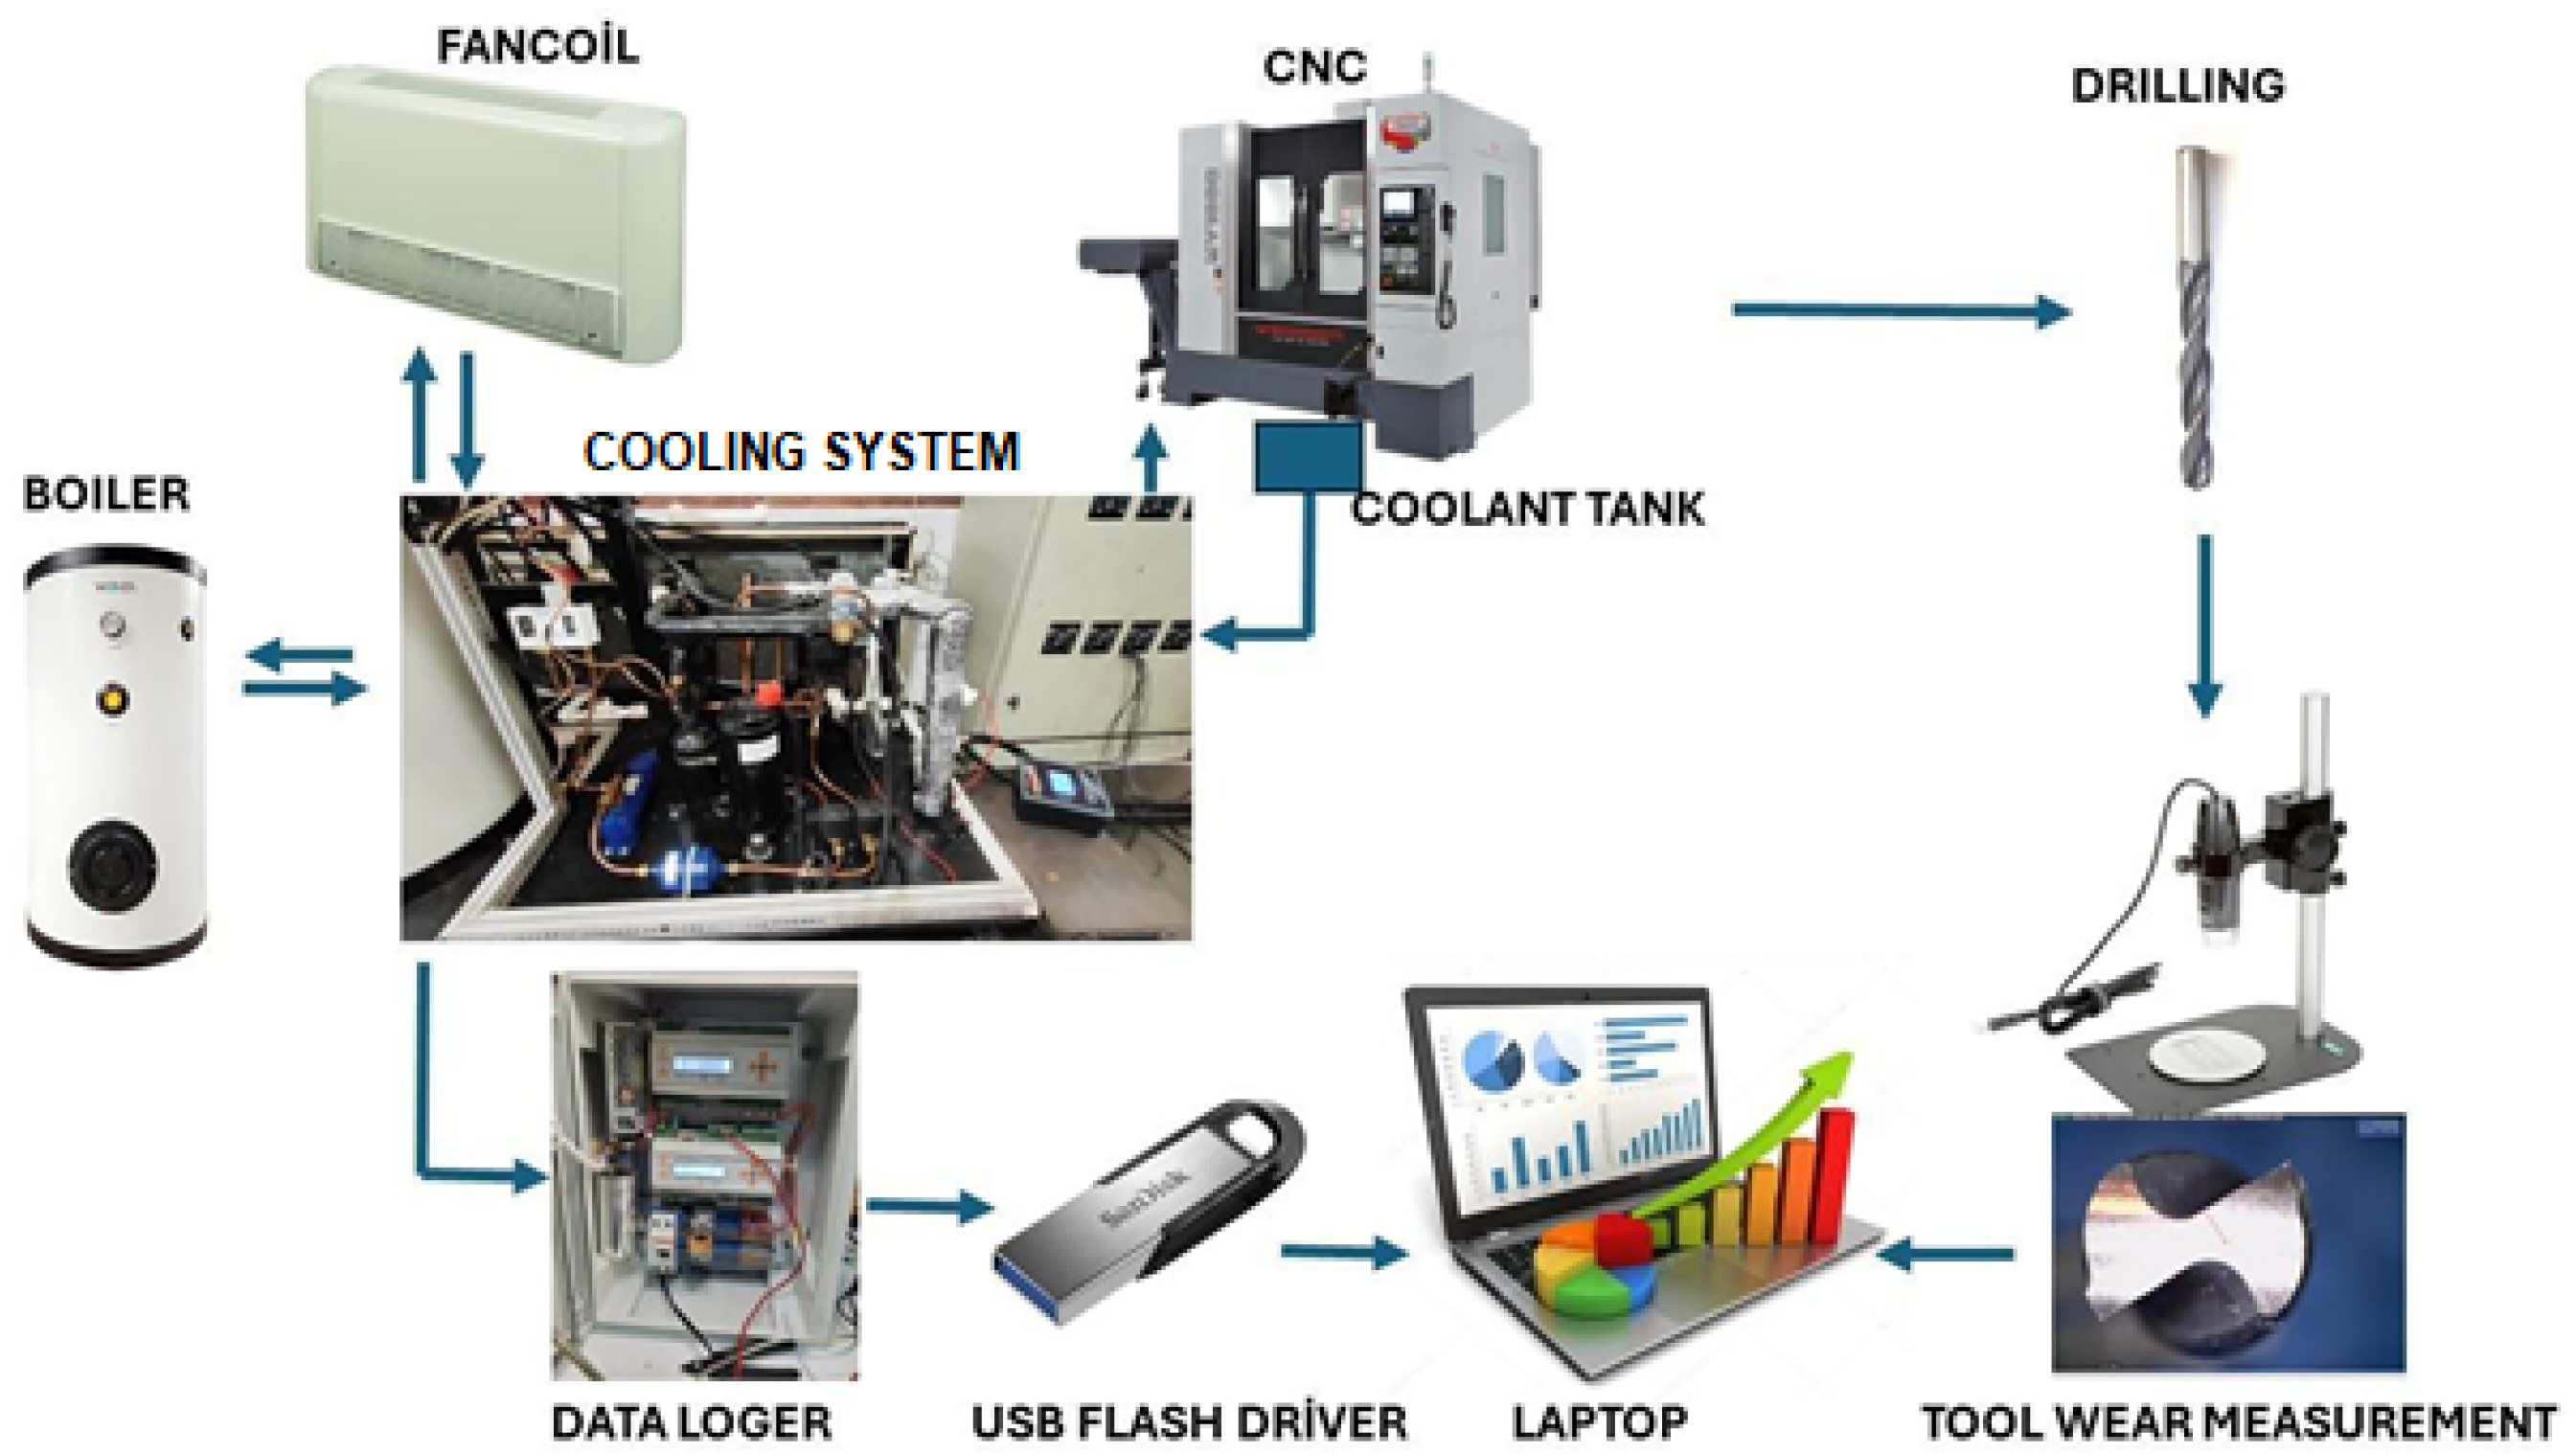
Figure 1. The experimental design and setup.
Machines 12 00677 g001
Figure 2. Schematic diagram of the circuit elements of the developed cooling system.
Machines 12 00677 g002
Figure 3. Photo of the developed cooling system.
Machines 12 00677 g003
Figure 4. Datalogger used in the experiments.
Machines 12 00677 g004
Figure 5. Machine tool and drill bit used in experiments.
Machines 12 00677 g005
Figure 6. Dimensions of specimens prepared for test.
Machines 12 00677 g006
Figure 7. Wear types and wear measurement methods used in the experiment.
Machines 12 00677 g007
Figure 8. (a) Visualization of drill bit wear, (b) drill-bit point geometry1.5.
Machines 12 00677 g008
Figure 9. Images of worn drill bits.
Machines 12 00677 g009
Figure 10. Flank wear (Ø = emulsion ratio. F = feed fate. N = spindle speed).
Machines 12 00677 g010
Figure 11. Chisel edge wear (Ø = emulsion ratio. F = feed rate. N = spindle speed).
Machines 12 00677 g011
Figure 12. Web (core) thickness wear (Ø = emulsion ratio. F = feed rate. N = spindle speed).
Machines 12 00677 g012
Figure 13. S/N analysis graph of flank wear for 15 °C.
Machines 12 00677 g013
Figure 14. Contour graphs for 15 °C.
Machines 12 00677 g014
Figure 15. S/N analysis graph for flank wear for 20 °C.
Machines 12 00677 g015
Figure 16. Contour graphs for 20 °C.
Machines 12 00677 g016
Figure 17. S/N analysis graph for flank wear for room temperature.
Machines 12 00677 g017
Figure 18. Contour graphs for room temperature.
Machines 12 00677 g018
Table 1. Process parameters.
FactorLevel
abc
Coolant temperature (°C)1520Room temperature
Coolant emulsion ratio (%)2.557.5
Feed rate (mm/rev)0.040.060.08
Spindle speed (rpm)398531663
Table 2. Experimental design matrix.
Test NoCoolant Set Temperatures (°C)Coolant Emulsion RatesFeed Rate (mm/rev)Spindle Speed (rev./m)
1a152.500.04398
b202.500.04398
cRoom temperature2.500.04398
2a152.500.06531
b202.500.06531
cRoom temperature2.500.06531
3a152.500.08663
b202.500.08663
cRoom temperature2.500.08663
4a155.000.04531
b205.000.04531
cRoom temperature5.000.04531
5a155.000.06663
b205.000.06663
cRoom temperature5.000.06663
6a155.000.08398
b205.000.08398
cRoom temperature5.000.08398
7a157.500.04663
b207.500.04663
cRoom temperature7.500.04663
8a157.500.06398
b207.500.06398
cRoom temperature7.500.06398
9a157.500.08531
b207.500.08531
cRoom temperature7.500.08531
Table 3. The design formulas of the S/N ratio models.
ModelFormula
Nominal is better S N = 10 l o g   i = 1 n ( y i ) 2 n  
Smaller is better S N = 10   i = 1 n y i 2  
Larger is better S N = 10   i = 1 n 1 y i 2  
Table 4. Wear measurement results.
Test NoTemperature LevelCoolant Temperature (°C)Emulsion Ratio
(%)
Feed Rate (mm/rev)Spindle Speed
(rpm)
Flank Wear
(mm)
Chisel Edge Wear
(mm)
Web (Core) Thickness Wear (mm)
1a152.500.043980.8211.5150.207
1b202.500.043981.152.1220.299
1cRoom Temperature2.500.043981.2062.340.331
2a152.500.065310.8411.0330.317
2b202.500.065310.9961.7610.345
2cRoom Temperature2.500.065311.0651.70.360
3a152.500.086630.5751.1590.267
3b202.500.086630.4452.4870.274
3cRoom Temperature2.500.086630.4733.00.296
4a1550.045310.5340.950.198
4b205.000.045310.9981.3620.235
4cRoom Temperature5.000.045311.1112.00.327
5a155.000.066630.5460.8640.251
5b205.000.066630.5711.9320.286
5cRoom Temperature5.000.066630.6433.00.360
6a1550.083980.5310.8220.254
6b205.000.083980.5940.9450.201
6cRoom Temperature5.000.083980.4330.8860.583
7a157.500.046630.30.70.463
7b207.500.046630.2610.8560.514
7cRoom Temperature7.500.046630.341.5930.615
8a157.500.063980.6920.8250.141
8b207.500.063980.5741.090.263
8cRoom Temperature7.500.063980.4331.0020.216
9a157.500.085310.360.4710.190
9b207.500.085310.4010.6480.308
9cRoom Temperature7.500.085310.5290.9470.352
Table 5. Analysis of variance for S/N ratios.
SourceDFSeq SSAdj SSAdj MSFP
Emulsion Ratio235.25935.25917.63013.020.071
Feedrate216.23916.2398.1206.000.143
Spindle Speed217.06917.0698.5346.300.137
Residual Error22.7082.7081.354
Total871.275
Table 6. Analysis of variance for S/N ratios.
SourceDFSeq SSAdj SSAdj MSFP
Emulsion Ratio264.78864.78832.39414.390.065
Feedrate219.71619.7169.8584.380.186
Spindle Speed253.43853.43826.71911.870.078
Residual Error24.5034.5032.252
Total8142.444
Table 7. Analysis of variance for S/N ratios.
SourceDFSeq SSAdj SSAdj MSFP
Emulsion Ratio255.1455.1427.5704.660.177
Feedrate227.3327.3313.6672.310.302
Spindle Speed241.0041.0020.4993.470.224
Residual Error211.8311.835.914
Total8135.30
Disclaimer/Publisher’s Note: The statements, opinions and data contained in all publications are solely those of the individual author(s) and contributor(s) and not of MDPI and/or the editor(s). MDPI and/or the editor(s) disclaim responsibility for any injury to people or property resulting from any ideas, methods, instructions or products referred to in the content.