Article

Vibration Research on Centrifugal Loop Dryer Machines Used in Plastic Recycling Processes

1
Faculty of Transport Engineering, Vilnius Gediminas Technical University, 10105 Vilnius, Lithuania
2
Faculty of Mechanical Engineering, Wrocław University of Science and Technology, 50-370 Wrocław, Poland
3
Faculty of Security, Logistics and Management, Military University of Technology, 00-908 Warsaw, Poland
4
Faculty of Automation and Information Technology, Kyiv National University of Construction and Architecture, 03037 Kyiv, Ukraine
*
Author to whom correspondence should be addressed.
Machines 2024, 12(1), 29; https://doi.org/10.3390/machines12010029
Submission received: 27 November 2023 / Revised: 29 December 2023 / Accepted: 30 December 2023 / Published: 1 January 2024
(This article belongs to the Section Machine Design and Theory)

Abstract

:
This study investigates the vibrations of centrifugal loop dryer machines used in plastic recycling processes. These machines are characterized by large uncertainties, high vibration, and unmodeled dynamics, making the design and maintenance of real-time state estimators for their operational conditions difficult. The present study includes an analysis of the centrifugal loop dryer machines’ vibration characteristics and their influence on operation results based on vibration analysis, frequency response analysis, and expert advice. Two identical loop dryers installed and operated in parallel in a single recycling line were investigated. Measurements were performed using a two-sample measurement design and based on a one-sample statistical method for estimating uncertainty in repeated measurements of data processing. Additionally, a problem connected with incorrect machine operation during high vibration, resulting in insufficient drying of loaded material, was investigated. This was defined as a situation in which some melted plastic is still too wet after mechanical drying, caused by the incorrect installation of damper elements of the holding elements. Finaly, it is recommended that a correction of the machine installation and a control measurement are carried out to determine whether the vibration in the base of the machine still exists. A simplified theoretical vibration analysis of the rotating machine was also carried out in the present paper.

1. Introduction

Polymers, plastics, and rubber materials have become indispensable in our society in different areas, from transport [1] to building [2]. They are used regularly every day in sports [3] and even in biomedical applications [4]. Despite the growing global scrutiny of plastic products, the fact remains that we rely heavily on this remarkable material. Consequently, there is a constant increase in demand for high-quality recycled products, particularly from major manufacturers of branded goods, who are eager to meet this demand [5]. As a result, manufacturers require significant amounts of consistently high-quality secondary raw materials. The project group demonstrated the effectiveness of recycling materials into engineered rigid plastic containers. A multi-stage processing facility for post-consumer plastic with perfectly matched components ensures excellent output quality [6]. Robust high-end shredding, washing, and drying technology is the key to smooth operation with low maintenance requirements and consistently high throughput for the recycling of different polymers [7].
Typically, the plastic polymer recycling process involves several stages, starting with the uploading of collected materials for recycling and concluding with a ground plastic material that is dry and fully prepared for secondary use (refer to Figure 1). To achieve this, there are two types of dryer machines available in the production recycling line: mechanical dryers and thermal dryers. In the loop dryer (which uses mechanical drying), the plastic granulate is dried through mechanical means. Any remaining non-plastic materials are removed from the material using controlled centrifugal force. The dryer achieves this by spinning the plastic granulate at approximately 600–1000 rpm, effectively eliminating water and residues such as paper [8]. On the other hand, the thermal dryer dries the material to less than 3% moisture content using adaptive heating technology, which perfectly prepares it for extrusion. A highly efficient programmable logic controller maintains a constant temperature and minimizes energy consumption [8].
According to the pointed above, only around 3% of drying processes happen in the thermal stage (finishing of drying), and the main drying is performed by a loop dryer, which is operated using the principle of centrifugal force. These machines are characterized by large uncertainties, high vibration, and unmodeled dynamics, making the design and maintenance of real-time state estimators for their operational condition difficult. A common problem for centrifugal dryer machines is high vibration [9,10]. Excessive machine vibration is a serious problem for stationary process machinery and mobile machines. Such machines can be treated as a source and receiver of mechanical vibrations. The frequency range of vibrations generated by the machine is wide and ranges from a few Hz to several thousand Hz. Figure 2 shows the amplitude–frequency spectrum of vibrations of the hydraulic power pack tank cover in the vertical direction.
In the spectrum in Figure 2, one can see, in addition to components with higher frequency values, also components whose frequencies are below 100 Hz. The sources of machine vibration are numerous and include, among others, the following: imbalance of rotating parts; errors in the manufacture of machine components; errors in the assembly of machine components; inadequate mounting of the machine to the ground or incorrectly selected vibration isolators; the nature of the paper of sub-systems installed on the machine; the nature of the work of the sub-systems installed in the machine (e.g., pulsating nature of the operation of hydraulic pumps, cavitation phenomenon); changes in the operating conditions of the machine (e.g., changes in external load, changes in direction of movement and speed); degradation processes (e.g., bearing damage, insufficient lubrication of kinematic pairs); in the case of mobile machinery, the effect of the ground on the moving machine. On the one hand, these vibrations interfere with the correct operation of the machine, contributing to a reduction in its service life; meanwhile, on the other hand, they can serve as a diagnostic signal to help identify the cause of the vibration and eliminate it. These vibrations also cause disruptions in the execution of machine processes. Vibrations are also accompanied by the noise of corresponding frequencies. Both vibrations and noise are transmitted to the surrounding environment, including the human operator of the machine. This can lead to exceeding the permissible normative values for vibration and noise levels. These values are set out in official European Union documents. The low-frequency range of vibration and noise, i.e., below 100 Hz, is particularly dangerous for humans. Vibrations acting on humans cause functional and physiological effects. Functional effects include the following: interference with movement coordination; increased visual reaction time; increased motor reaction time; feelings of fatigue and tiredness. These effects affect the quality of the work performed and its safety. Physiological effects include the following: changes in the nervous system; changes in the peripheral vasculature; changes in the osteoarticular system. These changes lead to the onset and development of vibration sickness. Noise in the low-frequency range is also detrimental to the human body, the so-called infrasound noise. Infrasound noise is assumed to be in the frequency range up to 20 Hz. Human exposure to infrasound noise causes, among other things, the following: increased reaction time; reduced level of perceptibility; disturbance of balance; shifting of the hearing threshold; a state similar to that after alcohol consumption; a drop in blood pressure; lowered heart rate; headaches; dizziness. The specific effects depend on the frequency and level of noise and the duration of exposure. Prolonged exposure to infrasound noise can lead to disturbances in the human psychological sphere. It has been found that in areas with foehn winds (accompanied by infrasound noise), an increased number of suicides are recorded, caused by artificially induced and successive periods of euphoria and depression in humans. Low-frequency vibrations and noise are poorly attenuated by matter and propagate over considerable distances, so combating them is difficult and should include their sources. Factors such as excessive vibration and noise also reduce the efficiency of processes and the operation of machinery. Many manufacturers, in order to achieve higher work efficiency and drying speed, offer dryers such as hot air rotary dryers on the market [11,12]. In addition, poor or low contact between the product being dried and the drying medium is a major problem [9] which can result from the high vibration and incorrect operation of machines [13]. System identification poses a high-rate problem, which involves identifying and quantifying changes in dynamics over a short period of time for systems with large uncertainties in external loads, non-stationarities, heavy disturbances, and unmodeled dynamics due to changes in system configuration [14]. However, analyzing these machines in real-time operations is challenging because batch processing techniques are typically used. To enable the vibration analysis of high-rate systems in real-time, a temporal approach must be integrated with the frequency technique using a method known as time–frequency representation [15]. The advantage of frequency-based methods is that they do not typically rely on the tuning of parameters such as adaptive gains [16]. However, they are inherently batch processing techniques that require vibration level measurements. Various methods extensively employ vibration-based data for the detection and quantification of faults [17]. Frequency domain characteristics, including frequencies, damping ratios, energy across different frequency ranges, and time–frequency domain characteristics like time–frequency spread [18], serve as crucial features for conducting structural health monitoring. Commonly employed approaches involve linear non-parametric methods such as short-time Fourier transform, wavelet transform, or Wigner–Ville distribution [18,19]. The application of these methods results in a trade-off between vibration time and frequency response resolutions [20], but they are still considered some of the best methodologies for the detection and quantification of faults using vibration-based data [17].
The current research was a real-time operational analysis of the centrifugal loop dryer machines’ vibration characteristics and their influence on operation results, based on vibration analysis, frequency response analysis, and expert discussion. Two identical loop dryer machines installed and operated in parallel in a single recycling line were under investigation. The problem consisted of some melted plastic still being too wet after mechanical drying, which did not meet the required standards. The current research included an analysis of the centrifugal loop dryer machines’ vibration characteristics and their influence on operation results.

2. Machines under Investigation and Research Methodology

2.1. Theoretical Analysis of Rotating Machine Vibrations
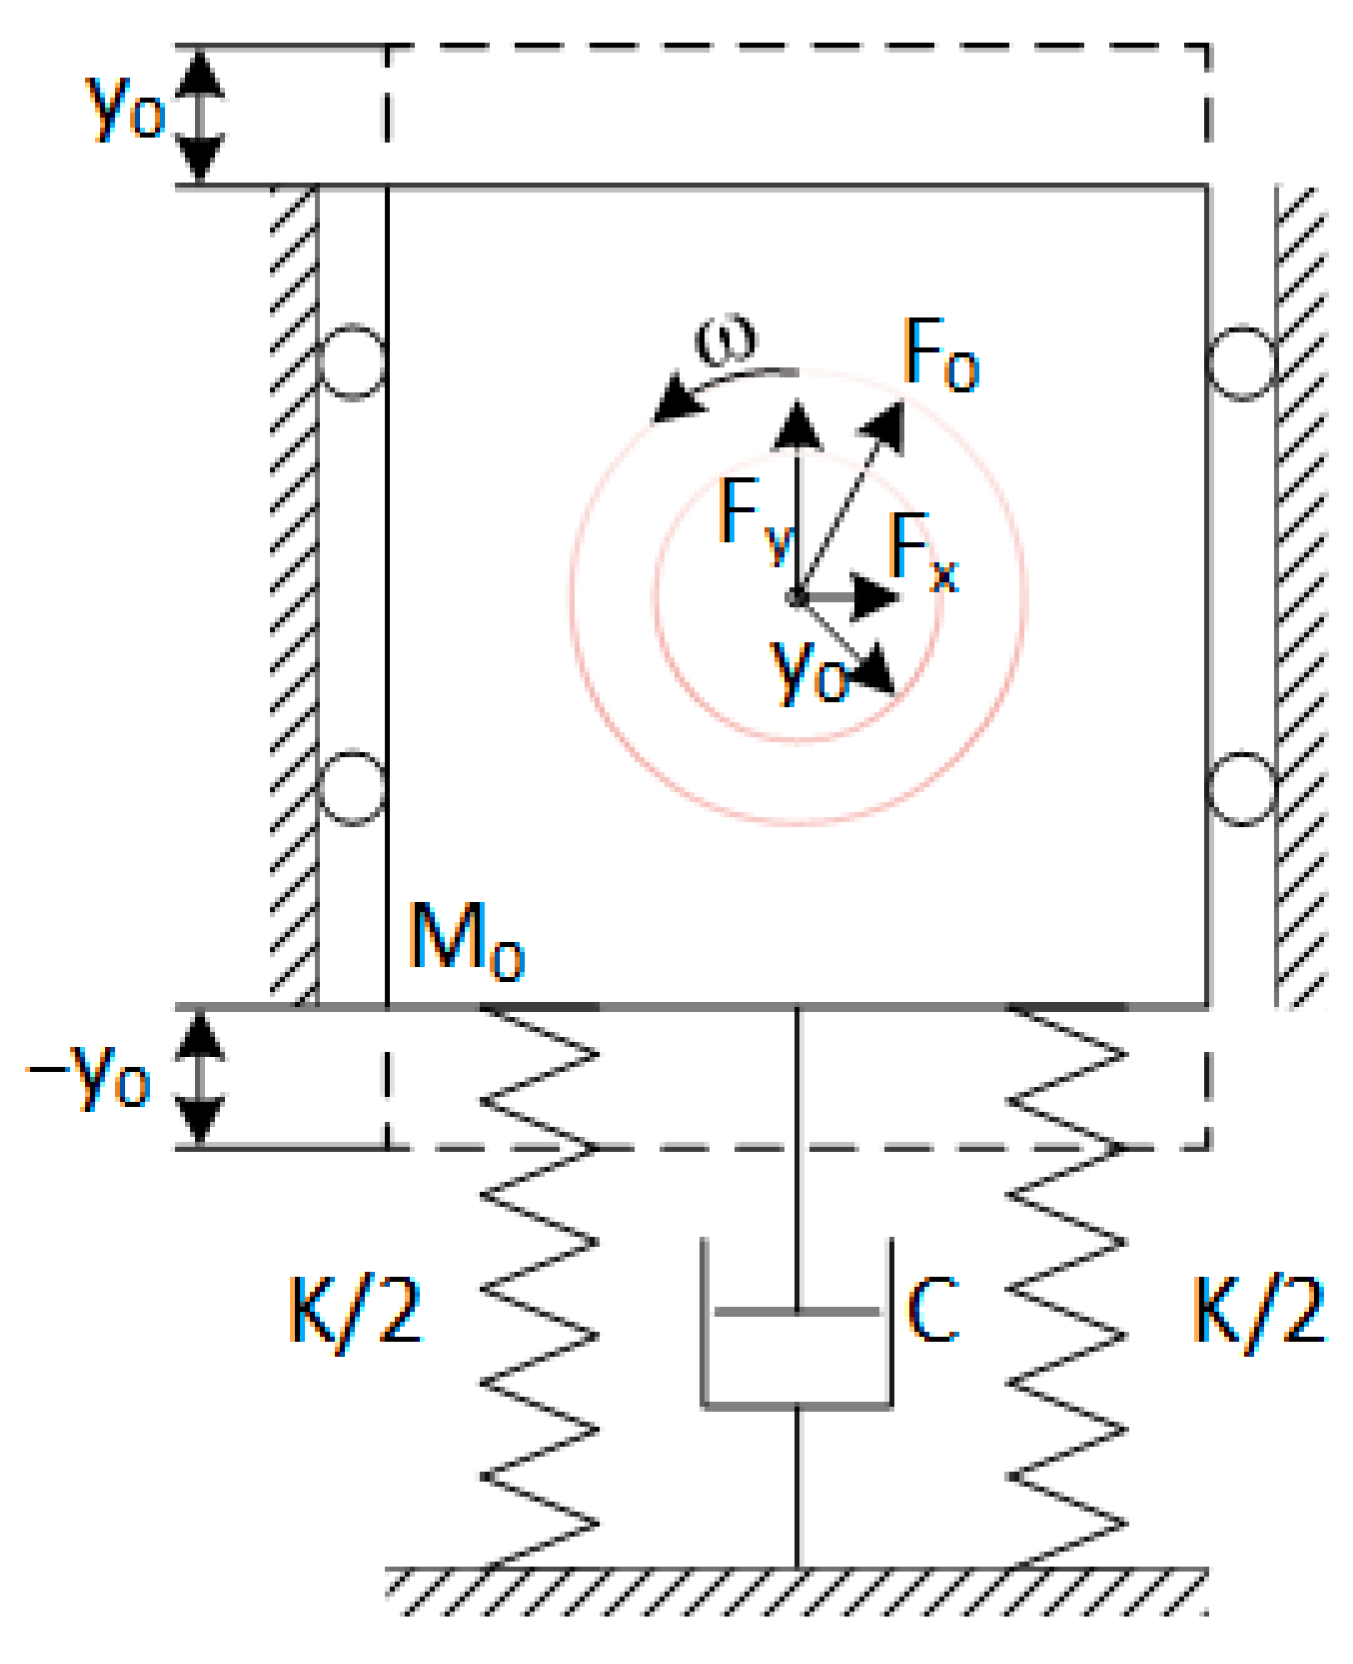
A simplified theoretical analysis of rotating machine vibration (Figure 3) can be carried out by assuming a single-mass model excited to vibration by a harmonic force:
F y = F 0 sin ω t = M w ρ ω 2 sin ω t
where
Mw—mass of rotating parts, kg;
ρ —radius of eccentricity of the center of gravity of rotating masses, relative to the geometric axis of rotation, m;
ω—rotor angular frequency, rad/s.
Figure 3. Dynamic diagram of a single-mass elastic system subjected to a harmonic force.
Machines 12 00029 g003
The vibrations of such a system can be described by the following equation:
M 0 y ¨ + c y ˙ + K y = F 0 sin ω t
The general solution of the equation above is of the following form [21]:
y = e γ Ω t A cos q t + B sin q t + F 0 K 1 1 μ 2 2 + 2 γ μ 2 sin ω t Φ
where
A and B—integration constants depending on initial conditions;
γ—dimensionless damping coefficient;
Φ —the phase lag angle between the forcing force vector F0 and the swing vector, rad;
Ω—undamped free vibration angular frequency, rad/s;
q—damped free vibration frequency, rad/s;
K—general vertical elasticity constant, N/m;
μ—angular frequency ratio, μ = ω/Ω.
Moreover,
Ω = K M 0 = Q 0 δ s t g Q 0 3.13 δ s t
The frequency of undamped free vibration is:
f = Ω 2 π 0.5 δ s t
The damped free vibration angular frequency is:
q = Ω 1 γ 2
In Equation (3), the first term describes a free oscillation fading at a frequency of q, and the second term describes a steady-state oscillation forced at frequency ω. For the analysis of steady-state oscillations, the first term of Equation (3) can be neglected, because the damping existing in the system causes the transient oscillations to decay quickly and only the steady oscillations taking place at the frequency of the forcing force remain. However, the first term cannot be omitted when analyzing shock oscillations, i.e., oscillations occurring under the action of single impulses.
For steady-state oscillation, the solution of the oscillating motion takes the following form:
y = y 0 sin ω t Φ
where
y 0 = F 0 K 1 1 μ 2 2 + 2 γ μ 2
Φ = a r c t g 2 γ μ 1 μ 2
Therefore, in the absence of damping, (γ = 0) ф = 0 or 180°.
The coefficient of force transfer to the foundation, i.e., the ratio of the amplitude of the force transferred to the foundation to the amplitude of the forcing force, is, in this case,
ζ 0 = P 0 F 0 = 1 + 2 γ μ 2 1 μ 2 2 + 2 γ μ 2
This relationship was obtained by representing the force transmitted through the elastic elements as the root of the sum of the squares of the amplitudes of the elastic and damping forces:
P 0 = K y 0 2 + c y 0 ω 2
Analysis of Function (10) allows us to conclude that when μ > 2 , the value of ζ 0 < 1 , and this means that P 0 < F 0 . However, when μ > 2 , the damping adversely affects the value of the force P0. Conversely, when μ < 1 , the force transferred to the ground P 0 F 0 .

2.2. Research Methodology

The current analysis was based on vibration analysis. Vibration analysis is a process that monitors vibration levels and investigates the patterns in vibration signals. It is commonly conducted both on the time waveforms of the vibration signal directly, as well as on the frequency spectrum, which is obtained by applying Fourier transform to the time waveform.
Vibration analysis involves measuring the vibration levels and frequencies of machinery to assess the health of its components. The process begins with using an accelerometer to measure the vibrations generated by the running machinery. The accelerometer generates a voltage signal that corresponds to the amount and frequency of vibrations produced by the machine. The vibration analysis is performed by measuring the vibration level and performing additional Fourier transform spectrum analysis.
The focus of this research is to determine the vibration level of machines and their holding places to compare the damping property of the investigated object. To achieve a successful analysis, there are several steps to follow (see Figure 4).
The local Fourier spectrum of each segment can be generated around the window’s position, and the temporal variation of the frequency can be observed locally. This is achieved by equation in the following way [22]:
S T F T x t τ , ω X τ , ω = x t ω t τ e i ω t d t
where x(t)—vibration signal to be transformed; X(τ, ω)—essentially the Fourier transform of x(t)ω(tτ); e—complex function representing magnitude and phase of the signal over time and frequency; ω(tτ)—window function (Hann window) centered around zero.

2.3. Machines under Investigation and Measurement Setups

In the current research, two machines of the same type were installed in parallel and operated in one recycle line (Figure 5a). The test measurement processes and equipment are shown in Figure 5b, including a National Instrument USB-443x data collector with an AS-065 B&K accelerometer and PC for data proceeding.
Each diagnostic processes measurement of the object includes a few measurements of vibration during machine operation. The duration of one measurement is typically 20 s, which is long enough to obtain a stable signal while the machinery is running and producing vibrations. An accelerometer attached to the machine generates a voltage signal that corresponds to the amount and frequency of vibrations being produced. All data collected from the accelerometer are recorded through a data collector (software NI Max ver. 21) as amplitude vs. time, known as a time waveform. These data are analyzed using computer program algorithms and are then reviewed by engineers to determine the health of the machine and identify any possible impending problems such as an unbalance, high vibration, etc. Prior to the main measurements, the accelerometers were calibrated using a B&K portable accelerometer calibrator type 4294.
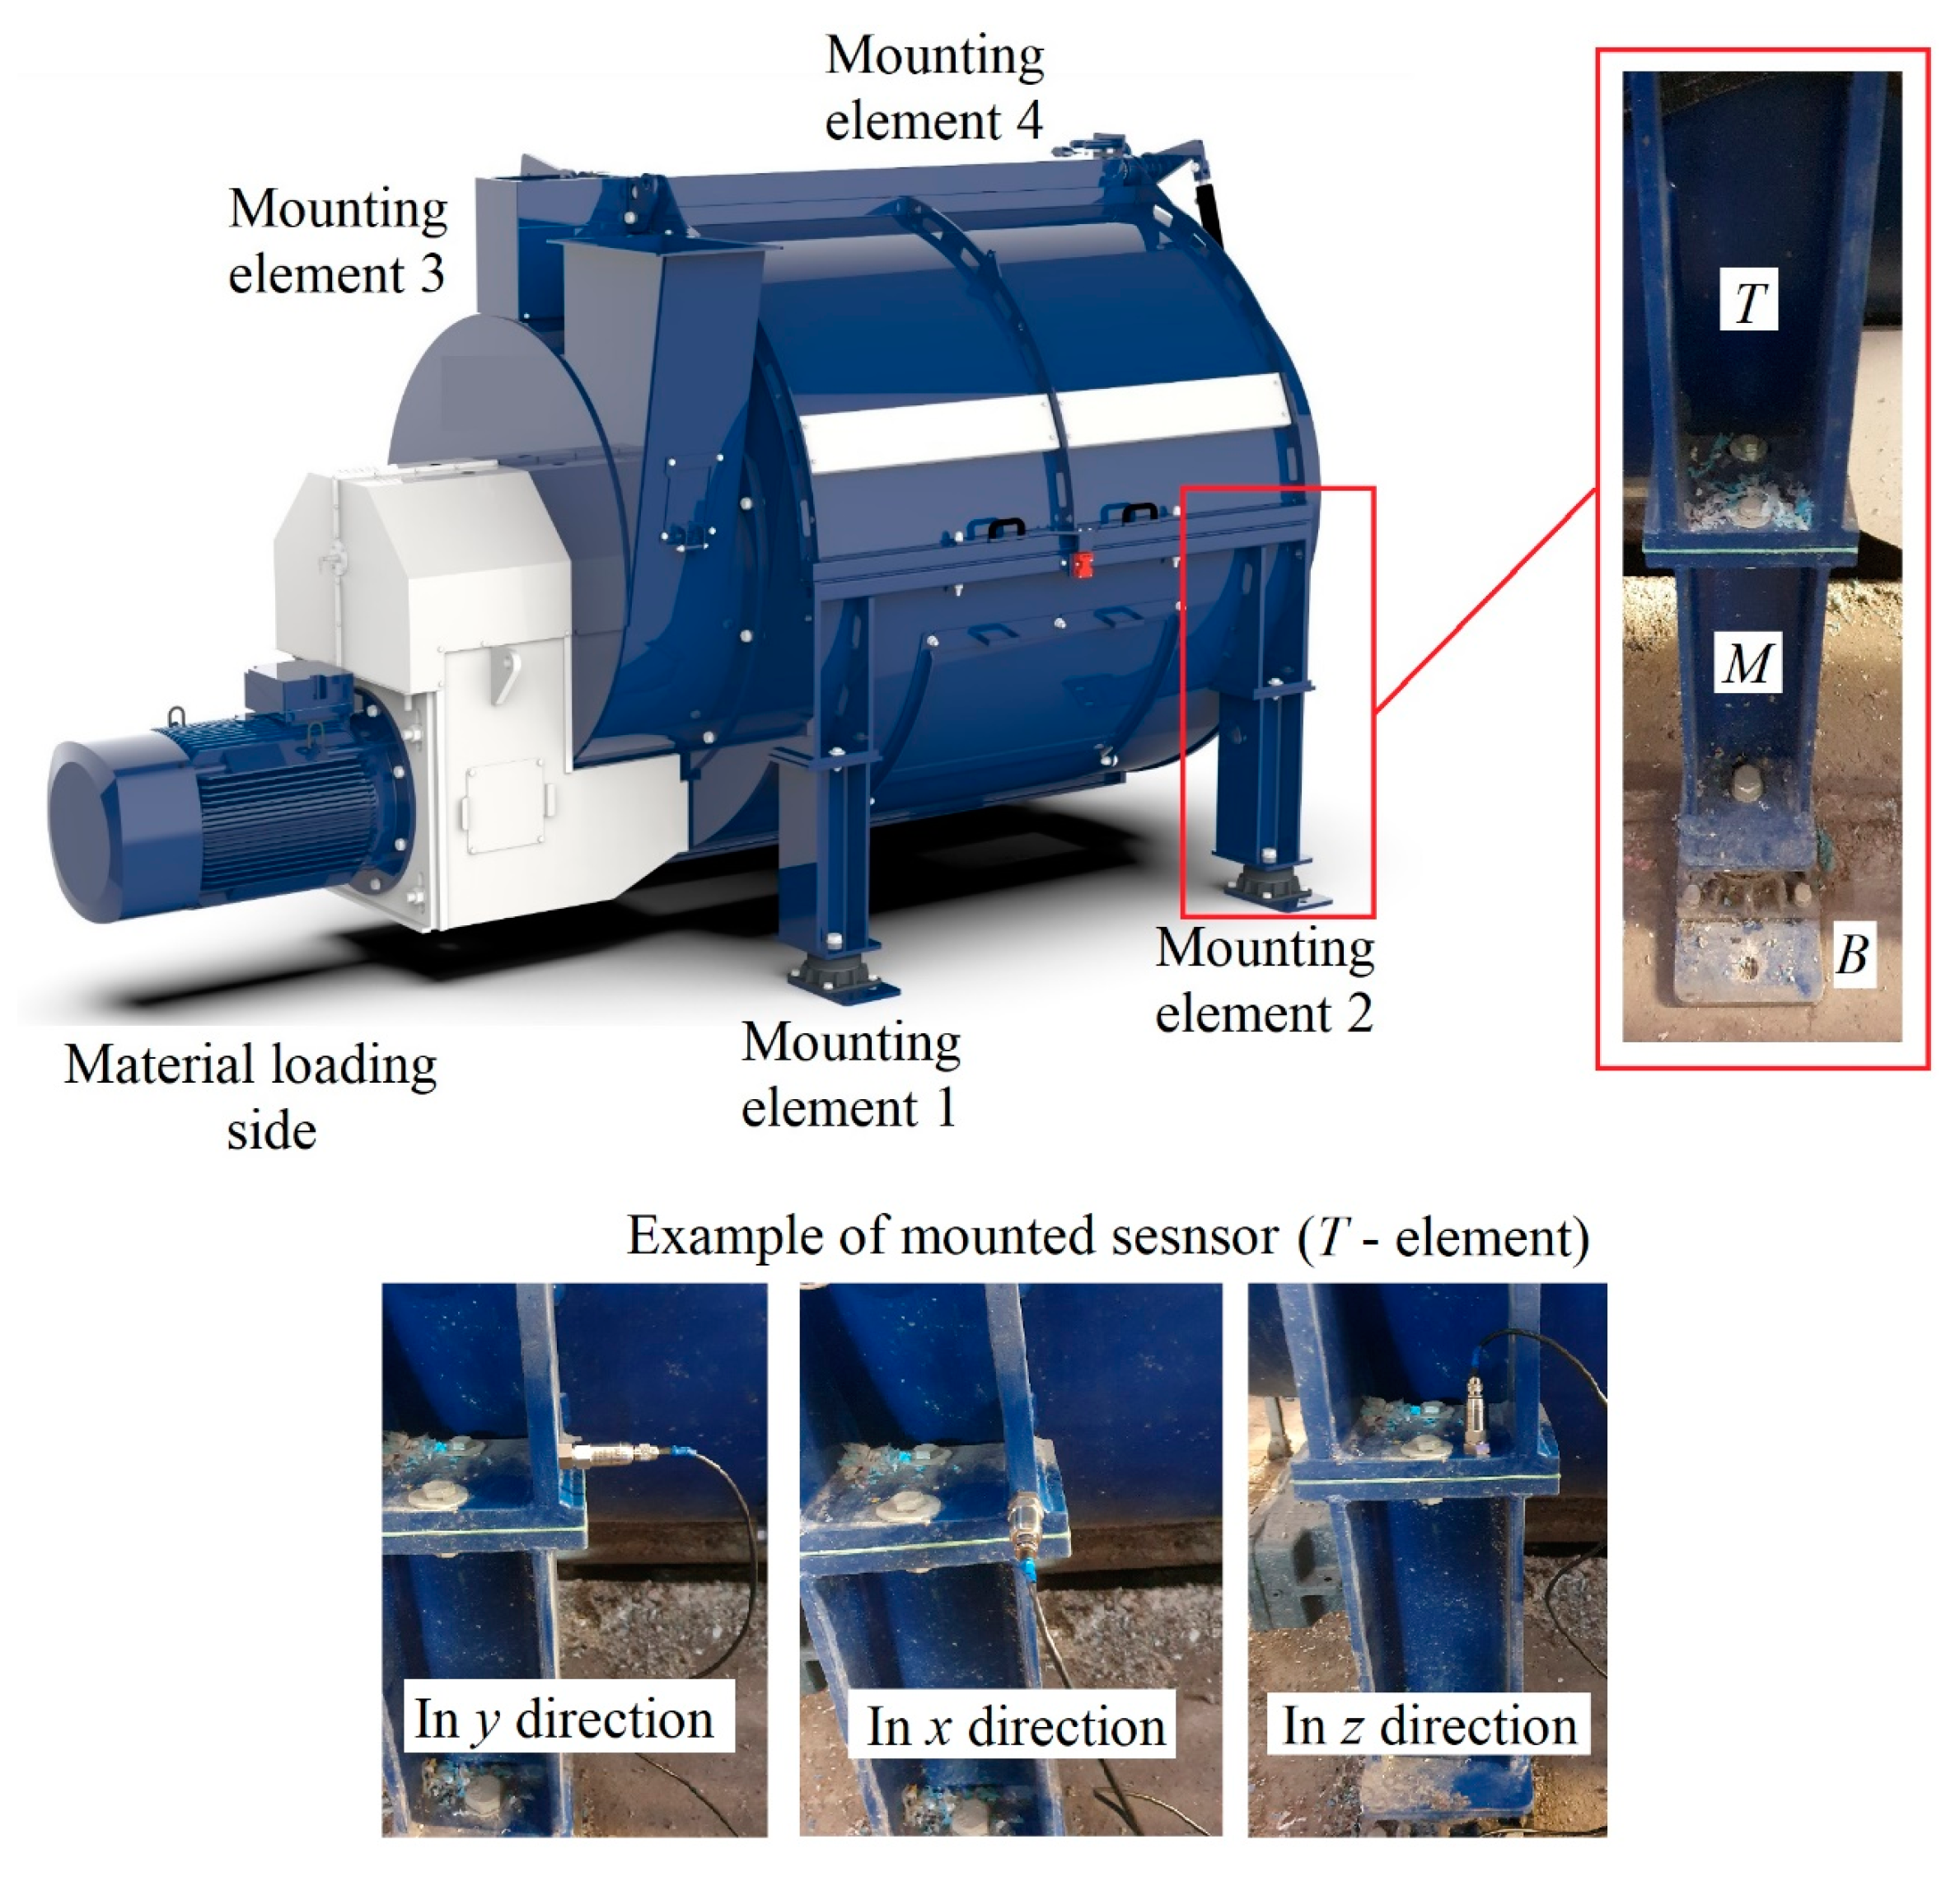
The machine’s vibration was measured in the main body, the four mounting elements (divided into two elements T and M), and the bases elements (B) to which the machine is attached on the ground (Figure 6).
To explain the obtained results, the machine is placed in an x, y, z coordinate system according to Figure 5 and Figure 6. The measurement points are defined, and the obtained results are presented in graphs and tables, with conclusions provided at the end of the machine’s vibrational analysis.

3. Results and Discussion

3.1. Results for Machine № 1

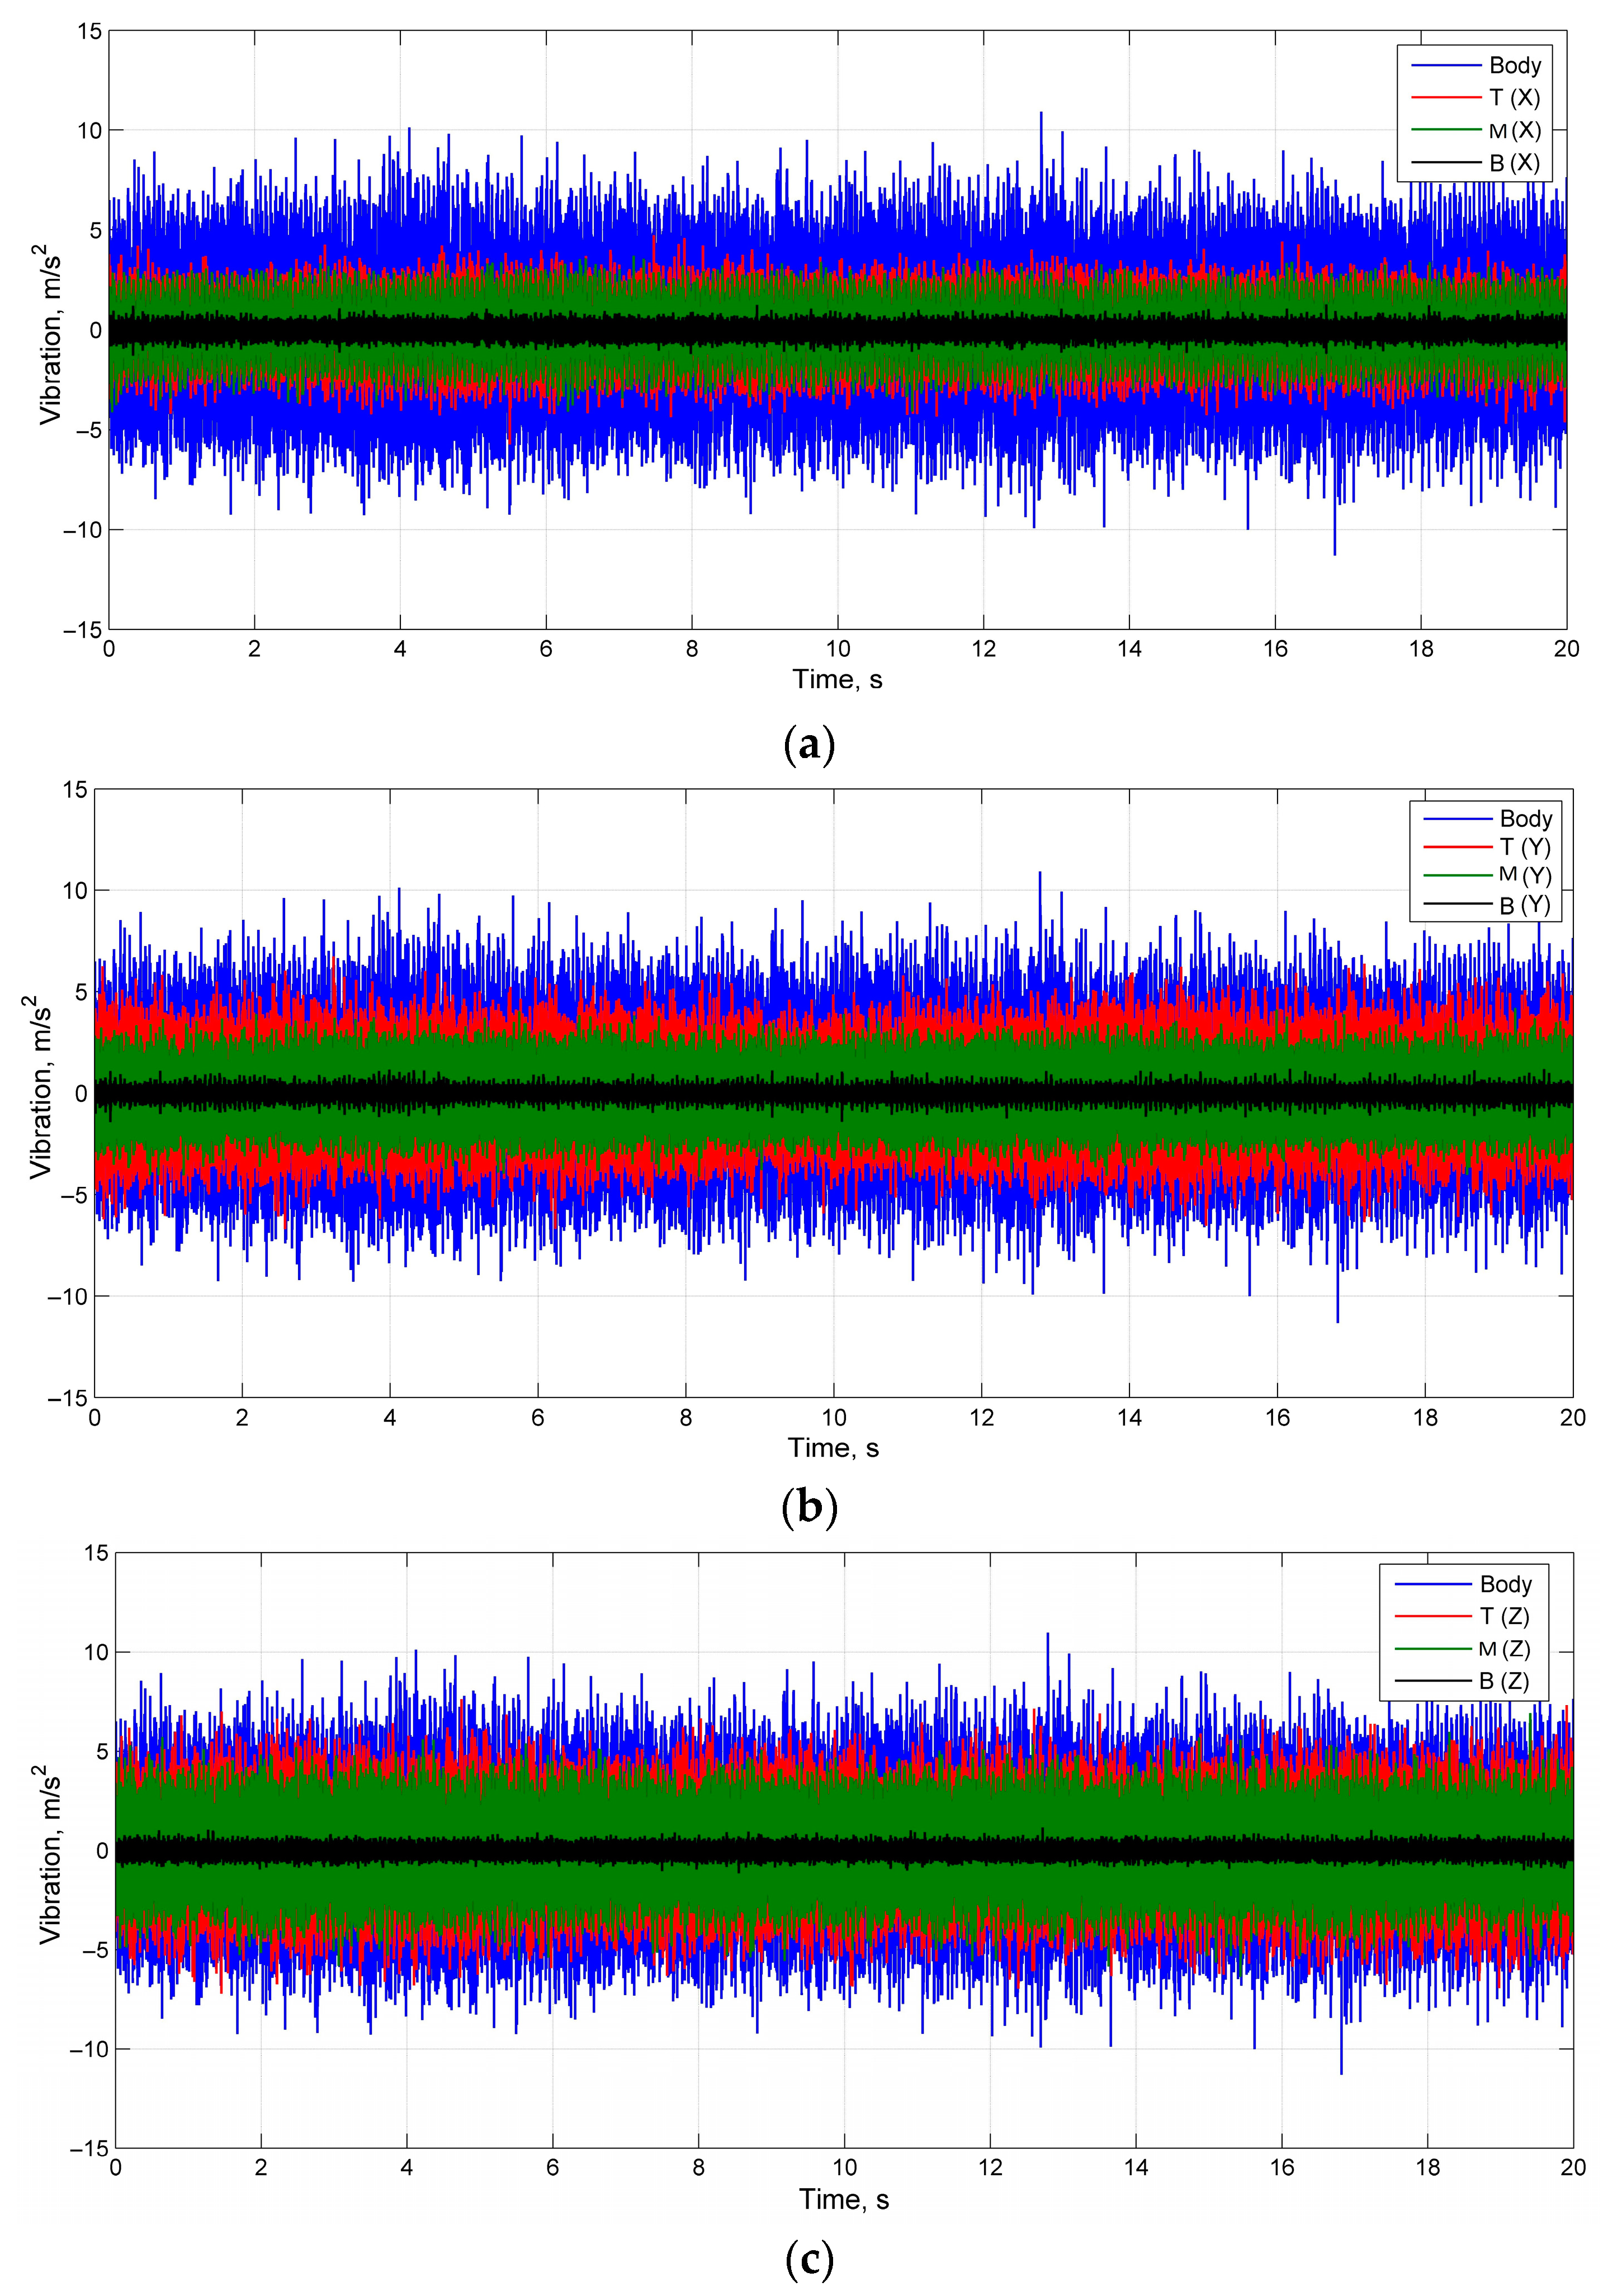
The results are presented in graphical form for the examples, and a comparison with the body vibration with the most vibrated mounting element of the machine is presented also. The most vibration was observed for Machine № 1 according to measurements on the third place of measuring. The results of vibration are presented in all measured directions (x, y, z) in order to find the main damped and less damped directions of vibration, shown in Figure 7.
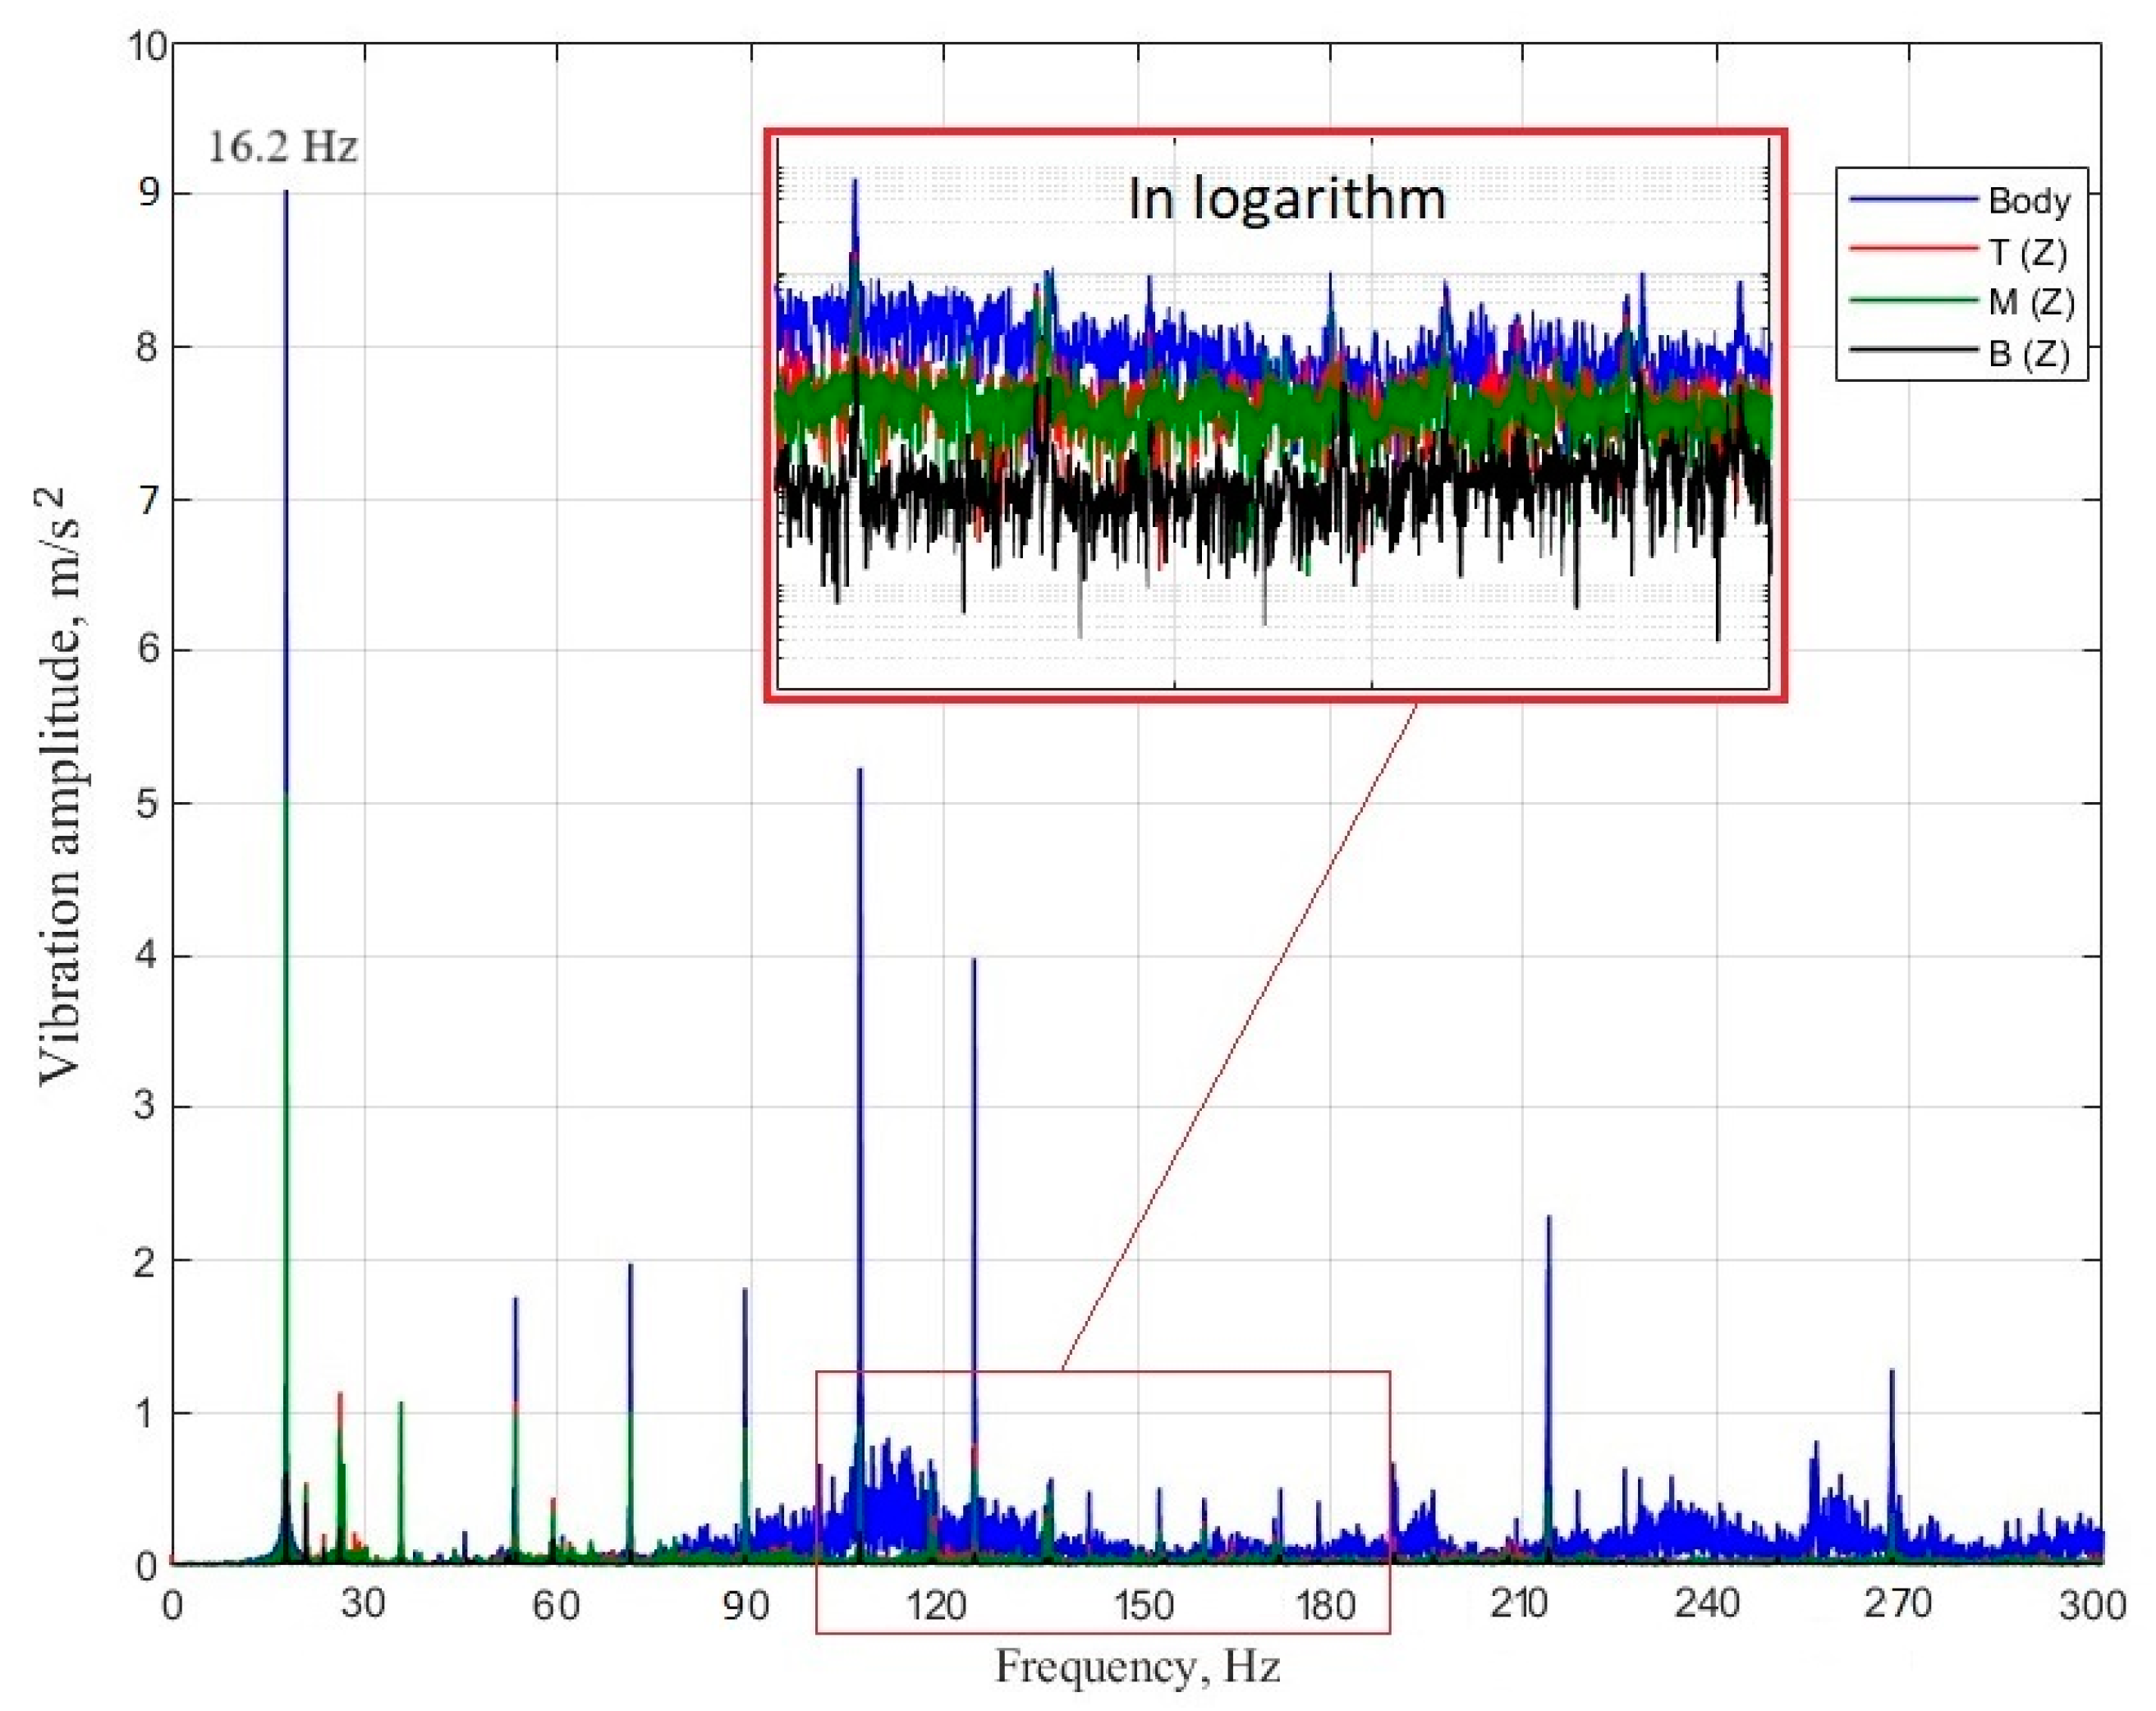
Additionally, a frequency spectrum analysis is provided based on Fourier transform for analyzing the dynamic processes of vibration (Figure 8).
Through studying the frequency response, it becomes clear that all vibrations from the loop dryer directly transmitted to various holding elements with a dampening effect. The main resonance frequency was identified at 16.2 Hz, confirming that all vibrations are indeed transferred correctly and are dependent solely on the body rotation operation conditions (specifically, 16.2 Hz or body rotation 972 rpm).
The measured data were transformed from acceleration to displacement using two integration trapezoidal methods with unit spacing, according to [23]. Table 1 presents information about the displacement vibration of each measured location by direction for future comparative analyses.

3.2. Results for Machine № 2

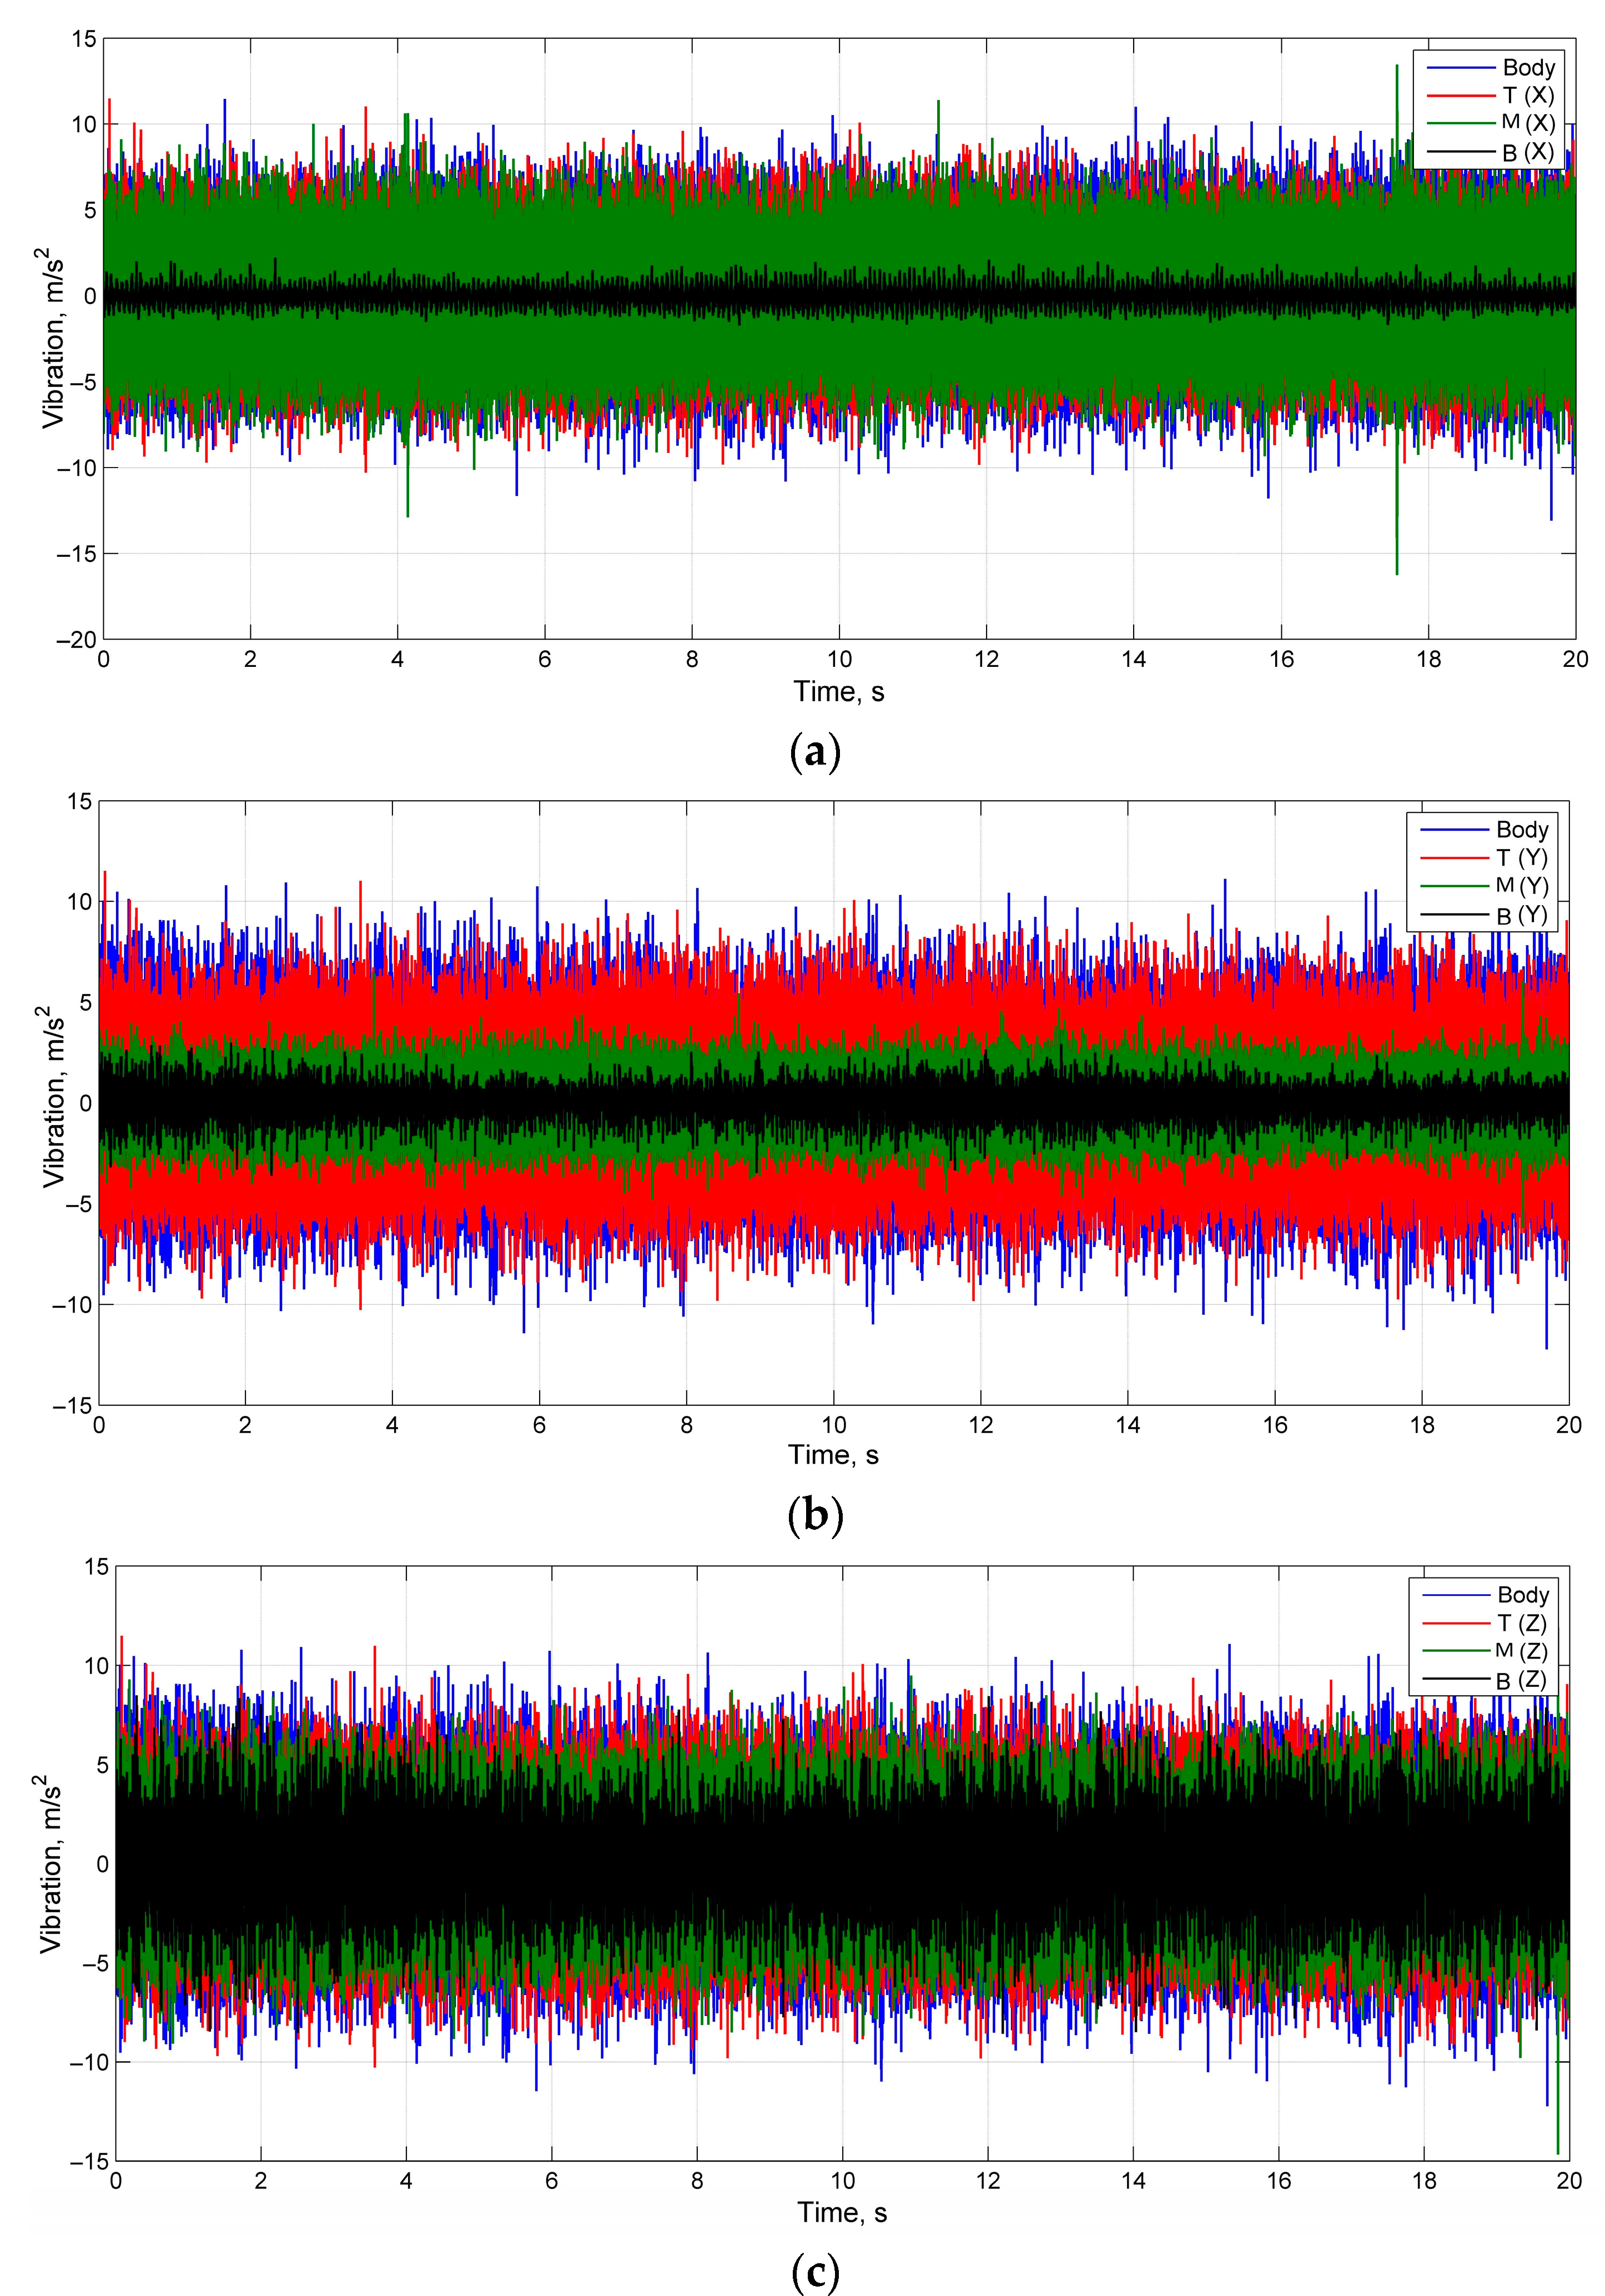
The machine was measured by vibration in the main body and in four mounting elements (divided into two elements), and the base by which the machine is attached to the ground. To aid an explanation of the obtained results, the machine is placed in the same x, y, z coordinate system. The measurement points are definite and named in the same way as for the analysis of Machine № 1. The vibration results on the 1st measured place are presented in Figure 9. The frequency response of vibration on the 1st measured place from Machine № 2 is shown in Figure 10 (the point of the highest difference between vibrations). Table 2 presents information about the displacement vibration of each measured place by direction for future comparative analyses and discussion.
Through studying the frequency response, it becomes clear that all vibrations from the loop dryer directly transmitted to various holding elements with a dampening effect. The main resonance frequency was identified at 16.33 Hz, confirming that all vibrations are indeed transferred correctly and are dependent solely on the body rotation operation conditions (specifically, 16.33 Hz or body rotation 980 rpm).

3.3. Discussion

3.3.1. Vibration Analysis for Machine № 1

According to the obtained results, the vibration level during operation of the machine was well-damped in all directions at all places of measuring. In places 1 and 3, a little bit of high-amplitude vibration was observed, but it can be easily explained by the installation of an electric motor near the 1st mounting element or that, close to this place, the material has a high weight.
Frequency analysis confirmed the measured vibration tendency, that the vibration level reduced in the body to base direction. Additionally, all four vibration absorbers worked fine and do not require maintenance or additional action by experts in the near future.

3.3.2. Vibration Analysis for Machine № 2

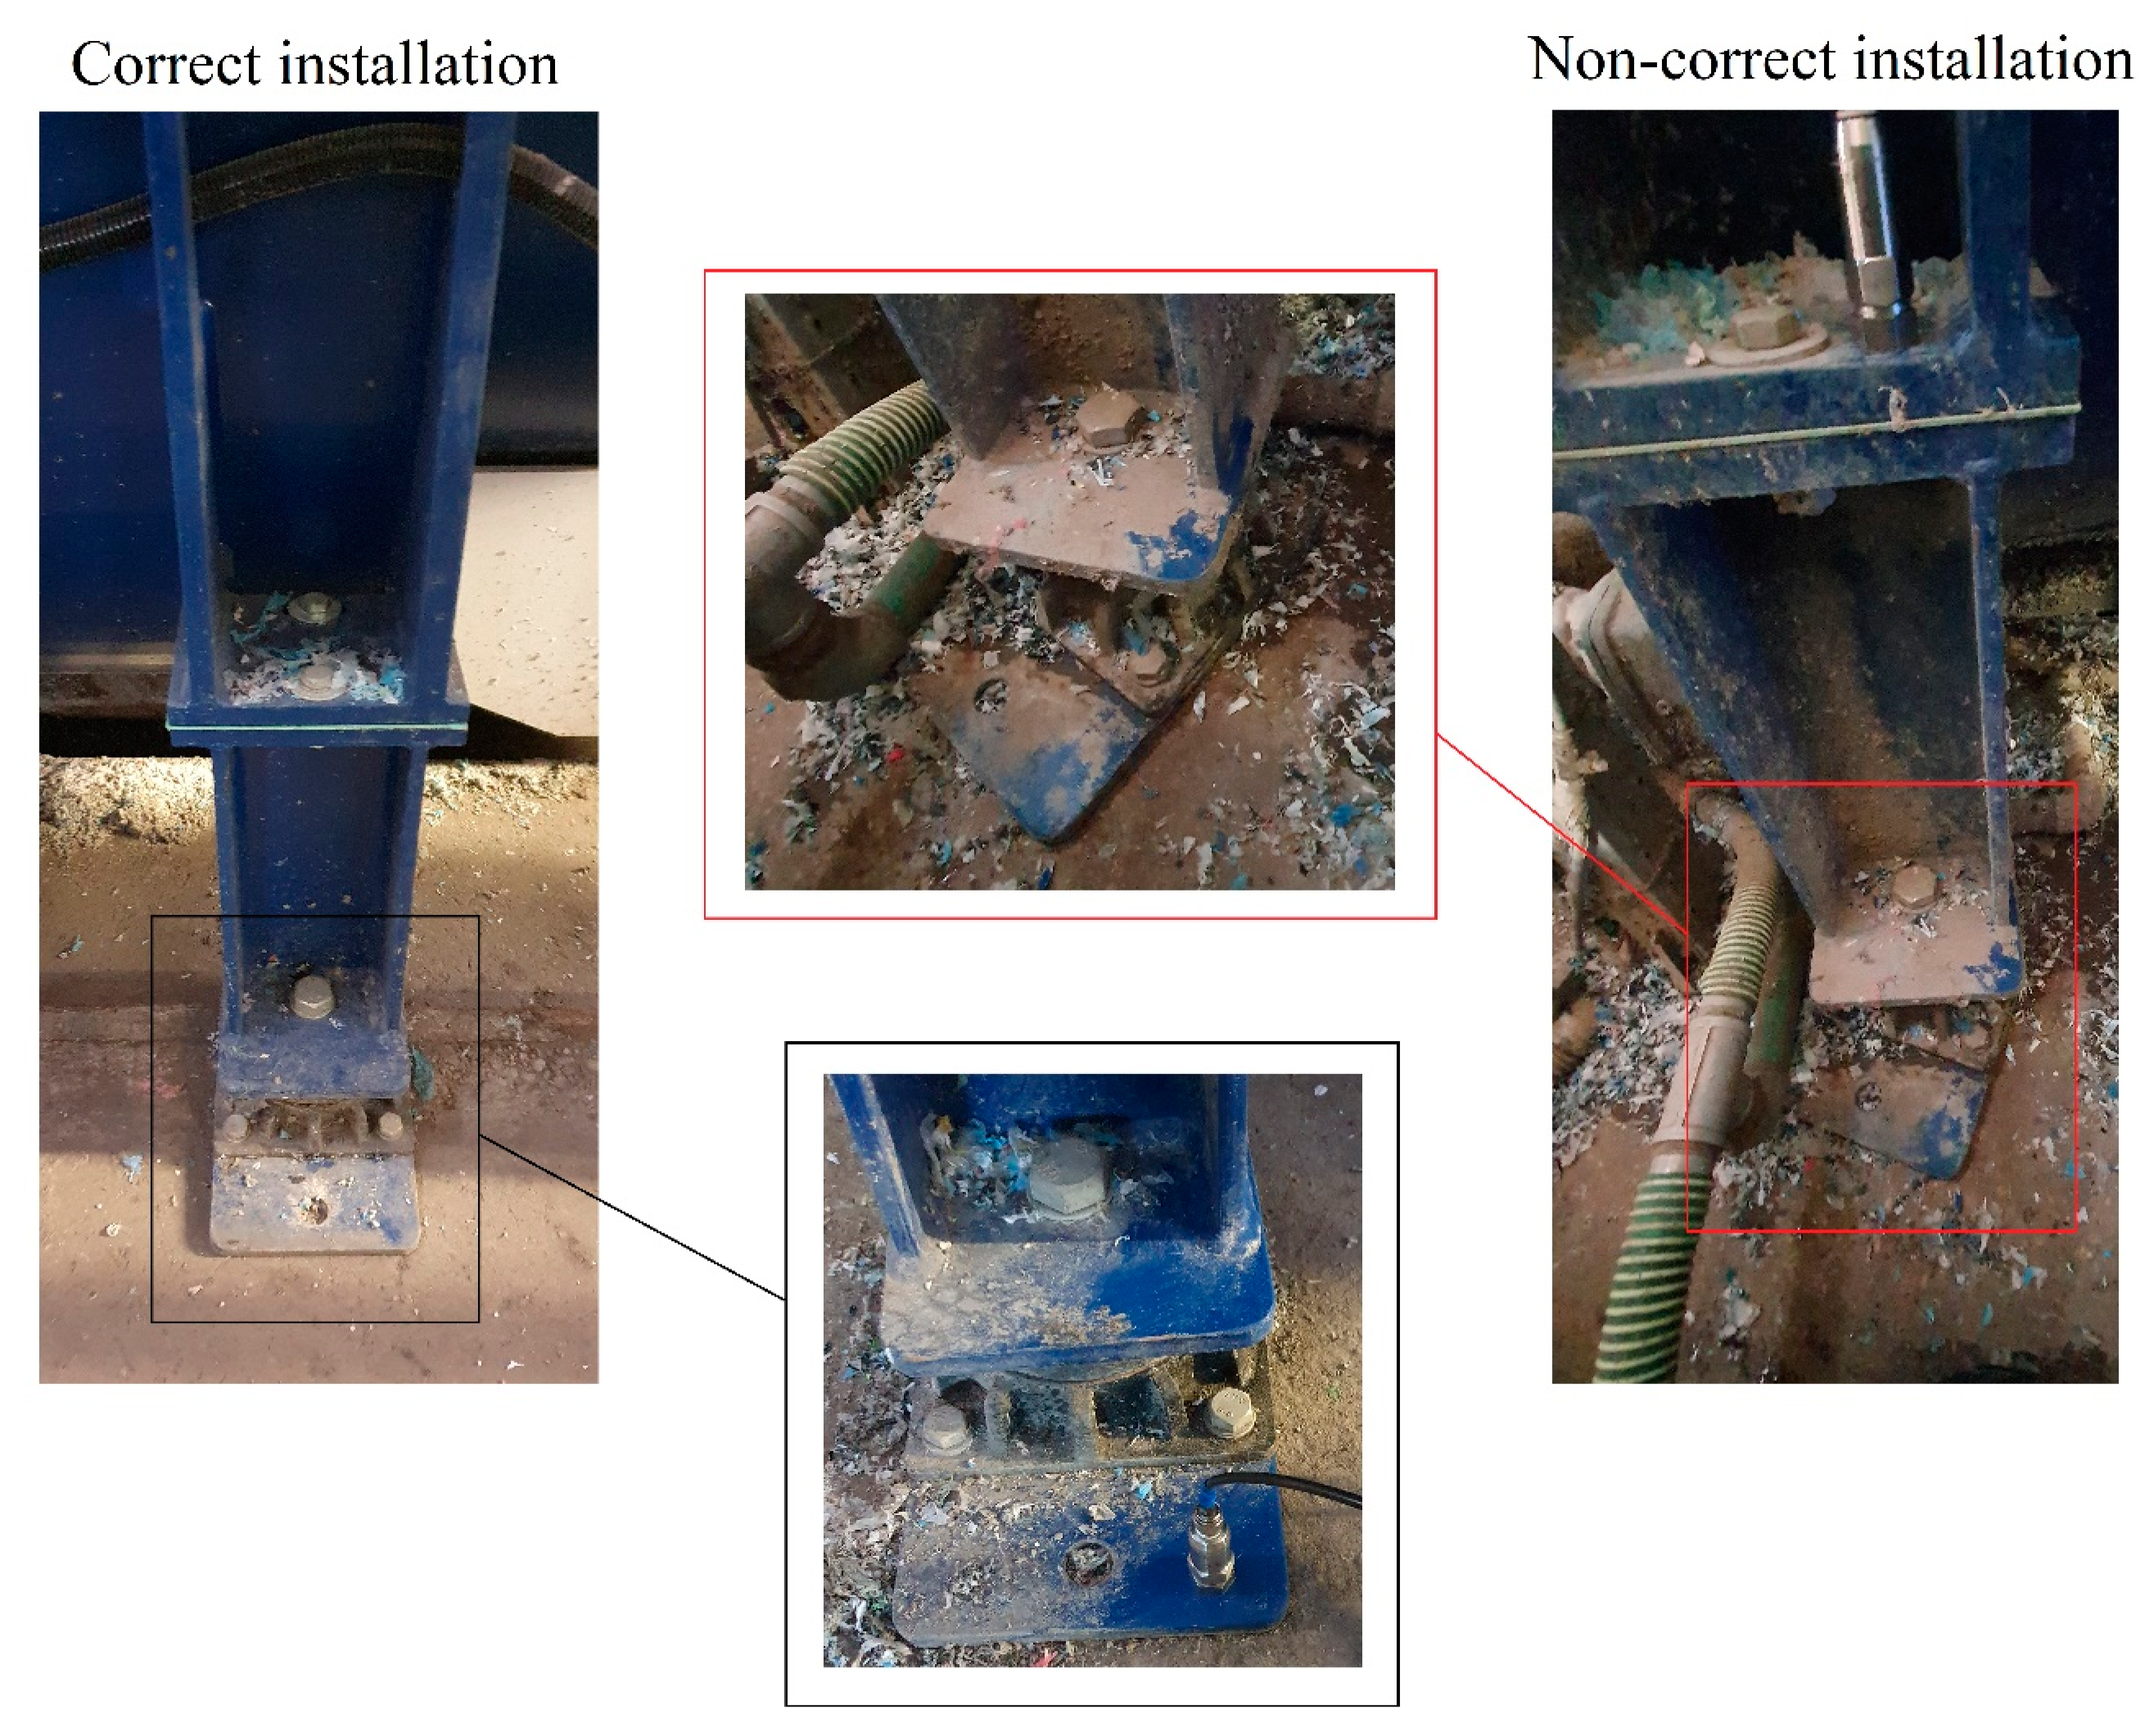
According to obtained results, the vibration level during operation of the machine was well-damped in three measured places (2, 3, and 4) in all directions. In mounting element 1, a high amplitude of vibration was observed. A comparison showed that in the first place z direction, the damping of vibration was in the low range, but in the x and y directions the damping was in the normal range. Even though this comparison/measurement/etc. does not take into account the higher range, it is possible that the z direction damping was not well-damped. This can be explained by the installation of damping elements and connection of (M) and (B) in different positions than all the others (Figure 11).
This incorrect installation probably caused the damping of vibration not to work properly by failing to keep the element in the 1st place attached to the floor. Because the x and y directions of vibration provided sufficient damping, the current situation can be solved by locating the source of the high vibration.
This study investigated the vibrations of centrifugal loop dryer machines used in plastic recycling processes. A real-time operational analysis was performed of centrifugal loop dryer machines’ vibration characteristics and their influence on operation results. The results identified a problem with some melted plastic still being too wet after mechanical drying, which did not meet the required standards. This was caused by the incorrect installation of damper elements of the holding elements. Finaly, it is recommended that a correction of the machine installation and a control measurement (in measuring place 1) are performed to determine whether the vibration on the base of the machine still exists.
In conclusion, this study’s in-depth exploration of the vibrations in centrifugal loop dryer machines utilized in plastic recycling processes has shed valuable light on their operational dynamics. The real-time analysis of vibration characteristics has pinpointed a critical issue: certain melted plastic retains excessive moisture post-mechanical drying, falling below the stipulated standards. This anomaly can be directly attributed to the improper installation of damper elements within the holding components. To rectify this issue, the study recommends a thorough correction of the machine installation process. Furthermore, a prudent follow-up control measurement, specifically at measuring place 1, is proposed to verify whether vibrations persist at the machine’s base after the corrective measures are implemented. This comprehensive investigation not only identifies a specific operational challenge but also provides actionable recommendations for enhancing the efficiency and adherence to quality standards in plastic recycling processes involving centrifugal loop dryer machines.

4. Conclusions

The present study investigates the vibrations of centrifugal loop dryer machines used in plastic recycling processes. In this study, two identical loop dryers were installed and operated in parallel in a single recycling line. These machines are characterized by large uncertainties, high vibration, and unmodeled dynamics, making the design and maintenance of real-time state estimators for their operational conditions difficult. The current research includes an analysis of the centrifugal loop dryer machines’ vibration characteristics and their influence on operation results, based on vibration analysis, frequency response analysis, and expertise. The vibration analysis is performed by measuring the vibration level and performing additional Fourier transform spectrum analysis. Measurements were performed using a two-sample measurement design and based on a one-sample statistical method for estimating uncertainty in repeated measurements of data processing.
Through a real-time operational analysis of the centrifugal loop dryer machines’ vibration characteristics and their influence on operation results, a problem was revealed that consisted of some melted plastic still being too wet after mechanical drying. This means that it does not meet the required standards, as a result of the incorrect installation of the damper elements in one holding element. This study recommends the correction of the machine’s installation and that control measuring is conducted to determine whether there is a remaining tendency toward increased vibration on the base of the machine.

Author Contributions

Conceptualization, M.S. and M.K.; methodology, M.K., M.S., M.D. and P.S.; software, M.K., A.B. and P.Ž.; validation, P.S. and P.Ž.; formal analysis, M.D. and A.B.; investigation, M.K. and M.S.; resources, A.B. and P.S.; data curation, M.D. and A.B.; writing—original draft preparation, M.K., M.S. and P.Ž.; writing—review and editing, M.K., P.S. and A.B.; visualization, M.K., P.Ž. and M.S.; supervision, M.K. and M.S.; project administration, M.S.; funding acquisition, M.S., P.Ž. and M.K. All authors have read and agreed to the published version of the manuscript.

Funding

This research received no external funding.

Institutional Review Board Statement

Not applicable.

Informed Consent Statement

Not applicable.

Data Availability Statement

All data included in this research are available upon request from the corresponding author.

Acknowledgments

Authors thankful for polyethylene factory AB “PLASTA” (Vilnius, Lithuania) for provided opportunity of using factory equipment’s for current research.

Conflicts of Interest

The authors declare no conflict of interest.

References

  1. Bogdevičius, M.; Karpenko, M.; Bogdevičius, P. Determination of rheological model coefficients of pipeline composite material layers based on spectrum analysis and optimization. J. Theor. Appl. Mech. 2021, 59, 265–278. [Google Scholar] [CrossRef] [PubMed]
  2. Alqahtani, S.; Muhammad, H.; Farukh, F.; Kandan, K. Experimental and computational analysis of polymeric lattice structure for efficient building materials. Appl. Therm. Eng. 2023, 218, 119366. [Google Scholar] [CrossRef]
  3. Feng, Q.; Wang, L. The effect of polymer composite materials on the comfort of sports and fitness facilities. J. Nanomater. 2022, 2022, 9108458. [Google Scholar] [CrossRef]
  4. Ramakrishna, S.; Mayer, J.; Wintermantel, E.; Leong, K. Biomedical applications of polymer-composite materials: A review. Compos. Sci. Technol. 2001, 61, 1189–1224. [Google Scholar] [CrossRef]
  5. Guo, S.; Wang, H.; Liu, Y.; Fu, Y.; Zhang, X.; Qi, B.; Liu, T. Preparation and closed-loop recycling of ultra-high-filled wood flour/dynamic polyurethane composites. Polymers 2023, 15, 1418. [Google Scholar] [CrossRef] [PubMed]
  6. Linder. System Solutions—Plastics Recycling. Lindner-Recycl. GmbH. 2019. 9p. Available online: https://www.lindner.com/fileadmin/user_upload/LRT_Broschuere_PLASTICS_16S_A4_EN_WEB_DS.pdf (accessed on 20 October 2023).
  7. Alzahrani, M.; Alhumade, H.; Simon, L.; Yetilmezsoy, K.; Madhuranthakam, C.; Elkamel, A. Additive manufacture of recycled poly(ethylene terephthalate) using pyromellitic dianhydride targeted for FDM 3D-printing applications. Sustainability 2023, 15, 5004. [Google Scholar] [CrossRef]
  8. Linder. Linder WashTech Company Official Web Page. Available online: https://www.lindner-washtech.com/system-solutions (accessed on 20 October 2023).
  9. Hamid, K.; Sajjad, U.; Yang, K.; Wu, S.; Wang, C. Assessment of an energy efficient closed loop heat pump dryer for high moisture contents materials: An experimental investigation and AI based modelling. Energy 2022, 238 (Part B), 121819. [Google Scholar] [CrossRef]
  10. Chaanaoui, M.; Abderafi, S.; Vaudreuil, S.; Bounahmidi, T. Prototype of phosphate sludge rotary dryer coupled to a parabolic trough collector solar loop: Integration and experimental analysis. Sol. Energy 2021, 216, 365–376. [Google Scholar] [CrossRef]
  11. Mihindukulasuriya, S.; Jayasuriya, H. Drying of chilli in a combined infrared and hot air rotary dryer. J. Food Sci. Technol. 2015, 52, 4895–4904. [Google Scholar] [CrossRef] [PubMed]
  12. Kim, A.; Doudkin, M.; Ermilov, A.; Kustarev, G.; Sakimov, M.; Mlynczak, M. Analysis of vibroexciters working process of the improved efficiency for ice breaking, construction and road machines. J. Vibroeng. 2020, 22, 465–485. [Google Scholar] [CrossRef]
  13. Langford, A.; Bhatnagar, B.; Walters, R.; Tchessalov, S.; Ohtake, S. Drying technologies for biopharmaceutical applications: Recent developments and future direction. Dry. Technol. 2018, 36, 677–684. [Google Scholar] [CrossRef]
  14. Yan, J.; Laflamme, S.; Singh, P.; Sadhu, A.; Dodson, J. A comparison of time-frequency methods for real-time application to high-rate dynamic systems. Vibration 2020, 3, 204–216. [Google Scholar] [CrossRef]
  15. Downey, A.; Hong, J.; Dodson, J.; Carroll, M.; Scheppegrell, J. Millisecond model updating for structures experiencing unmodeled high-rate dynamic events. Mech. Syst. Signal Process. 2020, 138, 106551. [Google Scholar] [CrossRef]
  16. Hong, J.; Laflamme, S.; Cao, L.; Dodson, J.; Joyce, B. Variable input observer for nonstationary high-rate dynamic systems. Neural Comput. Appl. 2020, 32, 5015–5026. [Google Scholar] [CrossRef]
  17. Boashash, B. Chapter 15—Time-frequency diagnosis, condition monitoring, and fault detection. In Time-Frequency Signal Analysis and Processing, 2nd ed.; Boashash, B., Ed.; Academic Press: Oxford, UK, 2016; pp. 857–913. [Google Scholar] [CrossRef]
  18. Goyal, D.; Pabla, B. The vibration monitoring methods and signal processing techniques for structural health monitoring: A review. Arch. Comput. Methods Eng. 2016, 23, 585–594. [Google Scholar] [CrossRef]
  19. Dörfler, M.; Matusiak, E. Nonstationary Gabor frames—Approximately dual frames and reconstruction errors. Adv. Comput. Math. 2015, 41, 293–316. [Google Scholar] [CrossRef]
  20. Busch, P.; Heinonen, T.; Lahti, P. Heisenberg’s uncertainty principle. Phys. Rep. 2007, 452, 155–176. [Google Scholar] [CrossRef]
  21. Piersol, A.; Paez, T. Harris’ Shock and Vibration Handbook, 6th ed.; McGraw-Hill Co., Inc.: New York, NY, USA, 2010; 1168p. [Google Scholar]
  22. Feng, Z.; Liang, M.; Chu, F. Recent advances in time–frequency analysis methods for machinery fault diagnosis: A review with application examples. Mech. Syst. Signal Process. 2013, 38, 165–205. [Google Scholar] [CrossRef]
  23. Lubecki, M.; Stosiak, M.; Bocian, M.; Urbanowicz, K. Analysis of selected dynamic properties of the composite hydraulic microhose. Eng. Fail. Anal. 2021, 125, 105431. [Google Scholar] [CrossRef]
Figure 1. Plastic recycling processes machines line based on [6].
Machines 12 00029 g001
Figure 2. Vibration acceleration spectrum of the top cover of the hydraulic power pack tank.
Machines 12 00029 g002
Figure 4. View of the research methodology.
Machines 12 00029 g004
Figure 5. Diagnostic processes: (a) machines under diagnostics; (b) test measurement processes and equipment.
Machines 12 00029 g005
Figure 6. View of the measurement points of machines.
Machines 12 00029 g006
Figure 7. Graphs of vibration data on the 3rd measured place of Machine № 1: (a) in x direction; (b) in y direction; (c) in z direction.
Machines 12 00029 g007
Figure 8. Frequency response of vibration on the 3rd measured place of Machine № 1 in z direction.
Machines 12 00029 g008
Figure 9. Graphs of vibration data on the 1st measured place of Machine № 2: (a) in x direction; (b) in y direction; (c) in z direction.
Machines 12 00029 g009
Figure 10. Frequency response of vibration on the 1st measured place of Machine № 2 in z direction.
Machines 12 00029 g010
Figure 11. The view of correct and incorrect installations of mounting elements.
Machines 12 00029 g011
Table 1. Vibration analysis of Machine № 1.
Place of MeasuringBody, mmTop (T), mmMiddle (M), mmBase (B), mm
1 by x~1.527~0.801~0.505~0.321
1 by y~0.828~0.524~0.323
1 by z~0.841~0.581~0.329
2 by x~1.527~0.721~0.566~0.221
2 by y~0.744~0.578~0.235
2 by z~0.813~0.592~0.238
3 by x~1.527~0.822~0.609~0.317
3 by y~0.873~0.611~0.324
3 by z~0.882~0.654~0.329
4 by x~1.527~0.781~0.574~0.216
4 by y~0.798~0.575~0.217
4 by z~0.801~0.588~0.222
Table 2. Vibration analysis of Machine № 2.
Place of MeasuringBody, mmTop (T), mmMiddle (M), mmBase (B), mm
1 by x~1.542~1.231~0.424~0.292
1 by y~1.289~0.527~0.378
1 by z~1.349~1.291~0.939
2 by x~1.542~0.781~0.574~0.216
2 by y~0.798~0.575~0.217
2 by z~0.801~0.588~0.222
3 by x~1.542~0.821~0.604~0.242
3 by y~0.829~0.612~0.247
3 by z~0.844~0.619~0.249
4 by x~1.542~0.762~0.564~0.226
4 by y~0.776~0.569~0.229
4 by z~0.798~0.592~0.305
Disclaimer/Publisher’s Note: The statements, opinions and data contained in all publications are solely those of the individual author(s) and contributor(s) and not of MDPI and/or the editor(s). MDPI and/or the editor(s) disclaim responsibility for any injury to people or property resulting from any ideas, methods, instructions or products referred to in the content.