Abstract
A vibration scale training model for converter transformers is proposed by combining attention modules with convolutional neural networks to solve the nonlinear problem of converter transformers in similar processes. Firstly, according to the structure and operating parameters of the converter transformer, a reliable three-dimensional multi-field coupled finite element model was established considering the influence of the winding and iron core component structure on the overall vibration characteristics. By changing different input parameters such as the size and voltage of the finite element model, corresponding output parameters are obtained, and a dataset is established through data expansion for training and verifying the attention convolution model. By analyzing the prediction processes and results of five prediction models on different operating conditions datasets, it is shown that attention convolution has higher accuracy, faster convergence speed, more stable training process, and better generalization performance in the prediction process of converter transformer recognition. Based on the predictive model, a prototype of the proportional vibration model for the converter transformer with scale factor of 0.2 was designed and manufactured. By analyzing the basic experimental items and vibration characteristics of the prototype, the stability of the prototype and the reliability of the prediction model were verified.
1. Introduction
Nowadays, with the rapid development of human society, the power load has sharply increased, energy resources are limited, and they are generally distributed in the opposite direction to the load center, forcing faster progress in high-voltage direct current transmission technology [1,2,3]. As the core equipment of high-voltage direct current transmission engineering, converter transformers have the characteristics of large volume, expensive price, and complex operating environment. It is very difficult to conduct in-depth research on the relevant internal mechanisms. In addition, due to safety limitations, it is difficult to conduct in-depth research on the internal structural vibration characteristics of operating converter transformers, which seriously hinders the further development of converter transformers and high-voltage direct current transmission technology [4,5]. The scale model has become a necessary condition for solving the internal structural vibration problem of converter transformers, but there are still engineering difficulties in developing accurate and effective electromagnetic and vibration scale models for converter transformers. By utilizing the principle of similarity and combining relevant empirical formulas, the similarity criteria for power equipment can be easily derived, which is one of the effective measures to solve the similarity problem of such large-capacity power equipment. However, due to the complex structure of the converter transformer and the existence of a large number of nonlinear problems during operation, the similarity process of the proportional model has a large number of approximate expressions, making it difficult to solve the accuracy problem of the scaled model of the converter transformer [6]. Reference [7] established a mathematical model of dual windings using the multi-conductor transmission line (MTL) method and studied the proportional model voltage distribution of an 800 kV converter transformer under lightning impulse. However, there is a lack of physical explanation and experimental verification of the scaling process of the converter transformer. Reference [8] studied the scale model of high-frequency transformers applied to railway substations and analyzed their electromagnetic compatibility issues, but it only analyzed the scaling form of the circuit and did not provide further explanation for the scaling principle of vibration and other electromagnetic parameters; Reference [9] established a simplified scaling criterion for transformers based on the relationship between physical quantities and designed a scale transformer model with a scaling ratio of 1/20. However, the finite element and experimental parts of this study only analyzed the pulse voltage distribution of the scale model, lacking validation of other parameters during the scaling process. At present, there are few high-precision research methods proposed for the vibration scaling model of converter transformers.
Driven by intelligent manufacturing, industry 5.0, and industrial big data, the manufacturing industry is undergoing a revolution, transforming traditional manufacturing practices into intelligent manufacturing [10,11,12]. Artificial intelligence methods can effectively handle nonlinear relationships in data. The geometric parameters, electromagnetic parameters, and solid mechanics parameters of the converter transformer are taken as the input, and the vibration characteristic parameters are taken as the output, so the solution of the vibration similarity criteria of the converter transformer can be understood as a process of multi-input and multi-output neural network training, from which the expected network model can be obtained through a large amount of data training, Given any input parameter, the vibration parameters of the reduced or amplified converter transformer can be accurately output. The CNN neural network package uses convolutional pooling to extract data features, reducing errors caused by human feature extraction. It is widely used in fields such as images, speech, power electronics, etc. [13]. References [14,15] used CNN models to extract features from input data for data prediction and found that they had higher accuracy in learning highly nonlinear sequences; however, when data volatility and instability are high, a single CNN model has difficulty in learning the dynamic changes of the data well. The attention mechanism is a resource allocation mechanism that can assign different weights to input features so that features containing important information do not disappear with the increase of step size, highlighting the impact of more important information and making it easier for the model to learn long-distance interdependent relationships in the sequence [16]. Yin et al. proposed a convolutional neural network based on attention mechanism, which integrates the interaction between sentences into CNN for modeling and recognition in natural language processing [17]. CNN has subsequently been well applied in the optimization convolution research of various feature patterns, including single line-to-ground fault detection [18], remote sensing scene classification [19], etc.
For a ±500 kV single-phase dual winding converter transformer, taking advantage of convolutional neural networks in processing nonlinear data combined with attention mechanisms to improve feature ambiguity and instability during the convolutional process, this paper proposes a vibration scaling model design method for converter transformers. By converting the finite element model structure and electrical parameters, the excitation response under different parameters is obtained, and a dataset is obtained through data expansion to predict the training and validation of the model. By analyzing the data distribution, accuracy, and errors during the model iteration process, it is shown that the network model has good robustness and universality. Based on this training model, a vibration scaling model prototype was designed and produced. Basic experiments and vibration characteristics analysis were conducted on the prototype to verify its reliability and stability. The CNN-AM proportional model design method proposed in this article solves the problem of non-linear fitting of electromagnetic and vibration parameters of converter transformers in similar processes, and improves the accuracy and reliability of solving similar problems. A highly reliable prototype of converter transformers was designed and prepared to study the mechanism of vibration and noise and suppression strategies, which has certain reference value for further optimizing the design of converter transformers. This design method provides a reference method for the similarity problem of nonlinear parameters, and it is suitable for research on the design and suppression strategy of vibration and noise mechanism experimental platforms for large power equipment.
2. Construction of Neural Network Model
2.1. Convolutional Neural Network
The convolutional neural network (CNN) is a kind of feedforward neural network that can deal with overfitting problems well so that large-scale deep learning can be realized [20]. Since LeNet-5 was proposed by Lecun [21], the basic structure of convolutional neural networks has been determined, mainly consisting of an input layer, convolutional layer, pooling layer, fully connected layer, and output layer; the overall structure of one-dimensional convolution is shown in Figure 1. The convolutional layer uses a certain size of convolution to check local features for convolution operations. After the nonlinear activation function, multiple feature surfaces are output. The same input feature surface and the same output feature surface share the same convolution kernel to achieve weight sharing and easy training. Its mathematical model can be described as

Figure 1.
CNN structure diagram.
In the formula, represents the jth feature map of the lth layer; f (·) is the activation function; M is the number of input feature maps; i is the number of ith feature maps in layer l-1; is a trainable convolutional kernel; is the offset.
In the selection of convolutional network activation function, compared with the sigmoid function and tanh function, the ReLu function can better solve the problem of gradient explosion or gradient disappearance and can also accelerate the convergence speed [22,23]. The calculation formula of the ReLu activation function is
The pooling layer is generally set after the convolutional layer, and its output feature surfaces correspond one-to-one to the feature surfaces output by the previous convolutional layer. Local acceptance domains are down-sampled through a specific size of “window”, and different “windows” do not overlap, which has the function of feature information integration and dimensionality reduction. The commonly used pooling methods include max pooling and mean pooling. The error in feature extraction mainly comes from the increase in estimation variance caused by the limited size of the two neighborhoods and the deviation of the estimation mean caused by the parameter error of the convolutional layer. Generally speaking, mean pooling can reduce the first type of error and preserve more background information of the data, while max pooling can reduce the second type of error and preserve more texture details. In order to enhance local details and reduce information loss during the iteration process, this article chose max pooling.
Using downsampling to extract characteristic information, the mathematical model is
In the formula, f(·) is the pooling function. This article selected the maximum pooling method; down(·) is the down-sampling function; is set to 0.
2.2. Attention Mechanism
Researchers have proposed the attention mechanism (AM) based on their research on human vision [24] to achieve efficient allocation of information processing resources. The attention mechanism is a resource allocation mechanism that allocates different weights of input features, ensuring that important features do not disappear with increasing step size. It is one of the core technologies that deserve the most attention and in-depth understanding in deep learning technology. Based on the above principles, this article introduces the attention mechanism into convolutional neural networks, weighting all input features one by one, focusing on specific spaces and channels, and adopting an end-to-end learning approach to achieve the extraction of significant fine-grained features of sequences.
The attention module can be added between different convolutional layers to achieve adaptive adjustment of features, and its principle can be expressed by the following formula.
Let F be an m × n dimensional feature matrix, where m is the spatial dimension and n is the channel. The mathematical model for channel attention is
In the formula, AcgP(·) is average pooling, MaxP(·) is maximum pooling, MLP(·) is the multi-layer perceptron, σ is the activation function, and Mc(F) is the channel attention parameter matrix.
The calculation formula for fusing the learned attention parameter matrix with the original features is
In the formula, F′ is the fused feature matrix; is the multiplication of corresponding bit elements.
The mathematical model of spatial attention is
In the formula, “[]” represents matrix merging; Ms (F) is the spatial attention parameter matrix; and f is the convolution operation.
2.3. A Convolutional Neural Network Training Model Combining Attention Mechanism
Because the similarity process of converter transformers involves a large number of nonlinear problems, such as the distribution of electromagnetic fields before and after similarity, structural mechanics distribution, etc., data feature extraction and weight distribution should be focused on when designing the training model structure. The CNN model has higher accuracy in predicting data on highly nonlinear sequences [25,26]. After the original data passes through the convolutional layer, different features will be obtained, and a single CNN model cannot measure the importance of these features. Moreover, due to the volatility and instability of the data, CNN models have difficulty in learning the dynamic changes of the data well. This article adds an attention mechanism to the CNN model and optimizes the model structure, constructing a CNN-AM training model, as shown in Figure 2. The attention mechanism sends the features obtained through convolutional layers into the softmax function. It can calculate the weight coefficients of different feature dimensions and then multiply the coefficients with the corresponding elements of the input features to form new features. These new features are those that have been assigned weights and can help the model obtain more critical and important information, enabling it to make more accurate judgments.

Figure 2.
CNN-AM structure diagram.
Through Adam (adaptive motion estimation) [27], various parameters of the network are optimized, and the training process of the prediction model is corrected through loss function observation:
where loss is the loss function, p(x) is the expected output, and q(x) is the actual output.
2.4. Experimental Platform and Evaluation Standards
This article trained the dataset using BP, ANN, SVM, CNN, and CNN-AM networks under the Ubuntu 16.04 operating system. The experimental environment is Python 3.7. Before training, the dataset is divided into training, testing, and validation sets, with proportions of 60%, 30%, and 10%, respectively. The Adam optimizer is used for training, the learning rate is 0.001, and the loss function is the cross-entropy loss function. In order to accelerate the convergence speed of the model and reduce the influence of outliers, the physical covariates in the data records are normalized [28], and the formula is as follows:
Among them, xi is the normalized sequence, is the original input sequence, and xmin and xmax are the minimum and maximum values of the data. After normalization, the values of the data are all within [0, 1].
By comparing the training results of the test set, the accuracy of the model can be obtained, and it is necessary to analyze and evaluate the model error. Considering that the model has multiple prediction results and there are differences in the order of magnitude and units of each prediction value, in order to facilitate the unity and comparison of prediction accuracy, this paper uses the average absolute percentage error of normalized data as the evaluation standard for parameter error to fairly and reliably compare the six prediction indicators and the overall prediction accuracy:
3. Dataset Establishment
Based on the design parameters of a ±500 kV converter transformer provided by the limited company, a finite element method was used to establish the electromagnetic force multi-field coupling model of the converter transformer. In order to improve computational efficiency, some details were simplified, as shown in Figure 3. This type of converter transformer is applied to the Jiangsu-Baihetan HVDC transmission project in China. It is a single-phase dual winding structure with ±500 kV of load voltage regulation. The main difference between this model and other finite element studies on transformers lies in the simplification of the internal component structure. The internal components mainly include a six-step slot silicon steel core and two winding cakes with an entangled-continuous-entangled winding structure. This is the main source of transformer vibration noise, and it is necessary to focus on their role in the vibration noise process, rather than overly simplifying them like in similar studies [7].
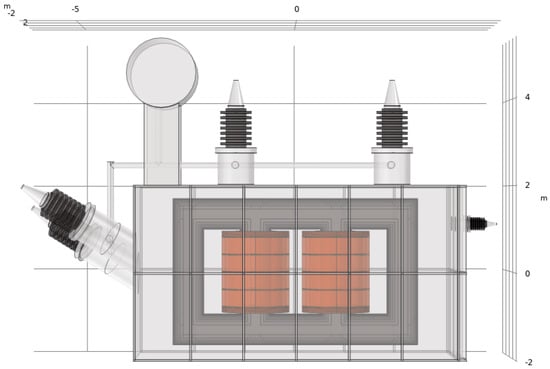
Figure 3.
Structural diagram of the electric magnetic force multi-field coupling model for converter transformers.
Due to the main focus of this article on the vibration characteristics of the internal components of the converter transformer, non-essential elements such as bolt structures, support frames, and oil conservators outside the oil tank have been simplified, with a focus on refining the iron core and winding structures. Figure 4 depicts the design details of the converter transformer winding. Considering the insulation and electrical performance of the actual winding, the overall winding is designed as an upper entanglement type, middle continuous, and lower entanglement type winding method, with insulation pads spaced between each cake. Finally, the continuity of current flow sequence is achieved through the field circuit coupling principle.
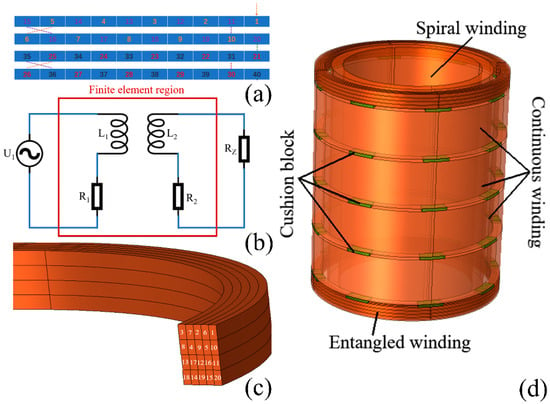
Figure 4.
(a) Entangled winding wire turn arrangement; (b) field circuit coupling method; (c) current sequence of entangled winding; (d) winding model.
The model vibration mode of the converter transformer can reflect its inherent structural vibration form and obtain the characteristic frequency distribution of the model, independent of external excitation. In the finite element software, the converter transformer frequency domain analysis model that only considers geometry and solid mechanics is established separately, and modal calculation is carried out on the model to obtain its natural frequency and modal distribution. Table 1 lists the first six natural frequencies of the winding and iron core with significant vibration phenomena, while Figure 5 shows their respective modal distributions. When designing converter transformers, it is often necessary to consider the mode of the body to avoid resonance with the applied power during operation.

Table 1.
Modal distribution of iron core and winding.

Figure 5.
Modal distribution.
Figure 6a–f show the magnetic flux, force distribution, and deformation distribution of the winding and iron core at the same time. As mentioned earlier, the advantage of the finite element method is that it can extract physical information at any finite element point. Compared with actual converter transformers and previous literature data, it can be seen that the threshold values of various parameters of the model and their distribution at each point are reasonable, which provides a guarantee for the rationality of further dataset construction.
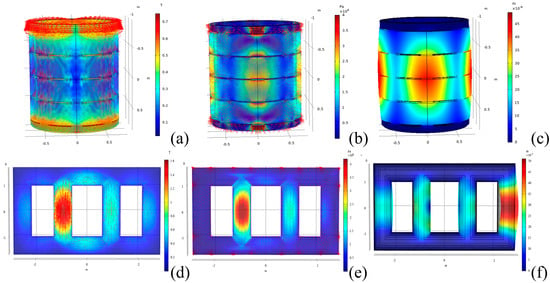
Figure 6.
Vibration characteristics distribution: magnetic flux leakage distribution (a), winding stress distribution (b), winding displacement distribution (c), magnetic flux density distribution (d), core force distribution (e), and core displacement distribution (f).
For neural networks, the final training accuracy is usually determined by the selection and organization of training data. The more relevant the selection of data is to the output variables, the faster and more accurate it is to determine the connections and weights between internal network nodes. Therefore, it is necessary to reorganize and clarify the selection of input and output variables and their inherent known relationships. The vibration noise of the transformer body mainly comes from the excitation response of its internal winding and iron core under alternating electromagnetic fields, namely the electrodynamic force and magnetostrictive effect. That is to say, the vibration and noise of transformers are external manifestations of the vibration of the iron core and winding. Therefore, determining the force and displacement of windings and iron cores similar to that of the model is equivalent to determining the external vibration noise of the transformer. Therefore, the input parameters are selected as geometric size ratio, input voltage, and winding turns, while the output parameters correspond to the force and displacement of the winding and iron core. The input parameters of the converter transformer were changed to obtain the corresponding output parameters, and a total of 2000 sets of input and output parameter data were recorded for model training and validation.
4. Experimental Results
The box graph analysis of the first 64 iterations of the CNN-AM training process is plotted in Figure 7. The rectangle shows the 25–75% distribution of the data, and the diamond represents the outlier during the training process. Figure 7a,b show the predicted distribution of core force, core displacement, core acceleration, winding force, winding displacement, and winding acceleration during the iteration process. It can be clearly seen from the box diagram that the training results of the CNN-AM model are relatively concentrated and relatively stable in the iterative process, and the outliers are less and evenly distributed near the maximum and minimum values. This mainly benefits from the enhancement effect of Relu and the attention mechanism on eigenvalues, which stabilizes the training direction and avoids the occurrence of gradient disappearance and explosion.
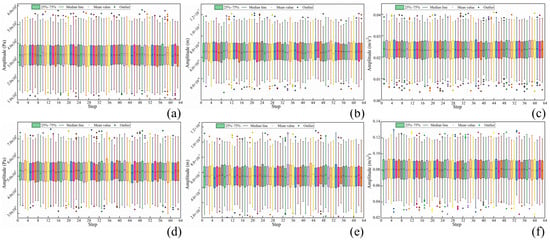
Figure 7.
Predicted distribution box plot of core force (a), core displacement (b), core acceleration (c), winding force (d), winding displacement (e), and winding acceleration (f) during the iteration process.
In order to further evaluate the reliability of the analysis model, the average absolute percentage errors of BP, ANN, SVM, CNN, and CNN-AM were calculated and compared, as shown in Figure 8. The relevant calculation data are summarized in Table 2. It can be seen that the average absolute percentage error of the output indicators of the BP model is very large, which is expected. Its antecedent feedback mechanism has weak ability in handling nonlinear data such as converter transformer vibration. The average absolute percentage error of CNN-AM on all six output indicators is the smallest, which is due to its advantages in handling nonlinear input-output relationships and its ability to highlight features.
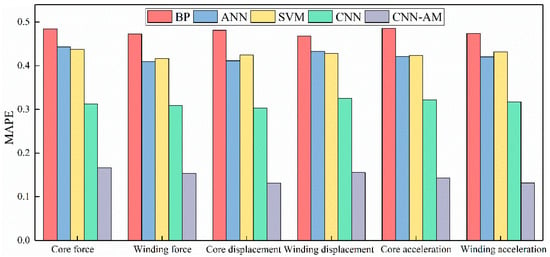
Figure 8.
Box plot of the results of the first 64 iterations of CNN-AM.

Table 2.
MAPE.
Figure 9 shows the accuracy of each prediction model under different operating conditions and similarity coefficient datasets. Figure 9a–f show the predicted results of core force, core displacement, core acceleration, winding force, winding displacement, and winding acceleration, respectively. As clearly shown in the figure, under other working conditions, the prediction accuracy of the prediction model has decreased, with ANN, SVM, and BP models showing the most significant decrease in accuracy, indicating that CNN is reasonable for predicting similar processes of converter transformers. The accuracy of the CNN-AM model slightly decreased during training on datasets under different operating conditions, but the average prediction accuracy remained above 97%, proving that the trained model has strong stability compared to other models [12]. Especially for datasets with scale coefficients greater than 1, the prediction accuracy of ANN and SVM models significantly decreases, while the prediction accuracy of CNN-AM model for six prediction parameters can still reach 96%, proving that the model has good universality [13].
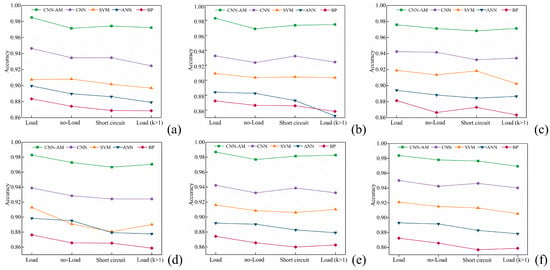
Figure 9.
Training accuracy of core force (a), core displacement (b), core acceleration (c), winding force (d), winding displacement (e), and winding acceleration (f) of each model under different validation sets.
5. Prototype Application
A scaled prototype of a ±500 kV converter transformer was designed and prepared using the data provided by the training model to guide the design and production of a 1:5 scale converter transformer. The prototype design is single-phase dual winding, with a capacity of 100 kVA and a rated voltage ratio of 100/3 kV. Compared with similar studies, the scale model of the converter transformer designed in this article includes all components of the prototype of the converter transformer and is proportionally reduced to ensure consistency of materials in all parts before and after scaling while considering the adjustment of electromagnetic and vibration parameters during operation.
Figure 10 shows the design process of the proportional prototype converter transformer. Figure 10a–c show the assembly effect of the iron core, winding, and internal components of the scale prototype, respectively. Figure 10d–f show the overall appearance structure and testing experimental arrangement of the scale prototype. Figure 11 shows the layout of measurement points for vibration characteristic testing.
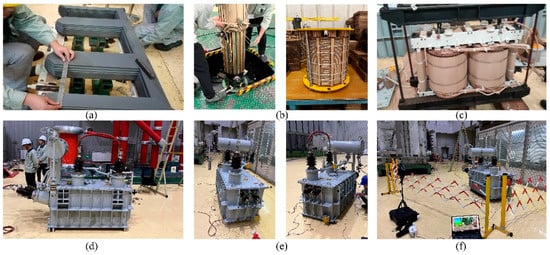
Figure 10.
Preparation of vibration scale prototype and vibration characteristics test: (a) iron core stacking; (b) winding; (c) internal component assembly; (d) front view of the prototype; (e) side of the prototype; (f) vibration testing of the prototype.
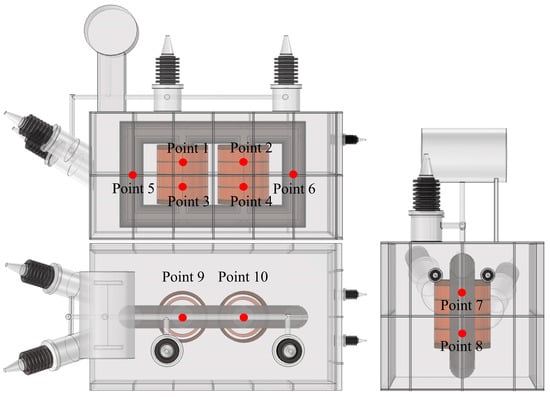
Figure 11.
Distribution of measuring points for vibration signal of scale prototype.
The time domain distribution of no-load vibration acceleration at each measuring point of the prototype is shown in Figure 12. Under no-load condition, the distribution peak values of the vibration signal dominated by the prototype iron core in the front oil tank and the side oil tank do not differ greatly. The overall vibration at the front oil tank is strong, while the distribution of the vibration signal on the oil tank wall of the top cover is relatively weak, which is related to the movement mode of the magnetic domain under excitation and the fixing mode of the iron core up and down.
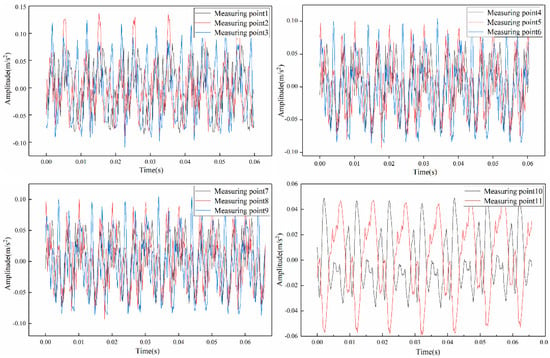
Figure 12.
Time domain diagram of no-load vibration noise of scaled prototype.
The time domain distribution of load vibration acceleration at each measuring point of the prototype is shown in Figure 13. Compared with no load, the overall amplitude of vibration signal under load condition is smaller, which is mainly related to the magnitude of excitation under load condition. The amplitude of the load vibration signal on the front tank wall is larger, while the amplitude on the side and top cover tank wall is weaker. The vibration signal at no load has certain periodicity, and its vibration period is about 0.01 s.
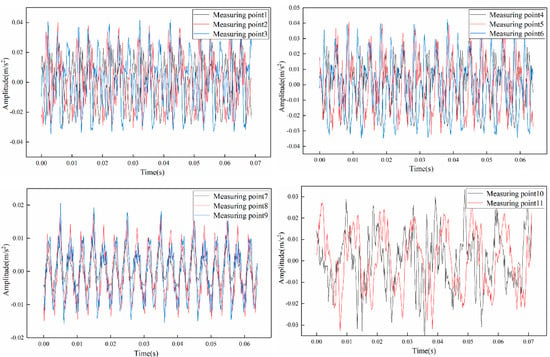
Figure 13.
Time domain diagram of load vibration noise of scale prototype.
Figure 14a,b respectively show the frequency distribution of the surface vibration acceleration of the fuel tank under the excitation of no-load voltage and load current on the scale prototype of the converter transformer. Figure 14c,d show the frequency domain distribution of vibration characteristics of the simulation scale model under no-load operating conditions. The measurement points represented in the figure are consistent with the positions in the experiment. By comparing the vibration distribution characteristics shown in Figure 14a,c, as well as in Figure 14b,d, it can be seen that the vibration characteristics of the scale prototype prepared based on the scale model design method proposed in this paper are basically consistent with those of the simulation model at the same position, regardless of whether it is operating under no-load voltage or load current conditions. They exhibit the same main frequency band and similar amplitudes between them, and the distribution of secondary frequencies with obvious vibration performance is also roughly the same. At the same time, the operational stability of the prototype and the basic factory test items have met the standards, verifying the feasibility of this research.
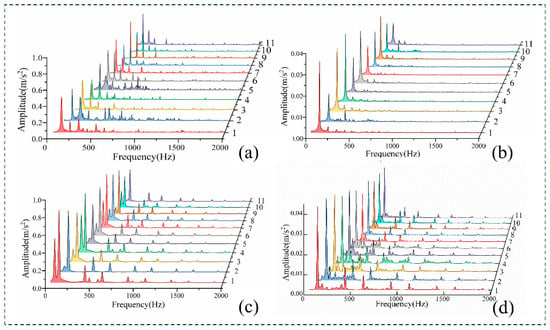
Figure 14.
(a) Frequency domain diagram of the prototype’s no-load vibration signal; (b) Frequency domain diagram of prototype load vibration signal; (c) Frequency domain diagram of simulated no-load vibration signal; (d) Simulate the frequency domain of load vibration signals.
6. Conclusions
This paper constructs a convolutional neural network vibration prediction model for ±500 kV single-phase dual winding converter transformers combined with an attention mechanism. Based on this prediction model, a large-scale vibration testing platform for converter transformers is designed and manufactured. Compared with other prediction models, CNN-AM has better convergence, higher prediction accuracy, and better universality in the similarity process of converter transformers. The introduction of the attention mechanism enhances the feature correlation between input and output in the similarity process of transformers, reduces the fluctuation of predicted data, and improves the descent speed and stability of the model loss function. By analyzing the vibration characteristics and factory experimental results of the vibration scale model of the converter transformer designed and manufactured based on the CNN-AM prediction algorithm, it is proven that the prototype has good reliability and stability and meets the standards of the converter transformer scale vibration test platform. This design method is applicable to the design of the vibration noise mechanism experimental platform for large power equipment and the study of suppression strategies.
Author Contributions
Conceptualization, L.Z. (Li Zhang); methodology, L.Z. (Liang Zou); software, L.Z. (Liang Zou); validation, Y.S.; formal analysis, H.W.; investigation, Y.S.; resources, L.Z. (Li Zhang); data curation, L.Z. (Li Zhang); writing—original draft preparation, H.W.; writing—review and editing, H.W.; visualization, Y.S.; supervision, L.Z. (Li Zhang); project administration, L.Z. (Li Zhang); funding acquisition, Y.S. All authors have read and agreed to the published version of the manuscript.
Funding
This work was supported by the Key R&D Program of Shandong Province (2021CXGC010210).
Data Availability Statement
Data are contained within the article.
Conflicts of Interest
The authors declare that they have no known competing financial interests or personal relationships that could have appeared to influence the work reported in this paper.
References
- Kim, C.K.; Sood, V.K.; Jang, G.S.; Lim, S.J.; Lee, S.J. HVDC Transmission: Power Conversion Applications in Power Systems; Wiley-IEEE Press: Hoboken, NJ, USA, 2009. [Google Scholar]
- Dan, K. HVDC to Grow Rapidly. Nat. Gas Electr. 2015, 31, 11–18. [Google Scholar]
- Du, B.; Wang, Q.; Tu, Y.; Tanaka, Y.; Li, J. Guest Editorial: Advanced Materials for HVDC Insulation. High Volt. 2020, 5, 351–352. [Google Scholar]
- Guo, Z.Y.; Lin, T.; Jia, G.T.; Wang, L. Influence of Converter Bus Serious Harmonic Distortion on HVDC Transmission System. Acta Autom. Sin. 2017, 43, 1412–1417. [Google Scholar]
- Jiang, P.; Zhang, Z.; Dong, Z. Research on distribution characteristics of vibration signals of ±500 kV HVDC converter transformer winding based on load test. Int. J. Electr. Power Energy Syst. 2021, 132, 107200. [Google Scholar] [CrossRef]
- Wang, H.; Zhang, L.; Sun, Y.; Zou, L. Vibration Scale Model of a Converter Transformer Based on the Finite Element and Similarity Principle and Its Preparation. Processes 2023, 11, 1969. [Google Scholar] [CrossRef]
- Xie, Q.; Li, J.; Wang, T.; Pu, Z.; Zhang, Y.; Du, Z. Research on Wave Process for 800 kV Converter Transformer Scale Model. Transformer 2016, 2, 12–16. [Google Scholar]
- Ouaddi, H.; Baranowski, S.; Idir, N. High frequency modelling of power transformer: Application to railway substation in scale model. Prz. Elektrotechniczny 2010, 86, 165–169. [Google Scholar]
- Yang, Q.; Chen, Y.; Sima, W.; Zhao, H. Measurement and analysis of transient overvoltage distribution in transformer windings based on reduced-scale model. Electr. Power Syst. Res. 2016, 140, 70–77. [Google Scholar] [CrossRef]
- Lee, J.; Bagheri, B.; Kao, H.-A. A Cyber-Physical Systems architecture for Industry 4.0-based manufacturing systems. Manuf. Lett. 2015, 3, 18–23. [Google Scholar] [CrossRef]
- Ghosh, N.; Ayer, B.; Sharma, R. Technology Integrated Inclusive Learning Spaces for Industry 4.0 Adaptive Learners-LUR Model for Sustainable Competency Development. ECS Trans. 2022, 107, 13823. [Google Scholar] [CrossRef]
- Chai, T.; Liu, Q.; Ding, J.; Lu, S.; Song, Y.; Zhang, Y. Perspectives on industrial-internet-driven intelligent optimized manufacturing mode for process industries. Sci. Sin. Technol. 2022, 52, 14–25. [Google Scholar] [CrossRef]
- Hao, Z.; Liu, G.; Zhang, H. Correlation filter-based visual tracking via adaptive weighted CNN features fusion. IET Image Process. 2018, 12, 1423–1431. [Google Scholar] [CrossRef]
- Dong, X.; Qian, L.; Huang, L. Short-term load forecasting in smart grid: A combined CNN and K-Means clustering approach. In Proceedings of the IEEE International Conference on Big Data and Smart Computing, Jeju, Republic of Korea, 13–16 February 2017; IEEE: Piscataway, NJ, USA, 2017; pp. 119–125. [Google Scholar]
- Wang, Y.; Chen, Q.; Gan, D.; Yang, J.; Kirschen, D.S.; Kang, C. Deep learning-based socio-demographic information identification from smart meter data. IEEE Trans. Smart Grid 2019, 10, 2593–2602. [Google Scholar] [CrossRef]
- Bahdanau, D.; Cho, K.; Bengio, Y. Neural Machine Translation by Jointly Learning to Align and Translate. In Proceedings of the International Conference on Learning Representations, Banff, AB, Canada, 14–16 April 2014. [Google Scholar]
- Yin, W.; Schütze, H.; Xiang, B.; Zhou, B. ABCNN: Attention-Based Convolutional Neural Network for Modeling Sentence Pairs. Trans. Assoc. Comput. Linguist. 2016, 4, 259–272. [Google Scholar] [CrossRef]
- Jabbar, F.I.; Soomro, D.; Tawafan, A.H.; Abdullah, M.N.; Radzi, N.H.; Baloch, M.H. Optimization of detection of a single line to ground fault based on ABCNN algorithm. IAES Int. J. Artif. Intell. (IJ-AI) 2020, 9, 623–629. [Google Scholar] [CrossRef]
- Wang, L. A Lightweight Convolutional Neural Network Based on Group-Wise Hybrid Attention for Remote Sensing Scene Classification. Remote Sens. 2021, 14, 161. [Google Scholar]
- Krizhezsky, A.; Sutskeve, I.; Hinton, G.E. ImageNet classification with deep convolutional neural networks. Adv. Neural Inf. Process. Syst. 2012, 25, 1097–1105. [Google Scholar]
- LeCun, Y.; Boser, B.; Denker, J.S.; Henderson, D.; Howard, R.E.; Hubbard, W.; Jackel, L.D. Back propagation applied to hand written zip code recognition. Neural Comput. 1989, 4, 541–551. [Google Scholar] [CrossRef]
- Zhou, F.Y.; Jin, L.P.; Dong, J. Review of convolutional neural network. Chin. J. Comput. 2017, 40, 1229–1251. [Google Scholar]
- Qu, Z.L.; Hu, X.F. Research on convolutional neural network based on improved activation function. Comput. Technol. Dev. 2017, 27, 77–80. [Google Scholar]
- Liu, W.J.; Liang, X.J.; Qu, H.C. Learning performance of convolutional neural networks with different pooling models. J. Image Graph. 2016, 21, 1178–1190. [Google Scholar]
- Abedinia, O.; Amjady, N.; Zareipour, H. A new feature selection technique for load and price forecast of electrical power systems. IEEE Trans. Power Syst. 2017, 32, 62–74. [Google Scholar] [CrossRef]
- Ruan, D.; Wang, J.; Yan, J.; Gühmann, C. CNN parameter design based on fault signal analysis and its application in bearing fault diagnosis. Adv. Eng. Inform. 2023, 55, 101877. [Google Scholar] [CrossRef]
- Kingma, D.; Ba, J. ADAM: A method for stochastic optimization. In Proceedings of the International Conference on Learning Representations, San Diego, CA, USA, 7–9 May 2015. [Google Scholar]
- Junninen, H.; Niska, H.; Tuppurainen, K.; Ruuskanen, J.; Kolehmainen, M. Methods for imputation of missing values in air quality data sets. Atmos. Environ. 2004, 38, 2895–2907. [Google Scholar] [CrossRef]
Disclaimer/Publisher’s Note: The statements, opinions and data contained in all publications are solely those of the individual author(s) and contributor(s) and not of MDPI and/or the editor(s). MDPI and/or the editor(s) disclaim responsibility for any injury to people or property resulting from any ideas, methods, instructions or products referred to in the content. |
© 2023 by the authors. Licensee MDPI, Basel, Switzerland. This article is an open access article distributed under the terms and conditions of the Creative Commons Attribution (CC BY) license (https://creativecommons.org/licenses/by/4.0/).