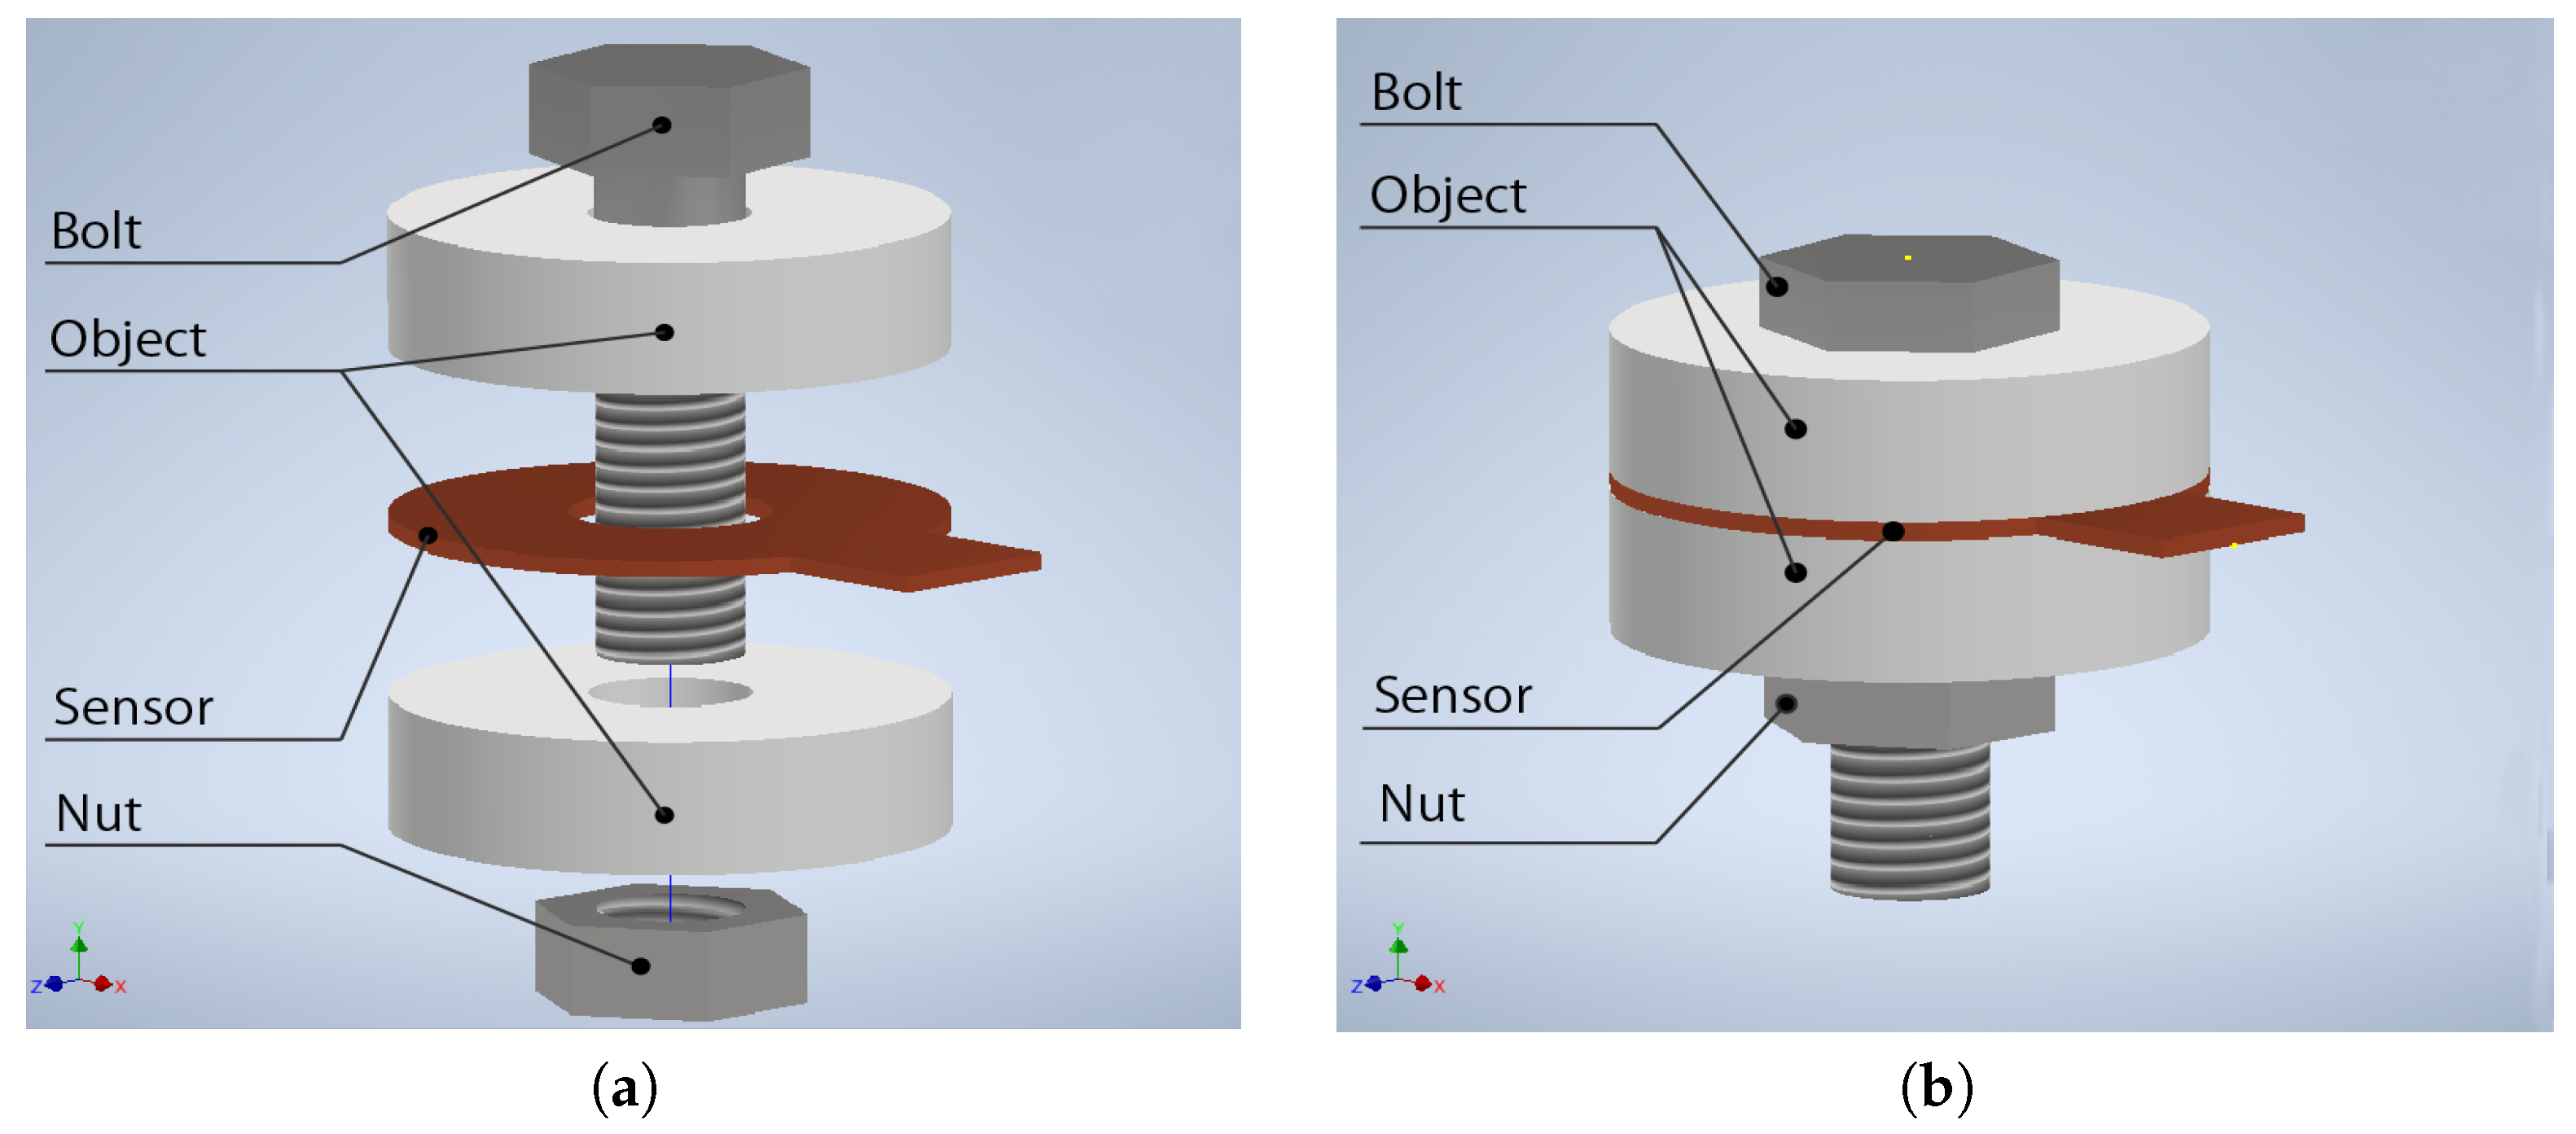
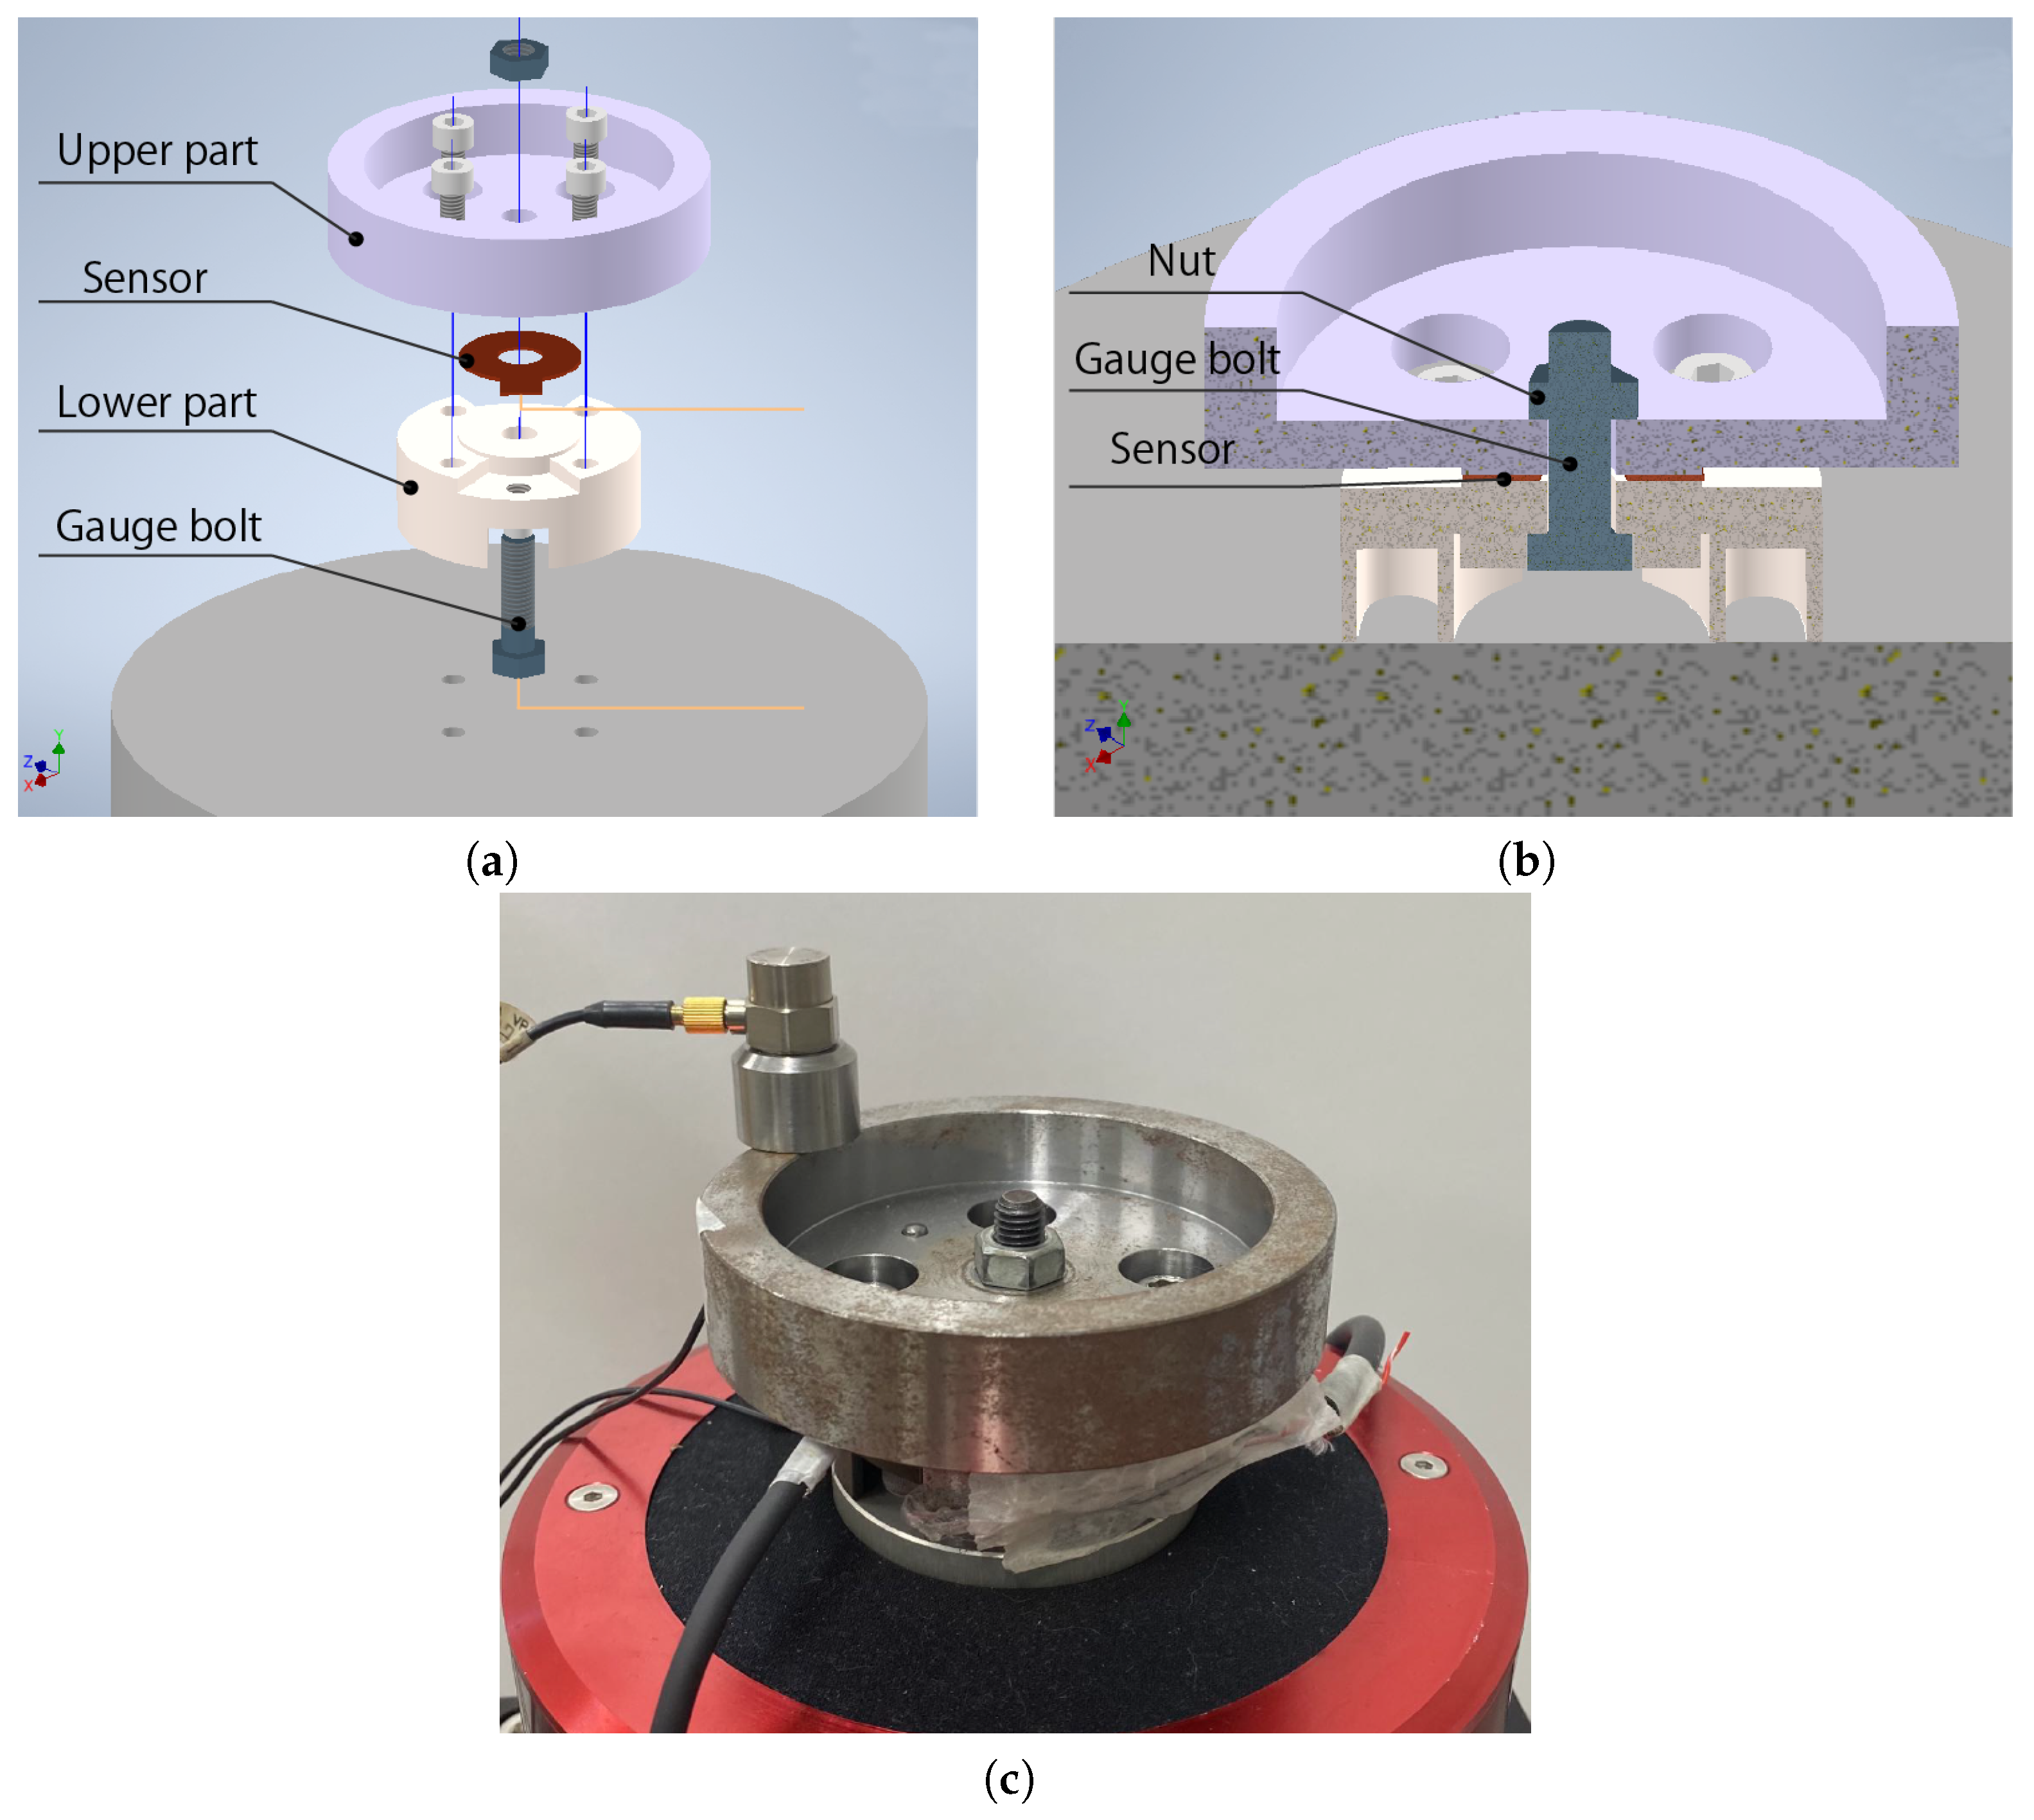
4.1. Experimental Results and Triboelectric Modeling Study
The results of the vibration tests, repeated six times, are plotted in
Figure 4, where the absolute values of the 35 Hz component of the sensor output are plotted in
Figure 4a against the axial force of the bolt, while the phase delays with respect to the excitation acceleration are shown in
Figure 4b. Note that the sensor output was defined as the voltage of the upper triboelectric layer (PET) relative to the lower layer (PI) and normalized by the value for the maximum fastening condition to eliminate the difference in the variation in the voltage level among the trials.
From
Figure 4, one can find that the test results have enough repeatability in terms of the relative ratio with respect to the maximum fastening condition when the fastening force is over 500 N. Below 200 N, the amplitude of the sensor output rapidly increases with larger deviation as the fastening force reduces. The reason for this deviation may be the difficulty of controlling the initial contact condition under the loosest bolt fastening force. Contrary to our prior expectation that the amplitude of the sensor output would monotonically increase with the decrease in the fastening force, it exhibits an unexpected “valley” around 300 N accompanied by a phase reversal of almost 180 degrees.
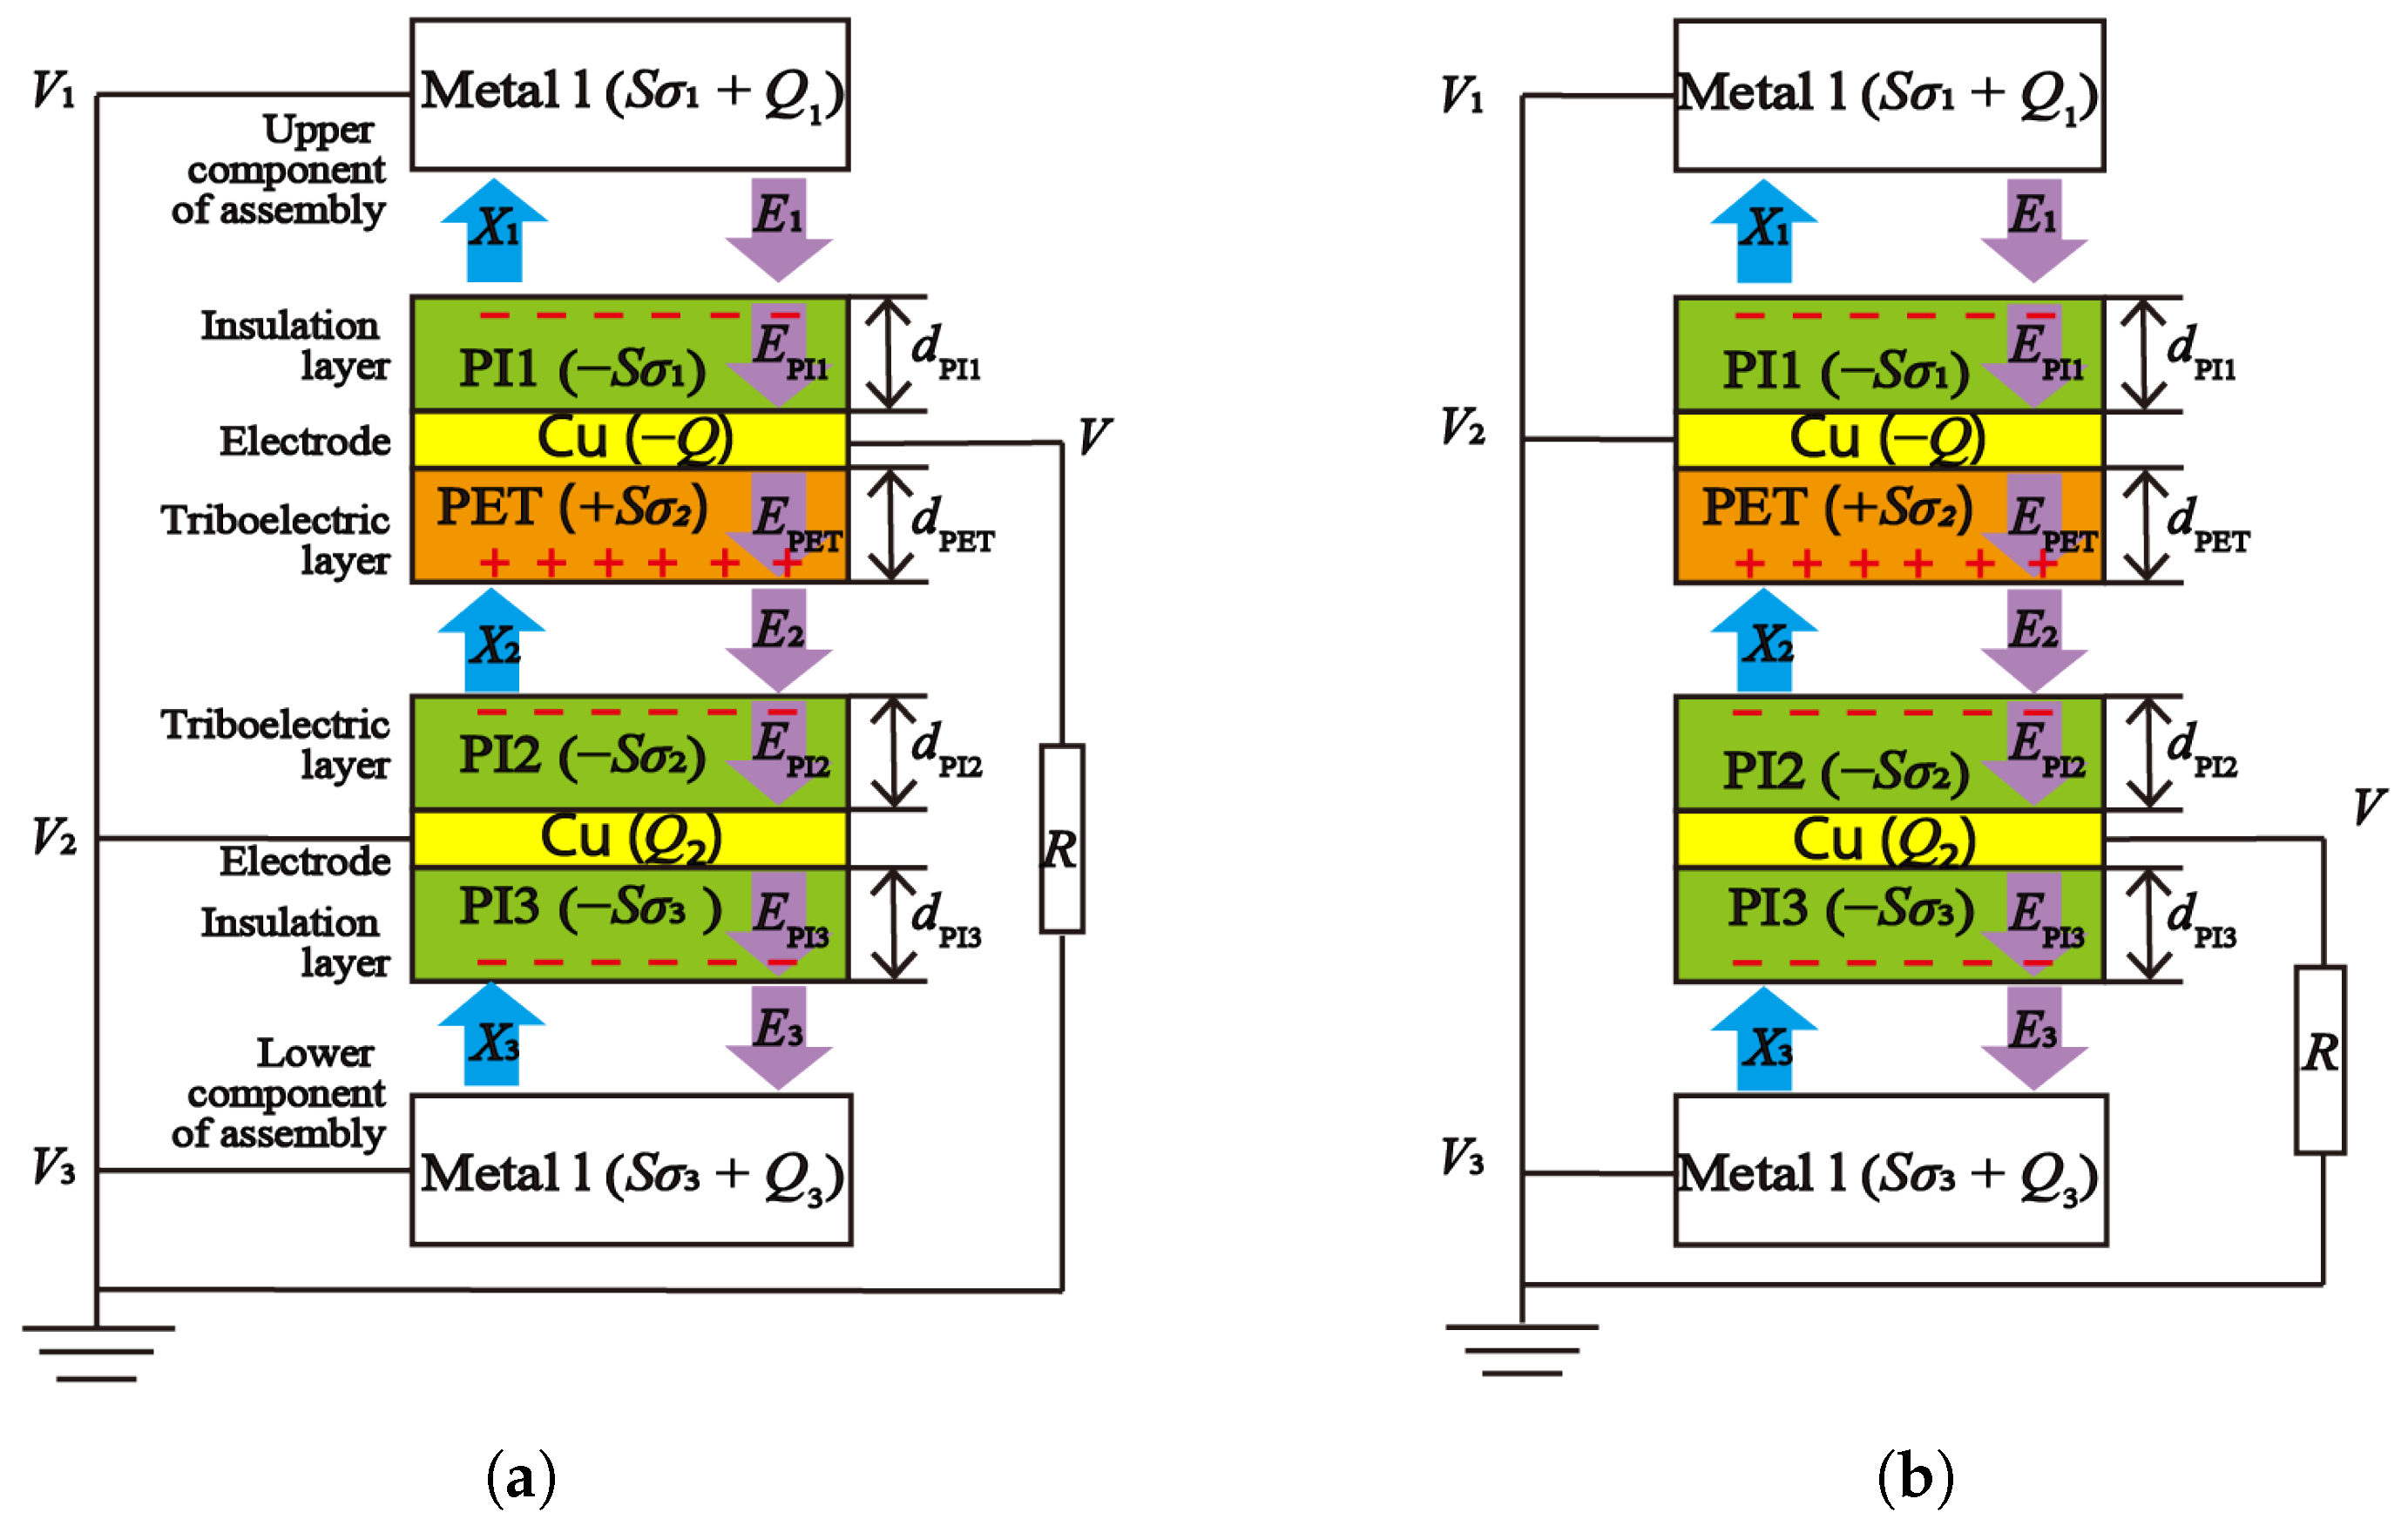
In order to understand the reason for this amplitude dropping phenomenon, and the reason why the phase delay has changed from 100 degrees to approximately −80 degrees, mathematical modeling of the experiments in terms of the triboelectric aspect was conducted. The model is schematically shown in
Figure 5a. The white rectangles are the upper and lower components of the assembly, and the layer of the colored rectangles is the sensor. Unlike the standard model of triboelectric devices, our model takes account of the effect of the contact between the upper insulation layer and the upper component of the assembly made of steel (PI1 and Metal1) and the contact between the lower insulation layer and the lower component (PI3 and Metal2), in addition to the contact between the triboelectric layers (PET and PI2). Considering the wiring described in
Section 3.2, the electric boundary conditions are set as depicted in the figure, and the measurement apparatus (data recorder) is modeled as an input resistance
R.
As shown in
Figure 5a, the triboelectric charge density at the contact between the triboelectric layers (PET and PI2) is assumed to be
, where PET is positively charged, while PI2 is negative. Similarly,
and
are assumed for the triboelectric charge density between Metal1 and PI1, and between PI3 and Metal2, respectively. Note that, for this metal–polymer contact, the metal layers are supposed to be positively charged. Also, air gaps between every contacted layer should be considered because the sensor is simply sandwiched between the fastened objects. The axial displacements of each air gap are assumed to be
,
, and
, as indicated in the figure.
Then, assuming the electric fields inside the air gaps and the triboelectric layers are all uniform, they are formulated, respectively, from Gauss’s theorem as
where
S denotes the area of the electrode,
,
, and
are the permittivity of vacuum, the relative permittivity of PET and PI, respectively; furthermore,
Q,
,
, and
are the induced charges in the metal entities (electrodes and tightened objects) via the external circuit, which should satisfy Kirchhoff’s law as
The voltages of the electrodes are represented by the electric fields as
where
,
,
,
are the thickness of PI1, PI2, PET, and PI3 layers, respectively. Moreover, the electric boundary conditions are given by
The relationship between
V and
Q can be obtained by eliminating all other voltage and charge variables from Equations (
1) to (
12) as
The charge
Q in the above equation is derived by solving a differential equation, obtained by eliminating
V from Equations (
13) and (
14) as
Considering that
and
are the distance of the air gaps vibrating in phase, the second and third terms in the right-hand side of Equation (
15), which perform as the excitation terms in this differential equation, vary antiphase because they have opposite signs. This means that if the relationship between the magnitude of those terms inverses across a certain fastening condition, it would make the resulting voltage have a valley in the amplitude and a jump in the phase, as observed in
Figure 4b.
If the above hypothesis for the reason behind the valley phenomenon in
Figure 4a is true, it should disappear if the signs of the second and third terms in the right-hand side of Equation (
15) are the same. This is possible by reversing the order of the lamination of the triboelectric layers, or just swapping the lead wires to the measurement apparatus, as depicted in
Figure 5b. In this case, the relationship between
V and
Q is derived as
This time, the signs of the second and third terms of the right-hand side become the same as expected, which should allow the sensor voltage to be pulled more negatively by aligning the polarity of the triboelectric effects at the polymer–polymer contact and the polymer–metal contact.
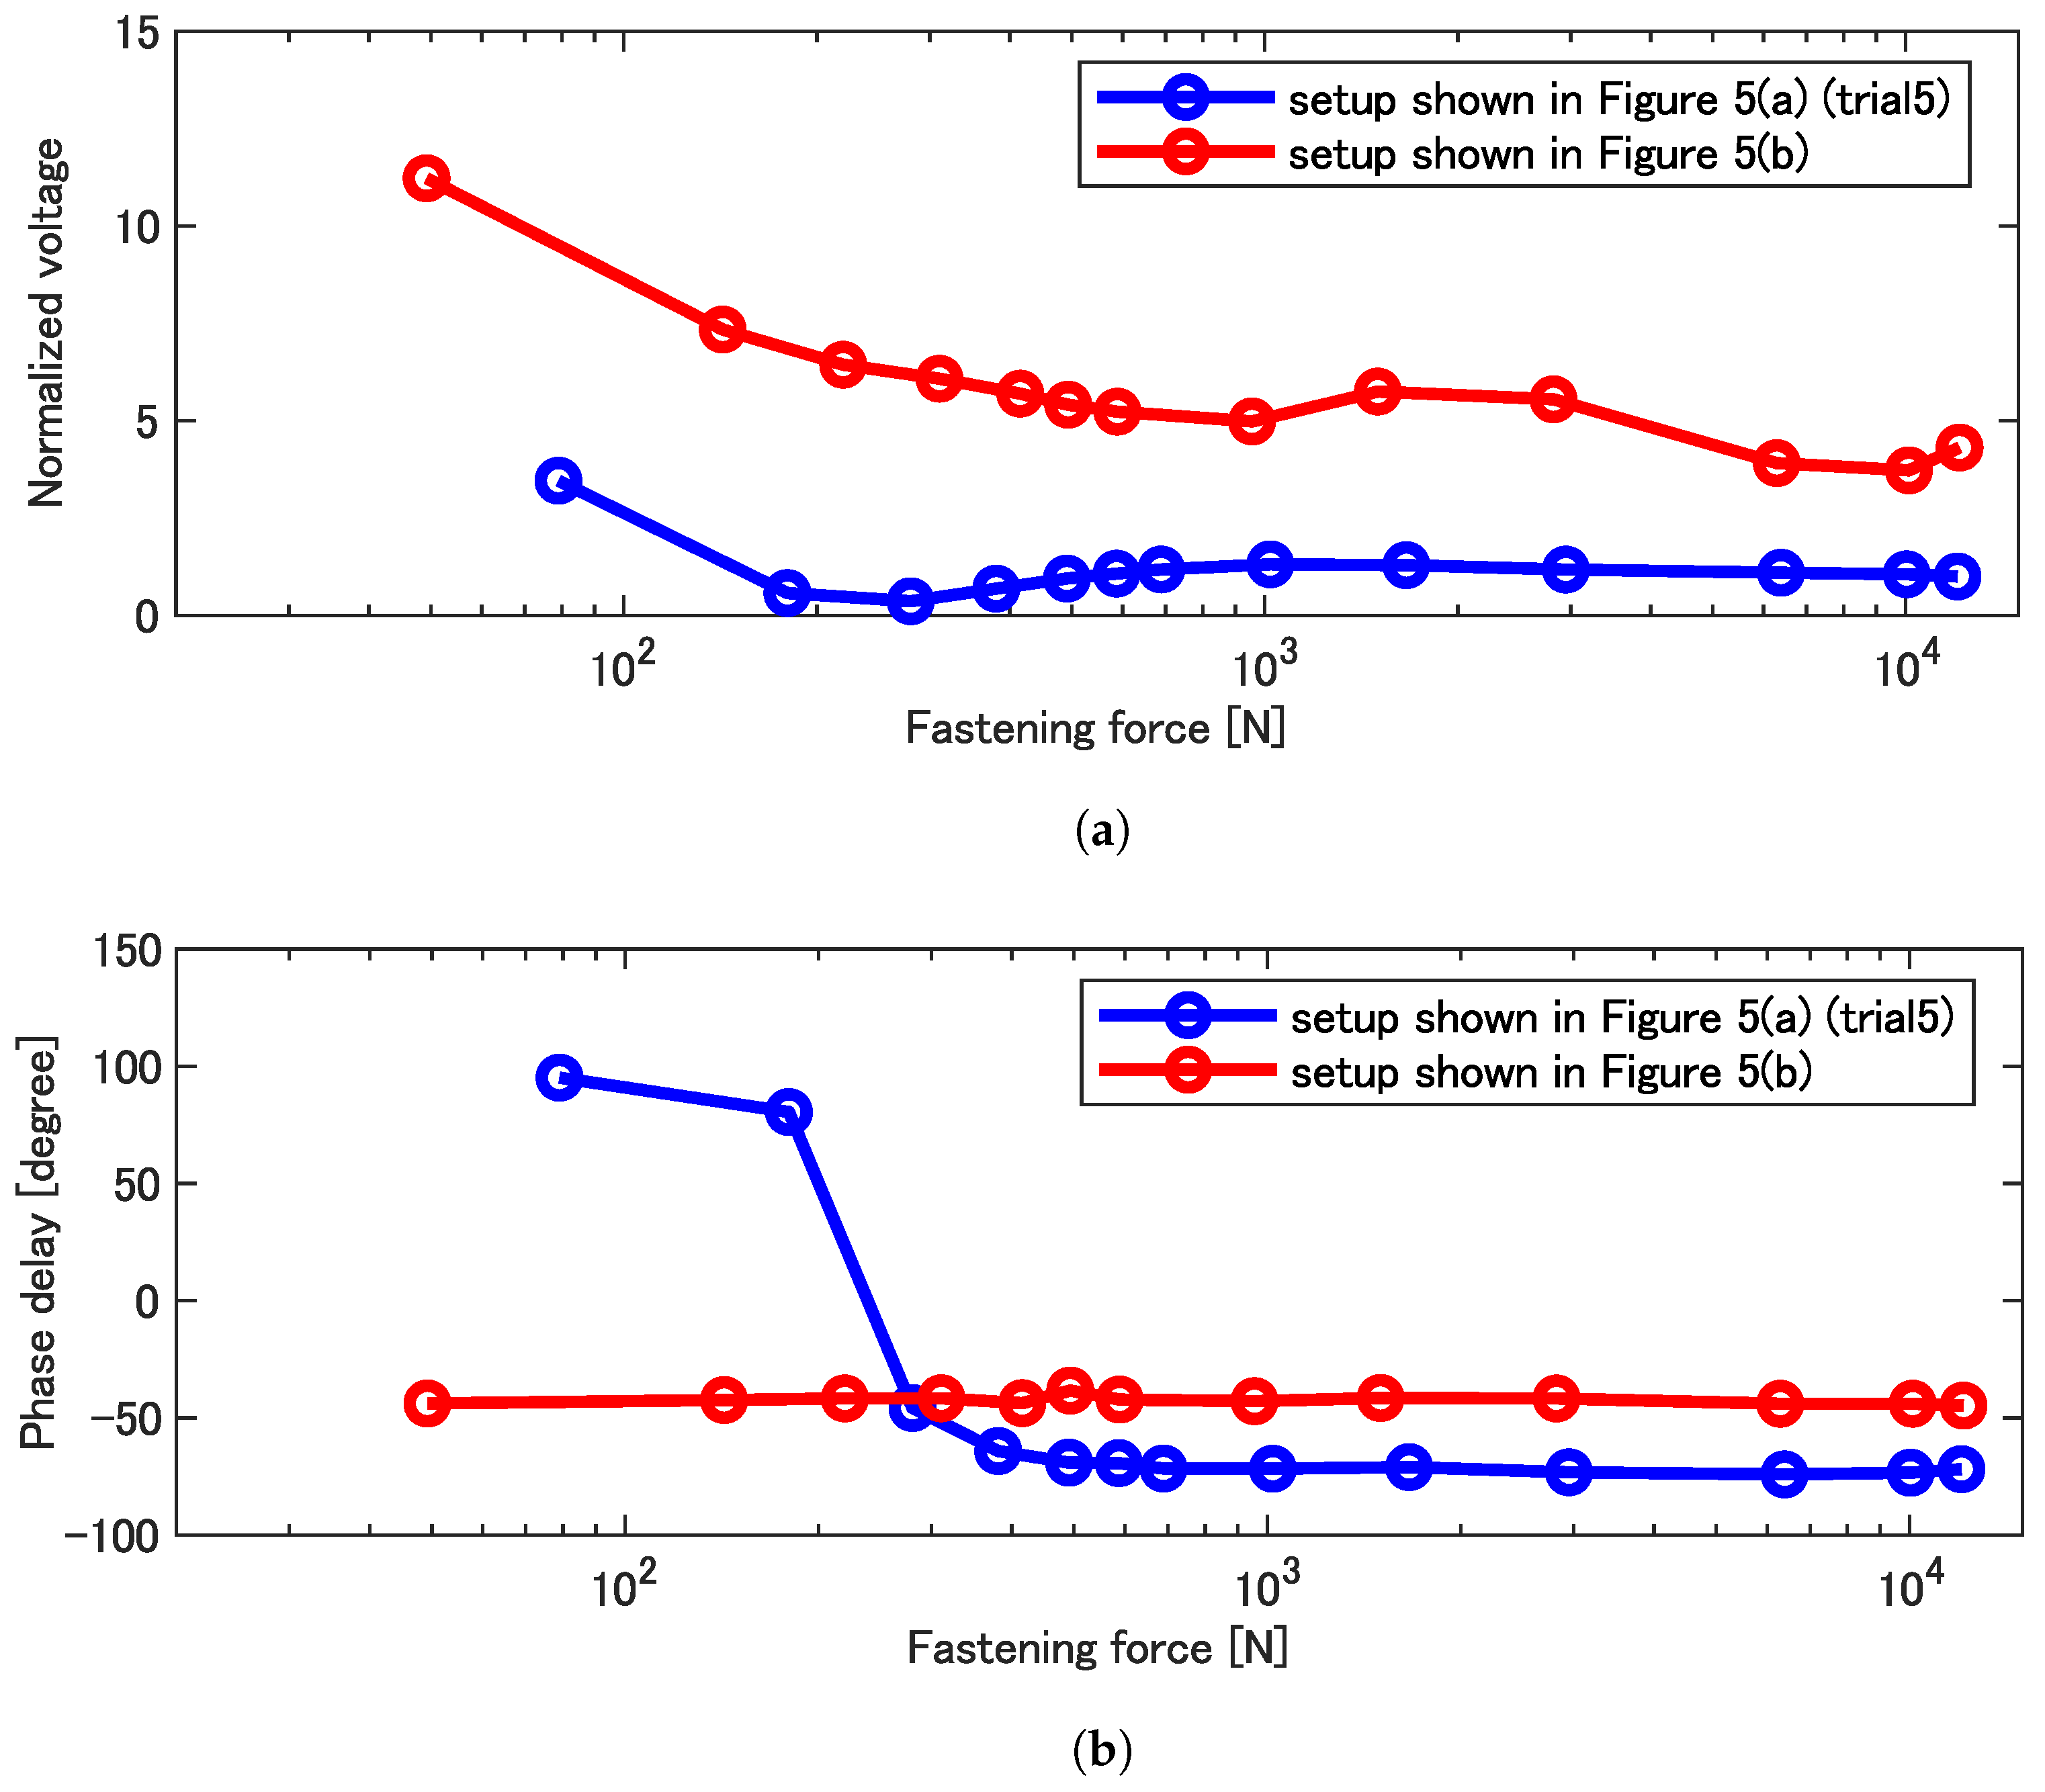
Figure 6 shows the amplitude and phase delay of the sensor output for the setup shown in
Figure 5b in red lines with the trial 1 data for the test using the setup shown in
Figure 5a in blue lines. Note that the amplitude is normalized by the value for the maximum fastening condition of trial 1 data for the configuration in
Figure 5a for ease of comparison. From the figure, one can find that the sensor output keeps the same phase delay throughout the experiment, not showing the valley in the amplitude and the jump in the phase as expected.
4.2. Modeling of Deformation of Bolt and Fastened Objects Considering Contact Mechanics
In order to gain a better understanding of the relationship between the fastening force and sensor output, a model describing the dynamic variation in the air gaps at the contacting surfaces, involving the fastening mechanics of the bolted joint as well as the contact mechanics, is introduced and combined with the triboelectric model described in the previous section. The purpose of this modeling study is to establish a rational explanation for the experimental results of sensor output shown in
Figure 4 and
Figure 6 in terms of both the amplitude and phase delay.
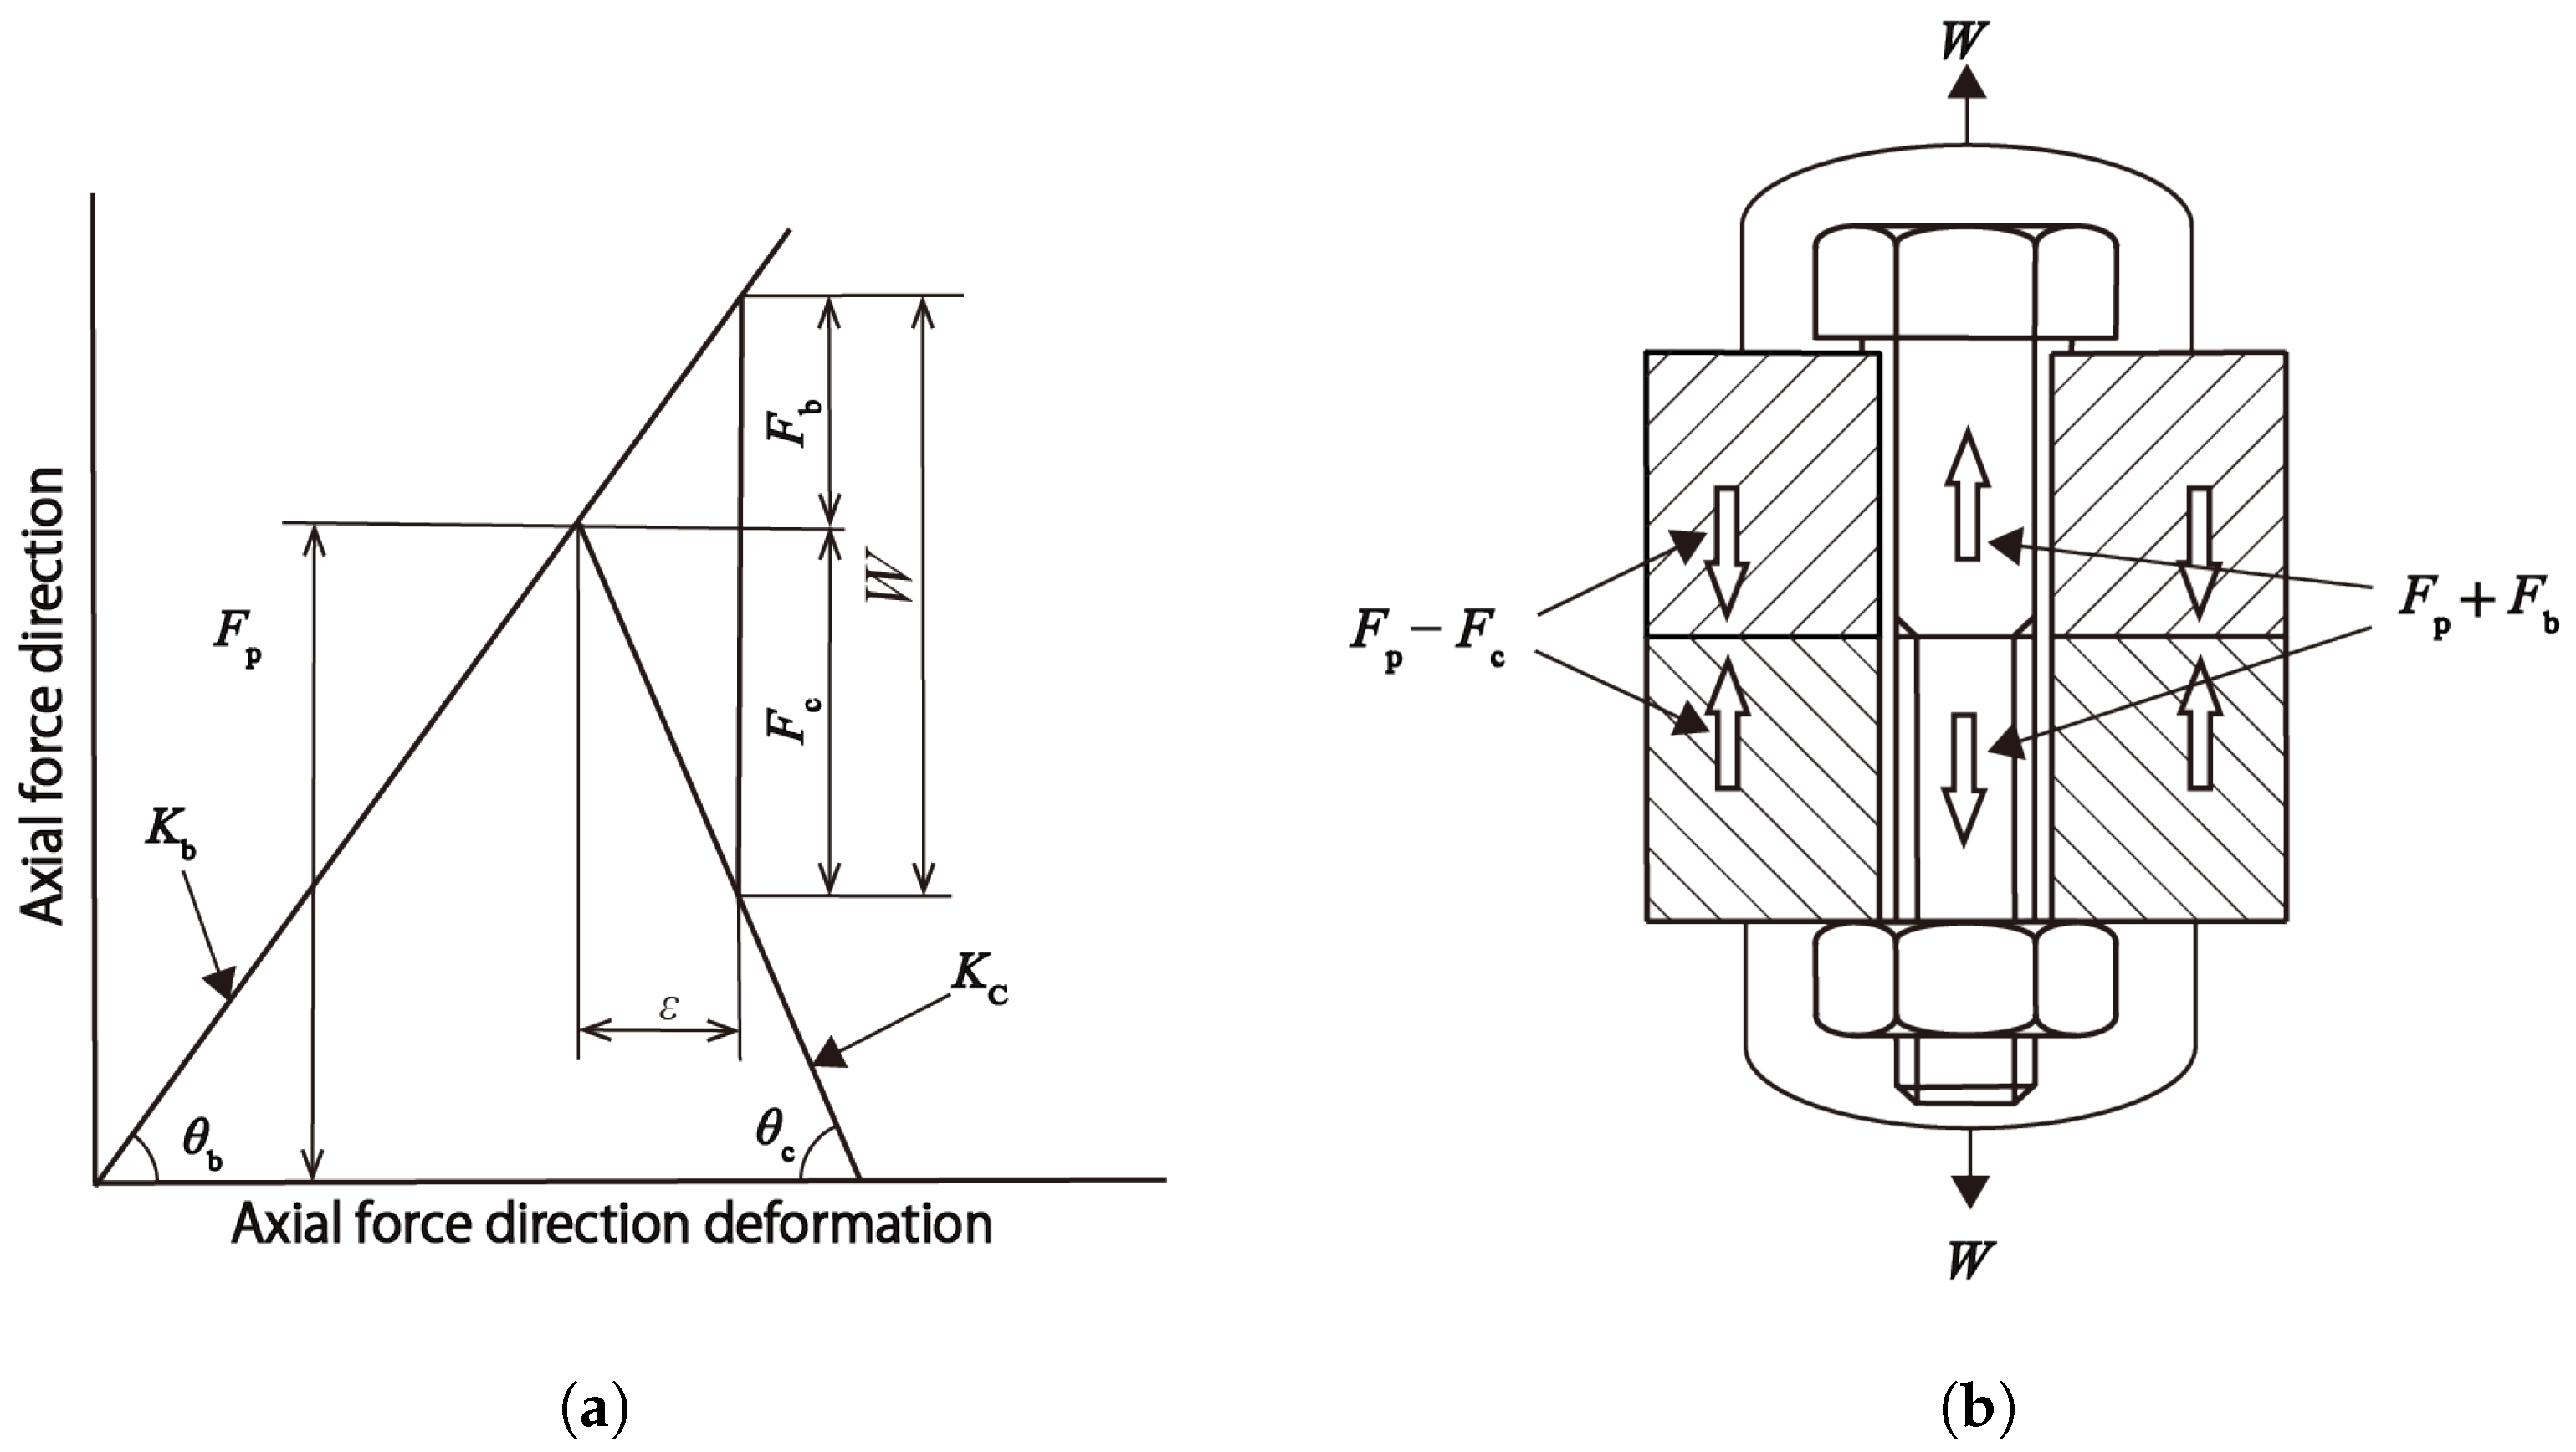
Let us first consider the forces and deflections in a bolted joint. When the bolt and nut are fastened, a tensile force (preload)
is generated in the bolt and a compressive force (fastening force)
of equal magnitude is generated between the fastened objects. This relationship is illustrated in
Figure 7a, usually called a joint diagram [
3], in which
is the spring constant of the bolt–nut system and
is the spring constant of the fastened objects.
When an axial tensile force
W is externally applied as depicted in
Figure 7b, the grip length
(the distance between the contact of the upper object with the bolt seat and the contact of the lower object with the nut seat) is supposed to be extended by
. As a consequence, a tensile internal force
is appended to the bolt, resulting in a tensile axial force
, and a compressive internal force
is removed from the fastened objects, resulting in a compressive force
. In other words, the tensile load acting on the fastened objects increases the axial force of the bolt, while decreasing the fastening force. The increase and decrease in these forces can be calculated from
Figure 7a as follows:
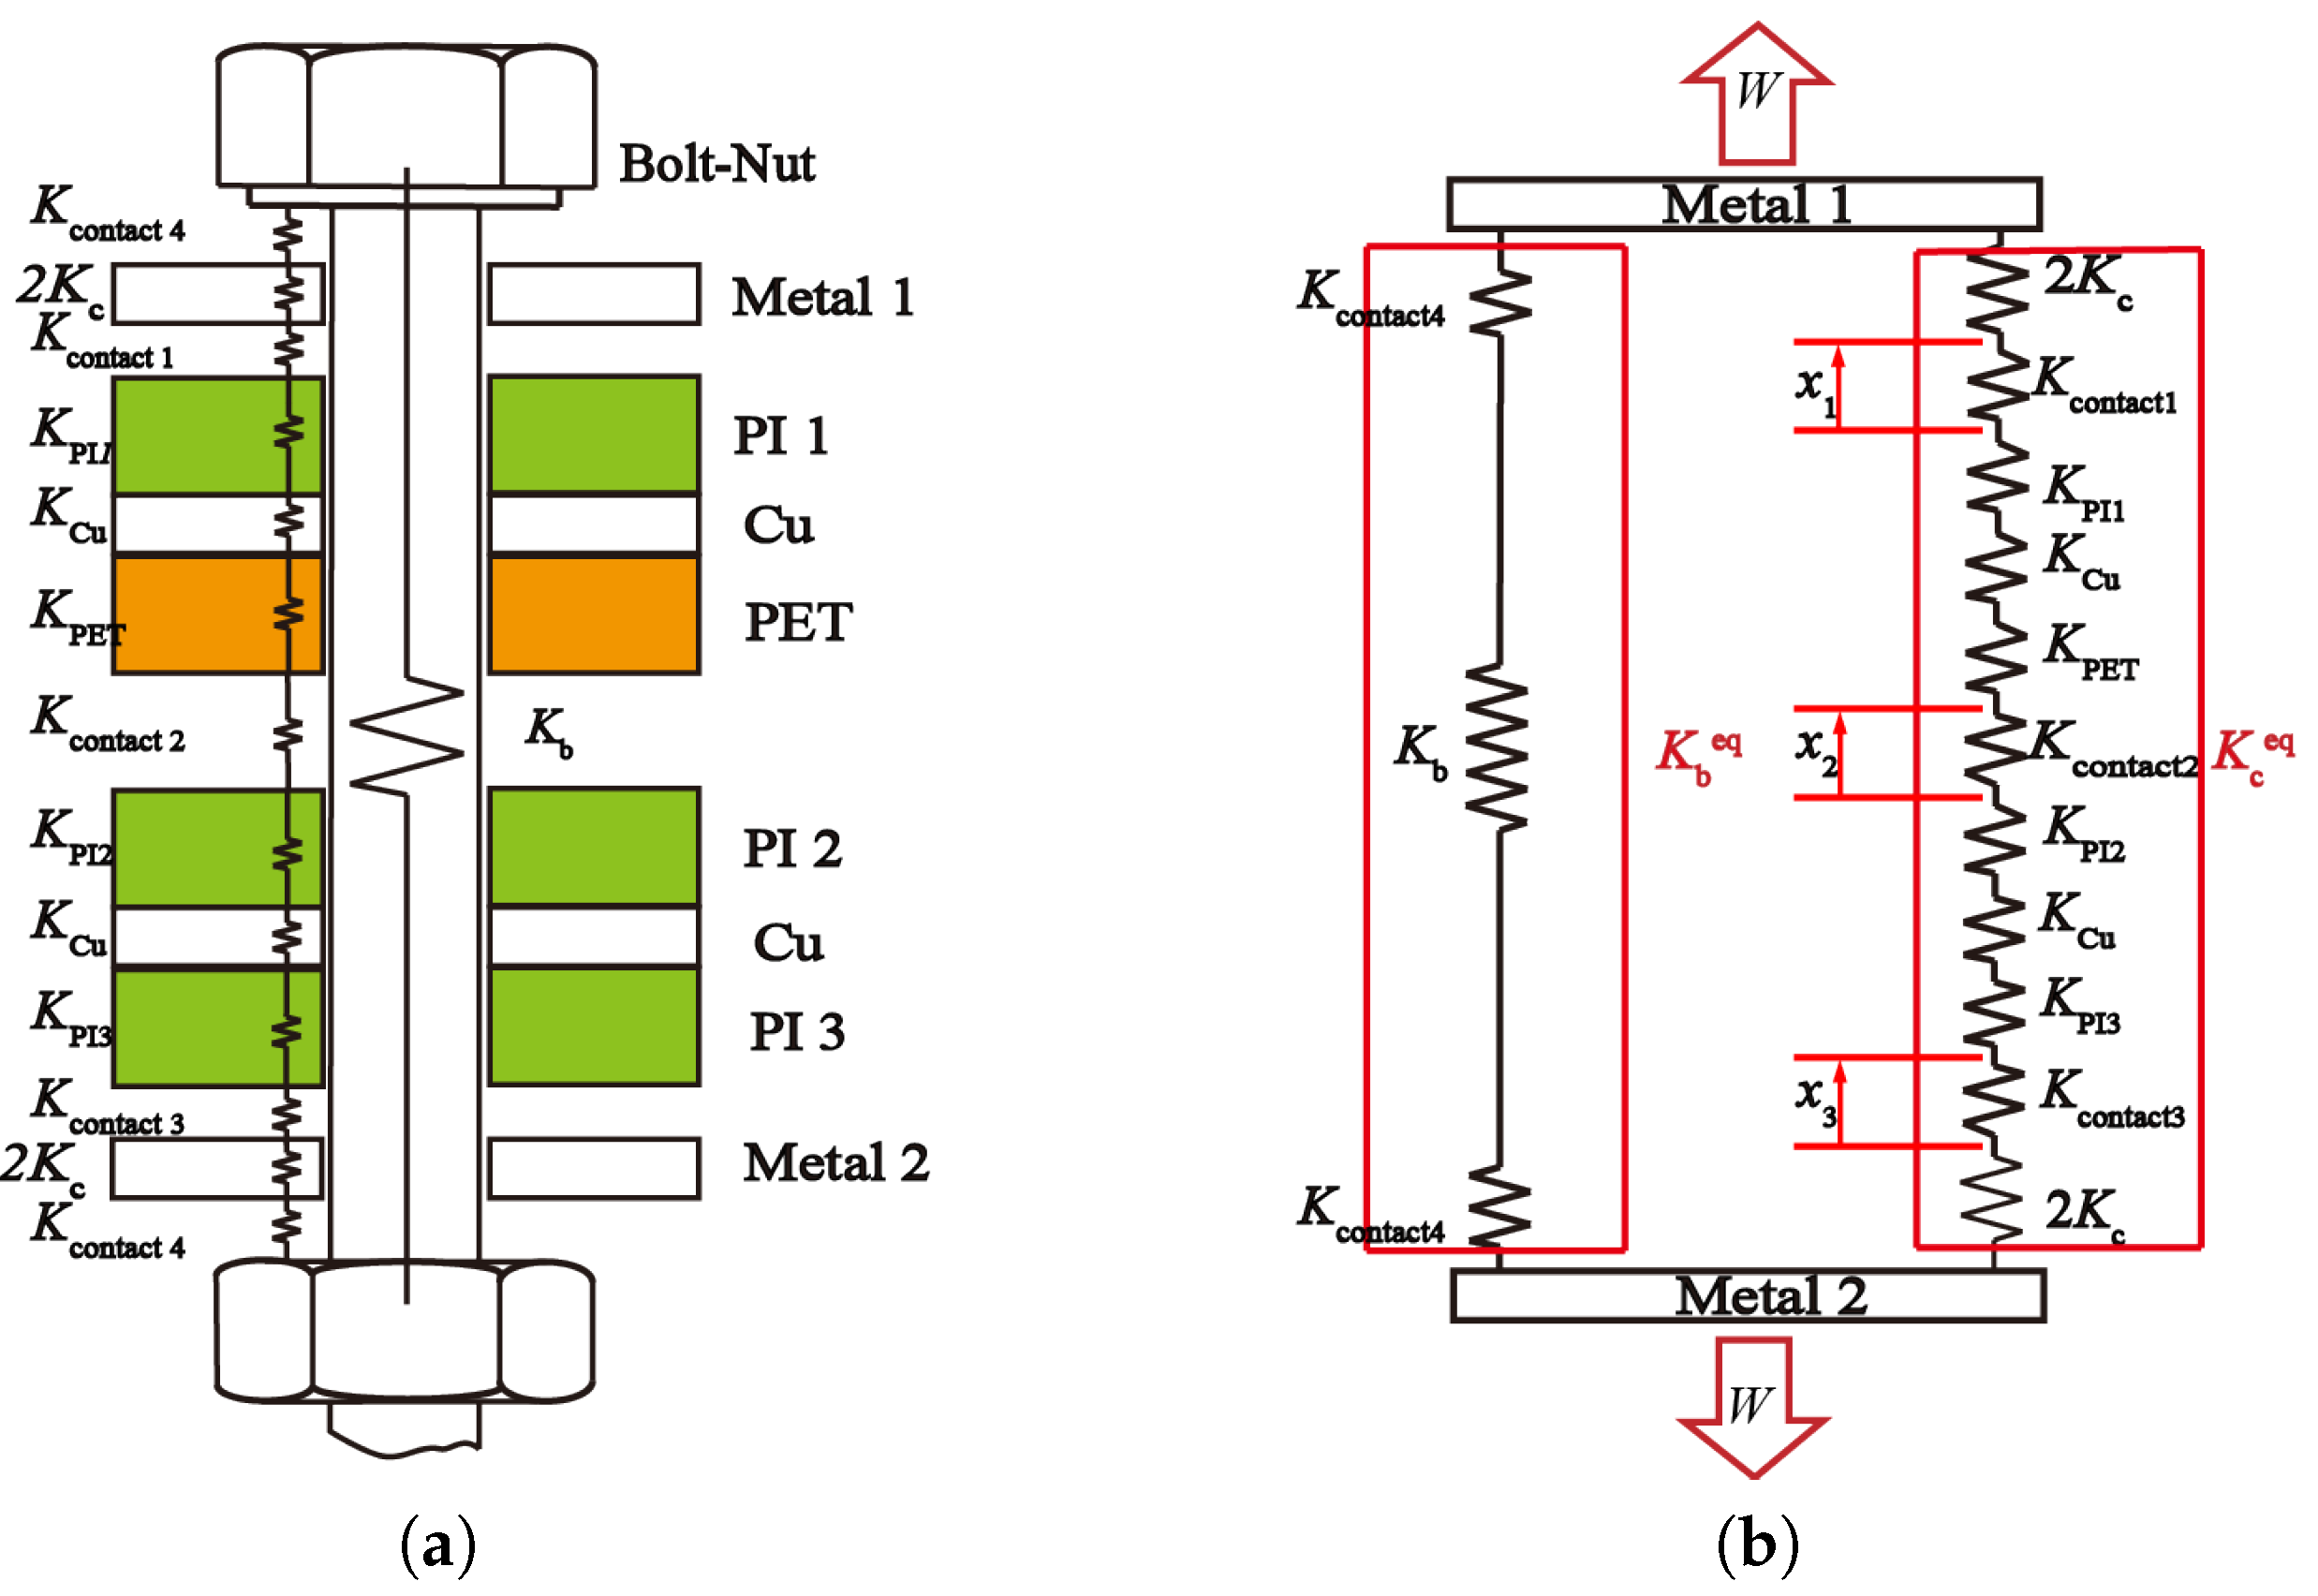
In ordinary models, the spring constants and are calculated just using appropriate formulae of the stiffness of the bolt and fastened objects, or using finite element models of them. In this study, however, we have to take account of the influence of the surface contact mechanics between the bolt sheet and the upper object, fastened objects and the sensor, triboelectric layers inside the sensor, and nut sheet and the lower object to explain the reduction in the stiffness due to the bolt loosening. Therefore, those spring constants and should be replaced by equivalent spring constants and considering the stiffness of the sensor layer and a contact stiffness between the contacting surfaces as well.
Figure 8a shows a model of the bolted joint with the proposed sensor, in which a contact stiffness denoted by
is introduced between each contacting surface, and
,
, and
are the spring constants of PI, PET, and the copper electrode, respectively. Note that the contact stiffness between the bolt sheet (or nut sheet) and the fastened object is involved in
, and the others in
, because the external load is applied on the fastened objects (labeled as Metal1 and Metal2), as depicted in
Figure 8b. Then, the equivalent spring constants are calculated as series composite spring constants of these trains of spring elements as
The stiffness of the bolt is given by [
26]
whereas the stiffness of the fastened objects is calculated by VDI 2230 (1986) [
27] as
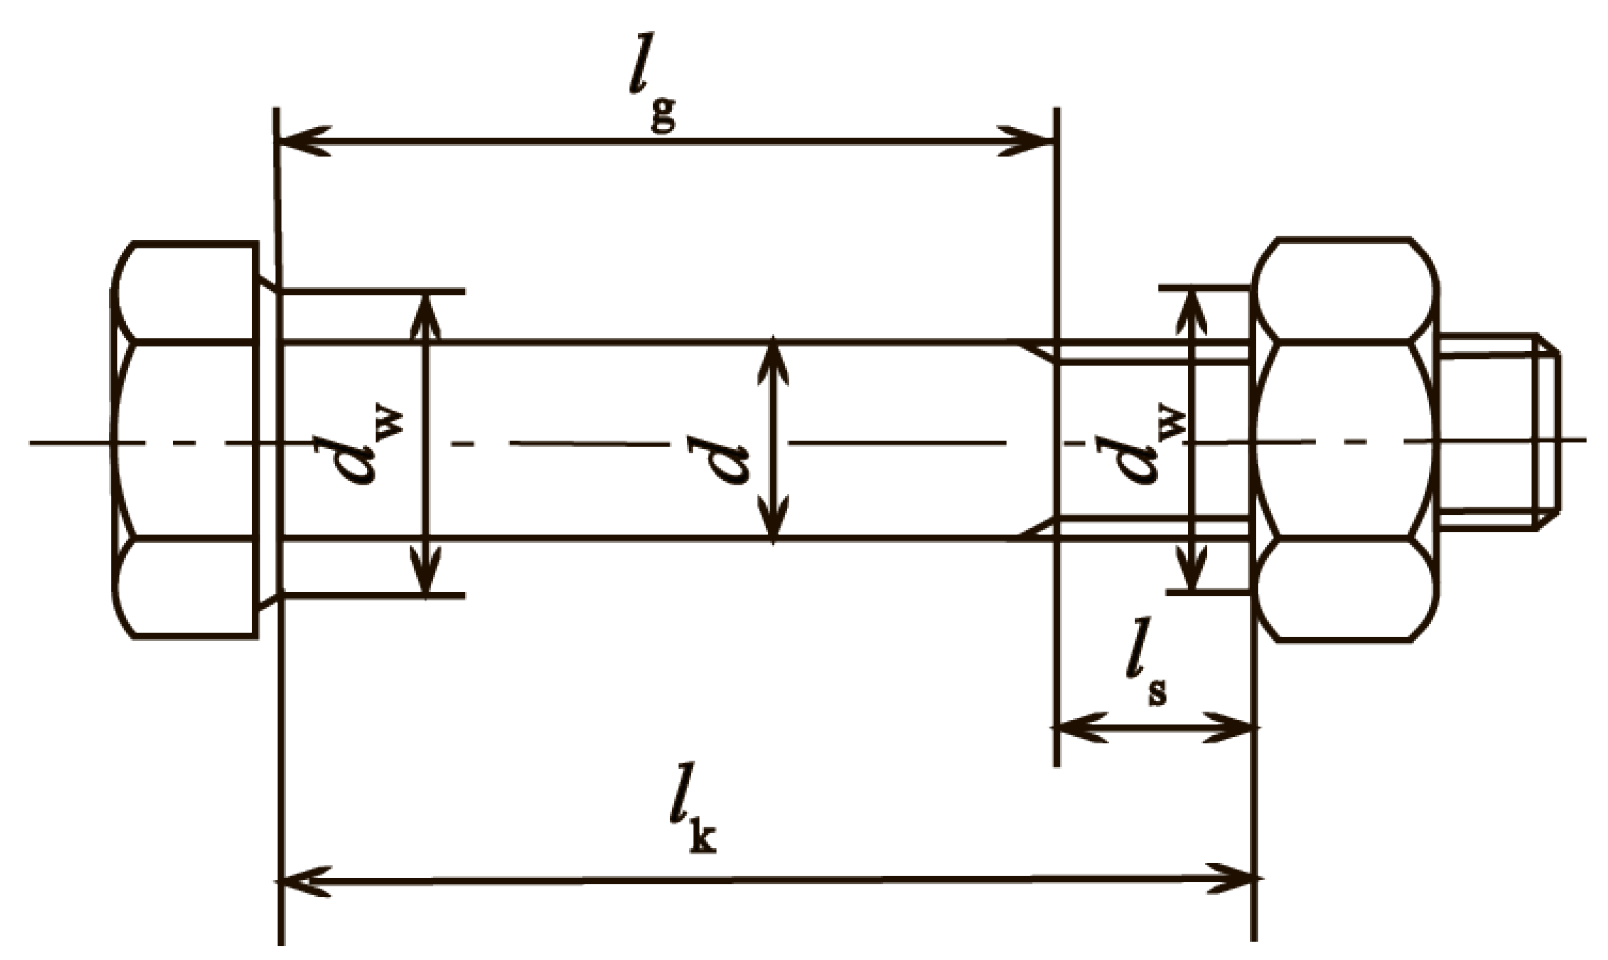
where
d,
,
,
, and
are the dimensions of the bolts, which are defined in
Figure 9, while
,
,
, and
denote the diameter of the bolt hole, effective cross-sectional area of the bolt, Young’s modulus of the bolt, and Young’s modulus of the fastened objects, respectively. All the values of those parameters used in the calculations are listed in
Table 2.
In the field of contact mechanics, much research has been carried out on the contact of rough surfaces under both elastic and plastic deformation conditions [
28,
29,
30,
31], including Hertzian elastic contact theory [
32,
33], Greenwood and Williamson’s model [
34], Bush, Gibson, and Thomas [
35], and O’Callaghan and Cameron’s model [
36]. Greenwood and Williamson’s model is a widely recognized and influential model in the field of contact mechanics. The model aims to understand the nature of contact between rough surfaces and provides insights into the dependency between the real area of contact, separation, and applied load, in terms of the surface topology, particularly the distribution of the heights of the surface asperities within the contact region.
According to the analysis by Greenwood and Williamson [
34], the relationship between the load
P on the contacting surfaces and the separation
d in the case of rough plane contact assuming a specific distribution of the heights of the surface asperities is
where
,
, and
are the surface density of asperities, nominal contact area, and radius of asperity summits, respectively; further,
,
, where
,
, and
,
, are the Poisson’s ratio, Young’s modulus, and standard deviations of the height distributions of the asperities on surfaces in contact, respectively. And
where
is the standardized probability density function of the height distribution of the asperities scaled to make its standard deviation unity. Differentiating Equation (
24) with respect to
, the contact stiffness is derived as follows:
where
is the first derivative of
, and the last equality is derived by applying Equation (
24).
From this model, the contact stiffness is found to be proportional to the magnitude of the compressive load on the contact surface if the height distribution is exponential, because
is equal to
in this case. Greenwood and Williamson [
34] clarified that the area of contact and number of contact spots are also proportional to the load. Furthermore, it was stated that those for the real height distribution, which tends to be Gaussian rather than exponential, can be fairly approximated by the formula for the exponential distribution as long as the real contact area stays small compared with the nominal area [
34,
37].
When the external force
W, i.e., the inertial force
in our experiment where
m,
, and
are the mass of the upper object, acceleration amplitude, and excitation angular frequency, respectively, is applied to the upper and lower ends of the model as indicated in
Figure 8b, the variation in the axial separation between the contacting layers, denoted by
,
, and
, is calculated as follows:
As described in Equation (
26) and the following paragraph, the contact stiffness is nearly proportional to the applied compressive load, which is the fastening force in our experiment. Therefore, as the bolt loosens, the contact stiffness
at each contact interface decreases with the decrease in the fastening force, resulting in the decrease in
and
as well. In consequence, the variation in the separation of the contact interface due to the external force increases.
In order to evaluate the actual values of the contact stiffness according to Equation (
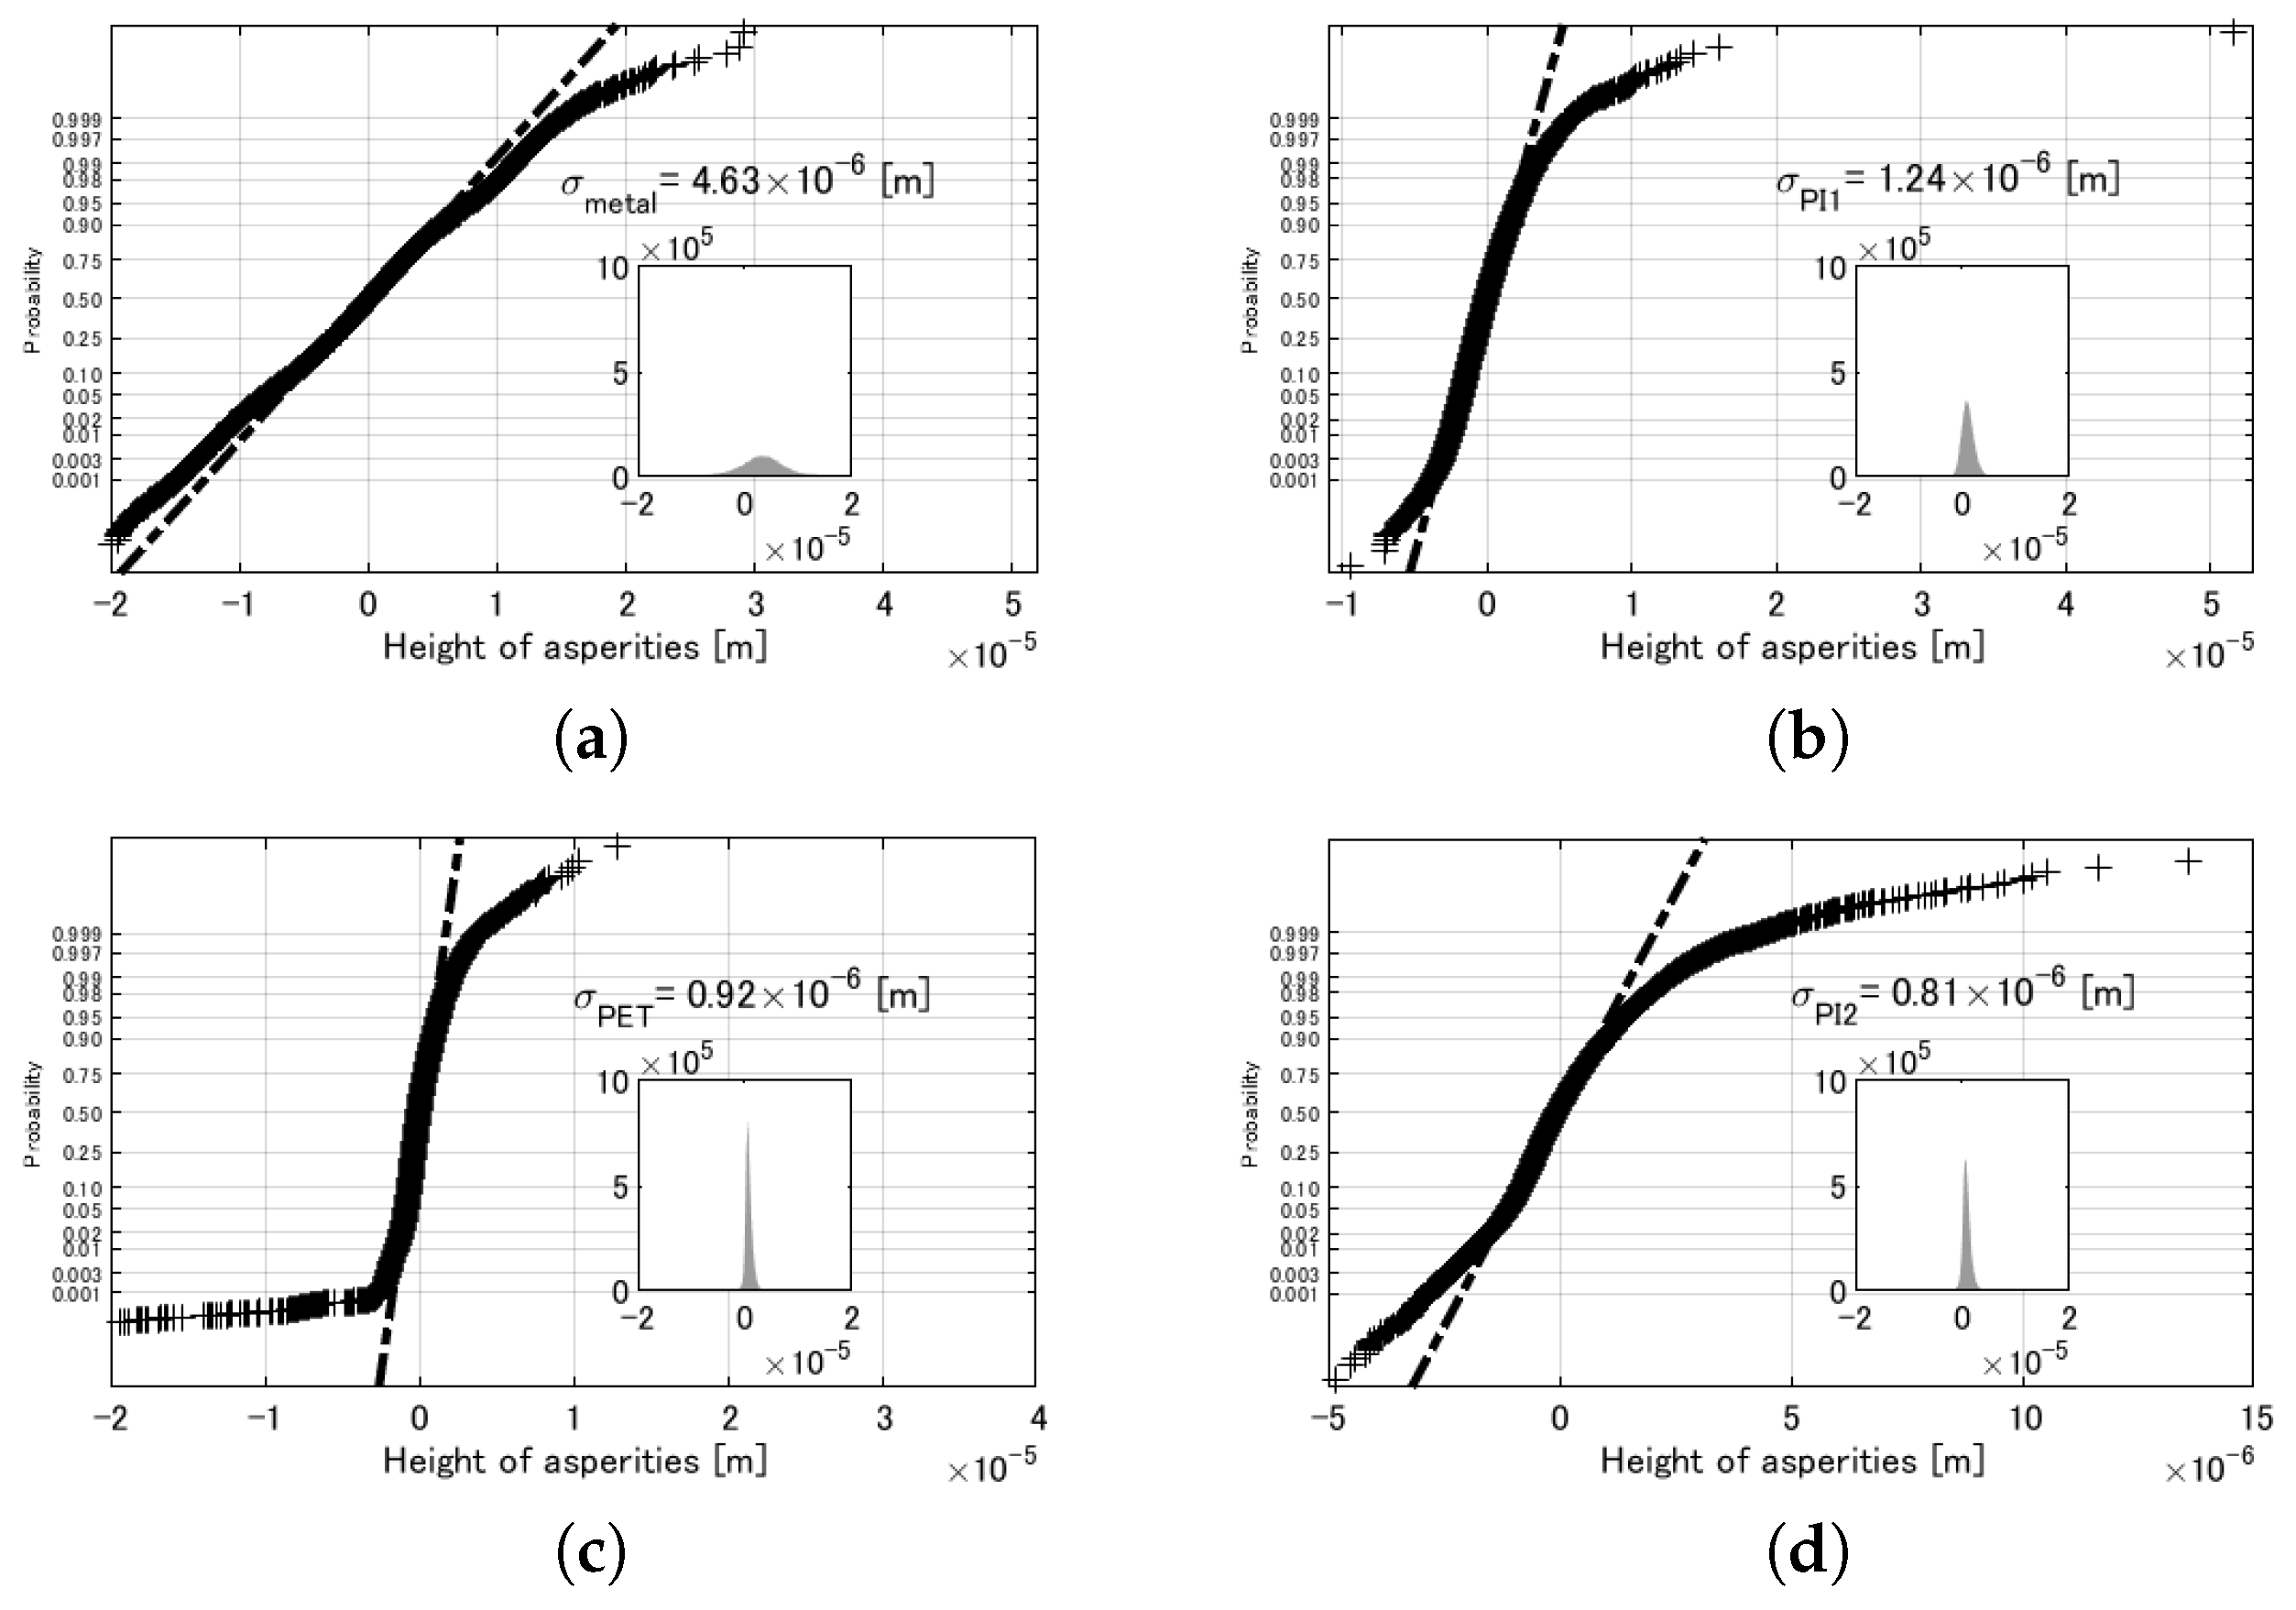
26), the distribution of the heights of the asperities on each surface of the contacting materials was investigated. We measured the two-dimensional profile of each contacting surface with a laser microscope at three specific locations, and extracted the heights of the local summits from those profiles.
Figure 10 shows the normal probability plot of the extracted heights for each surface, displayed with their histogram. From the plots, it was found that the main body of the right part of the distribution is fairly approximated by a Gaussian distribution except for the long right tail, which may contain measurement noise and outliers. Thus, we adopted the standardized normal density as
in Equation (
25) and calculated the stiffness of each contact interface by numerically evaluating Equations (
25) and (
26).
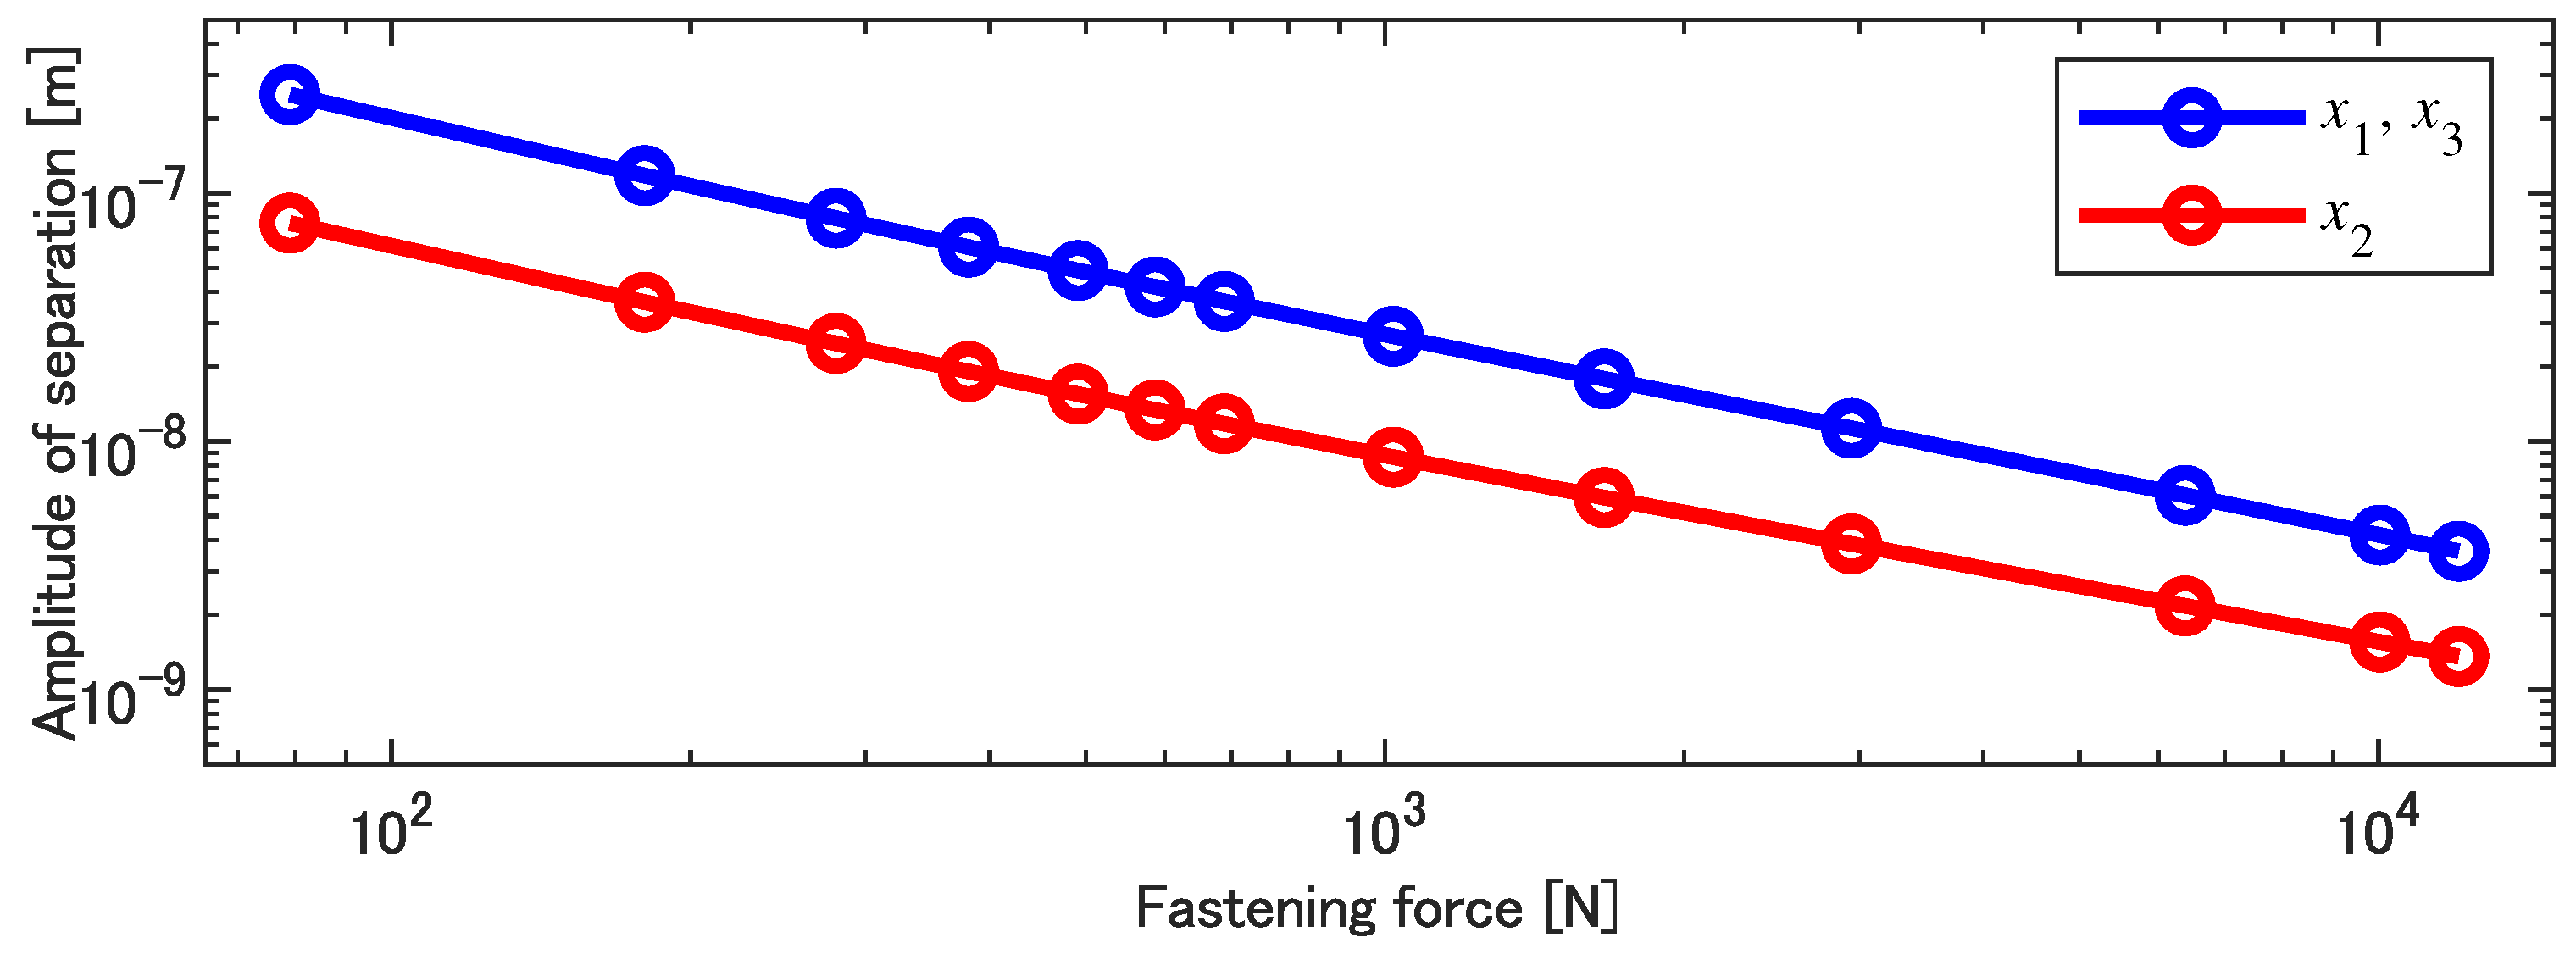
Figure 11 shows the results of the calculation of the amplitude of the variation in the contact separation by Equations (
27)–(
29). Note that the contact stiffness
and
are assumed to be the same because both are the contact between the same Metal and PI, and thus are the calculated amplitudes of
and
. As presented in the figure, it is found that the contact separation amplitudes are almost inversely proportional to the fastening force, and they are on the order of
m at most for the Metal–PI contact and
m at most for the PET–PI contact within the experimental conditions.
4.3. Model Validation via Evaluation of Triboelectric Charge Density
Since the value of the contact separation amplitude is negligibly small, as shown in
Figure 11, compared with the thickness of the polymer layer in the sensor, which is on the order of
m, Equation (
15) can be reduced to an equation of a first-order lag system as
where
Similarly, Equation (
16) is reduced to
because
.
Now assuming a steady-state response, the voltage amplitude is derived as
for the experimental setup shown in
Figure 5a, while
for the setup shown in
Figure 5b, assuming
, where the values with hat denote the complex amplitude.
Equations (
35) and (
36) provide a cogent explanation of the experimental results from the following two perspectives. First, the argument of the common part of the above two equations,
, explains the phase delay of the measured voltage from the excitation acceleration. For the given values of
R and
A, the value of the argument is calculated as 83°. This means that the phase delay of the voltage from the separation variation is −83° if the sign inside the parentheses in the right-hand side of those equations is positive, and 97° when it is negative. Furthermore, assuming that the natural frequency of the experimental setup is sufficiently higher than the excitation frequency, the phase delay of the separation variation from the excitation acceleration should be nearly 180°. In conclusion, the phase delay of the voltage from the excitation acceleration should be 97° when the sign inside the parentheses in the right-hand side of Equation (
35) (or Equation (
36)) is positive, and −83° if it is negative.
For the experimental results, it is found from
Figure 4b that the phase delay from the excitation acceleration for the circuit configuration shown in
Figure 5a was around 100° for the fastening force less than 200 N, and around −80° for the fastening force greater than 300 N. These findings are consistent with the above theoretical values and suggest that the magnitude of the first term in the parentheses in Equation (
35) is greater than the second term at high fastening forces, while it is smaller at low fastening forces. Moreover, the experimental results shown in
Figure 6b indicate that the phase delay for the circuit configuration shown in
Figure 5b took a nearly constant value around −45°. Although the value was slightly different from the theoretical value, possibly due to thinning of the polymer layers after the repeated tests, the fact that the observed phase delay showed a negative constant value is consistent with the theoretical findings.
Next, as the values of
R,
A,
B, and
C are known, and
,
, and
are calculated as shown in
Figure 11, the values of
and
are the only unknown values in Equations (
35) and (
36), which can be estimated by fitting the equations to the experimental values shown in
Figure 6 for each fastening force. To do this, the values of the phase delay were idealized by being replaced by the theoretical values based on the above discussion, and combined with the experimental amplitude values. Moreover, because the experimental results from two different configurations shown in
Figure 6 had different values for the fastening force, the results of the swapped configuration (red points) were resampled by linear interpolation at the values of the fastening force of the initial configuration (blue points).
The results are plotted in
Figure 12, in which regression lines being described below are also drawn. The triboelectric charge density that fits the experimental results increases as the fastening force increases, varying from the order of
C/m
to
C/m
for the Metal–PI contact and from
C/m
to
C/m
for the PET–PI contact. These values are reasonable, as the charge density reported in the literature related to TENG varies in the same range [
8,
14,
15,
38]. A closer look at the dependence of the estimated charge density on the fastening force reveals that the triboelectric charge density at the contact between Metal and PI is almost proportional to the fastening force, showing a slight saturating tendency at high loads, whereas the charge density between PET and PI exhibits a different power law at low loads.
The increasing dependency of the estimated charge density on the fastening force can be explained by considering the real contact area at the interface. When the real charge density is
on the real contact area
, the nominal charge density
is given by
where
is the nominal contact area. Because the real contact area is in general an increasing function of the applied pressure, the increasing dependency on the charge density is understandable.
Moreover, in the elastic contact model of random rough surfaces adopted in this analysis (described in
Section 4.2), the real contact area is nearly proportional to the applied load on the interface [
34,
37]. The estimated charge density at the Metal–PI interface showing almost linear dependency, which was in fact the power of 0.77 according to the regression line shown in
Figure 12 with a solid line, is consistent with this model. On the other hand, the different dependency of the charge density at the PET–PI interface in low load conditions suggests the existence of different contact mechanics. To see this tendency, the estimated density was regressed by a bilinear curve, as shown in
Figure 12 with a dashed and dotted line, which was specified by first fitting a line to the first seven points, extending it to the abscissa of the eighth point, and then fitting another line starting from the end of the first line to the remaining six points. The resultant power law was 0.29 for low loads and 0.74 for high loads. A possible candidate for a model of the different dependency in low loads is a contact of elastic wavy surfaces, in which the real contact area has a dependence proportional to the 2/3 power of the contact load, as described in the literature [
37,
39,
40].
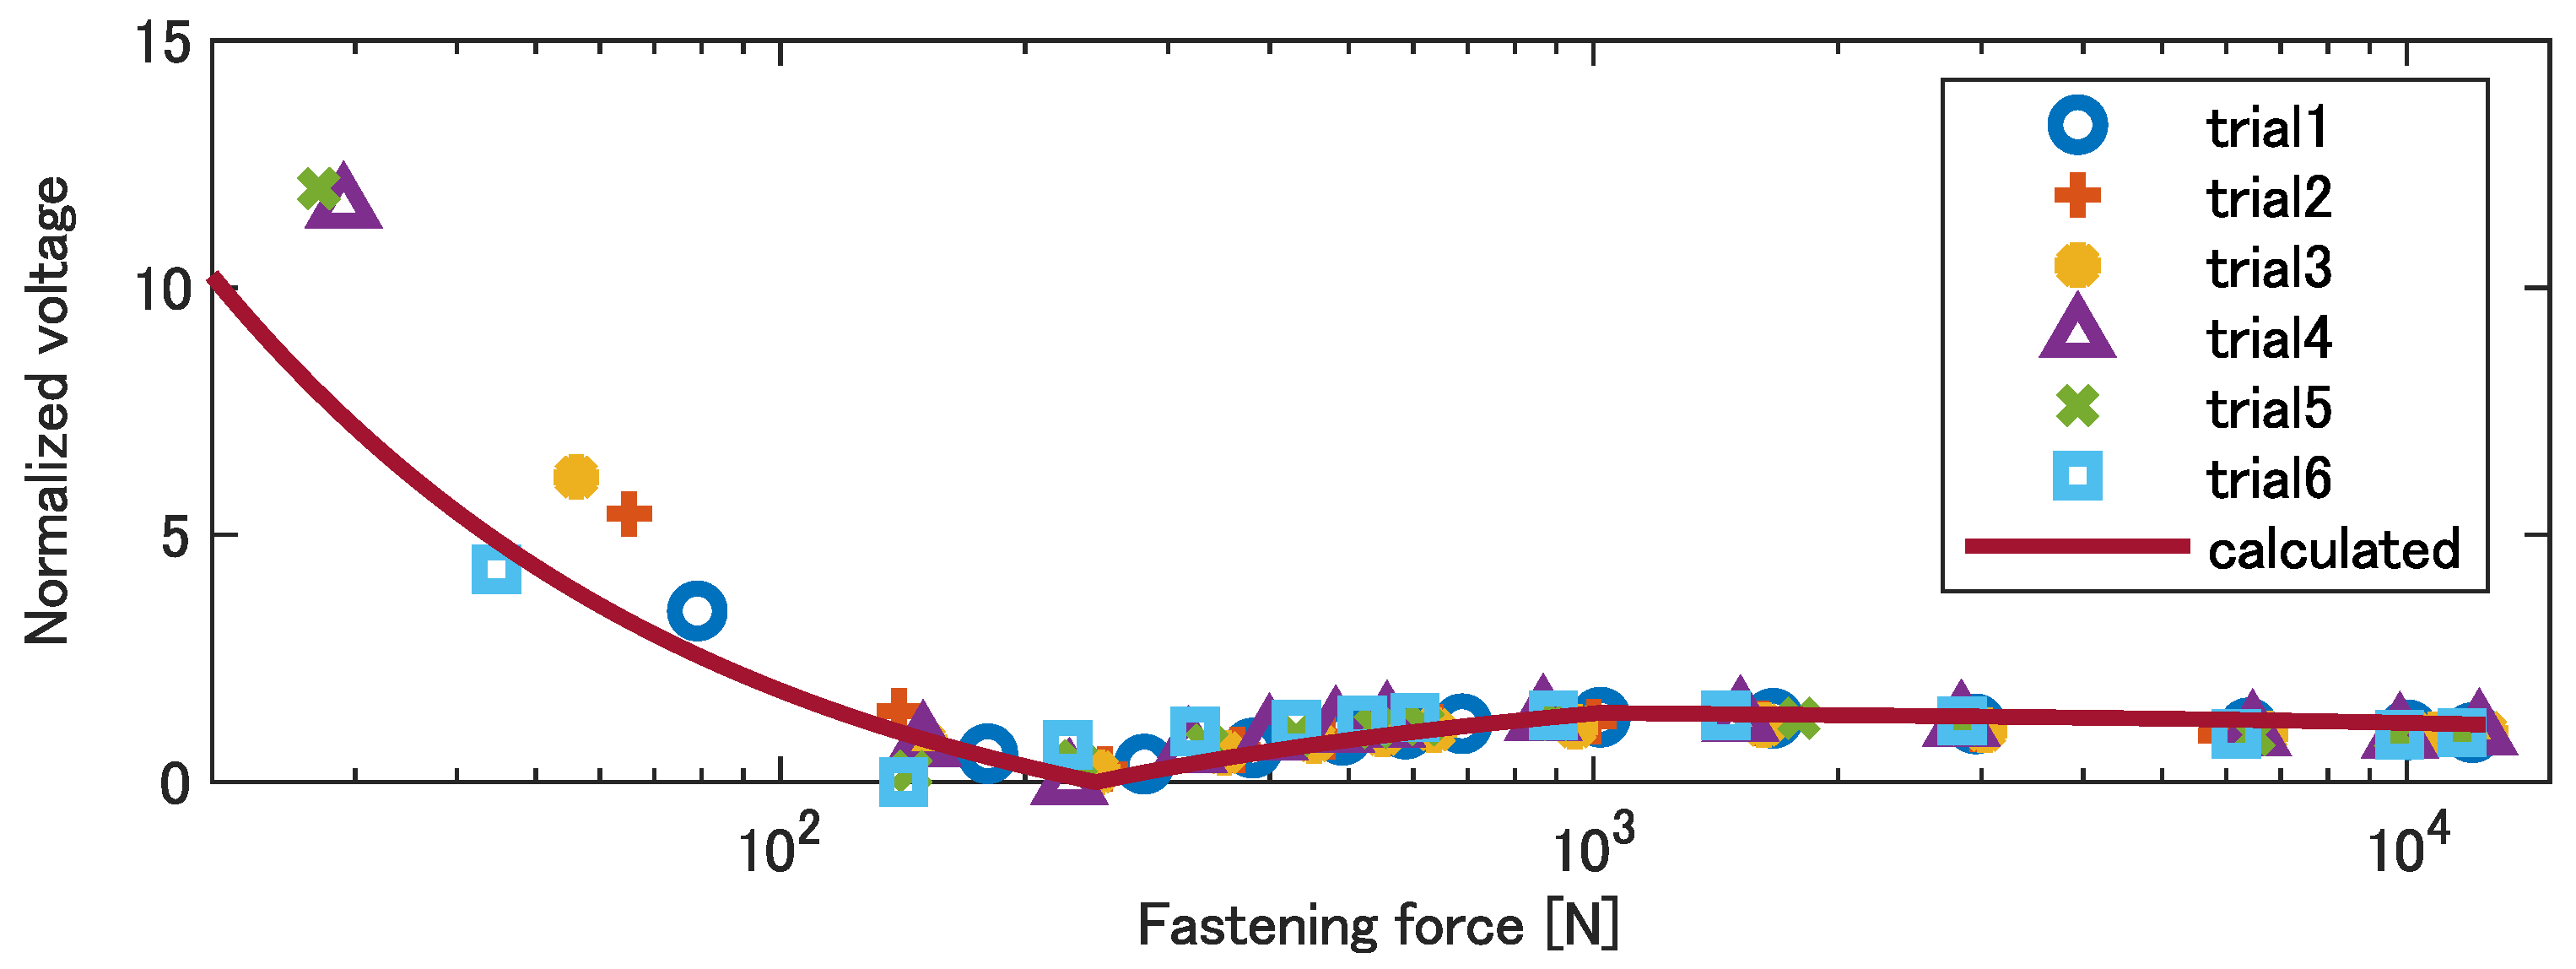
Finally, to verify that the mechanical–triboelectric model presented in this section, taking account of the tightening mechanics of the bolt and the contact mechanics of Metal–PI and PET–PI contacts, can appropriately explain the experimental results, the voltage amplitude of the sensor output for the initial configuration shown in
Figure 5a was calculated based on the regression curves indicated in
Figure 12. The result is shown in
Figure 13 with a solid line accompanied by all the experimental data plotted by markers. As presented in the figure, the model curve has a valley at a location close to the valleys that the experimental data exhibited and shows a good agreement with the experimental results in wide range of the fastening force, except for the lowest load conditions. The relatively large error at the low fastening forces is probably due to the deviation of the initial contact condition under the loosest fastening force, as mentioned in
Section 4.1. Introducing additional parameters to express the variation in triboelectric charge density considering the deviation of the real contact area in low load conditions may further improve the model adequacy.
