Abstract
Predictive maintenance is a system’s competency in distinguishing future scenarios where the machine is likely to fail and schedule repairs just prior to this happening. A heuristic technology to enable efficient predictive maintenance is digital twin technology. The development of a twin system between real-time machinery and the virtual world is made possible by digital twin technology, which is ideal for predictive maintenance. Induction motors, which are the core of industrial machinery, are sparsely represented in the digital twin domain. Therefore, this study created a digital twin of a squirrel cage induction motor, utilizing data-driven modeling and multiple physics, and integrated it with a custom predictive maintenance system. The purpose of this study is to implement digital twin technology for induction motors for fault diagnosis and predictive maintenance. This framework can extrapolate running parameters to presciently detect motor remaining useful lifetime as well as erratic fault diagnosis. The experimental setup for the 2.2 kW squirrel cage induction motor has been integrated into the digital workspace via the dSPACE MicroLabBox controller to allow frequent calibration and reference signal setup. The resultant digital framework deployed on MATLAB Simulink provided high accuracy without placing a great computational load on the processor. The proposed model’s commercial application may open the way for computational intelligence in Industry 4.0 adoption of induction motors.
1. Introduction
Conventional industrial machinery is being converted into cyber-physical systems to phase towards Industry 4.0 with the introduction of smart technology [1]. Furthermore, industrial wireless sensor networks (IWSNs) and the industrial Internet of Things (IIoT) are required by the interconnectedness of modern machinery to make these mechanisms accessible even outside the traditional industry or plant setup [2]. Conventionally, maintenance systems of any equipment are based on a predefined schedule or when faults occur within the system. However, these strategies are expensive and inefficient for setups consolidated through Industry 4.0 and IIoT [3]. Consequently, a growing industrial tendency dedicated to the robust operation of complex equipment is condition-based maintenance, which relies on the present forecasted condition of the equipment to create the most optimal maintenance schedule. Predictive maintenance and intelligent fault detection are two major drivers of this development [4]. Predictive maintenance (PM) is defined as “a method in which the service life of the important parts is predicted based on inspection or diagnosis in order to use the parts to the limit of their service life” [5]. Digital twin technology (DTT), a relatively recent development in technology, offers the ability to solve some of the traditional problems associated with implementing a predictive maintenance system. The definition of a digital twin (DT) is “an integrated simulation of a complex product, which can mirror the life of its corresponding physical twin” [5]. The focus of DTT is distinctively on the reciprocal interaction among the physical and virtual representations as compared with the Internet of Things (IoT) or computer-aided design [6]. Additionally, the DT can offer dynamic operational diagnostics for the machine’s potential future utilization.
Several researchers have investigated using DTs with preventative maintenance systems. Luo et al. [7] presented a highly accurate particle filtering algorithm for predictive maintenance deployed on a CNC machine DT. A comparable physics-based DT was developed by Werner et al. [8], with the in situ extension through a data-driven context to estimate remaining useful life (RUL). Other researchers [9] built a concomitant predictive DT for A PMSM traction motor’s RUL prediction and cloud-based health monitoring. Cavalieri and Salafia [10] boosted the application domain of the DT paradigm by implementing a complete industrial setup of 100 milling machines through a large-scale, data-driven DT. Though the system is computationally intensive, the extensive nature of the DT is a stepping stone for Industry 4.0, where entire assemblies must be automated. In recent research, the primary focus of DT researchers has been electric powertrains and motors [11]. Moghadam and Nejad [12] developed an intricate DT for wind turbine drive trains using torsional dynamic modeling as well as data-driven aspects. The authors of [11] utilized electric motors DT as a virtualized testbed for determining how well motor-drive systems operate and investigated yet another original utilization of motor DTs. The work in [13] continued to research the development of a mechanism to predict the lifespan of a featherweight motor under aerobatic loads for performance analysis.
A digital twin approach for estimating the health state of the on-load tap changers was established in [14] with the help of data-driven dynamic model upgrading and optimization-based operational condition prediction. Furtherly, Feng et al. [15] created a transfer learning algorithm to apply the knowledge gained from the established digital twin-driven model to the actual industry structure, achieving the gear transmission surface degradation assessment with high precision and effectiveness RUL prediction. In [16], a data-driven Digital Twin approach for gas turbine performance monitoring and degradation prognostics from the standpoint of airline operators was described. To create a data-driven Performance Digital Twin, the system used a semi-supervised deep learning approach. Zhang et al. designed a digital twin fault detection based on the transformer network for rolling bearings [17]. Wang et al. [18] suggested a model updating technique based on parameter sensitivity analysis and preliminary created the DT model of rotating machinery failure diagnosis. The Digital Twin has received significant attention in the fields of prognostics and health management mechanical systems, such as in oil pipeline system failure prognostics, vessel-specific fatigue damage prognostics, and fault isolation and isolation of aero engine faults [19]. A DT-based semi-supervised framework is proposed for label-scarce motor fault diagnosis [20]. A predictive maintenance tool for electric motors using the concepts of DT and IIoT is proposed in [21], which monitored the motor current and temperature by means of sensors and a low-cost acquisition module, and these measurements were sent via Wi-Fi to a database.
Predictive maintenance has become a crucial strategy in today’s fast-paced industrial environment as a result of increased operational efficiency and decreased downtime goals. Due to its potential to save costs, optimize maintenance schedules, and lessen production process interruptions, predictive maintenance, or a system’s capacity to predict possible machinery problems and plan repairs before they occur, has gained popularity. Digital twin technology is one innovation that has become a potent facilitator of effective predictive maintenance. This twin system enables a two-way exchange of information, insights, and forecasts by providing seamless connectivity between the actual and virtual worlds. As more and more sectors embrace digital twins, the way assets and processes are tracked, analyzed, and optimized is being completely transformed. As the workhorses of industrial machinery, induction motors are essential in many fields. Induction motors are quite important, but there has not been much coverage of them in the digital twin space [22]. The goal of the current work is to close this gap by developing a digital twin model, especially for a squirrel cage induction motor. The major goal of this project is to use digital twin technology to improve induction motor problem detection and predictive maintenance. The researchers build a thorough digital twin model of the squirrel cage induction motor by using data-driven modeling methodologies and including various physics.
Although the aforementioned literature has created very sophisticated DTs in a variety of application domains, it can be seen that the DTT literature’s coverage of IMs is limited. A further study into the development of a DT consolidated PM system for such machines is even rarer in pursued research, with comprehensive implementation largely unexplored. This can be a setback in the progress of Industry 4.0 utilization as the reliance on IMs remains high in various industrial stages. In addition to this, there are still many notable obstacles that can be observed in past developed DT implementations. Some of these drawbacks are as follows:
- High complexity models with infeasible processor requirements: In the pursuit of developing highly accurate frameworks, most DT predictive maintenance systems trade off lightweight processing. The resulting models cannot be commercially utilized in real-time tandem with the DT due to infeasible computational requirements.
- Incompatible integration: As the domain of DTT is new, no end-to-end solutions exist for the creation of DT PM models. Often the predictive maintenance system is developed on a stand-alone platform relative to the DT, which leads to imperfect integration of the two entities when run simultaneously.
- High cost and inflexible models: In attempts to boost system efficiency, various models focus heavily on data-driven DTs and consequent PM systems. This strategy results from inexpensive hardware setups with an array of sensing devices, also making customization more difficult.
The proposed predictive maintenance advantages from the suggested digital twin structure are numerous. It makes it possible to extrapolate running characteristics accurately, enabling the system to foresee future motor breakdowns in advance. Furthermore, the framework’s capacity to spot irregular fault patterns improves its diagnostic skills, enabling prompt and accurate maintenance actions. The study combines the digital twin concept with a unique predictive maintenance method in order to guarantee its practical applicability. The system acquires a comprehensive understanding of the motor’s status by fusing real-time monitoring with the virtual representation, which enables better-informed decisions about resource allocation and maintenance schedules. The 2.2 kW squirrel cage induction motor experimental setup is integrated into the digital workspace using the dSPACE MicroLabBox controller to enable easy integration into the industrial context. The periodic calibration and set of reference signals made possible by this integration ensure that the digital twin is perfectly aligned with the real motor. The computational effectiveness of the suggested digital twin structure is a key feature. The study reduces the processor’s large computational burden while achieving high accuracy in problem detection and predictive maintenance by deploying the model on MATLAB Simulink. The real-time viability of the digital twin in practical applications depends on this equilibrium between accuracy and processing efficiency. It is notable that this model has the potential for commercial use since it opens the door for computational intelligence in the adoption of Industry 4.0 practices for induction motors. Digital twin technology gives businesses a chance to optimize their maintenance plans, boost productivity, and harness the revolutionary potential of data-driven insights by seamlessly bridging the gap between the physical and virtual worlds. Overall, the use of digital twin technology in this study significantly advances the field of predictive maintenance for induction motors. The digital twin architecture bears the promise of changing industrial practices and assisting in the realization of Industry 4.0’s potential thanks to its powerful problem diagnostic capabilities and foresightful predictive maintenance.
The contributions of the article are highlighted as follows:
- To integrate physical measurements from a 2.2 kW squirrel cage induction motor experimental setup with the digital workspace via dSPACE MicroLabBox controller to allow frequent hardware-simulation calibration.
- To provide a virtual platform via the DT to generate exhaustive datasets for training machine learning models and predictive algorithms. The scale of these datasets is infeasible and impractical to perform solely on the hardware.
- To amalgamate all three aspects of the architecture, namely DT, PM, and physical setup, into one harmonious platform.
- To model a computationally lightweight predictive maintenance system that utilizes SCIM DT data for training and continuous use. To the knowledge of the authors, this is the first comprehensive DT PM model for SCIMs that analyzes gradual degradation as well as unpredictable machine faults.
- To create a hybrid DT that is in sync with the actual machine while also providing enhanced abilities in data generation, thus reducing reliance on data-driven setups through multiphysics modeling. This facet contributes majorly to the merit of this system, reducing the need for continuous physical sensor operation and enhancing parallel experimentation without compromising the quality of the insights generated by the system.
Curve fitting and machine learning algorithms that are optimized to give trustworthy estimations enable this system. The rest of this paper is structured as follows: Section 2 depicts the workflow of designing the digital twin as well as its mathematical backbone. Section 3 delineates the hardware and software aspects of the SCIM digital twin. Section 4 highlights the design of the predictive maintenance system, and in Section 5, there is a case study that describes how the model was applied and evaluated. Section 6 presents the outcomes of the PM system. The study is concluded in Section 7.
2. Digital Twin Implementation Workflow
This study’s suggested approach combines contextual data-driven modeling with synthetic data generated by multiphysics simulation with assistance from finite element analysis (FEA). Figure 1 provides a summary of the DT construction’s workflow.
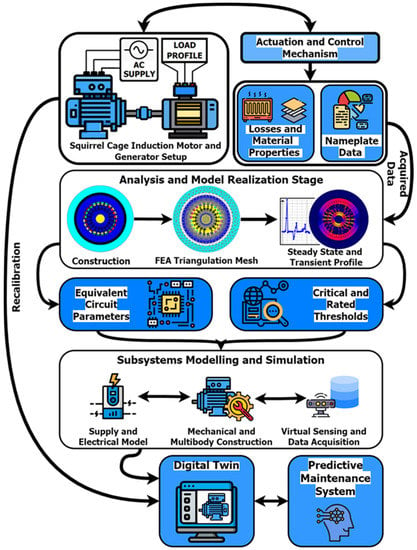
Figure 1.
Digital Twin Implementation Schematic.
The core of the DT system is the SCIM, whose particulars were extracted by utilizing comprehensive hardware experimentation. The setup minimizes the use of expensive sensing and data acquisition mechanisms as the DT creation is equally supported by reconfigurable multiphysics modeling. In order to simulate a comprehensive co-simulated model, it is necessary to establish the mathematical relationships that govern the SCIM’s electrical behavior. This is most efficiently performed using an equivalent circuit model [23], as shown in Figure 2, where V1 is the terminal voltage of the stator winding in the per-phase, R1 is the resistance of the stator winding in per-phase, X1 is the leakage resistance, E1 is induced voltage in the stator winding, RC is the stator core loss resistance, Xm is the magnetizing reactance, and so is the slip. Similarly, R2 is the resistance of rotor winding in per-phase, X2 is the rotor leakage reactance in per-phase, and E2 is induced voltage in the rotor at a standstill, all as referred to the stator. In the balanced state, the input Power (Pin) is given as shown in Equation (1).
where θ is the input power factor. This gives a stator current I1 through Equation (2).
Pin = 3V1I1cos(θ)
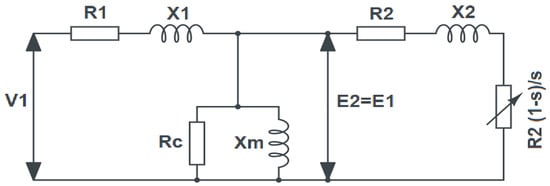
Figure 2.
Induction Motor Equivalent Circuit Model.
The field in the stator cuts the rotor conductors to induce a magnetic field in it. This gives a resulting rotor current I2 as given in Equations (4) and (5).
The presence of currents and magnetic fields gives losses, which must be deducted to obtain the final mechanical output. The major two losses are stator copper loss (PCU), which is dependent on machine loading, and core loss (PC), which remains constant throughout the operation [24]. These losses are calculated as given in Equations (6) and (7).
where GC is the core conductance. The converted mechanical power (Pconv) can then be found in Equation (8).
Ultimately, the mechanical power output (Pout) can be calculated using Equation (9).
where Prot is the mechanical rotational losses. Using this, the developed torque (τD) can be computed as per Equation (10). Here ωm is the mechanical rotational speed.
Similarly, the output torque of the machine (τL) can be calculated from Equation (11).
3. Hardware Realization and DT Model Integration
3.1. Hardware Realization
The experimental setup consists of a 2.2 kW singly fed asynchronous machine coupled with an electro-dynamic loading arrangement, Benn Electricals Make, India. The rating of the machine is given in Table 1. Adopting the experimental arrangement as shown in Figure 3, the dynamic performance of the single-fed motor is analyzed under partial single-phase ground fault and partial three-phase ground fault. The star-connected machine’s stator windings are tapped externally at 10 percent, 20 percent, 40 percent and 100 percent of the windings. The machine is energized through a three-phase variance, Benn Electricals Make to reduce the starting transients. In addition, the protection circuit (CT with overcurrent relay and contactor) is connected to isolate the machine from the source while operating beyond the threshold value undergrounding conditions. The E3N digital current probes are used to measure the input current. Furthermore, the machine shaft torque is measured with rotary torque sensors, Monad Make, India.

Table 1.
Specifications of the utilized SCIM.
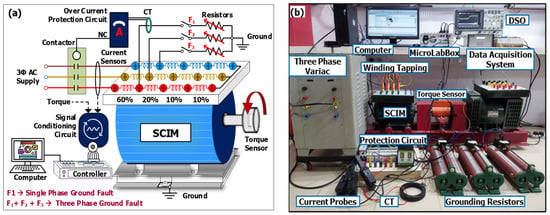
Figure 3.
SCIM with single-phase and three-phase ground faults: (a) hardware schematic; (b) experimental arrangement.
Through the interface card, the dSPACE MicroLabBox controller receives the current sensor output signal in millivolts (100 mV/1 A) and the torque signals in volts (0–10) V. These signals are conditioned and integrated into MATLAB for further processing and visualized through the Control Desk 7.4 software, dSPACE. To observe the mechanical torque effect under normal and abnormal conditions, the shaft torque of the machine is measured and recorded using the data acquisition system. The input electrical quantities (current) and output mechanical quantities (torque) are captured using a digital storage oscilloscope (DSO). The result extraction procedure using the above-discussed experimental setup is as follows;
- Selecting the appropriate tapings in one phase or all three phases and grounding through the switches (F1, F2, F3) creates partial discharge ground faults shown in Figure 3a.
- The effect of abnormalities depends upon the grounding tapings and the value of the grounding resistors.
- The machine is allowed, and the fault switches are enabled to record the input current data.
- Step 3 is repeated with different tapings and different resistance values.
- The threshold value for the protection circuit is determined by the motor current rating.
To this end, an electromechanical conversion interface is designed through torque and angular velocity transformation from electrical signals to physical signals. The final system is the data acquisition hub, which not only routes all the collected virtual sensor signals to a centralized display but also exports them to the MATLAB workspace for analysis and further processing.
3.2. Digital Twin Model
Once the relations have been established, the multiphysics profile of an existing physical SCIM cross-section was subjected to steady-state electromagnetic analysis as the first step in developing the SCIM DT. Altair Flux™ has been employed for the 2D analysis of the performance using the induction motor overlay tool [25] to expedite motor modeling. To reduce the computational intensiveness of the analysis process without sacrificing accuracy, an analysis mesh was built using finite element analysis. Ultimately, an analysis scenario was solved using the cross-section, material parameters, and electrical circuit to produce the resultant flux, vector potential, and current density contour, as seen in Figure 4a,b. Numeric results for phase currents and apparent power were also computed for cross-platform validation during DT deployment. Use of the aforementioned profiles for both the DT architecture as well as to set critical thresholds for the PM system algorithm. The data was subsequently added to an analogous circuit; its specifications were adjusted shown in Table 2. The value of stator core loss resistance is negligible; therefore, it has not been considered in the equivalent circuit modeling process. It is now necessary for this data to be displayed in a solitary entity, the system’s DT, which has been properly constructed to reflect the mechanical behavior of the system as well as its electrical configuration.
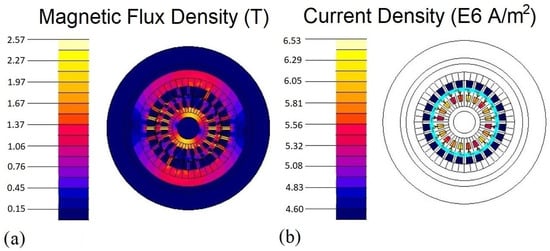
Figure 4.
Steady-State Electromagnetic Contours: (a) magnetic flux density Iso-values chart; (b) current density Iso-values chart.

Table 2.
Steady-state numeric results.
As this level of co-simulation is infeasible for the analysis platform, the creation of the digital twin is undertaken on MATLAB Simulink, utilizing the gained modeling insights from the steady-state analysis. The DT model consists mainly of four major subsystems: electrical drive, electromechanical conversion interface, mechanical multibody construction, and virtual sensing hub, as seen in Figure 5. The electrical drive system is built predominantly through the Simscape Electrical Blockset. The major component of this system is the 2.2 kW squirrel cage induction motor, Benn Electricals Make, India constructed from its equivalent circuit diagram. It is amalgamated with a linked load routed from the mechanical framework. This subsystem also consists of a synthetic fault generation unit that allows the model to function as a testbed for PM systems and possibly for design alterations. The second subsystem is the multibody construction unit. This recreates the physical structure of the SCIM along with its peripheral units and auxiliary safety features. The shaft of the motor is connected to a reconfigurable load. The motor casing houses the SCIM and is constructed with the load-bearing stand to hold the unit stationary. The SCIM produces significant amounts of heat during extended operation; therefore, they are built with radial fins for improved heat dissipation. The multibody visualization generated by this design of the SCIM is shown in Figure 6 from the cross-sectional and partial lateral view. The mechanical and electrical systems may be functional as stand-alone entities, but to emulate the true behavior of the actual SCIM, the systems must be seamlessly integrated and co-simulated. This completes the foundational design of the framework.
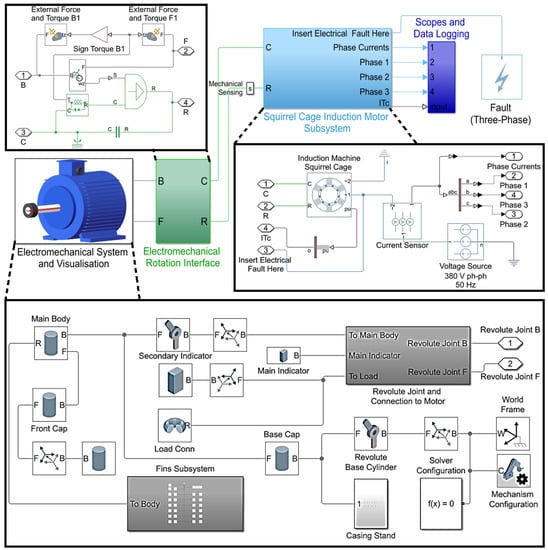
Figure 5.
Digital twin model on Simulink.

Figure 6.
Multibody visualization of the SCIM.
The data signals routed from the hardware bench serve as the reference signal to recalibrate the digital twin in the virtual space. This functionality enables the model to run in two different modes:
- Single Calibration Mode: The hardware setup is connected for a short period to collect multiple readings to serve as a reference architecture for the DT. Following this, the hardware setup is disconnected, and the DT runs experiments independently. This is used in the case of generating a dataset to train the fault detection classifier as a hardware setup takes infeasible time to perform repeated experiments, whereas a calibrated DT can produce abounds accurate data in a fraction of the same time using parallel processing.
- Continuous Feedback Mode: The hardware setup is connected continuously to the DT, and at regular intervals, the DT reconfigures its parameters to match the hardware setup. This mode is used when collecting data for the RUL estimation algorithm. It provides merit over using solely hardware as more data points can be generated via the DT being independent of the baud rate. Furthermore, this relieves the need for multiple physical sensors to be operational for long periods, which reduces measurement error and sensor degradation.
In order to perform system verification of the developed model, time-series data from the DT and steady-state data from the Flux 2D simulation are compared. With an average error of just 2.3%, the data for the phase currents, terminal currents, and real power on both platforms demonstrated a remarkable correlation. The data shows the repeatable variation of the waveforms after an initial transient during the starting period of the motor. These transients do not contribute to the diagnosis of faults or gradual degradation; therefore, only the portion of the signal depicting a steady state is utilized for analysis.
4. Predictive Maintenance System Design
While the DT and its data acquisition hub function sufficiently, creating and properly storing a large dataset is a difficult task that could require an unreasonable time period for an individual simulation. For effective data generation, numerous instances of the DT are simultaneously simulated by the script for executing the data creation using Matlab software’s parallel pool [26]. Additionally, since Simulink’s Ensembles data store relates specifically to this generation cycle, a central database was used to label and keep this data. From the MATLAB workspace, this is conveniently reachable and significantly minimizes the system’s computing costs. The mechanical output and phase currents are the data variables for the SCIM DT that change considerably during faults. Consequently, other variables were removed from the ensemble data store to avoid overstuffing the system. The predictive maintenance system created for these studies consists of two separate algorithmic evaluations, namely remaining useful life estimation and fault diagnosis. Though the processes are separate many aspects, including the standard deviation (σ), skewness (SK), mean (μ), peak-to-peak value, kurtosis (K), Reims (Xrms), shape factor (SF), crest factor (CF), margin factor (MF), impulse factor (IF), and energy, from the raw data must be extracted in both analyses. These useful mathematical markers are taken out of the raw data, and a feature table is created.
The PM system now branches into two separate subsystems. The first is an indicator of gradual degradation diagnostics, which aids in forecasting the remaining operational life of the SCIM. This algorithm utilizes a time series dataset collected over days, which ideally should demonstrate a trend toward slow degradation of the machine. To generate the dataset for this feature, the DT PM system is run in continuous feedback mode enabling accurate data to be collected without relying heavily on the hardware. The features of the store table are ranked by computing their monotonicity (Mn), and those with poor monotonicity are eliminated to optimize the prediction process. A monotonic series is one that either only increases over time or only decreases and is expressed by Equation (12). Such a dataset is ideal for studying gradual degradation, making it a suitable filter for RUL estimation [27]. Here, NDP refers to the number of positive differences that occur from one data point to the next in the sequence, and NDN refers to the same for negative differences.
This feature table is then processed to reduce noise in the signals and fed into a Principal Component Analysis algorithm which reduces dimensions by fusing features into principal components. The principal component, which shows a trend as the machine approaches the critical threshold, would be the ideal choice for a fused health indicator (h(t)). The fused health indicator can now serve as input to an exponential degradation model realized through Equation (13). The objective of the algorithm is to fit the data obtained for the data set to the obtained trend profile and extrapolate it to reach a predefined degradation threshold.
where θ and β are parameters that determine the gradient of the curve and are updated with every time interval (t) where the model is computed. It is also notable that θ is log normal-distributed, and β is Gaussian-distributed. There is also a noise component that is represented by ϵ, highlighting, in particular, the Gaussian white noise. The final term—σ2/2 is utilized for making the curve fit the exponential condition of the degradation model. In simplicity, the health indicator is loaded into an iterative process of fitting the data to an exponential degradation model. As more time-series data are available for this model, the prediction becomes more accurate, and the confidence interval becomes sharper. The system also generates a probability distribution function for every estimate of the RUL visualized graphically. The final value for RUL is obtained when the last data file is processed by the model and can be analyzed to judge the performance of the algorithm.
The second subsystem developed in this study is the detection of variable faults that may harm or impair the SCIM while running. Rather than a time series dataset, this technique uses categorical data labeled with codes for faulty or healthy conditions [28]. To this end, the system is run in the single calibration mode until the complete dataset is stored. The feature table is normalized with this approach to preserve scalability during classification. As with the previous subsystem, eliminating elements that are unnecessary or less beneficial to the training process is a good practice. This script first creates a correlation matrix for this purpose in order to identify the unnecessary features and eliminate from them the training table. Furthermore, this generated attribute table is then executed via neighborhood component analysis in order to determine training weights for the supervised learning method. This further improves the algorithm’s effectiveness by terminating the characteristics whose weights are not relevant. Finally, the algorithm executes a Support Vector Machine (SVM), a supervised learning classification technique that separates the data into categories and detects whether a fault is present. The SVM method has opted as the dataset obtained in the form of a feature table has relatively few samples in comparison to its dimensionality [29]. Such datasets are ideal for kernel-based SVM classification. Furthermore, the choice stems from the objective of this study to implement a lightweight and efficient solution, as SVMs are known to be memory-efficient classifiers. As mentioned previously, various noise reduction techniques have been implemented to ensure the SVM does not underperform. In the case that multiple faults are present, the classifier is also able to distinguish which fault is likely to be present in the signal. Since various SVM kernels, SVM kernels operate with variable success rates; the PM system simultaneously trained Gaussian, cubic, fine Gaussian, linear, quadratic, medium and coarse Gaussian SVMs to utilize the most accurate model in every individual case. The culminating stage of the design process involves routing the resulting RUL estimation and fault detection models to be run concurrently with the developed DT model. This would allow the developers to test the computational load put onto the running machine, which processes the DT’s behavior along with the two PM subsystems. The flowchart of the implemented DT PM system is delineated in Figure 7. In the case of the fault detection system, an intuitive diagnostic message appears in case a fault is detected by the trained SVM. On the other hand, the RUL estimation system collects insights for short intervals during every operational session of the machine by frequent recalibration with the DT to sync the current machine state. At the end of each session, an estimate is available for observation by the operator. However, if less than 2 weeks are available for the machine to function at the required capacity, a soft yellow warning is issued in the form of an intuitive notification. Similarly, if the yellow is ignored and the machine is estimated to have an RUL of a week or less, a red warning is issued to alert the operation team that expedited maintenance is required.

Figure 7.
Digital twin PM system integrated utilization flowchart.
5. Case Study: Utilizing the Predictive Maintenance System with Phase-Ground Faults
One of the factors that affect the machine in the short term and, over time, causes a progressive degradation is electrical faults. Of these, stator faults, including phase and winding faults, account for close to 37% [30]. To demonstrate that the PM system’s performance is efficient, both short-term and long-term stator faults were modeled as follows:
- Single Phase to Ground Fault: A fault that occurs when one of the three phases of the IM is brought into contact with the ground, which can create a serious unbalance in the system [31]. This is an unsymmetrical fault that creates an extremely high current in one phase as compared to the others. While this fault may be short-lasting when fault resistance (Rf) is low, it can also cause gradual degradation if the fault resistance is high.
- Three-Phase to Ground Fault/Three-Phase Bolted Fault: A fault that occurs when all the three-phase conductors have zero impedance between them because they are held together. This type of fault results in the maximum short-circuits current to be produced, which is why it is often used as a test to determine the level of protective device needed in the motor.
The two types of faults, when simulated on the SCIM DT and hardware rig for no-load conditions between 1–2 s, give the current profiles as seen in Figure 8 and Figure 9, respectively. The fault resistance taken for this sample is 23 Ohms. The single phase-to-ground fault shows increased current only for the phase with the fault present (phase 1), whereas the three-phase-to-ground fault shows increased current in all three phases and a higher peak-to-peak value as well. The figures demonstrate the strong correlation between the data obtained from the hardware and the DT after calibration. The following part discusses the outcomes of using these datasets as input and the PM system.
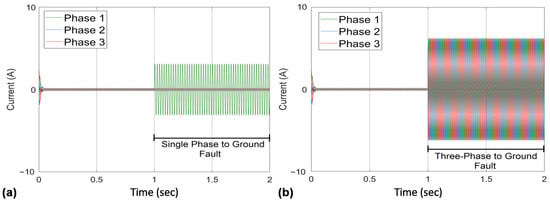
Figure 8.
Fault model simulation results: (a) single phase to ground fault; (b) three phase to ground fault.

Figure 9.
Hardware results for partial discharge ground fault, stator line current: (a) single phase to ground; (b) three phase to ground, fault current; (c) single phase to ground; (d) three phase to ground.
6. Results and Discussions
This data forms the core of the predictive maintenance system as it is used to provide the training model, a module of the healthy operational data and that with faults. Results from the models on both software show cohesion; therefore, it can be deduced that despite the change of platform, the models are compatible with data exchange. Fault experimentation in both models shows the increased amplitude of phase current in the phase where the fault has occurred (in this case, phase A). These currents can cause temperature rise and vibrations degrading the machine over time. Erratic fluctuation of angular velocity and torque are also observed, which contributes to mechanical noise, further deviating the motor from its stable operation.
The categorical data’s final dataset has two million data points for each variable and includes data on single-phase-to-ground faults (SPG), three-phase-to-ground faults (TPG), and healthy motor function. Subsequently, the final dataset generated from time-series data of a gradually developing single phase to ground fault each variable contained has 4.5 million data points. This dataset consisted of individual 10 s data files representing the collection of data over 45 days. As collecting data over 45 days is not realistic, the model is run in continuous feedback mode with a gradual increase in the single-phase fault resistance on the hardware rig, which mimics the emergence of gradual SPG in the motor. As the DT frequently calibrates in this mode, the resulting variation in data is reflected in the generated dataset.
6.1. Fault Detection
Fault codes 0–2 were used to label the data, where, correspondingly, 0, 1, and 2 represent data from healthy, SPG, and TPG samples. The time-domain features of each signal in the dataset were computed using the diagnostic feature designer App in MATLAB and exported to the MATLAB workspace. Despite the large number of features that this extraction produced, some of them may be redundant because they are correlated. To avoid unnecessary processing delays in such a situation, only one of the correlated features should be retained. Consequently, a correlation matrix was produced, as shown in Figure 10a. It is evident that features 2, 5, 6, 11, 12, 14, 15, 16, and 17 are redundant and, therefore, omitted from the feature table. After filtering for the desired features, the data was normalized to preserve scale and consistency.

Figure 10.
Data preprocessing procedures: (a) correlation matrix of 18 extracted features; (b) weights obtained from Neighborhood component analysis.
The next step was to use neighborhood component analysis to calculate feature weights for the classification. The efficiency of Neighborhood Component Analysis in feature selection and dimensionality reduction is heavily influenced by the specifics of the dataset and the underlying machine learning problem. To improve training performance even more, the weights in Figure 10b that are not significant results were omitted from the training table. To this end, features 4, 5, and 7 were eliminated from the training table. Once the model’s training table is finished, then it is fed to the MATLAB Classification Learner App. Specifically, by using the parallel pool computing option, the model is simultaneously trained with 6 SVMs, and Table 3 displays the results. According to Table 3, Quadratic SVM had the highest accuracy at 95.5%, producing the best results. The performance of the Quadratic SVM’s added description in Figure 11 displays the positive prediction rate, the false detection rate of the model and the parallel coordinate’s view of the data as well as predictions.

Table 3.
Performance of various SVMs for classification.
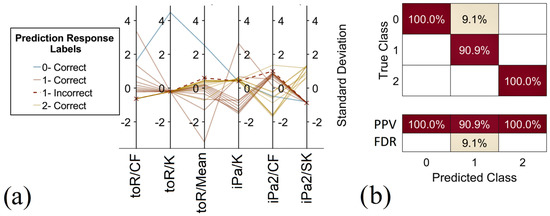
Figure 11.
Model Performance Metrics: (a) parallel coordinate’s plot of data and predictions; (b) confusion matrix of PPV and FDR.
6.2. RUL Estimation Results
The first data feature obtained in this subsystem was the spectral kurtosis of the torque signal. This feature indicates in which frequency the transient or, in this case, the fault occurs for each day of the data collection. As a result, it can allow us to analyze distortion at a particular frequency, thus optimizing the analysis.
The results of spectral kurtosis are presented in Figure 12. The kurtosis values of various frequency components in a signal’s spectrum are displayed graphically in a spectral kurtosis plot. A unique frequency bin and its matching kurtosis value are associated with each point on the plot. At some frequencies, high kurtosis levels point to the presence of impulsive or non-Gaussian components in the signal. These impulsive elements could be connected to flaws or irregularities in the system. Significant kurtosis values in frequency peaks point to the presence of certain resonance phenomena or fault frequencies. Engineers and analysts can learn more about the health of the system and identify any flaws or anomalous behaviors that might not be seen in the time-domain or conventional frequency-domain charts by analyzing the Spectral Kurtosis plot. The result shows large distortions between the 0.7 and 1.2 kHz interval and also indicates that the fault increases in severity as time passes. Mean, standard deviation, skewness, kurtosis, peak-to-peak value, rms, crest factor, form factor, impulse factor, margin factor, and energy were the features derived from this DT dataset. Furthermore, the extraction of mean, standard deviation, kurtosis and skewness were undertaken from the computed spectral kurtosis profile for frequency domain analysis. The resultant feature table was then subjected to signal processing to achieve smoother waveforms by eliminating noise. The monotonicity of each of the features is then calculated after smoothening. The analysis of monotonicity demonstrated that the best features for prediction were mean, rms, standard deviation, peak-to-peak value, skewness, crest factor, margin factor, shape factor, and energy, as they have the highest monotonicity coefficients. The processed and optimized feature table is now fed into a principal component analysis algorithm. The PC, which shows a trend with machine failure, is used as a good fused indicator for machine health prognostics. Consequently, this fused health indicator is stored as a function of time. The critical thresholds obtained from the previous analysis of the motor in steady-state and transient states are now entered into the program.
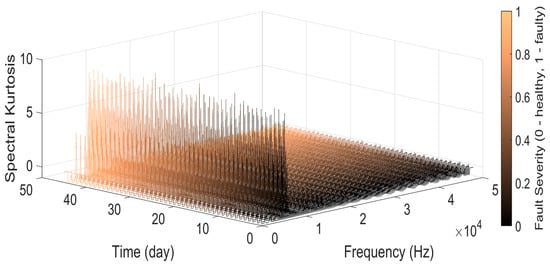
Figure 12.
Spectral Kurtosis plot for mechanical torque.
Curve fitting is performed using the exponential degradation profile generated. The trend estimate is used to compute the RUL varying over the testing data. The following shows the progression of the RUL estimation as more and more data is introduced to the training model. This progressing estimate is seen in Figure 13. With the current rate, the estimated RUL is approximately 22 days. A similar fault profile was also run solely on the hardware rig with a lower critical threshold in order to prevent any permanent damage to the physical machine. It was noted from this collected data when the motor showed sufficient deterioration and was compared with the prediction of the RUL model, as shown in Table 4. This conveys that upon the addition of a certain amount of data files (each file representing a day), the estimate of how many more days the system can continue to function optimally is generated. The generated value, visible as the peak of the graph, indicates the number of days following the completion of data collection. It is noted that with an increasing amount of data files supplied to the algorithm, the confidence interval is smaller, and the predictor approaches an estimate closer to the actual RUL of the system.
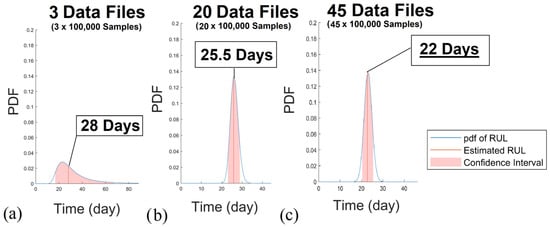
Figure 13.
RUL estimation results with increasing data samples: (a) with 3 data files; (b) with 20 data files; (c) with 45 data files.

Table 4.
Comparison of RUL estimation results with actual values.
Both trained models were exported to the MATLAB workspace and consequently utilized as Simulink objects to conduct the fault analysis and RUL estimation in an integrated fashion with the DT. The model was verified to distinguish even lower-scale fault occurrences and did not place a high load on the processing and memory resources of the running system. Some snippets of the resulting warning notifications are shown in Figure 14.

Figure 14.
Warning popup notification results from DT PM System: (a) RUL red alert; (b) RUL yellow alert; (c) fault diagnostic notification.
6.3. Benefits of the Developed Architecture
While the developed solution stands fair against the testing requirements for a stand-alone model, in order to verify its novelty, it must fulfill the metrics that are noticed as flaws in other similar studies. In comparison to other novel fault detection systems in SCIMs [32,33], the proposed solution reduces reliance on hardware testbeds and physical sensing at the culminating stage of its development cycle. This not only reduces the resources and costs required for operation but also opens the opportunity for more comprehensive testing with meticulous control over external variables. This shall pave the way for more low-cost machine maintenance setups and safer developed technology through rigorous virtual testing regimens.
In terms of analogous studies of DT PM systems, this study also showcases many benefits. Through effective pre-processing, germane algorithm selection, and parallel processing utilization, the model highlights its unique ability to operate a complex interconnected DT framework with limited processing requirements. Additionally, through the implementation of the ultimate components on the same platform, the integration of the model is seamless, which enhances its potential as an end-to-end solution in the commercial workspace. The utilization of a hybrid PM mechanism reduces the overall cost of implementation as the need for hardware sensing in DT development is substantially reduced. Finally, by designing a framework in an unexplored application area in DT PM systems, this model is both novel and foundational for future systems attempting to supplement the functionality and management of SCIMs.
7. Conclusions
As we transition into Industry 4.0, automation and smart technologies are progressively becoming crucial in industry and other sectors, DTTs are an enabling technology that enables us to integrate digital and physical machines. This paper extends the use of DTT in the domain of preventative maintenance. While such investigations have been carried out in the past, none has utilized the SCIM as a subject of virtual representation. Furthermore, by deploying a PM system using artificially produced data and thresholds of the SCIM DT system, the suggested study develops a practical solution for both short- and long-term fault occurrence. The resulting hybrid PM system was validated as a commercial platform for industrial SCIMs due to its accuracy and reduced computational requirements. Even though the development mechanism is a promising proof of concept, the future focus of this effort will be to enable the physical equipment to connect to the cloud storage system.
Author Contributions
Conceptualization, R.R.S.; methodology, R.R.S.; software, D.K.; formal analysis, I.V.; investigation, G.B.; resources, D.K.; writing—original draft preparation, G.B. and F.A.; supervision, I.V.; funding acquisition, F.A. All authors have read and agreed to the published version of the manuscript.
Funding
This research received no external funding.
Conflicts of Interest
The authors declare no conflict of interest.
References
- Colombo, A.W.; Karnouskos, S.; Kaynak, O.; Shi, Y.; Yin, S. Industrial Cyber physical Systems: A Backbone of the Fourth Industrial Revolution. IEEE Ind. Electron. Mag. 2017, 11, 6–16. [Google Scholar]
- Gidlund, M. Guest Editorial: Security, Privacy, and Trust for Industrial Internet of Things. IEEE Trans. Ind. Inform. 2020, 16, 625–628. [Google Scholar]
- Teixeira, H.N.; Lopes, I.; Braga, A.C. Condition-based maintenance implementation: A literature review. Procedia Manuf. 2020, 51, 228–235. [Google Scholar] [CrossRef]
- Essien, A.; Giannetti, C. A Deep Learning Model for Smart Manufacturing Using Convolutional LSTM Neural Network Auto encoders. IEEE Trans. Ind. Inform. 2020, 16, 6069–6078. [Google Scholar] [CrossRef]
- Bhatti, G.; Mohan, H.; Raja Singh, R. Towards the future of smart electric vehicles: Digital twin technology. Renew. Sustain. Energy Rev. 2021, 141, 110801. [Google Scholar]
- Catalano, M.; Chiurco, A.; Fusto, C.; Gazzaneo, L.; Longo, F.; Mirabelli, G.; Nicoletti, L.; Solina, V.; Talarico, S. A Digital Twin-Driven and Conceptual Framework for Enabling Extended Reality Applications: A Case Study of a Brake Discs Manufacturer. Procedia Comput. Sci. 2022, 200, 1885–1893. [Google Scholar]
- Luo, W.; Hu, T.; Ye, Y.; Zhang, C.; Wei, Y. A hybrid predictive maintenance approach for CNC machine tool driven by Digital Twin. Robot. Comput.-Integr. Manuf. 2020, 65, 101974. [Google Scholar] [CrossRef]
- Werner, A.; Zimmermann, N.; Lentes, J. Approach for a Holistic Predictive Maintenance Strategy by Incorporating a Digital Twin. Procedia Manuf. 2019, 39, 1743–1751. [Google Scholar] [CrossRef]
- Venkatesan, S.; Manickavasagam, K.; Tengenkai, N.; Vijayalakshmi, N. Health monitoring and prognosis of electric vehicle motor using intelligent-digital twin. IET Electr. Power Appl. 2019, 13, 1328–1335. [Google Scholar] [CrossRef]
- Cavalieri, S.; Salafia, M.G. A Model for Predictive Maintenance Based on Asset Administration Shell. Sensors 2020, 20, 6028. [Google Scholar] [CrossRef]
- Rassõlkin, A.; Rjabtšikov, V.; Vaimann, T.; Kallaste, A.; Kuts, V.; Partyshev, A. Digital Twin of an Electrical Motor Based on Empirical Performance Model. In Proceedings of the XI International Conference on Electrical Power Drive Systems (ICEPDS), St. Petersburg, Russia, 4–7 October 2020; pp. 1–4. [Google Scholar]
- Farid, K.M.; Amir, R.N. Online condition monitoring of floating wind turbines drivetrain by means of digital twin. Mech. Syst. Signal Process. 2022, 162, 108087. [Google Scholar]
- Goraj, R. Digital twin of the rotor-shaft of a lightweight electric motor during aerobatics loads. Aircr. Eng. Aerosp. Technol. 2020, 92, 1319–1326. [Google Scholar]
- Kim, W.; Kim, S.; Jeong, J.; Kim, H.; Lee, H.; Youn, B.D. Digital twin approach for on-load tap changers using data-driven dynamic model updating and optimization-based operating condition estimation. Mech. Syst. Signal Process. 2022, 181, 109471. [Google Scholar]
- Feng, K.; Ji, J.C.; Zhang, Y.; Ni, Q.; Liu, Z.; Beer, M. Digital twin-driven intelligent assessment of gear surface degradation. Mech. Syst. Signal Process. 2023, 186, 109896. [Google Scholar] [CrossRef]
- Sun, J.; Yan, Z.; Han, Y.; Zhu, X.; Yang, C. Deep learning framework for gas turbine performance digital twin and degradation prognostics from airline operator perspective. Reliab. Eng. Syst. Saf. 2023, 238, 109404. [Google Scholar]
- Zhang, Y.; Ji, J.C.; Ren, Z.; Ni, Q.; Gu, F.; Feng, K.; Yu, K.; Ge, J.; Lei, Z.; Liu, Z. Digital twin-driven partial domain adaptation network for intelligent fault diagnosis of rolling bearing. Reliab. Eng. Syst. Saf. 2023, 234, 109186. [Google Scholar] [CrossRef]
- Wang, J.; Ye, L.; Gao, R.X.; Li, C.; Zhang, L. Digital Twin for rotating machinery fault diagnosis in smart manufacturing. Int. J. Prod. Res. 2019, 57, 3920–3934. [Google Scholar] [CrossRef]
- D’Amico, D.; Ekoyuncu, J.; Addepalli, S.; Smith, C.; Keedwell, E.; Sibson, J.; Penver, S. Conceptual framework of a digital twin to evaluate the degradation status of complex engineering systems. Procedia CIRP 2019, 86, 61–67. [Google Scholar] [CrossRef]
- Xia, P.; Huang, Y.; Tao, Z.; Liu, C.; Liu, J. A digital twin-enhanced semi-supervised framework for motor fault diagnosis based on phase-contrastive current dot pattern. Reliab. Eng. Syst. Saf. 2023, 235, 109256. [Google Scholar]
- Dos Santos, J.F.; Tshoombe, B.K.; Santos, L.H.; Araújo, R.C.; Manito, A.R.; Fonseca, W.S.; Silva, M.O. Digital Twin-Based Monitoring System of Induction Motors Using IoT Sensors and Thermo-Magnetic Finite Element Analysis. IEEE Access 2022, 11, 1682–1693. [Google Scholar]
- Xie, G.; Yang, K.; Xu, C.; Li, R.; Hu, S. Digital Twinning Based Adaptive Development Environment for Automotive Cyber-Physical Systems. IEEE Trans. Ind. Inform. 2022, 18, 1387–1396. [Google Scholar] [CrossRef]
- Boldea, I. Induction Machines Handbook: Ransients, Control Principles, Design and Testing, 3rd ed.; CRC Press: Boca Raton, FL, USA, 2020. [Google Scholar]
- Gör, H.; Kurt, E.; Bal, G. Analyses of losses and efficiency for a new three phase axial flux permanent magnet generator. In Proceedings of the 4th International Conference on Electric Power and Energy Conversion Systems (EPECS), Sharjah, United Arab Emirates, 24–26 November 2015. [Google Scholar]
- Poginan, R. “Flux2D Simulation of the Rotor Bar Breakage”. Altair University. 2019. Available online: https://altairuniversity.com/learning-library/free-ebook-flux2d-simulation-of-the-rotor-bar-breakage/ (accessed on 1 December 2022).
- Saidi, L.; Ali, J.B.; Bechhoefer, E.; Benbouzid, M. Wind turbine high-speed shaft bearings health prognosis through a spectral Kurtosis-derived indices and SVR. Appl. Acoust. 2017, 120, 1–8. [Google Scholar] [CrossRef]
- Yin, S.; Ding, S.X.; Zhou, D. Diagnosis and Prognosis for Complicated Industrial Systems—Part I. IEEE Trans. Ind. Electron. 2016, 63, 2501–2505. [Google Scholar] [CrossRef]
- Çınar, Z.M.; Abdussalam Nuhu, A.; Zeeshan, Q.; Korhan, O.; Asmael, M.; Safaei, B. Machine Learning in Predictive Maintenance towards Sustainable Smart Manufacturing in Industry 4.0. Sustainability 2020, 12, 8211. [Google Scholar] [CrossRef]
- Jindal, A.; Dua, A.; Kaur, K.; Singh, M.; Kumar, N.; Mishra, S. Decision Tree and SVM-Based Data Analytics for Theft Detection in Smart Grid. IEEE Trans. Ind. Inform. 2016, 12, 1005–1016. [Google Scholar] [CrossRef]
- Basu, K.P.; Morris, S.; George, M.K. Operation of three-phase induction motor with line to ground fault at its terminal. Int. Rev. Model. Simul. 2015, 5, 1470–1474. [Google Scholar]
- Stief, A.; Ottewill, J.R.; Orkisz, M.; Baranowski, J. Two Stage Data Fusion of Acoustic, Electric and Vibration Signals for Diagnosing Faults in Induction Motors. Elektron. Elektrotech. 2017, 23, 19–24. [Google Scholar] [CrossRef]
- Contreras-Hernandez, J.L.; Almanza-Ojeda, D.L.; Ledesma-Orozco, S.; Garcia-Perez, A.; Romero-Troncoso, R.J.; Ibarra-Manzano, M.A. Quaternion Signal Analysis Algorithm for Induction Motor Fault Detection. IEEE Trans. Ind. Electron. 2019, 66, 8843–8850. [Google Scholar] [CrossRef]
- Patel, R.A.; Bhalja, B.R. Condition Monitoring and Fault Diagnosis of Induction Motor Using Support Vector Machine. Electr. Power Compon. Syst. 2016, 44, 683–692. [Google Scholar] [CrossRef]
Disclaimer/Publisher’s Note: The statements, opinions and data contained in all publications are solely those of the individual author(s) and contributor(s) and not of MDPI and/or the editor(s). MDPI and/or the editor(s) disclaim responsibility for any injury to people or property resulting from any ideas, methods, instructions or products referred to in the content. |
© 2023 by the authors. Licensee MDPI, Basel, Switzerland. This article is an open access article distributed under the terms and conditions of the Creative Commons Attribution (CC BY) license (https://creativecommons.org/licenses/by/4.0/).