Article

Component Criticality Analysis for Improved Ship Machinery Reliability

by
Abdullahi Abdulkarim Daya
* and
Iraklis Lazakis
Department of Naval Architecture Ocean and Marine Engineering, University of Strathclyde, 100 Montrose Street, Glasgow G4 0LZ, UK
*
Author to whom correspondence should be addressed.
Machines 2023, 11(7), 737; https://doi.org/10.3390/machines11070737
Submission received: 6 June 2023 / Revised: 8 July 2023 / Accepted: 10 July 2023 / Published: 13 July 2023
(This article belongs to the Section Machines Testing and Maintenance)

Abstract

:
Redundancy in ship systems is provided to ensure operational resilience through equipment backups, which ensure system availability and offline repairs of machinery. The electric power generation system of ships provides the most utility of all systems; hence, it is provided with a good level of standby units to ensure reliable operations. Nonetheless, the occurrence of undesired blackouts is common onboard ships and portends a serious danger to ship security and safety. Therefore, understanding the contributing factors affecting system reliability through component criticality analysis is essential to ensuring a more robust maintenance and support platform for efficient ship operations. In this regard, a hybrid reliability and fault detection analysis using DFTA and ANN was conducted to establish component criticality and related fault conditions. A case study was conducted on a ship power generation system consisting of four marine diesel power generation plants onboard an Offshore Patrol Vessel (OPV). Results from the reliability analysis indicate an overall low system reliability of less than 70 percent within the first 24 of the 78 operational months. Component criticality-using reliability importance measures obtained through DFTA was used to identify all components with more than a 40 percent contribution to subsystem failure. Additionally, machine learning was used to aid the reliability analysis through feature engineering and fault identification using Artificial Neural Network classification. The ANN has identified a failure pattern threshold at about 200 kva, which can be attributed to overheating, hence establishing a link between component failure and generator performance.

1. Introduction

Ship operators and onboard maintenance managers face the critical challenge of minimising downtime by ensuring the availability of key ship auxiliary systems that are vital to the correct functioning of other main ship systems. A system such as the power generation system plays such a vital role, be it at sea or in harbour, and like any other functioning system, its correct operation depends a lot on the individual subsystems and components that it is made of [1,2]. Considering that the power generation system provides the most utility of all onboard systems, failures underway or extended downtime can result in adverse consequences, including significant economic and operational losses. Hence, to address these challenges, conducting a system-specific analysis that identifies the most critical components and potential causes of delays, whether technical or logistical, becomes imperative [3].
Moreover, shipping decarbonisation is top on the IMO’s agenda, and it has put in place regulations and guidelines to address emissions generated by marine diesel engines [4]. This implies that regulations such as the sulphur oxides and particulate matter cap of 2010 and the 2050 GHG emissions would see the world’s future fleet having to rely on a broader range of fuels and adopt novel propulsion solutions to efficiently operate [5,6]. Measures in place by the IMO to help ship operators include the Energy Efficiency ship design index (EEXI) and the Ship Energy Efficiency Management plan (SEEMP), as provided in Marine Environment Protection Committee guidelines [5]. The provisions of these guidelines and regulations, such as the Energy Efficiency Existing Ship Index (EEXI) and the Carbon Intensity Index (CII), can only be achieved through more efficient on-board machinery system operations and technology upgrades through retrofits for existing ships and adaptation of new fuels such as ammonia, methanol, and biofuel blends [7,8].
Therefore, it is expected that these new fuels will bring up additional reliability issues [8]. Hence the need to understand how these new fuels and their enabling technologies fit into existing maintenance practises onboard. In this regard, the reliability of systems and failure modes of components will be required to identify which components and failure modes are critical to ship availability going forward. This is especially important considering that machinery failures have been identified as among the major causes of maritime incidents [9]. Moreso, degraded machinery health can be a serious burden on the vessel’s owner and operator due to frequent failures and increased consumption of fuel and lubricants [10]. Nonetheless, most of these challenges can be avoided or mitigated with the right understanding of component criticality, which enables more targeted maintenance strategy adaptation [11,12].
Therefore, in order to ensure the availability of equipment and system reliability, operators require an efficient maintenance approach that can minimise failures and reduce downtime through the life cycle of the asset or machinery. In general, ships are supplied with maintenance plan-based schedules drawn from the original equipment manufacturer’s (OEM) operating manual. These initial documents can help with routine checks and maintenance, especially when most systems are new. However, operating conditions such as climate, operating profile, technical capacity, and availability of genuine spare parts and other consumables such as fuel and lubricating oil could invalidate the initial as-supplied maintenance plan or approach [13].
In this regard, there are different approaches to establishing component reliability and enabling a maintenance approach that can ensure efficient life cycle management and improved system reliability while respecting all climate regulations [14]. Existing traditional maintenance approaches and the flexibility afforded by the development of sensor technology, as well as insights gained through data analysis, can provide an efficient solution to challenges in ship maintenance [15]. Similarly, the combined use of reliability analysis tools and machinery health monitoring data can help with the early detection of failures in equipment [16,17]. Accordingly, this research paper considers component criticality as it impacts ship maintenance and system reliability. Therefore, the paper is presented in five sections: Section 1 includes an introduction to the topic, while the critical literature review focusing on component criticality analysis is presented in Section 2. The methodology for developing a novel hybrid framework addressing ship system reliability and criticality analysis is presented in Section 3, while Section 4 presents a case study on marine diesel power generation plants. Finally, Section 5 includes the results and discussion, which are followed by the conclusions in Section 6.

2. Critical Literature Review on Component Criticality Analysis

According to Marvin [18], the reliability of a system is equal to the product of the reliability of the individual components that are included in the particular system; thus, the higher the number of components in a system, the more complicated it is to ensure its reliability. On the other hand, a system is defined as a collection of components that interact with each other to achieve a common goal; hence, any dysfunction in one or more components could impact the ability of an equipment or system to operate properly [18,19]. In this regard, calculation methods such as mean time to failure (MTTF), used for discrete events, and mean time between failures (MTBF) for continuous events, as well as failure rates (λ), have been extensively used to calculate equipment reliability or availability for the purpose of maintenance planning [20,21,22]. These measures provide maintenance planners with estimates on machinery reliability but not enough information to understand the course of failure and related impacts [23]. Accordingly, additional tools using failure probability analysis or statistical measurements are employed so that failure and courses of failure can be attributed to particular components in machinery [12,20,24,25].
System reliability analysis has historically aided maintenance planning since the advent of organised maintenance approaches that evolved from the breakdown of simple machines to condition monitoring-based predictive analysis [26,27]. In this regard, the evolution of maintenance strategies to prioritise certain maintenance actions can partly be attributed to advances in reliability analysis that enable an understanding of how component failure contributes to equipment availability [28,29]. On the other hand, risk and criticality are increasingly taking centre stage in equipment maintenance, especially in industries where human casualties or environmental pollution are priorities; hence, more focus is placed on the safety of operations and system reliability [30,31]. Consequently, authors have provided in-depth research regarding the application of reliability analysis tools in various industries. A criticality-based maintenance plan for coal power plants using Failure Mode Effect and Criticality Analysis (FMECA) to drive Risk Priority Number (RPN) aimed at identifying critical components in the plant to help with spare parts sourcing and reduce unscheduled shutdown was presented in [32]. System reliability analysis using tools such as Fault Tree Analysis (FTA) and Failure Mode Effect and Criticality Analysis (FMECA) has found wide application in the nuclear industry, especially in the energy sector [33]. Similarly, a great deal of research has been performed in the maritime sector on the use of reliability tools to improve safety, reduce risk, and achieve reliability for ships and offshore wind turbines [22,24,34].
The adoption of new technologies by ship operators, such as onboard diagnostics, intelligent sensors, and the internet of things (IoT), has enabled the implementation of remote monitoring and digital twin technologies. These technologies greatly help in system maintenance delivery and planning through automation and remote sensing, enabling real-time condition monitoring and possible early intervention. Consequently, this helps reduce crewing levels, reduce maintenance costs, and improve climate-friendly ship operations [35]. Moreover, the ISM code as contained in IMO [36] mandates operators develop processes to identify ship equipment whose sudden failure could lead to hazardous situations. Furthermore, industry regulations have initiated the introduction of advanced technologies that would require ship operators to adopt additional reliability measures [37,38]. Likewise, Classification Societies require ships to have standard maintenance documentation and strategies prior to acquiring Class qualification [39,40]. Hence, the adoption of tools such as FTA, Reliability Block Diagrams (RBD), Event Tree Analysis (ETA), Failure Mode Effect Analysis (FMEA), and other variants has been proposed to ensure the establishment of robust maintenance regimes.
It is therefore critical that researchers adopt hybrid approaches that combine a number of reliability tools in order to overcome some of the inherent deficiencies of individual tools or take advantage of other tools flexibility and depth of application, as shown in [20,41,42]. Establishing component criticality to aid maintenance planning is a key aspect of maintenance strategy implementation. For instance, [43] presented a combination of FMEA and FTA tools for critical component identification in order to increase ship machinery availability. A combination of reliability tools and ANN was used to develop predictive condition monitoring [15,44], which shows the competitive flexibility that can be driven due to the use of reliability tools and numerical methods in system reliability analysis. The criticality of a system, component, or event in FMEA is derived by the use of RPN [18,45]. Reliability analysis tools examine the risks of failures by considering quantitative and qualitative aspects. In this case, the selection of tools for reliability analysis depends on factors such as the depth of analysis intended, the system to be analysed, the type of data (qualitative or quantitative), the objective of the analysis, tool availability, the availability of computing resources, and the interaction between systems and/or components. Other factors include tool characteristics, i.e., inductive or deductive-based analysis [18,46]. Additionally, research gaps in the literature provide another important factor in the selection of tools for reliability analysis; therefore, additional research work is needed to identify a better or more efficient way of conducting similar analysis. In doing so, tools are assessed based on their strength or compatibility with the research at hand. Some of the notable reliability analysis tools include ETA, FTA, Dynamic FTA (DFTA), FMEA, FMECA, and Bayes’ Theorem presenting the Bayesian Belief Networks (BBNs) [20]. The strengths and weaknesses of these tools are presented in Table 1.
In Table 1, the tools presented share several futures that are important for reliability or risk analysis. Some of these similarities include the visualisation of component or event interactions in a system, the use of failure rates or probability as input data, the reliance on expert knowledge for model quality, and the prediction of system reliability [47]. In this regard, the choice of tools by researchers in reliability analysis can be influenced by the strengths and weaknesses of the available tools as well as the identified gaps in research methodology or application in a certain field [46]. Nonetheless, the motivation is not only to fill the existing research gap, as authors must provide the level of scrutiny required to meet certain standards in addition to the fact that the methodology can be replicated using different sets of data or systems. Accordingly, the methodology presented in this paper utilises the analytic logic in DFTA to present temporal and functional dependencies of events depicting component failures and the numerical analysis in ANN to identify patterns in the data that represent machinery health. Hence, these two tools were used to develop a component criticality and fault identification framework for ship system and machinery maintenance planning.

2.1. Dynamic Fault Tree Analysis (DFTA)

Dynamic fault trees use all the structure and logic of the static fault tree except for the addition of dynamic gates such as the Priority And (PAND), Functional Dependency (FDEP), Sequence Enforcing (SEQ), and Spare gate [48,49]. The PAND gate models a system failure or an undesirable event in order of occurrence from left to right, such that the left-most event occurs before the next event can take place. An example can be seen in the series of fuel filters in that a secondary filter downstream of the primary filter gets clogged only when the primary filter malfunctions. The SEQ gate, as the name suggests, models events in a constrained manner from left to right, such that an event occurs only if the event before it has occurred. In this regard, the SEQ differs from the PAND gate due to the constrained nature of failure occurrence and can be especially useful for modelling close-loop systems with feedback failure, such as in the bilge eductor in the bilge system, whereby pressure drop at any point in the system affects the entire piping network. The FDEP behaves in a slightly different manner compared to PAND and SEQ gates in that it takes into consideration the function of the system or component and resulting failure, for instance, the failure of a thermostatic valve that results in overheating of a heat exchanger that can be caused by a leakage in the system.
The Spare gate has some special futures, unlike the other gates, especially in modelling redundancy in system reliability or failed standby equipment. Spare gates consider only spare events as input, with the left-most events being the active or primary events [29]. All other spare events after the primary events are alternative inputs and have a varying degree of influence based on the dormancy factor, which is between 0 and 1 [48]. The dormancy factor indicates how active the spare event is, with 0 being a cold spare and 0.1 to 0.9 being a warm spare. In this regard, a failed spare is replaced by the next most active spare from left to right; a spare gate fails only when all the spare events have occurred, i.e., failed. Therefore, this makes it very relevant in analysing system improvements as presented in [13,50]. Therefore, these additional gates have provided more scope for DFT analysis [49,51], which can be used to factor repairs or improvements due to routine maintenance. Moreover, additional outputs such as reliability importance measures and minimal cut sets in the DFTA are equally influenced by the logic structure of the developed model. In that case, the output of a static FT and a dynamic FT would be significantly different and reflective of whatever dependencies exist in the model when considering functional dependencies and the sequence of failures or events.

2.2. Reliability Importance Measures (IMs)

Reliability Importance measures assist in identifying the event that, if improved, is most likely to produce a significant improvement in equipment or system performance [22,52]. In essence, the evaluation of IMs helps the operators, maintenance crew, and administrators, including regulatory agencies, prioritise actions that could result in improvements in equipment/system reliability. Among the commonly used IMs are the Birnbaum (Bir), Fussell-Vesely (F-V), and Criticality (Cri) ones. The Bir IM evaluates the occurrence of the top events based on the probability of basic events occurring or not occurring; hence, the higher the probability of basic events, the higher the opportunity for a top event to occur [53]. Criticality (Cri) IM is calculated in a similar way to Bir IM except that it compares the probability of the occurrence of the basic event to the probability of the occurrence of the top event. On the other hand, the F-V calculation adopts an entirely different approach in that it uses the minimal cut set summation, i.e., the minimum number of basic events that contribute to the top event. Therefore, the F-V IM considers the contribution of the basic event to the occurrence of the top event, irrespective of how it contributes to the failure. The Bir IM and Cri IM were considered in this research; however, comparing the two measures, the Bir IM is more reflective of the component’s criticality as modelled.
System reliability analysis using a combination of tools, including DFTA, was conducted on a set of four marine DGs, where the reliability IMs were used to identify critical components on marine DGs to improve maintenance delivery [43]. Reliability IMs are equally used for analysis, especially on safety-critical systems where components are critical to the safe operation of such systems [54,55]. Using Risk Achievement Worth (RAW) and Risk Reduction Worth (RRW) [33] introduced a methodology that can be applied to measure power distribution network criticality. Similarly, importance measures can be used to help improve overall understanding of either the weakest component or the most reliable component in a system so that maintenance planners are able to balance their efforts. Moreover, when components have been identified as critical or related to a failure that can be high-risk, maintenance planners are able to provide remedial plans against sudden failures or ensure sufficient quantities of spare parts are held in stock [56]. The Bir IM, as highlighted earlier, measures the contribution of the most critical component to the occurrence of the top event, thereby helping to clearly identify what component needs improvement. In this regard, researchers have adopted Bir IM to enable the identification of critical system failures to avoid catastrophic failures like crankcase explosions in diesel engines [57,58]. DFTA has equally been combined with other tools to achieve additional research goals, such as decision support or analysis requiring some level of subjective input [59,60]. Moreover, scrutiny in machinery health condition monitoring due to emission regulations and improved sensor capability, including autonomous shipping, has led to the application of machine learning-based tools for diagnostics and prognosis analysis [15,61], combining in some cases DFTA and other tools [13,16].

2.3. Artificial Neural Networks (ANNs)
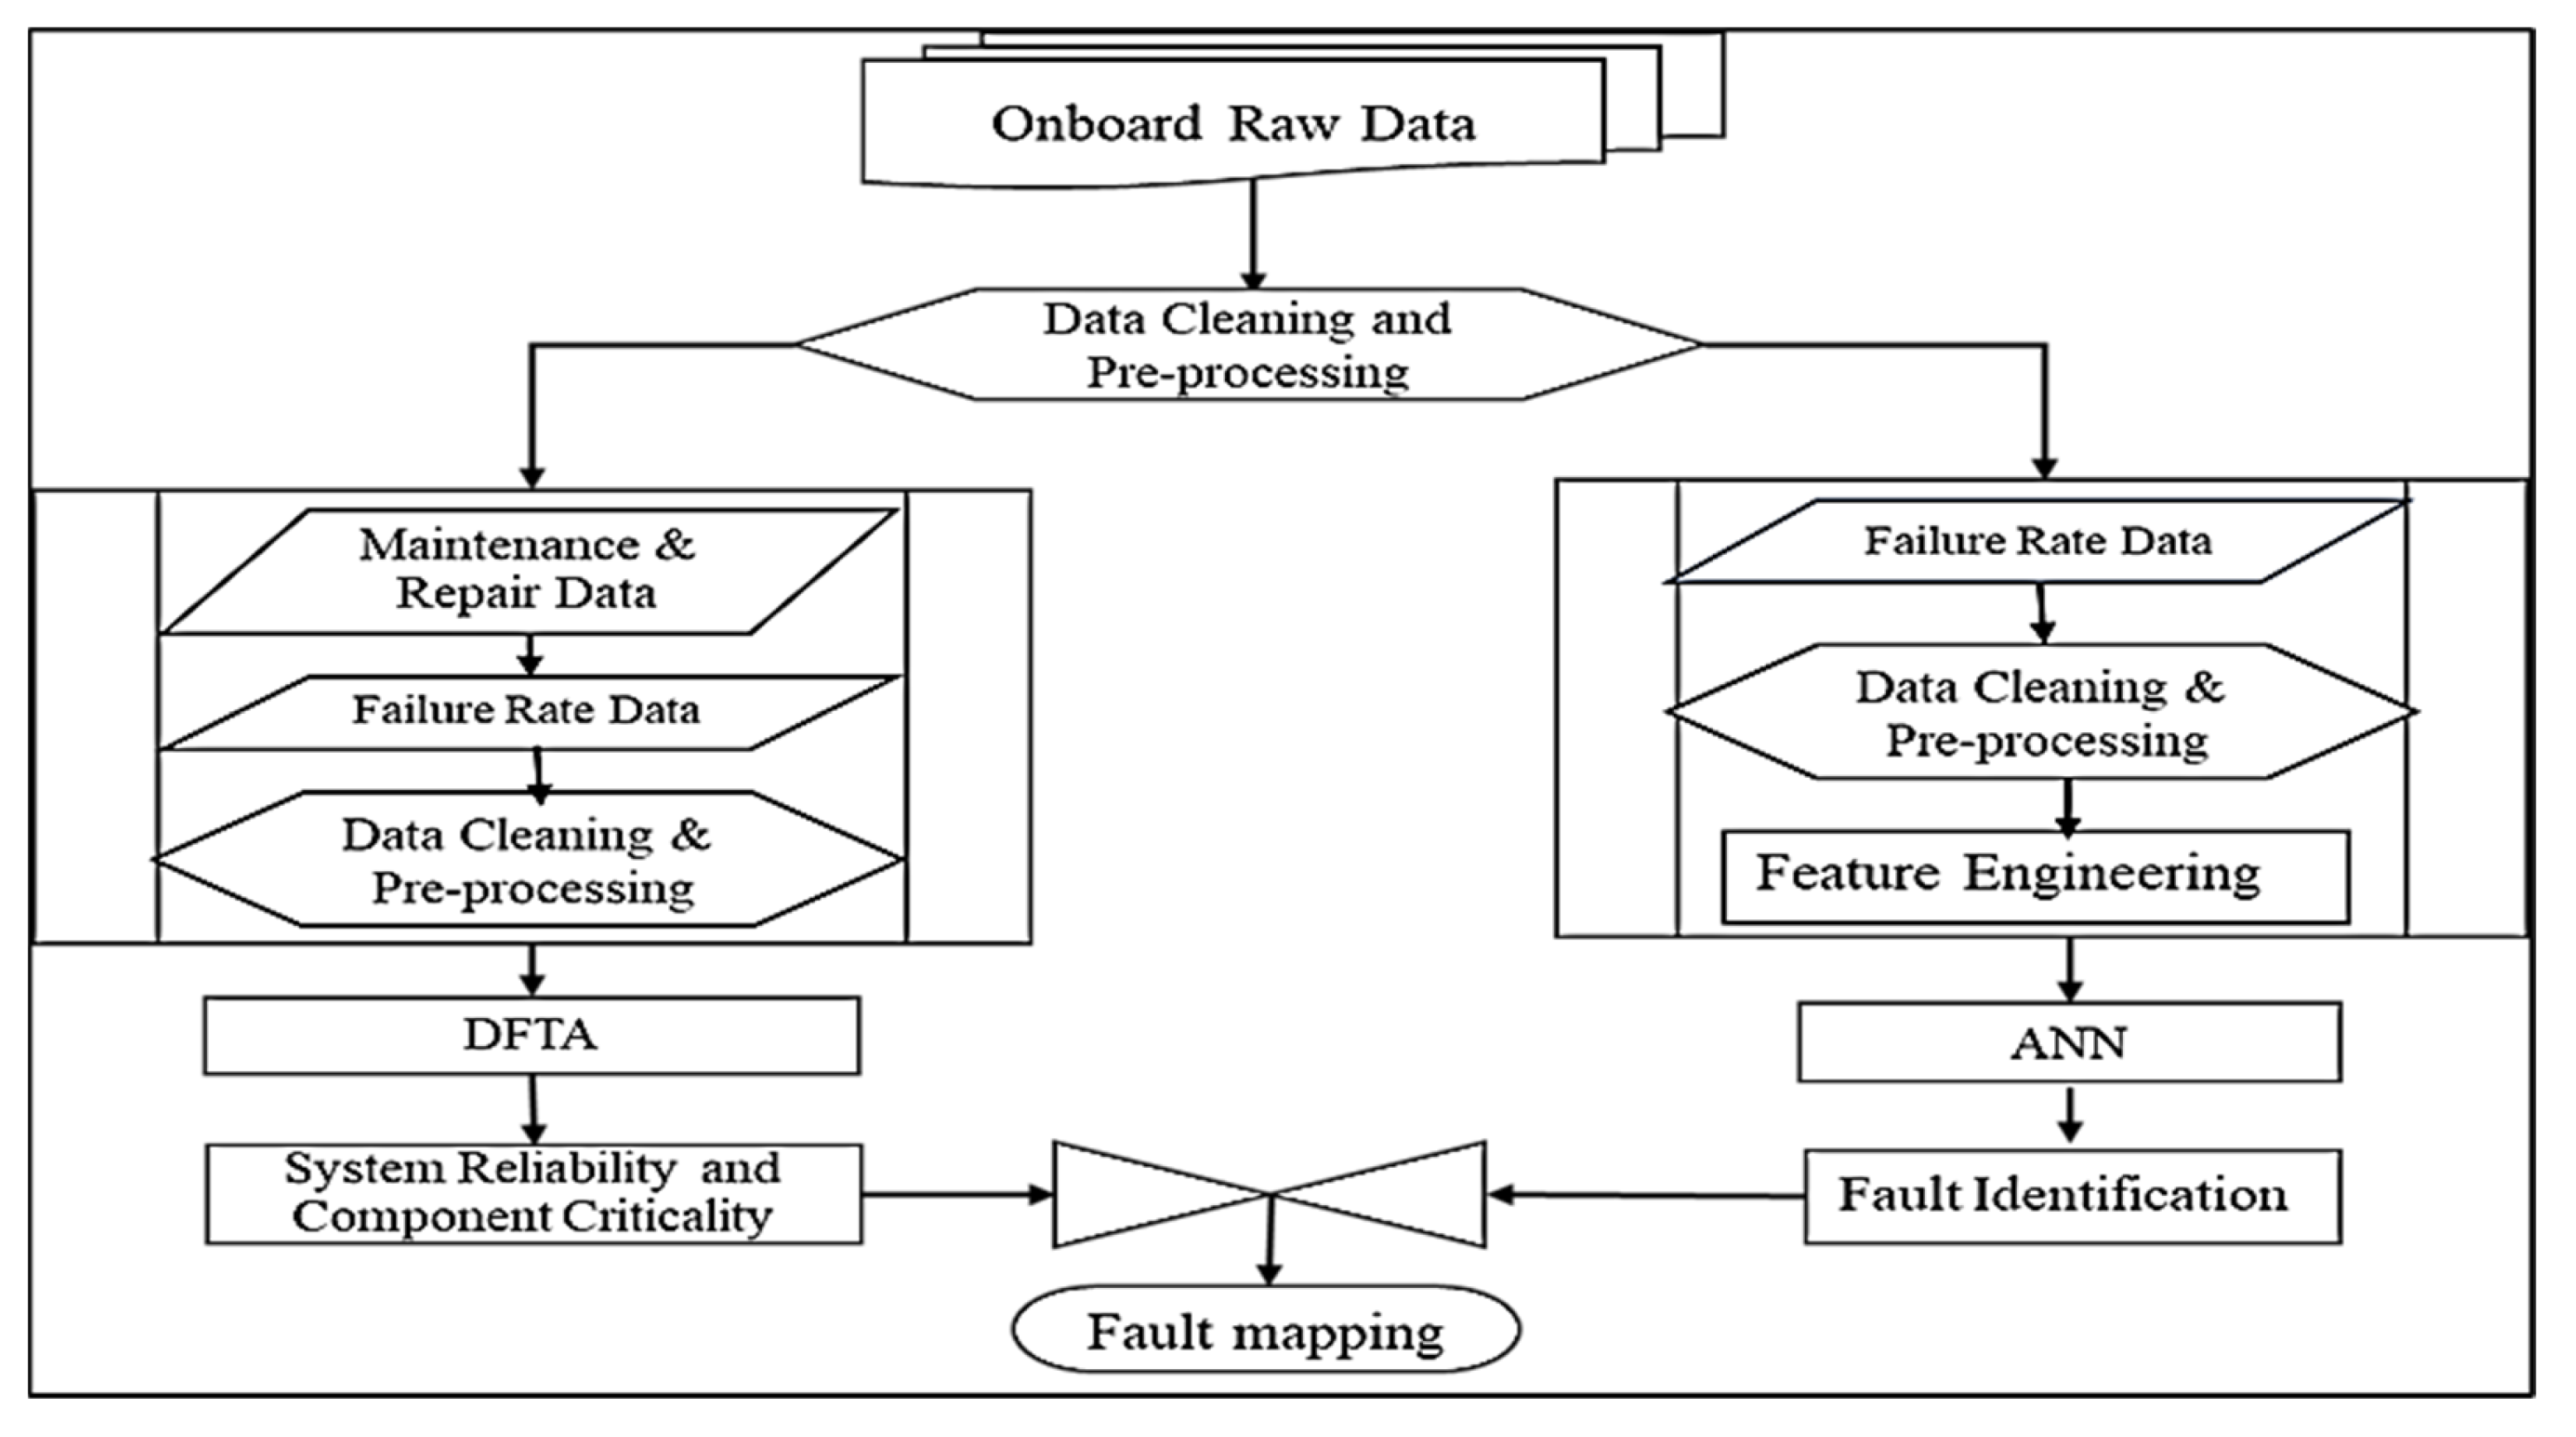
In general, there are two types of machine learning approaches: supervised and unsupervised learning [62,63]. The supervised machine learning is used to train a model using labelled data; that is, the features to be looked out are already known, and the algorithm is trained to look out those features in the input data [10]. On the other hand, unsupervised learning deals with unlabelled data, which means the algorithm will identify the unique features in the data and partition it accordingly [64,65]. Unsupervised learning is useful for exploring data in order to understand the natural pattern of the data, especially when there is no specific information about significant incidents in the data that can easily point to fault indicators [66].
ANNs have been applied in the field of maintenance for machinery health analysis and prediction of machinery conditions by various authors. Therefore, following on the existing success and procedures in the use of ANN for machinery data analysis, this research will employ ANN for fault classification and detection, fault/condition prediction, and machinery remaining useful life analysis. In a research paper presented by [52], an ANN approach for fault detection is combined with FTA to identify critical components of diesel generators. In some cases, machinery fault data are recorded without identifying the fault signals; therefore, this requires data clustering [67]. Clustering is a form of unclassified machine learning that is applied to machinery diagnostics [10]. The advantages of using clustering models are that they help identify possible clusters as well as the most influential clusters in the data. In research, ANN Self-Organising Maps were used for clustering of machinery log data from DG. SOM consists of a competitive layer that can classify a dataset of vectors with any number of dimensions as the number of neurons in the layer and is good for dimensionality reduction, as presented in [44].
Accordingly, ANNs are widely employed for multiple tasks such as clustering, forecasting, prediction, pattern recognition, classification, and feature engineering [68]. The use of ANN and Regression techniques was employed to estimate vessel power and fuel consumption, and the model was able to predict the actual vessel fuel consumption in real time [69]. The use of ANN for fault classification has been employed by [44,70,71]. Using a self-organising map, an ANN clustering algorithm analyses the health parameters of a marine diesel engine, looking at exhaust gas temperature, piston cooling outlet temperature, and piston cooling inlet pressure. Therefore, the performance of ANN in prediction and classification, as reviewed in [72,73,74], was presented as good in handling nonlinear high-dimensional data with fewer data sets [74]. In this regard, to build on the success of ANN, this work will apply the use of ANN to labelled data for diagnostic analysis on four sets of marine diesel generators. Therefore, the feedback from the ANN is used in combination with the reliability analysis output to identify the dominant faults and most affected components.
In view of the foregoing, several authors and researchers have made efforts in the application of DFTA, ANN, and other data-driven approaches for reliability and fault identification [15,44,75]. Nonetheless, there still exist some gaps in the application of DFTA for criticality analysis, especially when using the Bir IM to identify critical component failures. On the other hand, ANN and other machine learning approaches have been widely used in system diagnostics and fault identification [65,71,74], but their combination with DFTA criticality analysis with a view to identifying fault-related component failures requires further investigation. Moreover, in this research, a methodology was developed to apply the combination of DFTA and ANN fault identification to MDGs based on component criticality to improve ship operational availability. Furthermore, future engineering based on correlation analysis using power output as an independent variable to identify the most sensitive variables to performance alterations was presented. Therefore, this methodology presents an efficient approach to system reliability and fault detection analysis with the potential to be applied to an individual ship or fleet of ships.

3. Methodology

The presented methodology provides a holistic hybrid maintenance strategy to cover the entire ship system in a manner that enables flexibility in assigning component maintenance priorities or scheduling. In this regard, this research methodology utilises the combined strength of reliability analysis tools for system reliability and criticality while using ANNs for diagnosis and fault prediction. The combination of systems onboard ships makes it unsuitable to have a single approach to maintenance. This is more so when additional consideration is given to ship operators in developing countries where access to technology and original equipment manufacturers is limited and, in some cases, restricted. Often leading to extended downtime for some critical on-board equipment, which is usually ignored in most analyses. In this regard, the methodology provides an efficient approach to component/equipment failure and degradation analysis. This is because the nature of failure and equipment performance degradation depends on component, equipment, or sub-system, hence resulting in the need to consider multiple analysis tools to enable a more efficient and flexible methodology. Figure 1 shows the overall methodology of the research.
Therefore, a data collection campaign was conducted in order to access maintenance, repair, overhaul, and machinery log data for onboard machinery systems from a case study ship. Using this data, the failures in the diesel generator system and machinery subsystems were analysed to understand the course of failure, identify the most critical components, and provide possible ways to improve onboard maintenance. The process of the research involved the collection of machinery data from an Offshore Patrol Vessel (OPV), which was then analysed to generate outputs relevant to machinery health performance indicators. The research has three broad areas that are used as inputs or in combination to analyse the condition of machinery health, as shown in Figure 2, and include data collection and processing, system reliability analysis using DFTA, and fault detection using ANNs.

3.1. DFTA Analysis

The static FTA procedure is based on Boolean law by applying gates and events to describe faulty components and possible events that could develop a fault [49]. FTA is an important tool for reliability and risk analysis as it provides critical information used to prioritise the importance of the contributors to the undesired event, i.e., fault or failure. However, static FTA has some shortcomings to do with sequence dependencies, temporal order of occurrence, and redundancies due to standby systems. Therefore, DFTA, with the addition of four gates and one basic event, has provided a much more flexible way of modelling faults/failures in complex systems with respect to sequence and dependencies, which means the temporal order of the occurrence of events is important to analysis. The DFTA analysis, in addition to the system reliability, also provides additional outputs, namely, the reliability importance measures and the minimal set.
The reliability importance measures (IM) are used to identify the most critical component/situation that contributes to the occurrence of the low/basic event leading up to equipment failure or top event occurrence [48], while the minimal cut set is the set of events that cause the top event to occur. A minimal cut set (MCS) is the smallest set of events that, if they all occur, cause the top event to occur [48]. Moreover, IM provides more details on components, i.e., part failure criticality, while MCS provides more details on faults that could impact a component. The Bir IM measures the rate of system reliability due to an upset in the reliability of a single component, sub-system, or system. Therefore, the Bir IM is defined as the partial derivative of the system reliability with respect to the component reliability multiplied by the reliability of the component in Equation (1) [18]. Similarly, Relex [48] described the Br IM as the measure of the increase in probability of the top event due to the occurrence of event A, Equation (2). Equation (1) is relevant for analysing system or global criticality, while Equation (2) solves for local or sub-system-level component criticality.
I B i t = y p t p i t = h 1 i , p t h 0 i , p t
where
IB(i|t) = Birnbaum criticality at time t;
h (1i, p(t)) = system reliability when the system is functioning;
h (0i, p(t)) = system reliability when the system has failed.
subscripts: i = component whose reliability is being measured;
p = probabilty of the failure of component i;
y = top event being measured.
l i B A = P X A P X ~ A  
where
l i B A = Birnbaum importance measures for event A, component i;
A = the event whose importance is being measured;
~ A = the event did occur;
X = top event;
P = probability of the event occuring.

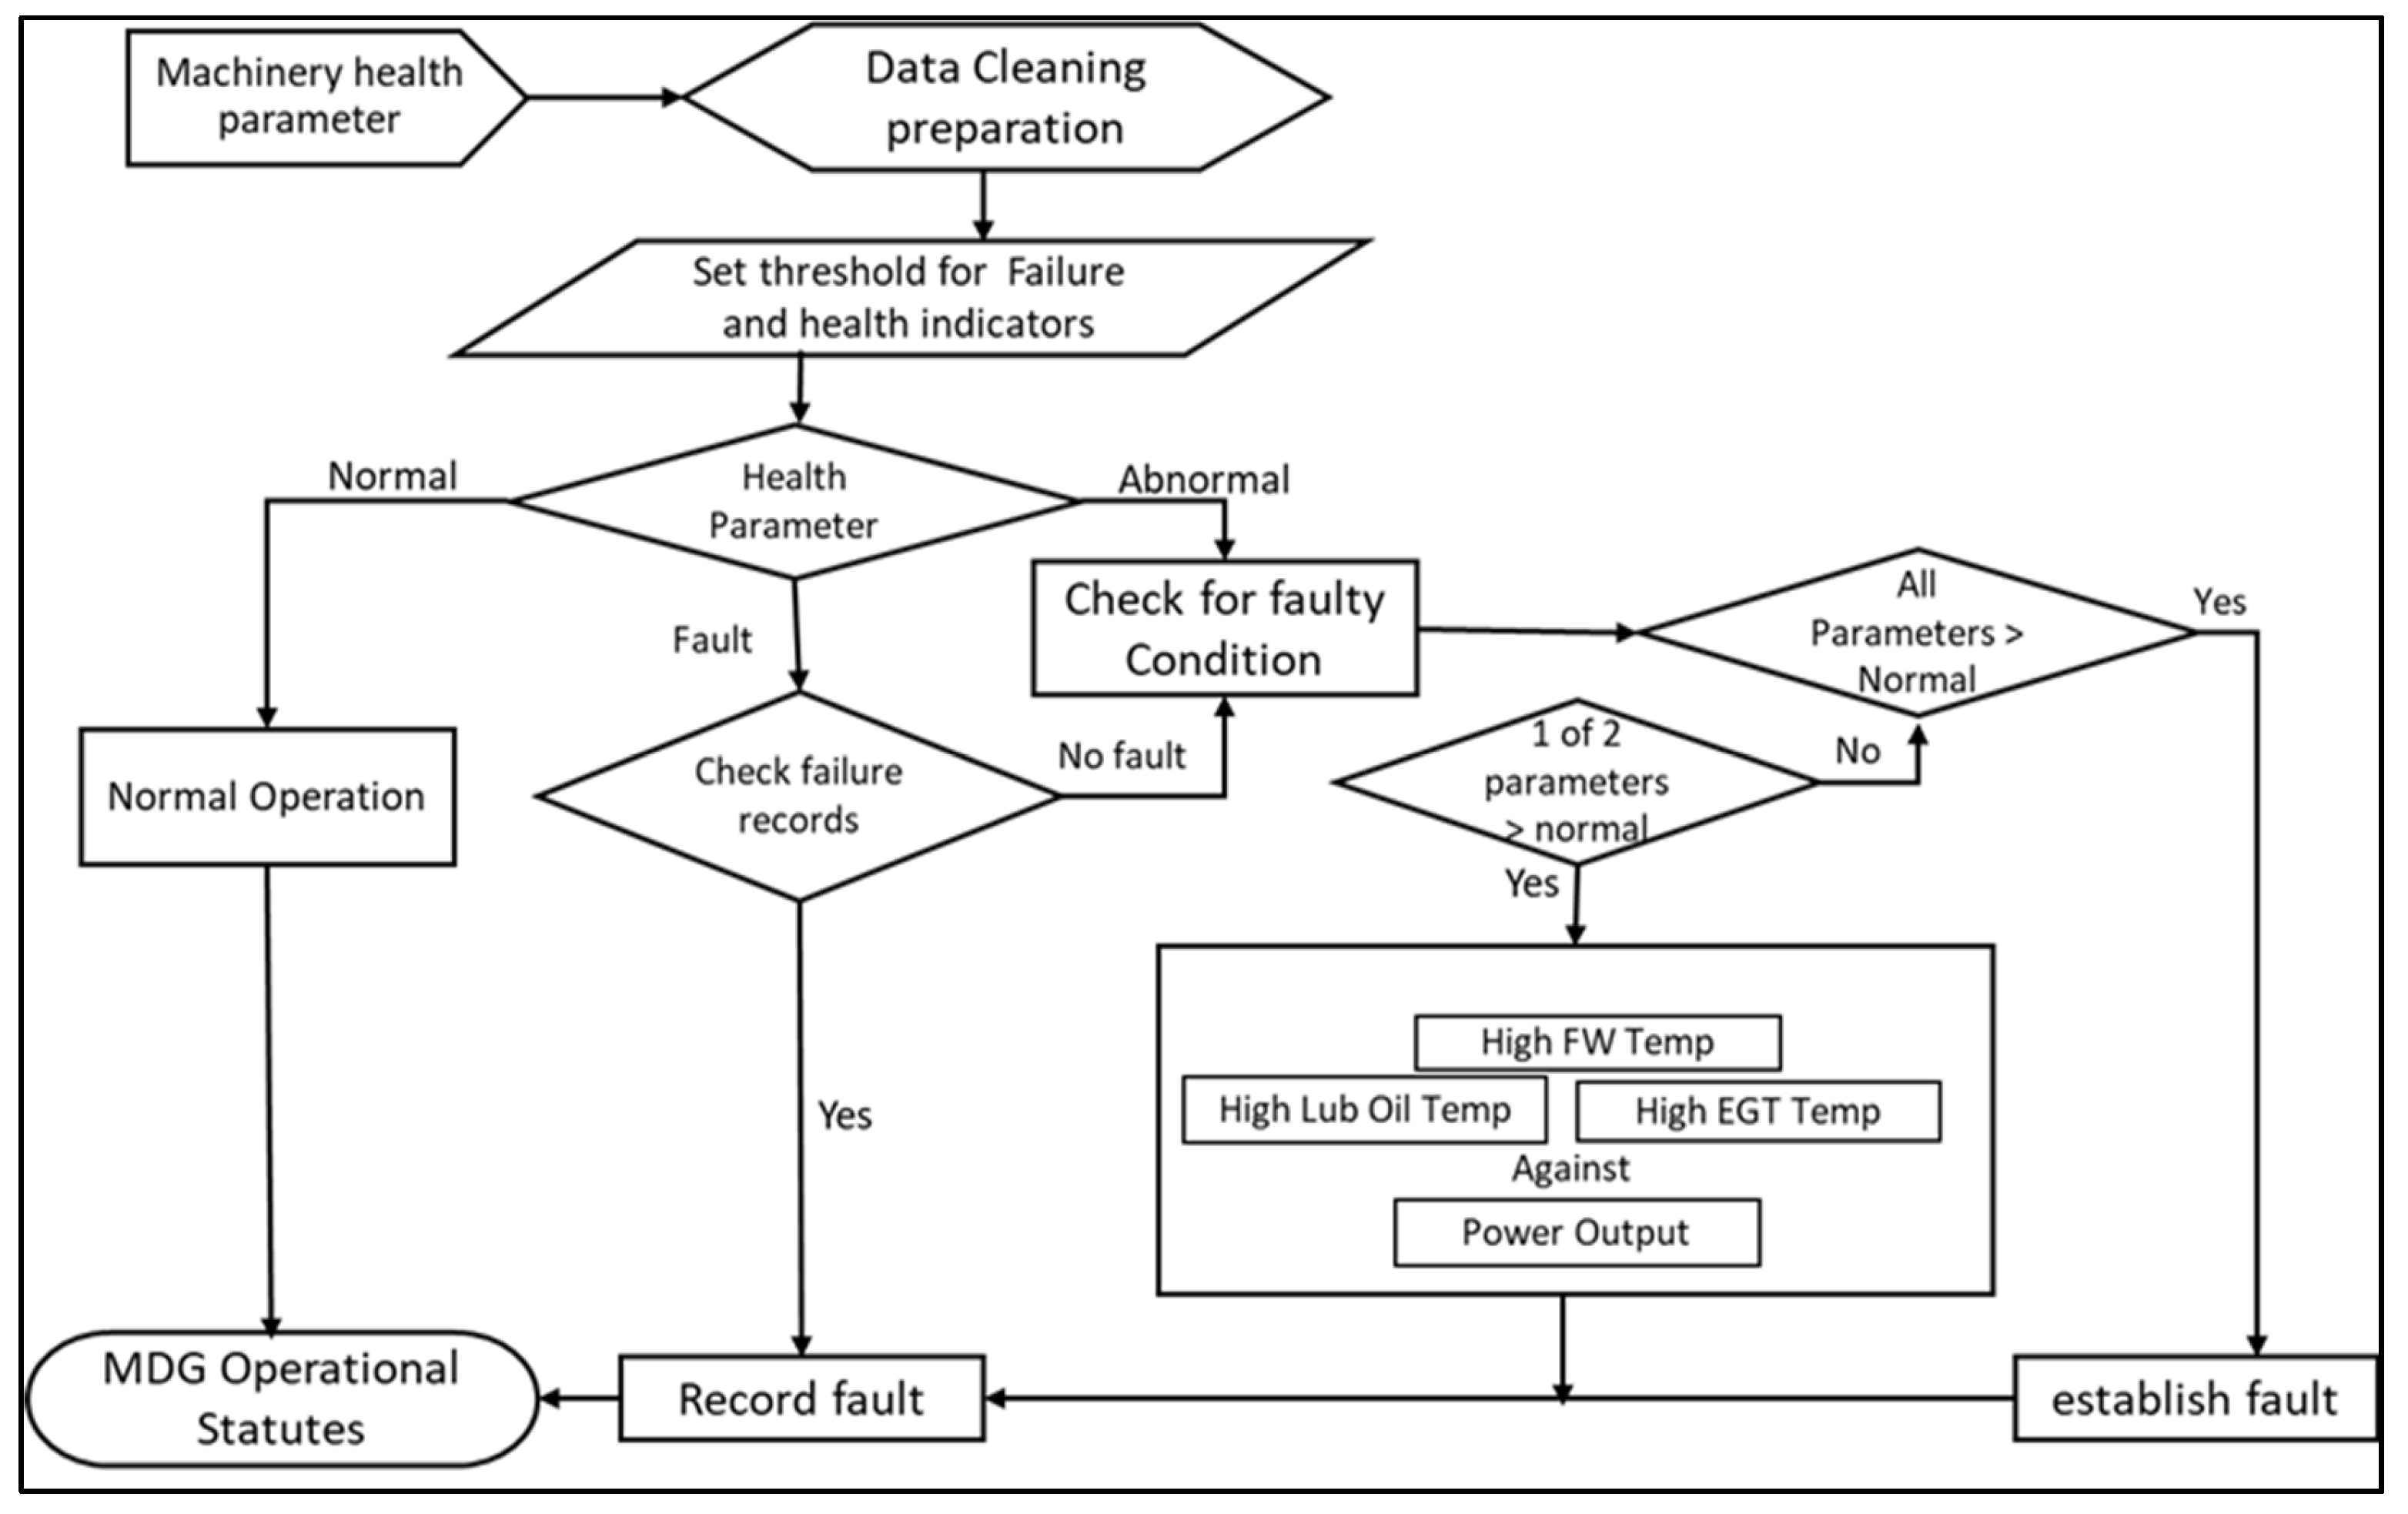
3.2. ANN Fault Identification

ANNs have been applied in the field of maintenance for machinery health analysis and prediction of machinery conditions by various authors. Therefore, riding on the existing success and procedures in the use of ANN for machinery data analysis, this research will employ ANN for fault classification and detection. The analysis involves recognising patterns in the data that indicate the presence of variations pointing to a change in the normal health parameters of the system or machinery of interest. A supervised ANN feedforward neural network was implemented for the classification analysis. Feedforward ANN is a time series algorithm that can be used for both function fitting and pattern recognition [76]. Feedforward networks usually have single or multilayer hidden sigmoid neurons followed by a series of output neurons. Multiple layers of neurons with nonlinear transfer functions enable the network to learn nonlinear relationships between input and output vectors [77].

3.3. Data Labelling

Following the above analysis, the data was labelled to identify faults and operating conditions for machine-learning purposes. Therefore, considering that there was no actual indication of faulty data from the operators’ log, the research relied on expert knowledge and the operators’ recommendations on data alarm limits to form the basis of fault identification and also provided the lower and upper acceptable operating limits for the diesel generator.
The fault class label for the diagnostic analysis was derived based on the labels as well as additional information from the failure data. The failure data was used to compare start-stop times and corresponding incident reports, which sometimes gives some valuable information regarding log readings. In this regard, a nested IF—ELSE analysis was conducted to get the fault class and operating temperature condition; the process is illustrated in Figure 2.
A two-layer feedforward network with sigmoid activation and SoftMax output neurons was adopted for the study based on Equation (3). The sigmoid activation function, Equation (4), helps to improve the prediction capability of the neurons by adding bias and non-linearity, while the SoftMax activation function, Equation (5), is a probability function with values between 0 and 1. The most likely probability being 1, and vice versa. Both sigmoid and SoftMax are used for classification problems, and they help improve the model’s capability [68].
y k   x , w = σ   j = i M w 2 k j h i = 1 D w 1 j i + w j 0 1 + w k 0 2
σ x = 1 1 + e x
e x p a k j e x p a j  
The above methodology, while focused on component criticality, provides a viable pathway that can be used to address carbon emissions due to shipping. This has in mind that the existing ships using Marine Gas Oil (MGO) or Low Sulphur Fuel Oil (LSFO) will continue to participate in the trade. Furthermore, regional marine areas with low incomes are likely to continue using engines that do not fully comply with MEPC76 regulations [5]. Hence, the approach in the research can help bring awareness as regards maintenance actions that are vital to engine emissions; on the other hand, the aspects of spare parts procurement and maintenance contract management all have additional factors that contribute to ship emissions. Therefore, the criticality analysis will identify pathways through which failures or partial failures contribute to emission, while ANN fault identification will help link the failures to the wider subsystem beyond the components. Moreover, not only are common cause failures not a strong point of DFTA, but the data requirement of DFTA only needs reliability indicators, while the ANN uses machinery health indicators. This way, the methodology will provide much-needed insight on how to use MDG component criticality and health parameters to address aspects of ship emissions.

4. Case Study

In order to apply the methodology presented above, a case study is conducted using data from the power generation system (PGS) of an OPV, which is mainly engaged in patrol duties typically lasting 3–4 weeks at sea while also spending 2 weeks in harbour. The PGS is equipped with 4× MDGs rated at 440 Volts, 60 Htz, 3 phases, and 400 kW; hence, there is no provision for an emergency MDG. All MDGs can operate individually and in parallel during high load demands or as required. These MDGs are the primary source of power to the ship both at harbour and at sea, except occasionally when the ship is at her home port, where she receives shore power supply. Therefore, considering that the MDGs are always in use, with average monthly usage exceeding 100 h per generator, it becomes important to ensure their availability while efficiently putting in place a maintenance strategy that considers the environment. In this regard, failure rate data over a period of six calendar years was obtained from the maintenance records and used as input for the DFTA analysis. A summary of the failure rates for the four MDGs is shown in Table 2.
Therefore, using the failure rate data, a DTFA model was built to represent all four MDGs in the PGS, as shown in Figure 3. A detailed sub-subsystem DFTA for one of the MDGs is presented in Figure 4.
An ANN fault detection model using a feedforward neural net was built to provide further details as regards the major courses of failure and how they can be related to an increase in emissions. Moreover, one of the goals of maintenance planning is to improve efficiency both in spare parts holding and the procurement process. Therefore, using the ANN would help identify faults that can be linked to the identified critical components. The available data obtained from the four diesel generators consisted of eight parameters from eleven sensors: (1) Generator Speed; (2) Lubricating Oil Pressure; (3) Fresh water temperature bank A; (4) Fresh water temperature bank B; (5) Fresh Water Pressure; (6) Lubricating oil temperature; (7) Exhaust gas temperature bank A; (8) Exhaust gas temperature bank B; (9) Generator running hours; (10) Generator Power Output; and (11) Datetime, as shown in Table 3, are a list of diesel generator parameters and their limits. In all, there are nine parameters collected for analysis; however, based on preliminary analysis, five parameters have shown strong correlation in the data pre-processing analysis. The application of ANN in research is mainly related to fault (anomaly) classification.

5. Results and Discussion

Maintenance onboard ships is influenced by important factors such as MTTF, MTBF, and MTTR, as well as failure rate data. These factors have been used in literature to help shape maintenance planning and scheduling. However, additional factors such as the number of man hours required to carry out the task and the level of qualification needed for certain tasks are important considerations. No doubt, these factors are universally applicable in all areas of maintenance planning, irrespective of industry or geographical location. Some factors that are common in developing countries but usually do not exist in other developed areas are delays in spare parts availability, OEM warranty restrictions, and OEM technology control. These factors play a key role in maintaining constraints in countries with low technology penetration, which makes it difficult for the major OEMs to establish strong representation.

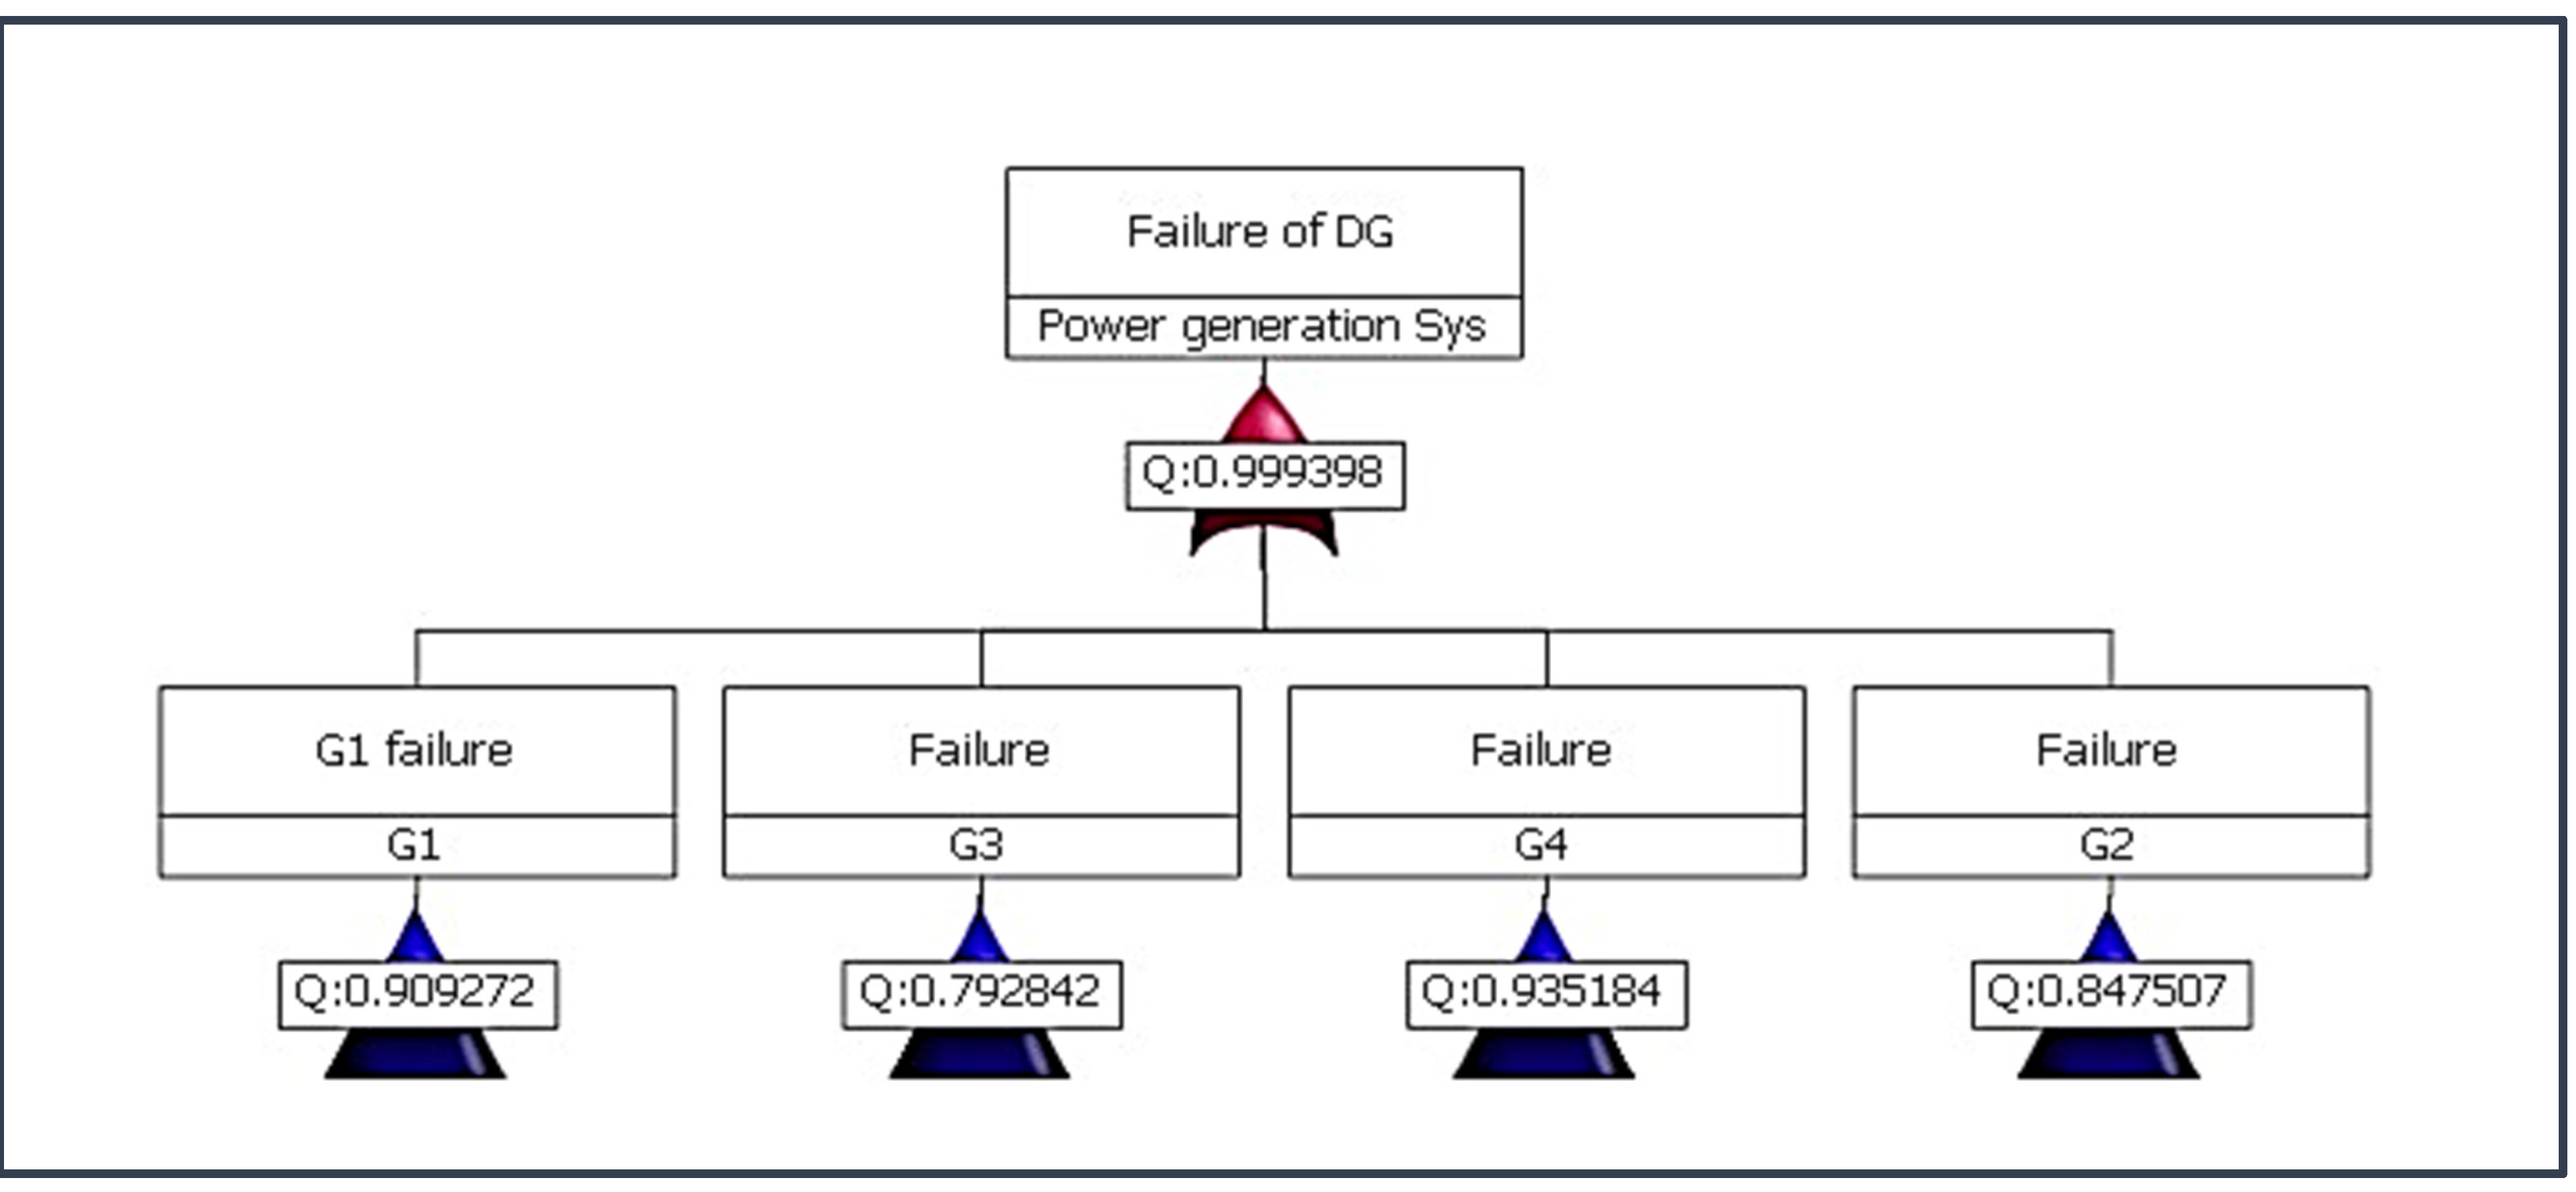
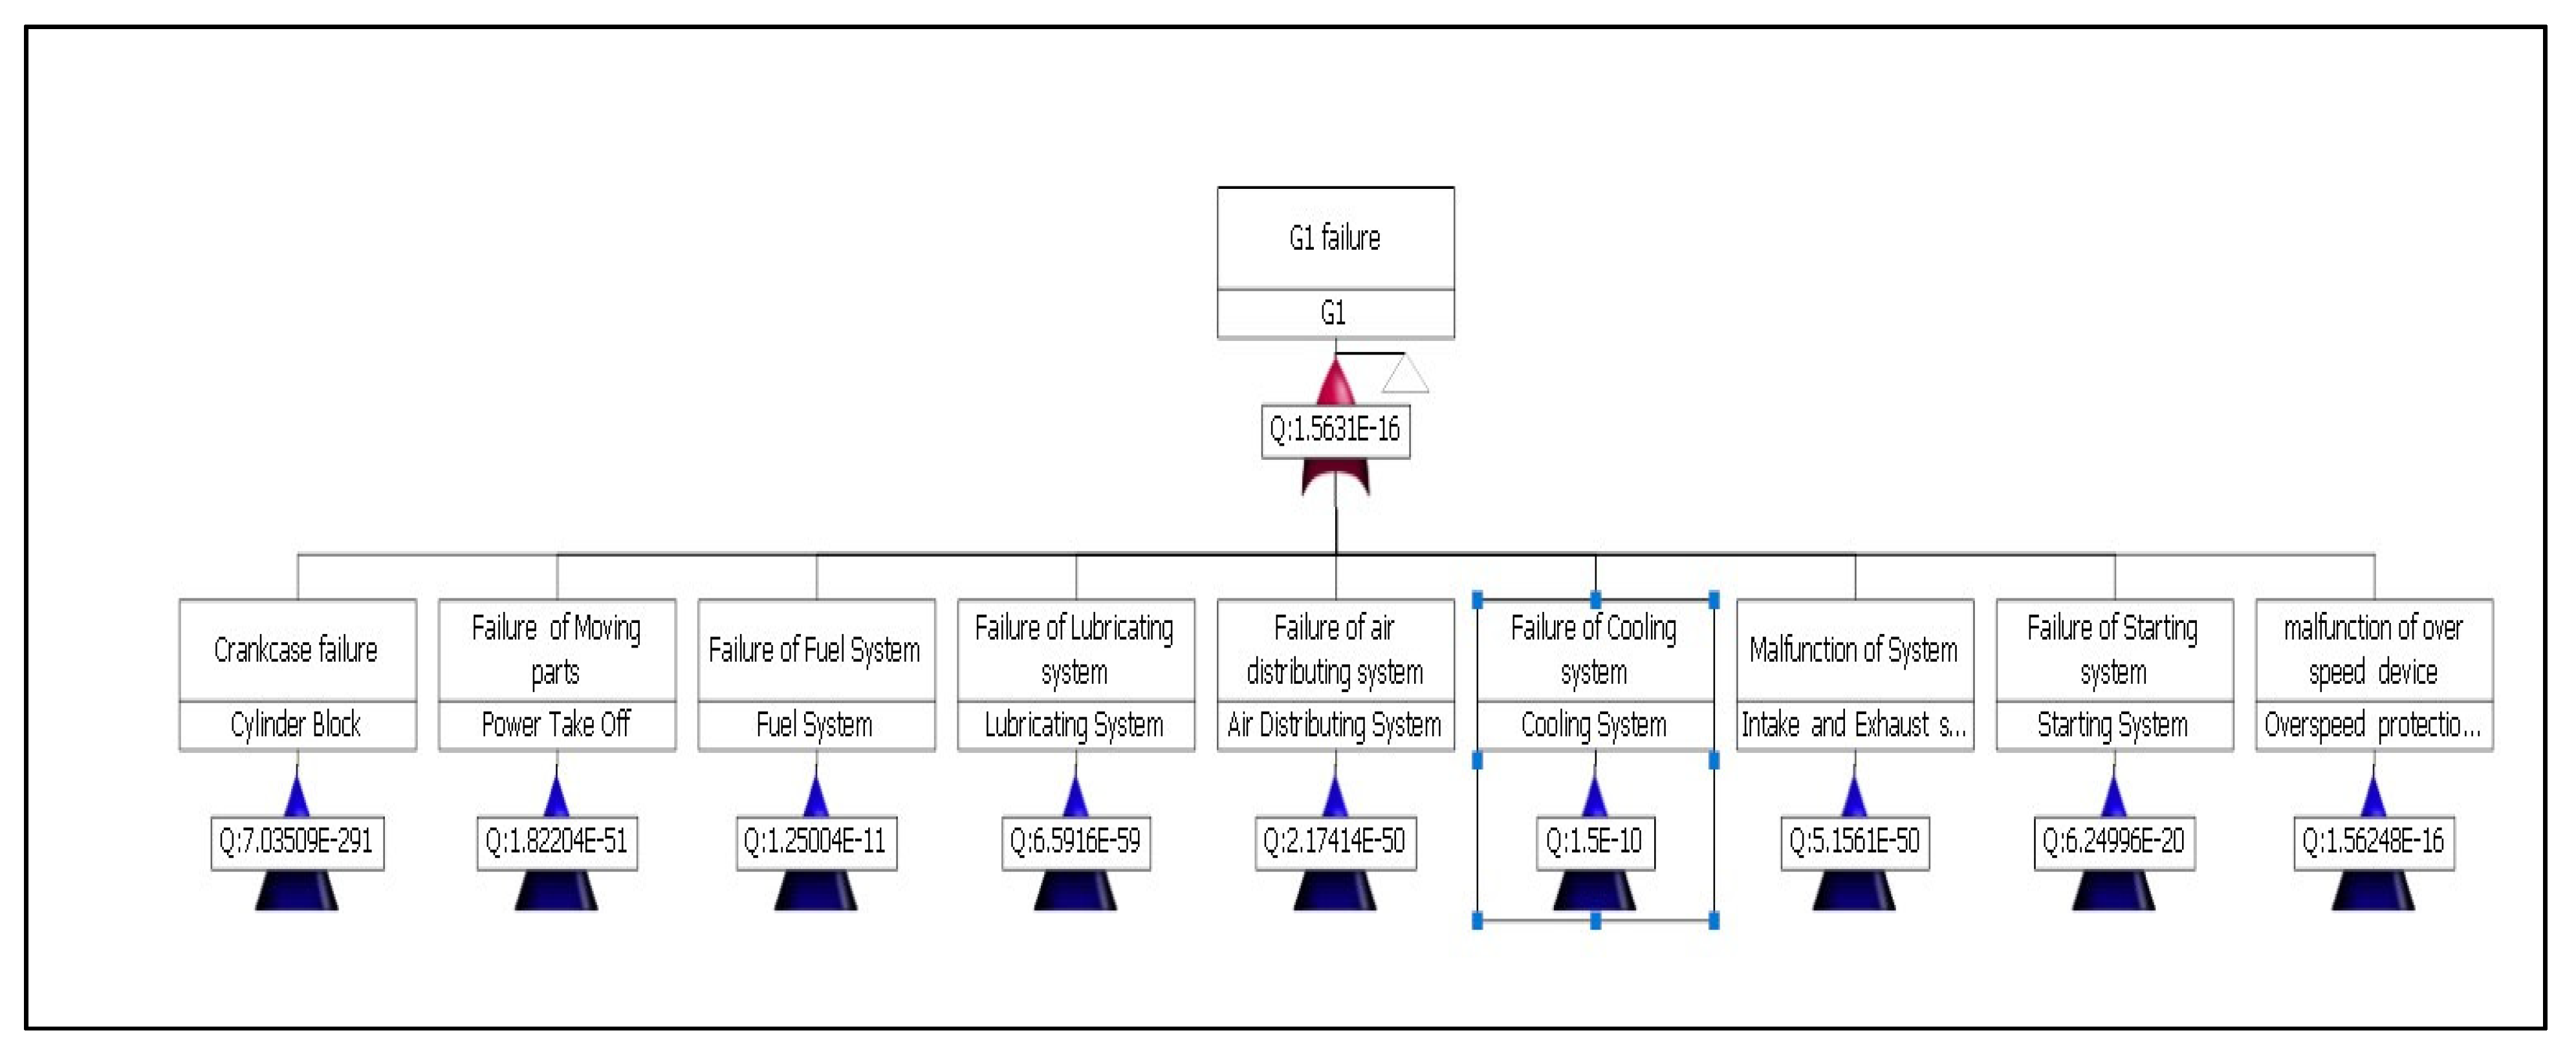
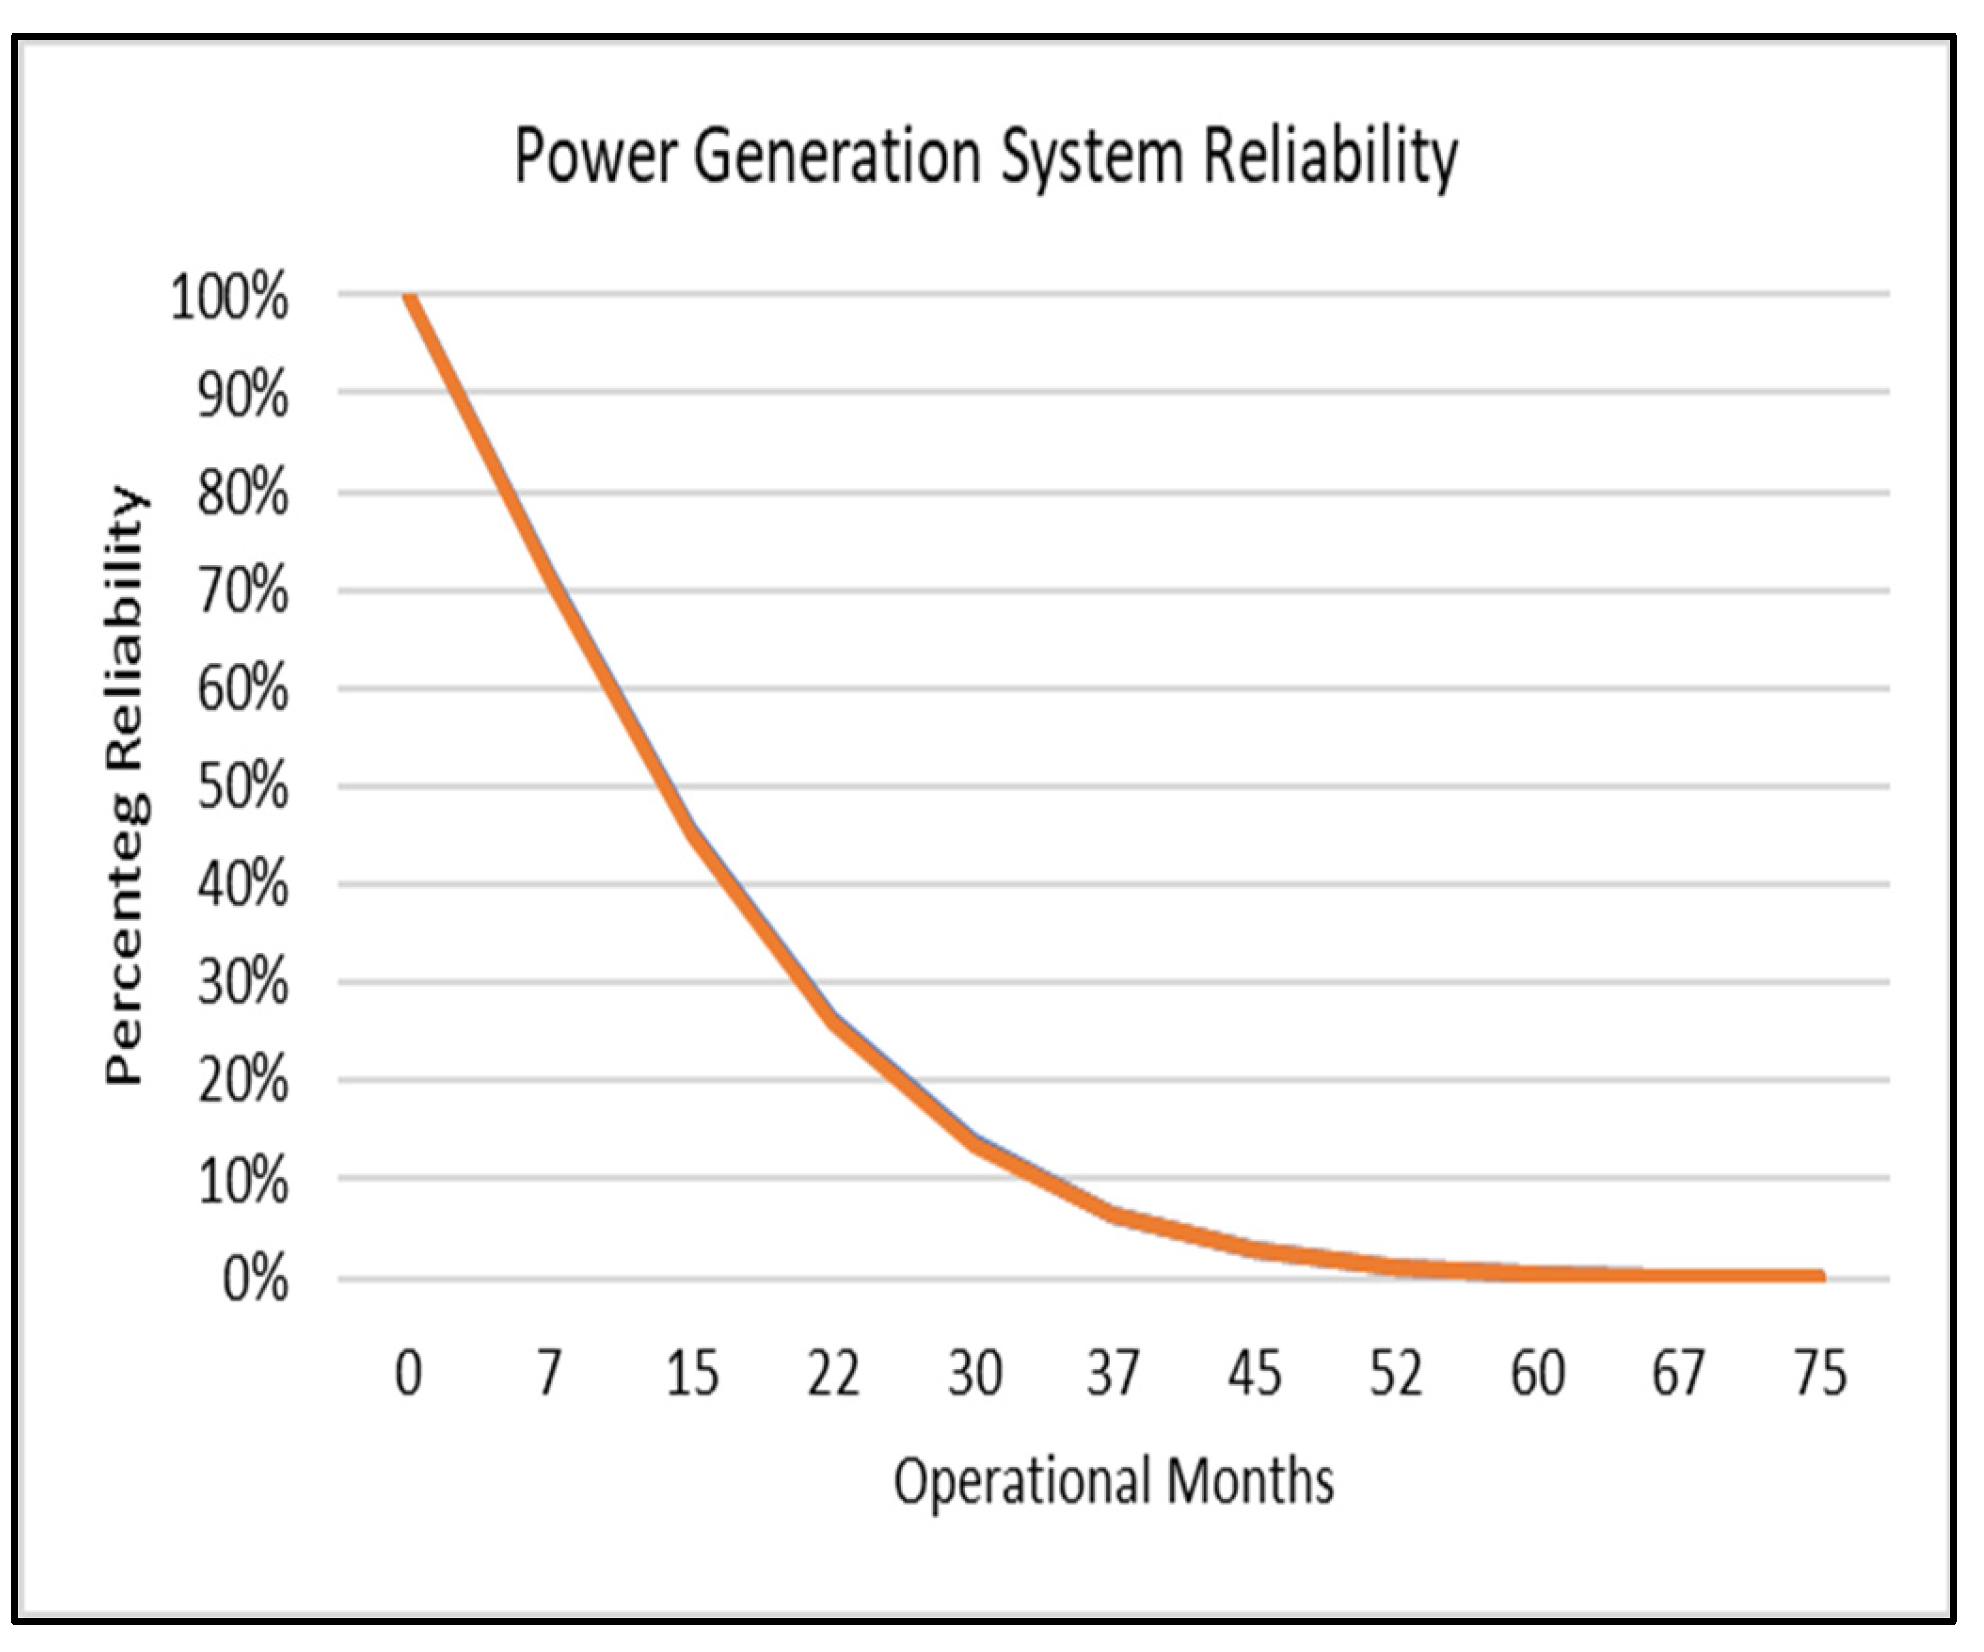
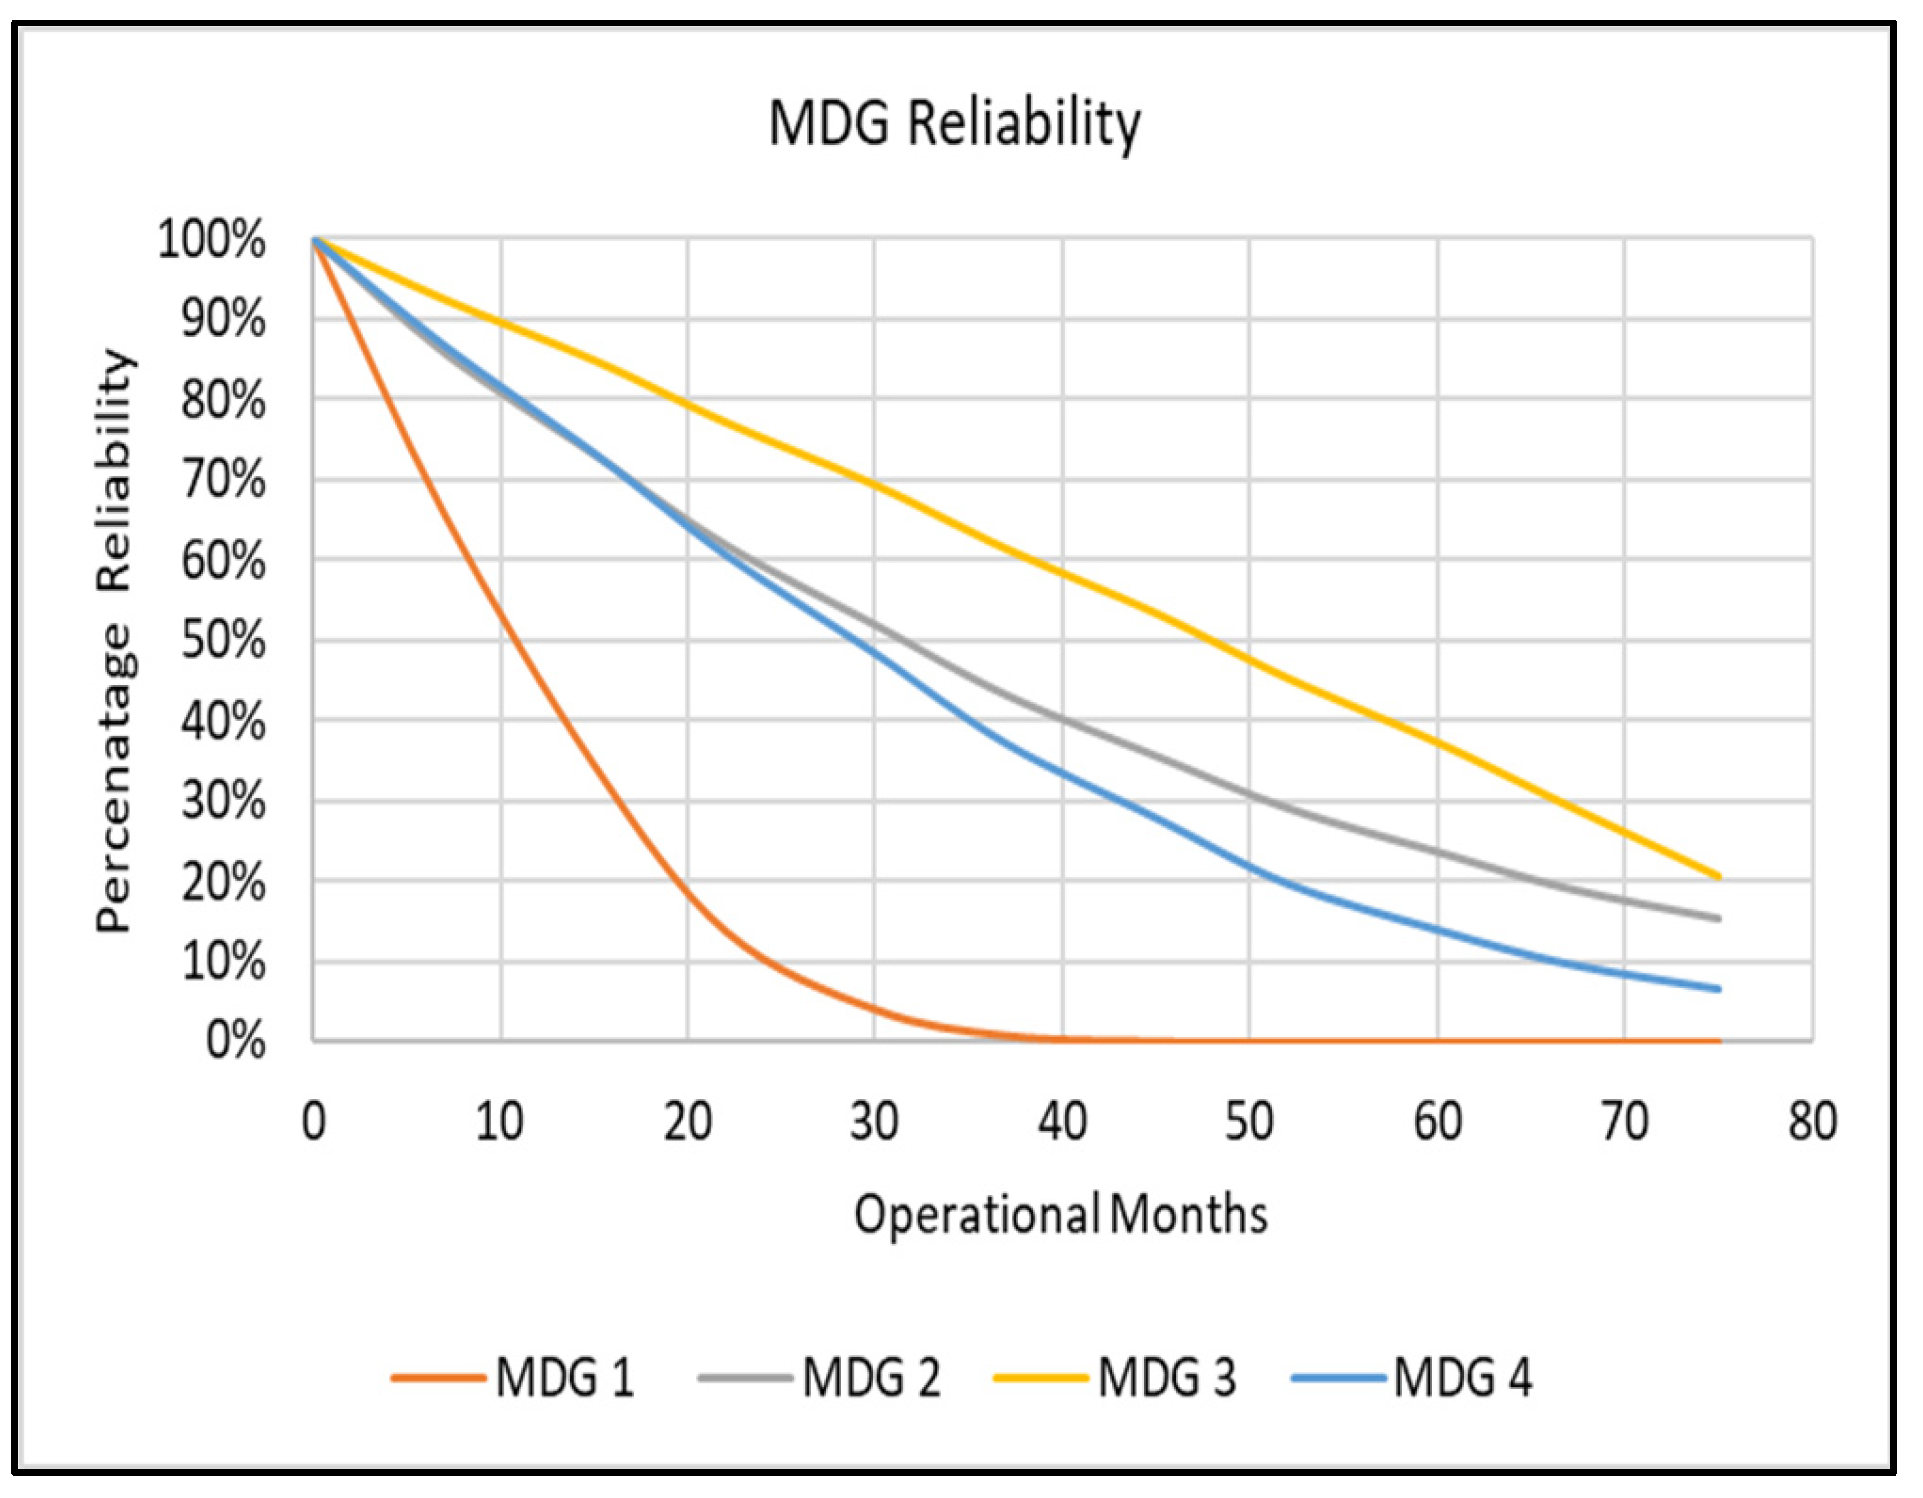
5.1. Subsystem Analysis

The analysis was conducted on systems, sub-systems, and components of individual engines. An overview of the reliability of the PGS and the MDGs is presented in Figure 5 and Figure 6, respectively. Figure 6 provides an overview of individual MDG reliability against the overall PGS reliability, which is the cumulative reliability of all MDGs. Therefore, following the operational requirements, the PGS reliability (Figure 5) develops a steady decline by the seventh month, and similarly, Figure 6 shows very low reliability, especially for MDG 1 just about the fifth month. The reliability curve MDG 1 reflects some earlier repair challenges faced by the maintenance crew due to faulty injector pump defects resulting in overdelivery of fuel to some cylinders, causing frequent overheating and power load balancing. Moreover, the remaining 3 MDGs also show low reliability levels, except for MDG 3, which maintains about 80% reliability for up to 20 months. Overall, the results indicate a high level of unreliability in all the MDGs, which explains the low reliability of the PGS in line with the operators’ requirements.
The analysis conducted on the other subsystems helped to provide further insight on the overall reliability of individual DGs, and most importantly, it identified where the major challenge is regarding all four DGs. Therefore, component criticality will shed light on the high level of unreliability displayed by the MDGs. Multiple components have been identified as critical, though with varying degrees of priority in their contribution to failure. Components in the power take-off system and cylinder heads make up of a greater number of critical parts.

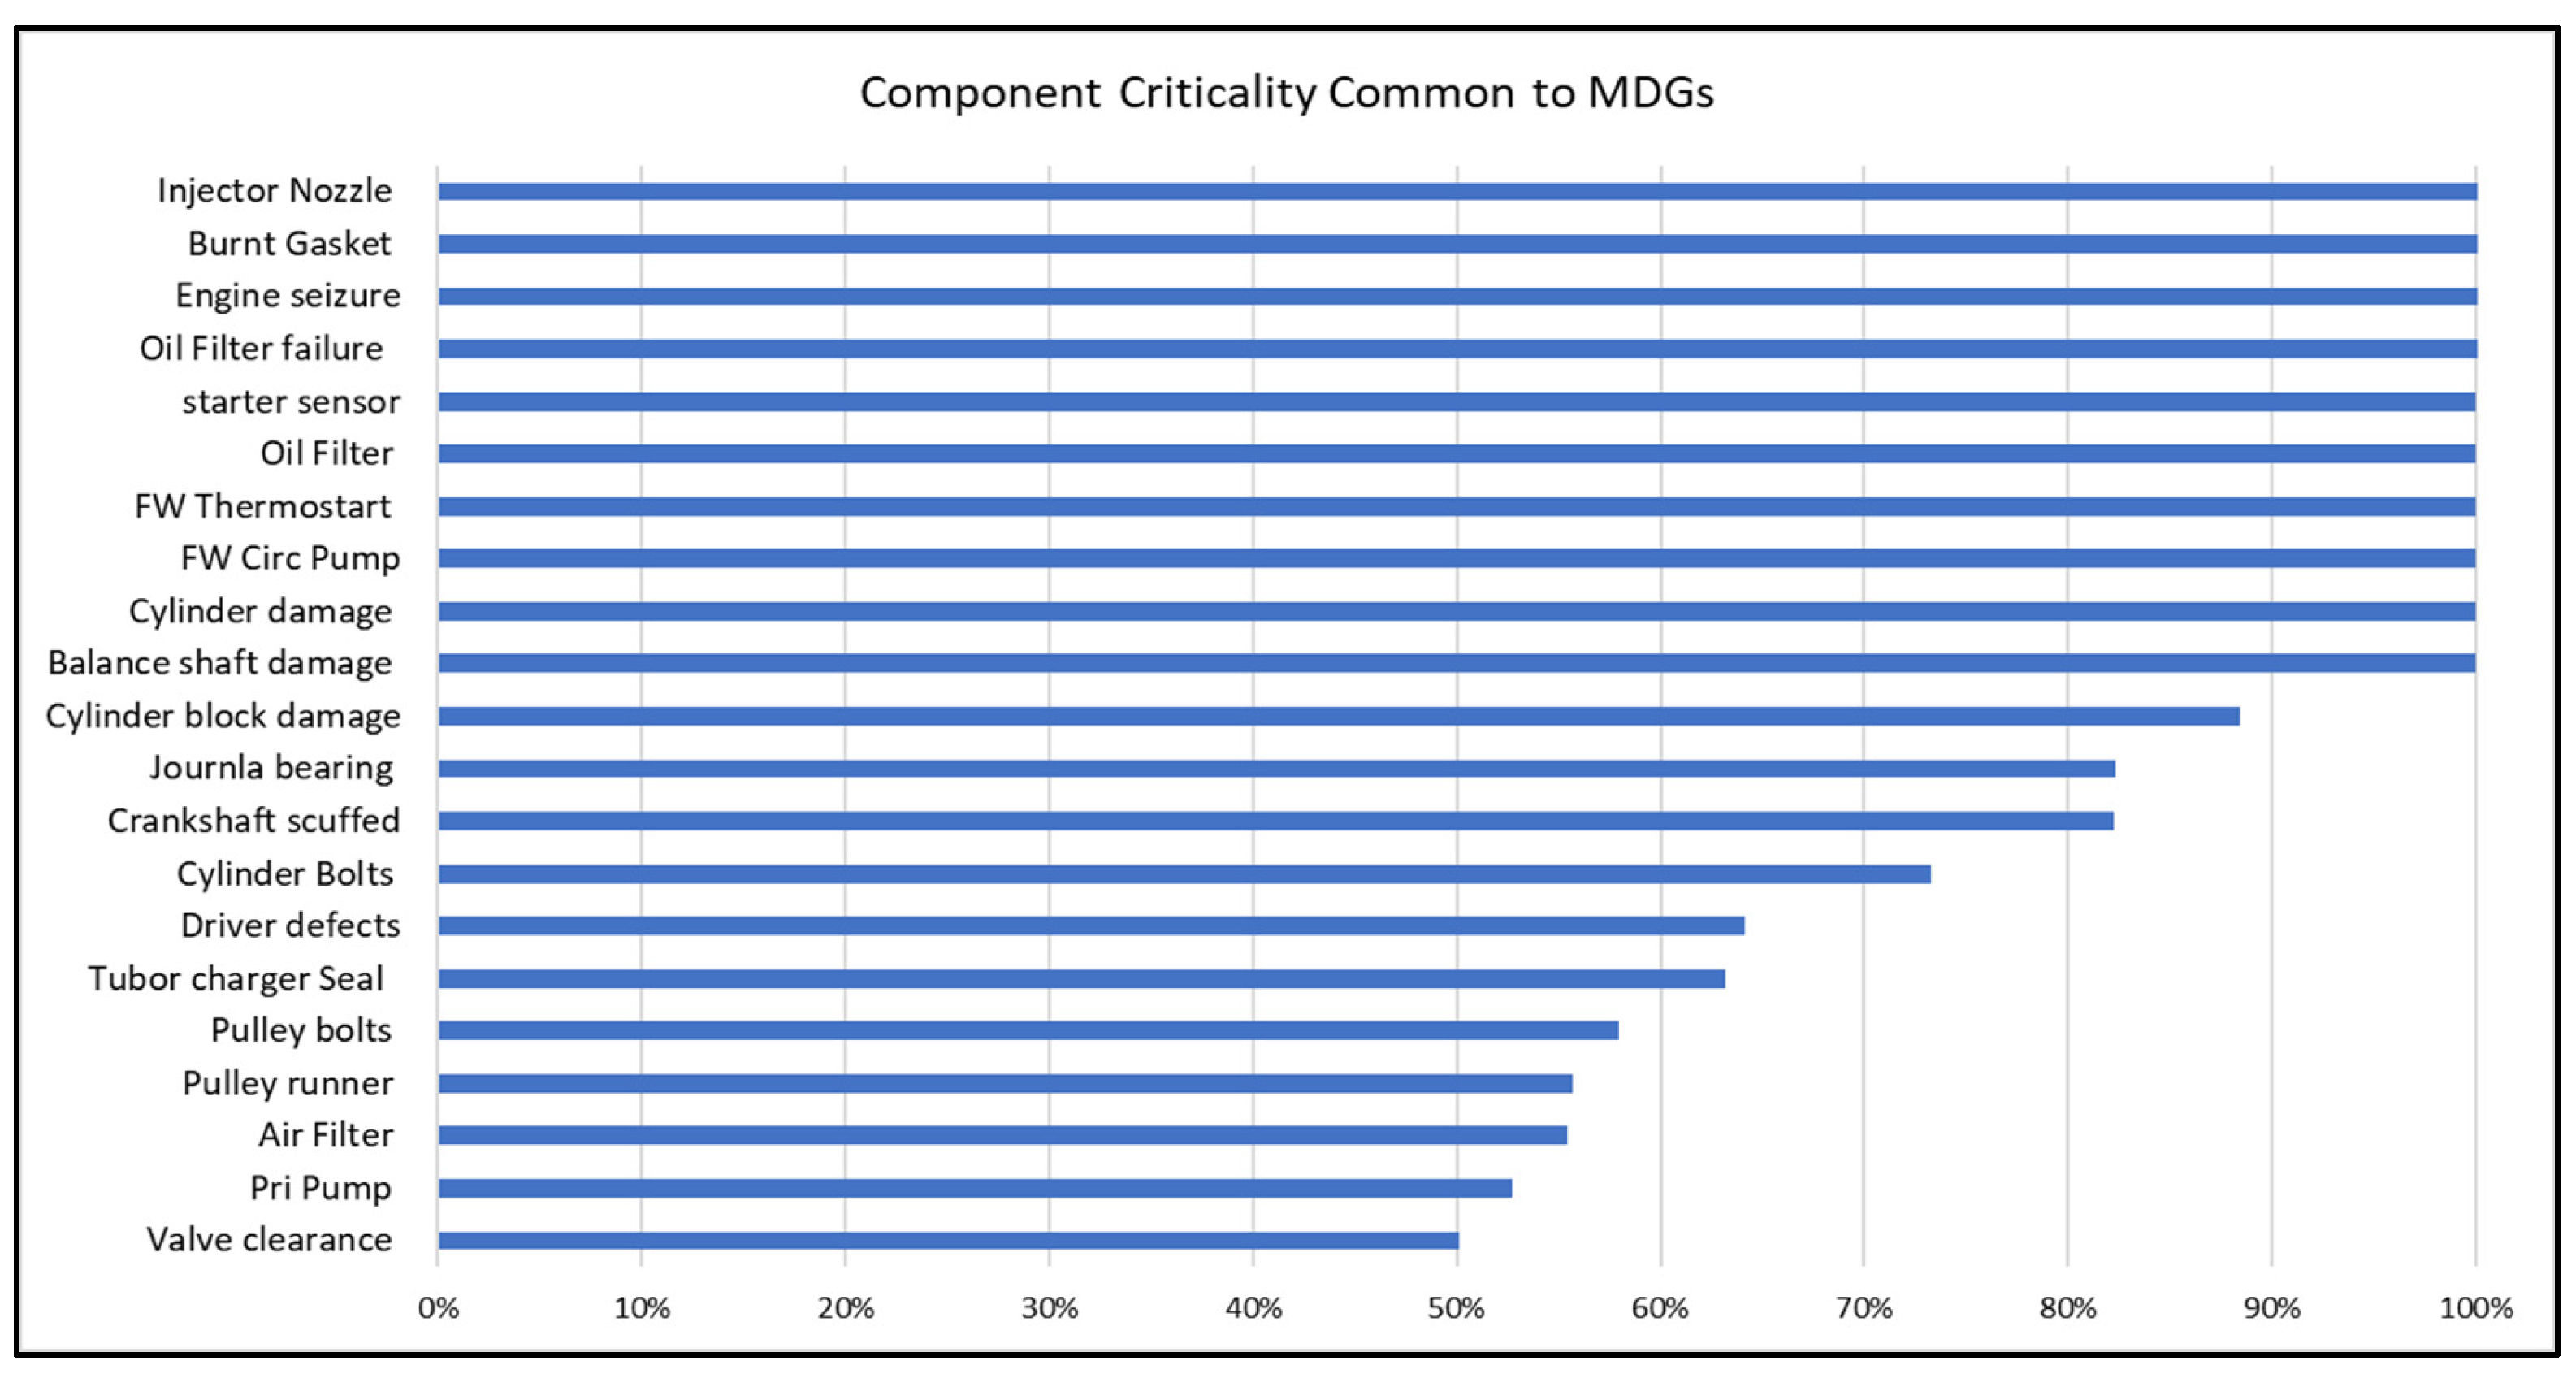
5.2. Component Criticality Analysis

Component criticality for individual components was obtained from the DFTA analysis. The Bir IM was used to present the most critical components; this is mainly because of its ability to identify the most critical component once the top event is said to have occurred. Moreover, readings for Cri and FV IM were obtained, but all appear to have the same values and were low, such that the system may not require any significant improvements, hence not a good representation of the case study maintenance and failure reports. The IM for the MDG1 is presented in Table 4, which gives an overview of the most critical components in the various sub-systems, including other auxiliary connections like the sea chest.
The Bir IM values were used for the component criticality analysis; in this regard, components that contribute up to 40% to system unreliability were established. The reason for keeping the component criticality at 40% was to have a manageable number of components while maintaining the integrity of the system.
The reliability importance measures (IM) for the DGs are presented in Figure 7. The individual bar charts give an overview of the most critical components in the various sub-systems, including other auxiliary connections like the sea chest. The Bir IM was used to present the most critical components, being that it is the most responsive to the DFTA structure as well as the number of components to analyse. The IMs here represent components that have at least contributed more than 50% of all failures within the period analysed. Interestingly, there are components that tend to appear in all the MDGs; of particular interest are those related to cooling and air intake systems. These are of great concern due to their influence on the combustion process. Hence, this is an area of high importance and must be noted by both the operators and the manufacturers, especially within the warranty period. Furthermore, if this is regarded as some kind of challenge due to fuel quality and operator skills, then the OEM could provide an alternative way to address this shortcoming in the MDGs.
Overall, all the MDGs did not indicate high reliability levels, even considering the OEM recommendations on checks and calibration of components such as the tappet, which require localised inspection every 200 operating hours. Notwithstanding that the OEM’s maintenance is mainly to serve as guidance to the operator, the equipment should not deviate much from the manufacturer’s initial maintenance projections, especially within the first 5 years. Table 5 presents the most critical components in all four MDGs; the percentage criticality is an indication of how a component can affect an MDG when it fails or is degraded.
The low reliability levels as presented in the component criticality could be as a result of inappropriate maintenance, low manufacturing standards, sub-standard consumables, or induced faults as a result of a shared environment. For instance, the problem with the cylinder head bolt getting loose could be attributed to high vibration, which can cause significant damage to the MDG and potentially lead to other hazards within the engine room. On the other hand, there are significant failures involving the freshwater heat exchanger, air filter, and turbocharger. Faults on these components are particularly significant because they all contribute to increased fuel consumption and reduced output on the MDGs, thereby leading to load shading or tripping. Therefore, to explore how these faults occur additional analysis to evaluate the MDGs health parameter to check for faults was conducted using ANN.

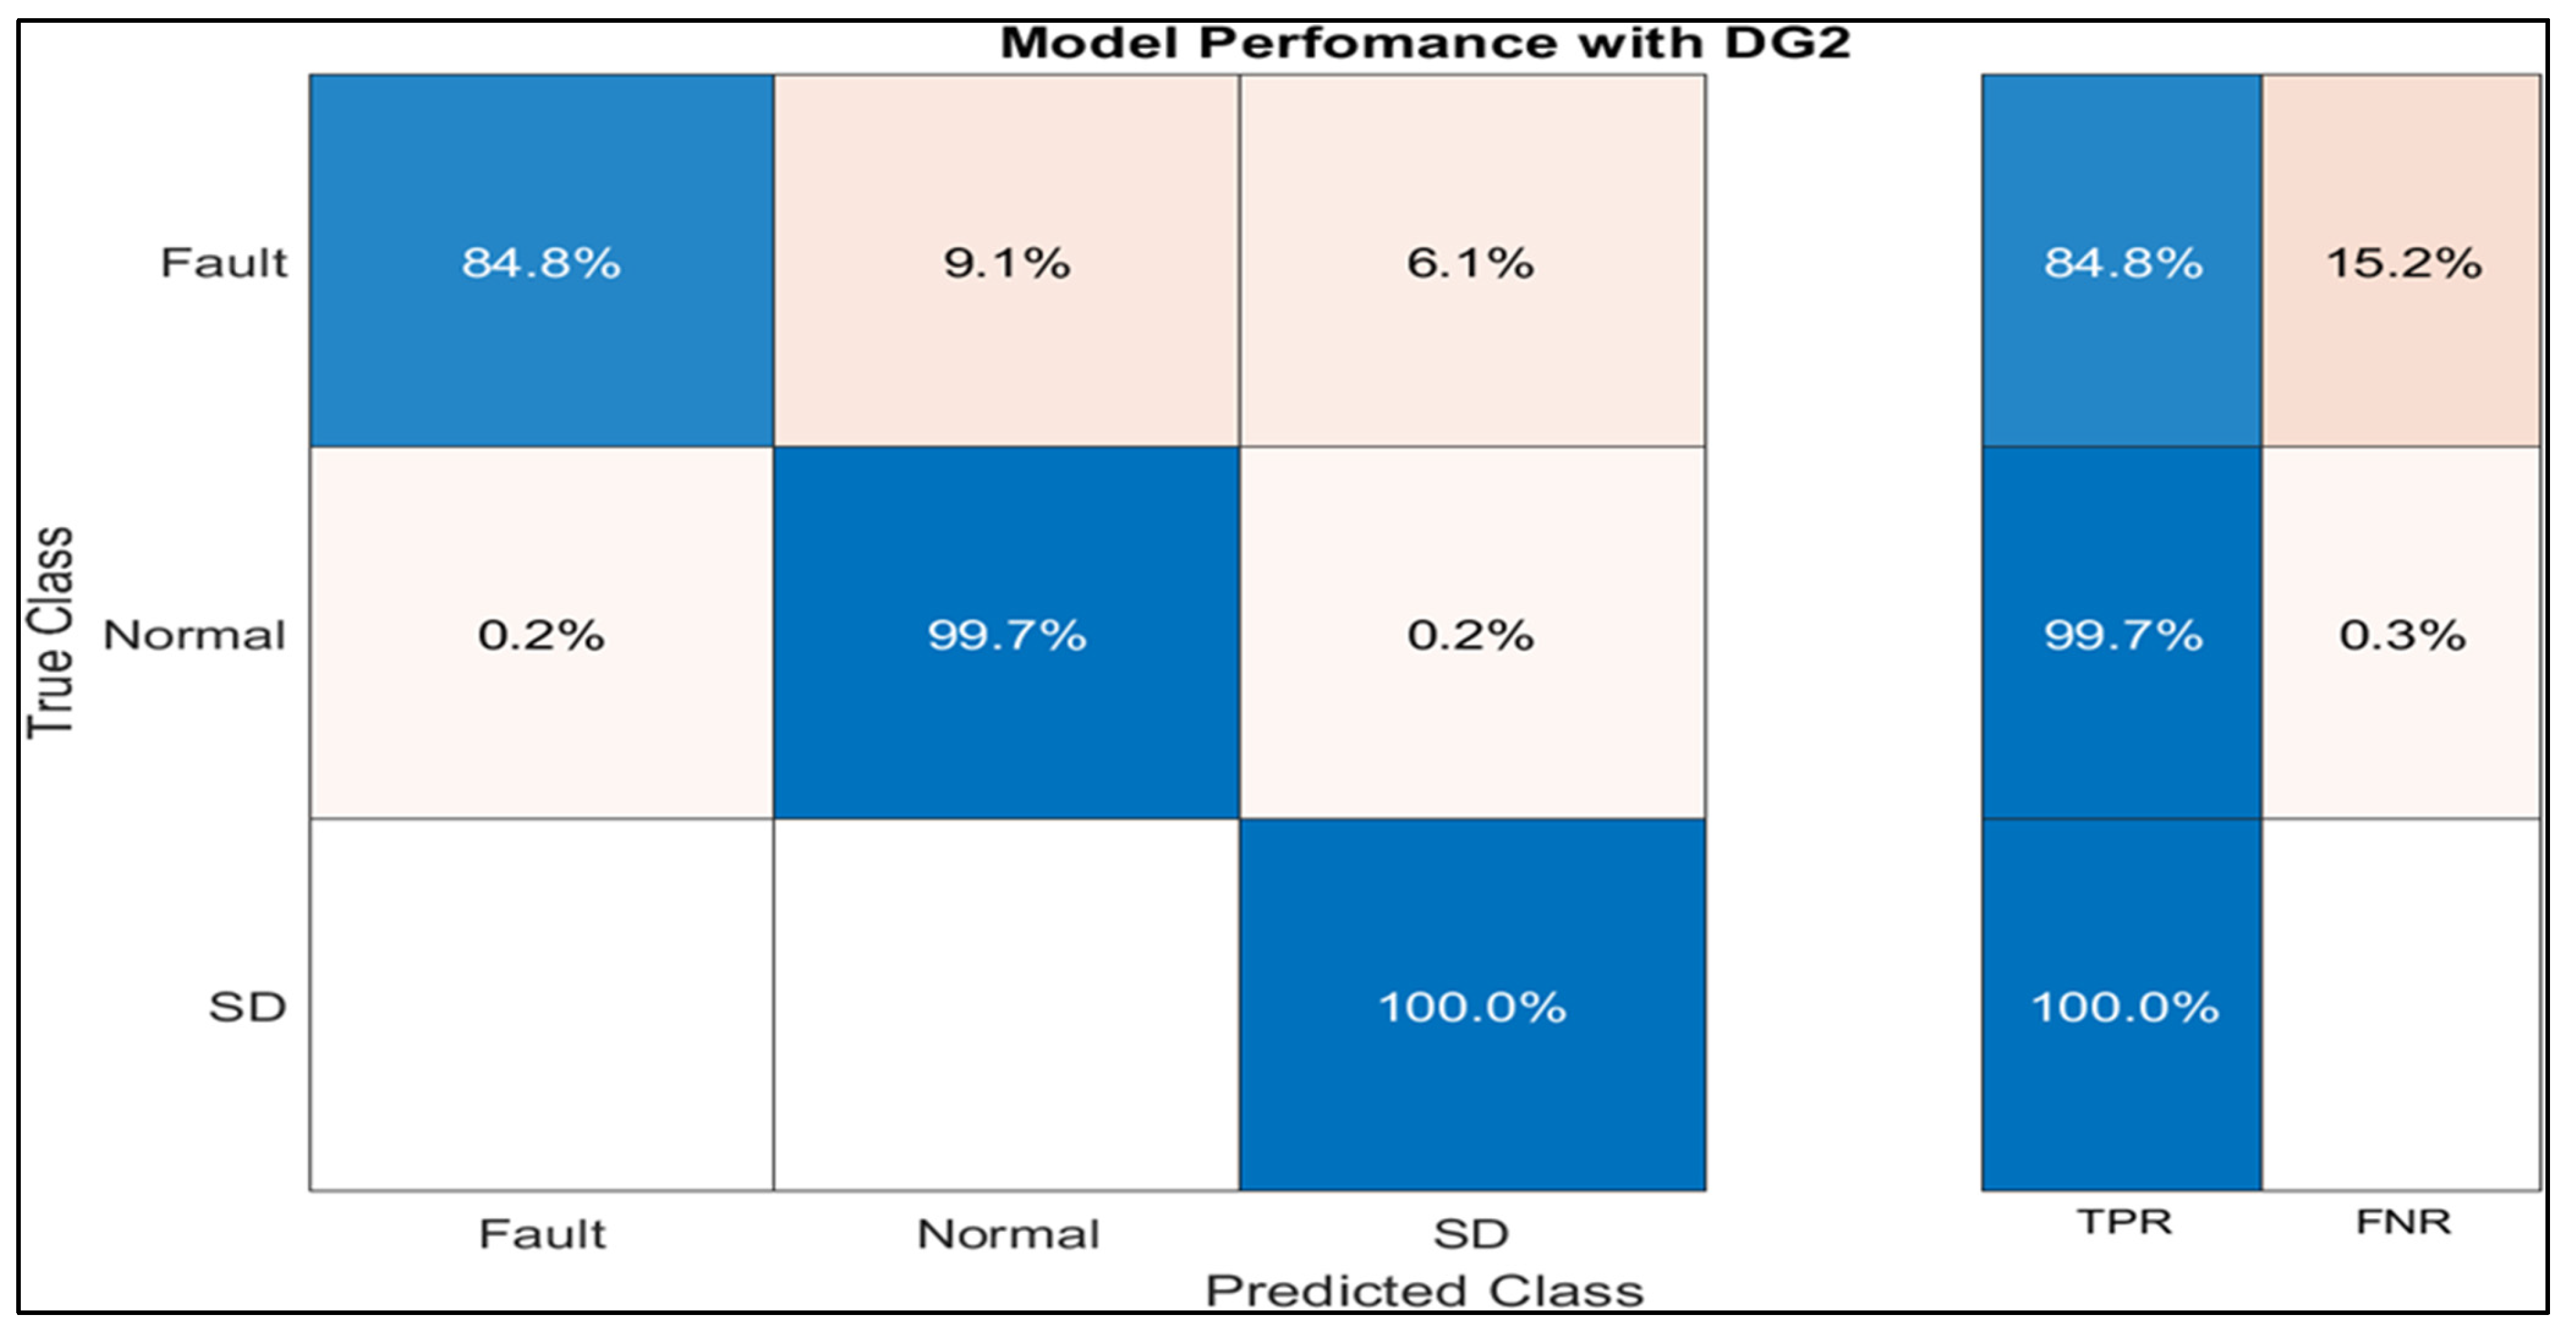
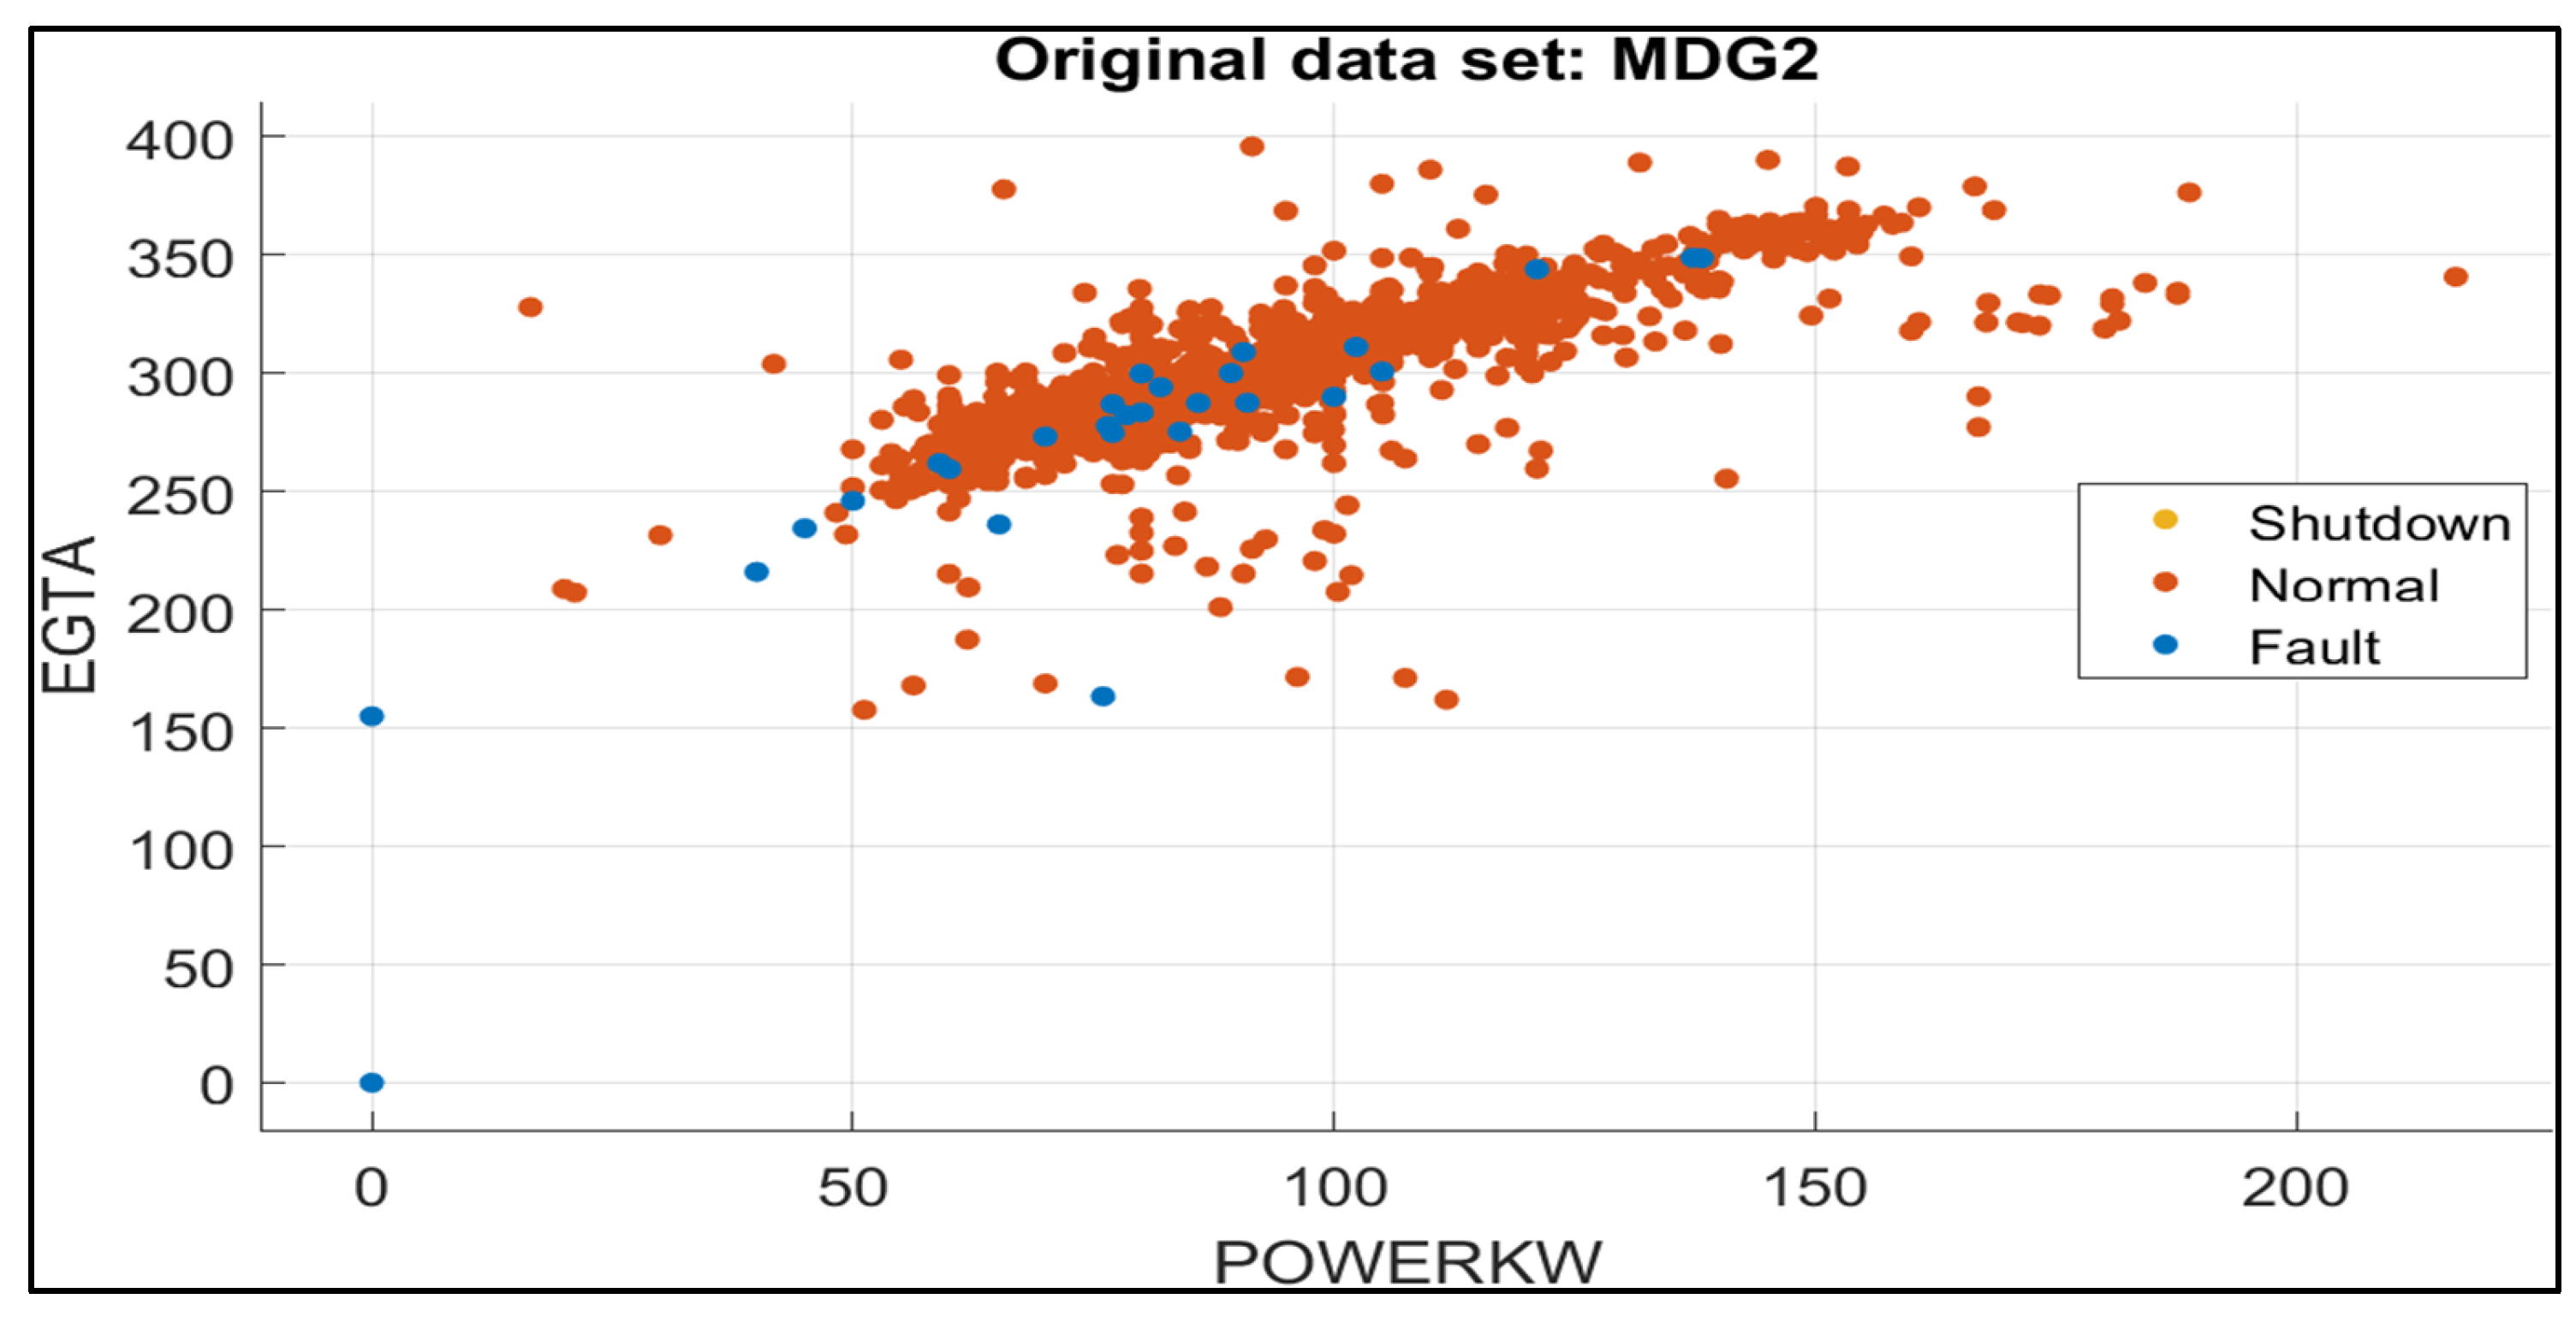
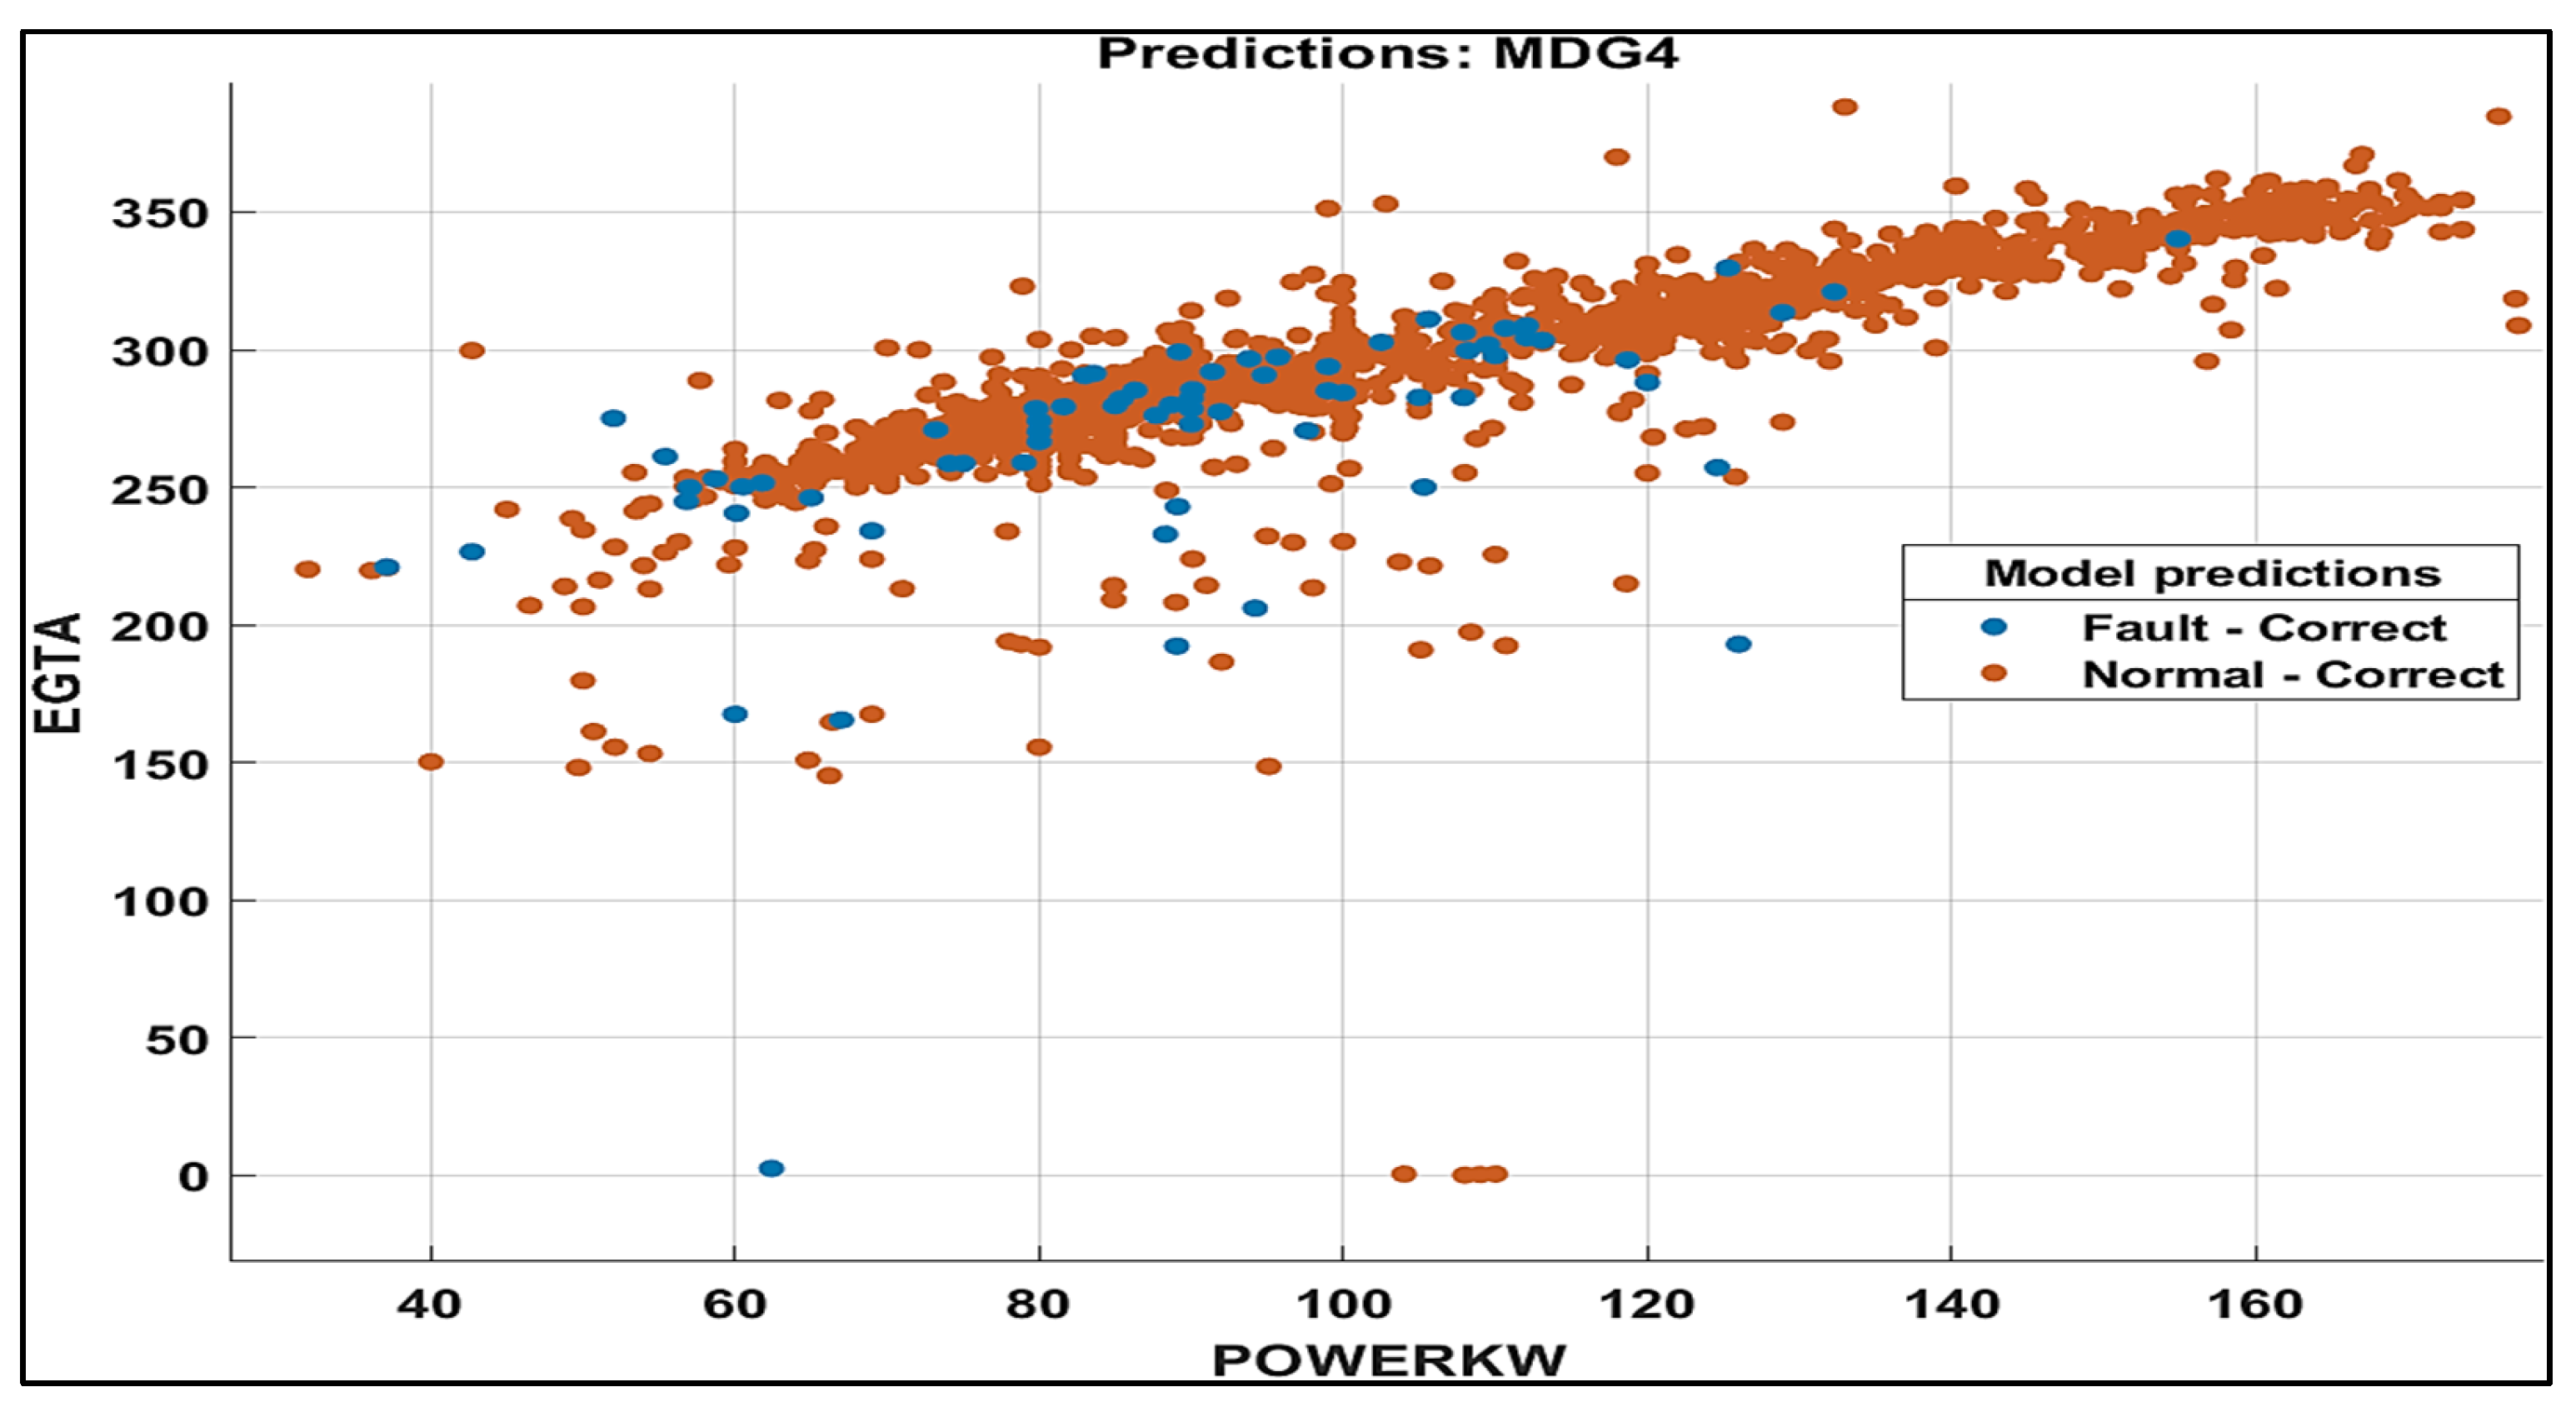
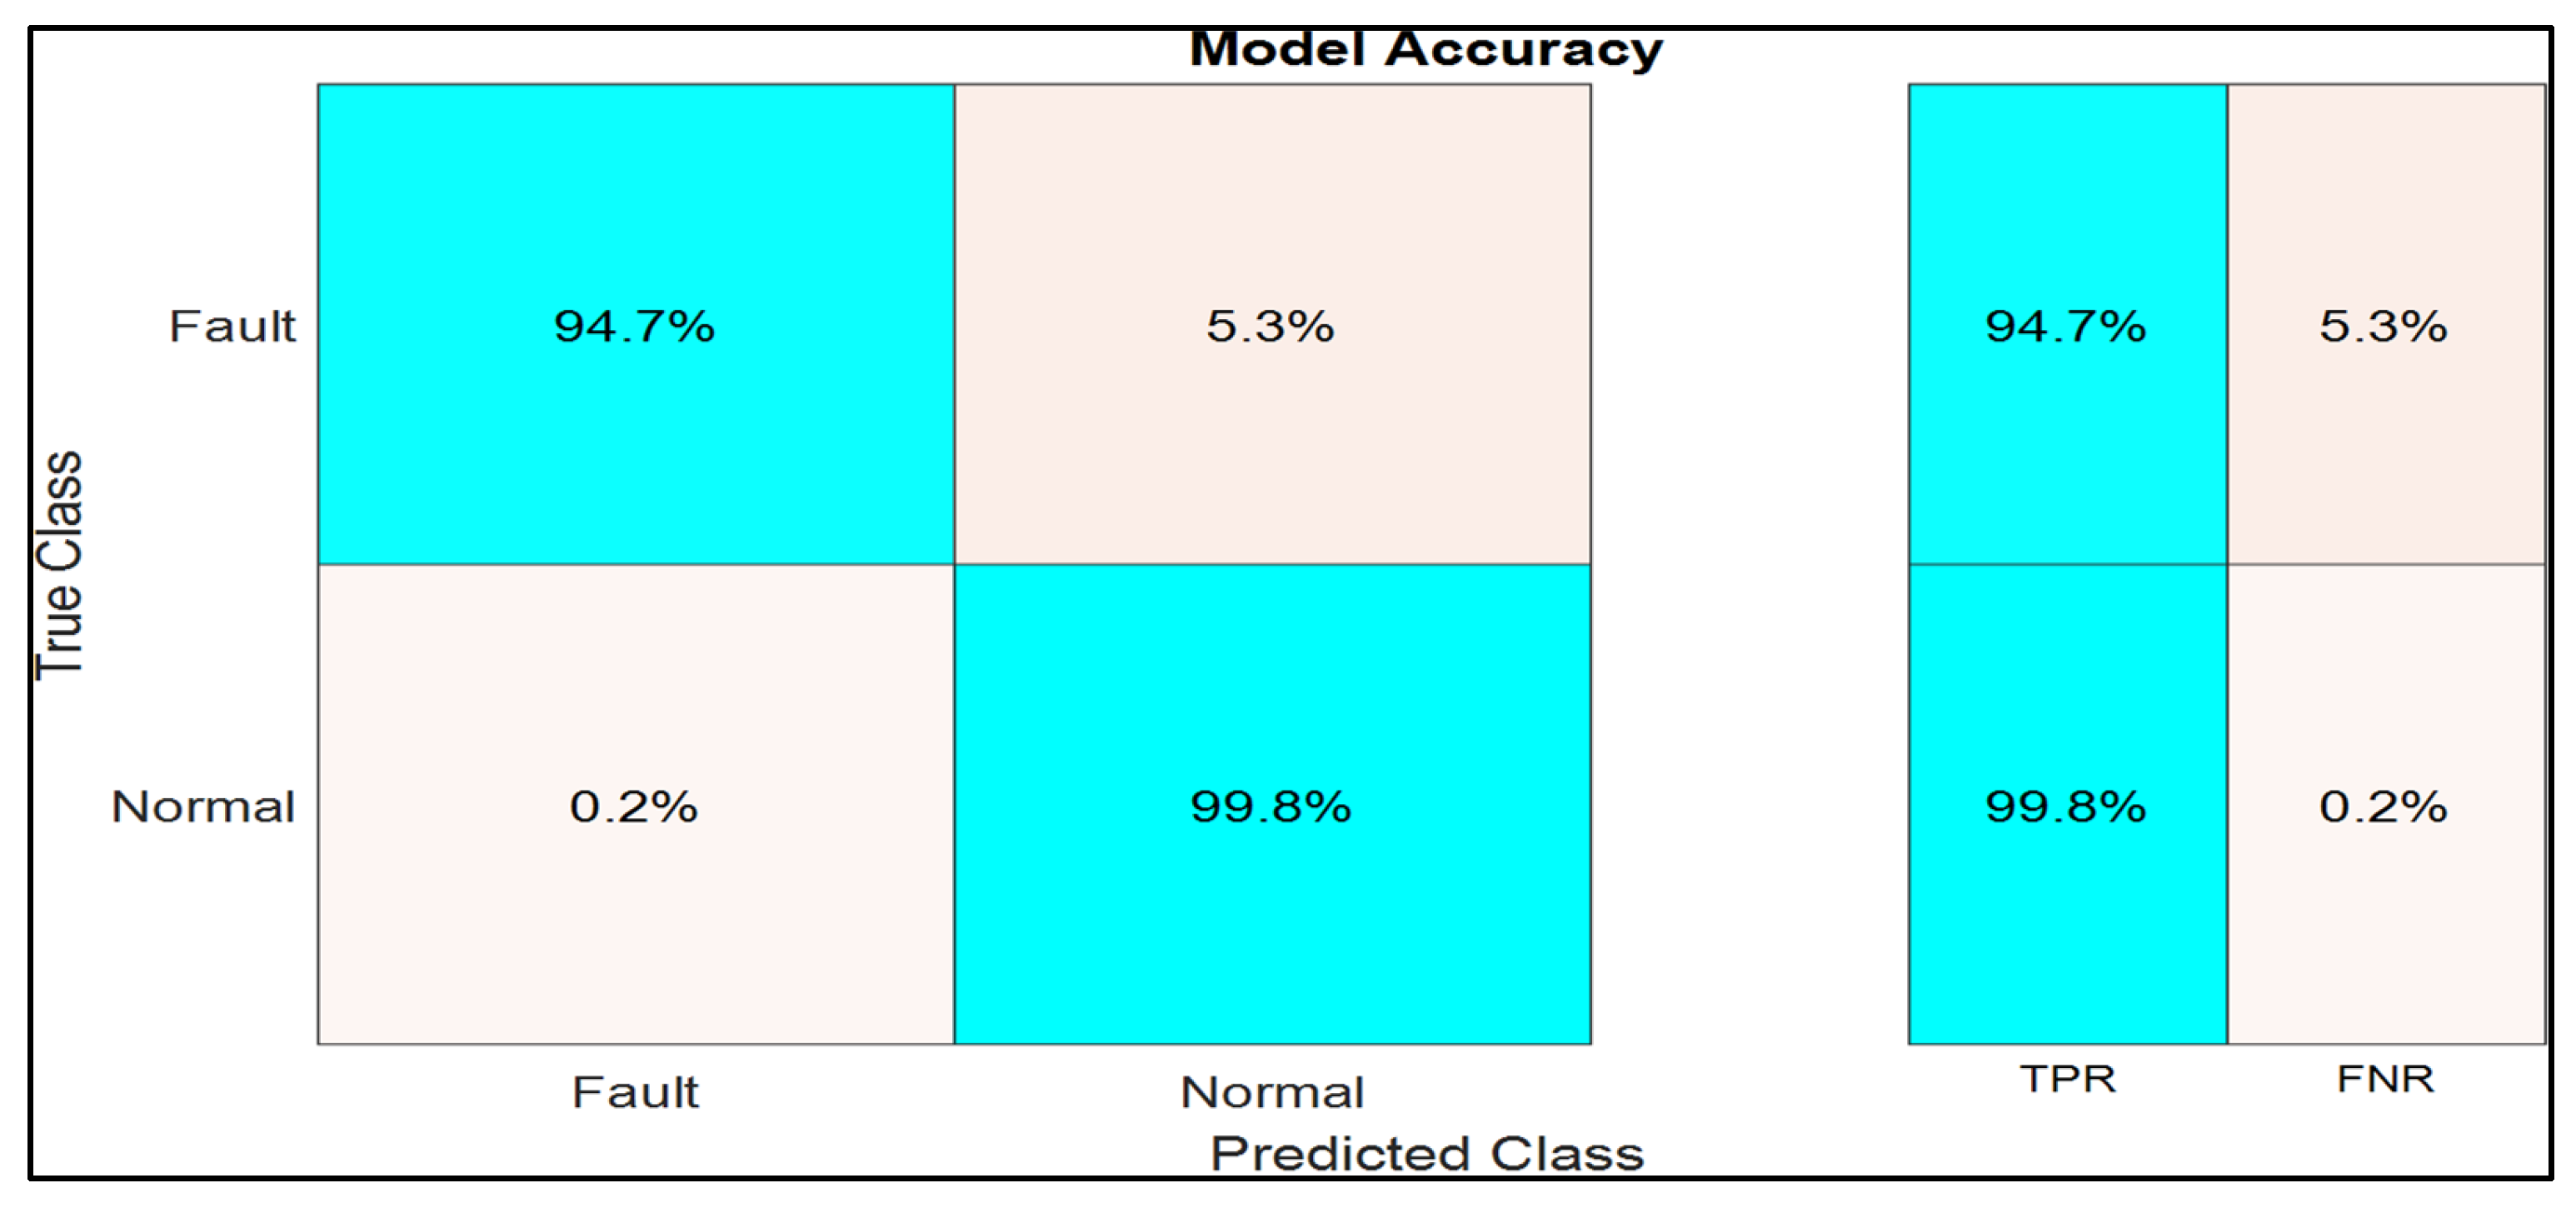
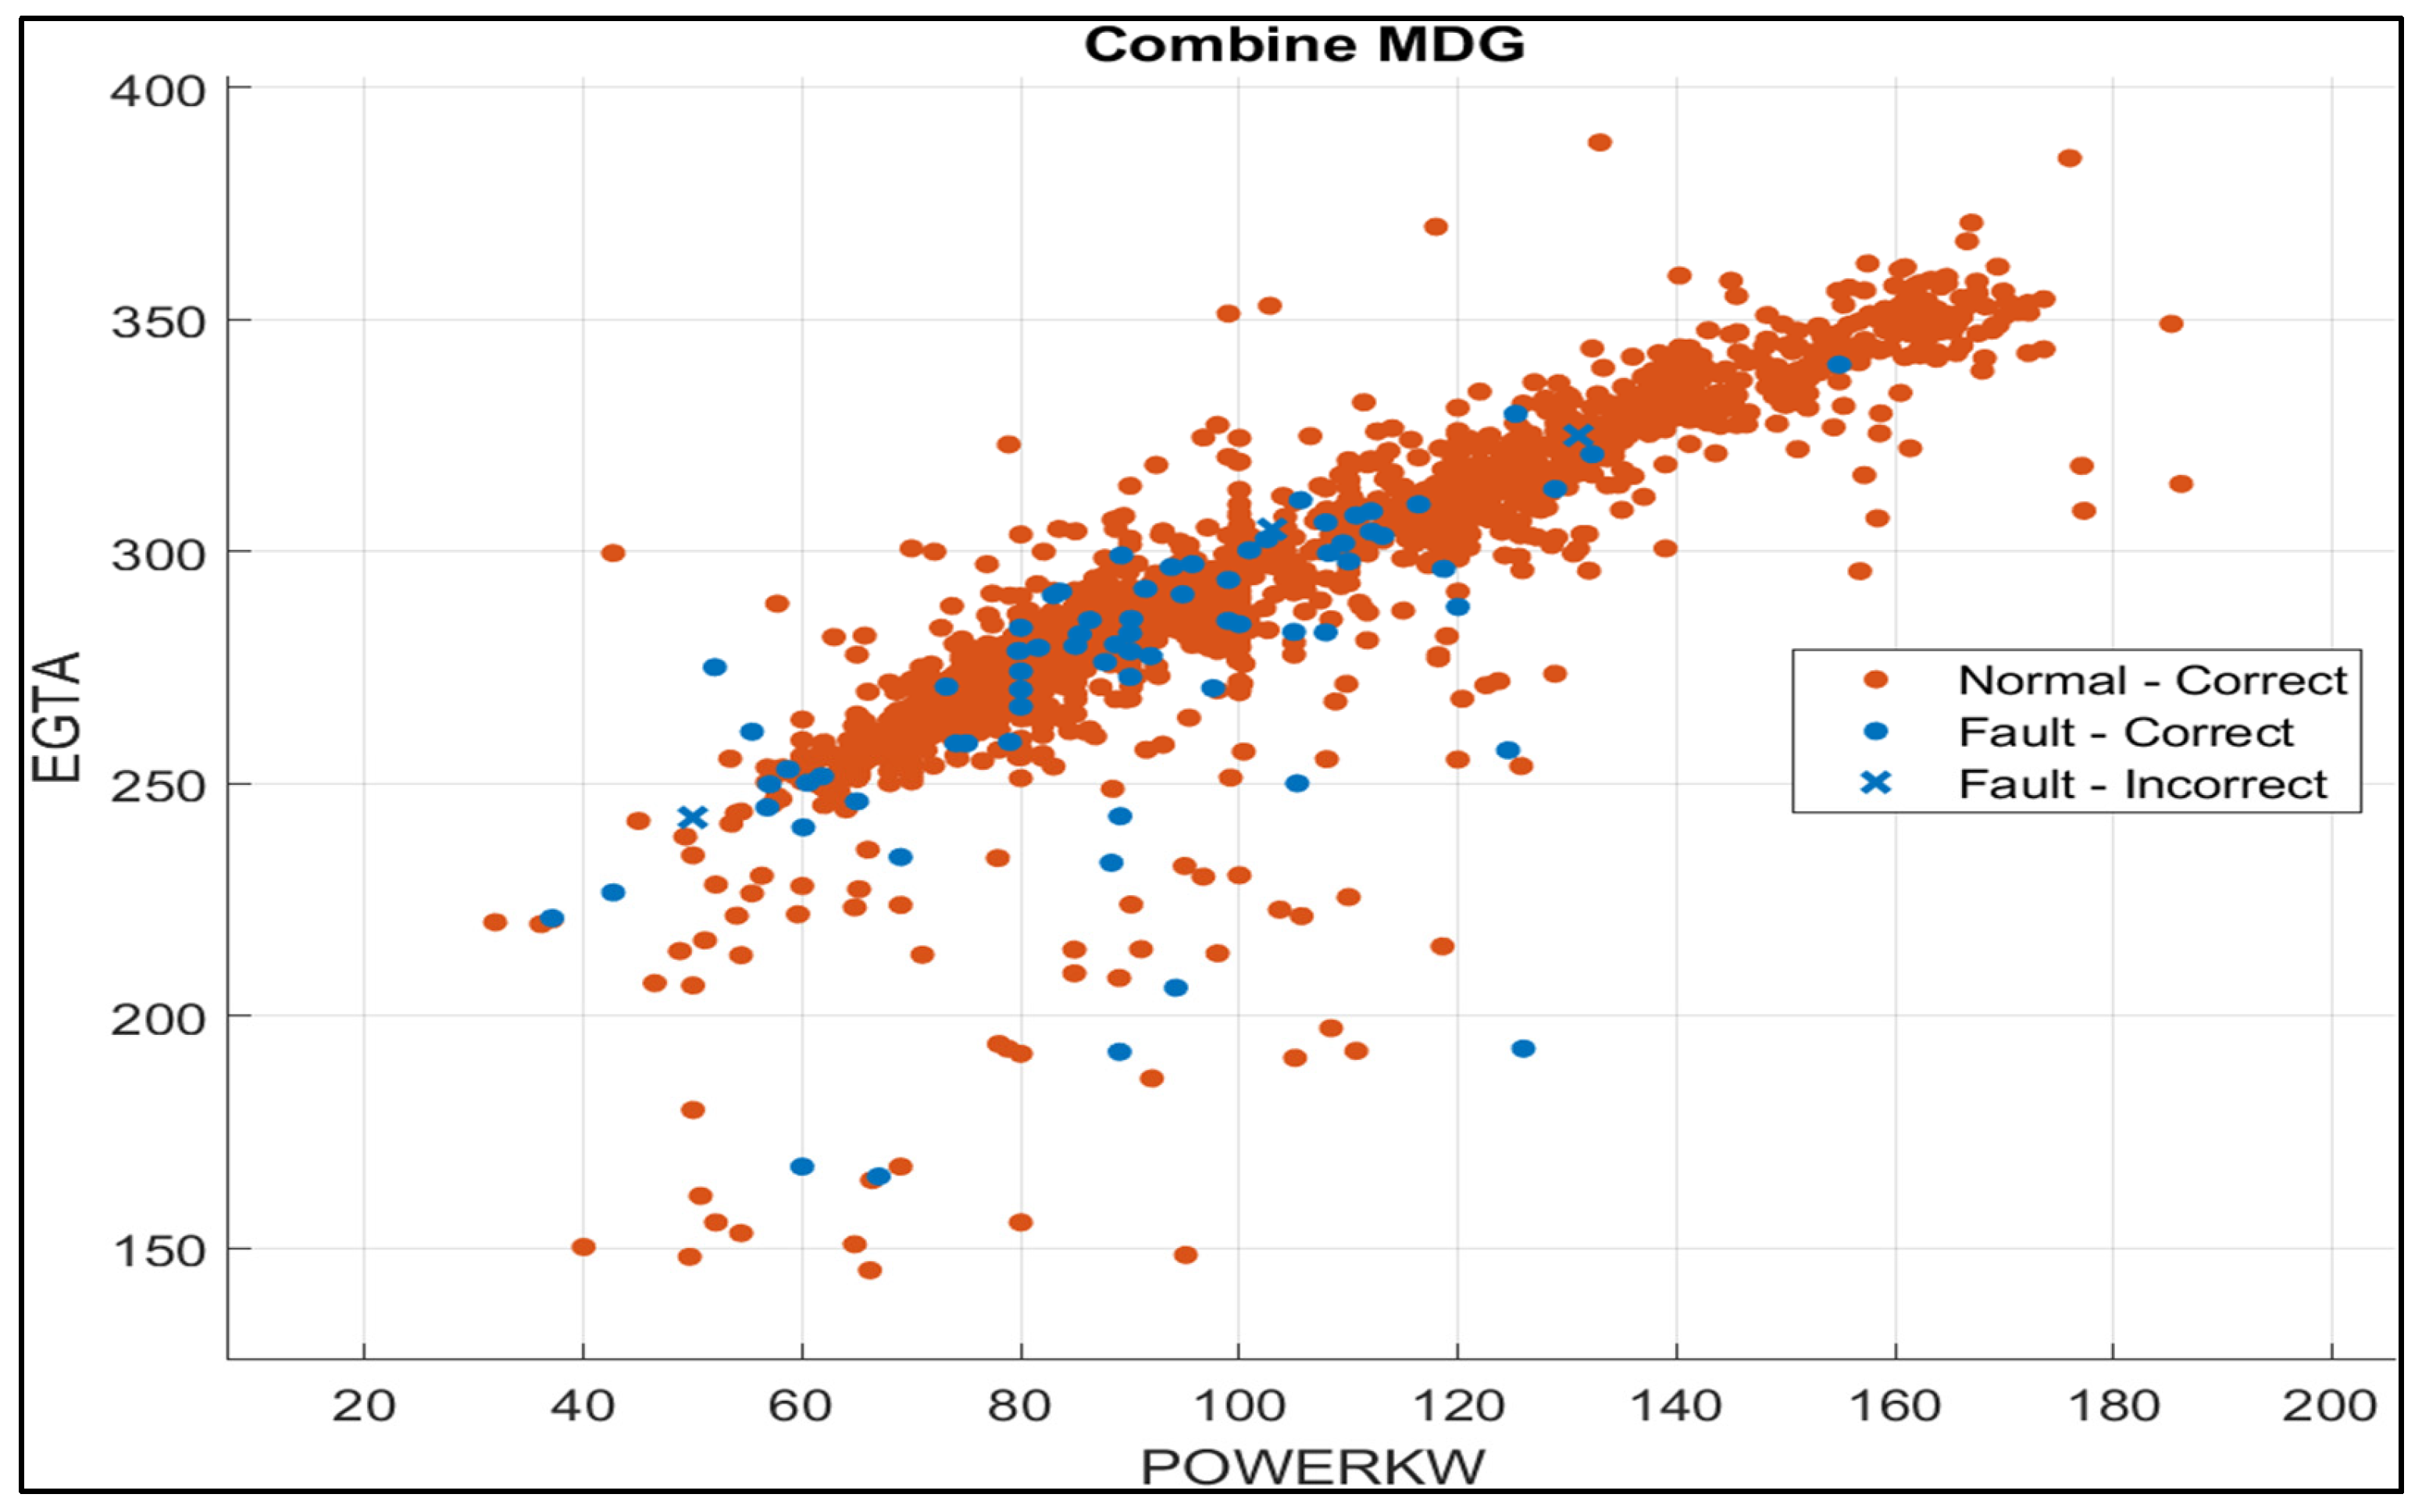
5.3. Fault Identification

The hourly generator log data covering more than 3000 operating hours over a duration of about 12 calendar months was collected. The pre-processing and labelling of the data were conducted using the data cleaning app and classification learner of MATLAB software, respectively. The data cleaning was necessary to remove outliers and invalid entries as well as gain a better understanding of the data generally. A summary of the data is presented in Table 6. Accordingly, Table 6 presents time series vectors used as input variables and predictors, while the response was split from Table 6, which includes KW and RPM. However, based on initial model training, the KW appears to be a better response, especially when used with EGTA. The variables contain threshold values that represent fault indicators as reported by operators.
In this regard, the anomaly data labels presented in Table 7 were used for the initial training using MDG 1; this was executed to develop a single model for all four MDGs. Hence, the labelled fault data was used for fault detection, which contains three fault classes: Normal, Fault, Abnormal, and Shutdown. A second fault class, although not represented, uses temperature thresholds as predictors with Lube oil pressure as responses. Accordingly, overall training data utilised 20% of the data from all MDGS added to MDG1 data before splitting, as earlier highlighted. Using this information, the analysis was also able to establish that most faults are related to overheating and occur when the ship is in the harbour.
A feed-forward ANN with two layers based on sigmoid and SoftMax activation functions using the MATLAB pattern recognition app was used for the classification analysis. Analysis of Variance (ANOVA) was used to determine feature importance, and seven data features were found to be important for the analysis. These include Power output (kw), Exhaust gas temperature (EGT) A and B, Fresh Water temperature (FWT) A and B, Lubricating Oil Pressure (LoP), and location data, as shown in Table 8. The time series data of about 3000 data points was used; the data was divided into three categories: 70% for training, 15% for validation, and 15% for testing. The model was then applied to the rest of the MDG data for fault identification, as shown in the Figures below.
On completion of the training, the model was evaluated using the True Positive Rate (TPR) and False Negative rate (FNR) approaches. This shows that the model has performed well for the diagnostics and can be deployed or adopted for the set of generators. Although considering the datapoints, it is believed that the model might behave slightly differently with a larger data set. Nonetheless, in all the classes, the model has achieved more than 84% accuracy between the true and predicted classes. Figure 8 shows the performance of the model in identifying the three classes, namely Fault, Normal, and Shutdown (SD). In this regard, the features for the fault identification model were maintained from [78]. Consequently, power output (KW) was used as an independent variable, while lubricating oil temperatures (five features) were used as predictors. Therefore, MDG 2 data was used for the first training data set, using the Exhaust Gas Temperature (EGTA) as the predictor variable and maintaining power output as the independent variable. In addition to the ANOVA score of 8.9, EGT was used due to its relevance to emission detection and can also indicate other faults such as turbocharger and/or air filter degradation.
Accordingly, the selection of the EGT as a predictor is premised on its fidelity to indicate performance degradation as well as the overall health of air-breathing engines. The results of the training model using MDG 2 are shown in Figure 9. The fault identification plot in Figure 9 indicates the zone between 250 °C and 350 °C as the most critical area for most faults occurring in the data set.
Following the original data set, an example prediction test was performed using MDG4 data, as shown in Figure 10, and the test model accuracy is shown in Figure 11. The test model also follows a similar pattern as in the MDG2 original data set. It suggests that most faults occur at EGT above 250 °C, corresponding to a power output range between 80 and 120 kw. These findings are very significant, going by the operating records of the MDGs. Moreover, in actual operation, the MDGs hardly go beyond 50% of their rated output (400 kw), so having the faults occur at that power output suggests a greater problem. The test prediction model using MDG4 also shows a very similar pattern, with additional points occurring at lower EGTs above 200 °C.
The model was deployed on the combined data of the MDGs, and good enough, the result remains consistent with both the validation and test data results earlier presented. The prediction model shows more fault detections with improved accuracy, mainly because of improved data. The result of the analysis is presented in Figure 12. As can be seen, the fault concentration zone is still representative of the original training data. Overall, the diagnostic model has attained a good fitness level to be deployed for fault detection on the case study MDGs. Therefore, with its analysis, the predicted model provides important insight that can be used alongside the component criticality results. The relevance is that with further training and improvements to the machinery health data, it would be possible to clearly identify some causal factors in component failure. The additional data labels, such as vibration and oil analysis, could improve the overall analysis by providing more specific details on faults, especially in combination with the EGT. Nonetheless, the EGT diagnostic model as presented in this research has good fitness for fault detection.
In this regard, following the results already presented above, it is possible to establish the link between component reliability and emissions. The component reliability analysis has identified components such as the sea chest, FW heat exchanger, tappet clearance, and turbo charger among the most critical to MDG reliability. All the stated components can be associated with temperature increases and performance degradation in the MDG. On the other hand, location data also suggests that a significant number of faults occur when the ship is at the harbour, as presented in Table 9. Hence, in perspective, the MDGs are run most of the time when the ship is alongside at the harbour; this could explain the reliability issues with the sea chest and air filter due to objects in the water and air quality around the port. In this regard, the running of the MDGs at the harbour could be an additional factor impacting their overall reliability, as could failures that are related to the cooling and air intake systems. The challenge of running the MDGs at the harbour can be addressed by providing shore power supply, which can help improve the MDGS reliability as well as provide the opportunity for maintenance to be carried out in a more conducive environment.
On the other hand, ship maintenance has evolved beyond system reliability in terms of cost and availability. Increased advocacy by the IMO, regulatory agencies, interest groups, and classification societies has helped to make shipping companies more aware of the environmental impact of their operations. Therefore, in line with IMO’s regulations with respect to EEDI and SEEMP, efficient maintenance will go beyond onboard maintenance tasks; other aspects that contribute to the successful implementation of maintenance will play a vital role. Accordingly, emissions from MDGs could be broadly classified into two types: direct emissions due to the operations of the MDG and indirect emissions due to associated maintenance and repair activities.
Direct emission as a result of component failures such as turbochargers, tappet/valve spring faults, air filters, injector nozzles, heat exchanger faults, piston rings, etc. could raise the possibility of emission due to overheating or incomplete combustion. Many OEMs have incorporated diagnostic systems that can provide information on fuel flow, air flow rate, and many other parameters to protect the engine. However, inefficient combustion due to fuel quality and valve timing is not adequately addressed. In this regard, placing a carbon metre along the exhaust gas path to alert of any fluctuation or count for the carbon emission threshold would provide much-needed information and help to improve efficiency in maintenance to ensure component reliability reflects the ship emission reduction goal.
On the other hand, indirect emissions are those associated with activities such as spare parts supply processes, maintenance, or repairs that require external support, such as OEM or equipment specialists. These activities require additional travel to the location of the ship as well as other logistics regarding transfer onboard. Beyond the issue of travel is that of planning and ensuring that those critical components that can be held onboard are sufficiently stocked, while those that cannot are adequately provided either at the port or by a vendor. Therefore, the component criticality analysis will help the ship operator understand the most critical components based on usage failure or degradation in performance, and this can be used to prioritise spare parts held onboard or schedule a specialist intervention. Additional spares that could be difficult or expensive to source could be adequately catered for within the service plan or budget. Periodic maintenance or inspection that requires OEMs or specialists can be planned in such a way that journeys are made in a more efficient manner or that video calls are used to conduct remote servicing by competent personnel onboard.

6. Conclusions and Future Work

The reliability of diesel-powered engines on board ships is increasingly taking centre stage in both the ship’s operational availability and its compliance with emission control regulations due to additional scrutiny put in place by the IMO to address emissions generated by marine diesel engines. Accordingly, to ensure compliance, ship operators are adopting more efficient maintenance approaches that ensure the availability of equipment and system reliability while minimising overall emissions. Nonetheless, operators face challenges relating to operating conditions such as climate, operating profile, technical capacity, and the availability of genuine spare parts and other consumables such as fuel and lubricating oil. These issues add huge constraints to the ship operator’s ability to abide by some of the emission reduction regulations. The existing traditional maintenance approach and flexibility afforded by the development of sensor technology, as well as insight gained through data analysis, can provide an efficient solution to challenges in ship maintenance. Similarly, the combined use of reliability analysis tools and machinery health monitoring data would help with the early detection of equipment failure.
Therefore, a hybrid methodology using DFTA, Bir IM, and ANN feedforward neural networks was developed for component criticality and fault identification, respectively. Using the methodology, a case study was conducted on the power generation system of an OPV consisting of 4× MDG. Accordingly, the criticality analysis came up with many components, such as the freshwater heat exchanger, sea chest, air filter, turbo charger, valve/tappet, piston crown, etc. The majority of the critical components lead to faults that are particularly significant in increasing fuel consumption and reducing output on the MDGs, hence leading to load shading or tripping. Accordingly, an ANN feedforward neural net was developed for fault identification, and EGT was used as the predictor based on the ANOVA score of 8.9, while power output in KW was an independent variable. The model was trained using aggregated data from all MDGs and thereafter tested on MDG 2.
Model validation was performed using new data from MDGs 3 and 4. Overall, the model’s performance was above 83% TPR with less than 15% FNR. A major finding suggests that most faults occur at EGT above 250 °C, corresponding to a power output range between 80 and 120 kw. These findings are very significant, going by the operating records of the MDGs. In actual operation, the MDGs hardly go beyond 50% of their rated output (400 kw), so having the faults occur at that power output suggests a greater problem. The test prediction model using MDG 4 also shows a very similar pattern, with additional points occurring at lower EGTs above 200 °C. On the other hand, location data also suggests that a significant number of faults occur when the ship is at the harbour, suggesting that MDG are run most of the time when the ship is alongside at the harbour. This could explain the reliability issues with the sea chest and air filter due to objects in the water and the air quality around the port.
In this paper, efforts have been made to present a novel methodology based on hybrid reliability and diagnostics analysis using a combination of reliability analysis tools and ANN classification. The methodology has identified components critical to maintenance and related faults due to degraded component or sub-system performance. Therefore, future research directions could investigate fault classification and mapping to component failure. Similarly, investigating the impact of component failure on ship emissions using reliability analysis and machinery health data to improve maintenance planning is recommended.

Author Contributions

Conceptualisation, A.A.D. and I.L.; methodology, A.A.D. and I.L.; software, A.A.D.; validation, A.A.D.; formal analysis, A.A.D. and I.L.; investigation, I.L. and A.A.D.; resources, A.A.D.; data curation, A.A.D.; writing—original draft preparation, A.A.D.; writing—review and editing, A.A.D. and I.L.; visualisation, A.A.D.; supervision, I.L.; project administration, A.A.D.; funding acquisition, A.A.D. All authors have read and agreed to the published version of the manuscript.

Funding

This research was funded by the Petroleum Technology Development Fund (PTDF) of Nigeria, grant number 17PHD178.

Data Availability Statement

The data presented in this study are available on request from the corresponding author.

Acknowledgments

The author wants to acknowledge and appreciate the support and scholarship funding received from the Federal Government of Nigeria via the Petroleum Technology Development Fund (PTDF) and the Nigerian Navy for providing access to ship data used in the research.

Conflicts of Interest

The funders as well as the data providers had no role in the design of the study, in the collection, analysis, or interpretation of data, in the writing of the manuscript, or in the decision to publish the results.

Abbreviations

ABS (NS)American Bureau of Shipping (Nautical System)ISM codeInternational Safety Management
ANNArtificial Neural NetworkMCSMinimal Cut Set
BBNBayesian Belief NetworkMTTFMean Time to Failure
BEBasic EventMTBFMean Time Between Failure
BSIBritish Standards InstitutionMDTMean Down Time
CBMCondition-Based MaintenanceMROMaintenance, Repair, and Overhaul
CMMSComputerised Maintenance Management SystemNASANational Aeronautics and Space Administration
CPTConditional Probability TableNPRDNon-Electronic Reliability Data
RPNRisk Priority Number OEMOriginal Equipment Manufacturer
OREDAOffshore and Onshore Reliability DataOPV Offshore Patrol Vessel
MDGMarine Diesel GeneratorPANDPriority- AND
ETAEvent Tree AnalysisDFTA Dynamic Fault Tree
DSSDecision Support SystemPMSPlanned Maintenance System
GHGGreen House GasRCMReliability-Centred Maintenance
CIICarbon Intensity IndexUNUnited nations
EEXIEnergy Efficiency Existing Ship IndexRPMRevolution Per Minute
SEEMPShip Energy Efficiency Management planLoPLubricating Oil Pressure
EEDIEnergy Efficiency Ship Design IndexFWT(A/B)Fresh Water Temperature (Bank A/B)
FDEPFunctional Dependency LoTLubricating Oil Temperature
FMEAFailure Mode and Effect AnalysisFWPFresh Water Pressure
FMECAFailure Mode Effect and Criticality AnalysisEGTA(A/B)Exhaust Gas Temperature (Bank A/B)
FTAFault Tree AnalysisRHRunning Hours
IMImportance Measure KWKilo Watt
IMOInternational Maritime Organisation HRSHours

References

  1. OREDA. OREDA Offshore Reliability Data Handbook, 4th ed.; OREDA: Ontario, OR, USA, 2002. [Google Scholar]
  2. BahooToroody, A.; Abaei, M.M.; Banda, O.V.; Kujala, P.; De Carlo, F.; Abbassi, R. Prognostic health management of repairable ship systems through different autonomy degree; From current condition to fully autonomous ship. Reliab. Eng. Syst. Saf. 2022, 221, 108355. [Google Scholar] [CrossRef]
  3. Nguyen, V.H. Optimal Ship Maintenance Scheduling under Restricted Conditions and Constrained Resoures. Ph.D. Thesis, Old Dominion University, Norfolk, VA, USA, 2017. [Google Scholar]
  4. Wan, Z.; El Makhloufi, A.; Chen, Y.; Tang, J. Decarbonizing the international shipping industry: Solutions and policy recommendations. Mar. Pollut. Bull. 2018, 126, 428–435. [Google Scholar] [CrossRef] [PubMed] [Green Version]
  5. IMO. 2021 Revised MARPOL Annex VI. In MEPC.328(76); IMO: Imo, Nigeria, 2021. [Google Scholar]
  6. IMO. Prohibition on the Carriege of Non-Compliant Oil for Combustion Onboard A Ship. In MEPC.305(73); IMO: Imo, Nigeria, 2018. [Google Scholar]
  7. Balcombe, P.; Brierley, J.; Lewis, C.; Skatvedt, L.; Speirs, J.; Hawkes, A.; Staffell, I. How to decarbonise international shipping: Options for fuels, technologies and policies. Energy Convers. Manag. 2019, 182, 72–88. [Google Scholar] [CrossRef]
  8. Ren, J.; Liang, H. Measuring the sustainability of marine fuels: A fuzzy group multi-criteria decision making approach. Transp. Res. Part D Transp. Environ. 2017, 54, 12–29. [Google Scholar] [CrossRef]
  9. Specialty, A.G.C.a. Shipping Loss and Accident Locations and Common Causes; Allianz Global Corporate & Specialty: Hong Kong, China, 2019. [Google Scholar]
  10. Gkerekos, C.; Lazakis, I.; Theotokatos, G. Machine learning models for predicting ship main engine Fuel Oil Consumption: A comparative study. Ocean Eng. 2019, 188, 106282. [Google Scholar] [CrossRef]
  11. Iheukwumere-Esotu, L.O.; Yunusa-Kaltungo, A. Knowledge Criticality Assessment and Codification Framework for Major Maintenance Activities: A Case Study of Cement Rotary Kiln Plant. Sustainability 2021, 13, 4619. [Google Scholar] [CrossRef]
  12. Daya, A.A.; Lazakis, I. Investigating ship system performance degradation and failure criticality using FMECA and Artificial Neural Networks. Trends Marit. Technol. Eng. 2022, 2, 185–195. [Google Scholar]
  13. Daya, A.A.; Lazakis, I. Application of Artifical Neural Network and Dynamic Fault Tree Analysis to Enhance Reliability in Predicitive Ship Machinery Health Condintion Monitoring. In Proceedings of the 2nd International Conference on Ship and Marine Technology, Istanbul, Turkey, 16–17 September 2021. [Google Scholar]
  14. Kim, G.S.; Lee, Y.H. Transformation towards a Smart Maintenance Factory: The Case of a Vessel Maintenance Depot. Machines 2021, 9, 267. [Google Scholar] [CrossRef]
  15. Cheliotis, M.; Lazakis, I.; Theotokatos, G. Machine learning and data-driven fault detection for ship systems operations. Ocean Eng. 2020, 216, 107968. [Google Scholar] [CrossRef]
  16. Karatuğ, Ç.; Arslanoğlu, Y. Development of condition-based maintenance strategy for fault diagnosis for ship engine systems. Ocean Eng. 2022, 256, 111515. [Google Scholar] [CrossRef]
  17. Zhang, P.; Gao, Z.; Cao, L.; Dong, F.; Zou, Y.; Wang, K.; Zhang, Y.; Sun, P. Marine Systems and Equipment Prognostics and Health Management: A Systematic Review from Health Condition Monitoring to Maintenance Strategy. Machines 2022, 10, 72. [Google Scholar] [CrossRef]
  18. Rausand, M.; Barros, A.; Hoyland, A. System Reliability Theory Models, Statistical Methods and Application; Wiley: Hoboken, NJ, USA, 2021. [Google Scholar]
  19. BSI. Information and Documentation Management Systems for Records-Reqirements; BSI: London, UK, 2011. [Google Scholar]
  20. Lazakis, I.; Ölçer, A. Selection of the best maintenance approach in the maritime industry under fuzzy multiple attributive group decision-making environment. Proc. Inst. Mech. Eng. Part M J. Eng. Marit. Environ. 2015, 230, 297–309. [Google Scholar] [CrossRef]
  21. Kiran, S.; Prajeeth Kumar, K.P.; Sreejith, B.; Muralidharan, M. Reliability Evaluation and Risk Based Maintenance in a Process Plant. Procedia Technol. 2016, 24, 576–583. [Google Scholar] [CrossRef] [Green Version]
  22. Lazakis, I.; Raptodimos, Y.; Varelas, T. Predicting ship machinery system condition through analytical reliability tools and artificial neural networks. Ocean Eng. 2018, 152, 404–415. [Google Scholar] [CrossRef] [Green Version]
  23. Ben-Daya, M.; Duffuaa, S.O.; Raouf, A.; Knezevic, J.; Ait-Kadi, D. (Eds.) Handbook of Maintenance Management and Engineering; Springer: Berlin/Heidelberg, Germany, 2009. [Google Scholar] [CrossRef]
  24. Lazakis, I.; Dikis, K.; Michala, A.L.; Theotokatos, G. Advanced Ship Systems Condition Monitoring for Enhanced Inspection, Maintenance and Decision Making in Ship Operations. Transp. Res. Procedia 2016, 14, 1679–1688. [Google Scholar] [CrossRef] [Green Version]
  25. Dao, P.B.; Staszewski, W.J.; Barszcz, T.; Uhl, T. Condition monitoring and fault detection in wind turbines based on cointegration analysis of SCADA data. Renew. Energy 2018, 116, 107–122. [Google Scholar] [CrossRef]
  26. Soliman, M.H. Machine Reliability and Condition Monitoring A Comprehensive Guide to Predictive Maintenance Planing; KDP and Lulu: Cairo, Egypt, 2020. [Google Scholar]
  27. Bousdekis, A.; Papageorgiou, N.; Magoutas, B.; Apostolou, D.; Mentzas, G. Enabling condition-based maintenance decisions with proactive event-driven computing. Comput. Ind. 2018, 100, 173–183. [Google Scholar] [CrossRef]
  28. Martin-del-Campo, S.; Sandin, F. Online feature learning for condition monitoring of rotating machinery. Eng. Appl. Artif. Intell. 2017, 64, 187–196. [Google Scholar] [CrossRef]
  29. NASA. Fault Tree Handbook with Aerospace Applications; NASA: Washington, DC, USA, 2002. [Google Scholar]
  30. Chojnacki, E.; Plumecocq, W.; Audouin, L. An expert system based on a Bayesian network for fire safety analysis in nuclear area. Fire Saf. J. 2019, 105, 28–40. [Google Scholar] [CrossRef]
  31. de Jonge, B.; Teunter, R.; Tinga, T. The influence of practical factors on the benefits of condition-based maintenance over time-based maintenance. Reliab. Eng. Syst. Saf. 2017, 158, 21–30. [Google Scholar] [CrossRef]
  32. Melani, A.H.A.; Murad, C.A.; Caminada Netto, A.; Souza, G.F.M.D.; Nabeta, S.I. Criticality-based maintenance of a coal-fired power plant. Energy 2018, 147, 767–781. [Google Scholar] [CrossRef]
  33. Volkanovski, A.; Čepin, M.; Mavko, B. Application of the fault tree analysis for assessment of power system reliability. Reliab. Eng. Syst. Saf. 2009, 94, 1116–1127. [Google Scholar] [CrossRef]
  34. Leimeister, M.; Kolios, A. A review of reliability-based methods for risk analysis and their application in the offshore wind industry. Renew. Sustain. Energy Rev. 2018, 91, 1065–1076. [Google Scholar] [CrossRef]
  35. Stopford, M. Maritime Economics; Routledge: London, UK, 2009. [Google Scholar]
  36. IMO. International Safety Management Code with Guidance for Its Implementation; Organistaion, I.M., Ed.; IMO: Imo, Nigeria, 2018. [Google Scholar]
  37. IACS. A Guide to Managing Maintenance in Accordance with the Requirements of the ISM Code; IACS: Hamburg, Germany, 2018. [Google Scholar]
  38. ISO. Condition Monitoring and Diagnostics of Machines—General Guidelines; ISO: London, UK, 2018. [Google Scholar]
  39. ClassNK. Good Maintenance Onboard Ships; ClassNK, Ed.; ClassNK: Tokyo, Japan, 2017. [Google Scholar]
  40. ABS. Equipment Condition Monitoring; ABS: Houston, TX, USA, 2016. [Google Scholar]
  41. Raptodimos, Y.; Lazakis, I.; Theotokatos, G.; Varelas, T.; Drikos, L. Ship Sensors Data Collection & Analysis for Condition Monitoring of Ship Structures & Machinery Systems. Smart Ships Technol. 2016, 2016, 77–86. [Google Scholar]
  42. Emovon, I.; Norman, R.A.; Murphy, A.J. Hybrid MCDM based methodology for selecting the optimum maintenance strategy for ship machinery systems. J. Intell. Manuf. 2015, 29, 519–531. [Google Scholar] [CrossRef]
  43. Lazakis, I.; Turan, O.; Aksu, S. Increasing ship operational reliability through the implementation of a holistic maintenance management strategy. Ships Offshore Struct. 2010, 5, 337–357. [Google Scholar] [CrossRef]
  44. Raptodimos, Y.; Lazakis, I. Using artificial neural network-self-organising map for data clustering of marine engine condition monitoring applications. Ships Offshore Struct. 2018, 13, 649–656. [Google Scholar] [CrossRef] [Green Version]
  45. Cicek, K.; Celik, M. Application of failure modes and effects analysis to main engine crankcase explosion failure on-board ship. Saf. Sci. 2013, 51, 6–10. [Google Scholar] [CrossRef]
  46. Hirzinger, B.; Nackenhorst, U. Efficient model-correction-based reliability analysis of uncertain dynamical systems. Acta Mech. 2023. [Google Scholar] [CrossRef]
  47. Byun, S.; Papaelias, M.; Márquez, F.P.G.; Lee, D. Fault-Tree-Analysis-Based Health Monitoring for Autonomous Underwater Vehicle. J. Mar. Sci. Eng. 2022, 10, 1855. [Google Scholar] [CrossRef]
  48. Relex. Reliability: Practitioner’s Guide; Bangalore, B., Paul, D., Geoff, P., Ron, S., Robert, W., Eds.; Relex Software Corporation: Greensburg, PA, USA, 2003; p. 350. [Google Scholar]
  49. Kabir, S. An overview of fault tree analysis and its application in model based dependability analysis. Expert Syst. Appl. 2017, 77, 114–135. [Google Scholar] [CrossRef] [Green Version]
  50. Turan, O.; Lazakis, I.; Judah, S. Establishing the Optimum Vessel Maintenance Approach Based on System Reliability and Criticality Analysis. In Managing Reliability & Maintainability in the Maritime Industry; Royal Institution of Naval Architects: London, UK, 2012; pp. 59–70. [Google Scholar]
  51. Ruijters, E.; Stoelinga, M. Fault tree analysis: A survey of the state-of-the-art in modeling, analysis and tools. Comput. Sci. Rev. 2015, 15–16, 29–62. [Google Scholar] [CrossRef] [Green Version]
  52. Raptodimos, Y. Combination of Reliability Tools and Artificial Intelligence for Ship Machinery Systems. Ph.D. Thesis, University of Strathclyde, Glasgow, UK, 2018. [Google Scholar]
  53. Dikis, K.; Lazakis, I.; Taheri, A.; Theotokatos, G. Risk and Reliability Analysis Tool Development for Ship Machinery. In Proceedings of the 5th International Symposium on Ship Operations, Management and Economics (SOME), Athens, Greece, 28–29 May 2015. [Google Scholar]
  54. Ayo-Imoru, R.M.; Cilliers, A.C. A survey of the state of condition-based maintenance (CBM) in the nuclear power industry. Ann. Nucl. Energy 2018, 112, 177–188. [Google Scholar] [CrossRef]
  55. Fu, S.; Yu, Y.; Chen, J.; Han, B.; Wu, Z. Towards a probabilistic approach for risk analysis of nuclear-powered icebreakers using FMEA and FRAM. Ocean Eng. 2022, 260, 112041. [Google Scholar] [CrossRef]
  56. Liang, X.; Yi, H.; Zhang, Y.; Li, D. Reliability and safety analysis of an Underwater Dry Maintenance Cabin. Ocean Eng. 2010, 37, 268–276. [Google Scholar] [CrossRef]
  57. Zhang, Y.; Zhang, C.; Wang, S.; Chen, R.; Tomovic, M.M. Performance Degradation Based on Importance Change and Application in Dissimilar Redundancy Actuation System. Mathematics 2022, 10, 843. [Google Scholar] [CrossRef]
  58. Chen, R.; Zhang, C.; Wang, S.; Zio, E.; Dui, H.; Zhang, Y. Importance measures for critical components in complex system based on Copula Hierarchical Bayesian Network. Reliab. Eng. Syst. Saf. 2023, 230, 108883. [Google Scholar] [CrossRef]
  59. Zhou, S.; Ye, L.; Xiong, S.; Xiang, J. Reliability analysis of dynamic fault trees with Priority-AND gates based on irrelevance coverage model. Reliab. Eng. Syst. Saf. 2022, 224, 108553. [Google Scholar] [CrossRef]
  60. Codetta-Raiteri, D.; Portinale, L. Generalized Continuous Time Bayesian Networks as a modelling and analysis formalism for dependable systems. Reliab. Eng. Syst. Saf. 2017, 167, 639–651. [Google Scholar] [CrossRef]
  61. Eriksen, S.; Utne, I.B.; Lützen, M. An RCM approach for assessing reliability challenges and maintenance needs of unmanned cargo ships. Reliab. Eng. Syst. Saf. 2021, 210, 107550. [Google Scholar] [CrossRef]
  62. Nadakatti, M.; Onori, M.; Ramachandra, A.; Santosh Kumar, A.N. Artificial intelligence-based condition monitoring for plant maintenance. Assem. Autom. 2008, 28, 143–150. [Google Scholar] [CrossRef]
  63. Cipollini, F.; Oneto, L.; Coraddu, A.; Murphy, A.J.; Anguita, D. Condition-Based Maintenance of Naval Propulsion Systems with supervised Data Analysis. Ocean Eng. 2018, 149, 268–278. [Google Scholar] [CrossRef] [Green Version]
  64. Coraddu, A.; Oneto, L.; Ghio, A.; Savio, S.; Anguita, D.; Figari, M. Machine learning approaches for improving condition-based maintenance of naval propulsion plants. Proc. Inst. Mech. Eng. Part M J. Eng. Marit. Environ. 2014, 230, 136–153. [Google Scholar] [CrossRef]
  65. Aizpurua, J.I.; Knutsen, K.E.; Heimdal, M.; Vanem, E. Integrated machine learning and probabilistic degradation approach for vessel electric motor prognostics. Ocean Eng. 2023, 275, 114153. [Google Scholar] [CrossRef]
  66. Cipollini, F.; Oneto, L.; Coraddu, A.; Murphy, A.J.; Anguita, D. Condition-based maintenance of naval propulsion systems: Data analysis with minimal feedback. Reliab. Eng. Syst. Saf. 2018, 177, 12–23. [Google Scholar] [CrossRef] [Green Version]
  67. Wu, S.-j.; Gebraeel, N.; Lawley, M.A.; Yih, Y. A Neural Network Integrated Decision Support System for Condition-Based Optimal Predictive Maintenance Policy. IEEE Trans. Syst. Man Cybern.—Part A Syst. Hum. 2007, 37, 226–236. [Google Scholar] [CrossRef]
  68. Gurney, K. An Introduction to Neural Networks; Taylor and Francis Group: London, UK, 1997. [Google Scholar]
  69. Farag, Y.B.A.; Ölçer, A.I. The development of a ship performance model in varying operating conditions based on ANN and regression techniques. Ocean Eng. 2020, 198, 106972. [Google Scholar] [CrossRef]
  70. Kang, Y.-J.; Noh, Y.; Jang, M.-S.; Park, S.; Kim, J.-T. Hierarchical level fault detection and diagnosis of ship engine systems. Expert Syst. Appl. 2023, 213, 118814. [Google Scholar] [CrossRef]
  71. Karatuğ, Ç.; Arslanoğlu, Y.; Guedes Soares, C. Design of a decision support system to achieve condition-based maintenance in ship machinery systems. Ocean Eng. 2023, 281, 114611. [Google Scholar] [CrossRef]
  72. Stetco, A.; Dinmohammadi, F.; Zhao, X.; Robu, V.; Flynn, D.; Barnes, M.; Keane, J.; Nenadic, G. Machine learning methods for wind turbine condition monitoring: A review. Renew. Energy 2019, 133, 620–635. [Google Scholar] [CrossRef]
  73. Velasco-Gallego, C.; Lazakis, I. Real-time data-driven missing data imputation for short-term sensor data of marine systems. A comparative study. Ocean Eng. 2020, 218, 108261. [Google Scholar] [CrossRef]
  74. Wang, R.; Chen, H.; Guan, C. A self-supervised contrastive learning framework with the nearest neighbors matching for the fault diagnosis of marine machinery. Ocean Eng. 2023, 270, 113437. [Google Scholar] [CrossRef]
  75. Velasco-Gallego, C.; Lazakis, I. RADIS: A real-time anomaly detection intelligent system for fault diagnosis of marine machinery. Expert Syst. Appl. 2022, 204, 117634. [Google Scholar] [CrossRef]
  76. Sazli, M.H. A brief review of feed-forward neural networks. Commun. Fac. Sci. Univ. Ank. 2006, 50, 11–17. [Google Scholar] [CrossRef]
  77. Sarwar, U.; Muhammad, M.B.; Karim, A.A.A. Time Series Method for Machine Performance Prediction Using Condition Monitoring Data. In Proceedings of the 2014 International Conference on Computer, Communications, and Control Technology (I4CT), Langkawi, Malaysia, 2–4 September 2014. [Google Scholar]
  78. Daya, A.A.; Lazakis, I. A Semi Automated Model for Improving Vessel System Reliability and Maintenance Management. In RINA Autonomos Ships; RINA: London, UK, 2022. [Google Scholar]
Figure 1. Hybrid methodology framework.
Machines 11 00737 g001
Figure 2. Data-labelling process.
Machines 11 00737 g002
Figure 3. DFTA model of the PGS.
Machines 11 00737 g003
Figure 4. Subsystem DFTA model for MDG.
Machines 11 00737 g004
Figure 5. Overall reliability of the power generation system.
Machines 11 00737 g005
Figure 6. Summary of individual MDG reliability.
Machines 11 00737 g006
Figure 7. Critical components that are common to all MDGs.
Machines 11 00737 g007
Figure 8. Trained model performance.
Machines 11 00737 g008
Figure 9. Training model.
Machines 11 00737 g009
Figure 10. Trained fault identification model with MDG4 data.
Machines 11 00737 g010
Figure 11. Test model accuracy.
Machines 11 00737 g011
Figure 12. Prediction using a sample dataset of all MDGs.
Machines 11 00737 g012
Table 1. Strengths and Weaknesses of the most common reliability analysis tools and approaches.
ToolStrengthWeakness
BBN
  • Ability to produce an acceptable model with limited information using probabilistic inference.
  • Good at modelling complex systems using both quantitative and qualitative data.
  • As a directed acyclic graph, BBN enables comprehensive visualisation of interactions between systems/components/events.
  • Ability to conduct analysis through the integration of multiple data types such as expert knowledge, empirical data, and historical records.
  • Efficient for building decision support models.
  • The accuracy of the model depends on probabilistic data estimates.
  • BBN structure can be complex and requires expert knowledge.
  • Increased complexity with an increase in the size of the model may require expert knowledge for interpretation.
  • Computationally complex with an increase in data size and types, hence making probabilistic inference difficult.
  • Susceptibility to model assumptions/expert judgement, which may interfere with output quality.
DFTA
  • Ability to track system events and component dependencies and interactions.
  • Enables dynamic behaviour modelling by considering events and components time-dependent interactions.
  • Real-time analysis can monitor system dependability and failure probabilities in real time.
  • Quantitative analysis quantifies system reliability by assigning probabilities to events and estimating system state and failure mode probabilities.
  • DFTA visualises the fault tree, making it easier to comprehend and discuss system reliability and failure modes.
  • By comparing system performance and component dependability, DFTA can help inform judgements.
  • Event sequence analysis, using the minimal cut set (MCS), DFTA enables the identification of critical routes or combinations of events that can cause system failures and provides focused mitigation.
  • Model creation and verification are time-consuming and require expert knowledge.
  • Complexity and data requirements involve detailed knowledge of the system’s components, failure modes, and interdependencies.
  • Sensitivity to assumptions, such as probabilities, repair techniques, and maintenance policies.
  • Dynamic behaviour assumptions for event probabilities and repair or maintenance schedules could lead to inaccurate results.
  • Model size could become difficult to manage and interpret for complex systems.
  • Interpretation difficulties: non-experts may have trouble interpreting DFTA results.
  • Data availability and reliability: DFTA requires accurate and reliable data to calculate failure probability, repair timelines, and other factors.
ETA
  • Good for visualisation.
  • The ability to analyse complex systems.
  • Enables evaluation of critical events and their impacts
  • Expert judgement can be used to improve accuracy.
  • Adaptability and flexibility to address multiple systems.
  • Enables assessment of critical events and their effects.
  • Ability to manage event dependencies.
  • Enables risk assessment and decision-making.
  • May become complicated with size.
  • Depends a lot on accurate probability data, without which the model will be misrepresentative of the system.
  • Modelling assumptions can create uncertainties.
  • Subjective judgement may impact the accuracy of the analysis.
  • Limitations in modelling temporal and dynamic system interactions.
  • Difficulty in analysing repeated or common-cause failures.
  • Heavy reliance on historical data.
  • Model quality depends on expert knowledge.
FTA
  • Enable reliability prediction by quantifying the likelihood of distinct failure modes and their combinations.
  • FTA enables systemic analysis of failure events and can identify critical faults.
  • Visual representation provides efficient event-failure mode links, which may aid expert-stakeholder collaboration.
  • FTA supports both qualitative and quantitative data inputs. When quantitative data is lacking, it can include qualitative expert judgements and knowledge.
  • Enables identification of critical failure paths.
  • FTA can help identify high-risk events or failure modes and can be used to prioritise resources to reduce the most significant risks, reducing system breakdowns.
  • Understanding and interpreting the fault tree diagram and probability may require expert knowledge.
  • Limited dynamic behaviour modelling, regardless of time, system conditions, and dependencies.
  • FTA model development is difficult, especially for big and complex systems, and requires correct and sufficient data.
  • FTA primarily targets single-point failures. It may not represent complex scenarios such as common course failures, cascading component faults, etc.
  • FTA may not analyse human factors in reliability analysis.
  • Limited temporal analysis may not analyse failure timing and sequencing.
RBD
  • RBD provides system reliability visualisation, which can help display system reliability dependencies and failure routes.
  • Use both Quantitative and qualitative data for analysis.
  • RBD can efficiently handle serial, parallel, and complicated subsystems. It can model system reliability for different system designs and setups.
  • RBD simplifies system structure and reliability linkages. Does not require in-depth technical knowledge, and non-technical stakeholders can understand and communicate it.
  • Scalability: RBD can accommodate systems of various sizes and complexity. It works for small and large systems.
  • RBD’s modular structure enables component or subsystem examination, enabling localised reliability gains and targeted maintenance or replacement strategies.
  • RBD diagram may get congested as the system size increases, making reliability relationship analysis difficult.
  • RBD may oversimplify component and subsystem dependencies. Unless expressly modelled, this may misrepresent system reliability.
  • Common cause failures: RBDs may struggle to represent common cause failures.
  • RBD is static and does not explicitly model the system’s dynamic behaviour over time.
  • RBD can be limited in analysing repair time distributions, system availability, or component-level diagnostics.
  • Accurate input data is crucial since small changes in these characteristics can dramatically affect dependability evaluation.
ANN
  • ANNs are good for pattern recognition and can recognise complex machinery defect patterns.
  • ANNs can model nonlinear input-output relationships.
  • ANNs can efficiently adapt, and generalised data can learn fault patterns from fault data and detect errors in real time or on new equipment instances.
  • Feature extraction: ANNs can learn and extract useful characteristics from raw sensor data without manual feature engineering.
  • ANNs enable real-time monitoring and therefore, can continuously monitor machinery and detect faults, i.e., online.
  • ANNs structure and variants make them good for fault classification. ANNs can detect and categorise defects.
  • ANNs require relatively large, labelled training data to accurately learn fault patterns.
  • Difficulty in understand the model’s predictions, as such, can make fault detection results hard to explain or defend.
  • ANNs can be overfitted to training data and fail to generalise to unseen data.
  • ANNs are sensitive to training data quality and representativeness. Hence, data pre-processing is very necessary for quality analysis.
  • Training large, deep, or high-dimensional ANNs can be computationally intensive.
  • ANNs cannot provide physical insights into defect processes or equipment behaviour.
Table 2. Component failure rate per 10,000 h samples.
Components Frequency
Failure typeAction takenMDG1MDG2MDG3MDG4
Turbo chargerBlack smokeReplaced and repaired8101212
Lube oil coolerOil leakage1. Replaced
2. Cleaned and the zinc anode replaced
16181516
External leakage 108812
Oil cooler valveFailedremove/repaired1121
Cylinder head1. Oil leakage
2. Fresh water leakage from A2 exhaust
3. Unable to start
1. Liner, O-ring replaced (G1, G3)
2. Cylinder replaced (G3, G2) Replaced gasket (G3)
20191× (A1, A2); 3× (A2, liner); 2× (A2 head); 1× (A3,B2 gskt)21
Guide bushing20142020
O-ring28322323
Holding bolts18171716
Cylinder jacket/sleeve1. Scuffed × 4
2. Cracked × 2
Replaced11121112
PistonRingsReplaced12131314
Cooling/crown 8131514
ConRodBent 7989
Gudgeon pin 8686
Drive beltFailedReplaced88911
Torn(wear)Replaced11593
Mech Injector pump1. Cracked bolts
2. Broken bolts
3. Broken shims
1. Replace bolt and drive (G1, G3)
2. Replace bolt and pulley and set injector timing (G1, G2)
3. Replaced shims
16121213
Drivedefects22202124
Table 3. Diesel Generator operating parameters.
ParameterOperating Ranges
MinMaxAlarm Level
Engine Speed (RPM)178918502052
Lubricating Oil Pressure (Mpa)0.40.55>0.6
Cooling Fresh Water Temperature banks, A/B (°C)7580>85 °C
Fresh water pressure (Mpa)0.020.25>0.3
Lubricating Oil Temperature (°C)30110 >120 °C
Exhaust Gas temperature banks A/B (°C)220400 >520
Generator running hours≥2000 hN/AN/A
Power Output (Kw)0350 Kw350 Kw
Date/timeJanuary 2019December 2019N/A
Table 4. Comparison of the three IM values.
EventBirnbaumCriticalityFussell-Vesely
Sea Chest0.4970180.4970180.013959
Intercooler0.4970180.0139590.013959
Heat exchanger0.5278220.0246460.024646
Fuel Supply pump0.6042330.0238610.023861
Journal bearing0.6321210.0225800.022580
Main bearing0.6321210.0225800.022580
Cylinder head O-ring0.6340480.0627170.062717
Tappets/Valves0.7959190.0273370.027337
Heat Exchanger tubes0.8262960.0246460.024646
Guide Bushing0.8875860.0627170.062717
Crankshaft1.0000000.0464630.046463
Governor1.000000.0439010.043901
Cylinder head Bolts1.00000.0629420.062942
Injection nozzles1.00000.0732720.073272
Table 5. MDG component criticality.
MDG1PercentageMDG3Percentage
Sea Chest50 Fuel return line 61
Intercooler50 Gasket67
Heat exchanger53 Cylinder head bolt71
Fuel Supply pump 60 Injector Camshaft84
Journal bearing63 Injector drive84
Main bearing63 Injector Plunger84
Cylinder head O-ring 63 FW Circulation Pump90
Tappets/Valves80 Air Filter 91
Heat Exchanger tubes 83 Heat Ex SW Thermostat94
Guide Bushing 89 Primary fuel lift pump95
Crankshaft100 Turbo Charger96
Governor 100 FW Thermostat97
Cylinder head Bolts 100 Sea Chest98
Injection nozzles100 Fuel Filter100
MDG2 MDG4
Fuel Supply pump44 Oil inlet hose53
Fuel injection pump drive 64 Air Filter55
Cylinder block damage89 Pulley 56
Cylinder damage100 Valve seats 74
FW HE Tubes 100 Water HE tubes 79
FW Thermostat 100 Piston Crown 100
Fuel pump Pulley bolts100 FW Circulation Pump100
Sea Chest70 Oil Filter100
Table 6. Summary of MDG hourly log data.
RPMLoPFWTAFWTBLoTFWPEGTAEGTBHRSKW
Count150150150150150150150150150150
Mean18000.566.168.884.40.08334.7317.62527128
std2.90.13.43.84.70.0139.338.9270334.7
Min.17830.3340.742.741.60.05161.2146.952365
25%17990.3865.267.782.40.07310.2287.5603.3100
50%18000.5666.268.884.60.07339.5325.8636.5130
75%18010.5767.470.386.40.08352337.56341140
Max.18120.8674.177.1940.12426.8408.16379240
Table 7. Sample fault identification data labels.
RPMLoPFWTAFWTBLoTFWPEGTAEGTBRHKWFaultTemp
18000.45872.975.4900.067332.1319.55234115NormalNML
18000.46572.875.389.90.068335.3323.95235120NormalNML
18000.5972.0174.0689.30.068329.5316.75236115FaultHTM
18000.5370.773.287.60.068310.229.45262100NormalNML
18000.587880.6896.20.066366.1355.95294150AbnormalOVH
18010.5875.878.694.60.067360.4351.75298140AbnormalHTM
18000.50476.279.1950.067361.2353.15299140NormalHTM
18000.5878.678.794.50.067359.1350.15300140AbnormalHTM
18000.50276.279.194.80.067358.33515201140NormalHTM
18000.49975.878.895.60.067360.1353.75302150NormalNML
18000.48877.880.596.10.066374.2363.35203140NormalOVH
18000.49877.38095.80.066364.3354.35204150NormalHTM
Table 8. ANOVA feature Score.
FeaturesANOVA Ranking
EGTA8.9
EGTB8.5
Lube Oil Pressure1.3
FWTEMPA0.6
FWTEMPB1.0
Location4.2
Power Output6.7
Table 9. MDG failure count by location.
LocationPeriodCount
January–December 2019NormalFault
Harbour104317
Sea82214
Disclaimer/Publisher’s Note: The statements, opinions and data contained in all publications are solely those of the individual author(s) and contributor(s) and not of MDPI and/or the editor(s). MDPI and/or the editor(s) disclaim responsibility for any injury to people or property resulting from any ideas, methods, instructions or products referred to in the content.

