Abstract
Anthropometric measurements are essential in various fields, such as sports, the automotive industry, clothing, health care, biomechanics, ergonomics, and gait analysis. However, the data collection process for these measurements is costly and time-consuming, and the data collected are not always precise and accurate. In this paper, some of the most widely reported machine vision systems (MVSs) are evaluated to determine the anthropometric length of body segments (BSs) used in gait analysis. The aim is to evaluate the performance of the MVSs and identify the most appropriate vision approach, in terms of accuracy, cost, speed, and computing performance. For this purpose, five BSs of the lower limb were selected and measured using both the MVS and the conventional manual anthropometric measurement (MAM) techniques. The results show that the MVSs represent an excellent alternative to measure the anthropometric parameters corresponding to the BSs, with some advantages in terms of sampling process time, precision, and equipment requirements.
1. Introduction
Nowadays, the use of smart sensors, the Internet of Things (IoT), and machine vision systems in the industry has arisen due to a need to increase organizational efficiency and competitiveness [1]. In the fields of anthropometry and biomechanics, human anthropometric data are the basis for the construction of digital human models to carry out human gait motion analyses [2]. The body segment (BS) parameters, including length, centre of mass (CoM), mass, and radius of rotation of body parts, are useful in ergonomic applications [3,4], such as tool design, protective clothing, specialized equipment, and workstations [5]. They are also important for developing biomechanical tools and models necessary to minimize the risk of musculoskeletal injuries when human beings perform occupational activities [6]. In human gait analysis, the data sets related to kinematics and kinetics are required to follow and understand every event in a gait cycle [7,8]. One of the most relevant data sets contains the anthropometric lengths of the BSs, which vary depending on body build, gender, and racial origin [9]. The anthropometric lengths of BSs are often estimated and useful in the analysis and modelling of human gait. The estimation of the parameters associated to the CoM of the BS is very important when analysing gait balance disorders [9,10].
Conventional methods for collecting anthropometric data imply the use of standardized human being posture [11]. Based on this standardized posture, the distance between the body’s landmarks can be measured using different instruments and equipment, such as the stadiometer, anthropometer, anthropometric compass, sitting-height table, and metric tape. However, the precision and accuracy of the measurements depend on the experience and ability of the analyst, including the correct and periodic calibration of the required equipment. On the other hand, modern techniques to measure anthropometric lengths consider advanced acquisition data systems that do not require direct contact with the person. In [12], a TC2® 3D body scanner was used to collect anthropometric data of old and physically impaired persons, and these data were compared with the results of the manual anthropometric measurements (MAM). Significant differences were found between the measurement results obtained with both methods; however, the dimensions that are based on the most easily identifiable body landmarks did not result in significant differences. In [13], a Microsoft Kinect NUI® sensor was used to calculate the parameters of person-specific BSs. The results showed high reliability, suggesting that the system could be well received by sports and health communities. A method to assess the accuracy of the reconstructed non-rigid human body model based on anthropometric parameters using multi-view binocular stereopsis was proposed in [14]. The results showed an average reconstruction accuracy of 2.5 mm. A depth camera to obtain and measure the 3D human body model was proposed in [15]. It was shown that the proposed algorithm had a better detection effect and robustness than other existing methods. There are many other computational tools such as Kinovea, which can be used for various applications, such as marker tracking in human gait studies and measuring of the anthropometric lengths of BSs [16].
Machine vision systems (MVSs) are being integrated into the philosophy of Industry 4.0. MVSs have been used for metrology and gaging, but the development of new technologies allows for higher accuracy and more precise measurements [17]. Cameras can communicate with each other and with sensors that allow machine-to-machine communication. The measurement capabilities of computer vision allow for the obtaining of a large amount of data from each inspection. These data can be fed into big data systems, and then used in the decision-making process. Most of the MVSs are based on the homogeneous (SVD) [18,19] and non-homogeneous [18,20] solutions of the calibration matrix by linear estimation methods.
The above information reveals that there are a wide variety of devices, tools, and MVSs that can be used to measure the anthropometric lengths. However, these measuring alternatives can be complex to handle and costly. Currently, several modern devices are available in the market, such as Fit3D Proscanner®, Texel Portal BX®, and Mantis Vision 3iosk®, with prices in the range from USD 10k to USD 250k [21]. On the other hand, manual anthropometric measuring requires longer times, and the accuracy and repeatability depend on the specialist’s skills and experience. In this paper, the performances of three different MVS methods are evaluated and compared with the traditional manual anthropometric measurements (MAM) approach. The aim is to identify the most appropriate MVS to measure the BS lengths required in human gait analyses.
2. Materials and Methods
2.1. Methodology
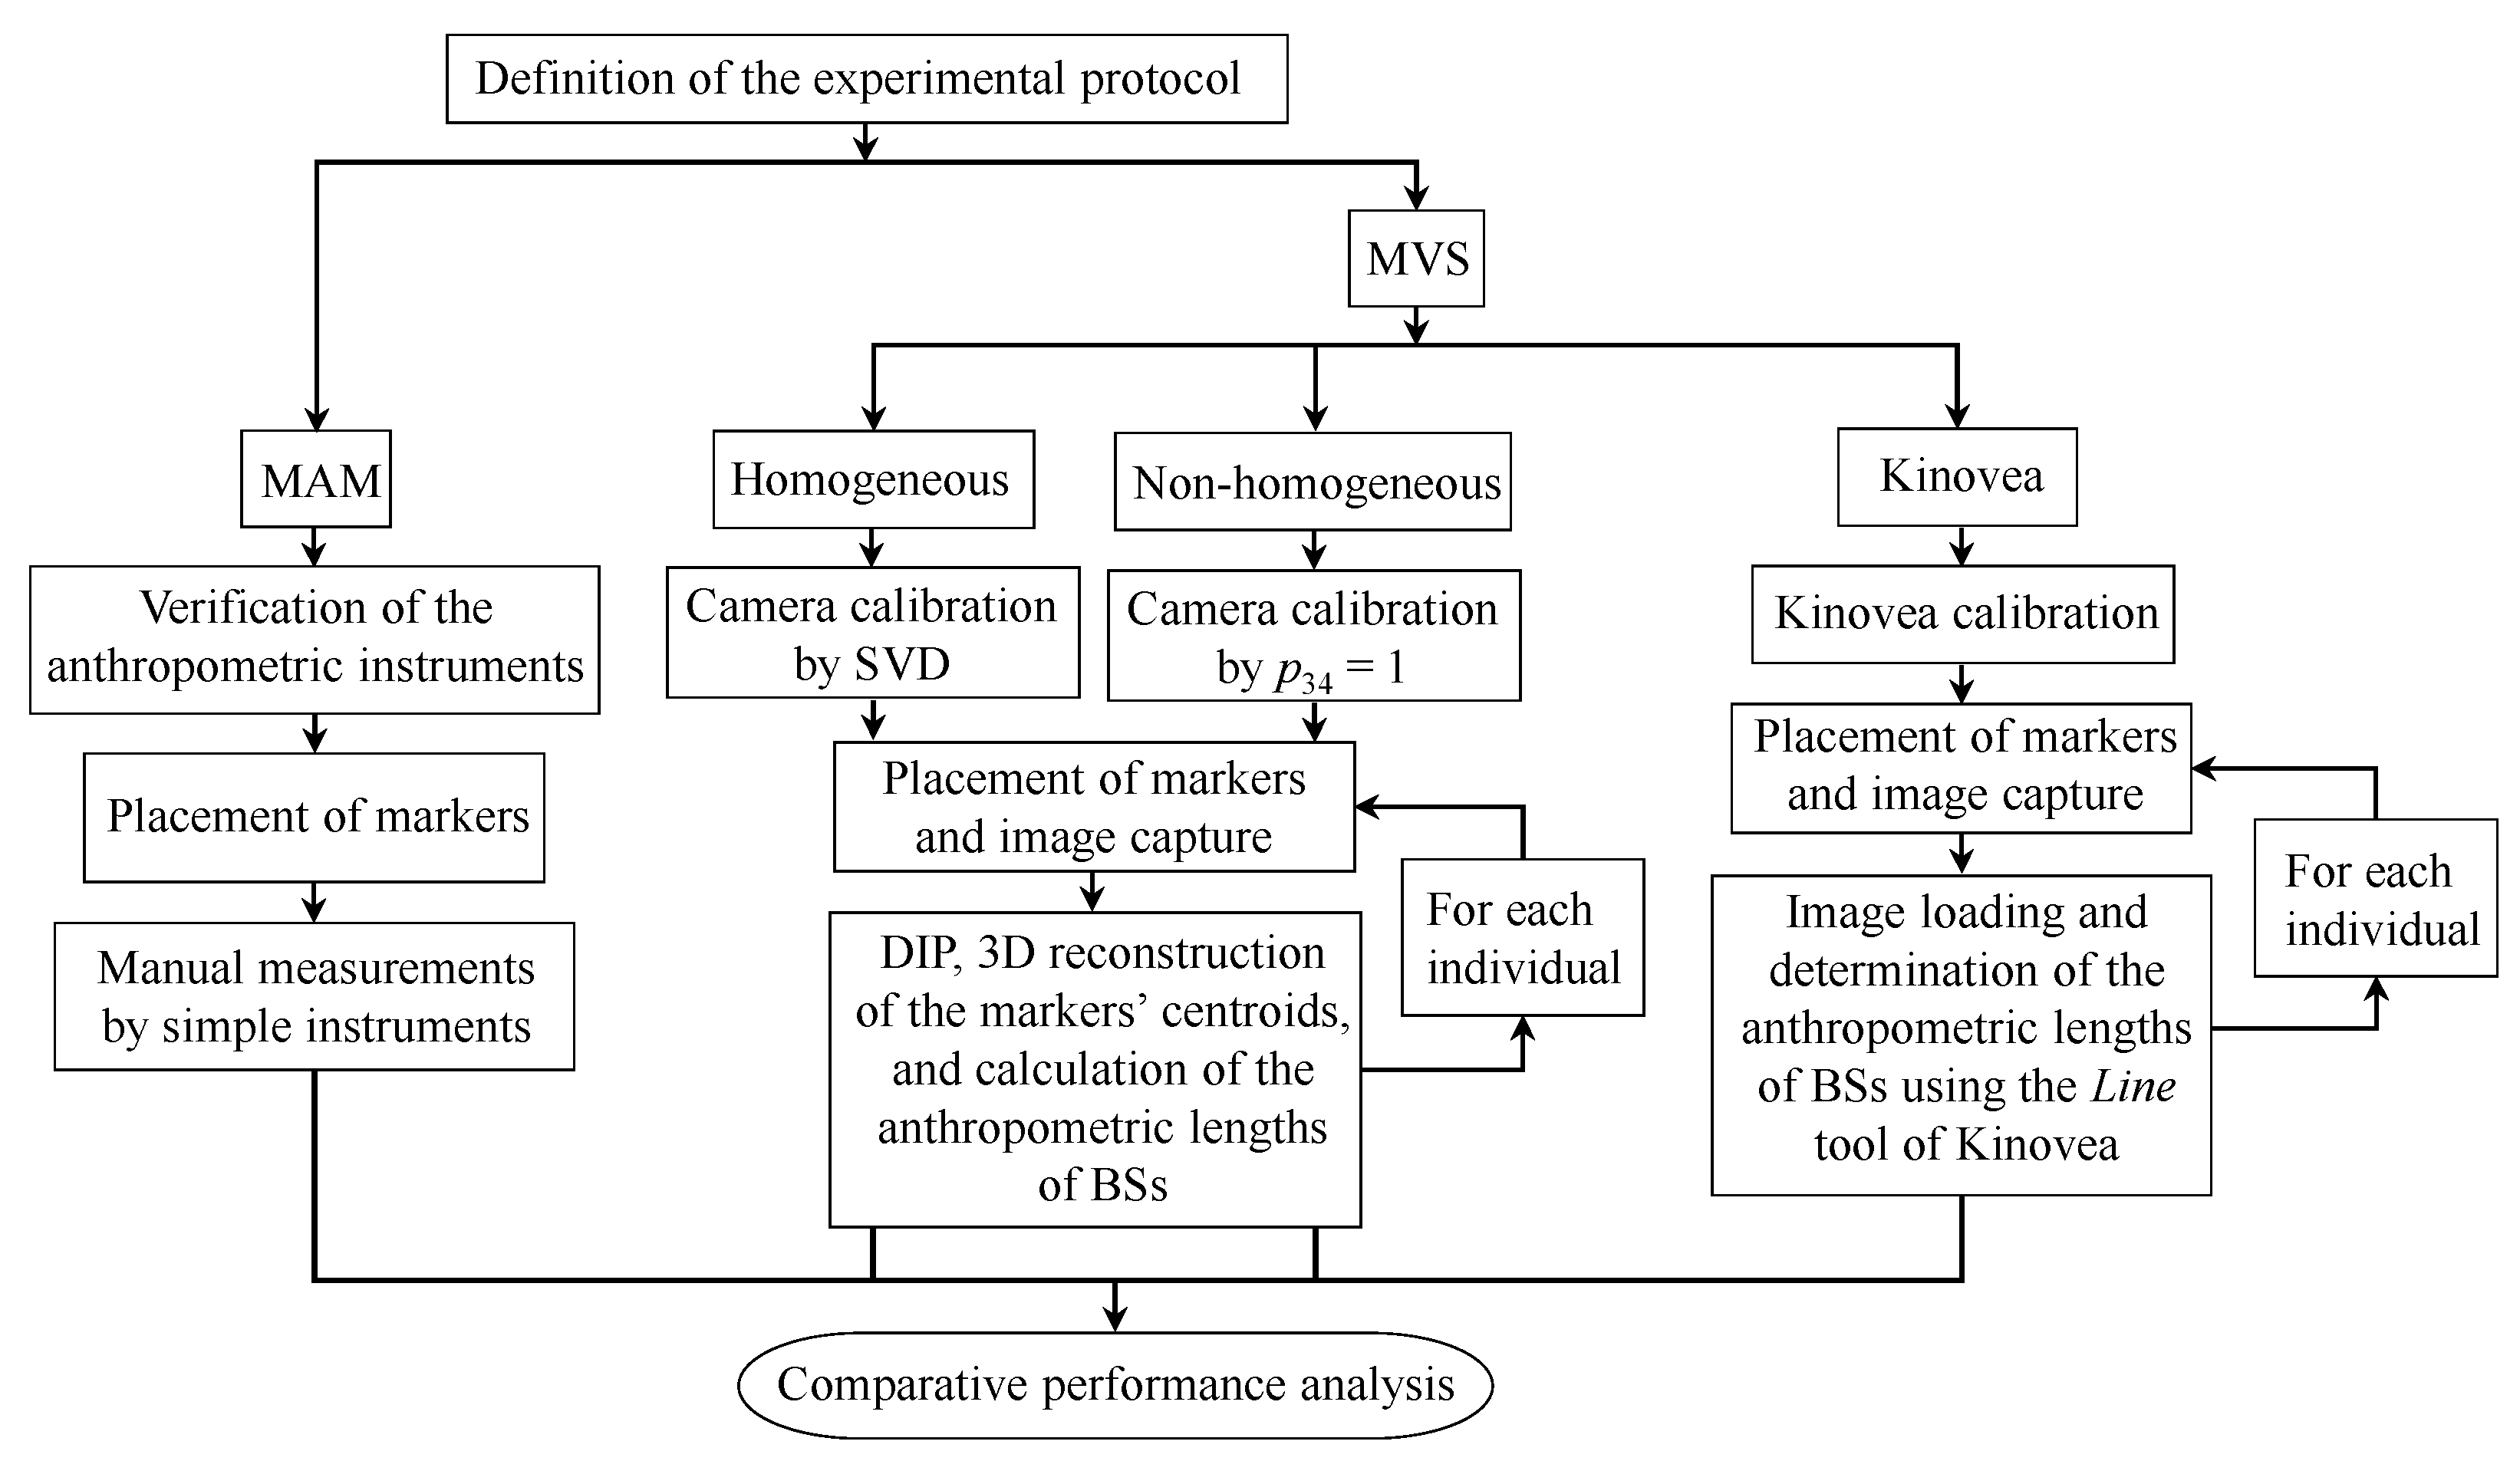
The following methods to measure the main anthropometric lengths of the BSs used in human gait analysis, were selected: (1) the linear vision method based on the homogeneous solution of the calibration matrix using the singular value decomposition process (SVD); (2) the linear vision method based on the non-homogeneous solution of the calibration matrix; (3) the Kinovea program application [22]; and (4) the traditional MAM method using simple instruments (anthropometers). The results of the first three MVS methods were compared with the results obtained by the MAM method. To evaluate the performance of the selected MVS and MAM methods, the methodology shown in Figure 1 was used.
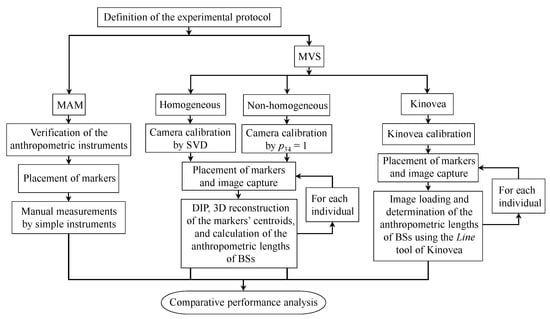
Figure 1.
General methodology used in the evaluation of different MVS methods.
2.2. Experimental Protocol Definition
Twelve subjects (six males and six females; Mage = 20.2 years, SDage = 2.8 years) were selected for this study. All participants were orthopedically healthy adults, and their height, mass, and body mass index (BMI) were recorded (Mheight = 1.645 m, SDheight = 0.058 m; Mmass = 65.3 kg, SDmass = 4.8 kg; MBMI = 24.13 kg/m2, SDBMI = 2.5 kg/m2). As part of the experimental protocol, all participants received a detailed explanation about the study before signing an informed consent form.
The following considerations and requirements were defined as part of the experimental protocol: (a) five BSs were considered; (b) a general physical examination was carried out on individuals to identify some conditions that may introduce variation in the measurements, such as edema (swelling), congenital malformation, etc.; (c) the measurements were made at a place with privacy and comfortable environmental conditions of light, ventilation, and temperature; (d) the analysts had theoretical and practical knowledge about anthropometric measuring; (e) all measurements were made on the right side of the body; and (f) the measurement and annotation techniques were homogeneous for all the participants.
2.3. Definition of the Markers Protocol and BSs Lengths
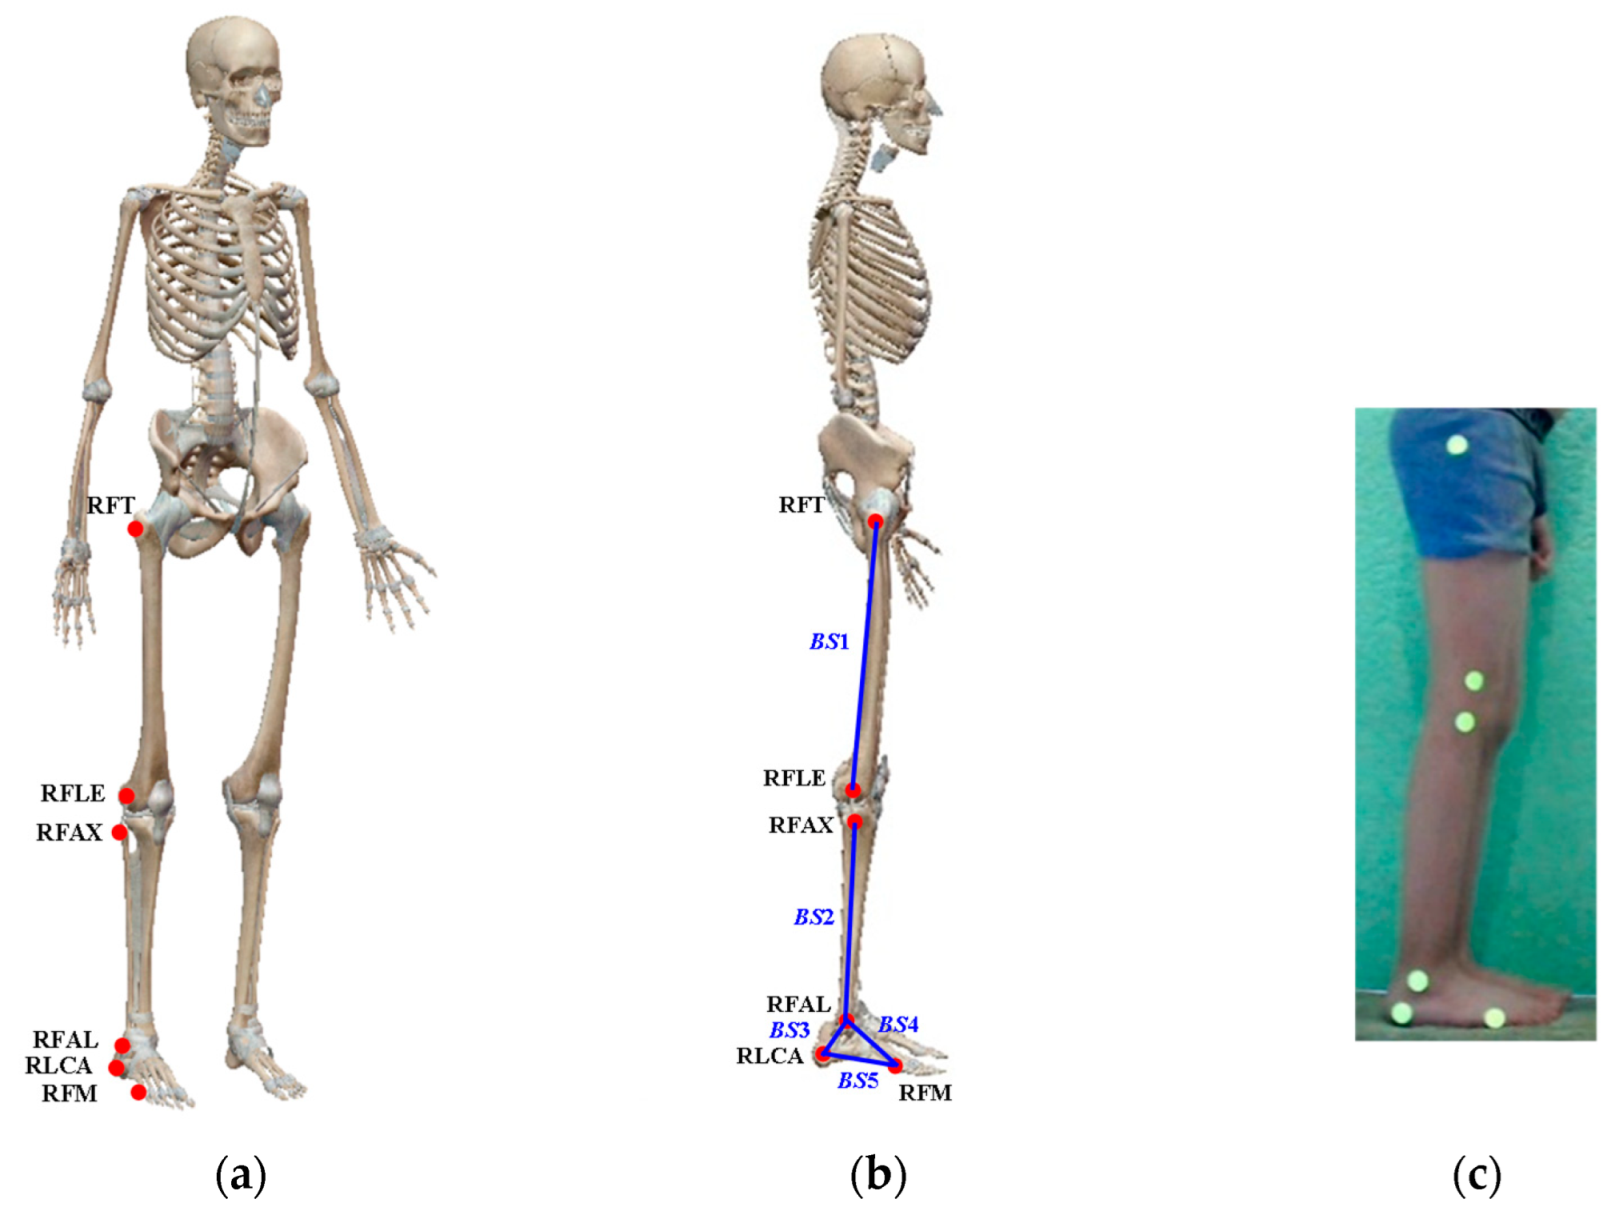
To obtain the anthropometric measurements using the MVS methods, bone landmarks for marker placement were defined as shown in Figure 2a and Table 1. The five BS lengths to be calculated are defined in Figure 2b and Table 2. The markers placed on a participant are shown in Figure 2c. It is important to mention that the correct identification of the anatomical landmarks is very important to obtain precise results.
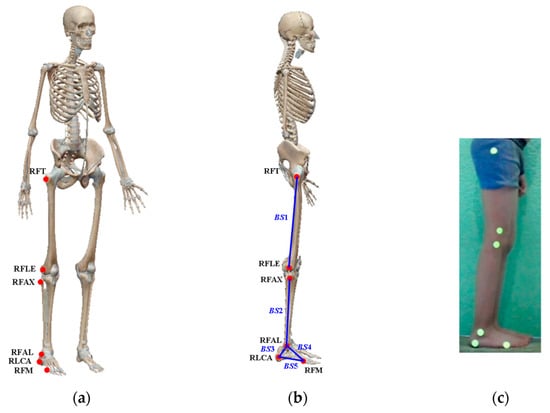
Figure 2.
Markers protocol: (a) definition of the bone landmarks, (b) definition of the body segments, and (c) placing the markers on the participant.

Table 1.
Definition of the bone landmarks.

Table 2.
Definition of the anthropometric measurements of the body segments (BSs).
2.4. Equipment Used
For the implementation of the MVS, the following equipment was used: two mobile phone cameras (Motorola®, Moto G4, 13 MP, 1080 × 1920 pixels, and f/2.0), two camera tripods, a 3D calibration pattern, a computer with the Kinovea and MatLab® programs, flat circular markers, and a black light lamp. The use of phosphorescent yellow markers and black light has demonstrated outstanding performance for digital image processing (DIP), in terms of accuracy and speed [23]. In the case of the MAM method, an anthropometer was used.
2.5. Measurement Methods
2.5.1. Manual Anthropometric Measuring
In order to manually obtain the anthropometric measurements (MAM), a conventional anthropometer was used. It is important to mention that the measurement process was carried out by an analyst with high experience in the use of anthropometers. Moreover, in order to guarantee the reliability of the measurements, three measurements were conducted for each BS and participant. The mean and standard deviation (SD) values were calculated and used as reference in the comparative study.
2.5.2. Homogeneous MVS Method
In the homogeneous MVS method, the calibration matrix is calculated using the singular value decomposition (SVD) process, represented by the following equation:
where xi ≡ (x, y, 1)T the location of a point in the camera space, Xi ≡ (X, Y, Z, 1)T is the location of the corresponding point in the 3D world, and P is a camera matrix that relates the 3D coordinates with the 2D coordinates. The P matrix can be obtained by a calibration process. To accomplish this, a correspondence is generated between 3D-points (Xi) and their position in the image plane (xi); if there are sufficient Xi↔xi correspondences, the camera matrix P can be computed through an SVD procedure.
2.5.3. Non-Homogeneous MVS Method
The following linear system defines the non-homogeneous MVS method:
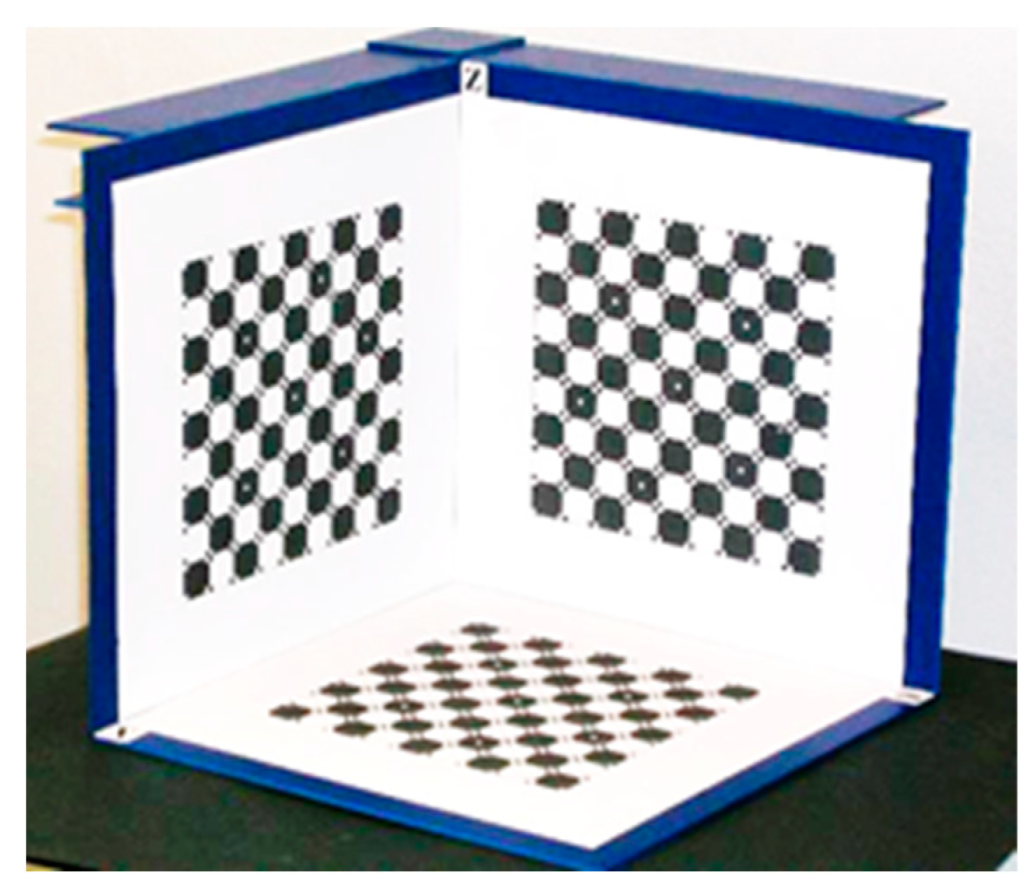
where ρ is a scaling factor, which, in this case study, ρ = 1, and pij are the components of the P matrix, i.e., P = [pij]. Since the non-homogeneous solution is used, p34 = 1. Thus, the method comprises the calculation of all the parameters of the matrix pij, except p34 = 1. To do so, it is necessary to consider 5.5 correspondences (observation points) between the 2D coordinates in the image plane, and the 3D coordinates of the calibration pattern (see Figure 3). Every correspondence generates two equations, as follows:
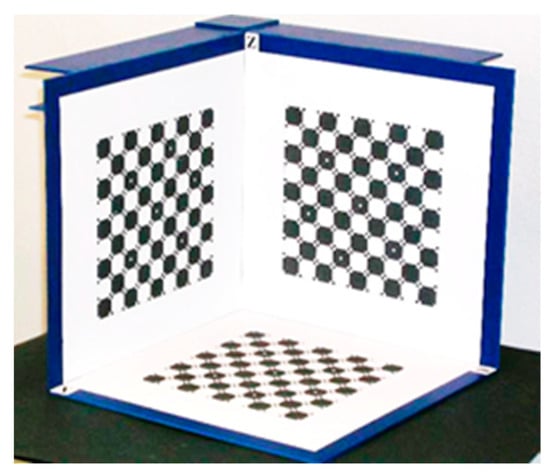
Figure 3.
Three-plane calibration pattern.
It is important to note that using 5.5 correspondences is sufficient to calculate the calibration matrix; however, a large number of correspondences must be used to reduce the noise and error in the measurements.
2.5.4. Kinovea Method
The Kinovea software is an open-source program especially designed to study, analyse, compare, and measure human joint movement in 2D by means of only one camera [22,24]. This program is used to improve the techniques in several sports and physical activities, as well as to correct body movements that could cause injuries to the athletes. This program allows measuring the range of passive and active movement of BSs by: (a) following the trajectory of a target point, (b) measuring joint angles, (c) measuring distances, and (d) measuring times, either manually or semi-automatically. The collected data by Kinovea can be transferred to a spreadsheet for further processing and analysis.
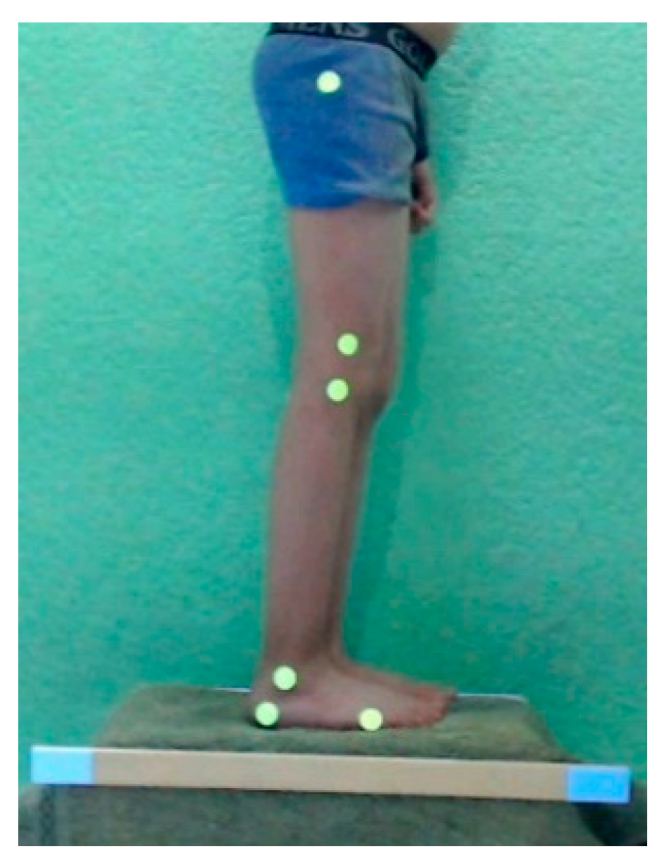
The implementation of the Kinovea program was conducted according to the algorithm shown in Table 3. The calibration process of the Kinovea program is necessary to establish the relationship between a physical length and the number of pixels in the image. To carry out this calibration, a 0.5 m-long bar was used, as shown in Figure 4.

Table 3.
Algorithm for obtaining anthropometric measurements using Kinovea.
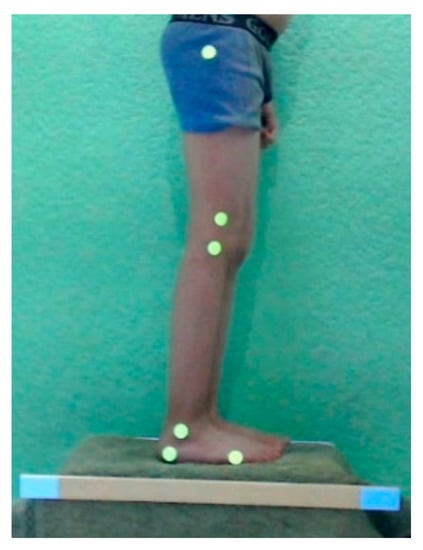
Figure 4.
Placing one participant and the element with a known length in the test area.
2.6. Image Processing and 3D Reconstruction
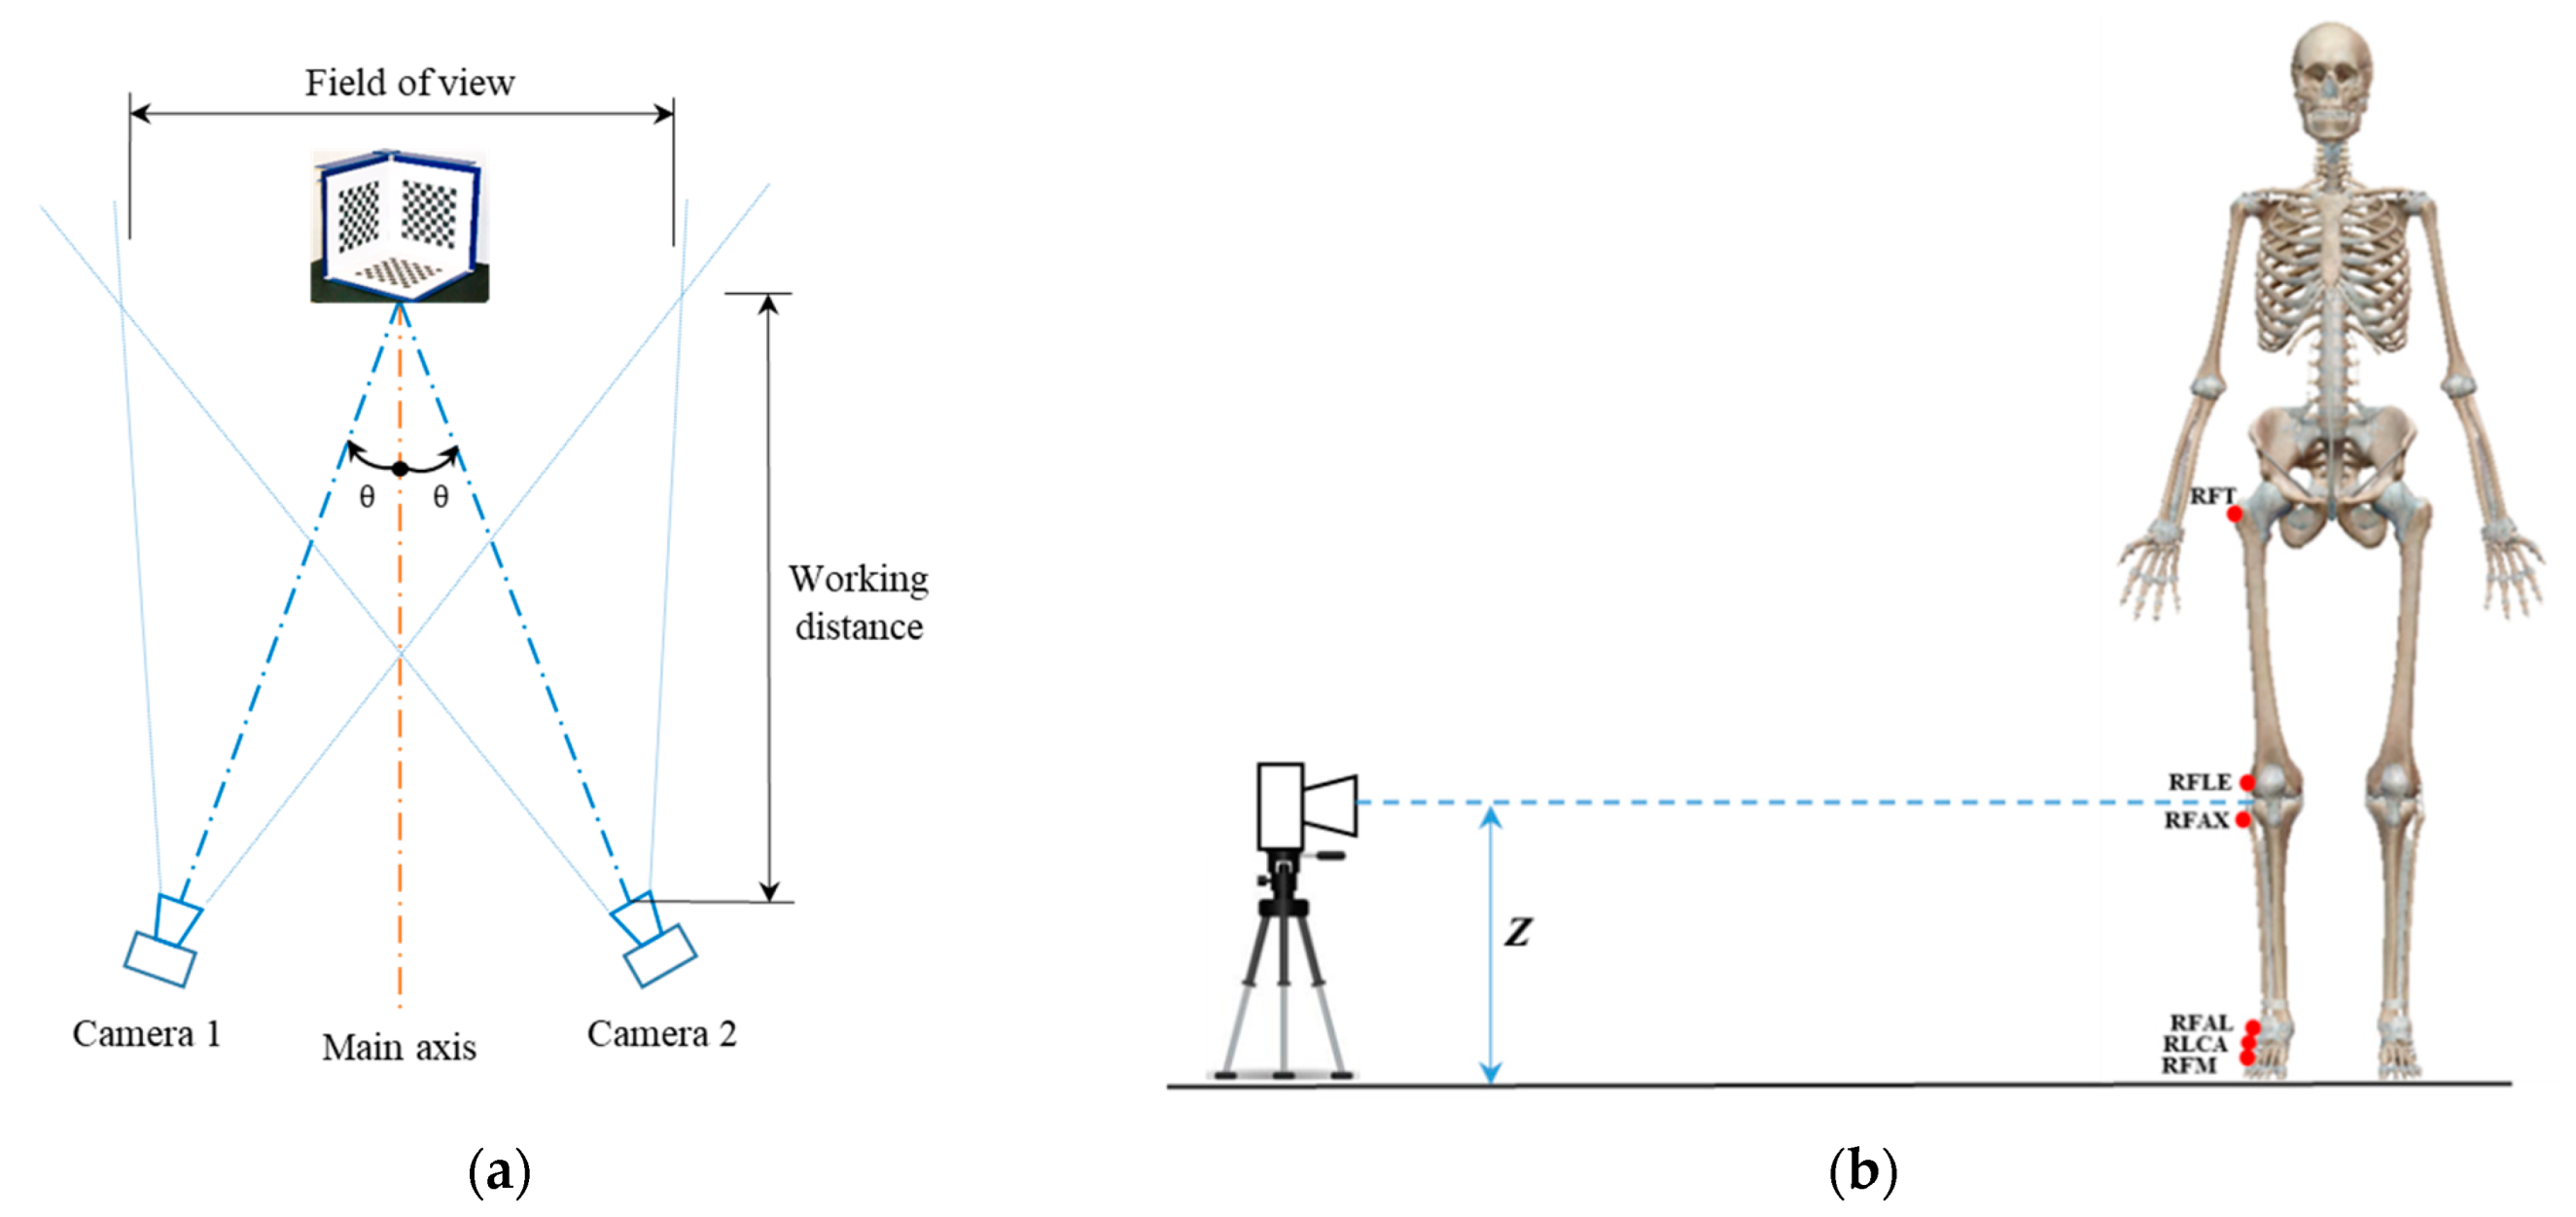
The digital image processing (DIP) and 3D reconstruction procedure for the non-homogeneous and homogeneous MVS methods is shown in Table 4, which is the same for both methods, except for the approach used to calculate the camera calibration matrix. In the homogeneous MVS, the calibration matrix is obtained using an SVD procedure, while in the non-homogeneous MVS, the calibration matrix is calculated considering the matrix’s element p34 = 1. The experimental set up shown in Figure 5a was used to obtain the images required in the digital image processing (DIP) and 3D reconstruction. Two cameras were installed equidistant from the principal axis. The working distance was estimated to obtain a field of view necessary to capture the subject at the centre of the image, reducing the camera lens error. The vertical location of the cameras with respect to the ground was proposed based on the average height between the highest and the lowest marker, which approximately matched with the average knee height of the participants, as shown in Figure 5b.

Table 4.
DIP and 3D reconstruction algorithm for the non-homogeneous and the homogeneous MVS methods.
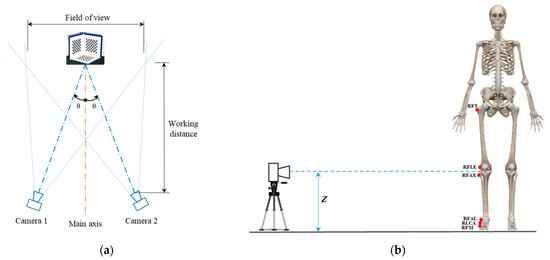
Figure 5.
Experimental set up: (a) scheme of distribution, and (b) camera location at knee height.
Once the cameras were calibrated and the 3D reconstruction process carried out, the anthropometric lengths of the BSs were calculated using the following equations:
where the subscripts x, y, and z, represent the x, y, and z coordinates of the 3D locations of the markers.
3. Results and Discussion
Table 5 shows the results of the anthropometric measurements obtained from the different methods. These results correspond to the average and standard deviation (SD) values of a group of twelve participants. This table shows that the values obtained by the homogeneous and non-homogeneous MVS methods are very alike to each other, and to the results obtained by the MAM method. In contrast, the results of the Kinovea method exhibit larger deviations than the previous ones. It is important to mention that the identification of the RFT, RFLE, and RFAX landmarks was difficult in two subjects with a body mass index (BMI) greater than 25 kg/m2. This difficulty is consistent with [25,26], where it is mentioned that the identification of anatomical landmarks may be more difficult in people with high body fat.

Table 5.
Results of the anthropometric measurements of length of the BSs (n = 12).
To estimate the performance of each of the MVS with respect to the MAM method, a deviation value was calculated according to the following equation:
where MeanMVS represents the length value obtained using one of the MVS approaches, and MeanMAM represents the corresponding length value obtained using the conventional MAM approach. The resultant deviation values are shown in Table 6, where it can be observed that the non-homogeneous and homogeneous MVS methods have smaller deviations than the Kinovea method. The longest anthropometric lengths, BS1 and BS2, calculated by the linear vision methods, had the smallest mean deviation. The largest mean deviation obtained by all the MVS corresponds to the shortest anthropometric length BS3. This large deviation may be due to the fact that the anthropometric length BS3 requires the RLCA landmark, which was one of the most difficult to be located, and therefore it may have moved out-of-place during walking. In addition, this large deviation is also a result of the small value of BS3 in the denominator of Equation (10).

Table 6.
Comparison of the deviation between MVS results and MAM’s results for a sample of 12 participants.
3.1. Results of the 3D MVS Methods
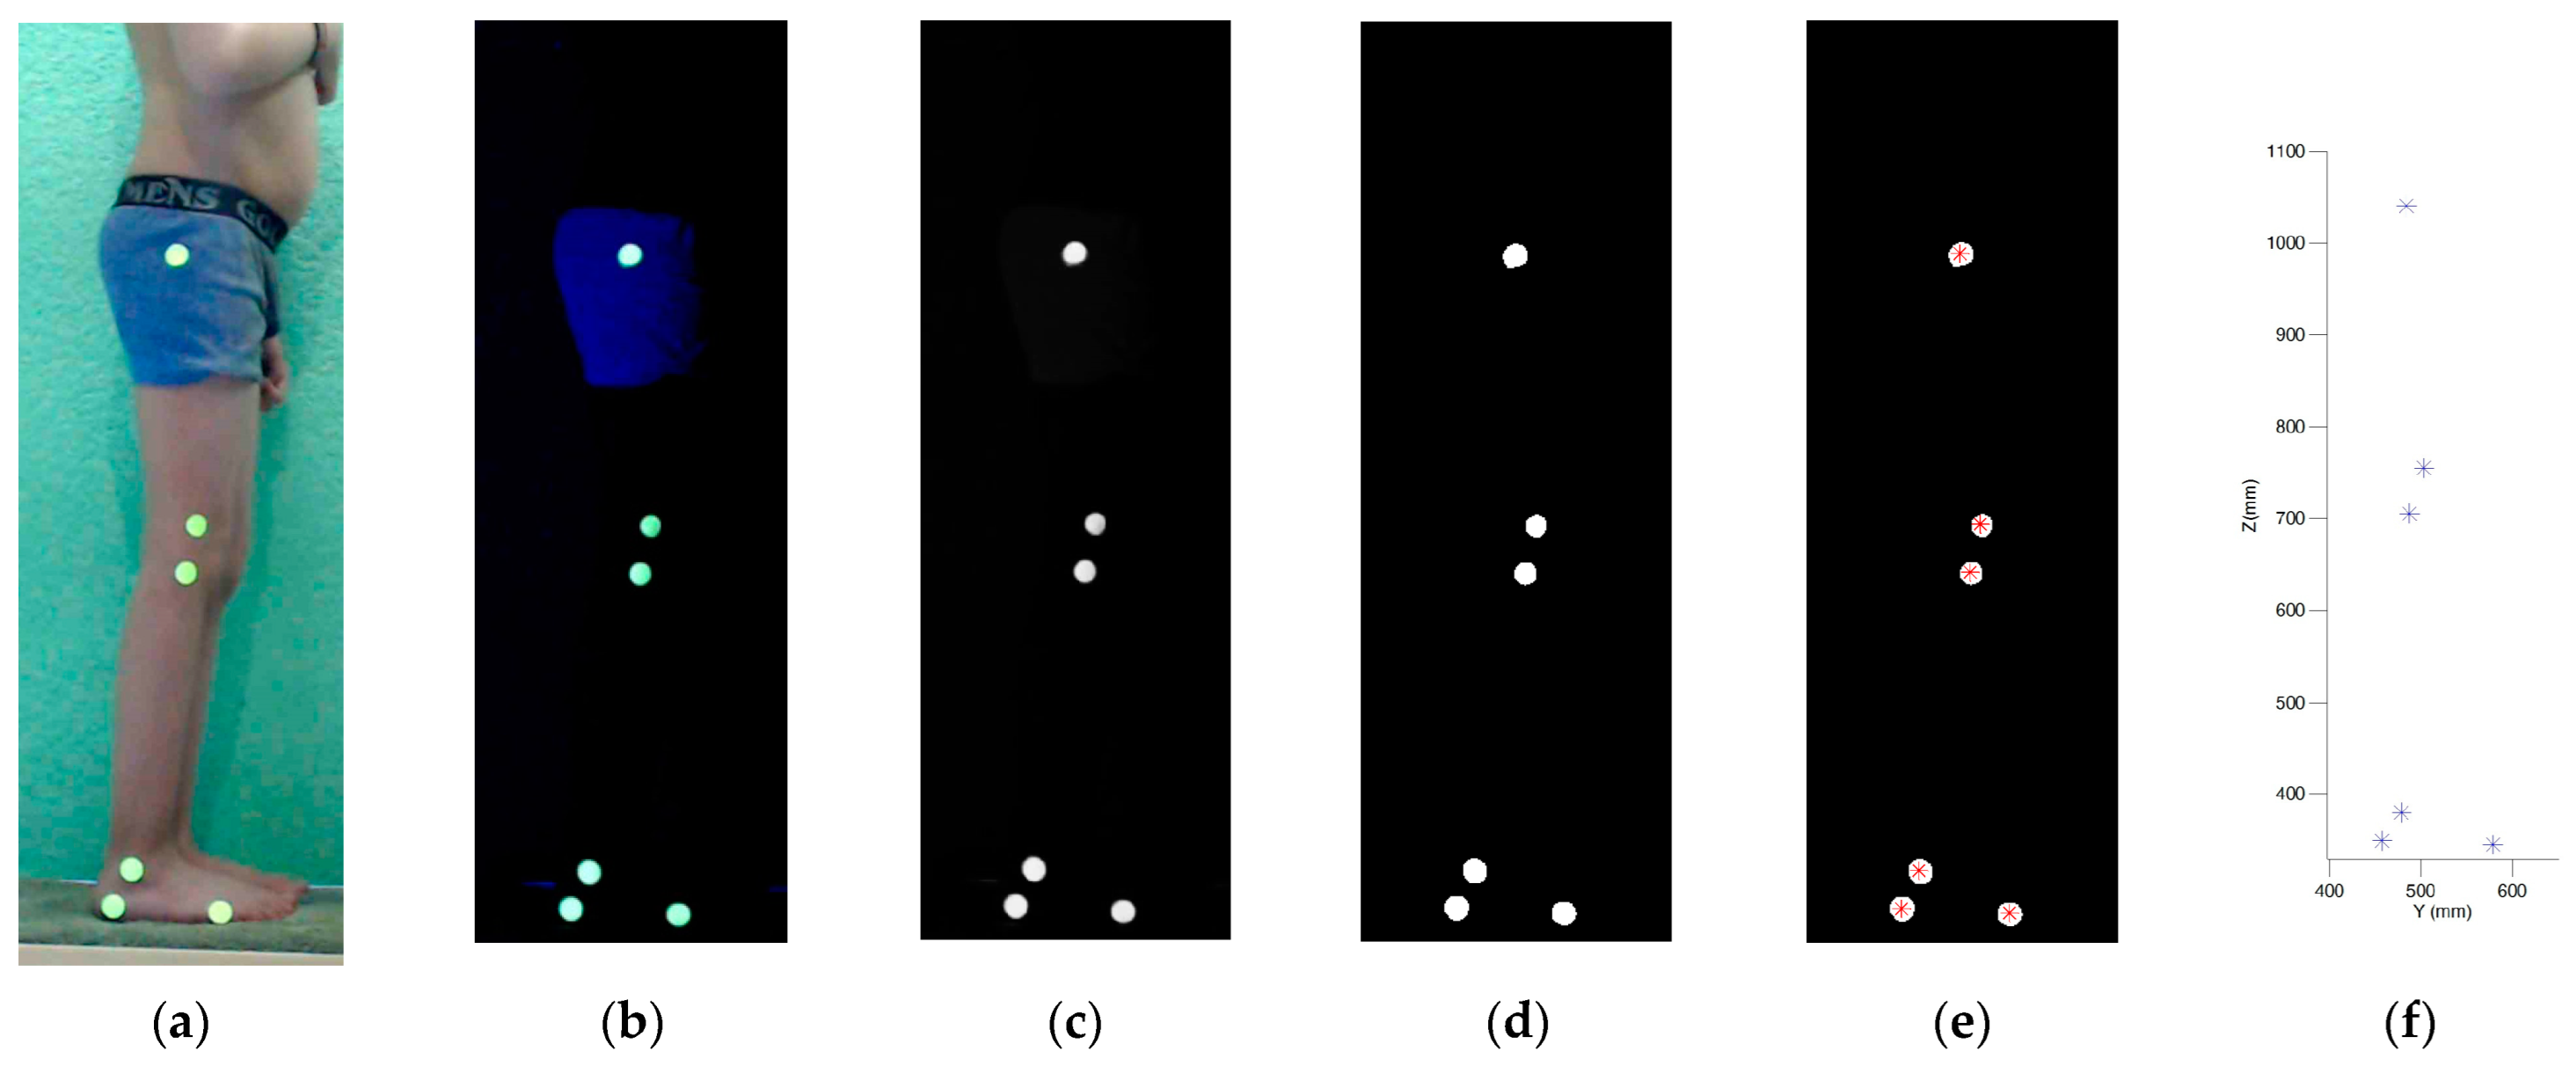
Figure 6 represents the results of the 3D reconstruction using the homogeneous MVS. At the beginning, the volunteers were placed in the test area, Figure 6a. Next, an RGB image was taken using a black light, Figure 6b, and converted to grayscale, Figure 6c. The histogram of the image was obtained by an image binarization process, Figure 6d. Next, the coordinates of the markers’ centroids in pixels were calculated, Figure 6e. Finally, the results of the 3D coordinate markers were computed, as shown in Figure 6f.
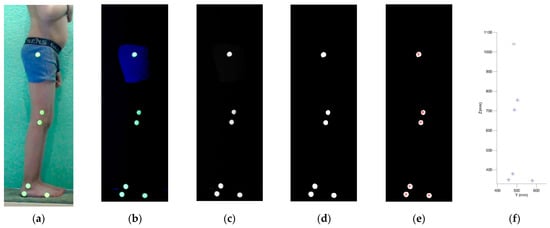
Figure 6.
Results of the MVS: (a) image using standard light, (b) image using black light, (c) image converted to greyscale, (d) binarized image, (e) location of centroids in pixels, (f) 3D reconstruction of the centroids’ markers.
The precision of the camera calibration process was fundamental to have a good accuracy in the homogeneous and non-homogeneous MVS. A good calibration pattern in terms of perpendicularity and correspondence among the planes, and a correct setting of the optical characteristics of the cameras, were also fundamental to have a good accuracy. Although mathematically, 6 and 5.5 2D-3D correspondences were required on the calibration pattern to calculate the calibration matrix P, the results revealed that the use of nine or more 2D-3D correspondences led to smaller errors in the 3D reconstruction. Therefore, it is indistinct to use either method as long as at least nine 2D-3D correspondences in the calibration pattern are used. It is important to mention that the calibration process must be conducted only once for all the participants. Once the calibration is made, many participants can be measured, and the process can be automated.
On the other hand, different image sizes were evaluated during the camera calibration process. For this purpose, three test points on the calibration pattern were 3D reconstructed using different image sizes. To determine the 3D reconstruction error, the following equation was used:
where are the 3D coordinates of a test point on the calibration pattern and are the 3D coordinates estimated by the MVS, and N corresponds to the number of test points. Since three test points (the farthest in each plane) were used for every trial, the resulting error corresponds to the average error. It should be noted that for comparative purposes, this absolute error in millimeters is normalized with respect to the distance from one of the test points to the origin of the calibration pattern. The results are shown in Figure 7, where it can be observed that the image size of 2816 × 2112 pixels led to the best precision performance; however, the processing of these images requires a high computational cost. Therefore, it was decided to use an image size of 1280 × 1024 pixels, which ranks second in terms of precision.

Figure 7.
3D reconstruction error as a function of the image size.
In the case of the camera selection, the results also revealed that it is important to identify the cameras with the least possible distortion in their perimeter fringe to reduce errors in the 3D reconstruction at the extremes of the field of view. In addition, it is important to avoid some sports cameras with wide-angle lenses, since the distortion is quite considerable.
3.2. Results of the Kinovea Program
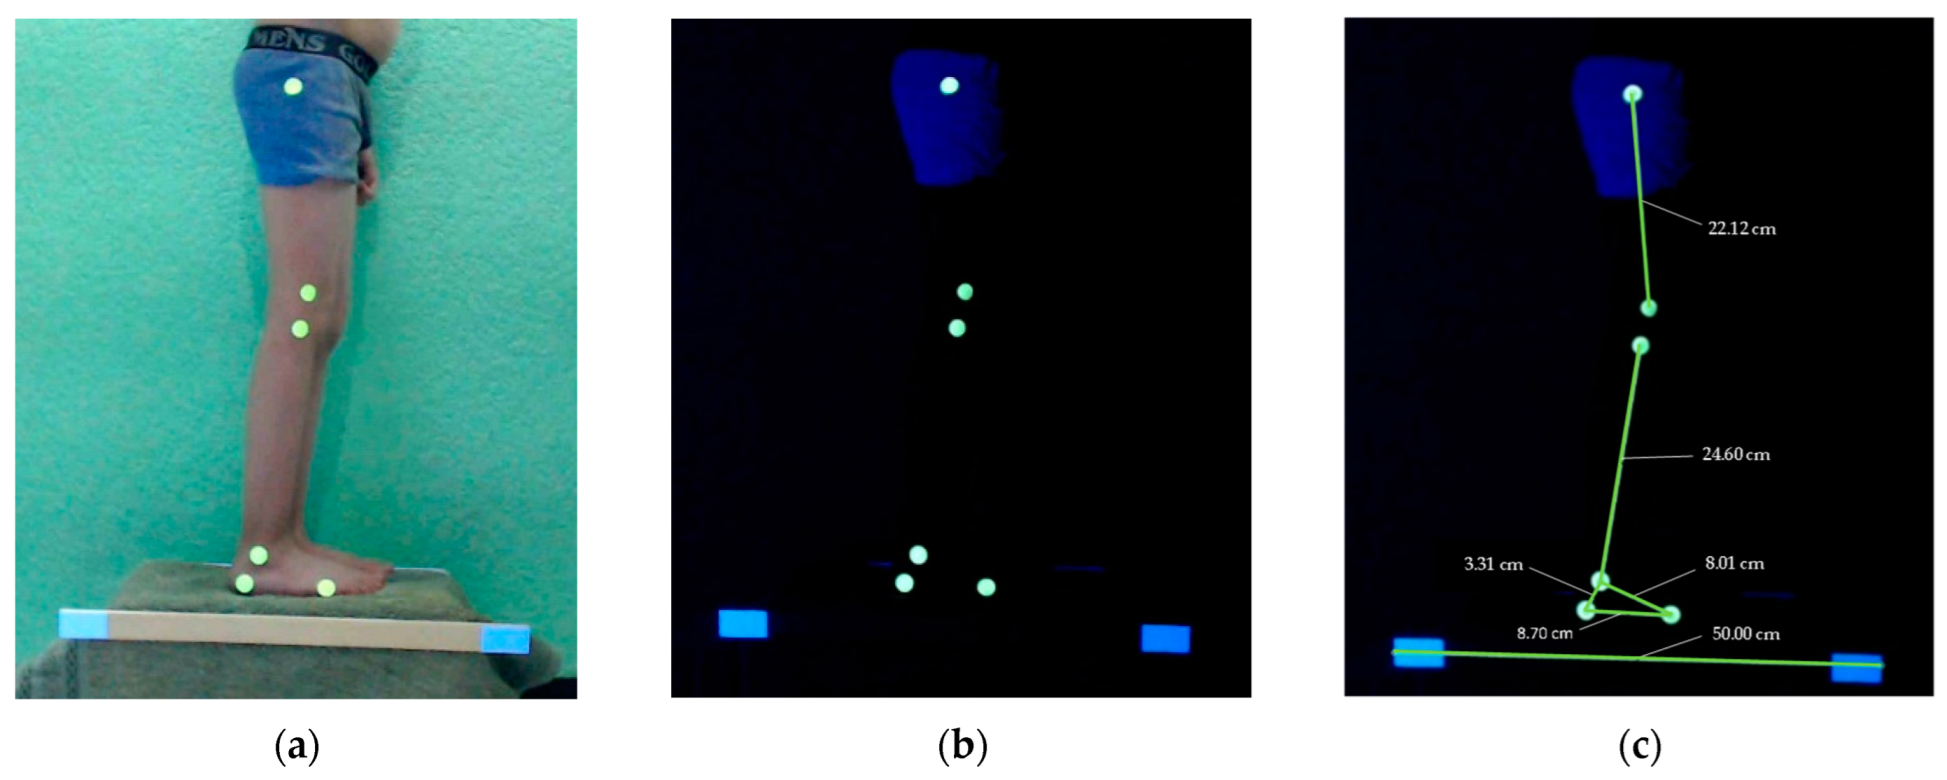
Before conducting the measurements using the Kinovea program, several tests were carried out to determine the optimal conditions to get good results. Three important conditions were identified and applied: (a) blacklight illumination, (b) phosphorescent yellow markers, and (c) the optical axis of the camera must be horizontal and perpendicular to the sagittal plane. As in any other MVS, a good calibration process is also essential to obtain satisfactory results in terms of precision. Figure 8a shows a participant in the test area under standard light, whereas Figure 8b shows the participant under blacklight conditions, which were used to improve the image processing and 3D reconstruction. These images were loaded into the Kinovea program and processed to obtain the anthropometric dimensions of the BSs, as shown in Figure 8c.
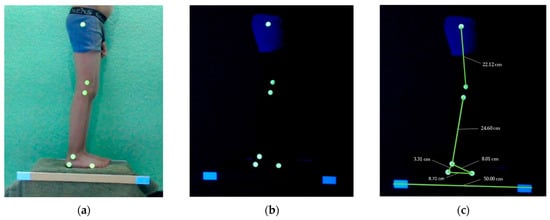
Figure 8.
Image to be analysed in the Kinovea program: (a) image captured based on the participant’s test area, (b) image captured using a blacklight, (c) result of the analysis in Kinovea.
3.3. Performance Comparison
To assess and compare the performance of each MVS, a performance index was proposed based on an Analytical Hierarchy Process (AHP) [27] and Quality Function Development (QFD) [27,28] tools. AHP is a structured technique used to make complex decisions, which helps to find the solution that best suits the needs and understanding of the problem, whereas QFD is a method for calculating what features should be added when designing a product or service. Both tools provide an objective view of what users are looking for in a product and the requirements it should have, as well as a prioritization of the most important features to consider. To determine the most important criteria to consider, as well as their corresponding weightings, the AHP and QFD tools were applied to a group of 30 potential customers of the proposed MVS approach for measuring BSs. Based on the results, the most relevant criteria were selected, assigning a value of 1 to the most important criterion. Thus, the criteria were: (1) precision; (2) speed of the MVS; and (3) equipment requirements, with weights w1 = 1.00, w2 = 0.78, and w3 = 0.72, respectively. Thus, the proposed performance index, pindex, is:
where cprecision is the precision criterion related to the deviation between the MVS results and MAM results, ctime is the criterion related to the total time required by each MVS to get the anthropometric measurements of the twelve individual samples, and cequipment corresponds to the equipment requirements for each method. The cprecision value was obtained from the mean deviation values shown in Table 6, and through a normalization process, giving a value of 1 to the method that exhibited the best precision. Table 7 presents the resultant values of cprecision for each MVS.

Table 7.
Criterion cprecision for each vision method.
The average total time required by each method to measure a subject and the criterion ctime, are shown in Table 8. Note that for the MVS methods, the time of the preparation and calibration processes corresponds to the average time per individual, i.e., the total time to prepare and calibrate the system is divided by the number of participants. The value of ctime was estimated similarly to the previous criterion, where a value of 1 was assigned to the MVS with the shortest total time. The preparation time corresponds to mounting the cameras and other devices, adjusting the cameras’ optical parameters, and placing the markers on the participants. The preparation time in the MAM method includes the verification and cleaning of the anthropometric instruments, and the measurement time corresponds to the time to measure the body segments of each participant three times.

Table 8.
Average time required by each method to measure a subject.
The results show that the non-homogeneous and homogeneous MVS are faster than the conventional and Kinovea methods. The homogeneous method led to a time reduction of 48.9%, the non-homogeneous method led to a time reduction of 48.2%, and the Kinovea program led to a time reduction of 33%, in comparison with the MAM method. The non-homogeneous and homogeneous MVSs had almost the same time performance, with the homogeneous MVS having the best ctime performance. In the case of the MVS methods, the equipment preparation and camera calibration are only needed once, regardless of the number of participants to be measured. Therefore, if only the DIP and 2D/3D reconstruction processes and placement of the markers are considered, the non-homogeneous, homogeneous, and Kinovea MVSs require an average time of 4.16 min, 4.15 min, and 5.88 min per participant, respectively. This represents an improvement in the efficiency of the data collection process.
Table 9 shows the equipment required by each MVS, and the obtained values of the equipment criterion, cequipment. The values were computed using a normalization process, assigning a value of 1 to the MVS that requires the minimum equipment. It is important to mention that the material and equipment used in this study were inexpensive and not sophisticated, in comparison with the devices and equipment reported in the literature. For instance, Mantis Vision 3iosk® is priced at USD 250k [21]. The cost of the materials and the equipment used in this investigation does not exceed USD 500, which represents a major competitive advantage. The DIP and the 3D reconstruction algorithms were implemented in MatLab® but they could also be implemented in an open source program.

Table 9.
Equipment required by each MVS.
Finally, the performance index results are shown in Table 10, where it is observed that the non-homogeneous and homogeneous MVS methods had the best performance index, with the homogeneous method having the best performance value. The Kinovea MVS approach had the worst performance value, despite the fact that it only uses one camera to provide 2D information, which is a disadvantage compared to other MVSs that provide 3D results.

Table 10.
Performance index.
4. Conclusions
This paper presents an investigation to assess the performance of different machine vision systems to measure the anthropometric lengths of body segments. The aim is to promote and improve the digitalization of anthropometric measuring. The results show that 3D stereo vision methods are an excellent technological alternative in terms of precision, processing time, cost, and computing performance. Special attention must be given to the correct camera calibration process, because the accuracy and precision of the 3D-reconstruction results depend on it. Although this study was focused on anthropometric measurements of the BSs involved in human gait, the analysed methods can be tailored to determine other types of anthropometric measurements, such as circumferences, areas, volumes, and lengths, commonly used in anthropometric and ergonomic applications.
Author Contributions
Conceptualization J.C.A.-G. and H.I.M.-C.; methodology, J.C.A.-G., H.I.M.-C. and A.G.-d.A.; software, J.C.A.-G. and H.I.M.-C.; validation, J.C.A.-G., H.I.M.-C., R.I.H.-M. and H.P.-M.; formal analysis, J.C.A.-G. and H.I.M.-C.; investigation, J.C.A.-G. and H.I.M.-C.; resources, J.C.A.-G. and H.I.M.-C.; data curation, J.C.A.-G., H.I.M.-C., R.I.H.-M., H.P.-M. and A.G.-d.A.; writing—original draft preparation, J.C.A.-G. and H.I.M.-C.; writing—review and editing, J.C.A.-G., H.I.M.-C., R.I.H.-M. and H.P.-M.; visualization, J.C.A.-G., H.I.M.-C., R.I.H.-M. and H.P.-M.; supervision, H.I.M.-C., R.I.H.-M. and H.P.-M.; project administration, J.C.A.-G. and H.I.M.-C.; funding acquisition, J.C.A.-G., H.I.M.-C., R.I.H.-M. and H.P.-M. All authors have read and agreed to the published version of the manuscript.
Funding
This research received no external funding.
Informed Consent Statement
Informed consent was obtained from all subjects involved in the study.
Data Availability Statement
The data presented in this study are available on request from the corresponding author.
Acknowledgments
The first author is grateful to the Program for Professional Development of Academics (PRODEP) of the Secretary of Public Education (SEP) of Mexico for the scholarship granted during his PhD studies.
Conflicts of Interest
The authors declare no conflict of interest.
References
- Wollschlaeger, M.; Sauter, T.; Jasperneite, J. The Future of Industrial Communication: Automation Networks in the Era of the Internet of Things and Industry 4.0. IEEE Ind. Electron. Mag. 2017, 11, 17–27. [Google Scholar] [CrossRef]
- Marshall, R.; Summerskill, S. Posture and anthropometry. In DHM and Posturography; Academic Press: Cambridge, MA, USA, 2019; pp. 333–350. [Google Scholar]
- Merrill, Z.; Perera, S.; Chambers, A.; Cham, R. Age and body mass index associations with body segment parameters. J. Biomech. 2019, 88, 38–47. [Google Scholar] [CrossRef] [PubMed]
- Merrill, Z.; Perera, S.; Cham, R. Predictive regression modeling of body segment parameters using individual-based anthropometric measurements. J. Biomech. 2019, 96, 109349. [Google Scholar] [CrossRef] [PubMed]
- Chaffin, D.B.; Andersson, G.B.J.; Martin, B.J. Occupational Biomechanics; Wiley-Interscience: Hoboken, NJ, USA, 2006. [Google Scholar]
- Durkin, J.L.; Dowling, J.J. Analysis of body segment parameter differences between four human populations and the estimation errors of four popular mathematical models. J. Biomech. Eng. 2003, 125, 515–522. [Google Scholar] [CrossRef] [PubMed]
- Perry, J. Gait Analysis: Normal and Pathological Function, 2nd ed.; SLACK Incoporated: West Deptford, NJ, USA, 2010. [Google Scholar]
- Baker, R. Measuring Walking: A Handbook of Clinical Gait Analysis; Mac Keith Press: London, UK, 2013. [Google Scholar]
- Winter, D.A. Biomechanics and Motor Control of Human Movement; John Willey & Sons Inc.: Toronto, ON, Canada, 2009. [Google Scholar]
- Kumar, D.; González, A.; Das, A.; Dutta, A.; Fraisse, P.; Hayashibe, M.; Lahiri, U. Virtual reality-based center of mass-assisted personalized balance training system. Front. Bioeng. Biotechnol. 2018, 5, 85. [Google Scholar] [CrossRef] [PubMed]
- ISO 7250-1:2017; Basic Human Body Measurements for Technological Design—Part 1: Body Measurement Definitions and Landmarks. ISO: Geneva, Switzerland, 2017.
- Sims, R.E.; Marshall, R.; Gyi, D.E.; Summerskill, S.J.; Case, K. Collection of anthropometry from older and physically impaired persons: Traditional methods versus TC2 3-D body scanner. Int. J. Ind. Ergon. 2012, 42, 65–72. [Google Scholar] [CrossRef]
- Clarkson, S.; Wheat, J.; Heller, B.; Choppin, S. Assessing the suitability of the Microsoft Kinect for calculating person specific body segment parameters. In Computer Vision-ECCV 2014 Workshops; Springer: Berlin/Heidelberg, Germany, 2015; pp. 372–385. [Google Scholar]
- Ran, Q.; Zhou, K.; Yang, Y.L.; Kang, J.; Zhu, L.; Tang, Y.; Feng, J. High-precision human body acquisition via multi-view binocular stereopsis. Comput. Graph. 2020, 87, 43–61. [Google Scholar] [CrossRef]
- Tan, X.; Peng, X.; Liu, L.; Xia, Q. Automatic human body feature extraction and personal size measurement. J. Vis. Lang. Comput. 2018, 47, 9–18. [Google Scholar]
- Littrell, M.E.; Chang, Y.H.; Selgrade, B.P. Development and assessment of a low-cost clinical gait analysis system. J. Appl. Biomech. 2018, 34, 503–508. [Google Scholar] [CrossRef] [PubMed]
- Alonso, V.; Dacal-Nieto, A.; Barreto, L.; Amaral, A.; Ribeo, E. Industry 4.0 implications in machine vision metrology: An overview. Procedia Manuf. 2019, 41, 359–366. [Google Scholar] [CrossRef]
- Hartley, R.; Zisserman, A. Multiple View Geometry in Computer Vision, 2nd ed.; Cambridge University Press: Cambridge, UK, 2003. [Google Scholar]
- Navab, N. SVD Abstract en la Documentación 3D Computer Vision Script Draft; Technische Univertität München: Munich, Germany, 2006; pp. 48–51. [Google Scholar]
- Ham, H.; Wesley, J.; Hendra, H. Computer vision based 3D reconstruction: A review. Int. J. Electr. Comput. Eng. 2019, 9, 2394–2402. [Google Scholar] [CrossRef]
- The 7 Best 3D Body Scanners in 2022. Available online: https://www.aniwaa.com/buyers-guide/3d-scanners/best-3d-body-scanners/ (accessed on 12 December 2022).
- Kinovea, Video Player for Sport Analysis. Available online: https://www.kinovea.org/ (accessed on 12 December 2022).
- Arellano-González, J.C.; Medellín-Castillo, H.I.; Cervantes-Sánchez, J.J.; García-Murillo, M.A. Assessment of computer vision methods for motion tracking of planar mechanisms. J. Mech. Eng. Sci. 2022, 236, 4093–4104. [Google Scholar] [CrossRef]
- Damsted, C.; Nielsen, R.O.; Larsen, L.H. Reliability of video-based 4 quantifications of the knee-and hip angle at foot strike during running. Int. J. Sports Phys. Ther. 2015, 10, 147. [Google Scholar] [PubMed]
- Bragança, S.; Arezes, P.; Carvalho, M.; Ashdown, S.P.; Xu, B.; Castellucci, I. Validation study of a Kinect based body imaging system. Work 2017, 57, 9–21. [Google Scholar] [CrossRef] [PubMed]
- Rumbo-Rodríguez, L.; Sánchez-SanSegundo, M.; Ferrer-Cascales, R.; García-D’Urso, N.; Hurtado-Sánchez, J.A.; Zaragoza-Martí, A. Comparison of Body Scanner and Manual Anthropometric Measurements of Body Shape: A Systematic Review. Int. J. Environ. Res. Public Health 2021, 18, 6213. [Google Scholar] [CrossRef] [PubMed]
- Mu, E.; Pereyra-Rojas, M. Practical Decision Making an Introduction to the Analytic Hierarchy Process (AHP) Using Super Decisions V2; Springer Brief in Operational Research: Cham, Switzerland, 2017. [Google Scholar]
- Ocampo, L.A.; Labrador, J.J.T.; Jumao-As, A.M.B.; Rama, A.M.O. Integrated multiphase sustainable product design with a hybrid quality function deployment–multi-attribute decision-making (QFD-MADM) framework. Sustain. Prod. Consum. 2020, 24, 62–78. [Google Scholar] [CrossRef]
Disclaimer/Publisher’s Note: The statements, opinions and data contained in all publications are solely those of the individual author(s) and contributor(s) and not of MDPI and/or the editor(s). MDPI and/or the editor(s) disclaim responsibility for any injury to people or property resulting from any ideas, methods, instructions or products referred to in the content. |
© 2023 by the authors. Licensee MDPI, Basel, Switzerland. This article is an open access article distributed under the terms and conditions of the Creative Commons Attribution (CC BY) license (https://creativecommons.org/licenses/by/4.0/).

