Article

Air Duct Optimization Design Based on Local Turbulence Loss Analysis and IMOCS Algorithm

1
College of Mechanical Engineering, Zhejiang University of Technology, Hangzhou 310023, China
2
Institute of Innovation Research of Shengzhou, Zhejiang University of Technology, Shengzhou 312400, China
*
Author to whom correspondence should be addressed.
Machines 2023, 11(2), 129; https://doi.org/10.3390/machines11020129
Submission received: 14 December 2022 / Revised: 28 December 2022 / Accepted: 9 January 2023 / Published: 18 January 2023
(This article belongs to the Section Machine Design and Theory)

Abstract

:
Considering the complex flow state of the duct flow field in the exhaust system, the structural parameters can significantly impact the internal flow field and noise. This paper takes the noise generated by the duct system under operating conditions as the research object, studies the mechanism of duct noise generation through theoretical analysis, numerical simulation and experimental test, and proposes an optimization design method, that is, to improve the duct structure by adding duct guide vanes. In order to maximize the optimization effect of the guide vane, a multiobjective optimization design of its profile is required, including the parametric expression of the guide vane profile, establishing the design variables and optimization objectives, and establishing the Kriging approximation model. The IMOCS algorithm is used to accurately and efficiently calculate the Pareto front solution to obtain the optimal profile of the duct guide vane and finally improve the noise-reduction performance of the duct system. This paper applies this design method to an integrated stove head duct to verify its accuracy, and prototype tests are conducted according to the optimization results. The test results show that the optimized integrated cooker has improved the outlet flow rate of the whole machine by 1.2 m3/min and reduced the noise by 2.3 dB.

1. Introduction

As a shaped duct for evacuating fluid, the duct is crucial to the exhaust system’s stable gas transmission and pneumatic noise performance. Duct systems are widely used in household appliances such as refrigerators, air conditioners, hoods, integrated cookers, etc. A significant problem in their operation is noise, which can significantly weaken the competitiveness of products and reduce the user’s experience.
In order to improve the transmission efficiency of the air duct and reduce the aerodynamic noise, scholars of the field have conducted much research from theoretical analysis, experimental research and numerical simulation. Lee [1] used particle image velocimetry (PIV) to visualize the internal flow field of household refrigerators. The gray difference method was used to process multiple flow images, and the simulation calculation was carried out. The comparison results verify the reliability of the simulation calculation. Zhao [2] used CFD simulation to analyze the structural characteristics of the initial air duct of the refrigerator, and proposed design defects and optimization design schemes. The results show that the improved air duct will increase the total air volume by about 17.44%, so that the temperature of the refrigerator room is more uniform and not easy to condense. Koo [3] studied the influence of vortex and stabilizer on the performance and noise characteristics of air-conditioning cross-flow fan, and reduced the noise of air conditioner by improving its structure. Liu [4] optimized the performance of range hood by response surface method, and revealed the influence of the structural parameters of the range hood box on its aerodynamic performance. The results showed that the maximum air volume of the range hood increased by 0.95 m3/min under the same noise conditions. Wang [5] simulated and analyzed the sound field intensity of the air duct system of the range hood. According to the simulation analysis results, the noise reduction of the air duct system was carried out. The experimental results showed that the noise of the optimized range hood decreased by 3.1 dBA compared with the original value, and the air performance remained basically unchanged.
In addition, with the development of computer technology, the combination of CFD technology and optimization algorithms for pneumatic optimization design has become one of the main tools for fluid mechanical design. In order to ensure that the duct system generates low noise while maintaining high flow rate, it is necessary to use optimization algorithms for the multiobjective design of the duct structure [6], and some scholars have conducted in-depth research on evolutionary algorithms based on the multiobjective optimization problem of Pareto optimal solution. Deb [7] proposed the classical NSGA-II algorithm by improving the nondominated sorting genetic algorithm (NSGA). Coello [8] and others proposed the multiobjective particle swarm optimization algorithm (MOPSO) based on particles. Zhang [9] combined traditional mathematical planning methods with evolutionary algorithms to propose the decomposition-based multiobjective evolutionary algorithm (MOEA/D). Gong [10] proposed the nondominated neighborhood antibody selection immune multiobjective optimization algorithm (NNIA).
In summary, previous researchers only improved the duct structure, and did not study the flow characteristics in depth. In this paper, based on the study of the mechanism of aerodynamic noise generation in the duct system, a multiobjective optimization design method is proposed to reduce the duct noise under the condition of ensuring the flow rate. The proposed method is verified by the coupling verification of the integrated stove head air duct in this study. The optimization design is carried out by adding the guide vane, and the optimization results are verified by the proof test. This method applies to, but is not limited to, the optimization of the air duct system of other appliances and is highly adaptable, providing new ideas for the entire integrated stove industry and the energy-saving and noise-reducing design of the air duct system.

2. Local Loss Analysis of Air Duct System

The duct noise of household appliances consists of pneumatic noise, resonant noise, and electromagnetic noise, which is the prominent noise of the duct system. The duct system is separated by the boundary layer and airflow, resulting in pressure pulsation of the internal structure, resulting in unstable flow noise. Pneumatic noise mainly includes eddy current noise and rotational noise. Eddy noise, also known as broadband noise, is made by the interaction of the turbulent layer and blade, air duct components, air outlets, and other structural components. Its spectral characteristics are randomly continuous. Rotational noise is mainly bladed dispersion in the form of harmonics outward, and its spectral characteristics are discrete [11].
This paper mainly studies the vortex noise in the air duct system. The flow characteristics in the air duct system can be studied by the flow theory in the pipe. The commonality of different electrical duct systems is that the vortex area and velocity redistribution often occur at the local device, that is, the viscous fluid generates local loss in the flow of the pipe. The local loss occurs in the rapid change of flow state, which is mainly caused by the collision of fluid microclusters and vortices in the fluid. The calculation formula is as follows,
h j = ζ v 2 2 g ,
where h j denotes the local loss per unit weight of fluid m, ζ denotes the local resistance coefficient v denotes the average flow velocity on the effective cross-section of the pipe, m/s, and g denotes the acceleration of gravity, m/s2.
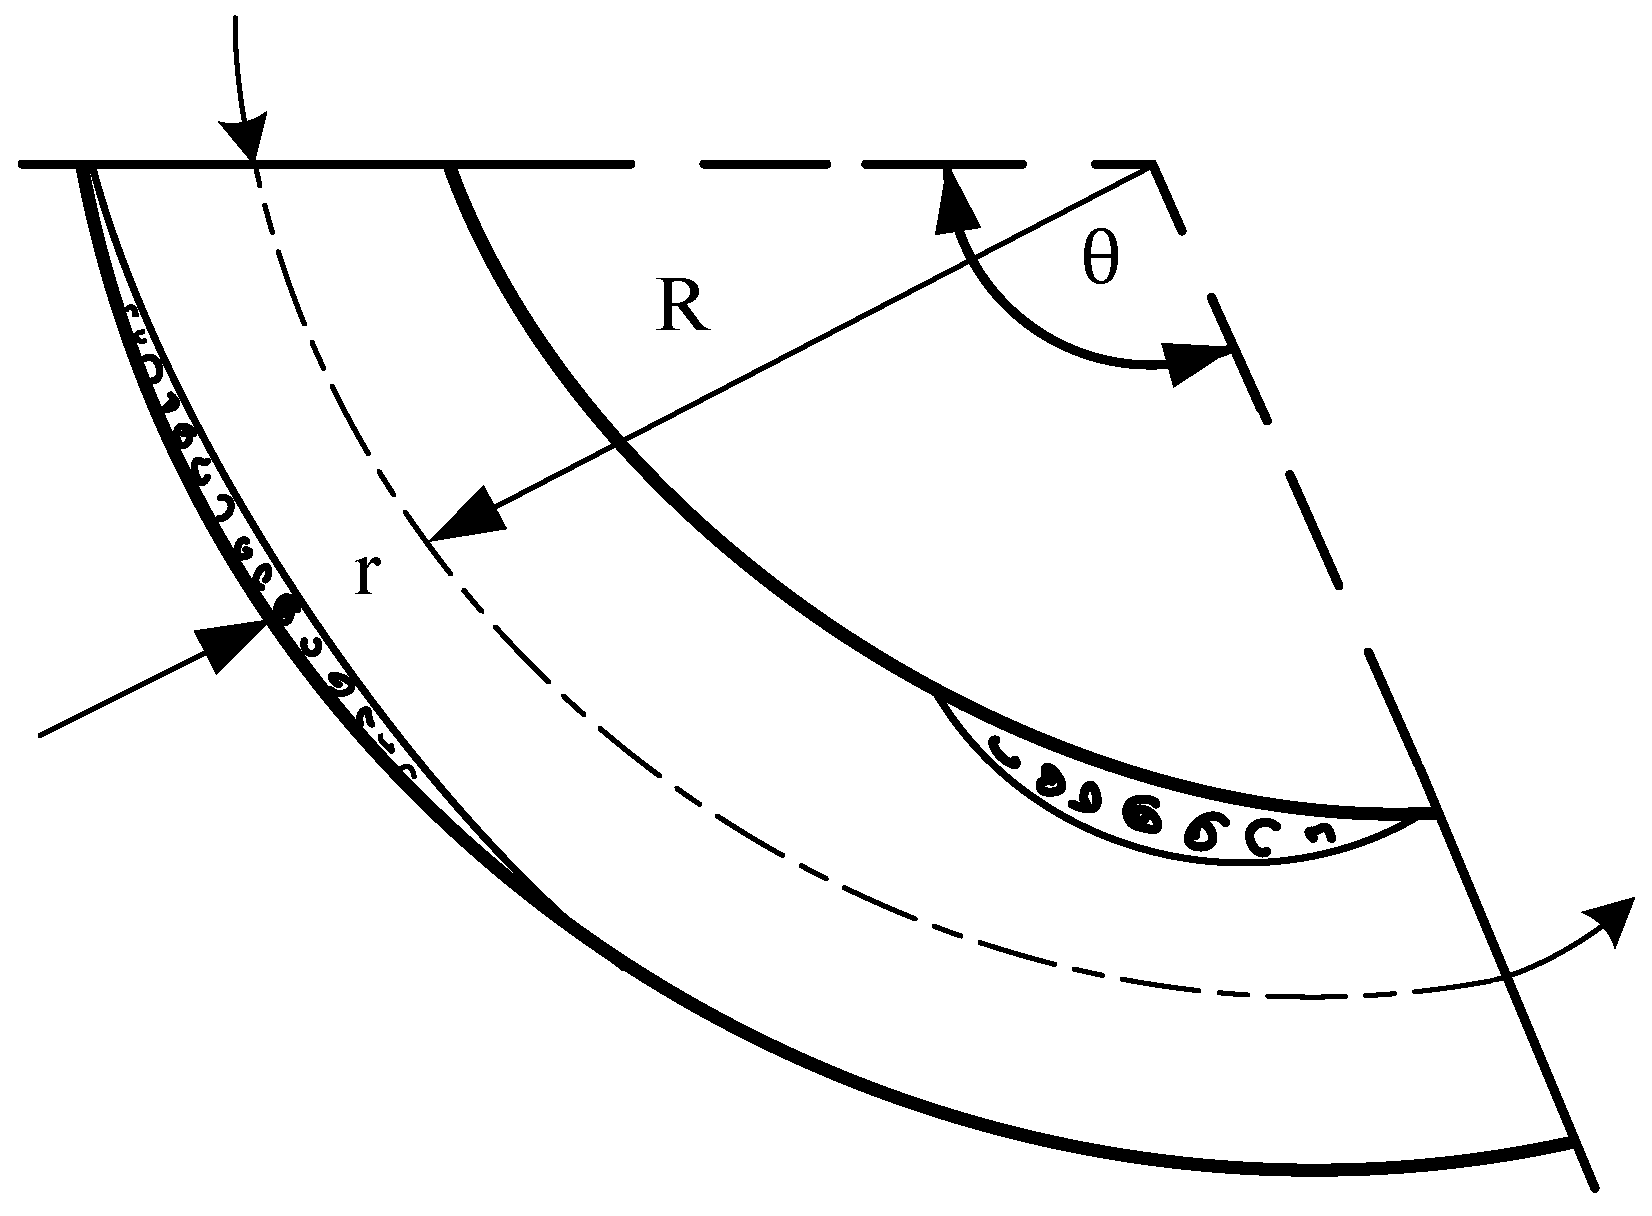
In the duct system, the energy loss mostly occurs at the corners of the duct, so this paper takes the local loss of the duct as an example to analyze the flow field. Due to the flow inertia, streamline separation often occurs on the inside of the elbow to form a vortex area; on the outside of the bend, the impact of the fluid on the wall increases the degree of airflow chaos, causing the generation of turbulent airflow, thus forming a vortex area, as shown in Figure 1 [12].
In the overflow section of the pipeline, the external pressure is greater than the inner pressure measurement, the high-pressure part of the fluid along the wall of the pipe to the low-pressure part of the extrusion. Consequently, the section produced backflow, and finally, the fluid often left the bend in a spiral movement. Through experiments, Weisbach summarized the empirical formula for the local loss coefficient in bends,
ζ = 0.131 + 1.847 r R 3.5 θ 90 ,
where ζ indicates the local resistance coefficient of the bend, r indicates the radius of the bend, m, R indicates the bending radius of the bend, m, and θ indicates the bending angle of the bend.
From Equations (1) and (2), it can be seen that when the flow rate of gas in the pipeline is constant, the greater the degree of bending, the greater the local loss will be. The area of the generated vortex area will increase, and the vortex area will appear on the inside and outside of the pipe wall. In addition, it is also necessary to judge the impact of the vortex area in the pipeline on the noise. Not all vortices will produce considerable broadband noise, and identifying the vortices that significantly impact the duct noise is the key to noise-reduction design. When the air flows in the pipeline to form turbulence, the turbulence itself contains part of the turbulent kinetic energy as the duct structure vibration excitation on the pipe wall, causing the vibration of the pipe wall and external radiation noise, another part of the energy will flow as a sound source in the pipe to produce noise, so the turbulent kinetic energy is one of the leading causes of vortex noise in the duct [13].
Based on the above theoretical research, this paper proposes an optimal design method for the duct system, i.e., according to the numerical simulation results, the part of the duct where both vortex zone and severe turbulent energy loss exist is identified, and the duct guide vane is added there to channel the gas vortex in the vortex zone into the primary airflow, to reduce the turbulent energy loss and realize the duct noise reduction. Due to the complex and variable flow conditions in the vortex area of the duct, the design of the guide vane profile is complicated. In order to minimize the duct noise while ensuring the flow rate, the multiobjective optimization design of the guide vane is carried out in this paper, and the IMOCS algorithm is used to solve the design, which significantly improves the efficiency and accuracy of the design.

3. Feasibility Verification of Design Methods

3.1. Validation Object

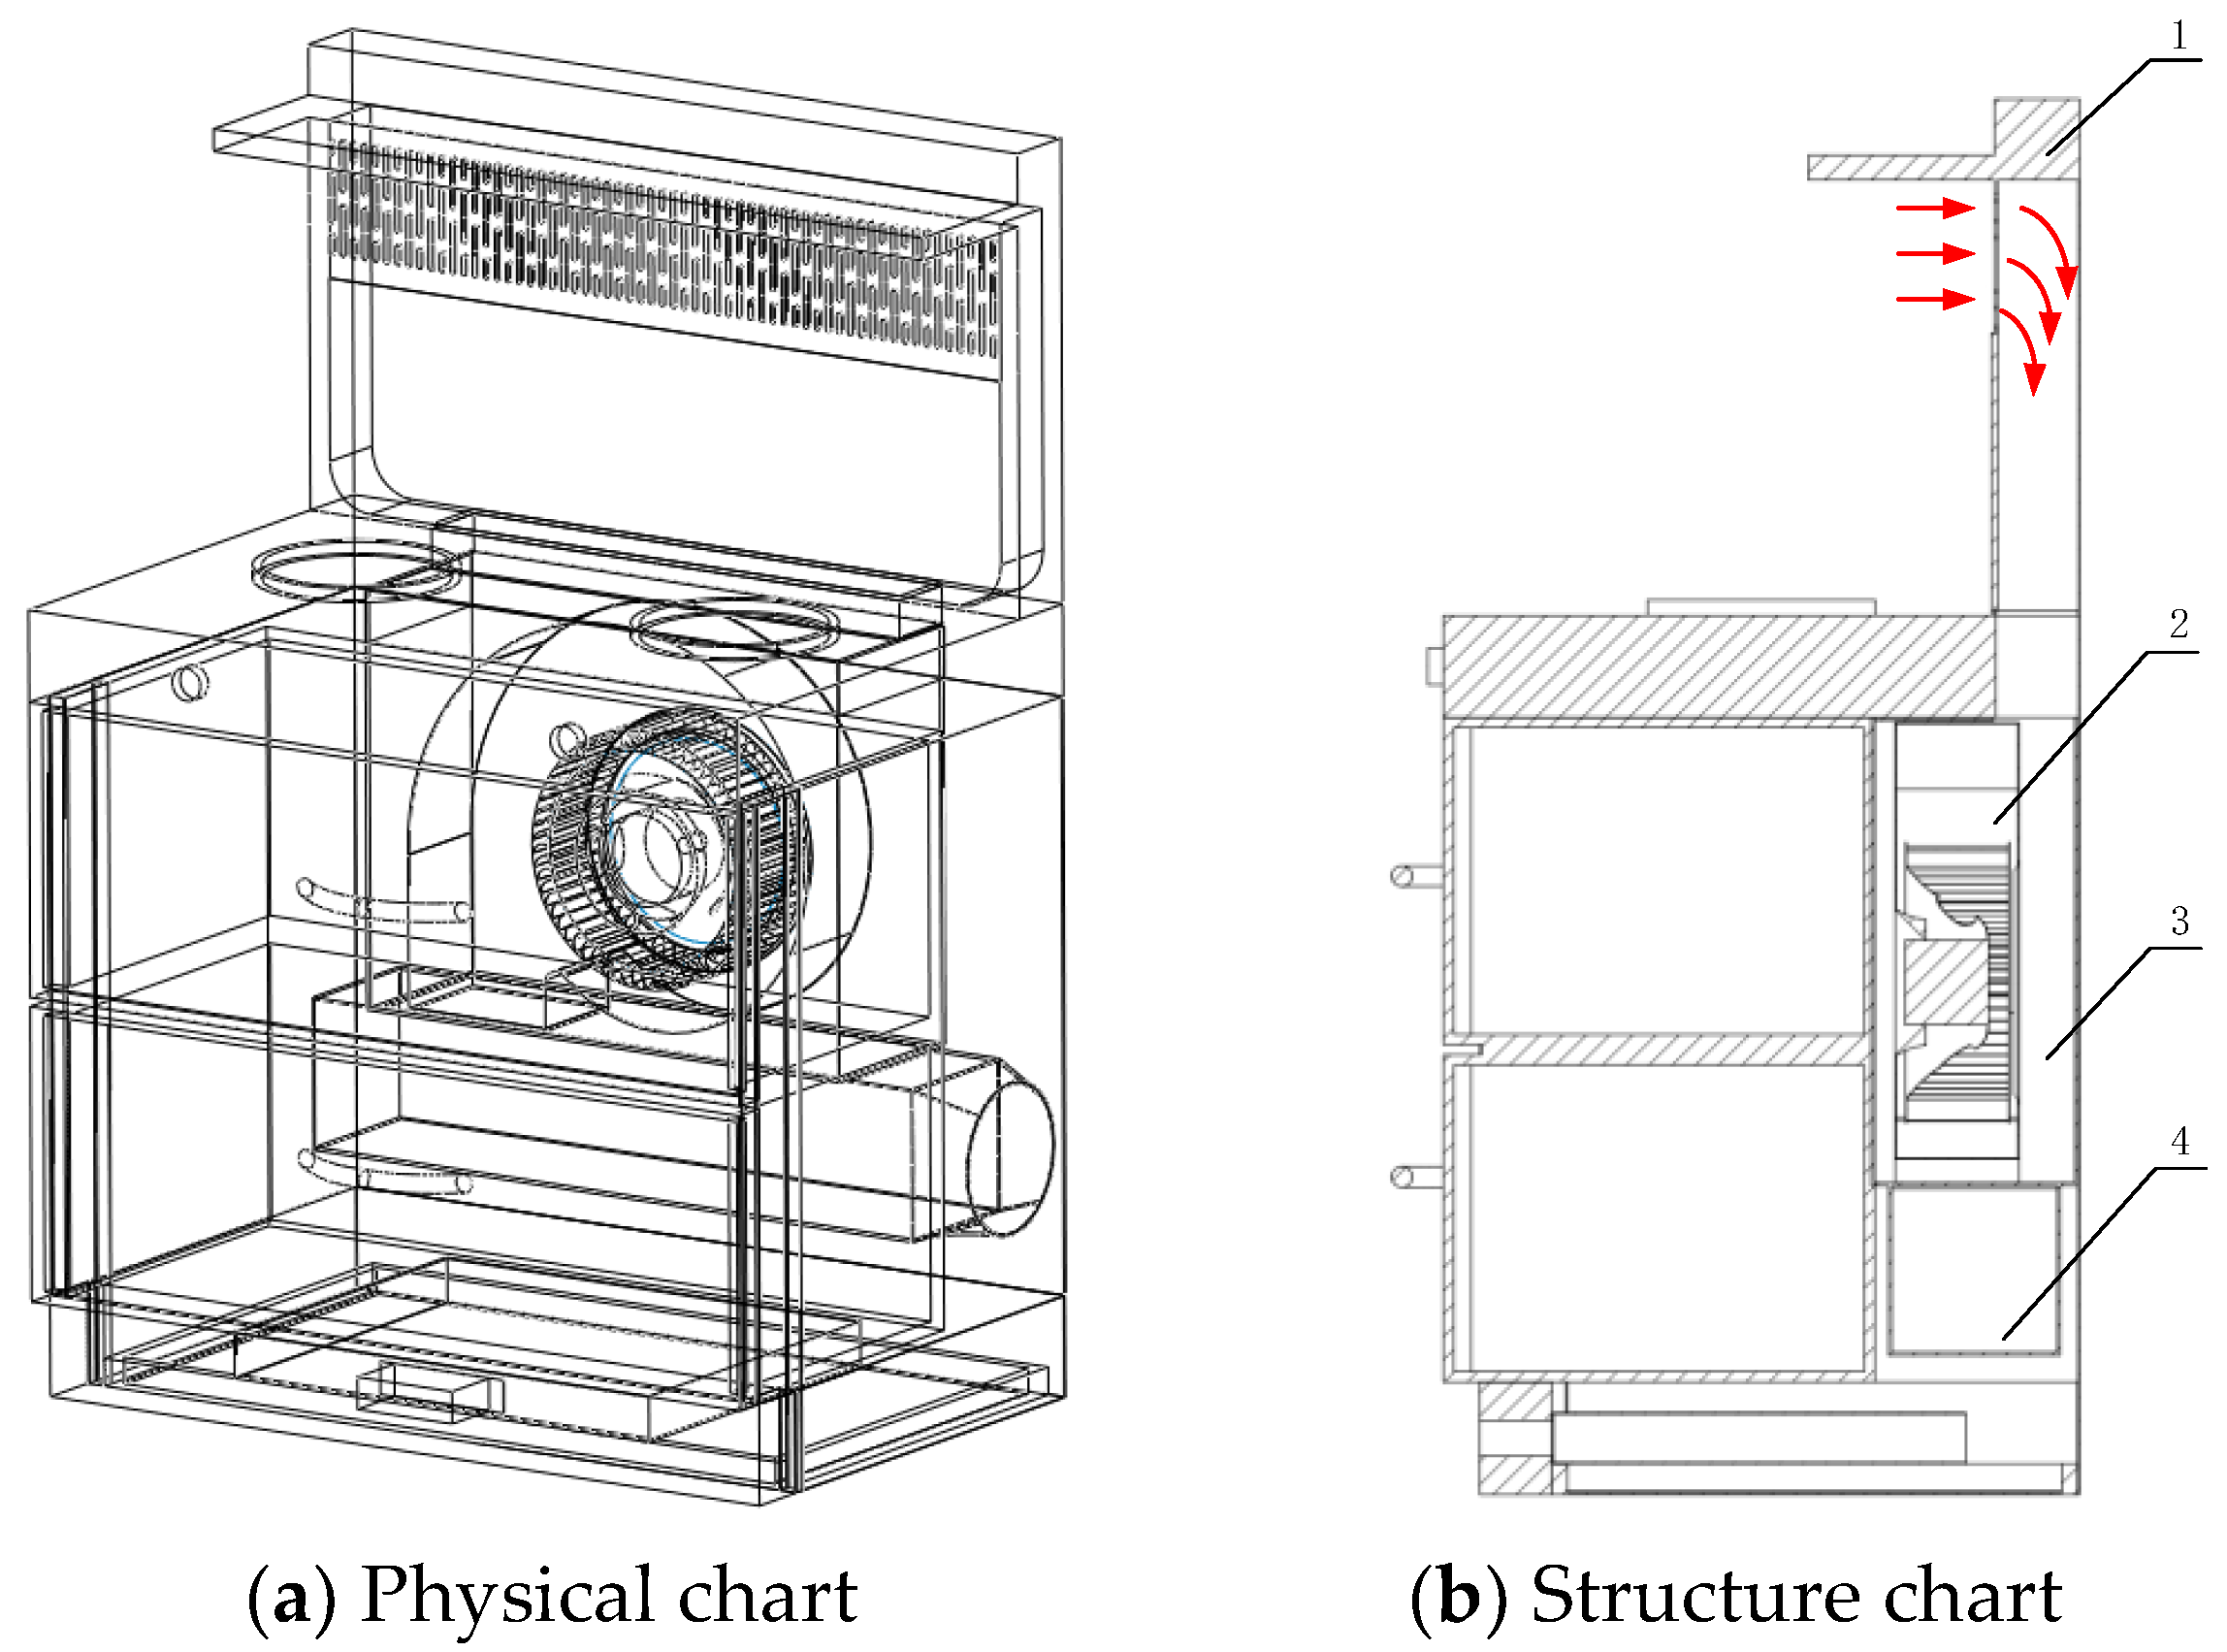
In order to verify the feasibility of the above design method, this paper takes an integrated cooker smoke exhaust system as the verification object. The structure schematic diagram is shown in Figure 2. The integrated cooker smoke exhaust system is a back-to-back system, in which the smoke exhaust system can be divided into two parts: duct system and fan system (2), the duct system mainly consists of head duct (1), air inlet box (3) and air guide box (4), and the fan system (2) mainly consists of impeller, worm housing, motor, and flow collection ring.
The structural parameters of the integrated stove air duct system are shown in Table 1.

3.2. Computational Modeling and Validation

In order to generate the integrated cooker fluid domain grid more efficiently, the whole integrated cooker basin is divided into inlet, head, inlet box, fan, guide box, and outlet fluid domains.
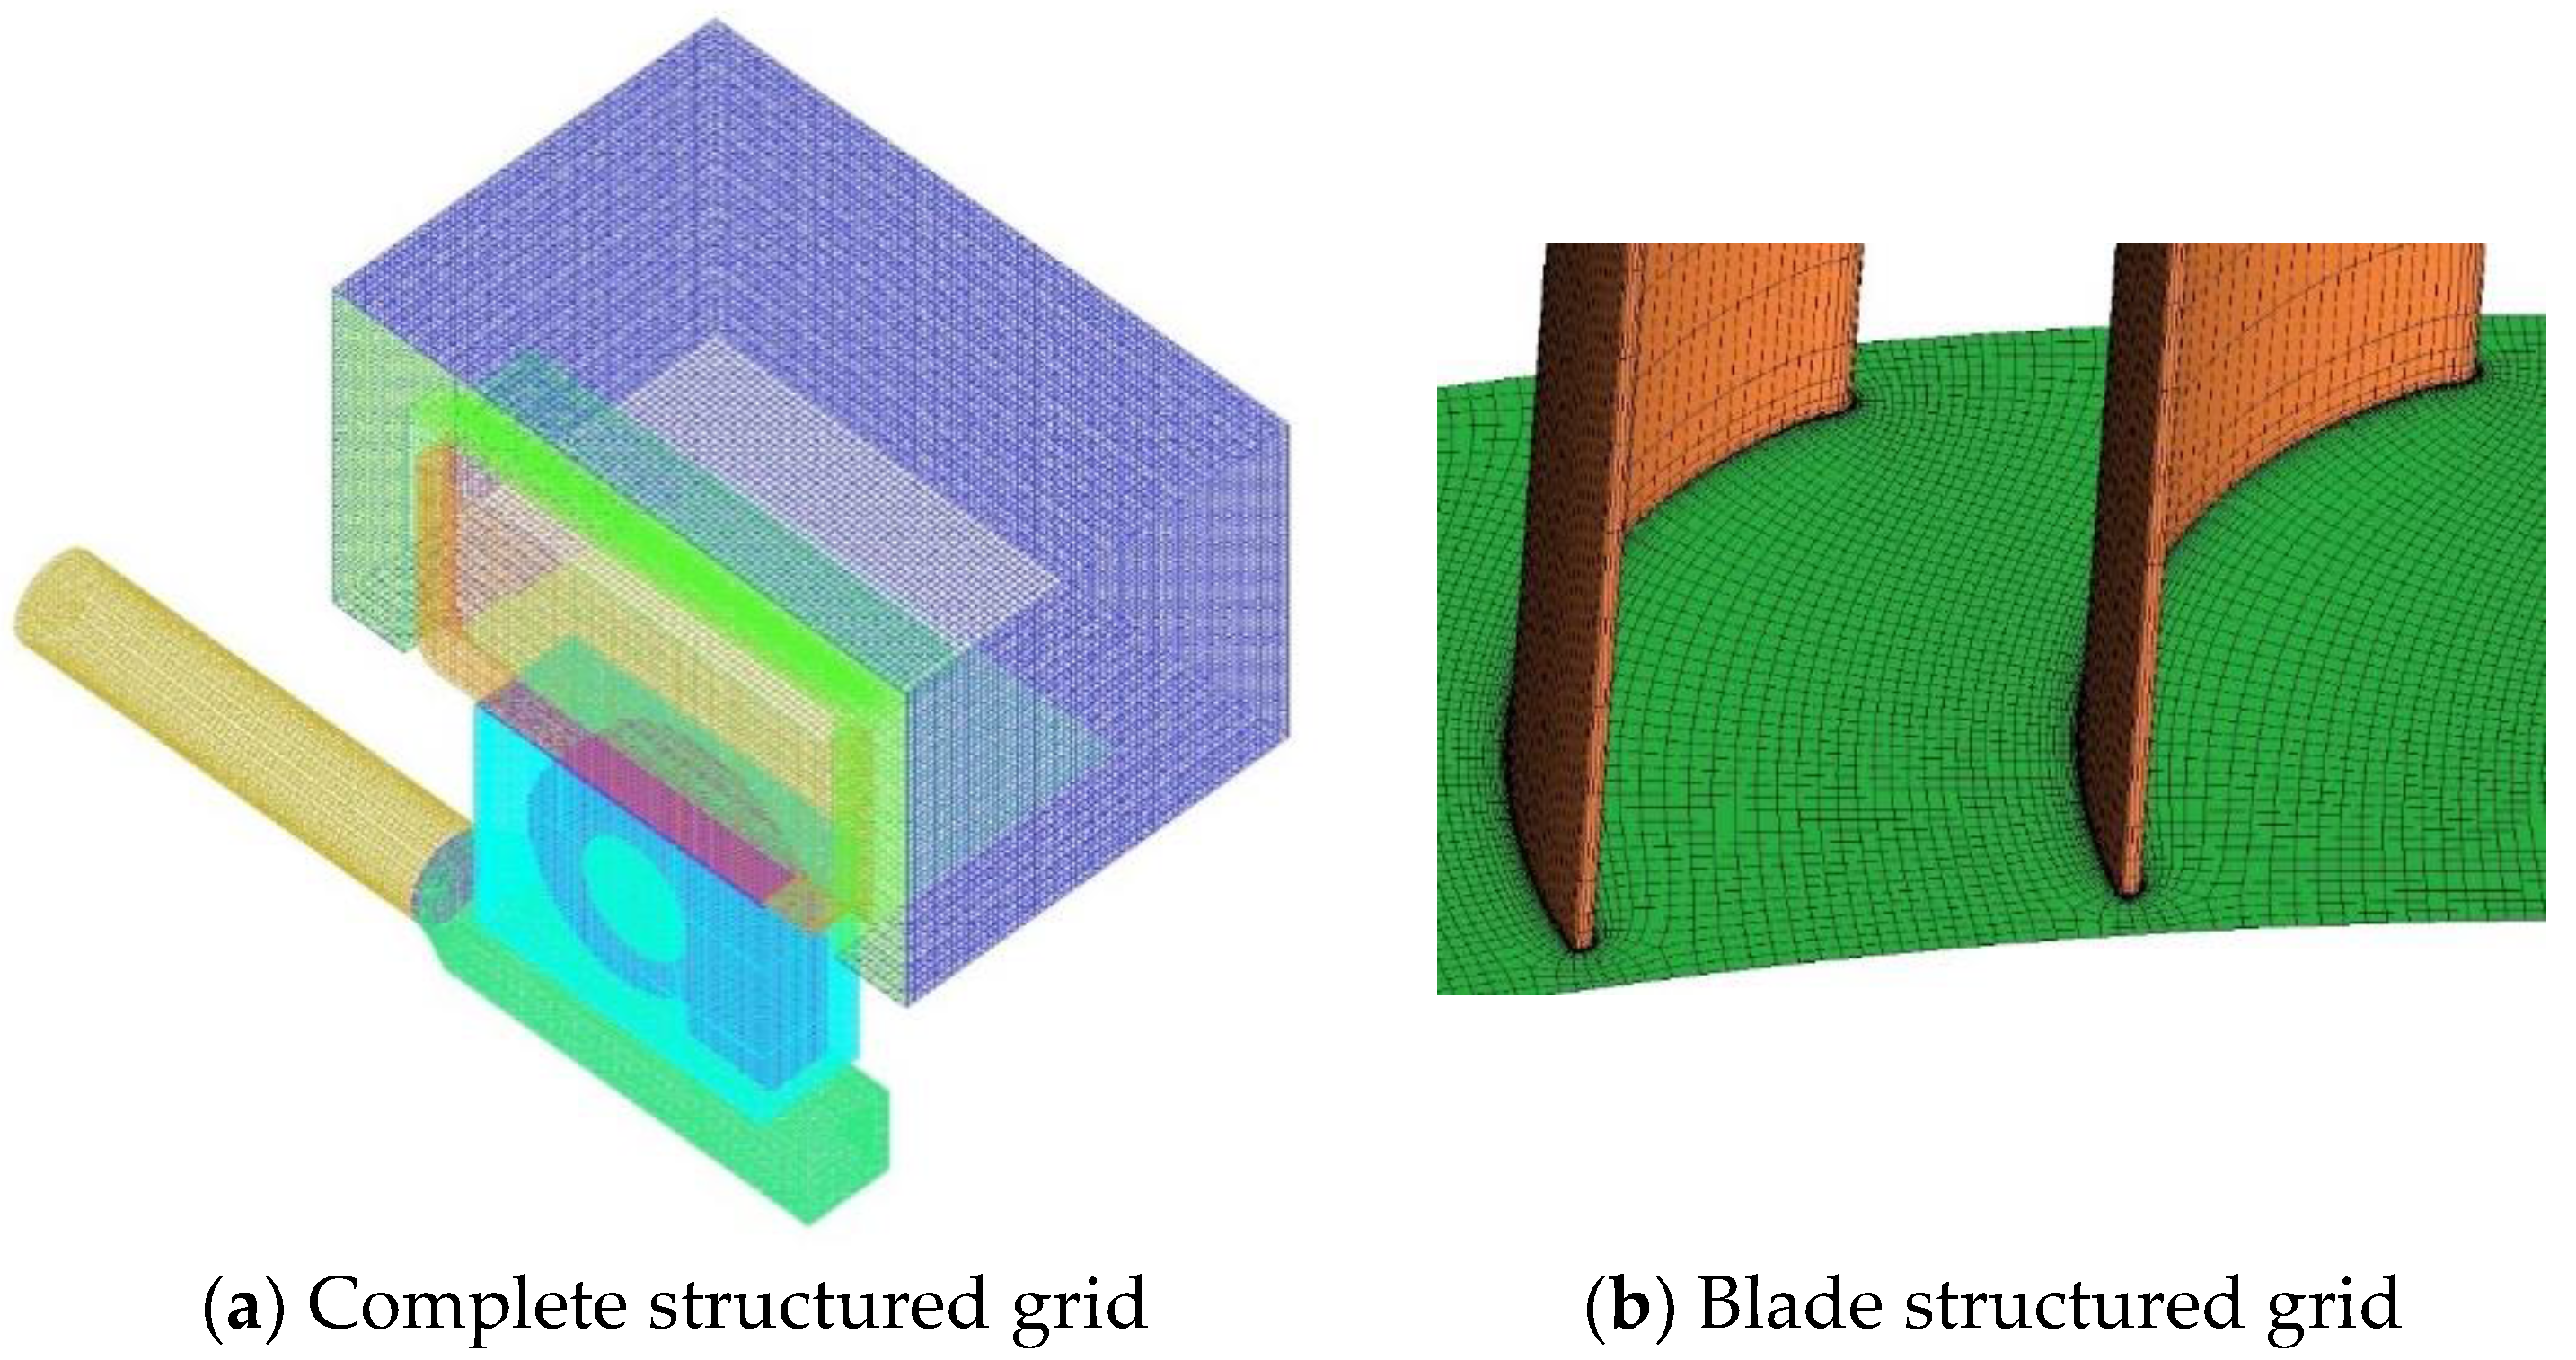
The blades within the integrated stove fan system rotate at high speed and have a more complex internal structure, thus requiring a higher quality of the computational grid. In order to ensure the accuracy of calculation, this paper uses hexahedral structured mesh to divide each basin. Because the overall size of the smoke exhaust system is large and the geometric size of the blade and other structures is too small, setting the same grid will seriously affect the calculation accuracy. Therefore, the whole basin is divided into inlet, head, air inlet box, fan, air guide box, and outlet fluid domain. The global grid setting first makes the grid sparse to reduce the simulation time, and then makes the necessary structural encryption through local grid encryption to obtain the correct simulation results. Finally, the basins’ meshes are stitched together by using the interface surface to form the complete computational model mesh of the integrated stove exhaust system, as shown in Figure 3.
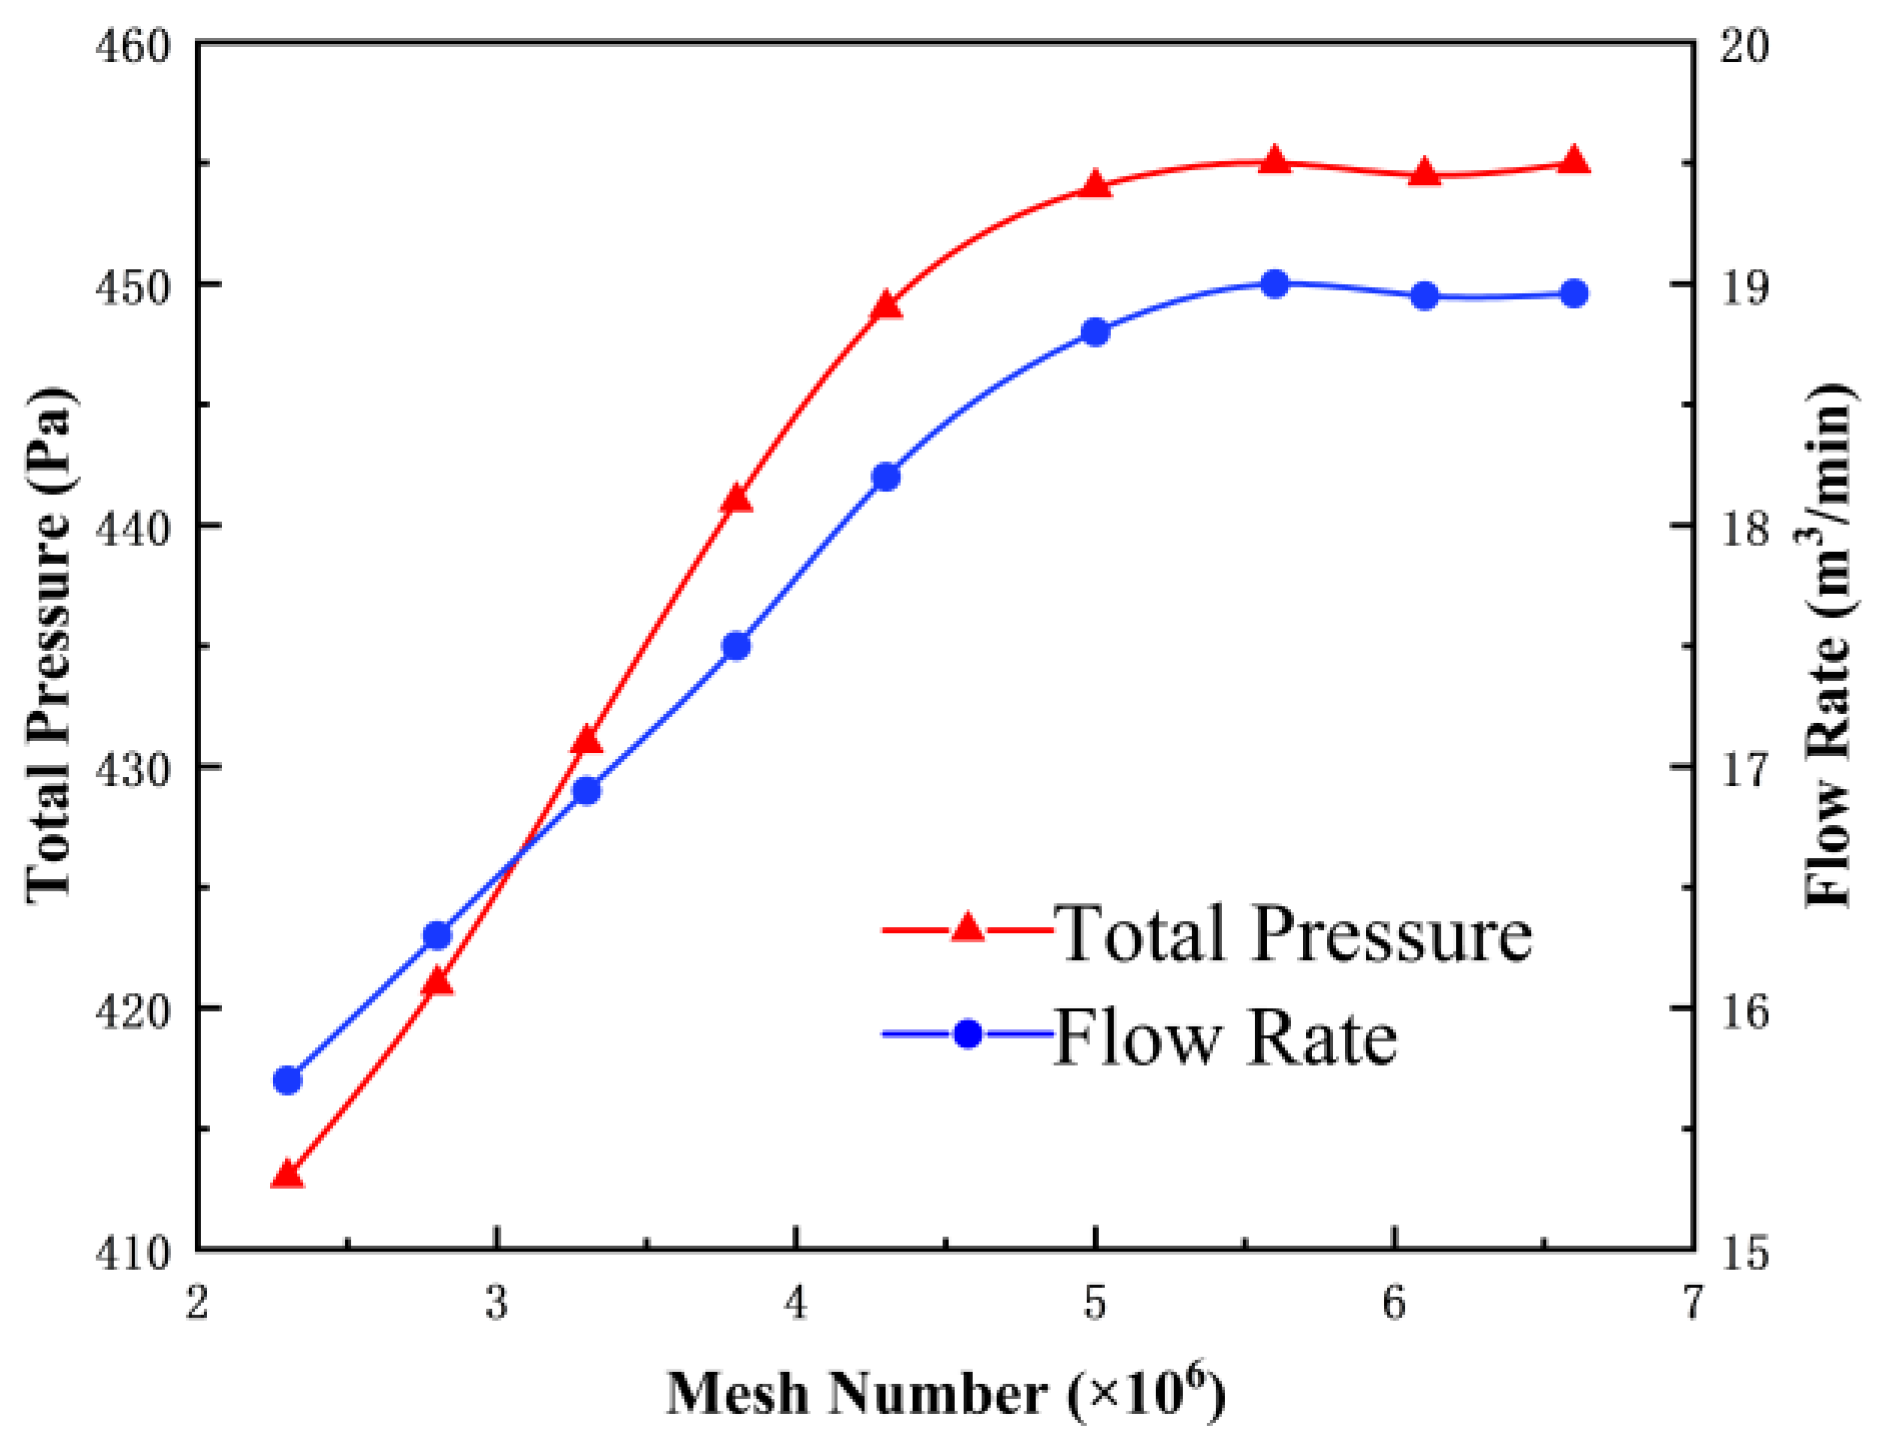
The quality of the grid is a crucial factor in ensuring the accuracy and reliability of the numerical simulation results, so the Jacobi quality of the generated grid should be at least 0.3. Moreover, to save computational resources and improve efficiency as much as possible, the number of grids needs to be strictly controlled, so grid independence verification is also required. Taking the total pressure and outlet air volume of the fan as reference indicators, the numerical simulation results are shown in Figure 4. Therefore, under the condition of ensuring the accuracy of the calculation results, the grid number of the fan system is kept at about 5,611,692, which can improve the calculation efficiency.
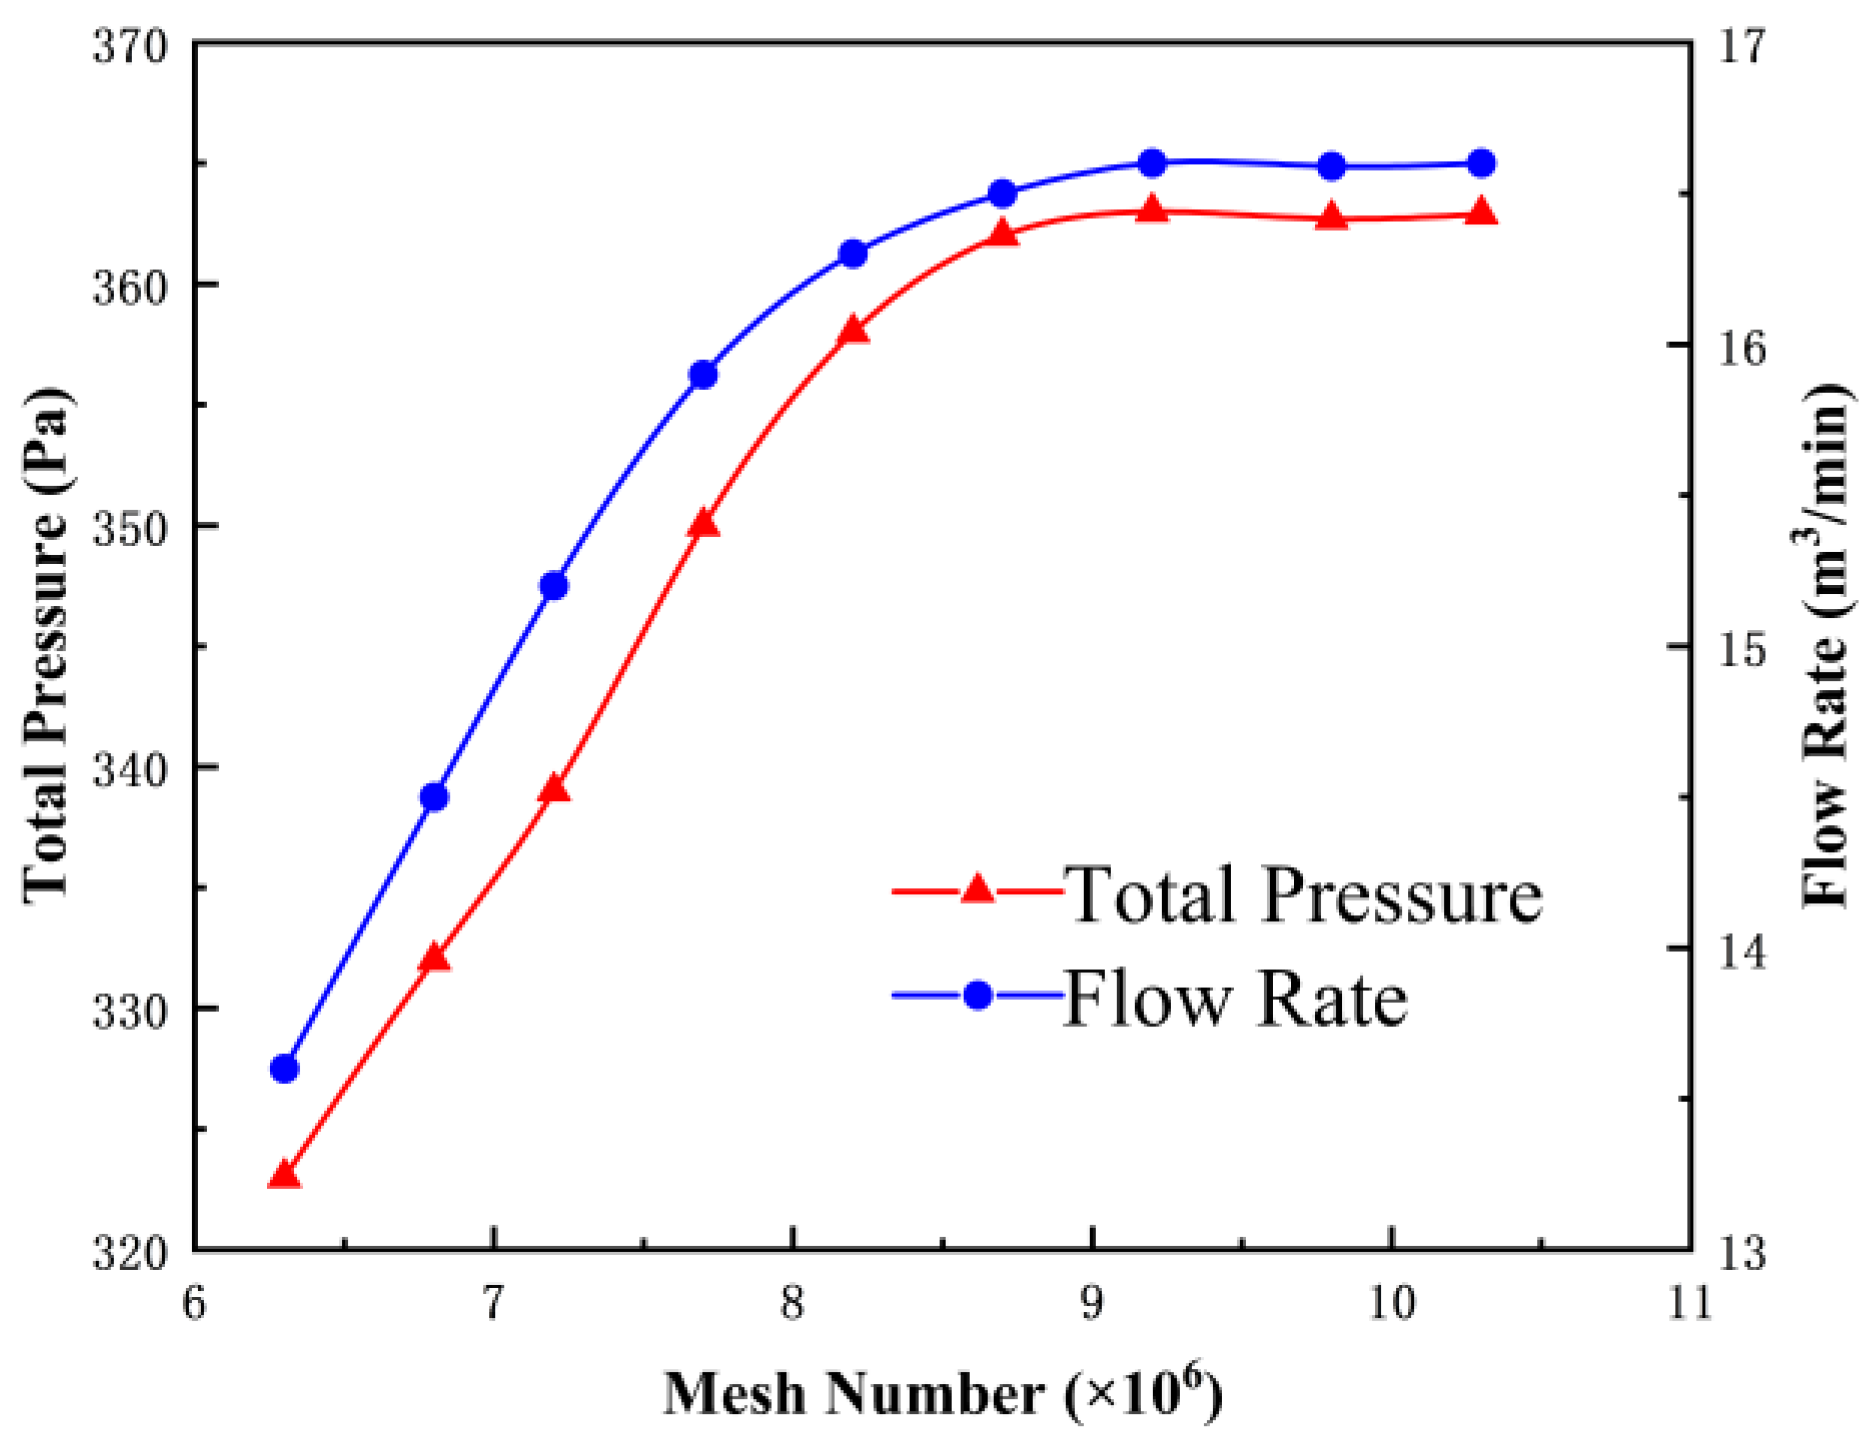
Based on the above 5,611,692 grid number of the fan system, the grid independence of the integrated stove duct system is verified by using the numerical simulation calculation results. Under the condition that the grid number of the fan system is fixed, the grid density of the integrated stove duct system is changed for calculation. The results of the numerical simulation are shown in Figure 5. When the number of grids of the air duct system reaches 9,265,461, the machine’s total pressure and air volume remain stable. Therefore, the prototype air duct system with grid number 9,265,461 is selected for simulation calculation. Table 2 shows the grid number of each basin.

3.3. Boundary Conditions and Calculation Methods

The computational models involved in this paper were solved by using FLUENT software. The temperature for both the calculation and the test is 25 °C. The medium in the basin is air, where the blade basin in the fan system is set as a rotating domain, and the multiple reference system model (MRF) is used for the calculation. The other basins of the fan system and the basin of the duct system are all static wall surface basins. The blade’s rotational speed is set to 1000 r/min, and all other parts are set to the static wall surface. The air inlet of the integrated hood is set as a pressure inlet, the air outlet is set as a pressure outlet, and the outlet section of the hood outlet is set as the airflow monitoring surface. The implicit pressure-based equations were selected for the solution, and the three-dimensional Reynolds-averaged N-S simulations were performed in Fluent to obtain the steady flow field in the duct system with the following control equations. We have [14]
ρ t + ρ u i x i = 0
ρ u i t + x j ρ u i u j = p x i + x j μ u i x j ρ u i u j ¯ + S i ,
where ui denotes the velocity component averaged over the xi direction, and ρ, t, μ, and p are the air density, time, dynamic viscosity, and average fluid pressure, respectively.
This paper chooses the finite volume method (FVM) to discrete the three-dimensional steady-state incompressible Reynolds average Navier–Stokes (RANS) equation discretization [15]. The SIMPLE algorithm is selected for the velocity-pressure coupling method. The spatial discretization format is set to the momentum equation, the dissipation rate equation, and the turbulent kinetic energy equation in the second-order windward form. To ensure the accuracy of the numerical results, the root means square (RMS) values of the residuals of the control equations are set to be no more than 10−5.
In this paper, the acoustic module in the software Fluent is used to simulate the acoustic characteristics of the integrated stove smoke exhaust system. The steady-state calculation results are used as the initial flow field of the transient calculation. The time step of the transient calculation is the time required for the blade to rotate 1°, that is
Δ t = 1 360 × 60 n = 1 6 n ,
where Δt denotes the time step of transient calculation, s, n denotes the fan speed, r/min. Therefore, for the object studied in this paper, the time step is 0.0001 s, to obtain near-field flow field information, by calculating the time domain integral and area fraction to solve the Ffowcs Williams and Hawkings (FW-H) equation to determine the far-field noise of the integrated stove machine.

4. Multiobjective Optimization Design of Air Duct Guide Vane

4.1. Head Duct Flow Field Analysis

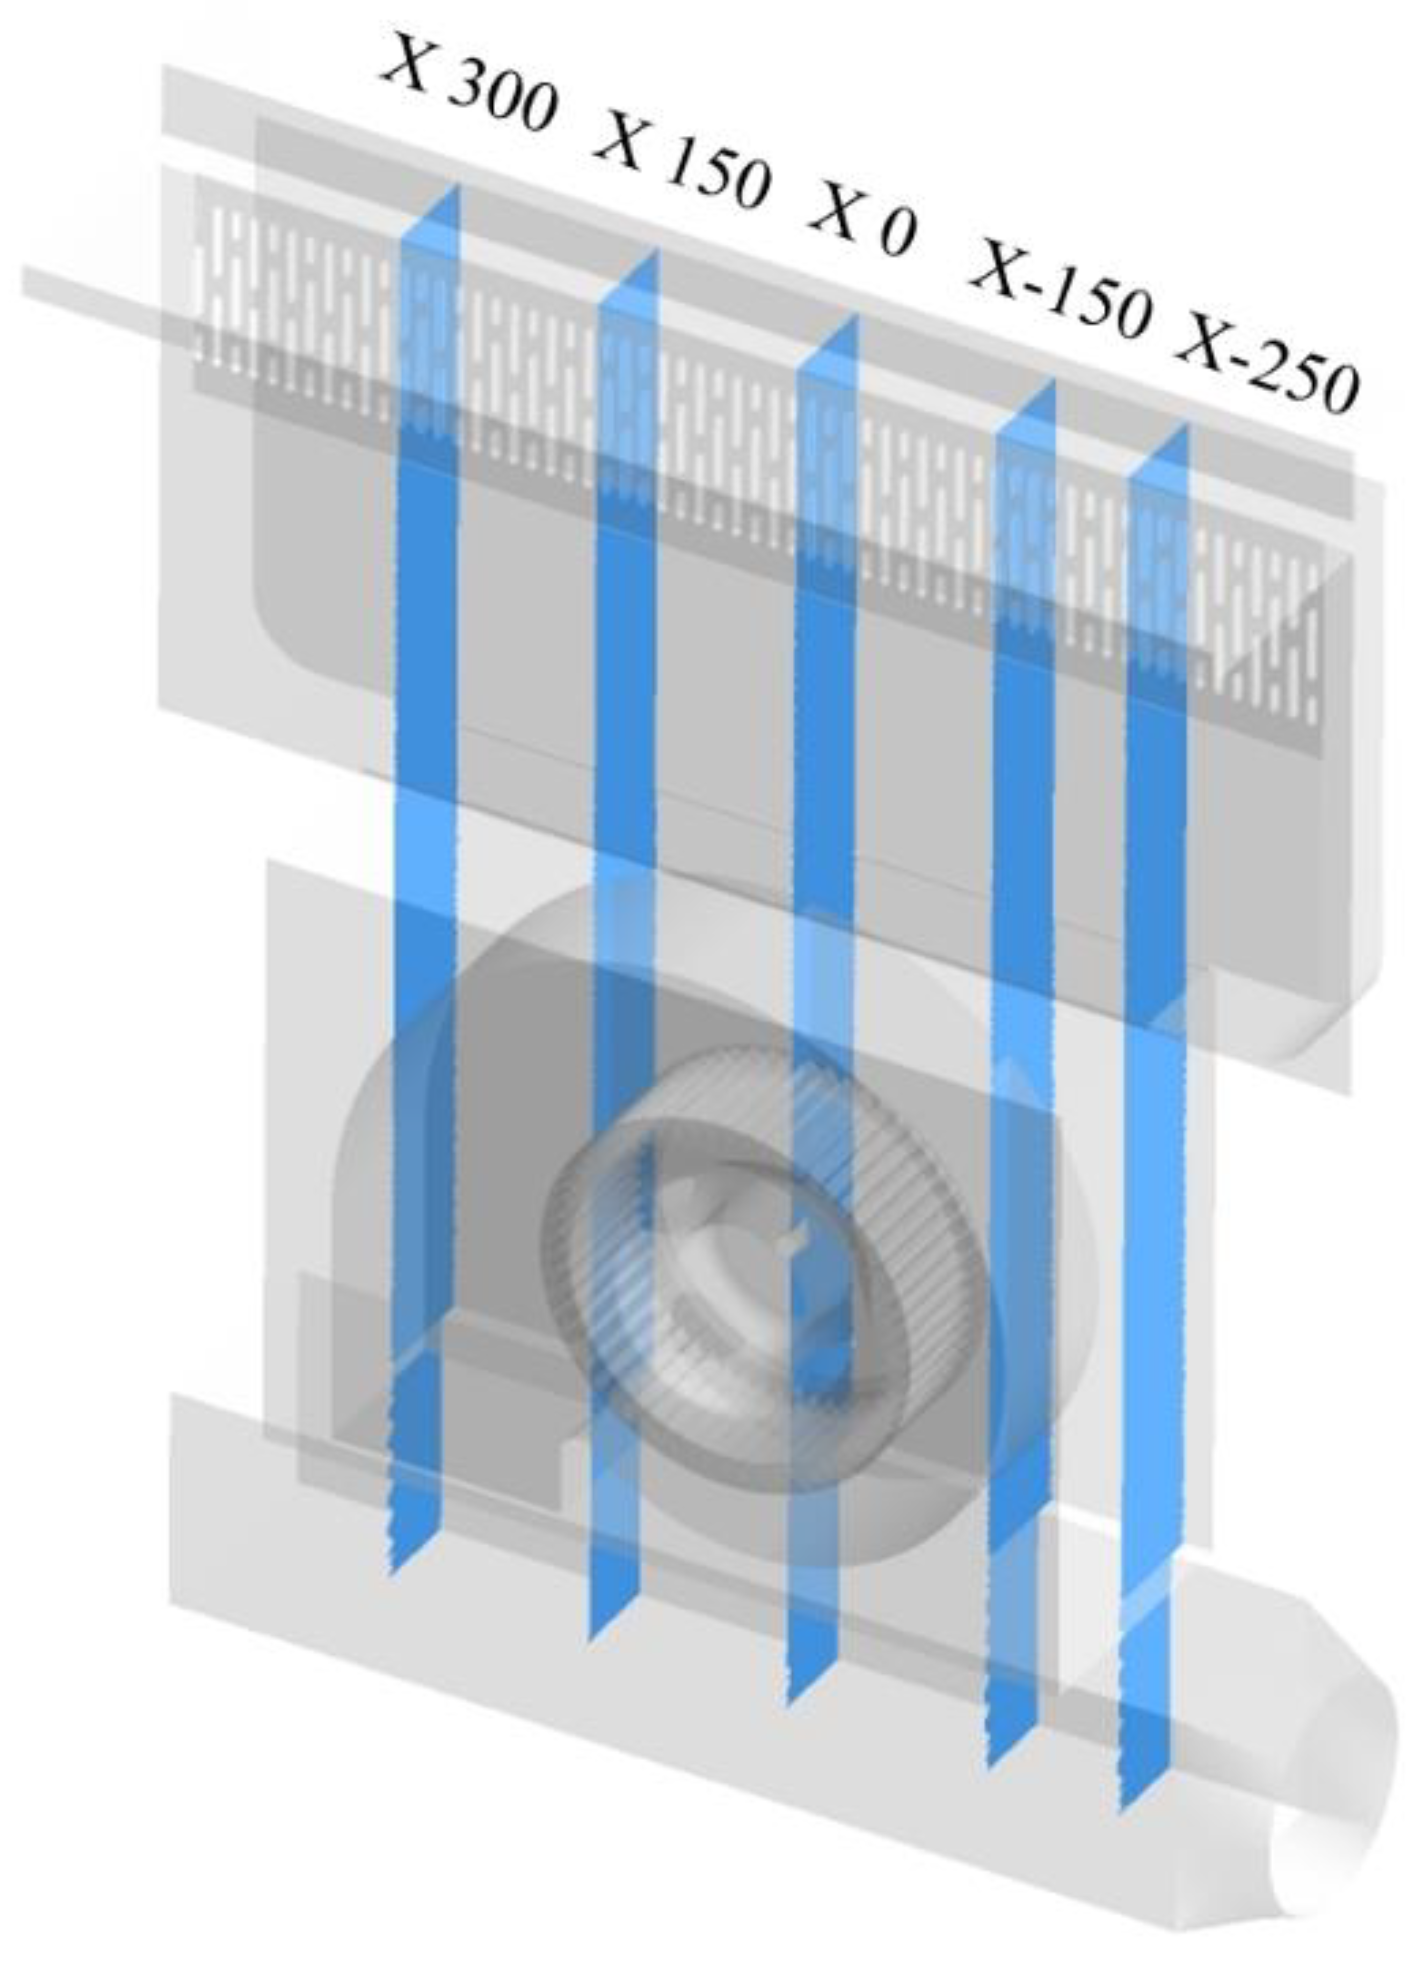
In this chapter, we first analyze the internal flow field of the integrated cooker head duct and propose an optimization scheme. In order to more accurately analyze the flow field characteristics inside the air duct of the integrated stove prototype head, the cross-section of the air duct along the X-axis direction is taken to observe the flow characteristics in the air duct. Figure 6 is the cross-sectional position calibration diagram of the air duct at the head of the integrated stove in the X direction. The cross-sections in the X direction are represented by X-250, X-150, X 0, X 150 and X 300, respectively. The X 0 section is located on the vertical meridian plane of the multiblade centrifugal fan in the fan system, and the number in X 150 represents the horizontal distance between the section and the X 0 section.
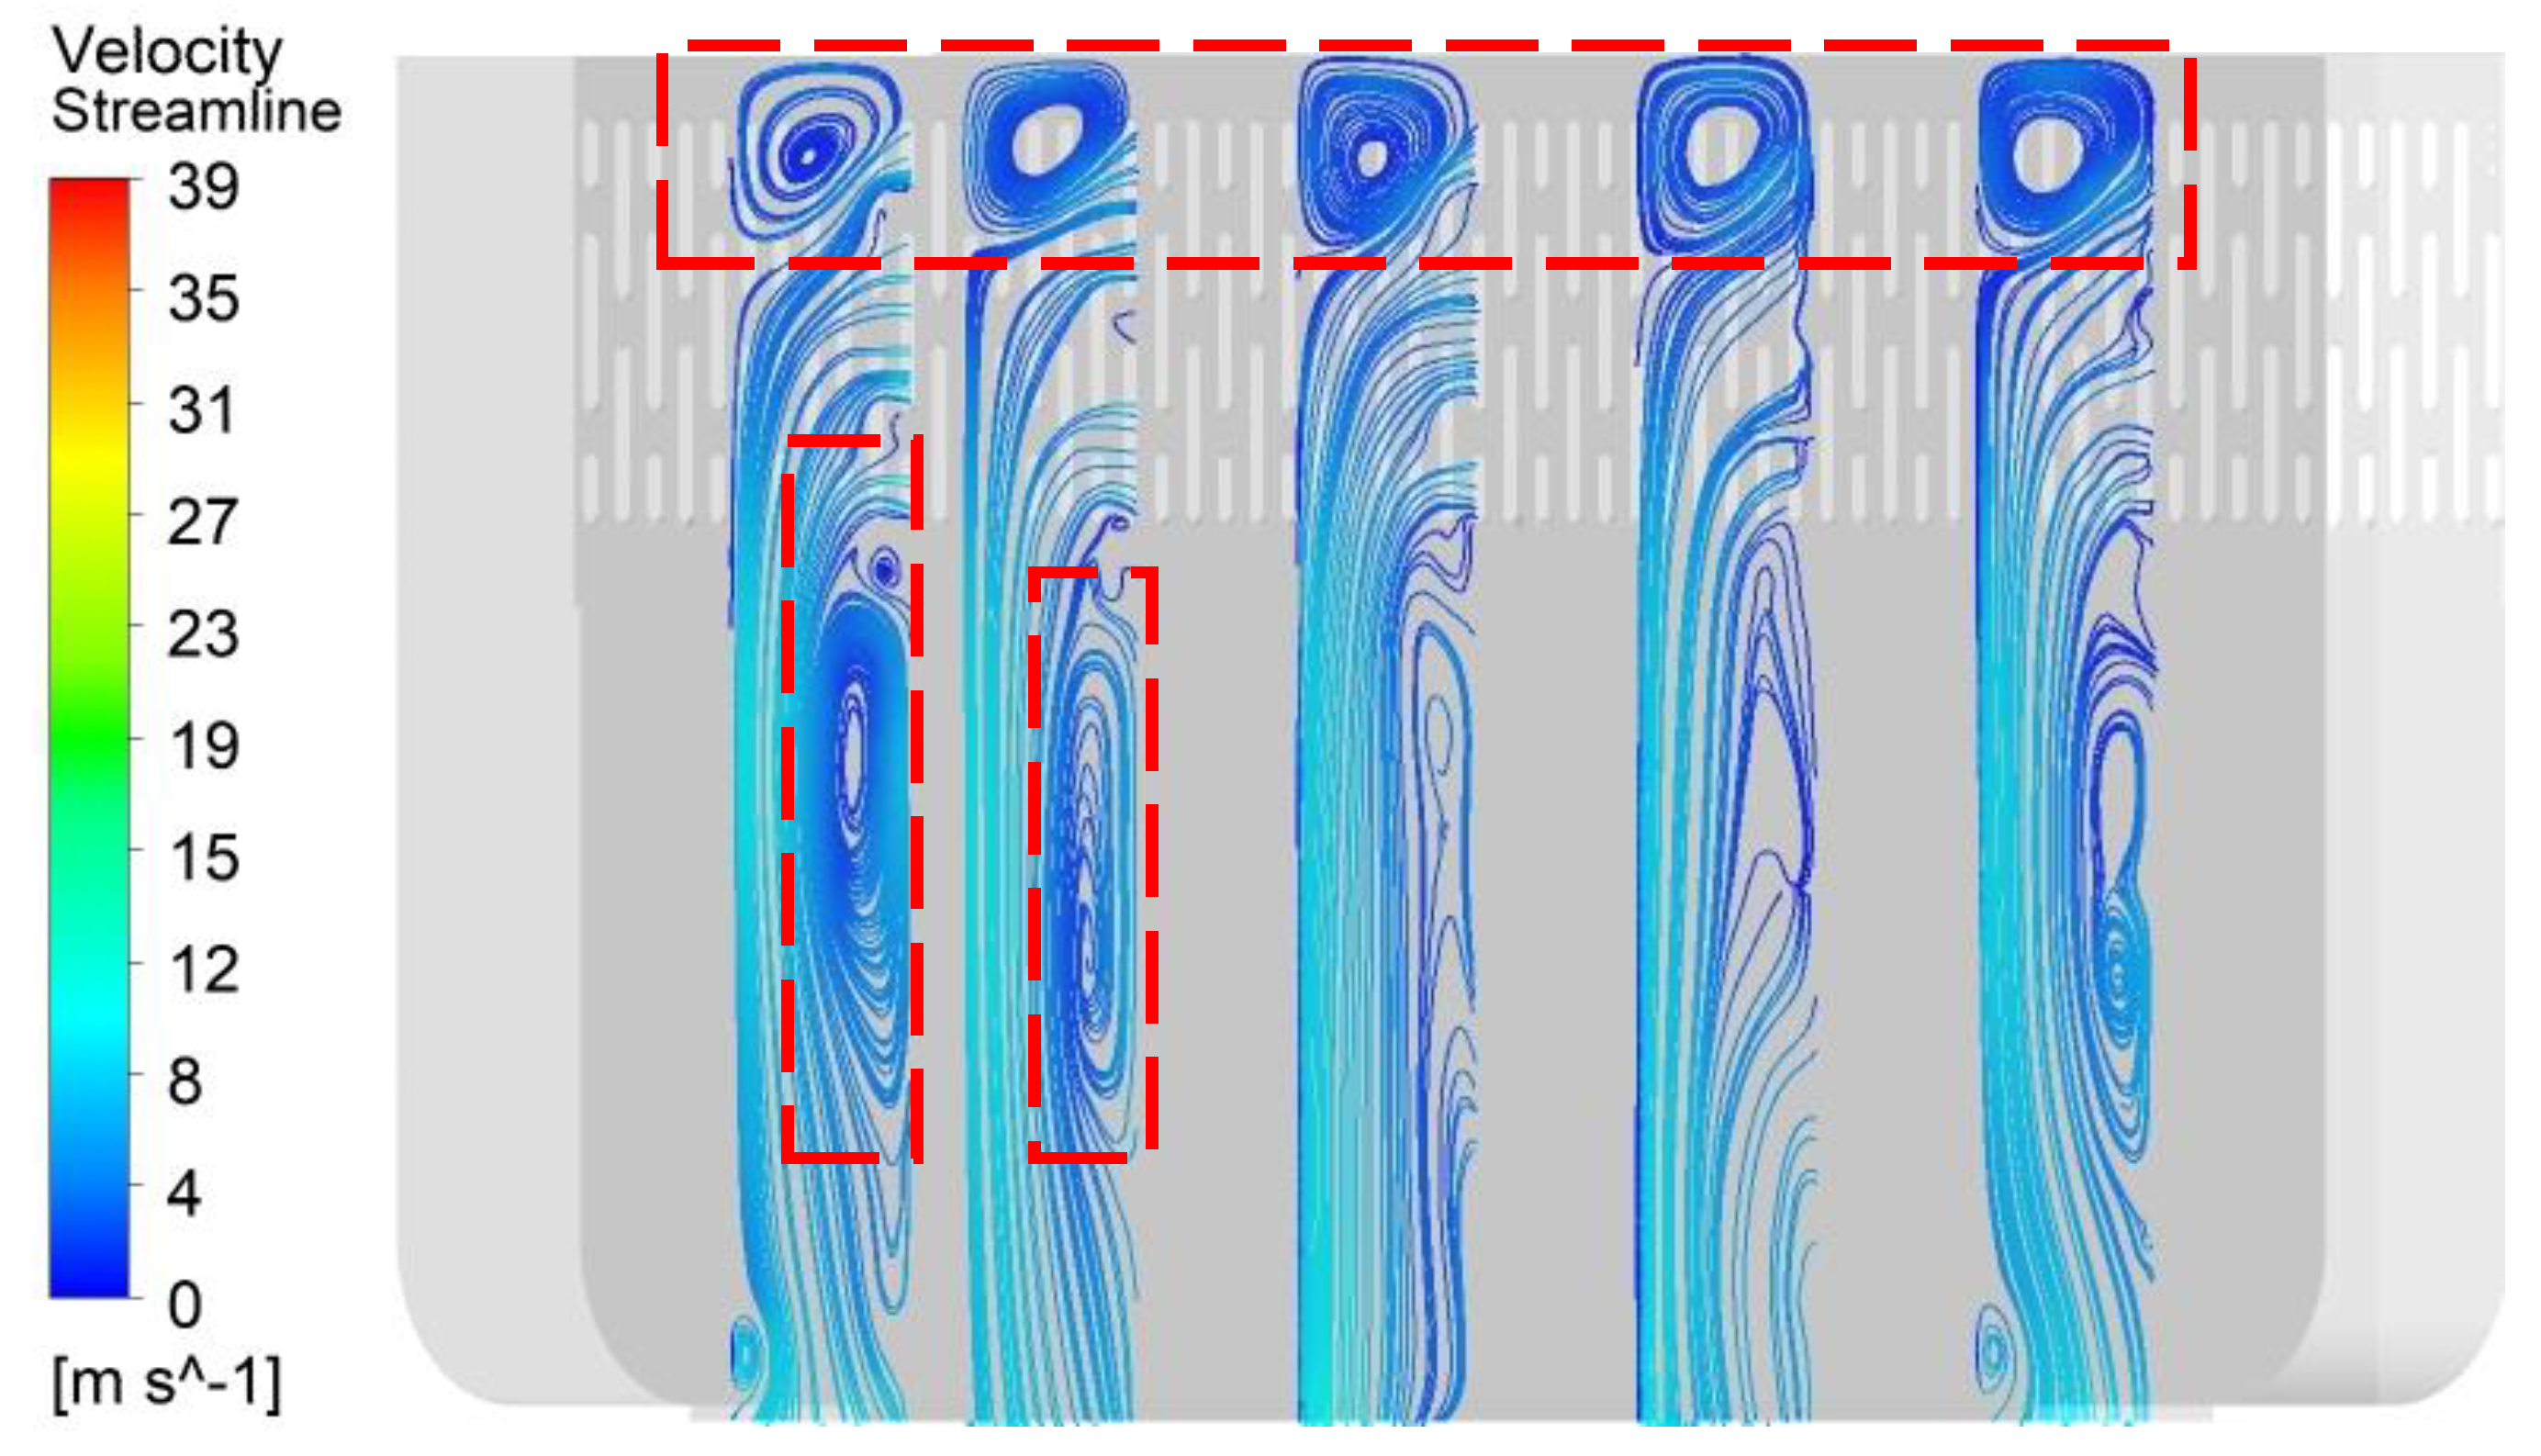
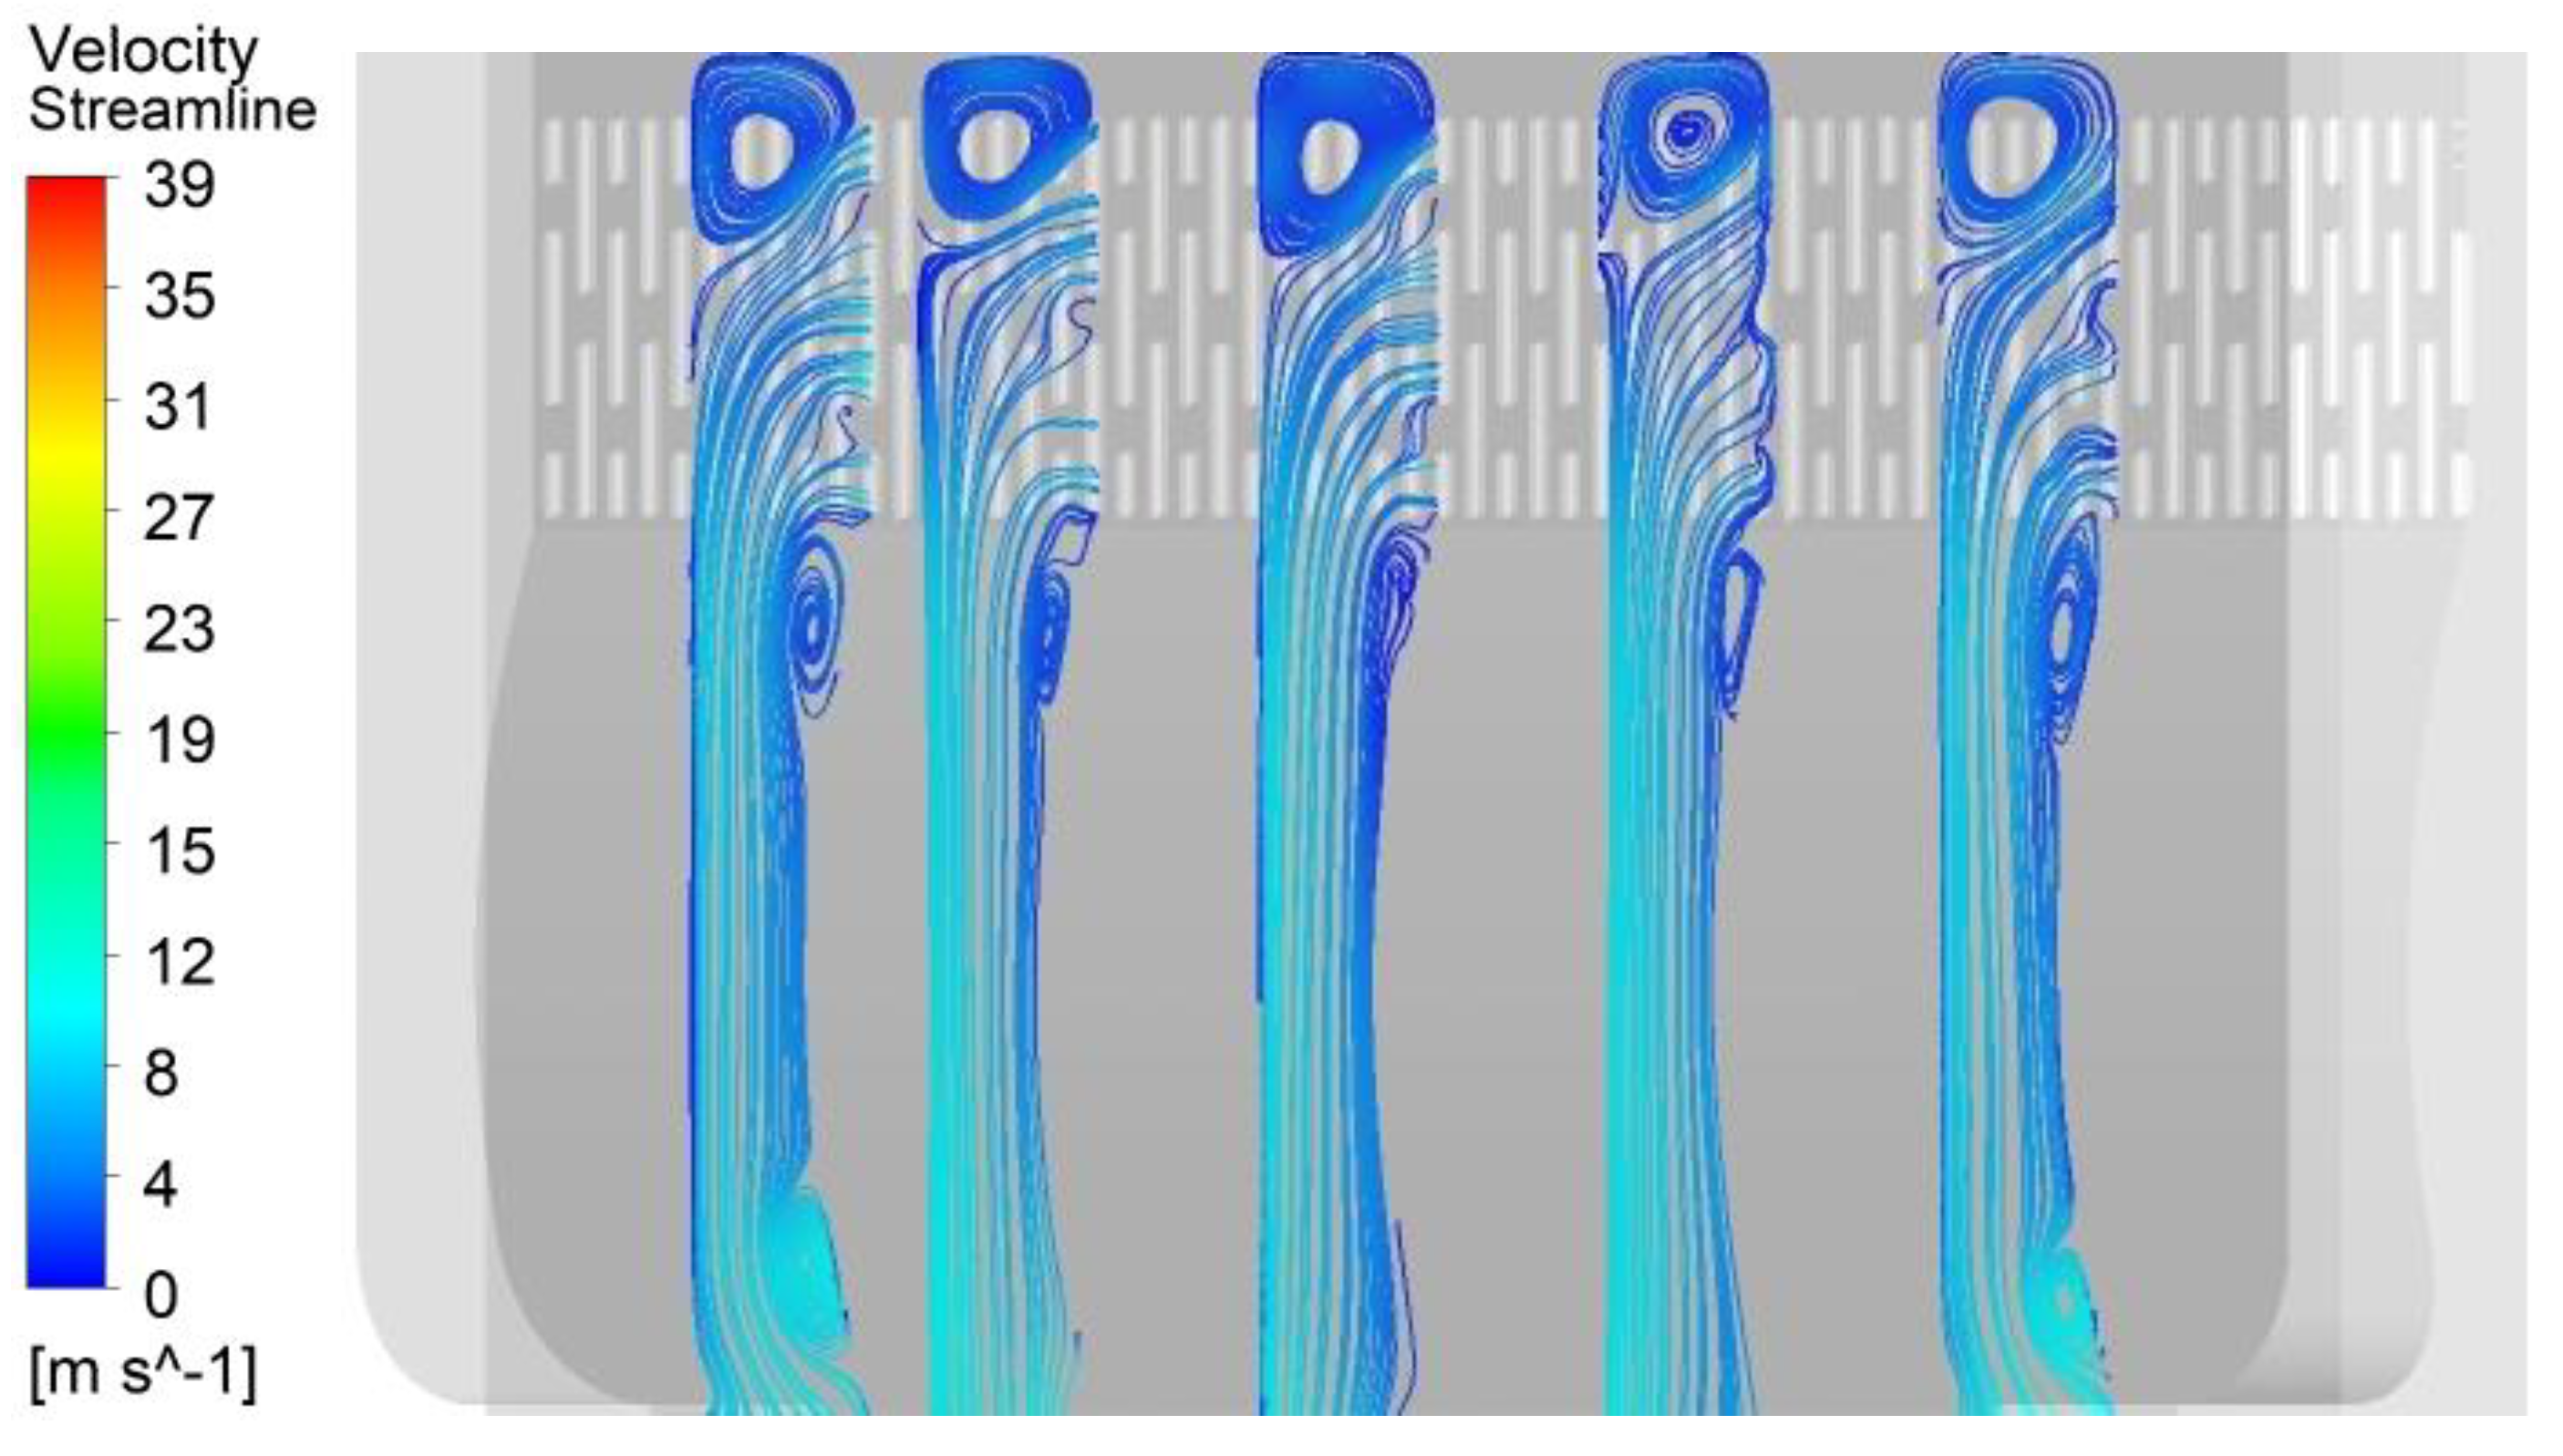
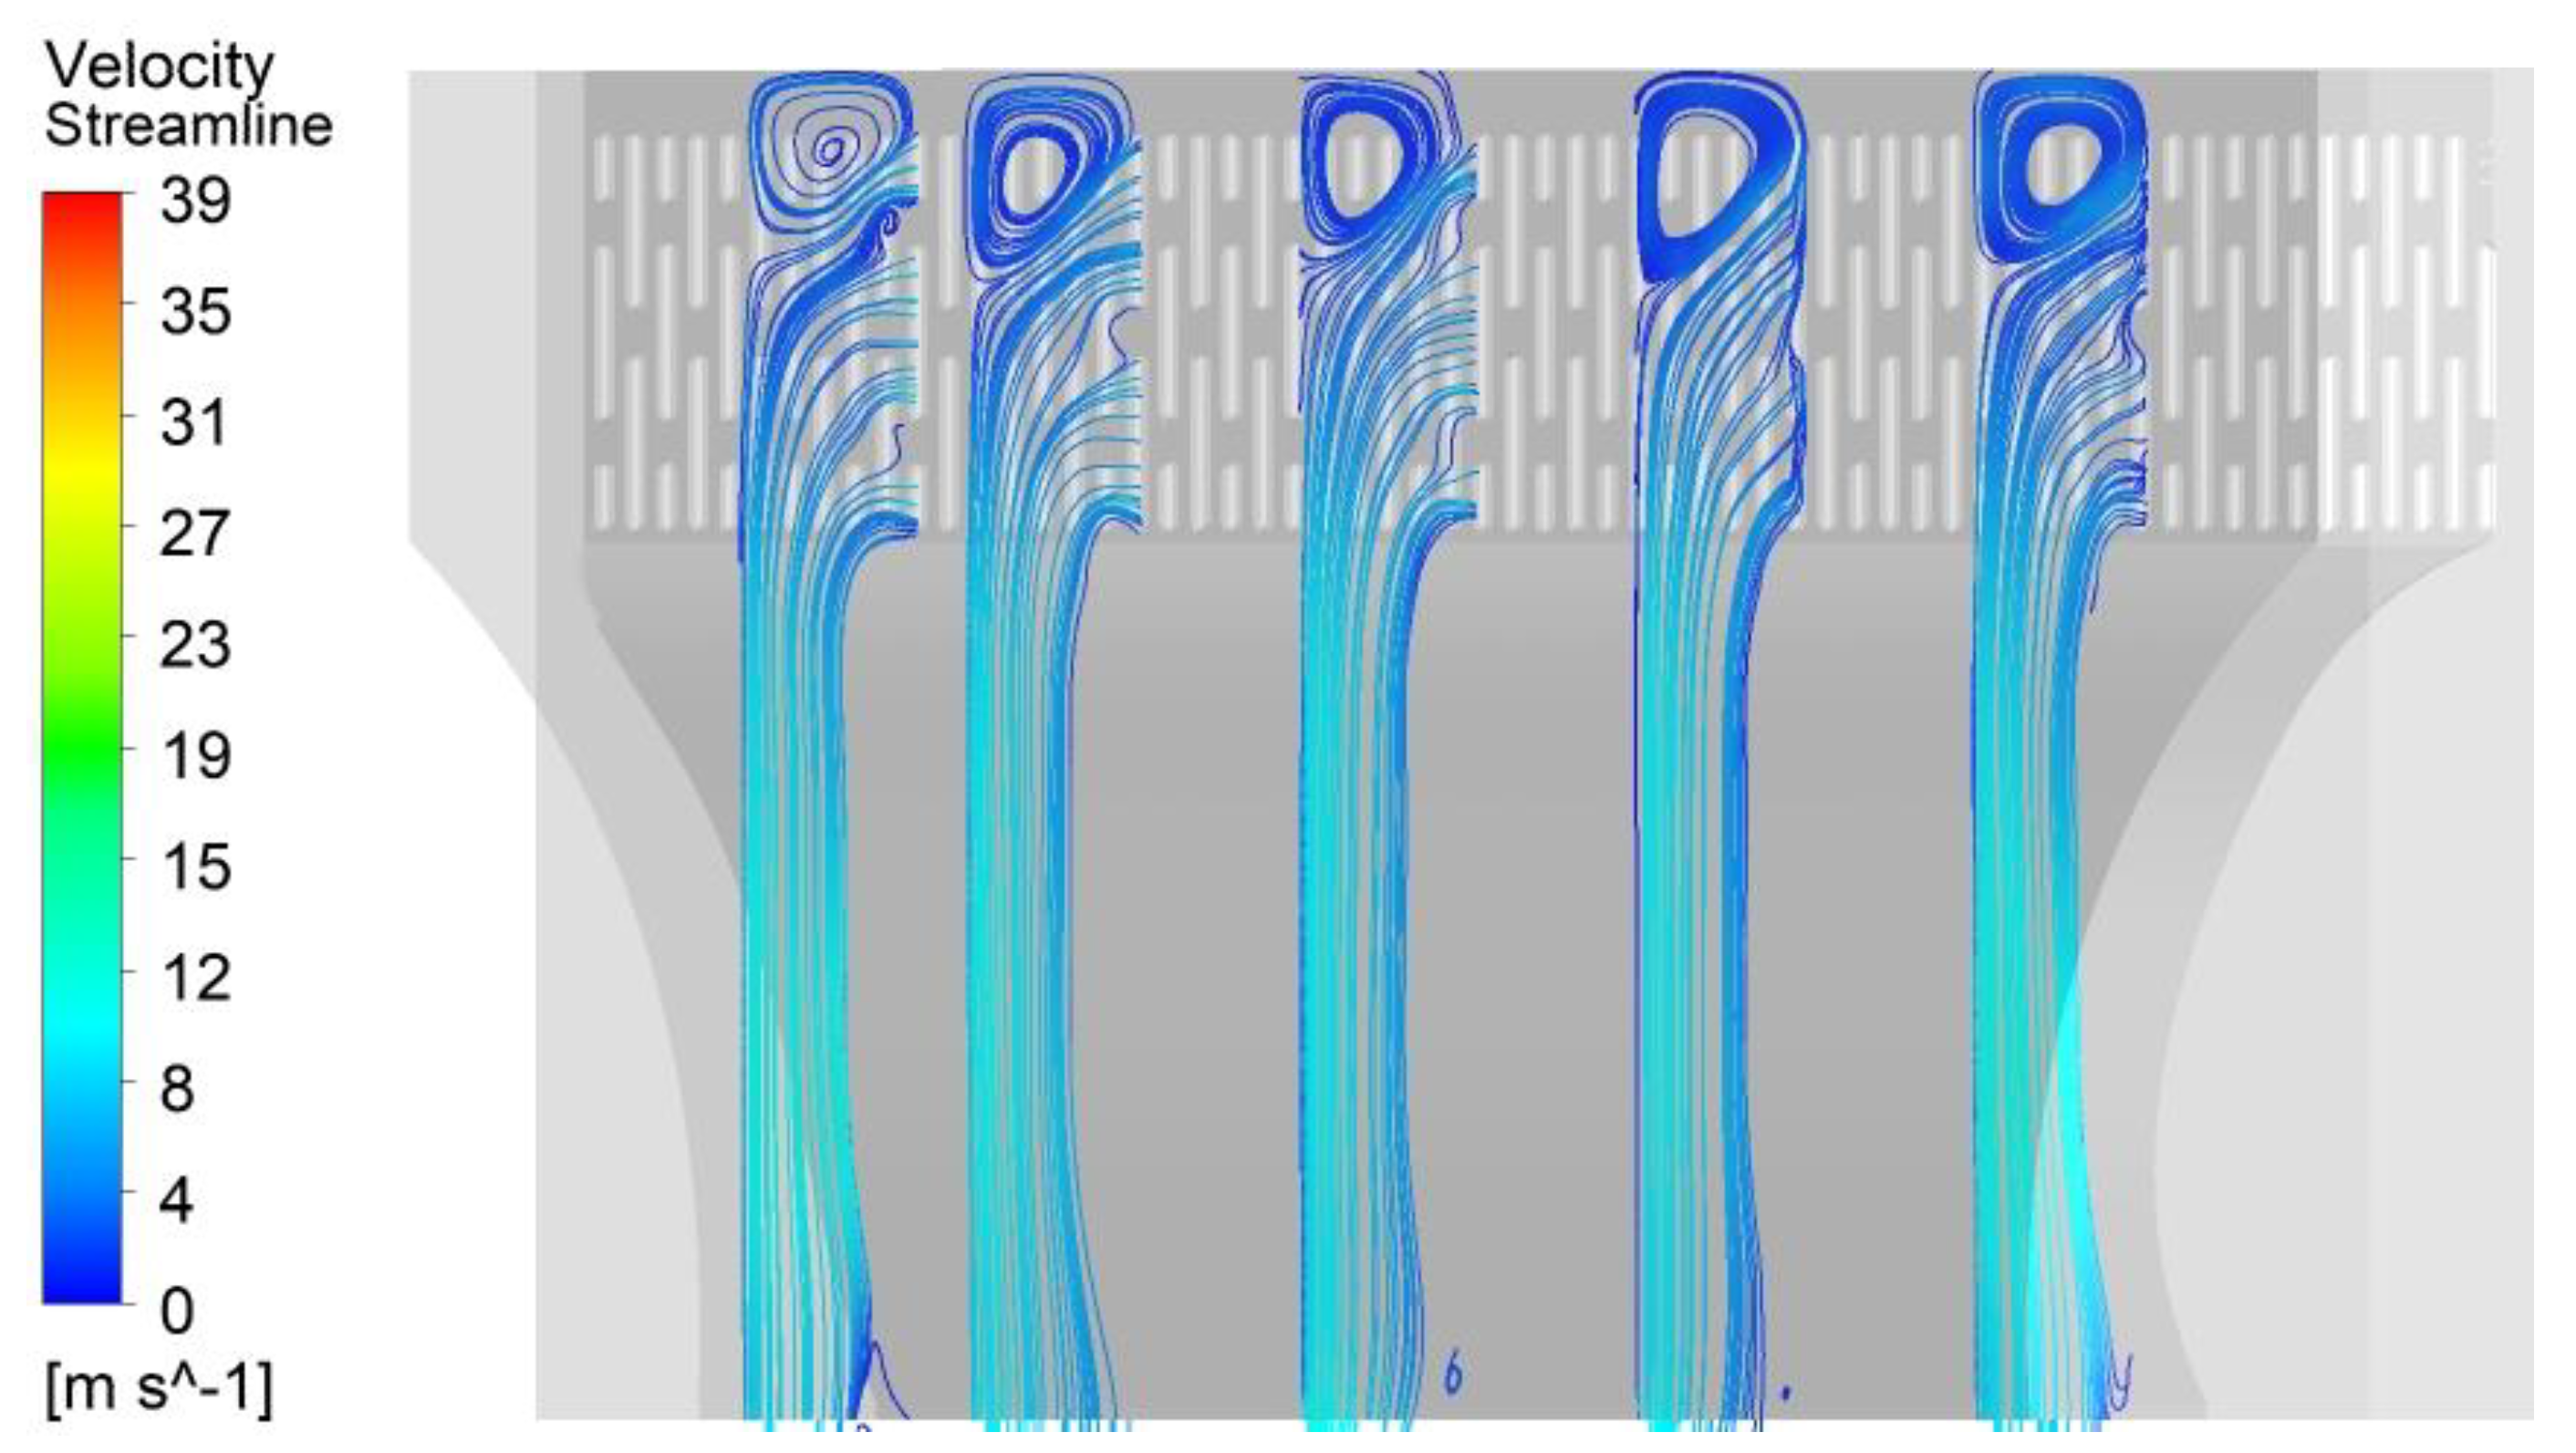
Soot flows through the head duct from the integrated stove grille’s inlet under the fan system’s action. The resistance of its duct piping is mainly concentrated at the inlet of the filter grille. As the oil smoke is absorbed into the head duct, the direction of the oil smoke movement undergoes a significant angle turn, and the process will cause a large fluid energy loss. By numerical simulation of the internal flow field characteristics of the head duct, the cross-sectional flow diagrams of the integrated cooker head duct in the X direction (X-250, X-150, X 0, X 150, and X 300) are shown in Figure 7. The overall flow line distribution in the head duct is uneven. When the airflow enters the interior of the head duct from the inlet grille, many vortices appear at the top of the head duct and near the wall of the front baffle side, among which the vortex flow field at the top of the head duct is weak. The vortex is one of the main reasons for noise generation in the head duct of the integrated cooker. The swirl area of the integrated stove head duct will block the duct pipeline and cause local resistance in the duct, resulting in the loss of airflow, thus reducing the smoke exhaust efficiency of the exhaust system.
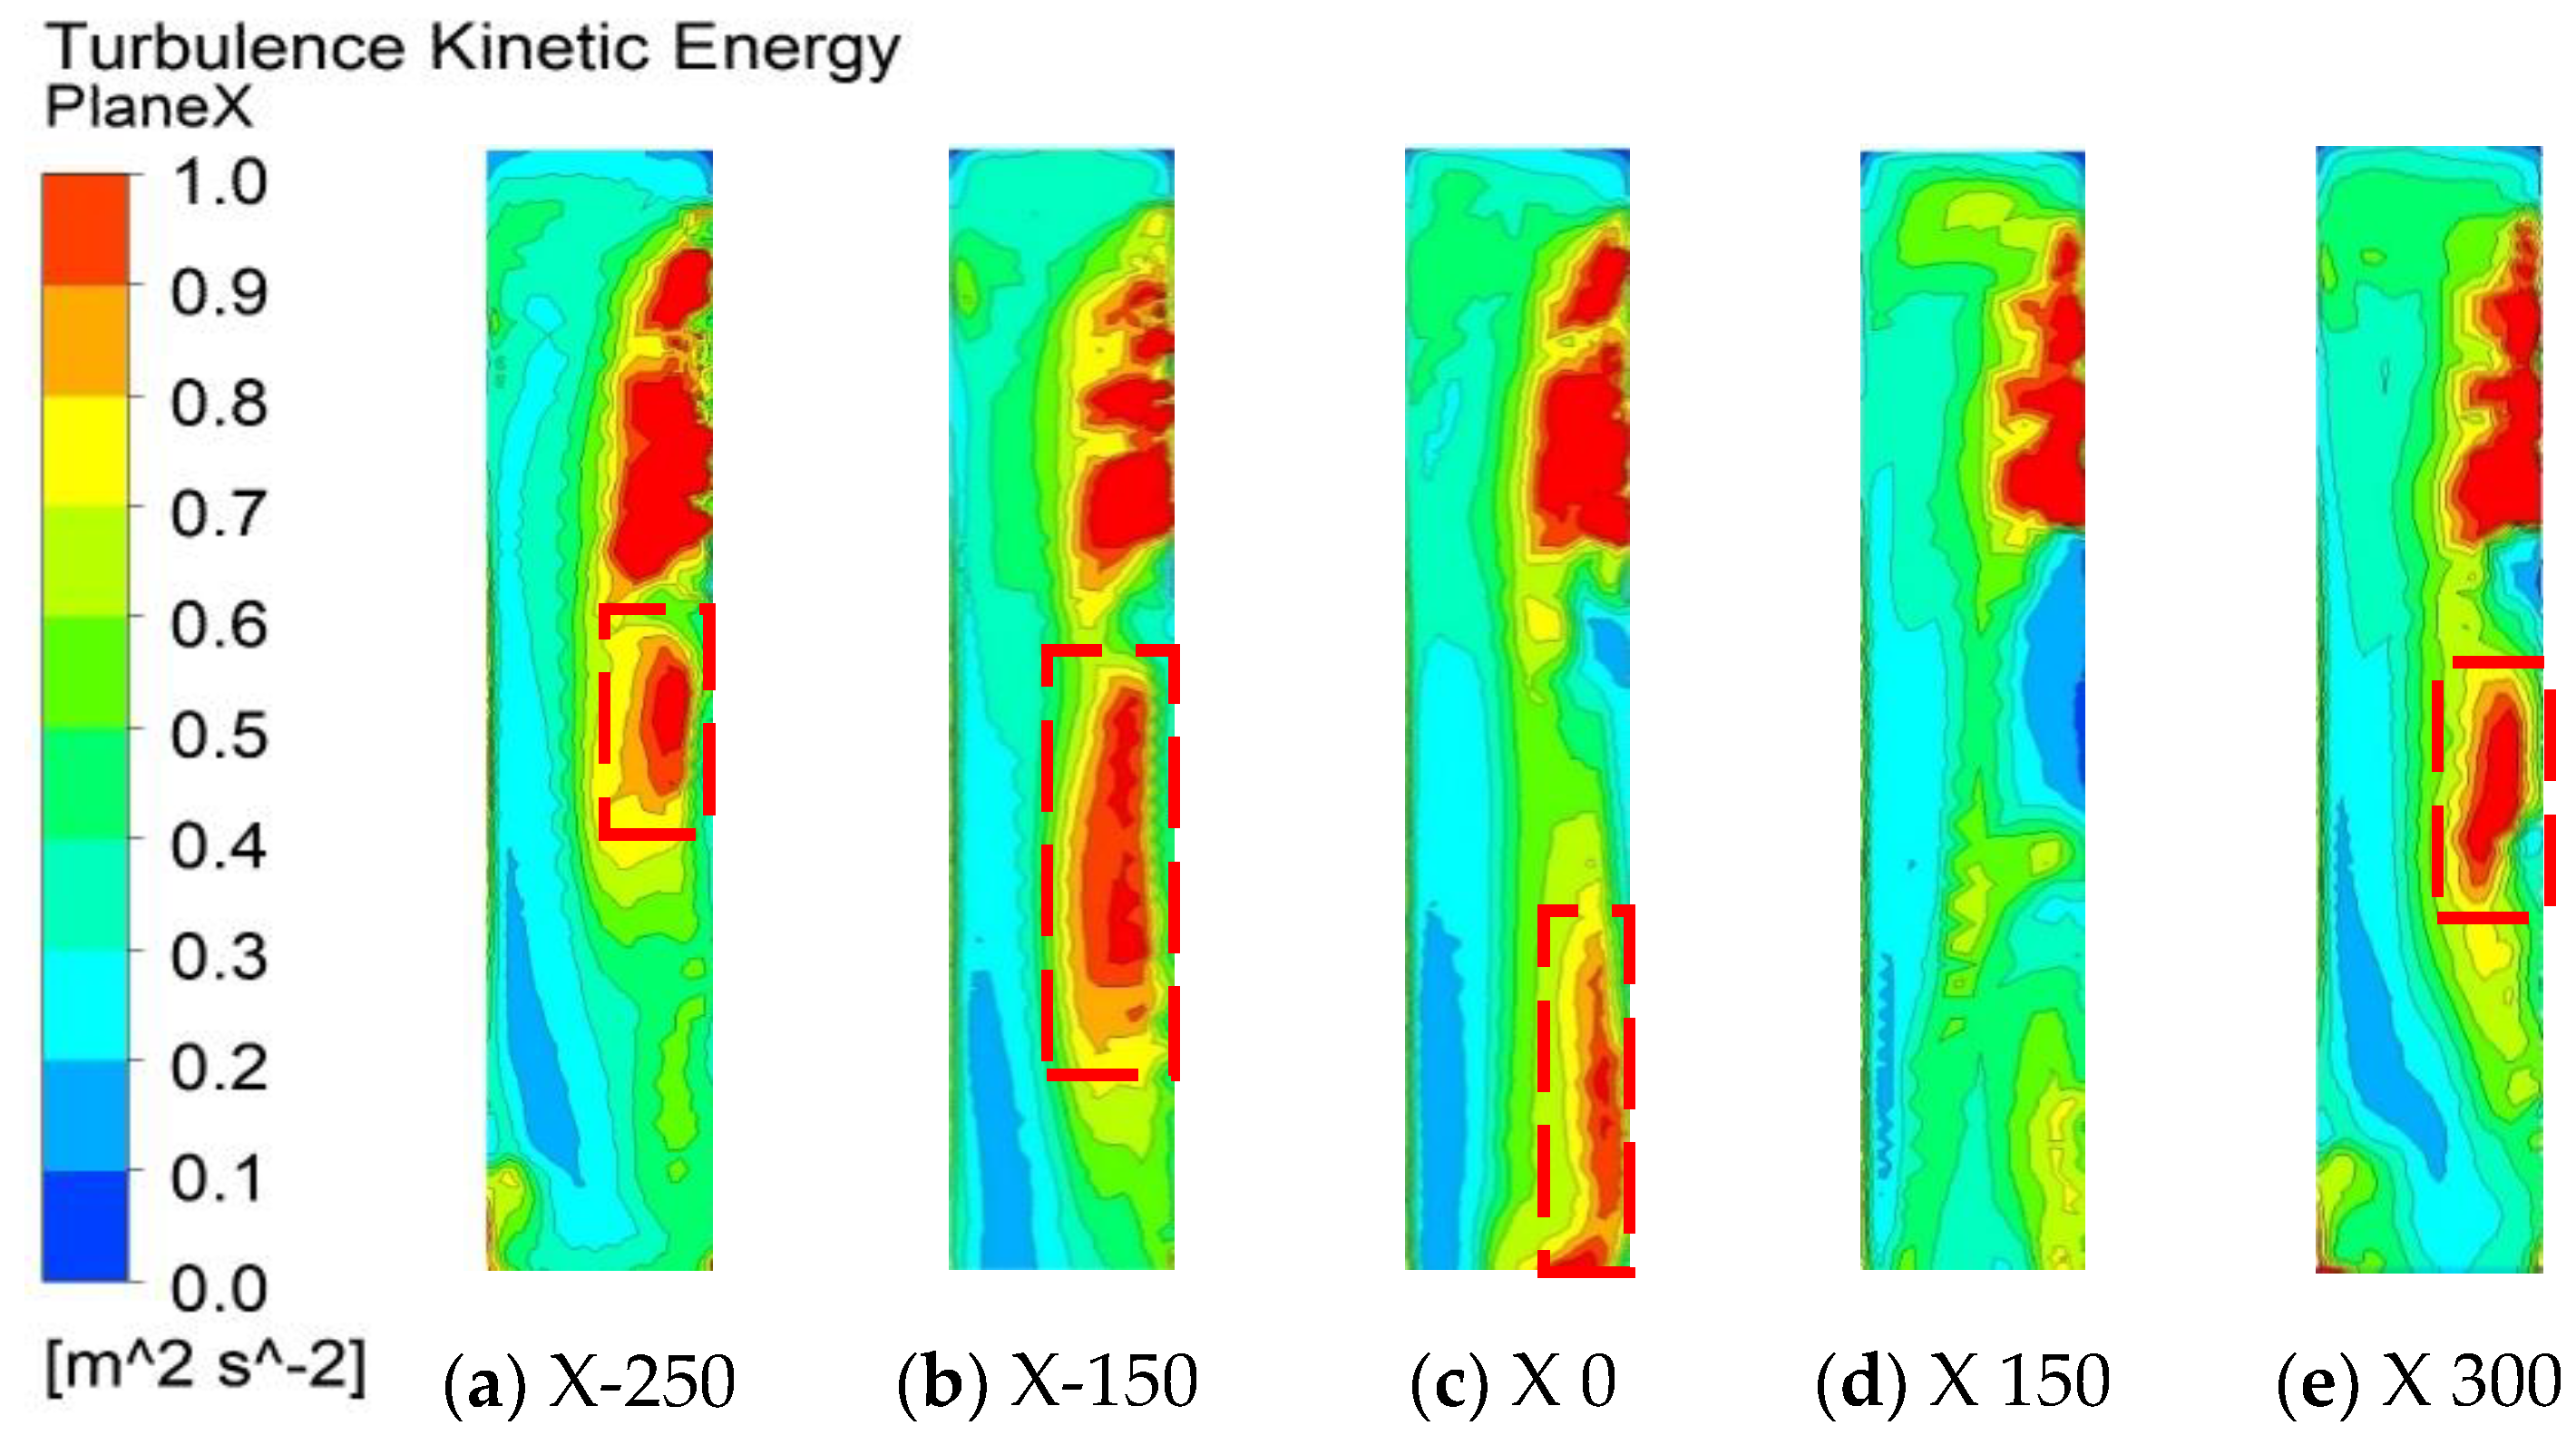
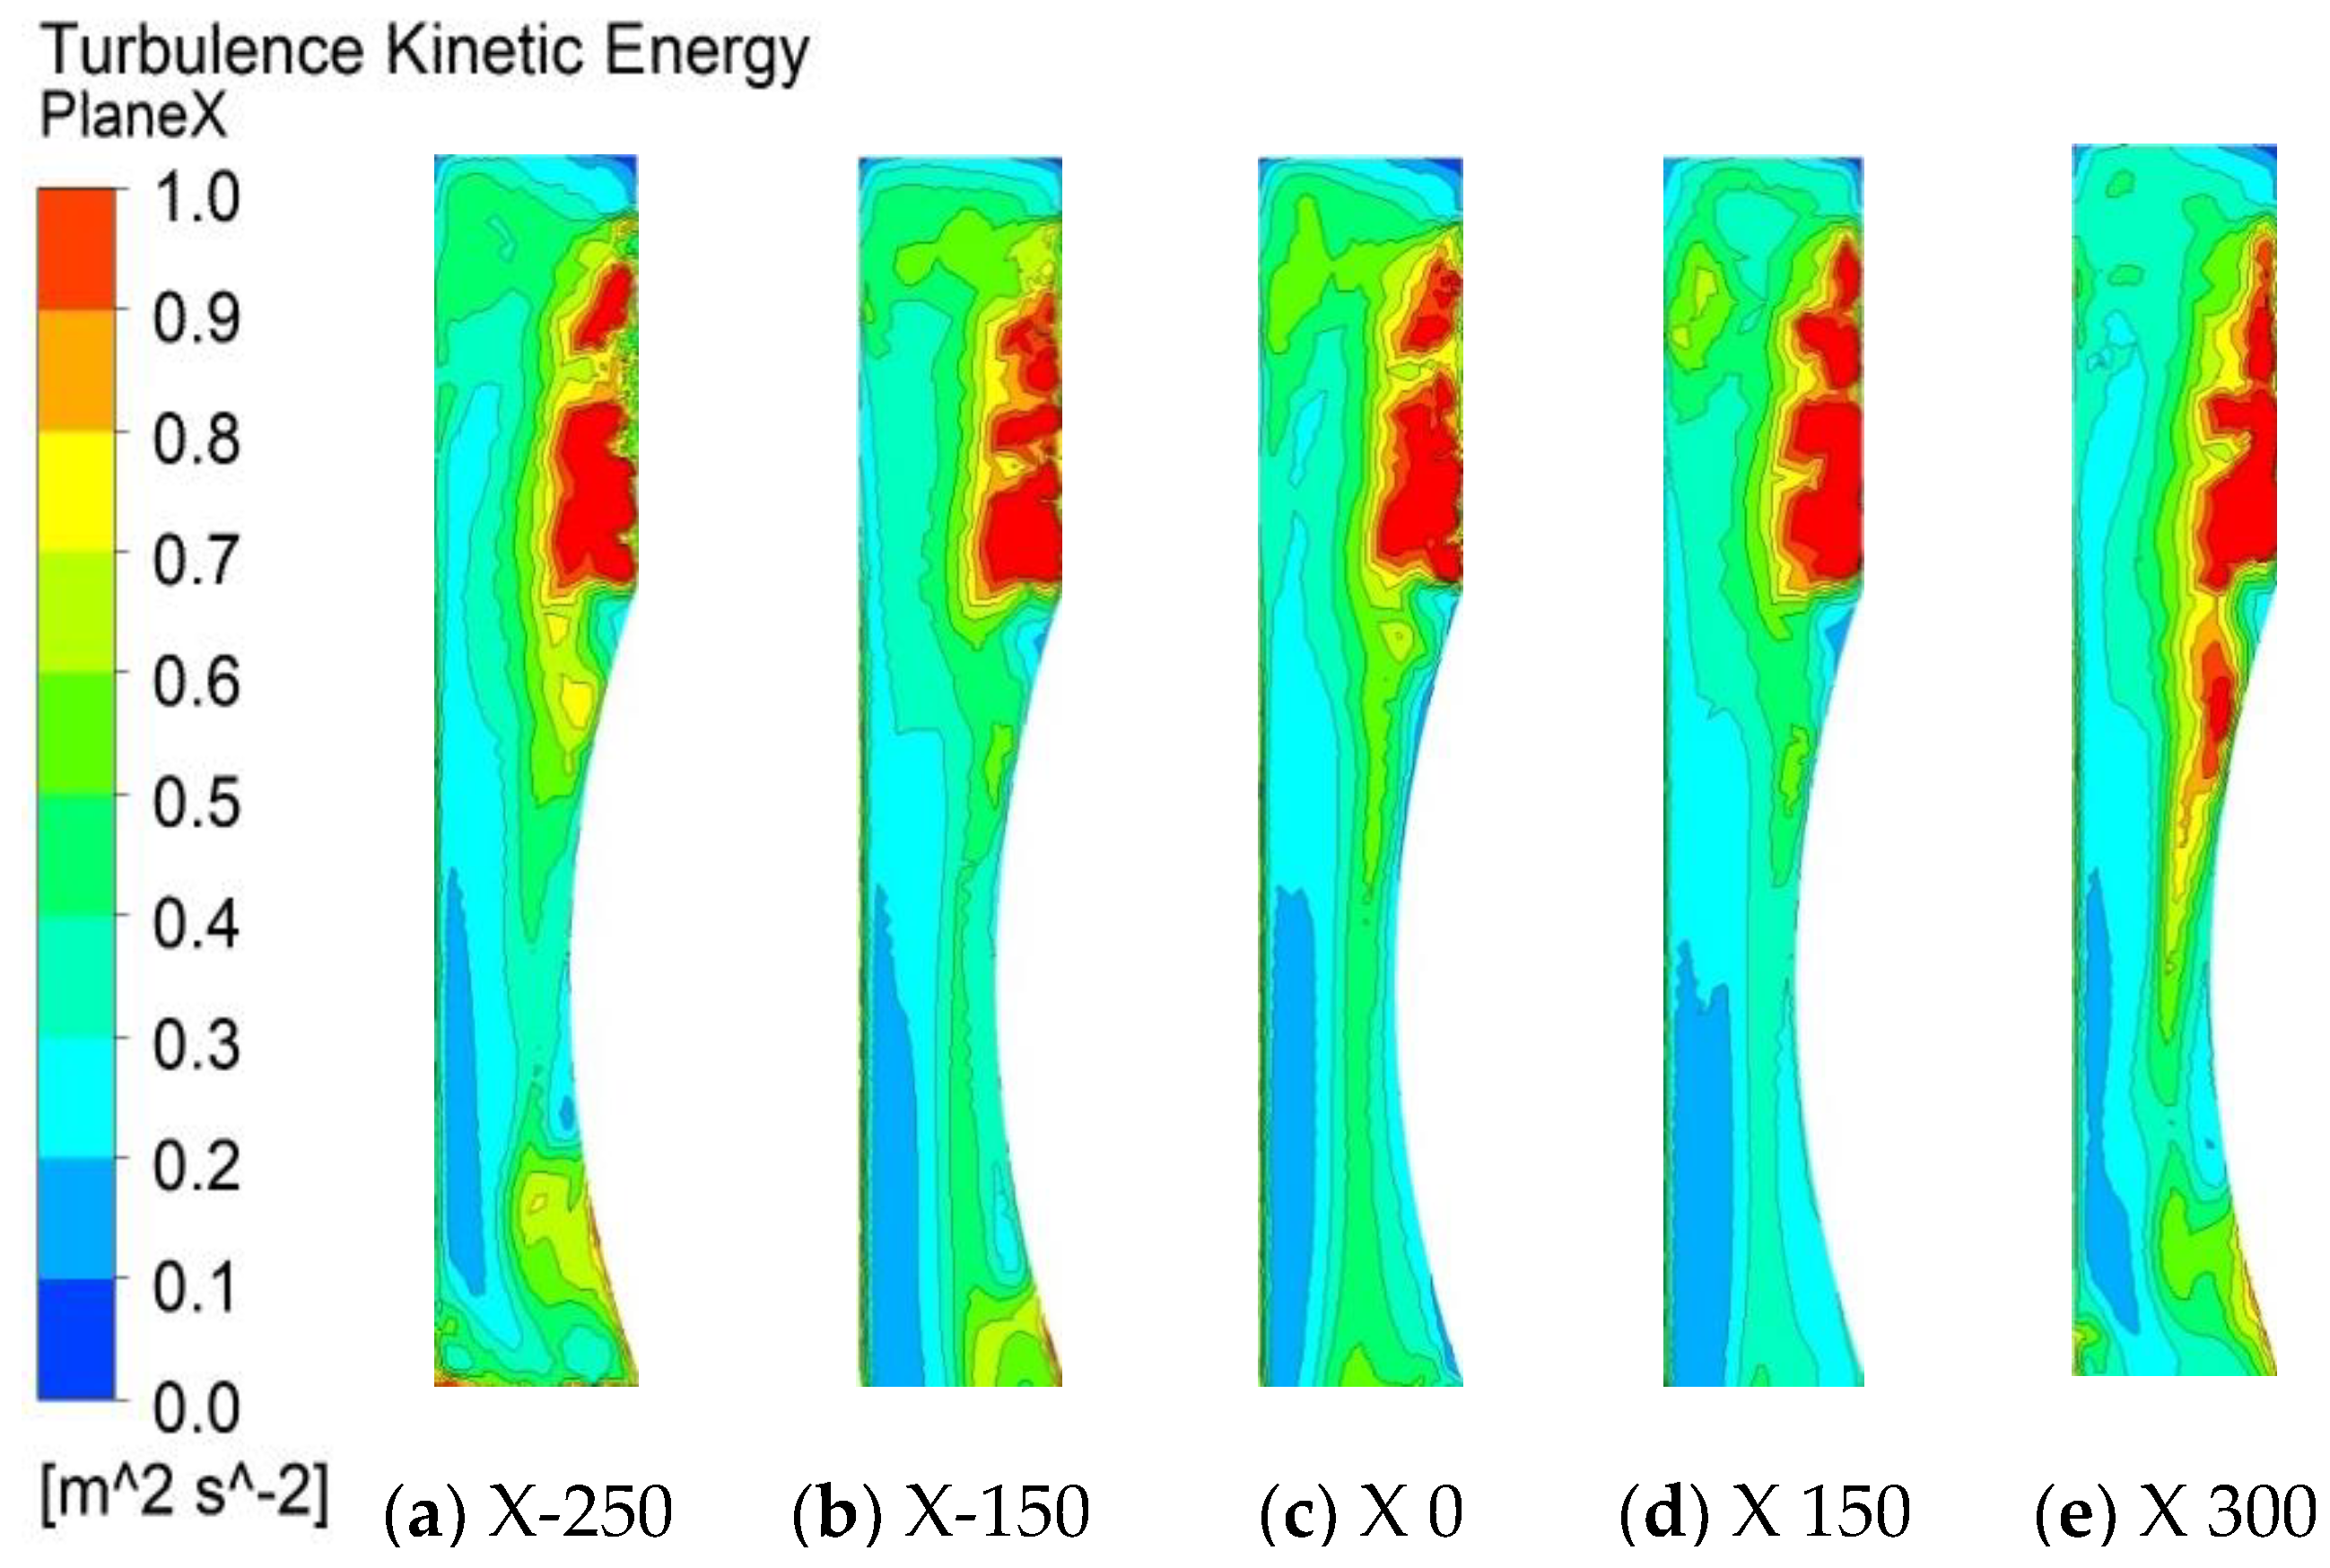
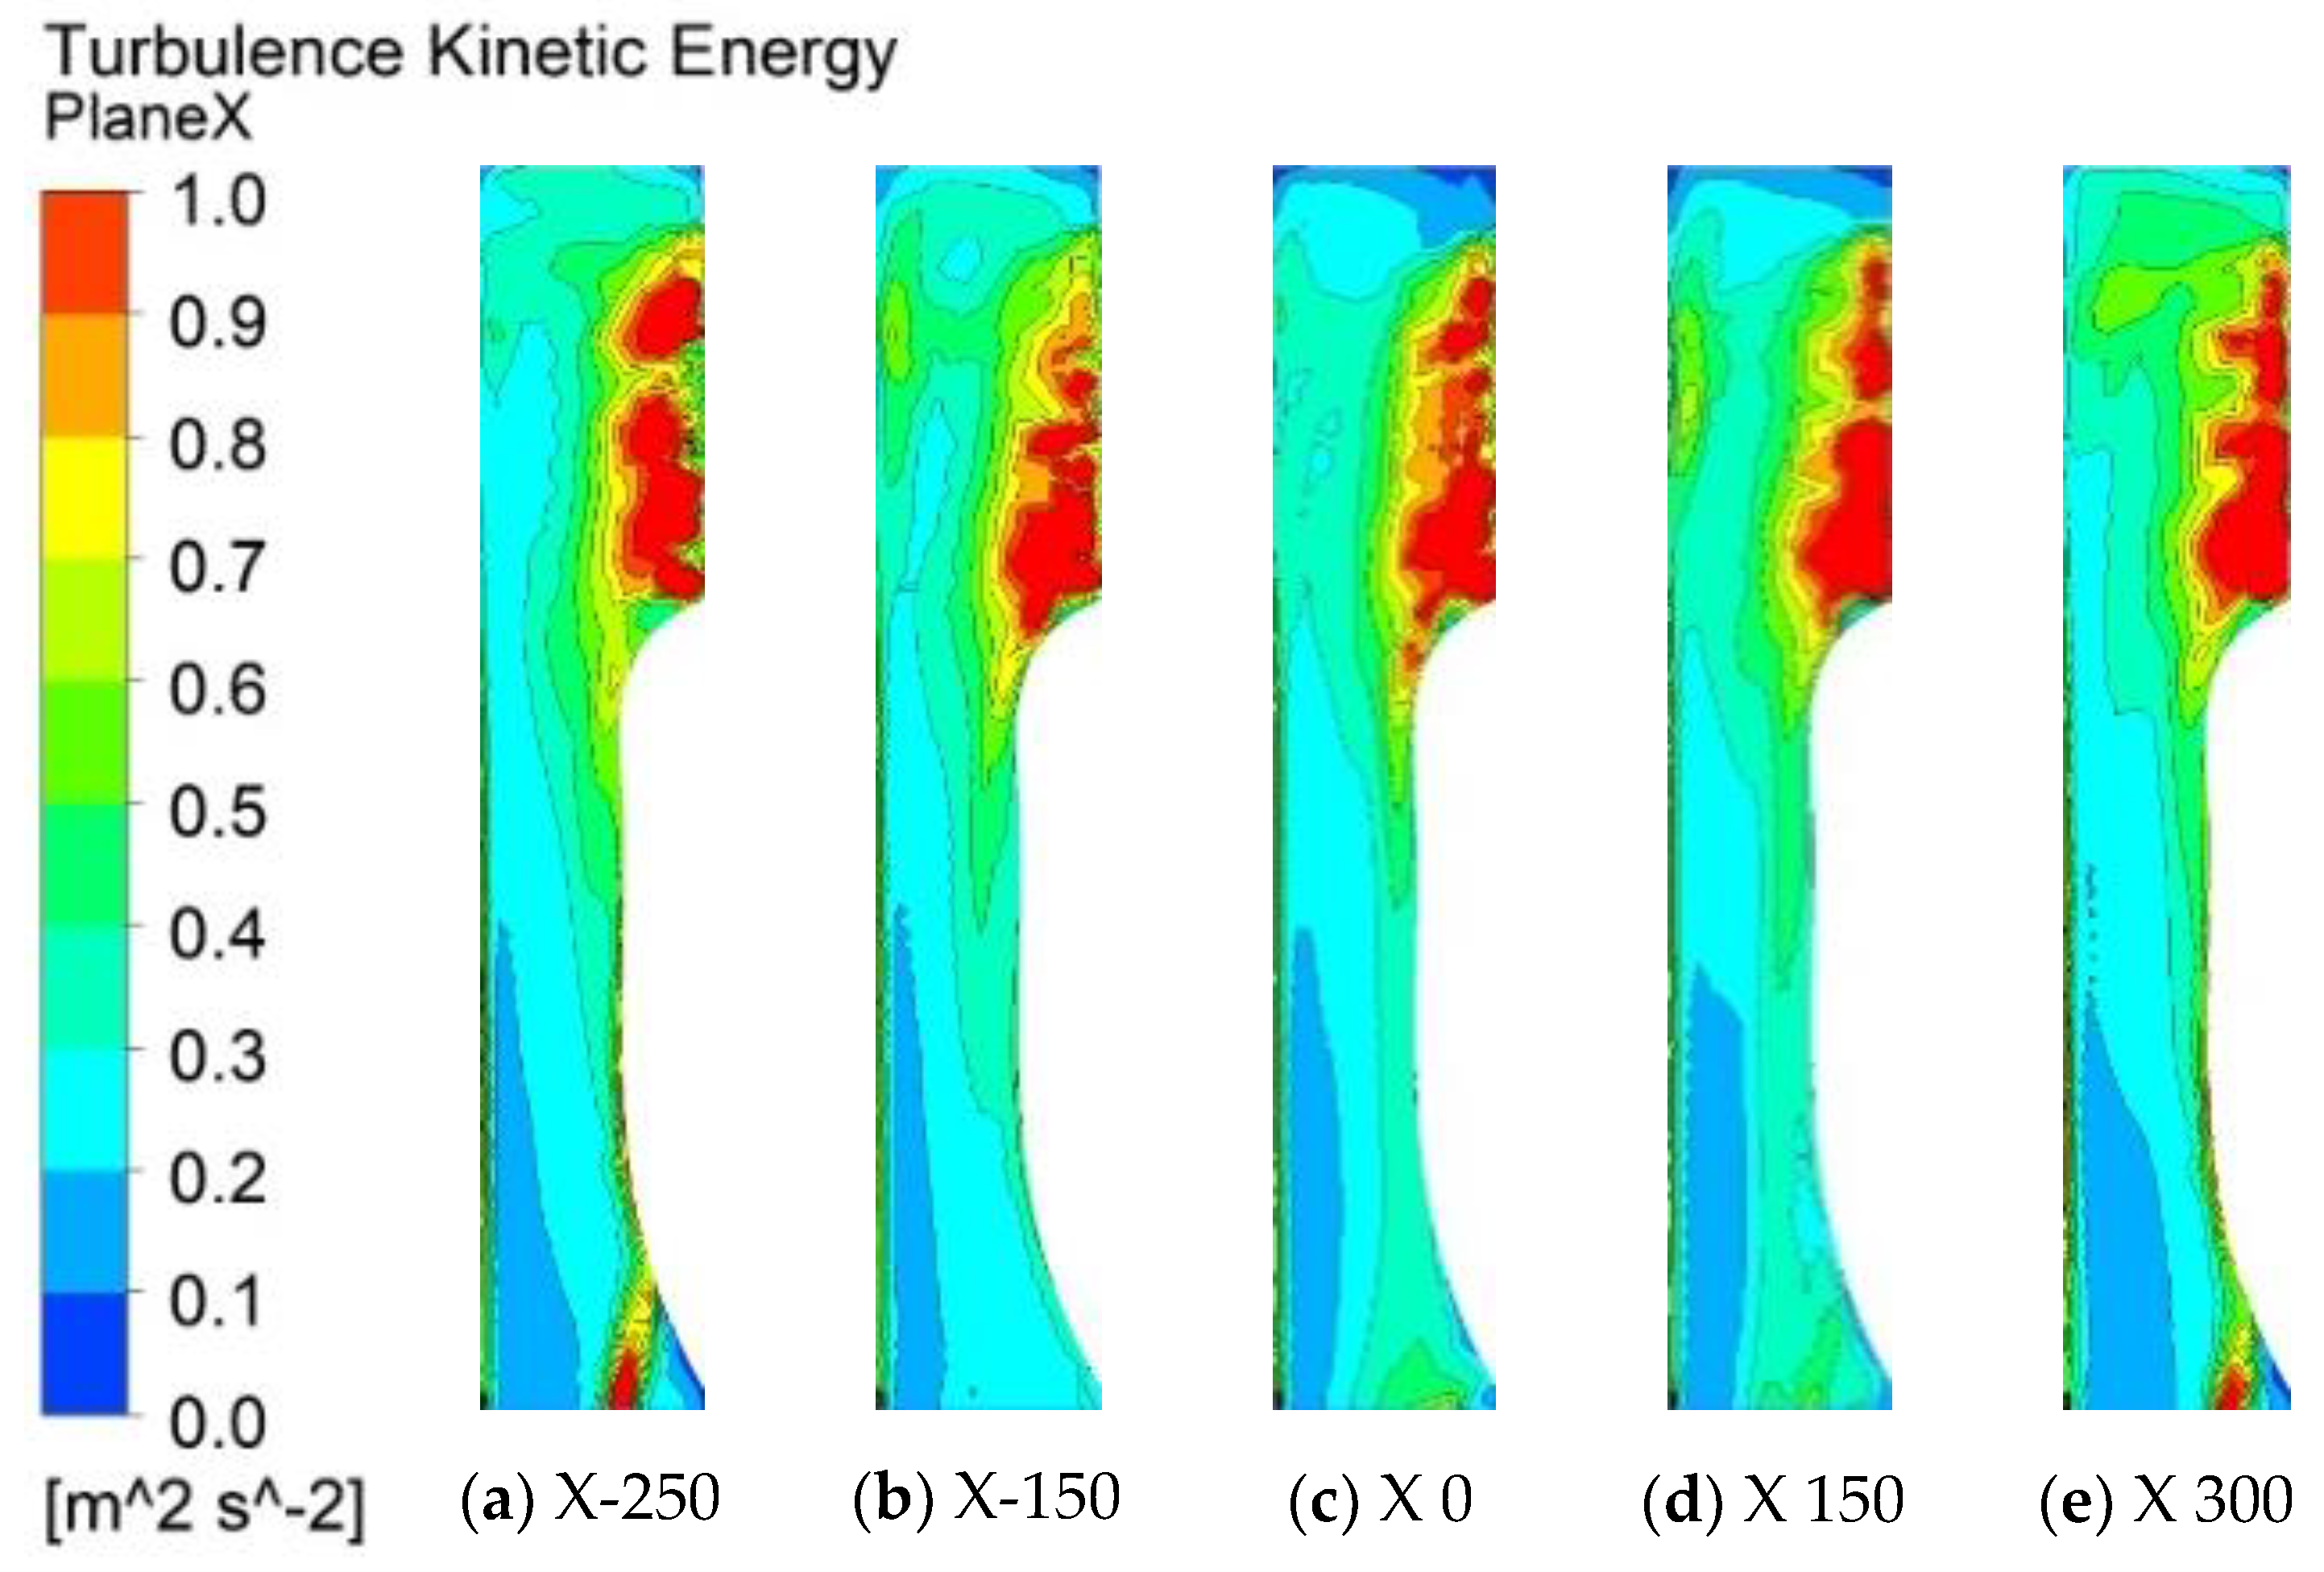
Figure 8 shows the turbulent kinetic energy clouds of different X-directional cross-sections in the head duct of the integrated cooker. The selected X-directional cross-sections are X-250, X-150, X 0, X 150, and X 300. It can be seen that when the airflow flows into the head duct from the inlet of the integrated cooker, a large number of highly turbulent kinetic energy areas appear at the near wall of the front baffle side, which corresponds to the vortex areas in the above figure. These high turbulent kinetic energy areas can lead to broadband noise in the system. However, the vortex region formed above the head duct in Figure 7 is not reflected in the turbulent energy cloud in Figure 8, so it is assumed that the vortex region has little effect on the noise. The subsequent numerical simulation and test will verify the conjecture.
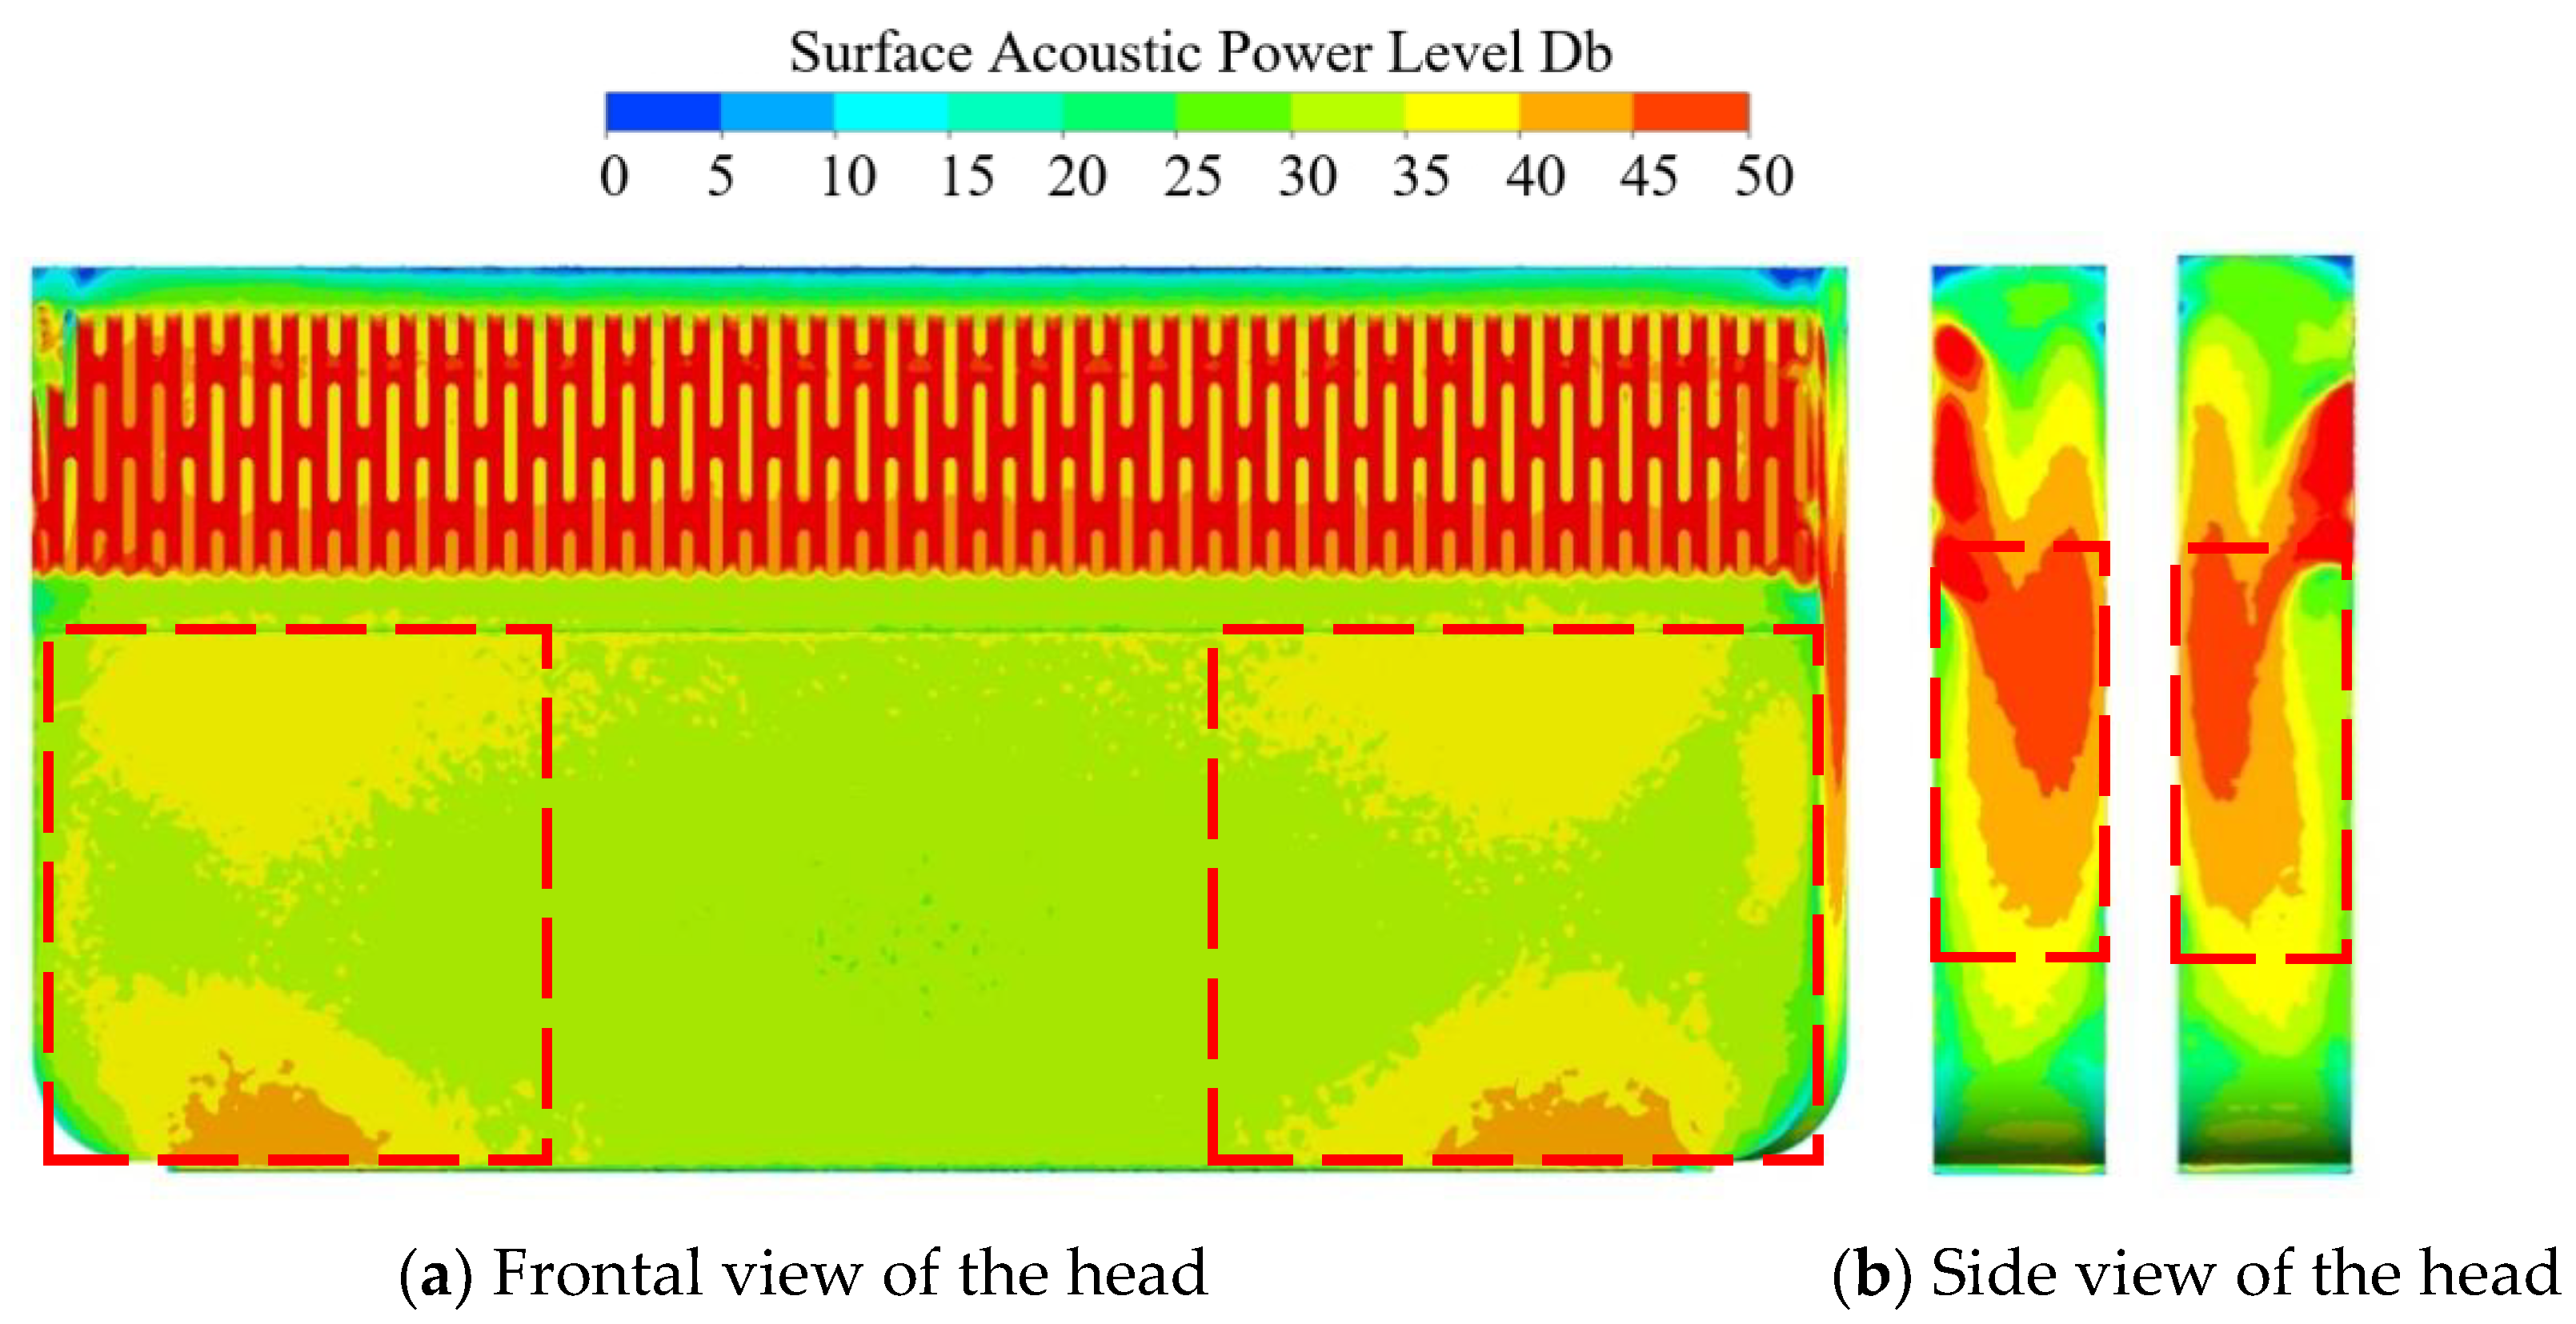
In order to investigate the main noise areas inside the head duct, based on the above validated numerical simulation method, the noise distribution information of the prototype head duct basin surface is extracted in this paper, as shown in Figure 9. From Figure 9a, it can be seen that the highest sound power level is presented at the air inlet grille of the head, which is in line with the realistic and unavoidable situation due to the impact of airflow; the near wall surface of the front baffle side also presents a higher sound power level, which is consistent with the analysis results in Figure 7 and Figure 8. From Figure 9b, it can be seen that the upper area of the head duct does not show high sound power level, which is consistent with the analysis results of Figure 8, indicating that the vortex is not the only necessary condition for noise generation in the duct system, but also to analyze its energy loss, and both sides of the head duct show high sound power areas. Therefore, the optimization of the integrated stove head duct will focus on the area near the wall at the front baffle side.

4.2. Head Air Duct Optimization Design

To address the defects of the head duct summarized above, this section optimizes the duct structure by adding guide vanes at the defective parts. The first is to optimize the design at the near wall of the front baffle side. The analysis of the numerical simulation results in Figure 7 and Figure 8 shows that there are a large number of the vortex and high turbulence kinetic energy areas at the near wall of the front baffle side of the head duct, which leads to obstructed airflow and increases broadband noise in the head duct.
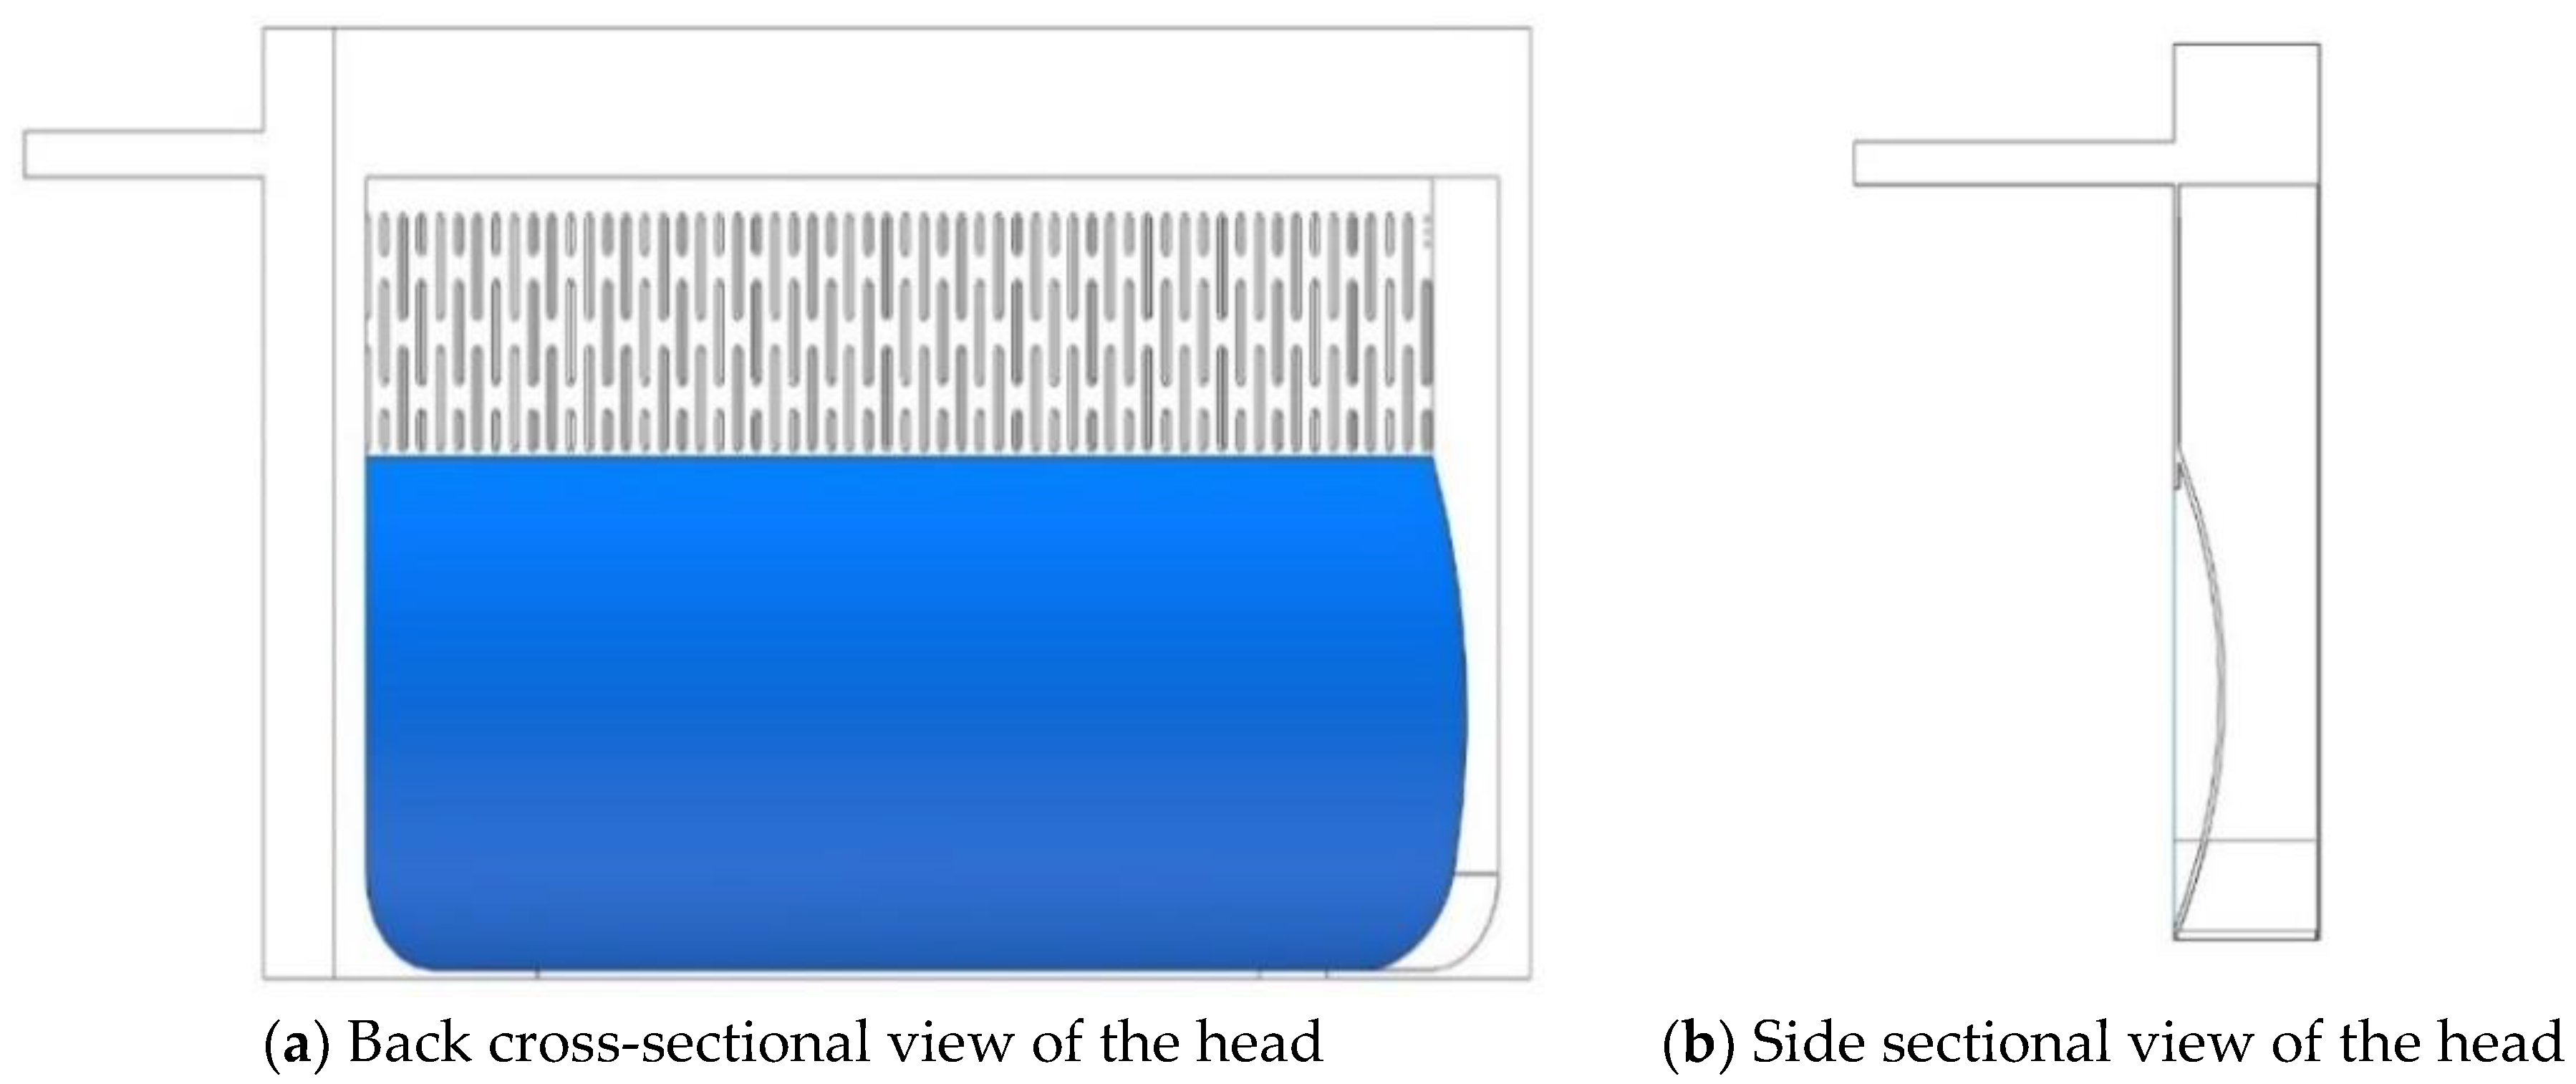
In order to solve the above problems, we introduce the front baffle side near the wall with an additional guide vane to optimize the airflow in the head duct and reduce the vortex energy. The duct guide vane is shown in the blue part of Figure 10.
The optimized head duct internal flow field characteristics were analyzed by the above numerical simulation method, and the optimized flow line diagrams (X-250, X-150, X 0, X 150, and X 300) on the X-directional cross section inside the head duct are shown in Figure 11. From the flow distribution in the figure, it can be seen that the overall uneven distribution of flow lines inside the head duct has been improved compared with Figure 7. The vortex area at the front baffle side near the wall is obviously reduced, a large number of low-energy separation areas disappear, vortex energy is obviously reduced, and the airflow condition inside the integrated stove head duct is significantly improved.
The turbulent energy clouds of X-directional cross-sections (X-250, X-150, X 0, X 150, and X 300) in the optimized head duct of the integrated cooker are shown in Figure 12. Compared with the turbulent energy clouds in Figure 8, it can be found that the highly rugged energy area near the wall on the front baffle side is dissipated mainly after the additional guide vanes are installed, which improves the noise reduction performance of the integrated hob head duct.
The above optimization scheme is only a simple design of the guide vane in the head duct. Through numerical simulation and testing, it can be seen that the guide vane profile significantly influences the outlet air volume and the overall noise of the integrated cooker. Therefore, optimizing the guide vane’s design to achieve the best overall performance of the integrated cooker is especially important.

4.3. Parametric Design of Guide Vane

There is often a reciprocal relationship between the air volume at the outlet of the integrated stove and the noise of the whole machine. Usually, the noise of the integrated cooker whole machine will rise with the increase of its outlet air volume, so in the optimized design, the duct system’s aerodynamic performance is first improved. Then the noise reduction optimization is carried out. The expected effect usually cannot be achieved. In this paper, the multiobjective optimization design of the guide vane profile will be carried out based on the prototype head duct, so the influence of the structural parameters of the guide vane on the air volume and noise needs to be analyzed when selecting the corresponding optimization variables. The B-spline representation method [16] is used to design the guide vane profile parametrically, and the range of design variables is limited. The optimal Latin hypercube test method is used to obtain the sample space of different design variables. The machine’s corresponding outlet air volume and noise are numerically simulated and calculated. The Kriging approximation model of the head duct of the integrated cooker is constructed with the calculated data. Finally, the IMOCS algorithm finds the optimal design variables to obtain the optimal guide vane profile parameters.
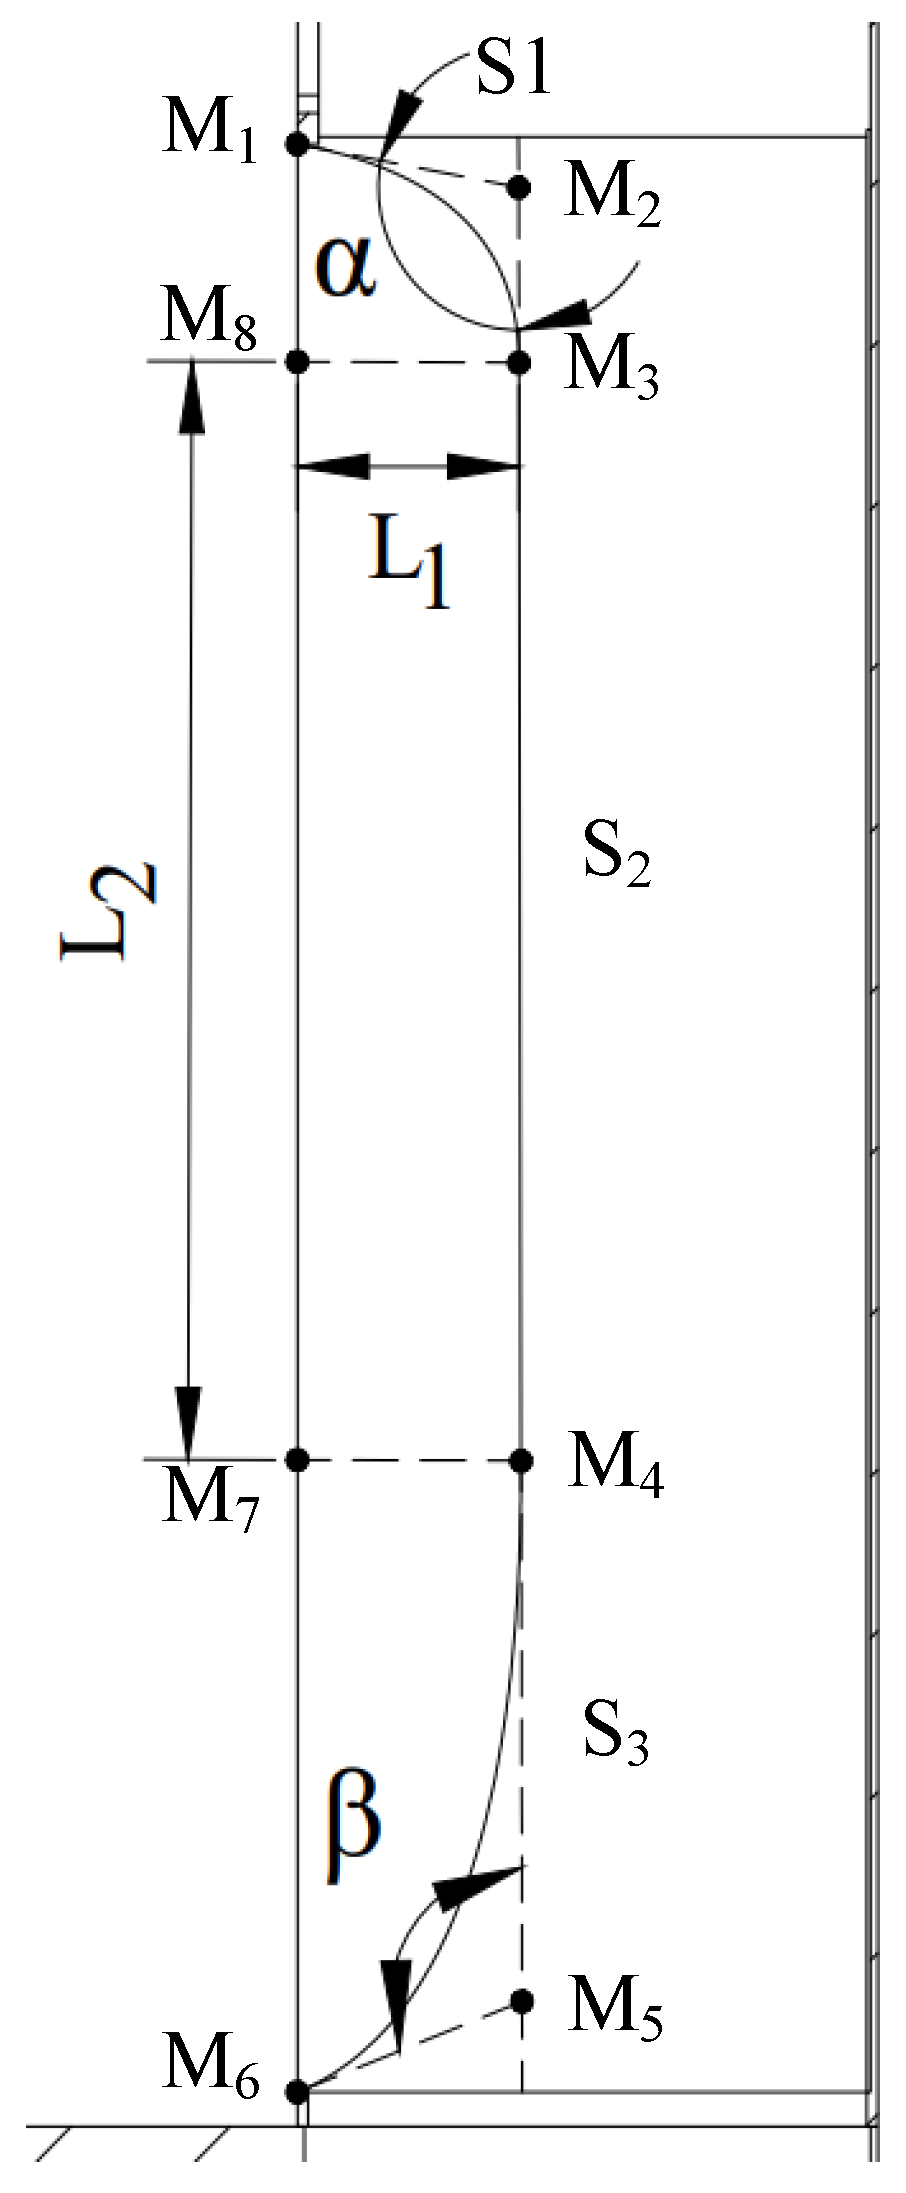
The parameterized schematic diagram of the guide lobe profile is shown in Figure 13. The side of the rear suction channel of the integrated cooker head is divided into areas, and several control points are set to control the profile of the guide lobe. The guide lobe profile is divided into S1, S2, and S3, where S1 is the profile shape of the guide lobe at the inlet of the head duct, S2 is the profile shape of the middle section of the head duct, and S3 is the profile shape at the outlet of the head duct. The shape of S2 is a vertical straight line, and its position is controlled by the depth L1 of the cavity formed by the guide lobe and the front baffle, and the length L2 of the air direct current in the head duct controls its length. The parameterized guide lobe has fixed endpoints M1 and M6, and the ray from point M1 is made to intersect with the S2 extension line at point M2. The ray from point M6 is made to intersect with the S2 extension line at point M5, and M1, M2, and M3 are set as control points to establish B-sample curve S1. Then M4, M5, and M6 are set as control points to establish the B-sample curve S3. Finally, the specific size of line segment S2 can be determined, and the specific size and position of line S2 can be determined. These three B-line segments can express the overall characteristics of the guide leaf profile.
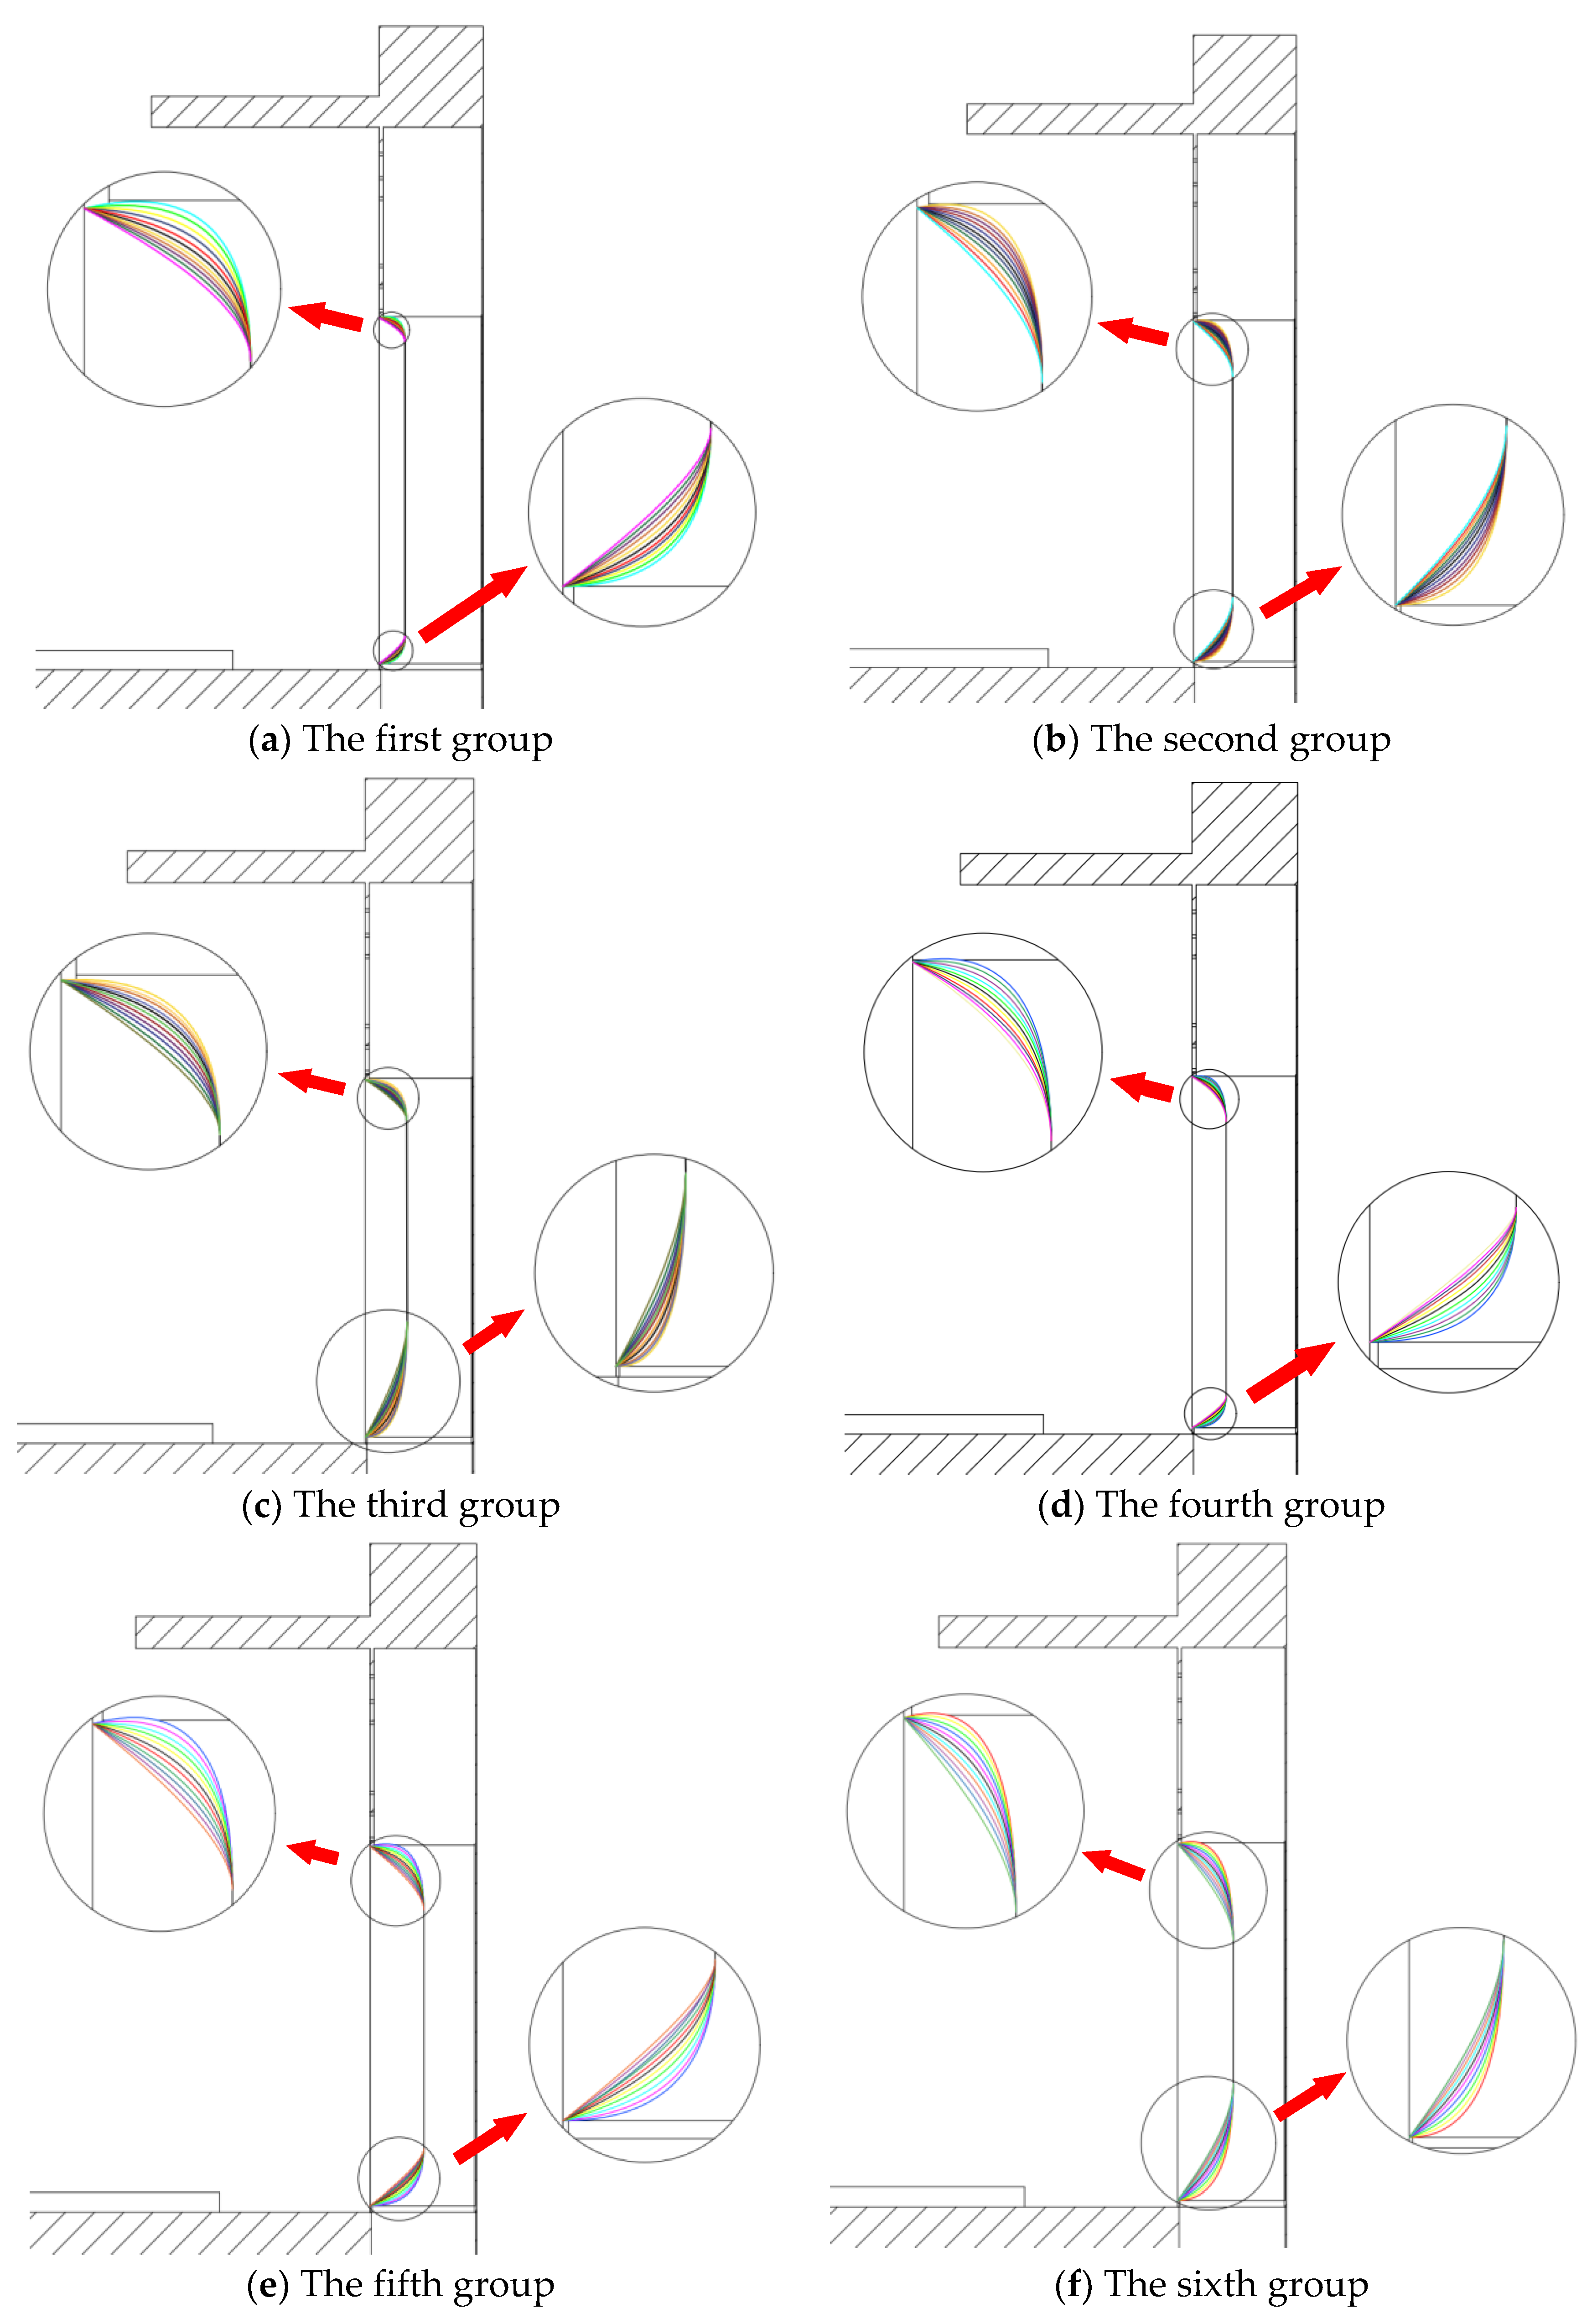
A sample of the design variable space established by the optimal Latin hypercube experimental design method is shown in Figure 14, different color lines represent different spatial samples.

4.4. Approximate Model

Currently, the Kriging approximation model [17] is a method for the prediction of random variables and has been widely used in fluid mechanical engineering practice. Because this model is suitable for calculating nonlinear dynamic simulations of guide vane profiles, the Kriging approximation model is chosen in this paper to express the relationship between design variables and optimization objectives. The following equation can express the Kriging approximation model,
f ( x ) = i = 1 k b i f i ( x ) + z ( x ) ,
where, fi(x) denotes the basis function, bi denotes the coefficient corresponding to the basis function, i = 1 k b i f i ( x ) , denotes the mathematical expectation of f(x), and z(x) denotes the variance σ s 2 .
To determine the reliability of the approximation model, its error analysis is performed by using the linear regression coefficient of determination R2. The closer R2 is to 1, the more accurate the prediction results of the approximation model. The following equation can calculate it as
R 2 = 1 - i = 1 n y i y ^ i 2 i = 1 n y i y ¯ 2
where R2 denotes the regression coefficient, yi denotes the actual response value obtained from the simulation, y ¯ denotes the sample mean, and y ^ i denotes the predicted value of the test sample.
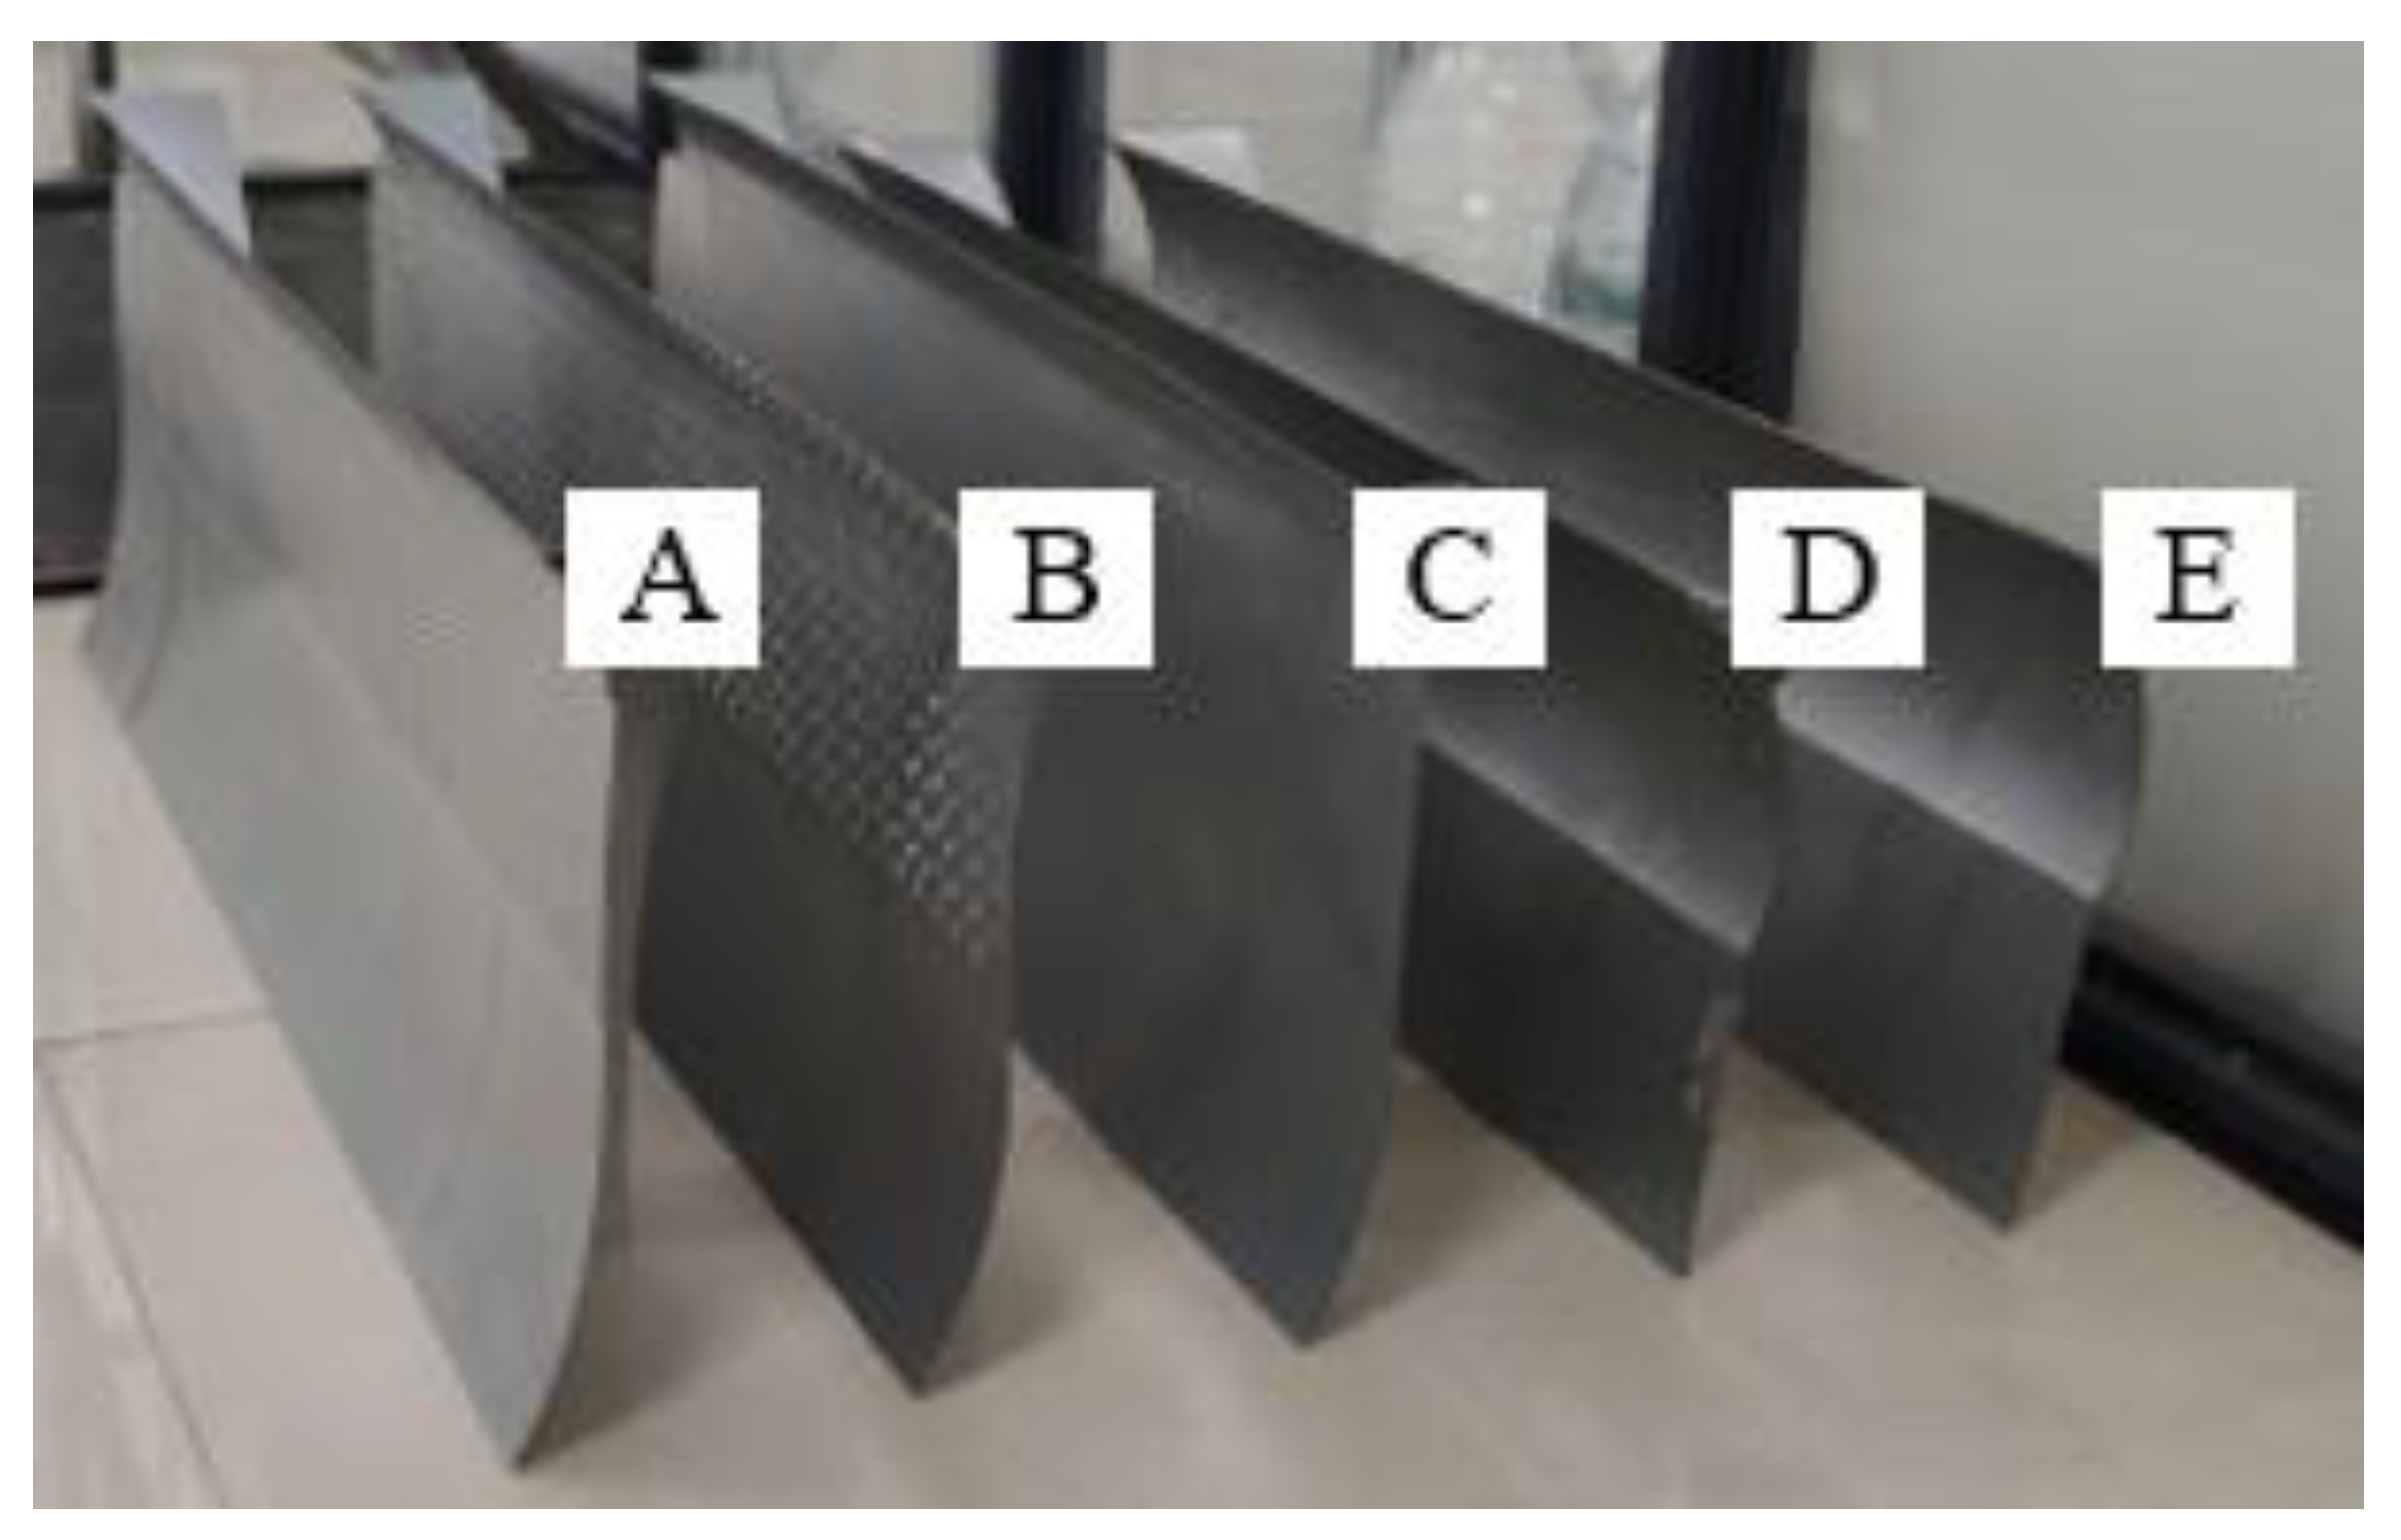
The last five sets of guide vane-type line space samples were prototyped, as shown in Figure 15. In order to ensure its accuracy, the samples were tested to obtain test data, as shown in Table 3. Comparing the predicted values of the approximation model with the experimental values, the R2 values of the outlet air volume Q and the sound pressure level SPL of the whole machine calculated by the above equation are all between 0.9 and 1, which proves the usability of the Kriging approximation model and provides reliable data support for the multi-objective optimization search below.

4.5. Improved MOCS Algorithm

The MOCS algorithm [18] is implemented by determining its optimization objective, generating new solutions by random crossover through the Lévy flight mechanism, and calculating the objective values in the new solutions. Then the highly adaptive solution is made to enter the next iteration for the algorithm to converge in the desired direction. Finally, during the mutation process, a new set of solutions is generated by discarding some incorrect solutions according to the similarity principle with probability and continuing the iteration to obtain a set of optimal solutions. The advantage of the MOCS algorithm is that it can completely dominate any solution to be the optimal solution instead of being able to choose only a smaller objective value. However, the MOCS algorithm is improved from the CS algorithm, which does not consider that the new and old solutions do not dominate each other when solving the Pareto solution set, nor does it address the mutual dominance relationship between individuals. The MOCS algorithm does not preserve the highly adaptive individuals during the optimization search. Instead, they are discarded with the probability of Pa, resulting in the loss of better solutions, which severely impacts the final optimization results [19]. In order to solve the problems of the above MOCS algorithm, it will be improved.
In order to obtain accurate Pareto front solutions in the multiobjective optimization of guide lobe type lines, the adaptability of solutions, local search capability, convergence speed, and uniformity of Pareto solution set distribution of the original MOCS algorithm will be improved in this paper as follows.
(1) The original MOCS algorithm, which enhances the solution fitness by the dominance relationship between the new solution and the old solution, will cause many solutions to have no dominance relationship, significantly reducing the speed of solution update. In this paper, we refer to the NSGA-II algorithm, which uses a fast nondominated sorting method to evaluate the fitness of solutions to speed up solutions’ updates. However, this still needs to ensure a uniform distribution of solutions, so the congestion distance method [20] is used to solve the above problem. Because there are two optimization objectives in the multiobjective optimization design of this paper, the size of the crowding distance of a solution is determined by the sum of the side lengths of the rectangle formed by the two solutions adjacent to that solution.
(2) The calculation step of the random wandering strategy in the original MOCS algorithm is regulated based on the similarity of the solutions, which the following equation can express,
X i t 1 = X i t + r X k t X j t ,
where X k t and X j t denote the two solutions of the random search respectively, and r denotes the value of the random distribution in [0, 1].
The discard probability is used during the local search of the original MOCS algorithm. When r is less than the discard probability, the old solution is discarded, and a new solution is computed by Equation (8). The motion step of the solution is determined by the random value r and the vector difference calculation X k t X j t , which leads to the generation of new solutions without directionality. In this paper, the local search capability of the MOCS algorithm is enhanced by introducing the randomly distributed value r and 1 r the difference factor for local search, then Equation (8) can be transformed into
X i t 1 = X i t + r a n d × r × X k t 1 r × X j t .
(3) Because the discard probability will determine the speed of the solution update, the convergence speed of MOCS arithmetic can be improved by optimizing the discard probability. Because the question of whether a solution is discarded or not is independent of its fitness, the new and old solutions are ranked according to their fitness. The discard probability is set to a tunable state, and the tuning range is specified, P a P a , min , P a , max . Specify that the fitness of a solution is inversely proportional to the discard probability used and set the extreme value of the discard probability to be linearly related to the number of iterations, as shown in the following equation,
P a , min = max P a , min 1 t / max _ i t e r
P a , max = max P a , max 1 t / max _ i t e r ,
where t denotes the number of iterations, and max_iter denotes the maximum number of iterations.
(4) To make the solutions obtained by the MOCS algorithm, uniformly distributed in the Pareto front. In this paper, an archive is constructed to group all the solutions. Moreover, a screening mechanism is established for this archive based on the small habitat technique based on the shared radius. The filtering rules of the archive are (i) discard the solutions within the shared radius, (ii) if the distance between two solutions is smaller than the shared radius, both solutions are discarded, and (iii) on the contrary, they are retained, thus avoiding duplicate and too immediate solutions in the archive.
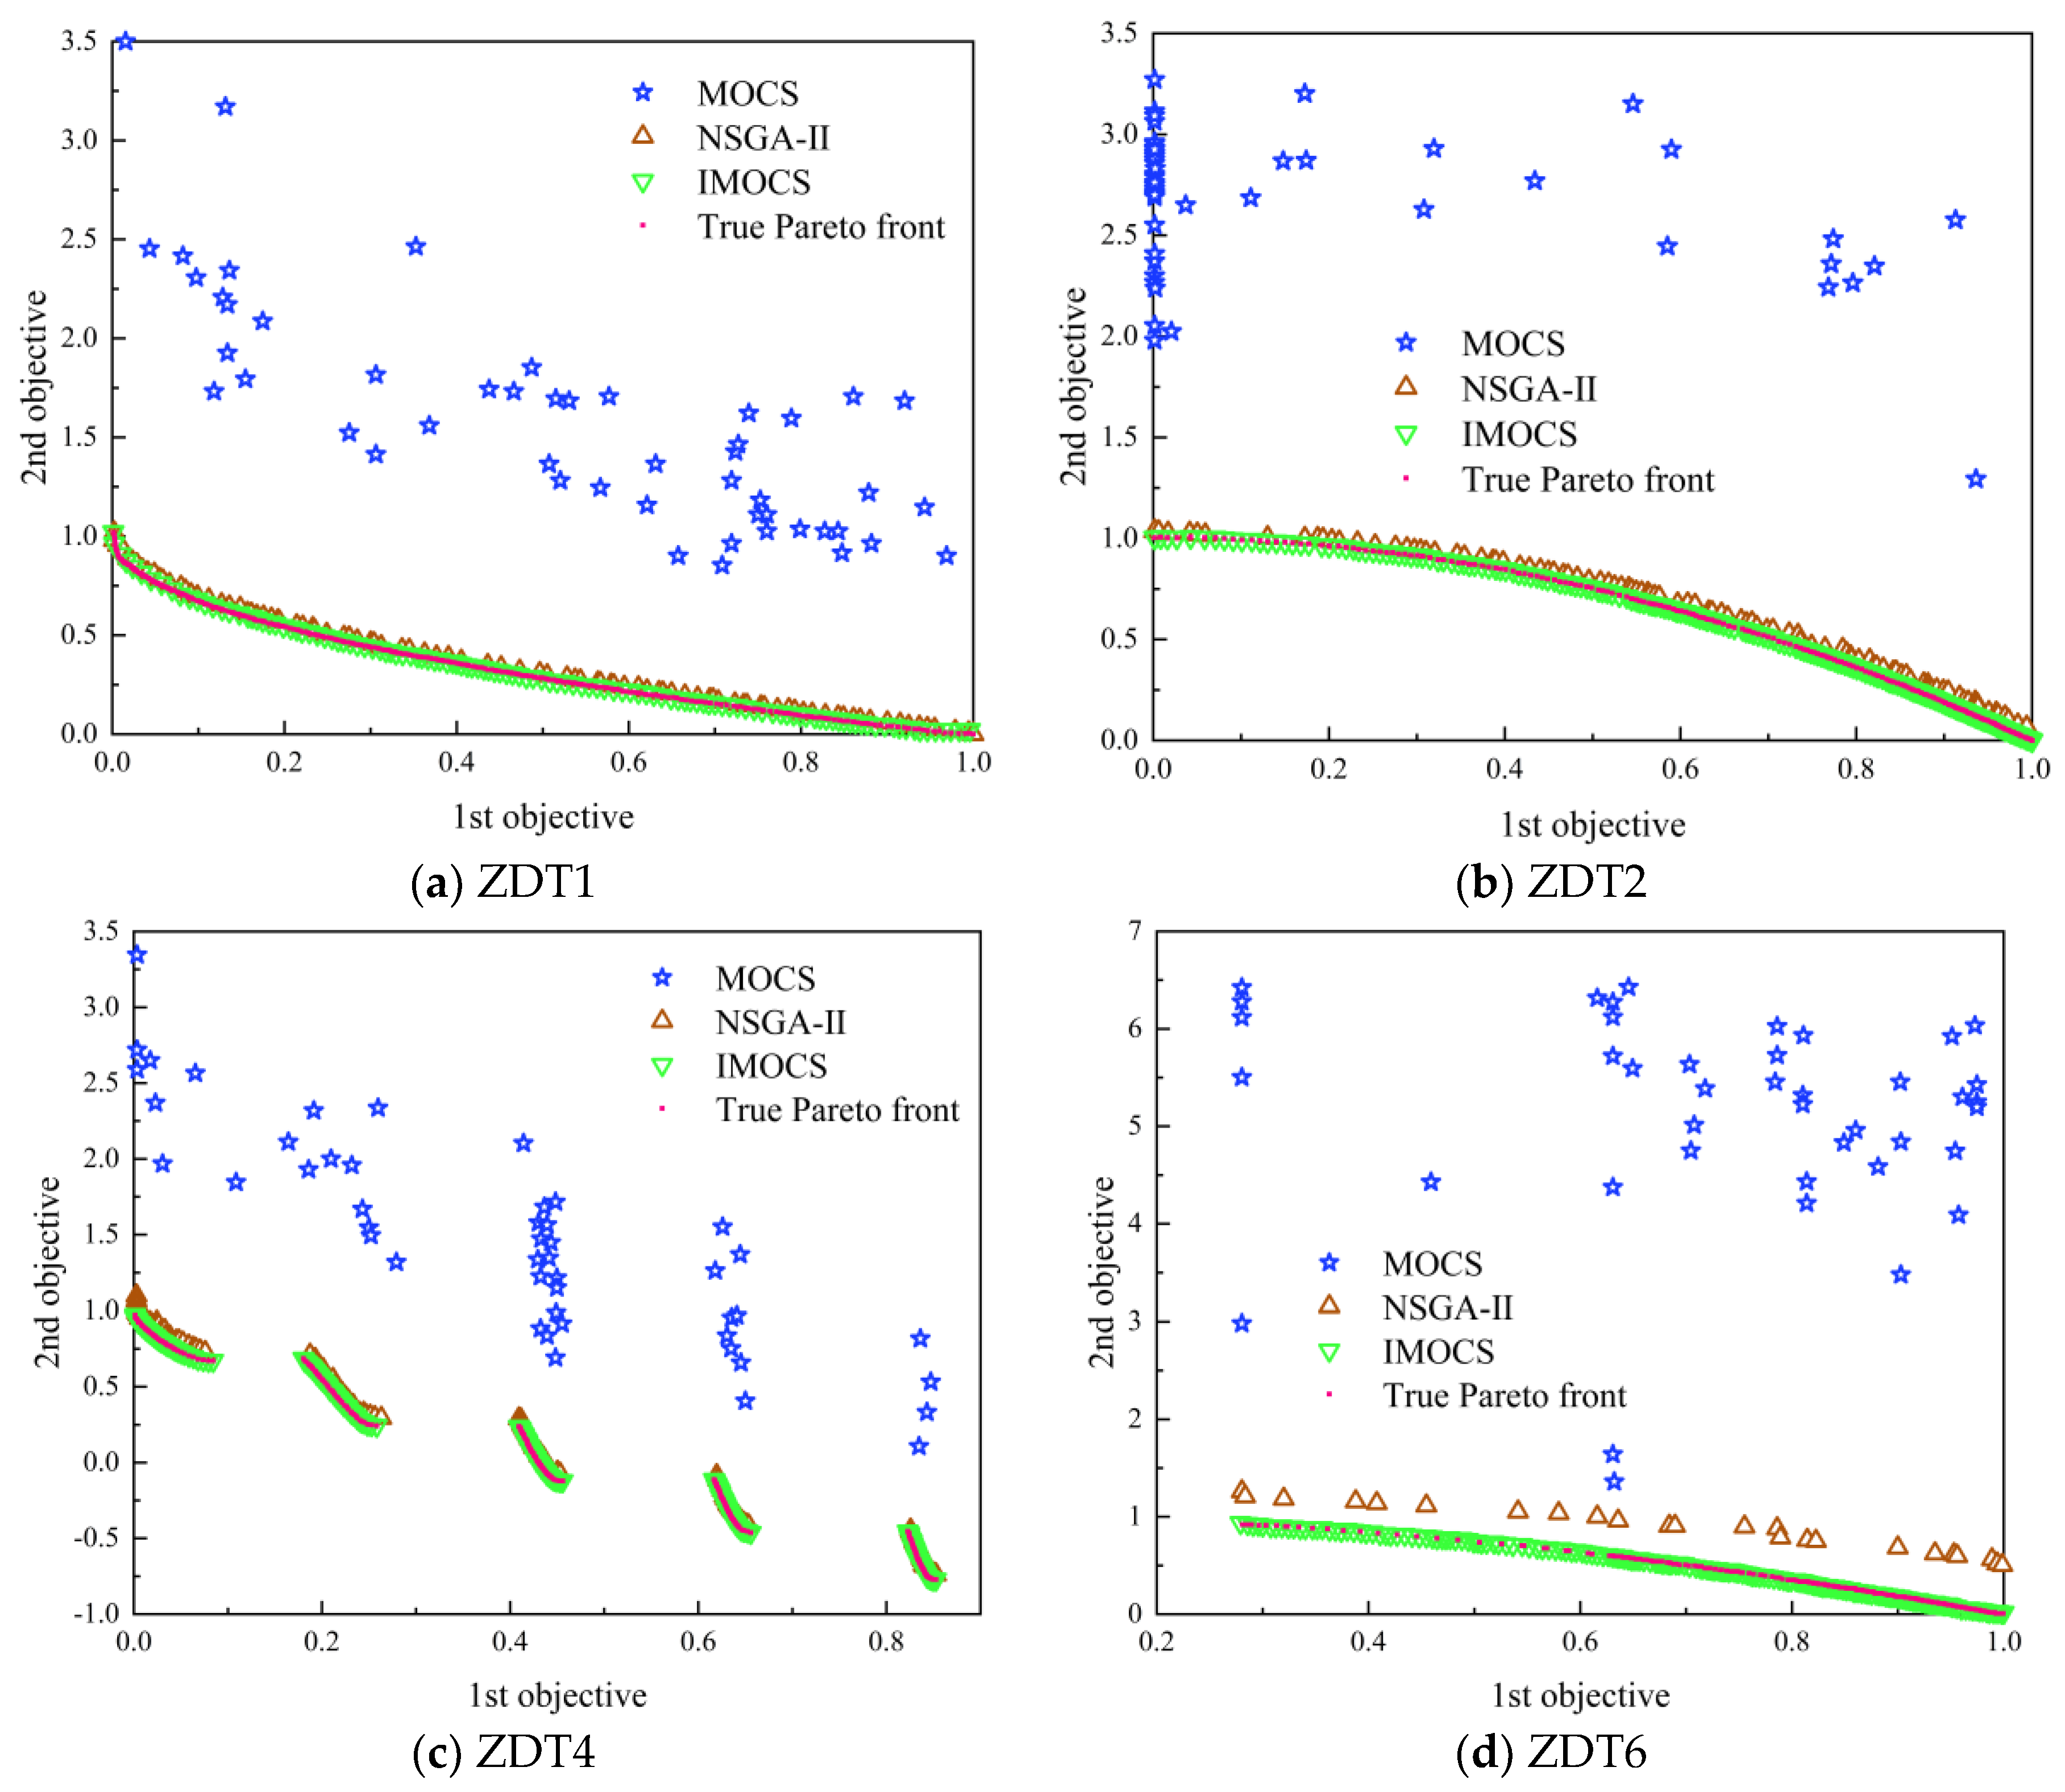
The IMOCS algorithm is proposed according to the improvement measures in the above paper. In the following, the original MOCS algorithm, the NSGA-II algorithm, and the IMOCS algorithm are simulated and tested by using the test function. The improvement effect of the IMOCS algorithm is examined by comparing the test results of the three algorithms. During the testing process, the number of calculations of the above three algorithms is kept consistent.
Four different test functions were used to simulate and test the optimization algorithm, and the test results are shown in Figure 16. In addition, the NSGA-II algorithm crossover probability Pc, variance probability Pm, crossover distribution index eta_c, and variance distribution index eta_m need to be adjusted. The data in the figure shows that the Pareto solution set obtained by the IMOCS algorithm is closer to the natural Pareto frontier, and the optimization results of the IMOCS algorithm are more accurate compared with the NSGA-II algorithm and the MOCS algorithm. Due to the limited number of iterations, the optimization effect of the MOCS algorithm is not shown, which also shows the limitation of the MOCS algorithm.
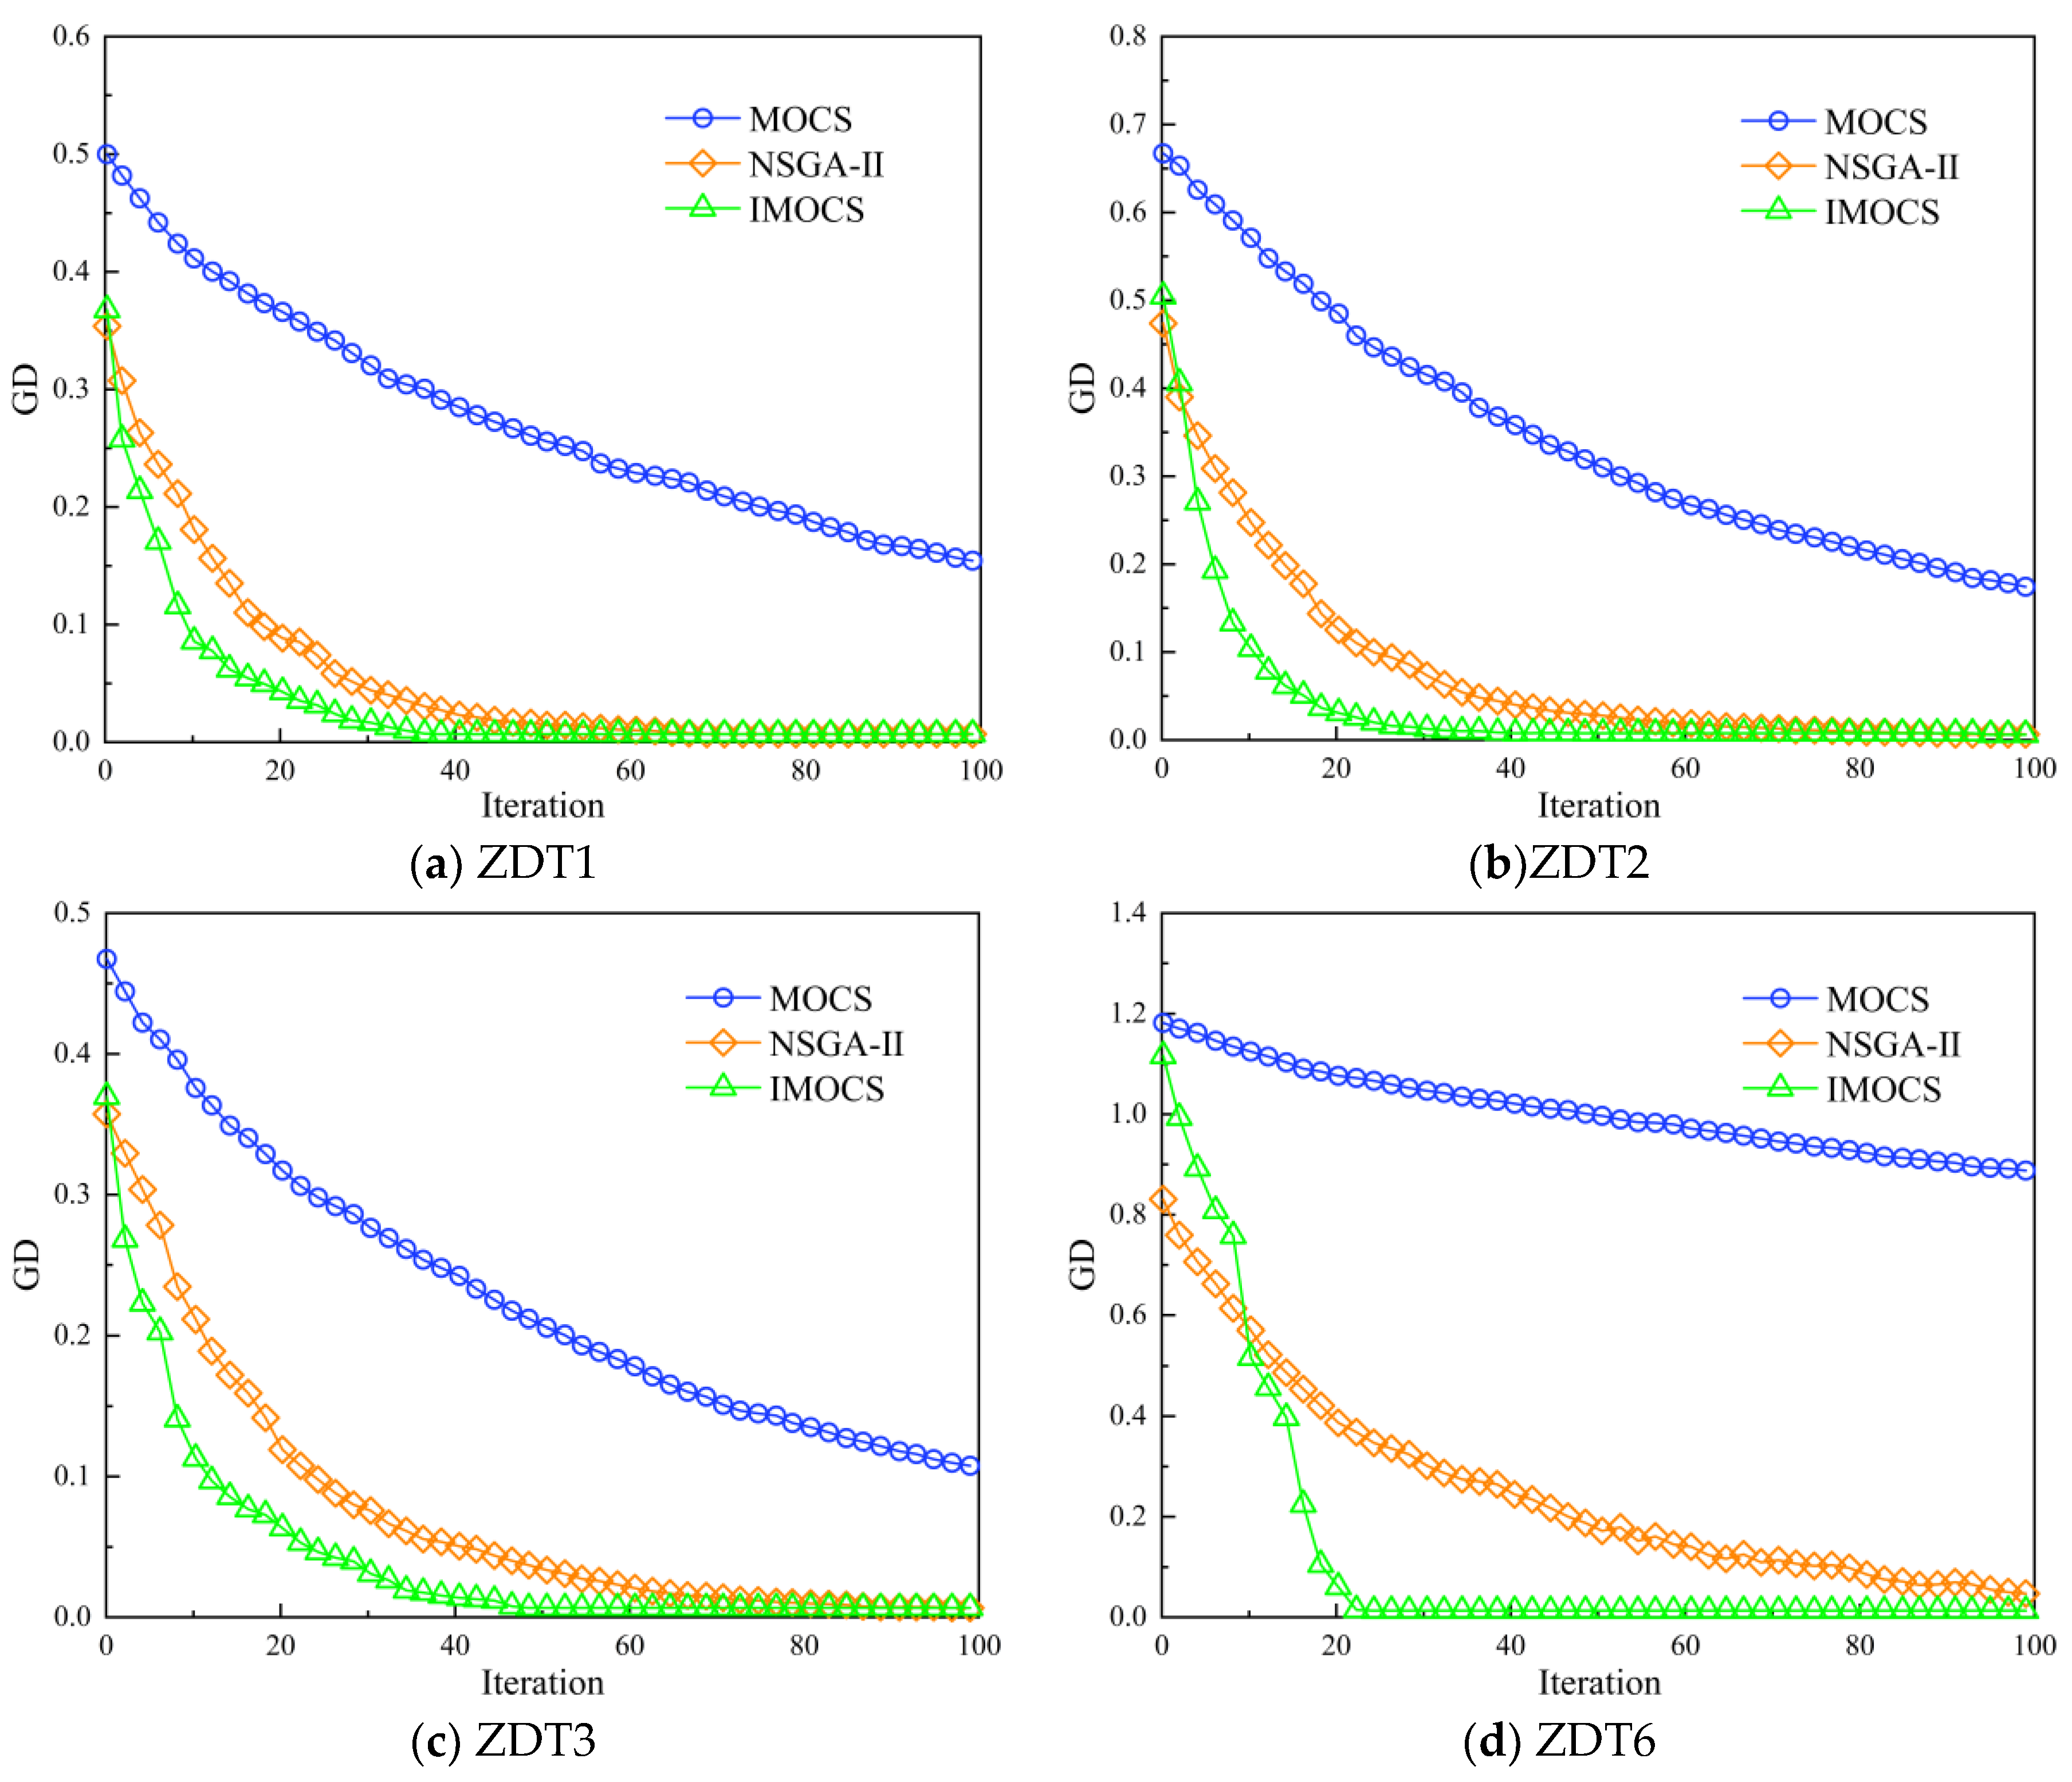
Comparing the computational errors of the three algorithms, the variation with the number of iterations is shown in Figure 17. The figure shows that the IMOCS algorithm converges faster in computing all four test functions compared to the NSGA-II algorithm and the MOCS algorithm.
In summary, this paper will use the IMOCS algorithm for multiobjective optimization search.
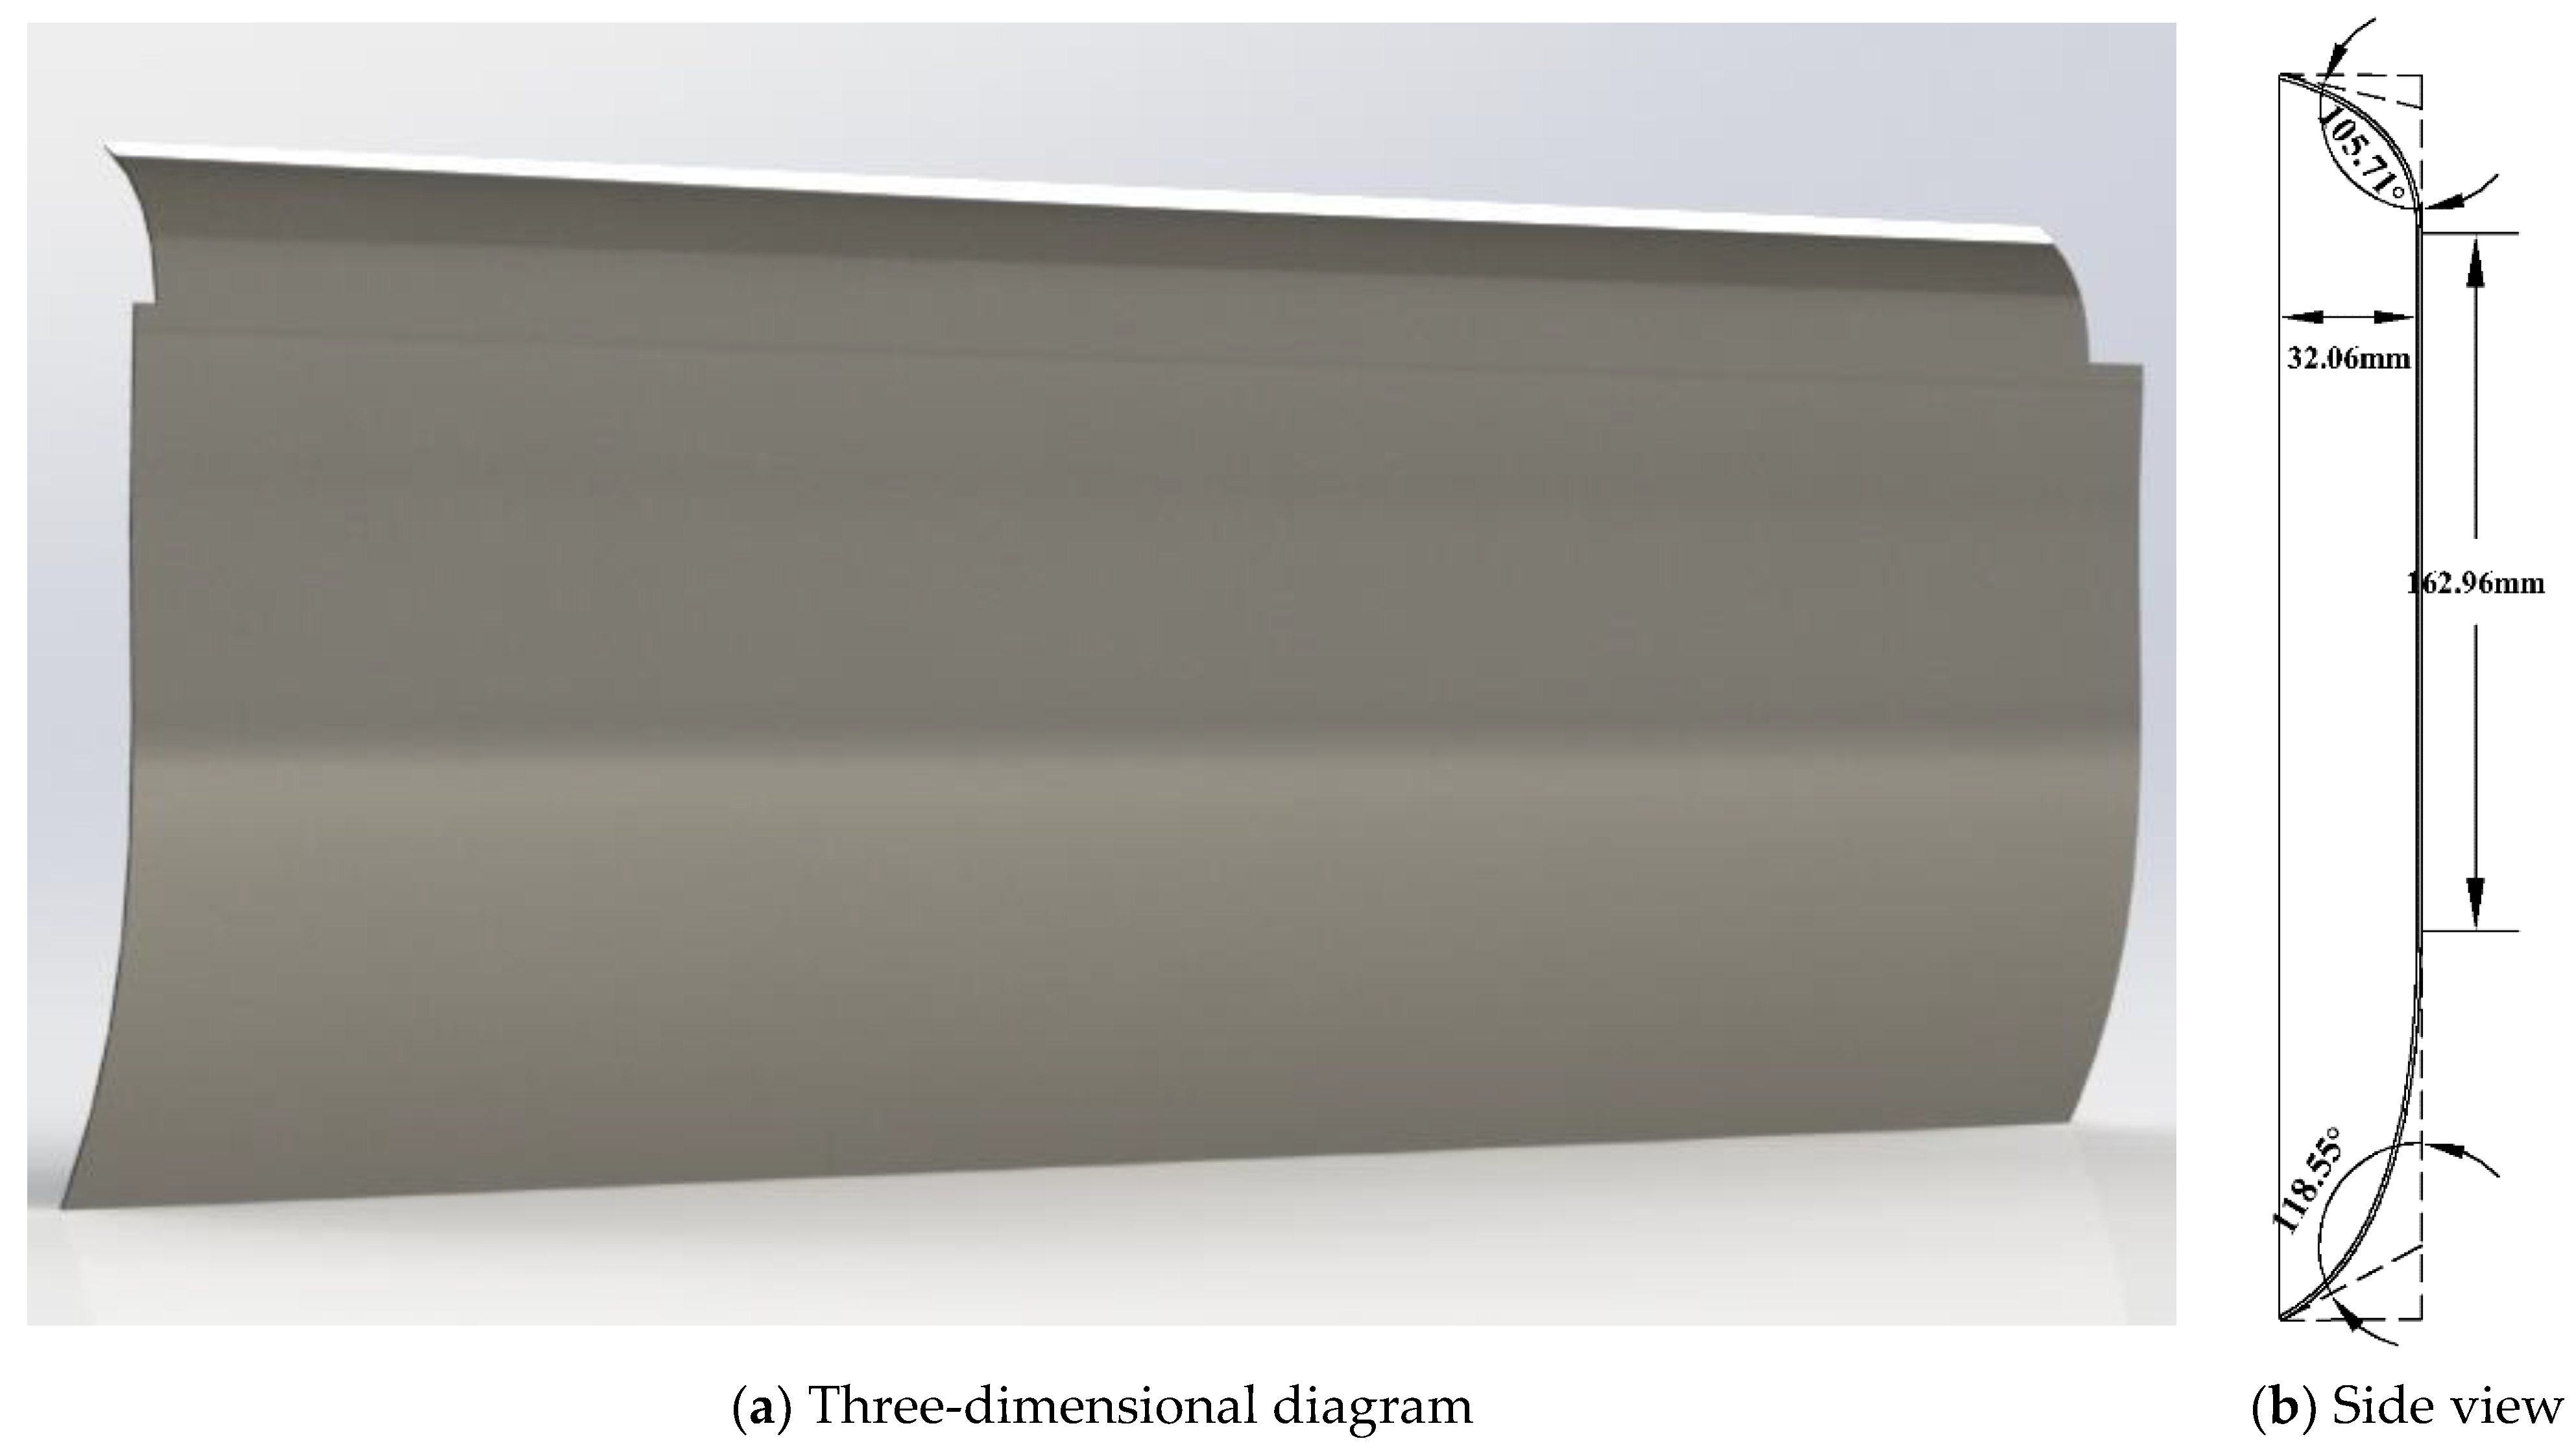
The 3D model of the guide vane is plotted by the parameters in Table 4, as shown in Figure 18.
The flow field characteristics inside the head duct with the optimized guide vane installed were analyzed by numerical simulation method, and the optimized flow line diagrams (X-250, X-150, X 0, X 150, and X 300) on different X-directional sections inside the head duct are shown in Figure 19. From the flow distribution in the figure, it can be seen that the overall uneven flow distribution inside the head duct has been significantly improved compared to Figure 7 and Figure 11. The vortex area and low-energy separation area on the front baffle side near the wall have basically disappeared, and the vortex energy has basically been completely dissipated, and the airflow condition in the head duct of the integrated cooker has been dramatically improved.
The optimized turbulent energy clouds for different X-directional sections (X-250, X-150, X 0, X 150, and X 300) in the head duct of the integrated hob are shown in Figure 20. They are comparing with the turbulent energy clouds in Figure 8 and Figure 12; it can be seen that the high turbulent energy zone at the front baffle side near the wall disappears entirely after optimization of the guide lobe profile, which further improves the noise reduction performance of the integrated hob head duct.
5. Experimental Verification

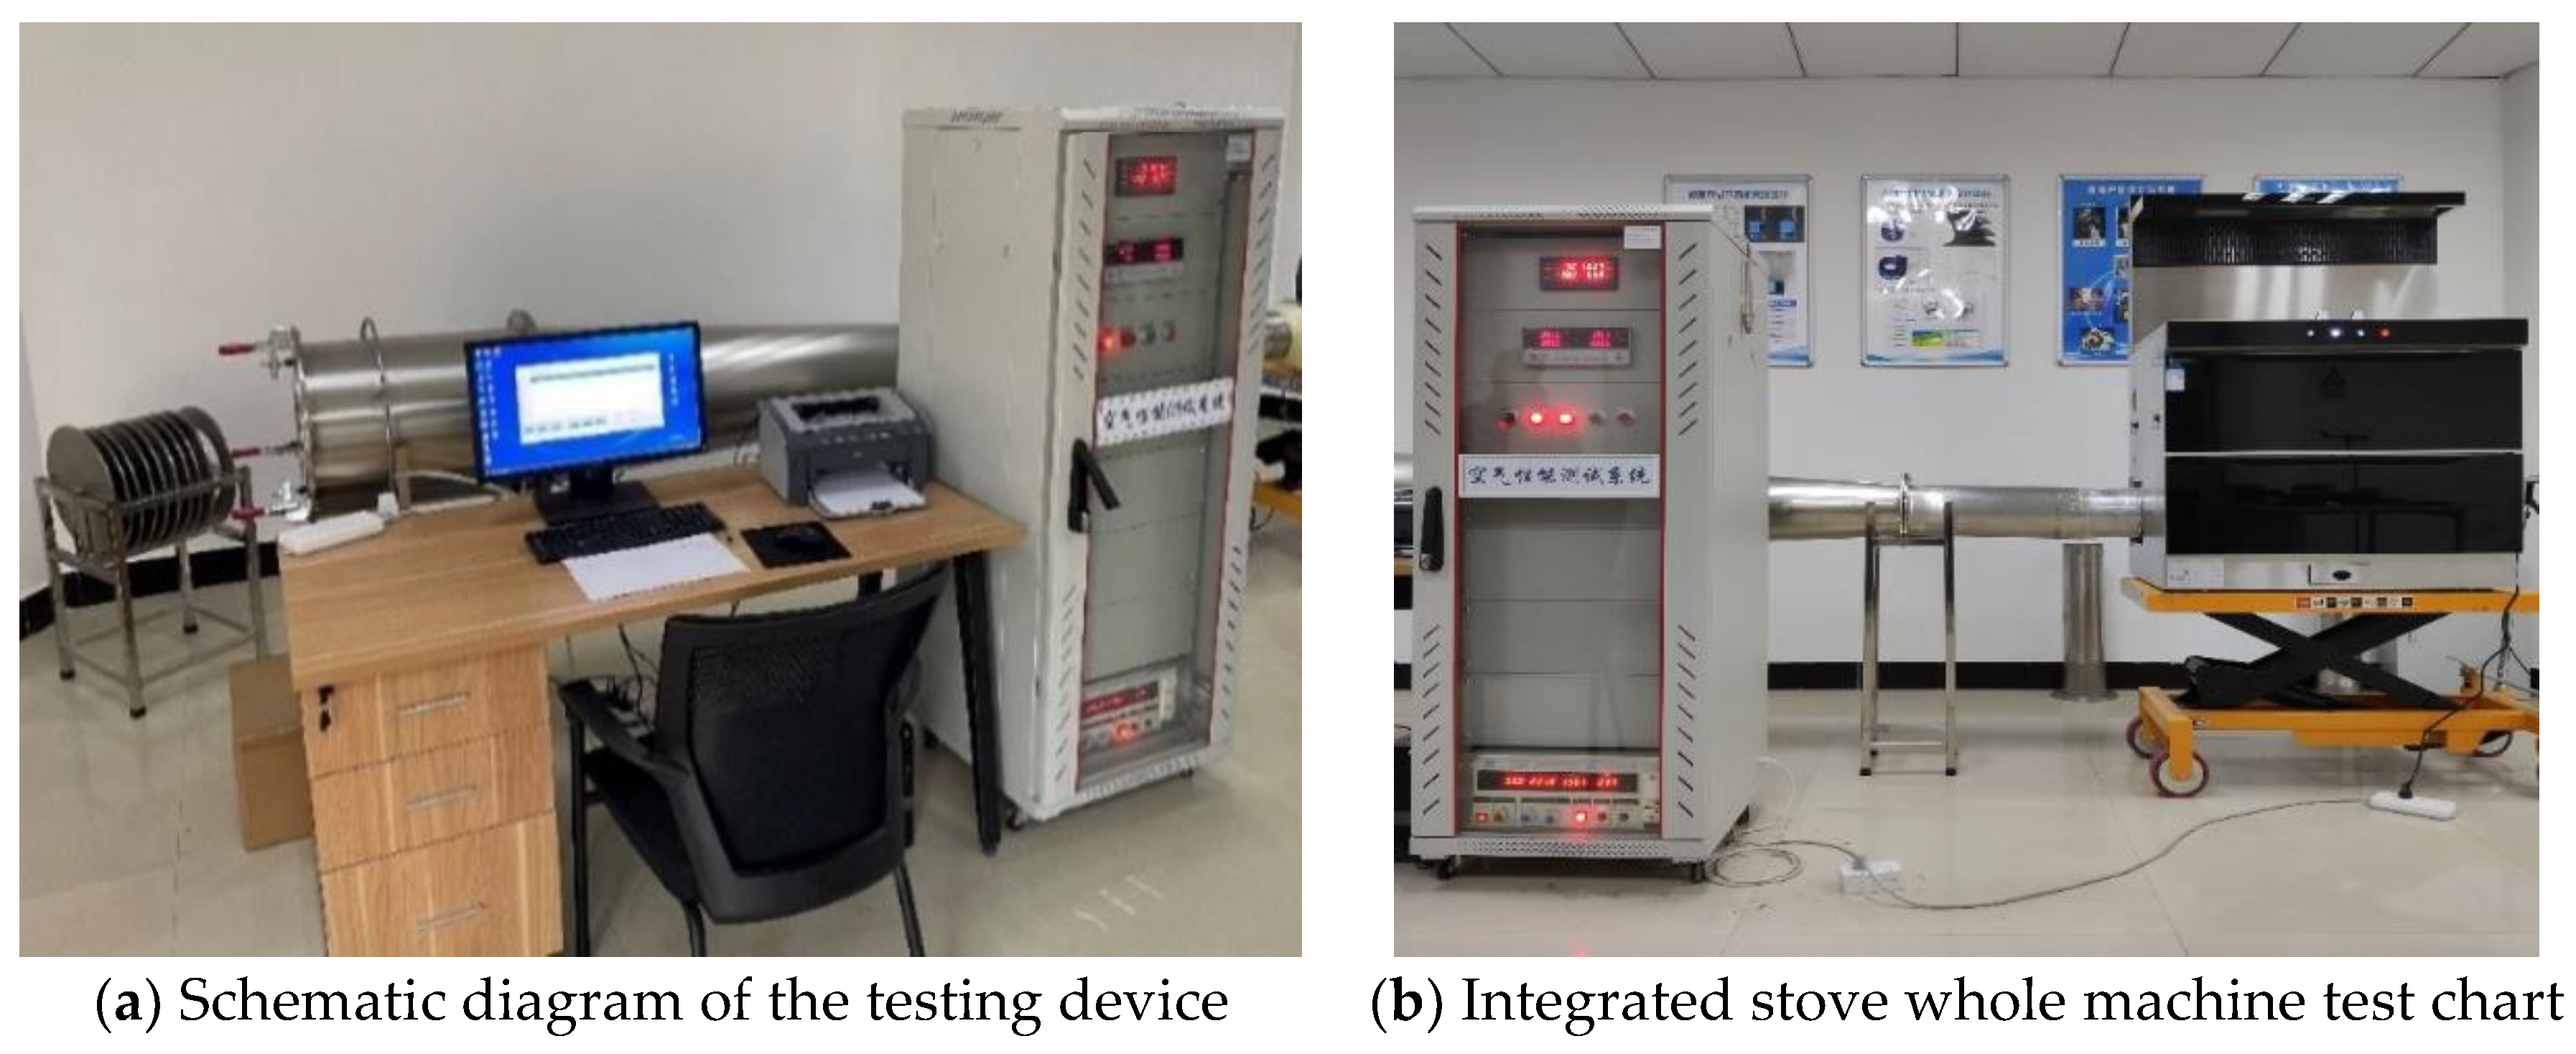
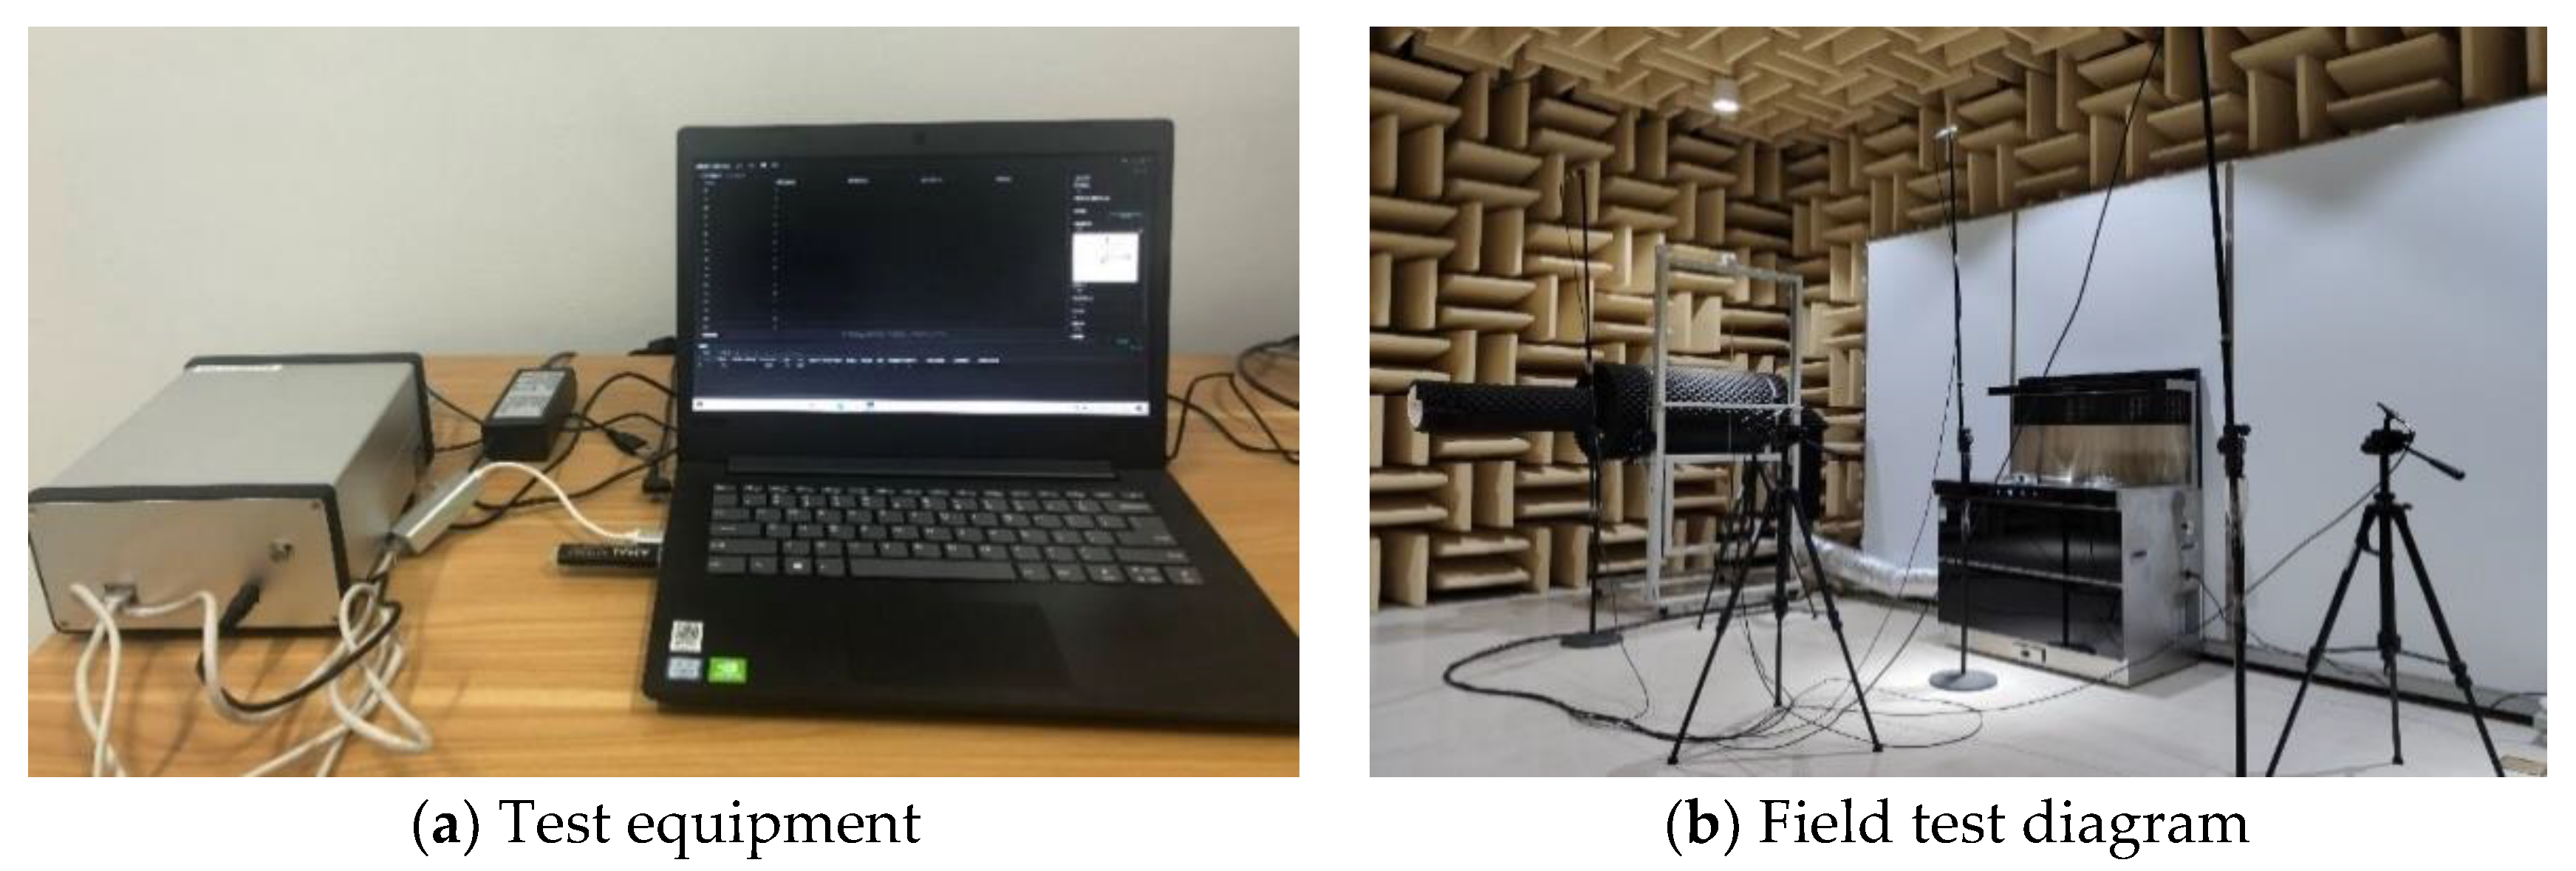
In this chapter, the air performance and noise tests are conducted to test the prototype of the integrated cooker and the optimized solution, respectively, to verify the feasibility of the optimized solution of the guide leaf. The air performance test refers to the standard ISO5801-2017 “Fans—Performance Testing Using Standardized Airways “ for aerodynamic performance test [21], and the acoustic characteristic test refers to the standard GB/T 2888-2008 “ Methods of Noise Measurement for Fans Blowers Compressors and Roots Blowers” for acoustic characteristic test [22].Detailed information is shown in Figure 21 and Figure 22.
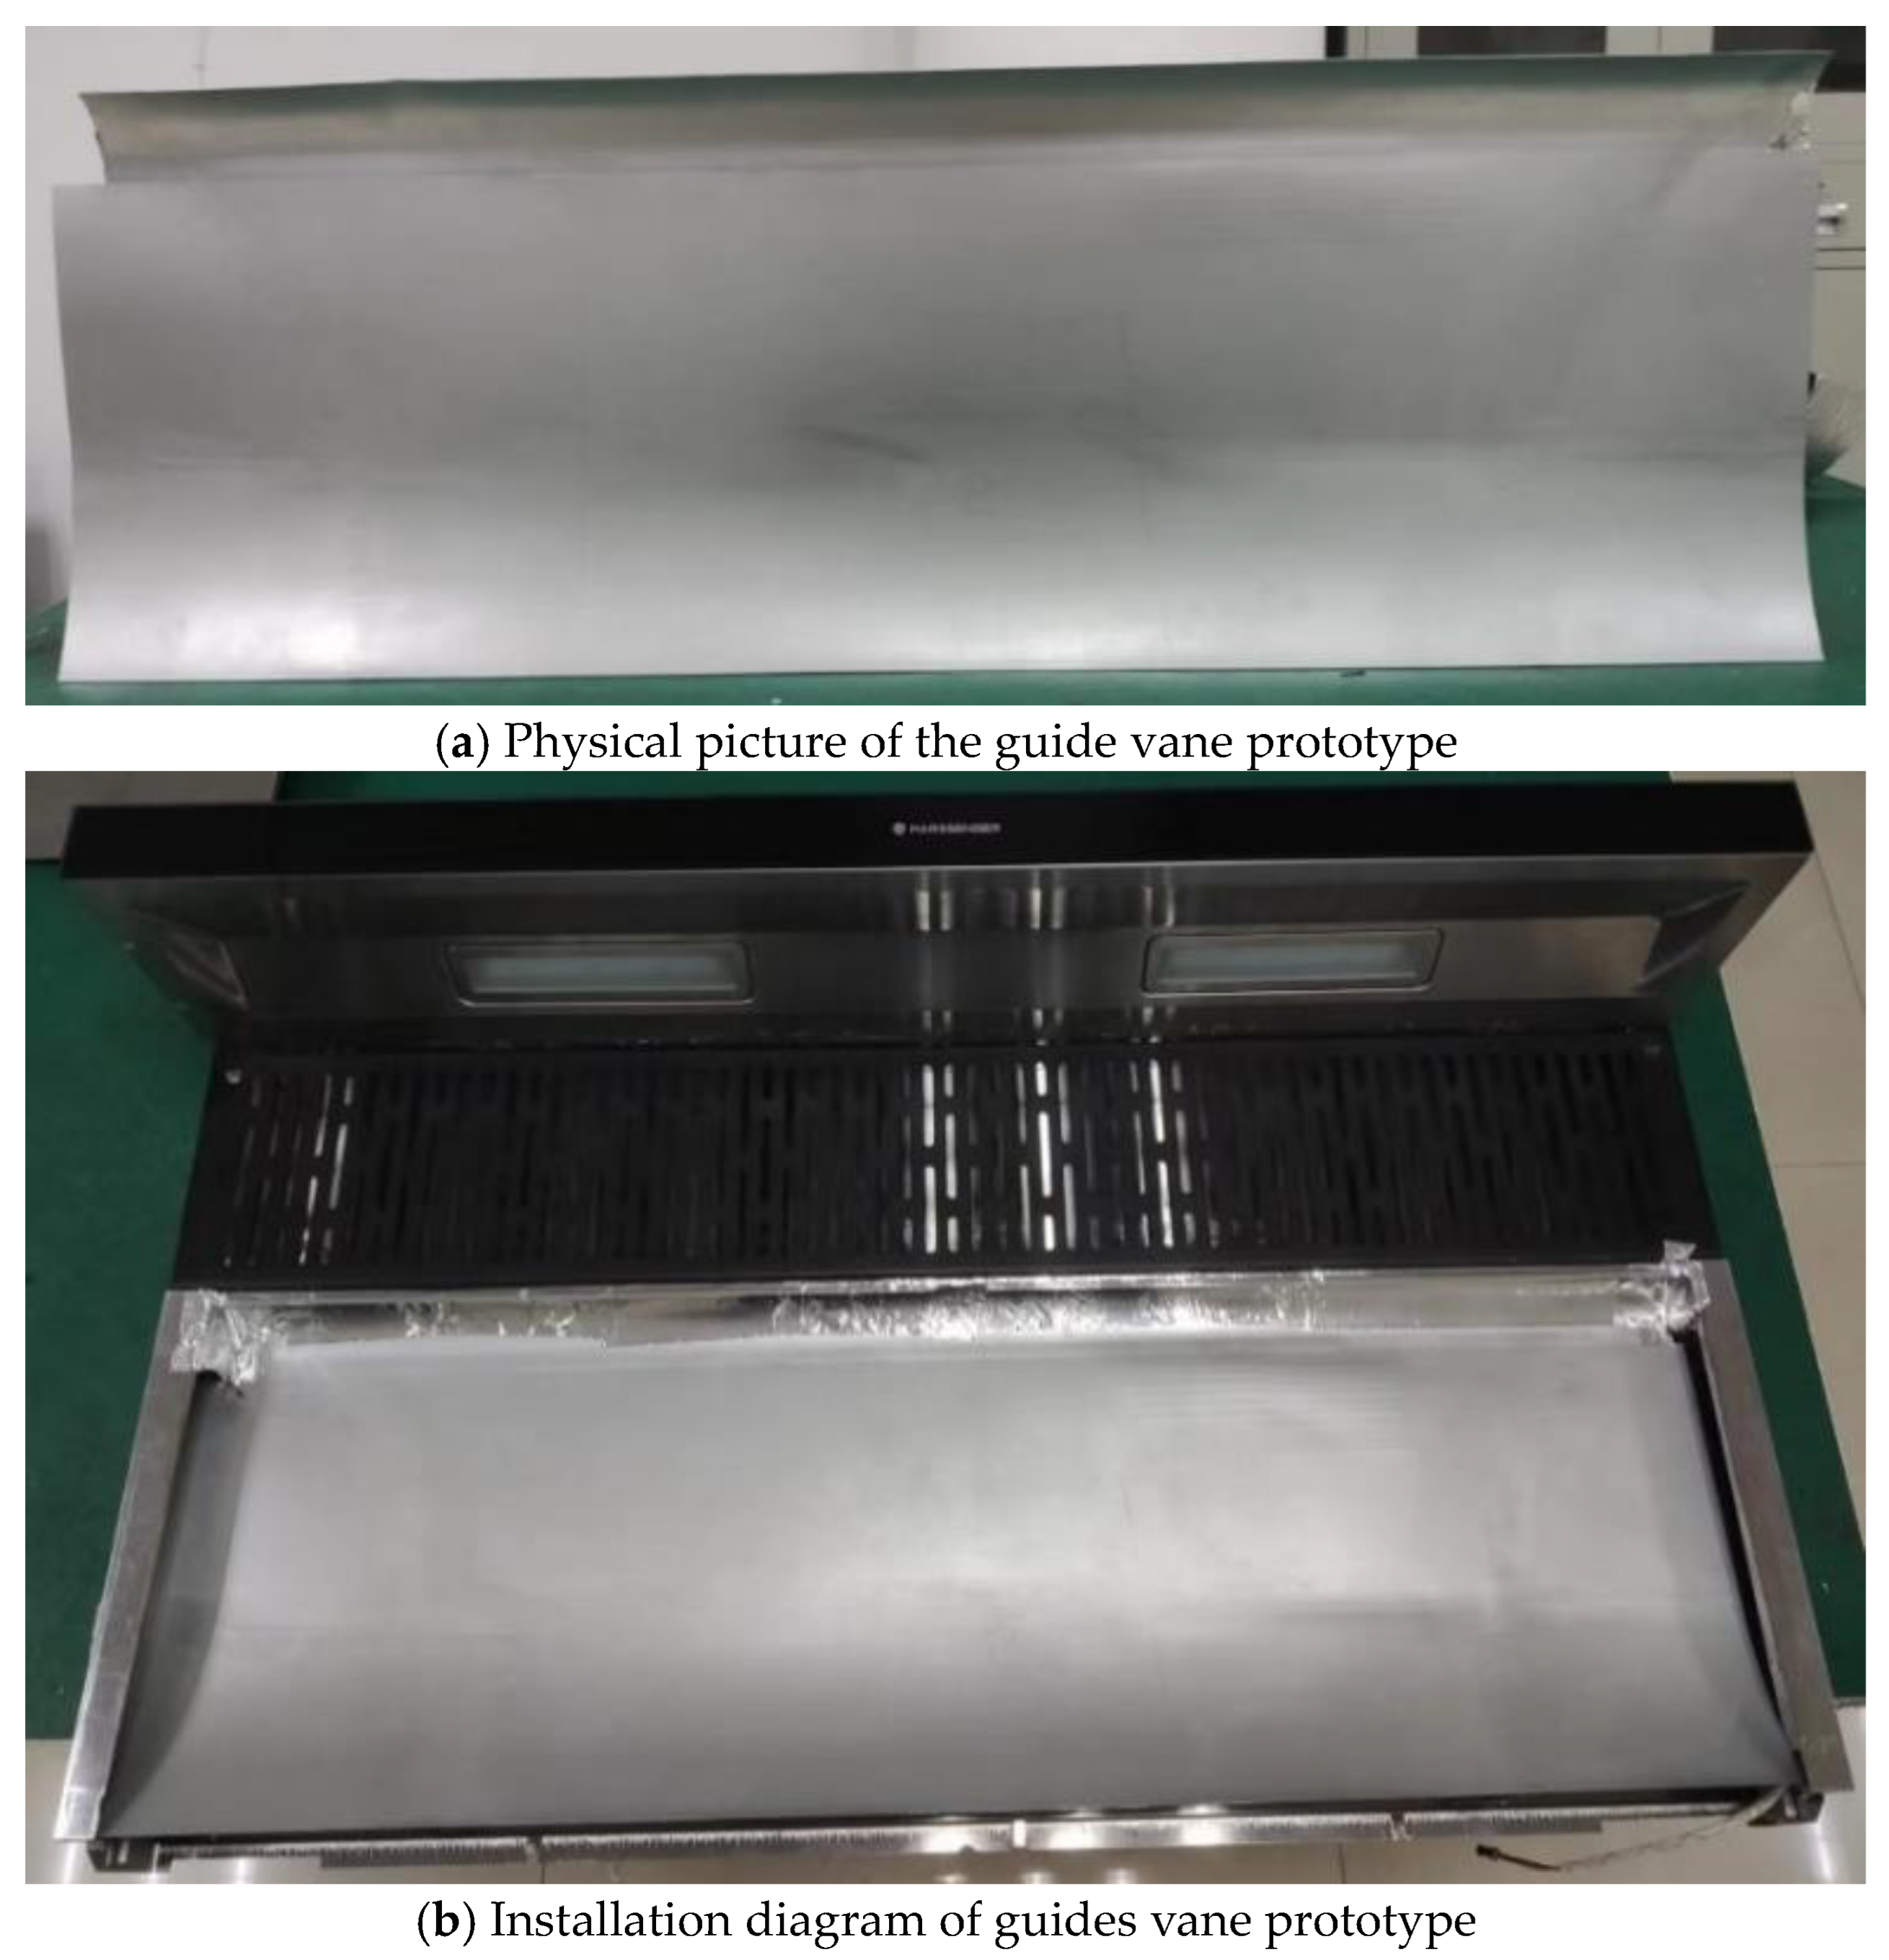
To ensure the feasibility of the optimized solution, a prototype will be fabricated for experimental verification. The first step is to prototype the guide vane and install it in the head duct, as shown in Figure 23.
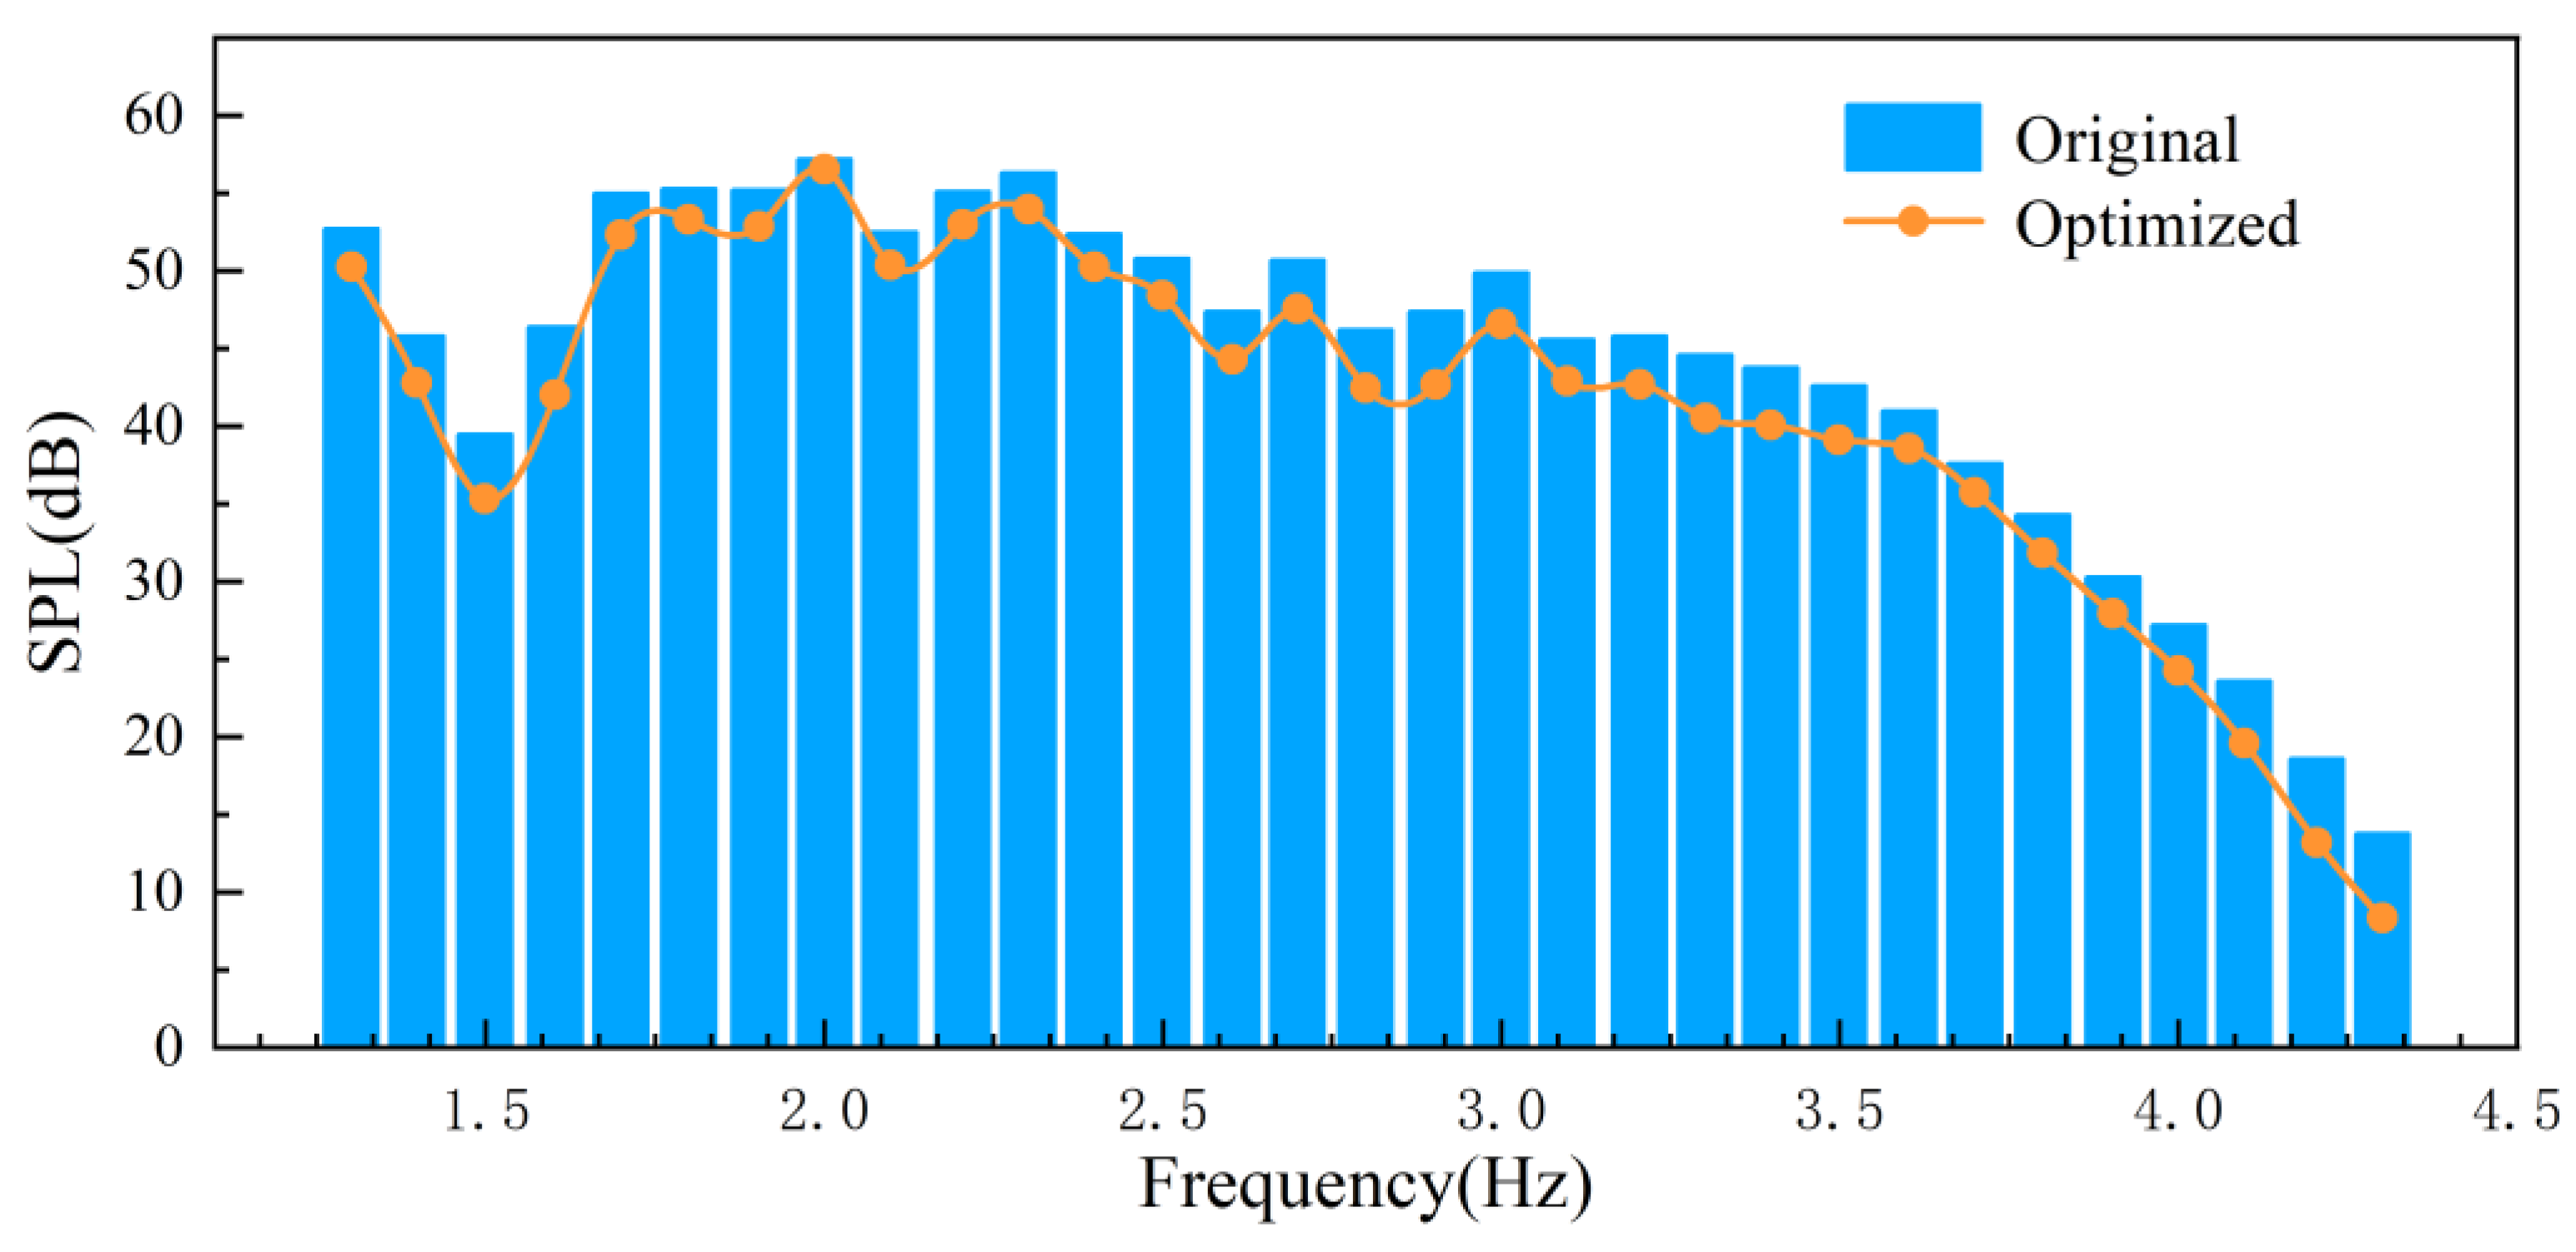
Compared with the prototype integrated cooker smoke exhaust system, adding guide vanes in the head duct can reduce the noise by 1.6 dB, which has a more obvious noise-reduction effect. In order to further analyze the sound pressure level spectrum of the smoke exhaust system, the sound pressure level distribution of the prototype and the guide lobe optimization at 1/3 octave frequency was derived for analysis.
The comparison of the sound pressure level distribution between the prototype and the guide vane optimization at 1/3 octave frequency is shown in Figure 24. After adding the guide vane optimization, the smoke exhaust system has significantly reduced noise at low frequencies, and the trend of high-frequency changes is similar to that of the prototype. The guide vane can suppress the generated vortex noise in a wide range of frequency distribution, and the discrete rotational noise is not significantly reduced. The additional guide vane in the head duct can improve the gas flow in the duct, reduce the generation of vortex in the duct, and then reduce the aerodynamic noise.

6. Conclusions

In this paper, we analyze the mechanism of noise generation in the air duct for the common problem of excessive noise in the air duct system of household appliances, propose an optimization method of adding guide vanes, and further study the design scheme of guide vanes type line. The method’s feasibility is verified by applying it to the head duct of an integrated cooker, and the main conclusions of this paper are as follows.
(1) Through experiments and numerical simulations to analyze the aerodynamic performance before and after air duct optimization, it is found that the optimized fan performance curve is basically consistent with the original fan. However, the air volume is improved under various working conditions. The outlet flow rate of the integrated cooker whole machine is improved by 1.2 m3/min, and the noise is reduced by 2.3 dB under the design working conditions.
(2) The IMOCS algorithm, applied to the multiobjective optimization design of the duct guide vane, verifies the feasibility of coupling the Kriging model and the IMOCS algorithm to the multiobjective optimization search and provides a reference for the aerodynamic design of other duct systems.
(3) The air duct optimization design method proposed in this paper is verified in the optimization of the air duct of the head of the integrated cooker. This method applies to but is not limited to the optimization of the air duct system of other appliances and is highly adaptable, providing new ideas for the whole integrated cooker industry and the energy-saving and noise-reducing design of the air duct system.

Author Contributions

Conceptualization, Y.L. (Yuebing Li); Methodology, Z.W.; Validation, Y.L. (Yu Luo); Formal analysis, Y.L. (Yuebing Li); Resources, W.J.; Data curation, Y.L. (Yu Luo); Writing—original draft, Z.W.; Writing—review & editing, Z.W.; Supervision, W.J.; Project administration, S.Z.; Funding acquisition, S.Z. All authors have read and agreed to the published version of the manuscript.

Funding

This research was funded by National Natural Science Foundation of China grant number 51706203 and Natural Science Foundation of Zhejiang Province grant number LY20E090004.

Conflicts of Interest

The authors declare no conflict of interest.

References

  1. Lee, I.S.; Baek, S.J.; Chung, M.K.; Rhee, D. A study of air flow characteristics in the refrigerator using PIV and computational simulation. Flow Vis. Image Process 1999, 6, 333–342. [Google Scholar] [CrossRef]
  2. Zhao, Y.; Han, L.; Zhang, S.; Yan, B. CFD simulation-based optimization of refrigerator air ducts. Appl. Technol. 2022, 415, 53–55+65. [Google Scholar] [CrossRef]
  3. Koo, H.M. An experimental study of the noise and the performance of cross-flow fans in room air-conditioning systems. Noise Control. Eng. J. 2000, 48, 41–47. [Google Scholar] [CrossRef]
  4. Liu, X.; Wei, M.; Yang, L.; Li, D. Performance optimization study of internal duct system for range hoods. J. Eng. Thermophys. 2018, 39, 2200–2206. [Google Scholar]
  5. Wang, D.; Yu, W.; Zhang, Y.; Chen, J.; Gao, S. Exploration of new noise-reducing air ducts for range hoods and their optimal parameters. Dly. Appl. 2019, 24–28. [Google Scholar]
  6. Abdollahzadeh, B.; Gharehchopogh, F.S. A multi-objective optimization algorithm for feature selection problems. Eng. Comput. 2021, 25, 1–19. [Google Scholar] [CrossRef]
  7. Deb, K.; Pratap, A.; Agarwal, S. A fast and elitist multi-objective genetic algorithm: NSGA-II. IEEE Trans. Evol. Comput. 2002, 6, 182–197. [Google Scholar] [CrossRef] [Green Version]
  8. Coello, C.A.; Pulido, G.T.; Lechuga, M.S. Handing multiple objectives with particle swarm optimization. IEEE Trans. Evol. Comput. 2004, 8, 256–279. [Google Scholar] [CrossRef]
  9. Zhang, Q.F.; Li, H. MOEA/D: A multi-objective evolutionary algorithm based on decomposition. IEEE Trans. Evol. Comput. 2007, 11, 712–731. [Google Scholar] [CrossRef]
  10. Gong, M.G.; Jiao, L.C.; Du, H.F.; Bo, L. Multi-objective immune algorithm with non-dominated neighbor-based selection. Evol. Comput. 2008, 16, 225–255. [Google Scholar] [CrossRef] [PubMed]
  11. Goldstein, M.E. Unified Approach to Aerodynamic Sound Generation in the Presence of Boundaries. J. Acoust. Soc. Am. 1974, 56, 497–509. [Google Scholar] [CrossRef]
  12. Zhang, Y. Fluid Mechanics; Higher Education Press: Beijing, China, 1999; pp. 284–293. [Google Scholar]
  13. Curle, N. The influence of solid boundaries on aerodynamic sound. Proc. R. Soc. Lond. 1995, A23, 505–514. [Google Scholar]
  14. Wang, F. Computational Fluid Dynamics Analysis; Tsinghua University Press: Beijing, China, 2004; pp. 1–272. [Google Scholar]
  15. Li, T.; Qin, D.; Zhang, J. Effect of RANS Turbulence Model on Aerodynamic Behavior of Trains in Crosswind. Chin. J. Mech. Eng. 2019, 32, 155–166. [Google Scholar] [CrossRef]
  16. De Boor, C. On calculating with B-splines. J. Approx. Theory 1972, 6, 50–62. [Google Scholar] [CrossRef] [Green Version]
  17. Bouhlel, M.A.; Bartoli, N.; Regis, R.G.; Otsmane, A.; Morlier, J. Efficient global optimization for high-dimensional constrained problems by using the Kriging models combined with the partial least squares method. Eng. Optim. 2018, 50, 2038–2053. [Google Scholar] [CrossRef] [Green Version]
  18. Xu, Y.; Chen, N.; Shen, X.; Xu, L.; Pan, Z.; Pan, F. Proposal and experimental case study on building ventilating fan fault diagnosis based on cuckoo search algorithm optimized extreme learning machine. Sustain. Energy Technol. Assess. 2021, 45, 15–20. [Google Scholar] [CrossRef]
  19. Mirjalili, S. Dragonfly algorithm: A new meta-heuristic optimization technique for solving single-objective, discrete, and multi-objective problems. Neural Comput. Appl. 2016, 27, 1053–1073. [Google Scholar] [CrossRef]
  20. Yang, M.D.; Chen, Y.P.; Wang, C.T.; Deng, M.J.; Lin, Y.H.; Chen, H.W. A stochastic multi-objective optimization decision model for energy facility allocation: A case of liquefied petroleum gas station. Clean Technol. Environ. Policy 2020, 22, 389–398. [Google Scholar] [CrossRef]
  21. GB/T 1236-2017; Fans—Performance Testing Using Standardized Airways. China Standard Press: Beijing, China, 2017.
  22. GB/T 2888-2008; Methods of Noise Measurement for Fans Blowers Compressors and Roots Blowers. China Standard Press: Beijing, China, 2008.
Figure 1. Diagram of local loss of bent pipes [12].
Machines 11 00129 g001
Figure 2. Structure diagram of integrated cooker smoke exhaust system.
Machines 11 00129 g002
Figure 3. Integrated stove exhaust system calculation model grid.
Machines 11 00129 g003
Figure 4. Verification of grid independence of wind turbine systems.
Machines 11 00129 g004
Figure 5. Grid independence verification of integrated stove smoke exhaust system.
Machines 11 00129 g005
Figure 6. Position calibration of the X-directional section within the prototype head duct of the integrated stove.
Machines 11 00129 g006
Figure 7. Cross-sectional flow diagram in the X-direction within the prototype head duct of the integrated stove.
Machines 11 00129 g007
Figure 8. Turbulent kinetic energy cloud map of X-direction cross-section in the head duct of integrated stove prototype.
Machines 11 00129 g008
Figure 9. Integrated stove prototype head surface broadband noise distribution.
Machines 11 00129 g009
Figure 10. Integrated stove head air duct preliminary optimization program.
Machines 11 00129 g010
Figure 11. Flow diagram of the X-directional cross-section within the initial optimized head duct of the integrated stove.
Machines 11 00129 g011
Figure 12. Turbulent energy cloud of X-directional cross-section in the preliminary optimized head duct of the integrated stove in head air duct of integrated stove.
Machines 11 00129 g012
Figure 13. Parametric schematic diagram of guide leaf profile.
Machines 11 00129 g013
Figure 14. DOE initial samples.
Machines 11 00129 g014
Figure 15. Verification of guide plate samples.
Machines 11 00129 g015
Figure 16. Comparison of test function optimization results.
Machines 11 00129 g016
Figure 17. Comparison of convergence speed.
Machines 11 00129 g017
Figure 18. Guide vane diagram.
Machines 11 00129 g018
Figure 19. Flow diagram of different X-directional cross-sections in the optimized head duct of the integrated stove.
Machines 11 00129 g019
Figure 20. Turbulent energy clouds for different X-directional cross-sections in the optimized head duct of the integrated stove.
Machines 11 00129 g020
Figure 21. Air performance testing device.
Machines 11 00129 g021
Figure 22. Integrated stove machine noise test diagram.
Machines 11 00129 g022
Figure 23. Diagram of guide vanes prototype.
Machines 11 00129 g023
Figure 24. Comparison chart of 1/3 times frequency before and after guide vanes optimization.
Machines 11 00129 g024
Table 1. Description of the key parameters of the integrated stove air duct system.
Part NameGeometric ParametersNumerical Value
Air inletlength A1 (mm)900
width A2 (mm)170
Headlength B1 (mm)900
width B2 (mm)80
height B2 (mm)505
Intake boxlength C1 (mm)600
width C2 (mm)200
height C3 (mm)460
Guided air boxlength D1 (mm)760
width D1 (mm)166
width D1 (mm)166
Air outletdiameter R (mm)166
Table 2. Number of grids in each fluid domain.
DomainsNumber of Grids
import860,778
head1,721,557
inlet box891,927
fans5,611,692
guided airbox55,962
export123,545
Table 3. Simulation accuracy verification.
SamplesAir Volume QSound Pressure Level SPL
ProjectionsSimulationsExperimentsProjectionsSimulationsExperiments
A16.5716.8216.6555.7156.2355.85
B17.1218.6517.0253.9055.9854.82
C16.2817.3916.3655.8956.7355.97
D15.9516.3616.0556.8557.0456.14
E16.5517.3316.0255.6756.7256.25
Table 4. Comparison of parameters before and after optimization.
Guide VaneL1 (mm)L2 (mm)A (°)Β (°)
Original27.050156.13155.87
Optimized32.06162.96105.71118.55
Disclaimer/Publisher’s Note: The statements, opinions and data contained in all publications are solely those of the individual author(s) and contributor(s) and not of MDPI and/or the editor(s). MDPI and/or the editor(s) disclaim responsibility for any injury to people or property resulting from any ideas, methods, instructions or products referred to in the content.