1. Introduction
Brake squeal in frictional brakes is a constant challenge for the automotive industry. It is a classic NVH (Noise, Vibration, Harshness) problem describing an undesired comfort-related dynamic phenomenon that is noticeable by the driver. Since no general solution to this problem exists, the development cost of automotive brakes is currently still dominated by solving these NVH problems [
1]. A brake squeal is usually caused by self-excitation based on the friction forces between the pad and the disk or drum. Non-conservative systems can nevertheless result in energy transfer from the rotation of the disk into vibrations, see, e.g., [
2]. This high-frequency noise occurs in the audible frequency range between 1 kHz and 15 kHz [
3]. A detailed literature review of brake squeal can be found in [
3,
4,
5].
Since squealing brakes are regarded by consumers as a significant quality issue, this phenomenon leads to high costs for warranty services and a high effort for the development of quiet brakes [
6]. According to [
7], 60% of all brake-related warranty cases in the automotive sector are caused by brake noise. In the past, industry but also academia focused mainly on eliminating brake squeal in disk brakes in cars [
8,
9,
10] or trains [
11]. Due to increased requirements for particle emissions and the shift away from internal combustion engines to electric drives, drum brakes are increasingly being used again [
12]. To an increasing extent, drum brakes are used in modern passenger cars like the Volkswagen ID.3 and ID.4 on the rear axles [
13,
14,
15]. Since electric vehicles are also decelerated by using regenerative braking in addition to conventional friction braking, the conventional braking systems are less frequently stressed and therefore also wear at a slower rate. Therefore, simpler drum brakes are often considered, which nevertheless meet the required braking characteristics. Drum brakes have many advantages in this context [
16]. These advantages are robust design, reduced release of harmful abrasion emissions [
17], and a clear weight advantage compared to the disc brake. According to [
18], the cost of a drum brake is also significantly lower. In the past, noise problems with drum brakes played a rather subordinate role, since they were mostly found in the commercial vehicle sector or the lower-price sector of passenger cars. However, this aspect is likely to become more important in the future, especially due to the use of upscale, quiet electric vehicles.
Common measures to reduce brake squeal on disk brakes are design modifications such as shifting the natural frequencies of components [
19,
20,
21], reducing the rotatory symmetry [
22,
23,
24], adjusting the geometry of the lining by using chamfers [
25] or even the use of suppression through active force control methods [
26]. However, since there is no straightforward correlation between these measures and the squealing behavior, they often require a great amount of testing and simulation. An often simpler and more robust method of reducing brake squeal is to add additional damping. In the case of disc brakes, this is often realized by attaching so-called shims to the backplate, of the brake pads [
5]. With drum brakes, on the other hand, the outside of the drum which is the main source of sound radiation [
22], offers a great additional potential for the application of damping [
18,
27].
It seems evident that increasing damping in a dynamic system improves its stability behavior. However, there are various studies where it has been shown that, concerning brake squeal, increasing damping in specific cases can destabilize the system. For instance, in [
28], it is demonstrated by using an FE model that the influence of damping on mode-coupling behavior can have both a stabilizing and destabilizing character. In one paper [
29], it is shown that the application of shims can lead to new unstable modes, and in [
30], a minimal model is described that becomes unstable only with the addition of damping. The experiments in [
31] also highlight a potentially destabilizing effect of damping, emphasizing the significance of the ratio between modal damping values in coalescing modes. A detailed theoretical explanation for this phenomenon is provided in [
32].
Therefore, the main objective of this paper is to fundamentally investigate the potential of additional damping in drum brakes—by applying, besides well-established tools like complex eigenvalue analysis (CEA), methods of time data analysis. To make clearly identifiable the influence of the later-applied additional damping measures, a commercial drum brake was modified by using an especially manufactured steel drum, so that its damping is significantly lower than the original brake with a cast iron drum. To determine the principal influence of damping, extensive tests were performed on this modified brake. Therefore shim materials have been applied to the drum and the brake shoes. The results obtained were then compared with simulation results. However, the aim was not to match them as precisely as possible but to investigate the capabilities of CEA [
33,
34] to include the influence of damping on drum brakes and to apply additional current methods of time data analysis in identifying squeal from experiments. It is essential to emphasize that simulating brake squeal solely based on linearized FE models (CEA) is not predictive. As demonstrated in [
28,
35,
36], accounting for nonlinearities is non-negligible when aiming for an accurate simulation of brake squeal. In fact, the analysis of the measurement results showed that the classification of the braking events into squealing and non-squealing was not so easy due to the test rig. Therefore, for the purpose of time series data analysis, techniques from the field of big data analysis and machine learning were used for the classification, resulting in an efficient identification of noise events.
2. Complex Eigenvalue Analysis (CEA)
In this section, investigations are described, on how damping measures can be applied to drum brakes and analyzed via CEA. For this purpose, a steel drum has been manufactured at the chair of Machine Dynamics and Mechatronics. This “academic” steel drum possesses a lower material damping than the commonly used cast iron drums, see investigations in [
27]. The aim is to assess the effectiveness of certain damping measures in order to reduce squealing events. The Finite Element (FE) model of a drum brake shown in
Figure 1 is a modified version of the model used in [
27]. However, the focus there was basic testing of the CEA with regard to drum brakes and modeling of the applied damping devices. Since the objective is now focused on test rig results to be analyzed by time series data analysis to be compared with the FE model, the general model from [
27] is adapted to the actual drum brake on the test rig. One of the main changes is that a simplex brake (bearing and actuation of shoes both on top and bottom of the brake) is used here and not a duplex brake (one shoe with bearing on top and actuation on bottom and the other vice versa) as before in [
27].
In one paper [
27], applying passive damping structures on drum brake components showed a significant improvement in noise behavior. Usually, thin composites, called shims in the automotive industry, are applied on pad back plates of disk brakes. They work by the constrained-layer-damping (CLD) mechanism [
37,
38]. In drum brakes, shims have shown to be effective when applied on the outer drum surface as well as on the brake shoes [
27]. Particularly, a shim consists of several layers, usually made of steel and elastomers. Due to the high stiffness differences between the layers, the elastomer is strongly sheared when the shim is bent. This leads to a high energy dissipation under dynamic deformation [
39].
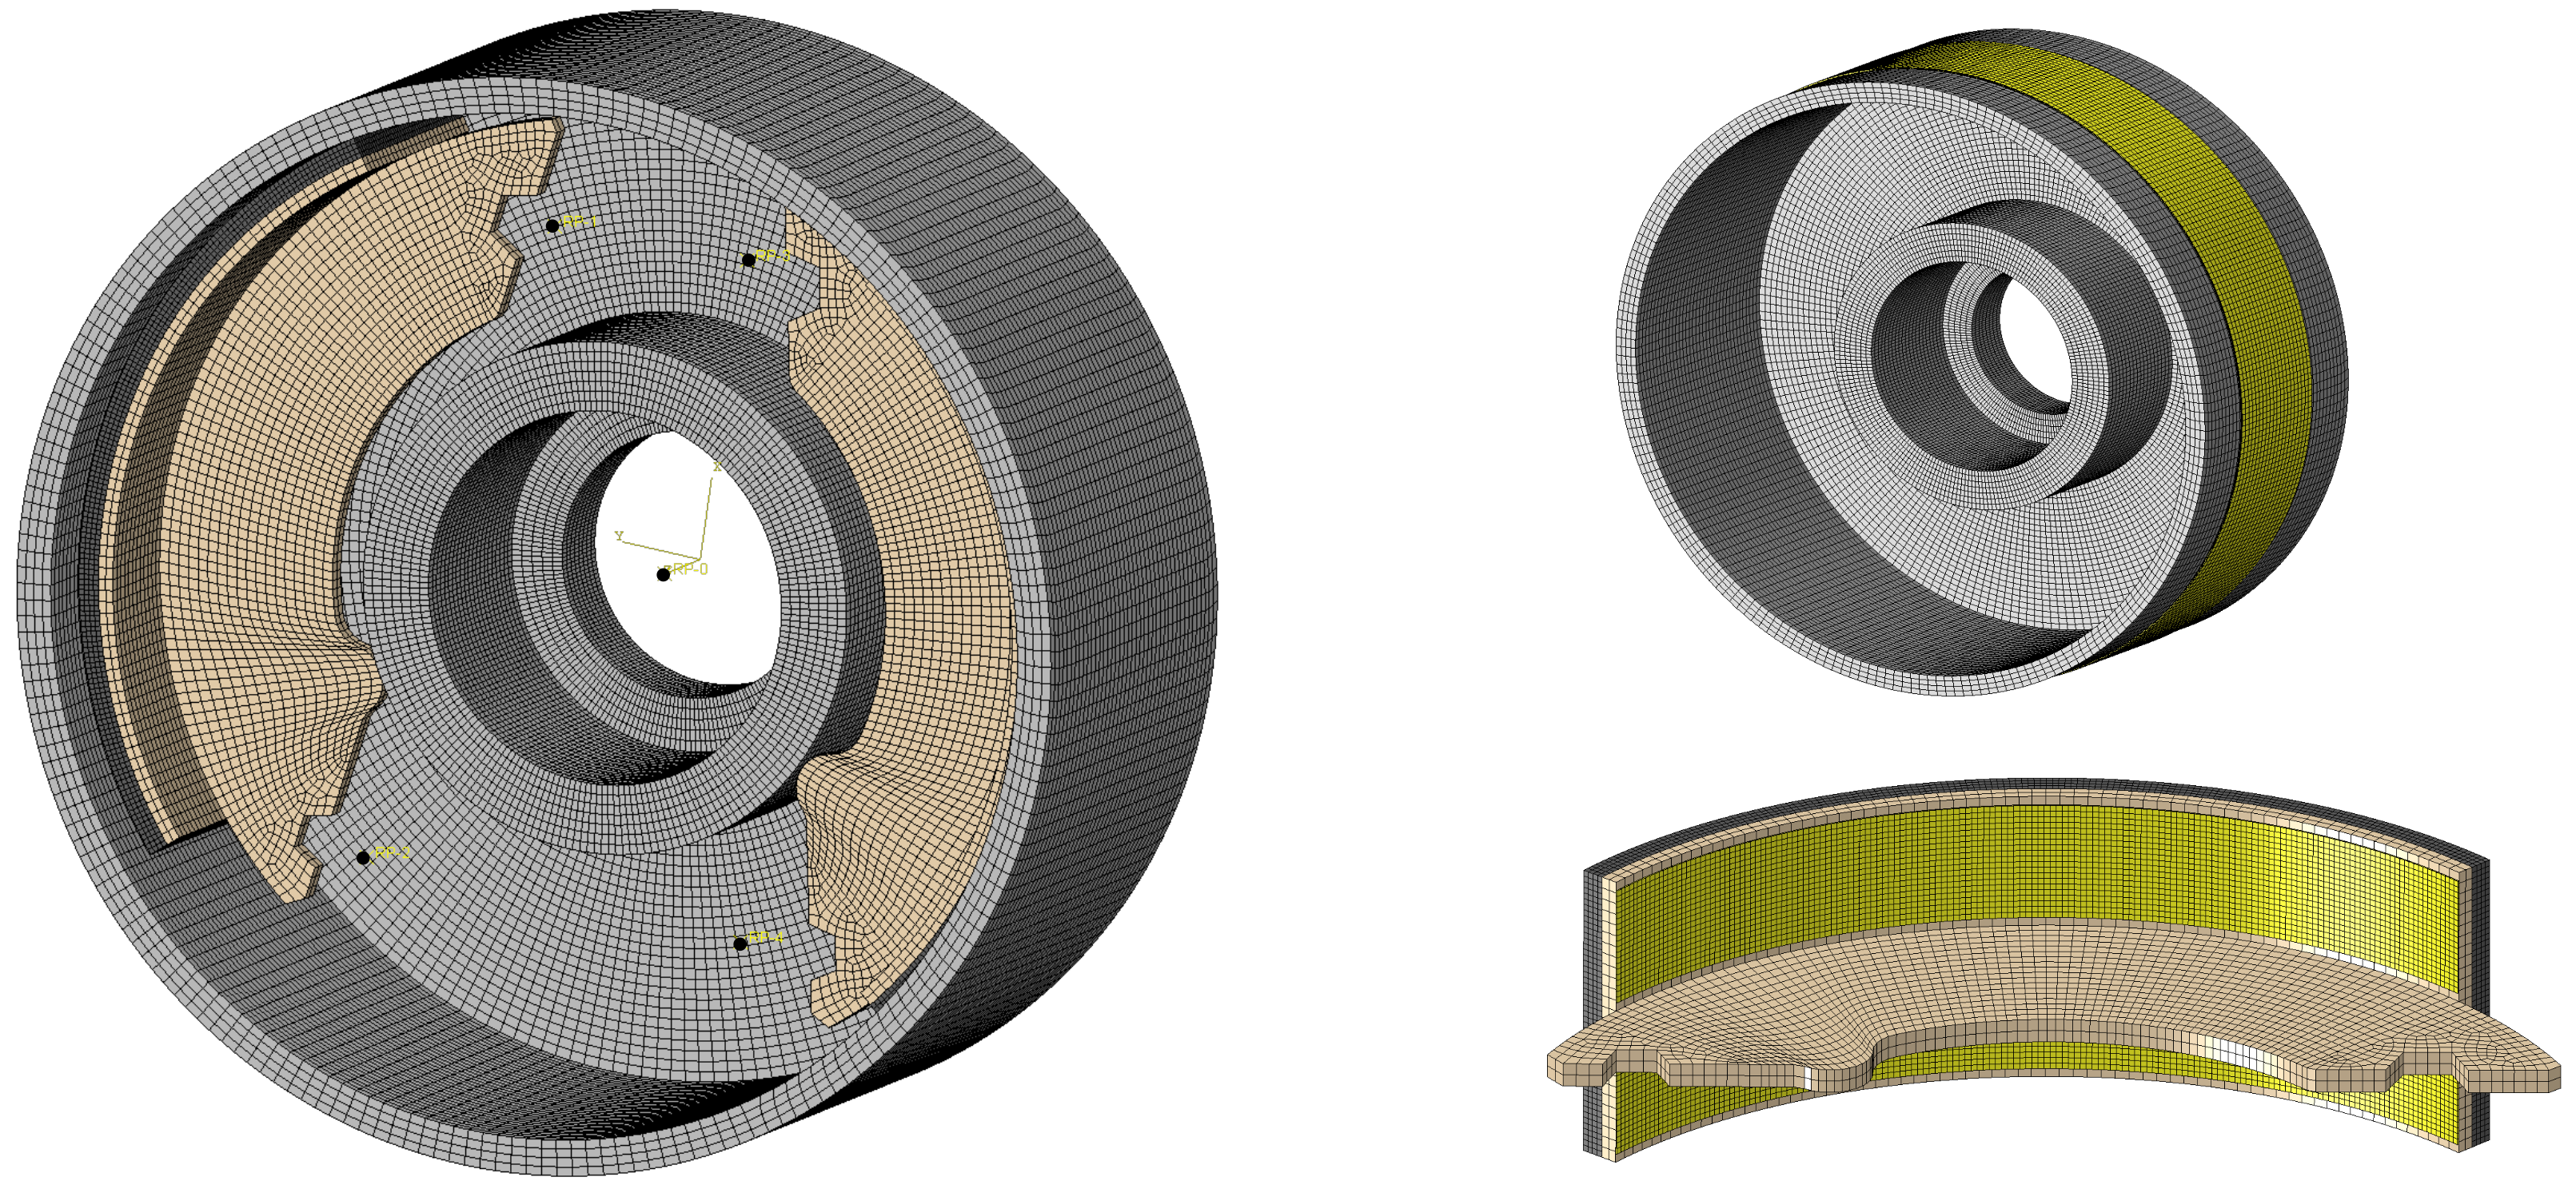
The FE model focuses on essential brake parts such as the drum, brake shoes, and lining considering a simplified geometry. Shims are applied on the drum surface as well as on brake shoes as shown in
Figure 1. They are attached using tie constraints. For meshing the brake parts, hexahedral solid elements (C3D20) are used. A convergence analysis was conducted, revealing that the drum, back plate, and shim components can be sufficiently meshed with a 2 mm element length. The lining, on the other hand, needs a 1 mm element length to accurately map higher mode shapes and prevent numerical problems such as significant distortions. Steel parts are modeled with isotropic material properties. The lining considers transversal isotropic material properties, where the out-of-plane direction behaves differently from the in-plane of the friction area. Details regarding material properties and natural frequencies of the brake components can be taken from [
27]. Three reference points (RP), one in the center of the drum and two on the bearing of each brake shoe are used to implement a pinned-pinned bearing arrangement between the drum and the brake shoes. The RPs are coupled with beam elements to the surface areas of the brake shoes to allow some elasticity. Another two RPs, coupled with the brake shoes, allow for the application of concentrated forces that represent the applied brake pressure. For this investigation, the force was selected to correspond to an applied brake pressure of 10 bar. This makes the simulation comparable to the conditions during the experimental study, where tests were conducted in the range of 6 to 30 bar. The friction contact between the drum and the lining material is based on a surface-to-surface formulation with a constant coefficient of friction at
. This is different from disc brakes determining the actual friction coefficient, which turns out to be difficult, resulting from the more complex shoe geometry and the self-reinforcing mechanism.
For all components made of steel, the density
and Poisson ratio
are used. Based on component tests already carried out and described in detail in [
27], the Young’s modulus of the drum and the shoe back plate was set to
and
. After this adjustment, a sufficiently good agreement concerning the natural frequencies cf.
Table 1 of these components could be achieved.
Identifying the material parameters of the lining material is a challenging task. A good overview of this topic can be found in [
40]. The used parameters in this model are shown in
Table 2.
Figure 1.
Finite Element simplex drum brake model and positioning of shims, modified figures compared to [
27,
41] changing from duplex to simplex drum brake.
Figure 1.
Finite Element simplex drum brake model and positioning of shims, modified figures compared to [
27,
41] changing from duplex to simplex drum brake.
The damping added to the system due to the application of the shims is implemented in the FE module using Rayleigh damping, which is a purely mathematical construct that weights the influence of the mass and stiffness matrixes to generate the damping matrix as
. Unlike modal damping, this formulation allows individual structural damping of different components. To determine the corresponding damping parameters
and
, an experimental modal analysis of the drum and the brake shoes has been conducted with and without additional damping. A comprehensive overview of the results of this investigation and how the damping parameters for the drum and the brake shoes are determined is provided in [
27]. The parameters used here are shown in
Table 3.
Complex Eigenvalue Analysis (CEA) is the prevailing simulation method within the automotive industry for assessing the squealing tendencies of friction brakes or examining modifications and their impact on squealing behavior [
42]. This standard procedure can be divided into four main steps which are described in more detail e.g., [
43,
44,
45]. The first step is a nonlinear static contact analysis whereby the brake pressure is applied and then the contact areas and forces are determined. The second step is used to calculate the friction forces using the Coulomb friction law. This considers both the rotation of the brake drum and the possible deformations of the contact surfaces. In the third step, the model is linearized at the previously determined equilibrium position, leading to the equation of motion,
Subsequently, the first
n normal modes are determined based on the mass matrix
and the symmetric part of the displacement-proportional terms
, which define the stiffness matrix (MK system). Using these results in the fourth step, a dimensional reduction of the entire MDGKN system is performed. Here,
and
refer to the damping and gyroscopic matrixes, and
denotes the non-symmetric parts of the displacement-proportional terms, i.e., the circulatory matrix. Finally, the eigenvalues and eigenvectors of the thereby reduced model are determined. Due to the skew-symmetric matrix N resulting from the non-conservative frictional forces between the lining and the drum, the linearized model may contain eigenvalues with positive real parts [
46,
47]. The corresponding imaginary parts are interpreted as potential squealing circular frequencies. Results of complex eigenvalue analyses carried out are compared in
Figure 2. The measures investigated correspond to the experimentally tested set-ups and are visible in
Figure 3: (1) the steel drum possessing no additional damping, (2) a shim ring applied on the drum surface, and (3) shims applied on both brake´s shoes additionally to the considered shim ring in (2).
Overall using shims leads to an improvement in noise behavior, by moving eigenvalues with positive real parts in the negative half-plane. Particularly the drum damping itself is very effective in the frequency range below 4 kHz. Adding extra shims on both brake shoes and drum (3) shows that all eigenvalues above 4 kHz could be shifted successfully to the negative half-plane. Nevertheless, there is an increase of positive real parts below 4 kHz in the (3) case.
3. Dynamometer Tests
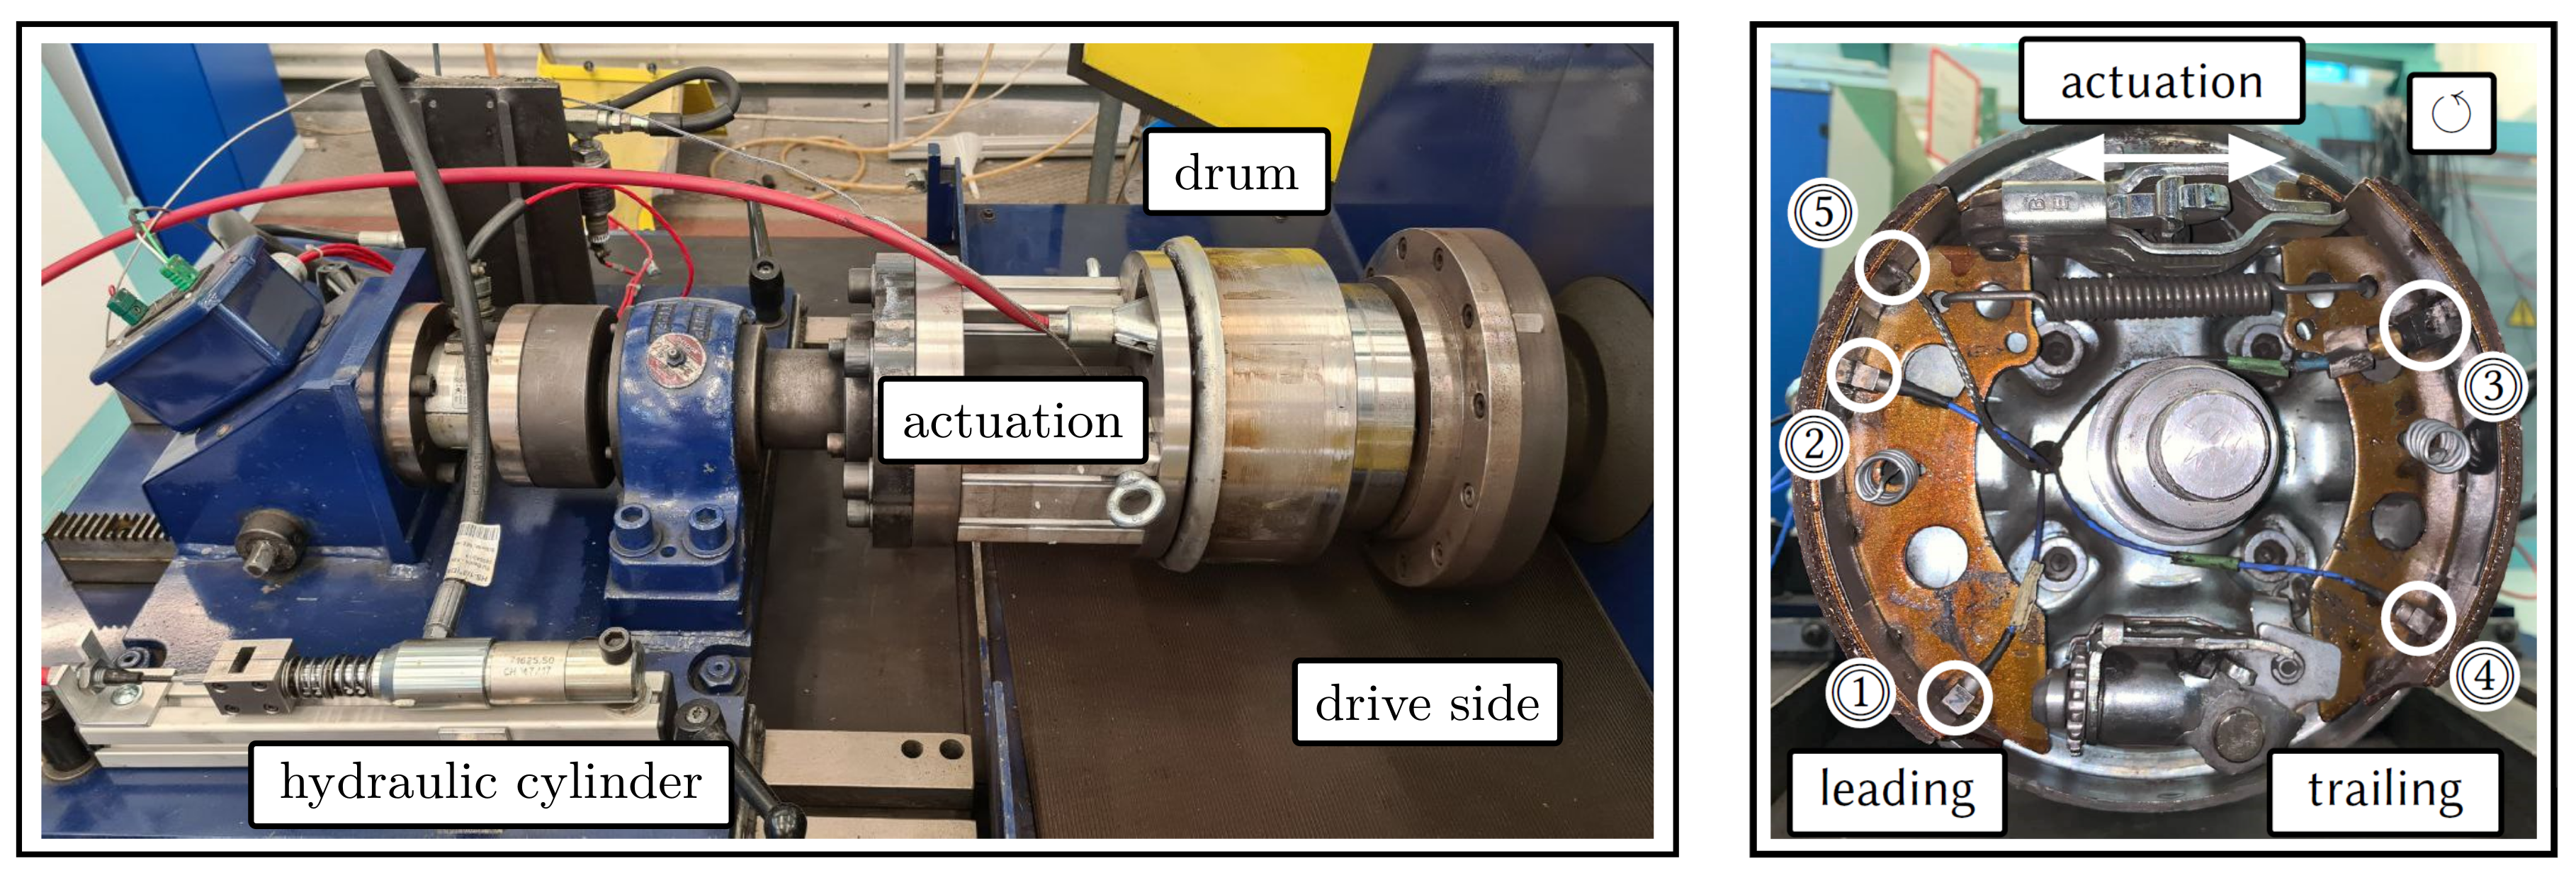
The test campaigns are carried out using the dynamometer test rig (Link friction tester model D 1500) at the Chair of Mechatronic and Machine Dynamics (MMD) at Technische Universität Berlin. The test bench is entirely automated and engineered to execute drag brakings with a maximum braking torque of 700 Nm. It can reach a maximum brake pressure of 206 bar and a maximum speed of 700 rpm. As control variables, can be utilized either speed, brake pressure (measured using an in-line torque cell), or temperature (measured via thermocouples at various points on the brake).
Figure 3 shows the investigated industrial simplex drum brake used in trailers, which consists of the steel drum of industrial parts. For actuating (spreading) both brake shoes, a lever mechanism is used connected to an external hydraulic cylinder via a Bowden cable. Four triaxial accelerometers (denoted by 1 to 4 in
Figure 3 right) are glued to the brake shoe surfaces for measuring time series data during braking (For all measurements three PCB 356A03 sensors and one PCB 356A33 from the manufacturer PCB Piezotronics Europe GmbH, Hückelhoven, Germany are used.). Accelerometers 1 and 3 measure the radial as well as tangential accelerations and vibration sensors 2 and 4 exclusively detect the tangential component due to limitations resulting from the number of channels in data recording. Additionally, a thermocouple type K (denoted by 5 in
Figure 3 right) suitable for a temperature range up to 1250 °C is used and positioned in a 4 mm deep blind hole located in the leading brake shoe.
The campaign contains exclusively drag brakings. These drag brakings are described in [
48] to be the worst case with respect to squeal, meaning that there is more time for the vibration to reach a squeal state. For investigating the squeal behavior of the drum brake the following three configurations (similar to those in
Section 2) are carried out:
drum brake without additional damping devices
four shims attached to the outer drum surface
shims applied to the drum and brake shoe surfaces
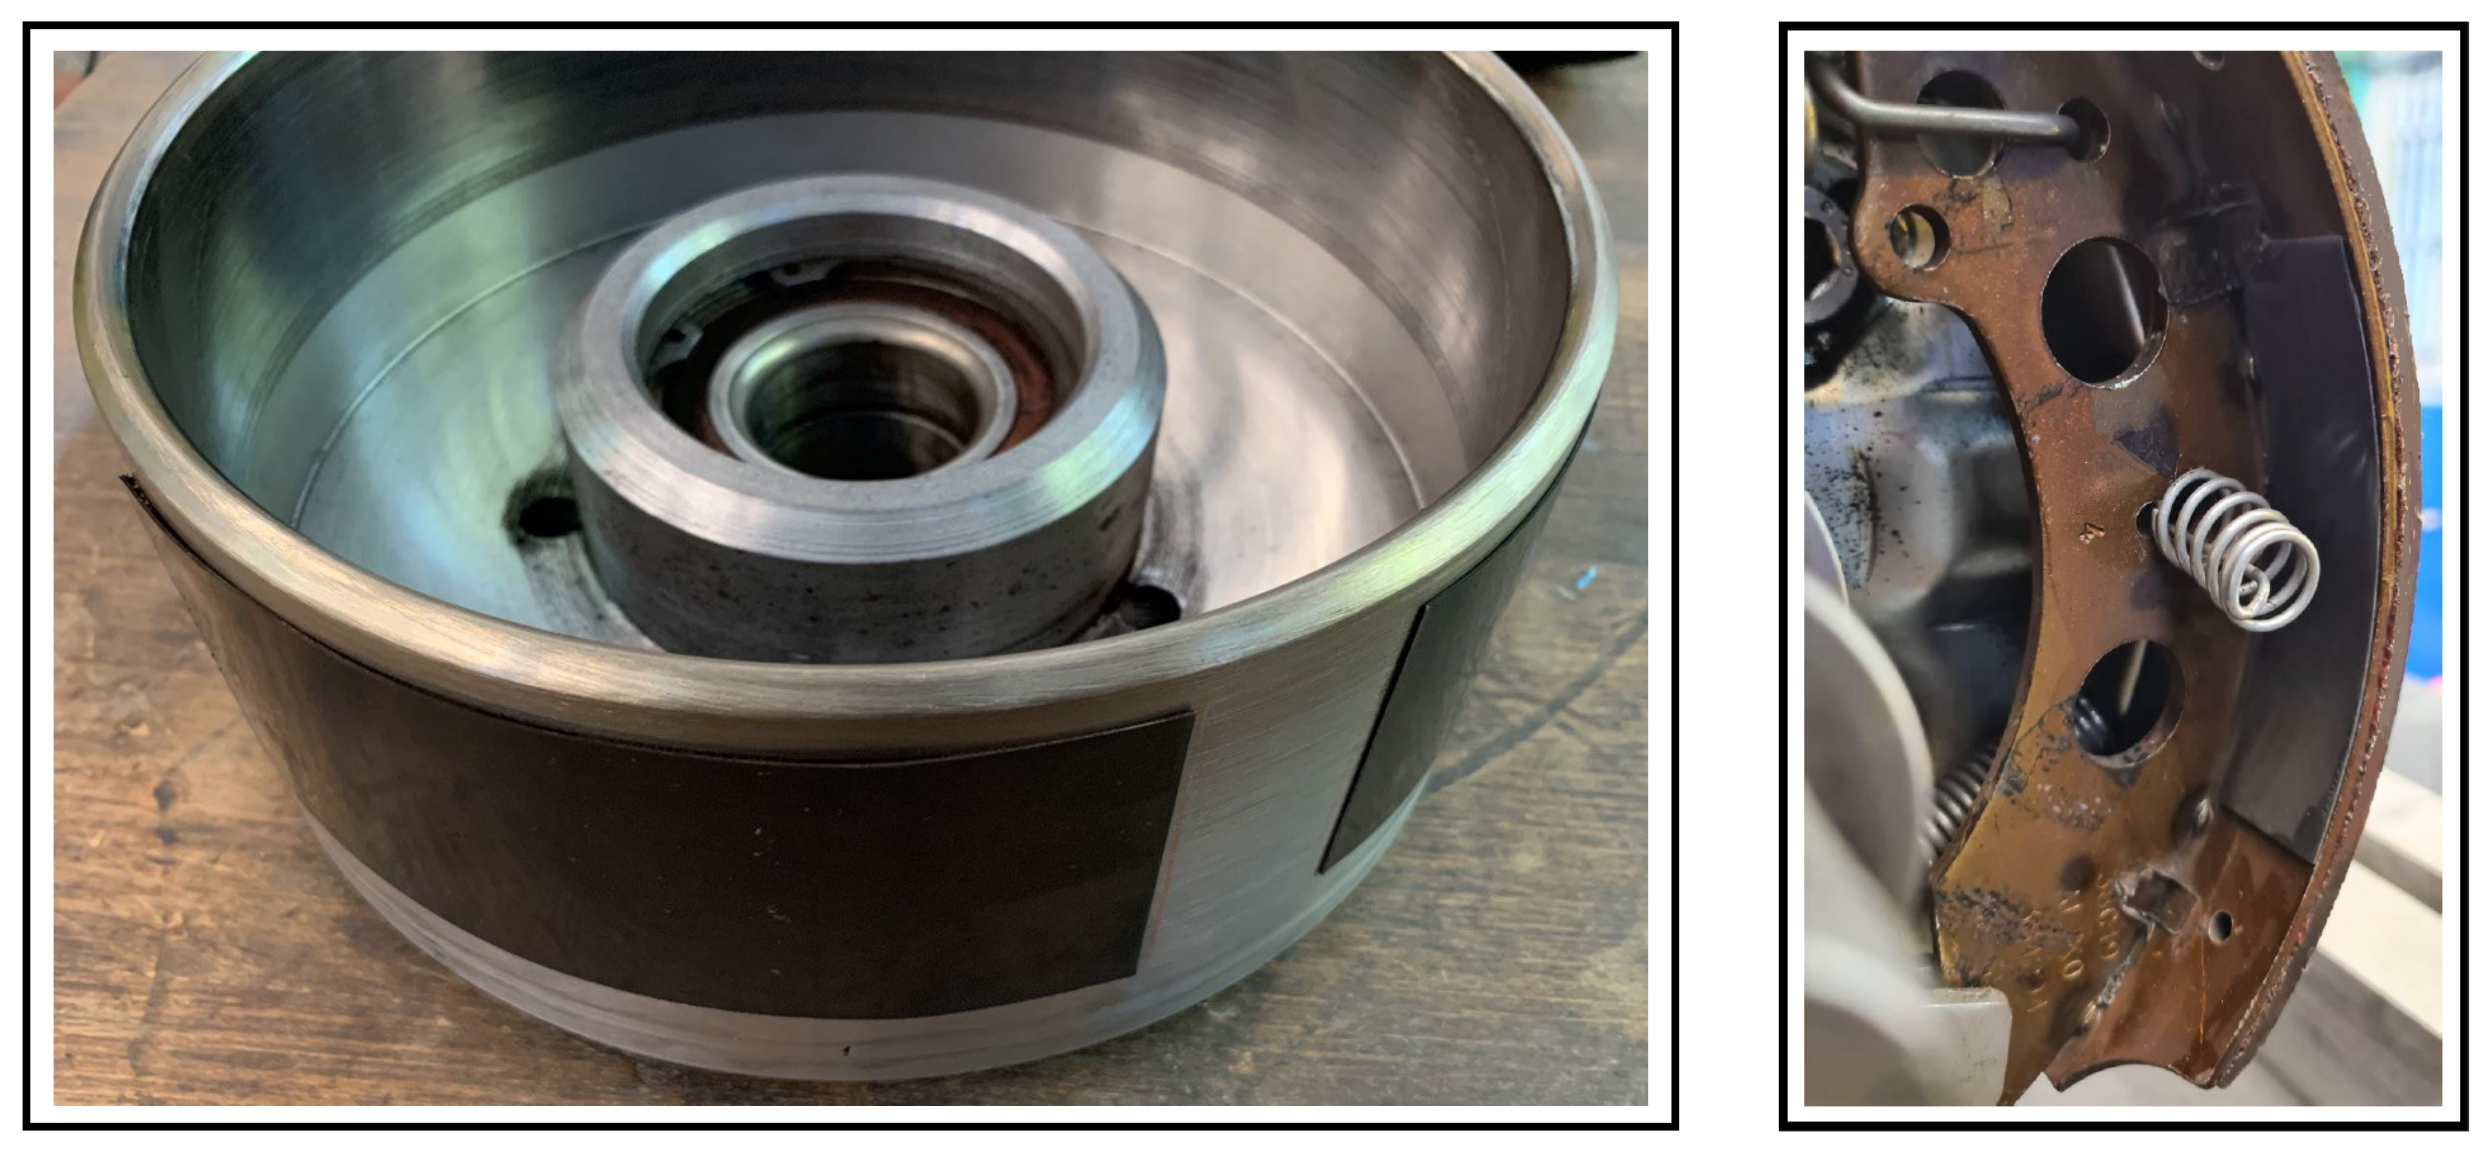
As already analyzed by the CEA in
Figure 2 the applied damping measures and their positioning on the outer drum as well as brake shoes can be seen in
Figure 4.
Operation parameters recorded during a brake event are brake pressure, torque, and temperature. It should be noted that the braking pressure here does not act directly on the brake shoes; instead, it is transmitted via a mechanism using a hydraulic cylinder and a Bowden cable. Due to the choice of the used piston diameter, the brake pressure corresponds to that in conventional automotive disc brakes. A test cycle includes five different speeds, each considering 10 constant pressure levels, thus obtaining 50 braking operations per test cycle. The target temperature for each brake application is specified at 80 °C. Thermal issues due to the closed drum brake design could affect the applied sensors. Therefore, tests at higher temperatures were not performed. All test parameters are listed in
Table 4. It is widely recognized that achieving repeatability in measurements related to brake squeal is challenging. In general, even under precisely identical operating conditions, brakes may squeal intermittently. For this reason, a large number of measurements were conducted under identical conditions to facilitate a statistical evaluation. To mitigate temperature fluctuations, numerous short brake tests were conducted with consistent initial temperatures. Furthermore, to minimize the influence of wear, pre-conditioned brake pads were used.
Ten identical and sequential braking cycles—500 braking operations in total—are carried out for the configurations (1), (2), and (3). For reaching the specified temperature, deceleration brake applications at 10 bar are used to warm up the brake from room temperature. General details about dynamometer tests can be found in [
49].
Time data during braking are measured after one accelerometer signal exceeds a threshold level (amplitude) of 3
for detecting brake events. The rotation direction is anticlockwise as drawn in
Figure 3 right. A change of rotation direction and its effects are not considered in the investigations and are not expected to have an impact on the investigations due to the simplex design. Time series are recorded 3 s before and 20 s after triggering with a sampling rate of 50 kHz. The 3 s pre-trigger is enabled due to the usage of a circular buffer.
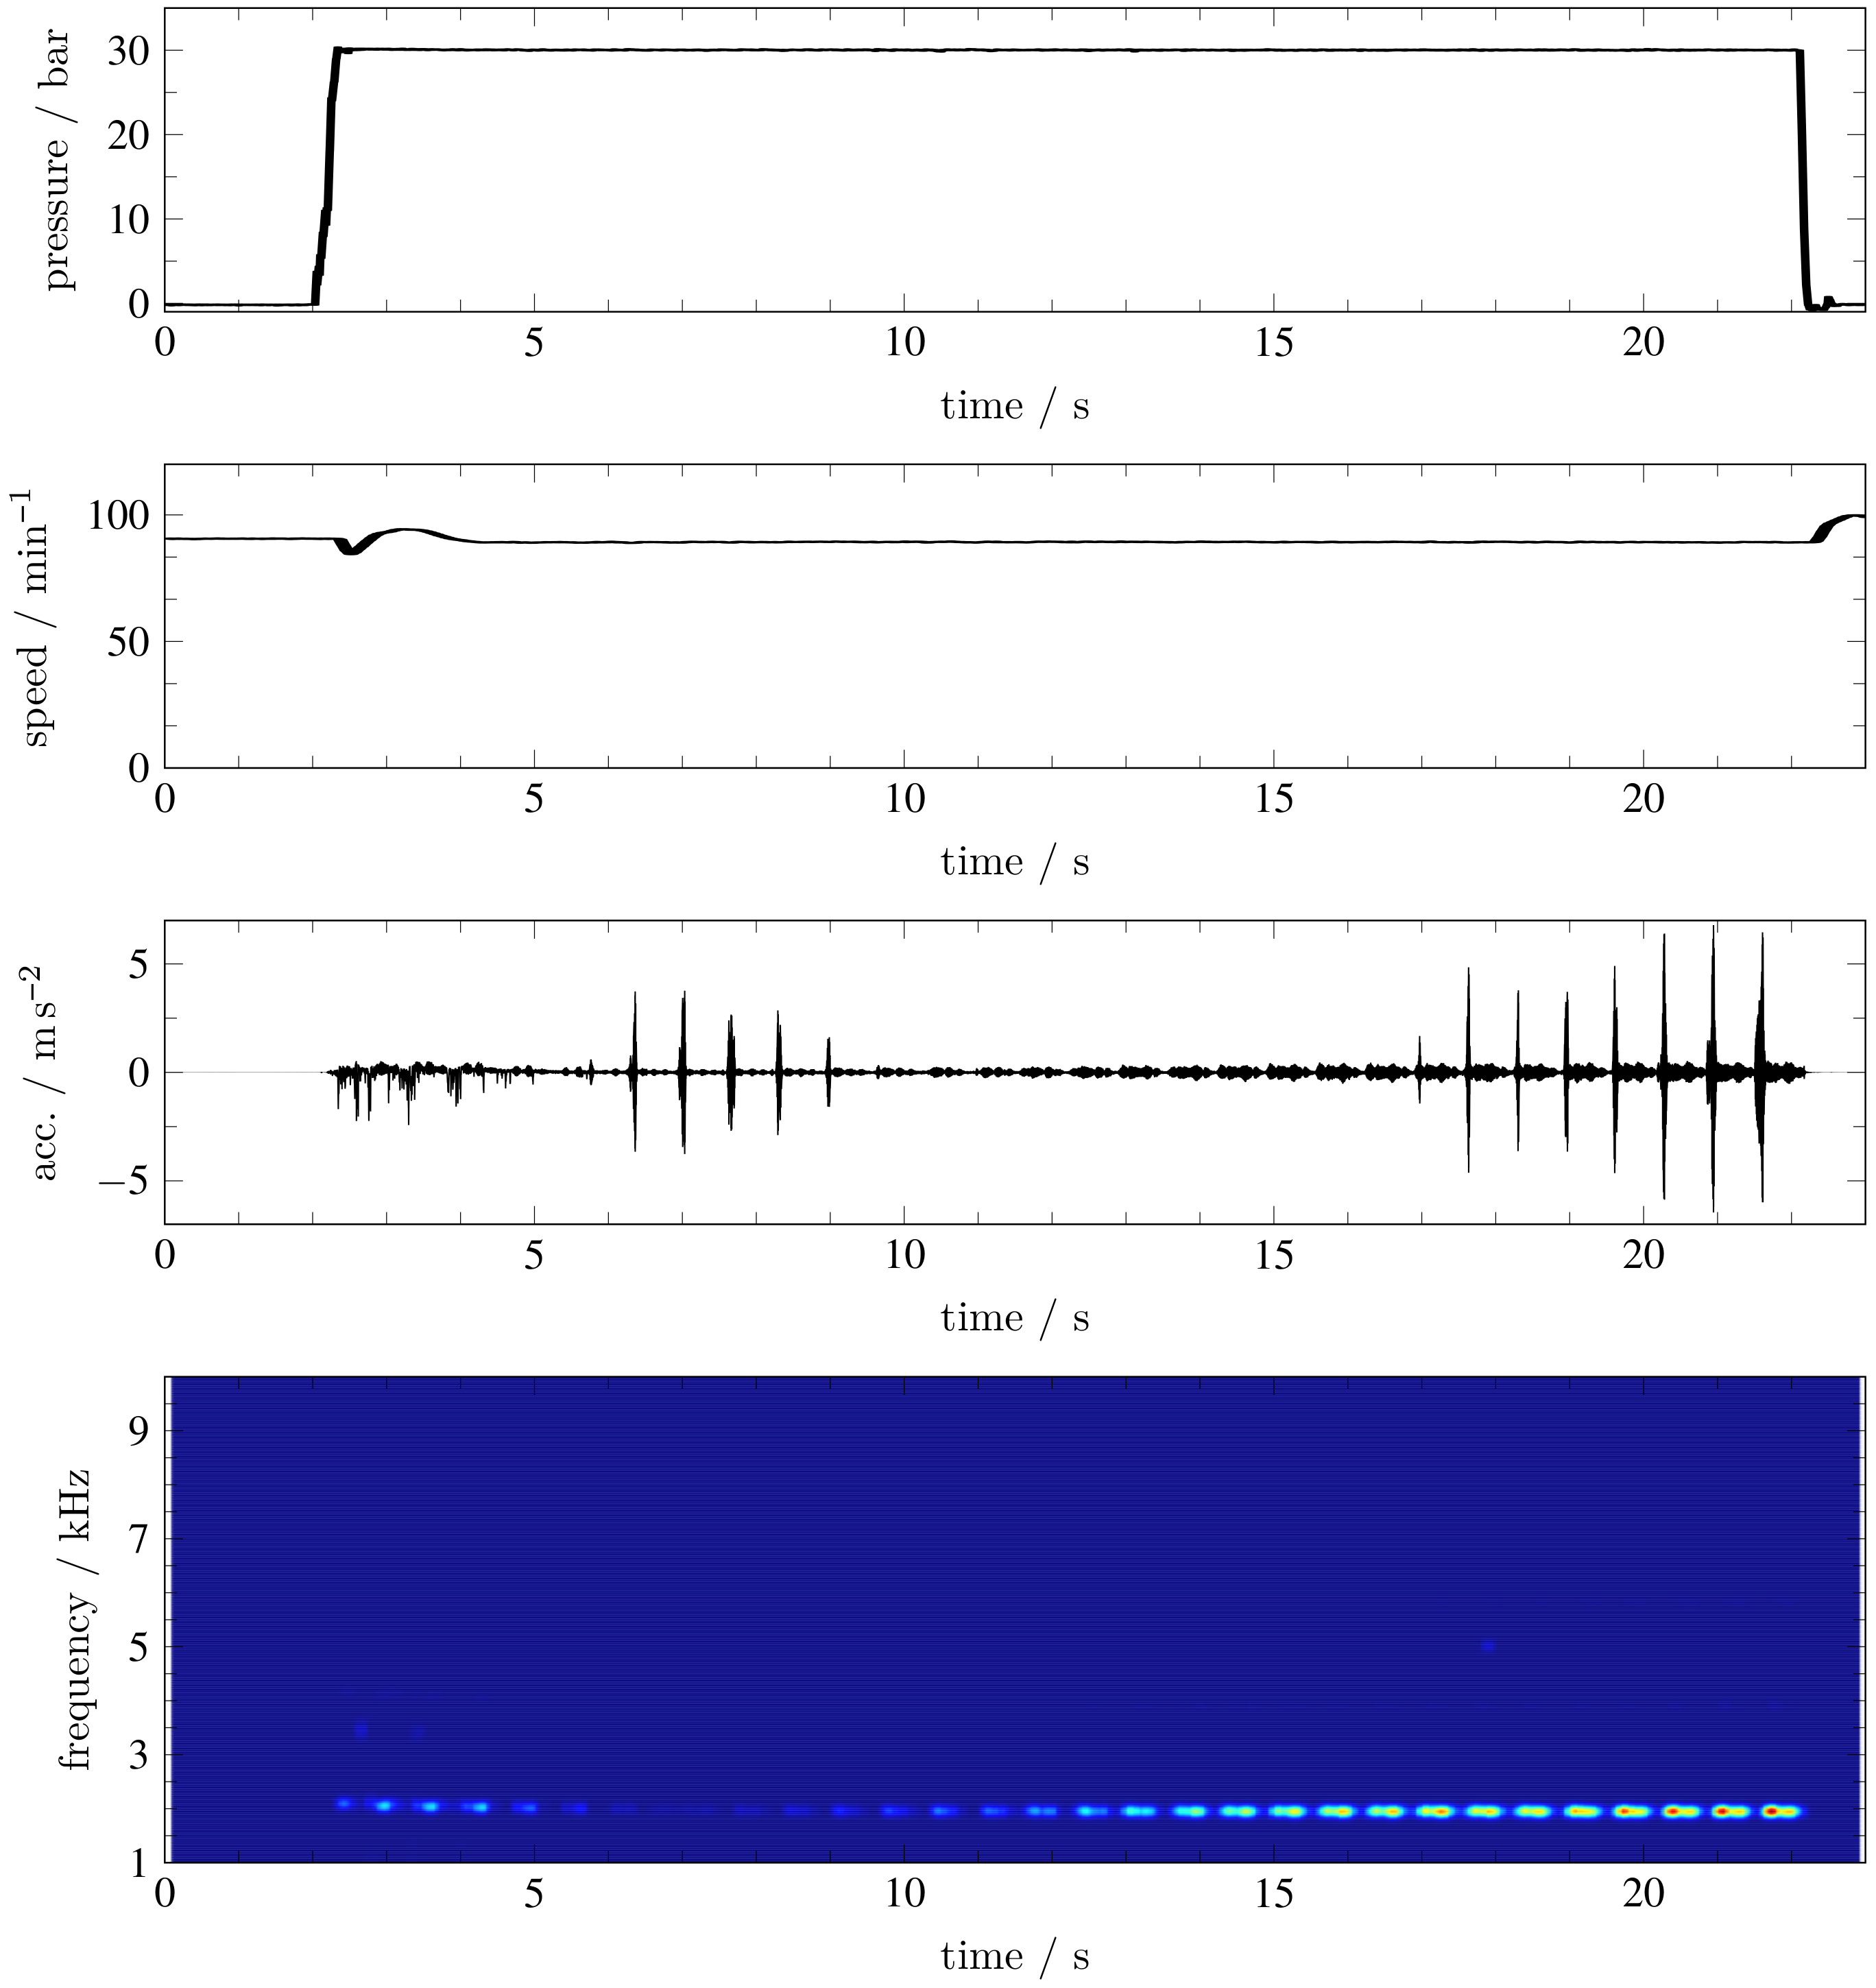
Figure 5 visualizes measured quantities such as pressure, speed, and acceleration (
Figure 3, accelerometer 4).
4. Data Analysis of Dynamometer Results Using Machine Learning
To analyze the measurement results, it is necessary to classify each braking recorded into squeal or non-squeal events. As described earlier, each measured event is approximately 23 s long including the time series of brake pressure, drum speed, and six acceleration signals at different positions and in different directions located on the brake shoes. An example event is shown in
Figure 5, where the braking begins at approximately time
s and correspondingly squealing starts with a dominant frequency of 2 kHz. The brake pressure varies correspondingly and speed fluctuates slightly as a result. Since the goal of this analysis is to obtain a detailed result about the squeal behavior of the brake, each event is divided into sections of 2 s. To exclude sections in which the brake is partially inactive, all sections with a brake pressure of less than 1 bar or a speed of less than 1 rpm are deleted. For each test scenario, this results in more than 20,000 measured 2 s long events that have to be classified based on their squealing behavior.
According to SAE J2521 [
49], the detection of squealing events is usually performed by analyzing microphone data. For this purpose, amplitude threshold values are defined in the spectrum of such a signal, where exceedance is interpreted as squeal. Since sound measurements on the test rig used here are hardly possible due to the high noise levels, acceleration signals are used instead. For a first attempt to classify the data, the method described in SAE J2521 was adopted and applied to the acceleration signals instead of the sound data. Therefore, the maximum peak in the frequency spectrum of the time signals recorded by the accelerometers was calculated. However, this attempt was not successful because there was no clear correlation between a specific value of height, that separated the data from squealing and no squealing. The possible reason for this might be, that in contrast to what is advised in SEA J2521, microphone data could not be used here. But even with available sound data, the automatic detection and classification of typical brake sounds is, according to [
50], a challenging task.
Basically, this is a classic time series classification issue. The goal in the following is to determine whether the brake is squealing or not using the measured time series (acceleration signals). To overcome this problem, different supervised feature-based classification algorithms are tested. An overview of those methods is given in detail in [
51]. Feature-based in this context means that the classification is not based on the high-dimensional time series of several sensors but on several one-dimensional features, e.g., the maximum amplitude. To achieve an adequate result, it is necessary to choose these features in such a way that they (at least somehow) represent the relevant information in the time series. The algorithm itself is based on a model using these features as input and determines as output, whether the investigated time series contains a squeal event or not. The term “supervised” in this context means, that the model is trained with data that are already classified. The algorithms tested in this paper are K-Nearest Neighbors [
52], Multinomial Logistic Regression [
53], and Random Forrest [
53].
This choice and the code created for this purpose is partly based on the Master’s thesis by Memmel [
54]. In her Master’s thesis, Memmel used the above-mentioned techniques to classify existing measured time series data of a bistable oscillator with respect to several characteristic properties.
The use of machine learning to classify squeal in measurement data is not state-of-the-art, but there are already some promising attempts in this field. In one paper [
50], for example, spectrogram images of microphone data are analyzed with the help of an AI that is optimized for image recognition. The procedure described therein is very successful even if it seems to be unusual to use image recognition for this application. In another work [
55], various parameter-based classification algorithms are used to predict the squeal behavior of a particular brake system. There, however, the time series of the recorded squeal is not used directly, instead external parameters such as brake pressure, speed, or temperature.
Other very interesting papers related to the analysis of time series data and friction-induced oscillations are [
56,
57]. In this work, transitions in friction-induced oscillations (FIV) are studied experimentally. Advanced time series analysis techniques are used to investigate the transition from steady-glide to high-frequency FIV in various samples. The results contribute to the further development of nonlinear dynamics tools for identifying and characterizing different friction scenarios.
These approaches demonstrate significant potential for detecting squealing events. However, in this paper, we will evaluate the effectiveness of feature-based classification algorithms as an alternative method for squeal detection, particularly when using test benches that are not specifically optimized for NVH analysis.
For the current paper, the pre-classification of the training data has been carried out “manually” by listening to the time series of one of the acceleration signals. For this purpose, the time series were played out unfiltered via a loudspeaker, considering the sample rate used during measuring. Using this method, 10% of all three test configurations as described in
Section 3 have been labeled and then used for training and testing the model. Given the time-consuming nature of this task, the data underwent manual classification only once. Consequently, it is not feasible to provide a precise assessment of the method’s reproducibility. However, the experience gained during the classification process indicated that distinguishing between squealing and background noise was quite achievable. In addition to the time series of the acceleration signals, the time series of the brake pressure, the rotational speed, and the temperature are also available. The choice of the input parameters used in the model is essential for its behavior. If, for example, the data related to the brake pressure and the rotational speed are also taken into account, a model is created which allows predictions about the basic squealing behavior of the tested brake with respect to certain pressures and speeds area. This would be an interesting approach. However, in the study presented here, the aim is not to classify a particular brake, but to develop the first step of a generally applicable model that only classifies whether squealing happened during braking or not. For this reason, only the features that are calculated from acceleration signals are used as input parameters here. For some of those features, it is necessary to calculate the frequency spectrum or the autocorrelation of the previous time series. In total, the 11 features listed in
Table 5 are used as input for the model. More details on the definitions of these features are described in [
58].
Figure 6 shows three exemplary box-plot features of the labeled data. Since the features are separated into squeal and no squeal, it is possible to obtain a first impression of the correlation between them and the squeal behavior. The strongest correlation is shown for the maximum peak of the FFT. However, it is noticeable that also for this parameter, there is a maximum peak range, where squeal and no squeal events occur. This shows that this single feature is not sufficient to classify all events reasonably. Therefore, the supervised classification algorithm, which takes into account multiple features, is a significant improvement.
Since the numerical values of all calculated features deviate from each other in a large range, they have to be normalized for a working model. After preparing all measured data by extracting the defined features, the pre-labeled data were separated in test and training data sets and used for training and testing the model. For testing, the trained model has been applied to all test data sets and the prediction accuracy was evaluated. The best result with a 94.5% match has been achieved by using the K-Nearest Neighbors model. This result is a significant improvement compared to the first tests where only one parameter has been considered.
5. Results
Using the K-Nearest Neighbors model, all three test configurations were evaluated. All recorded events were classified as squealing or no squealing. It turned out that in the first test series, in which no additional damping was applied, 40% of all events were categorized as squealing. This is very high value compared to commercial drum brakes and the simple reason is that the “academic” steel drum investigated possesses a significantly lower material damping compared to industrially used cast iron drums. It should be noted that this effect is intentional and favored in the context of this test series in order to prove the effectiveness of additional damping measures. In test series (2), in which the damping of the drum was increased by applying shims on the outer drum [
27], the squeal rate could be halved to about 20%. The evaluation of the third test series (3), where shims were also applied to the brake shoes additionally to the drum, showed that there has been no significant further improvement of the squealing behavior compared to test series (2). This result clearly shows that the damping of the drum is very successful in avoiding squeal.
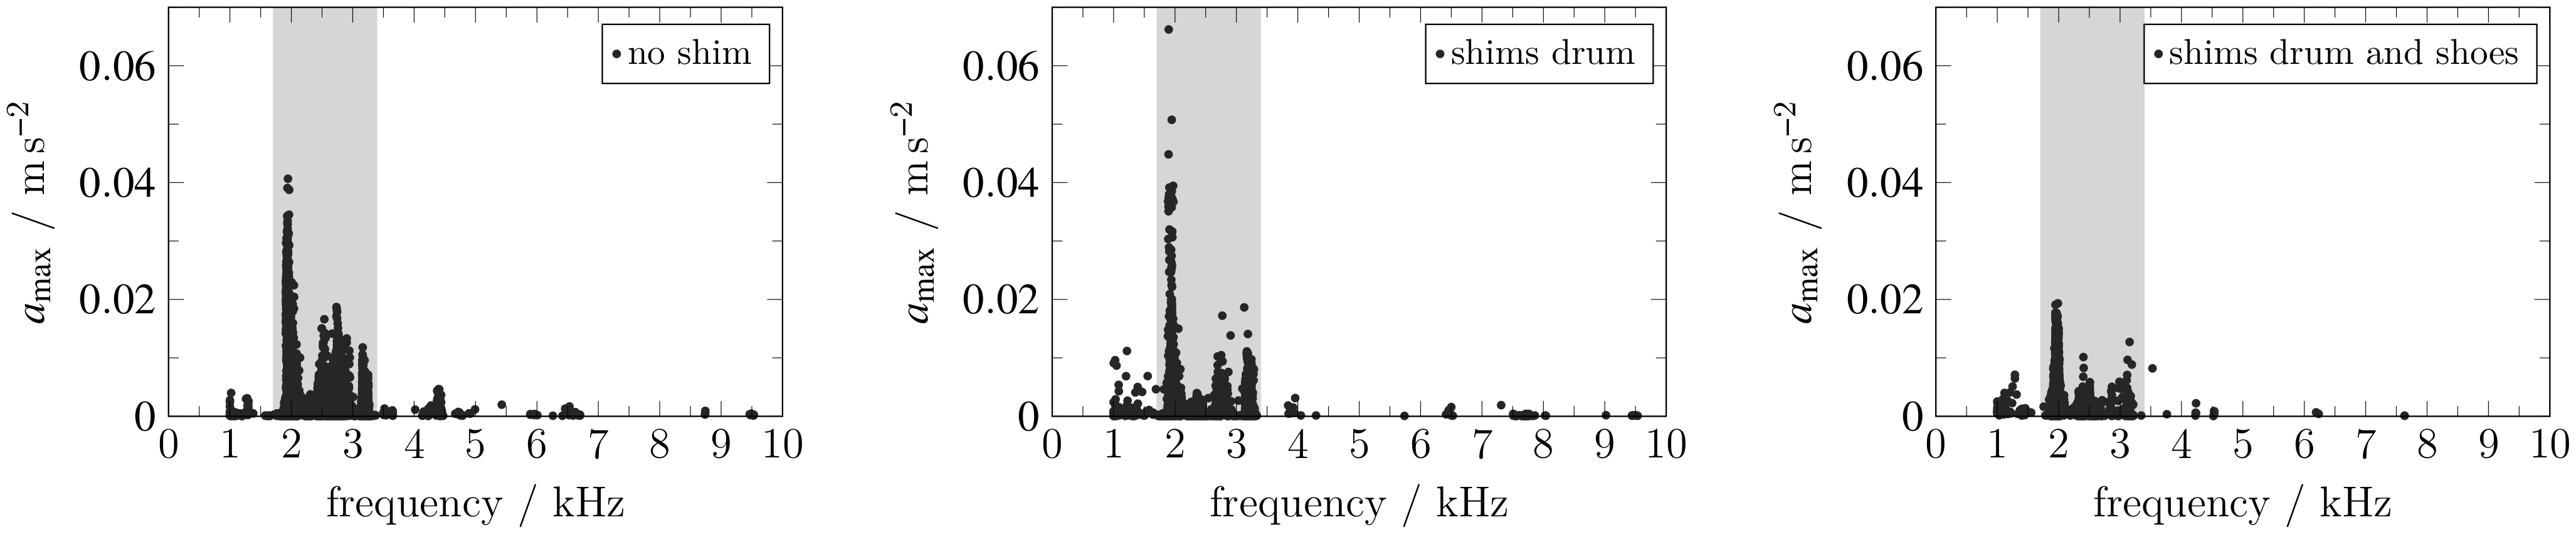
Figure 7 shows all squealing events, detected by the K-Nearest Neighbors model, separated according to the three test configurations (1), (2), and (3). Therein the maximum peak
in the considered frequency range can be seen, interpreted as squeal frequency and squeal intensity. It can be seen that most of the squealing events occur in the frequency range between 2 kHz and 3.5 kHz. The comparison of the three test scenarios clarifies that the squealing intensity could be reduced by applying additional damping. In particular, the damping increase at the brake shoes leads to a significant reduction of the squealing amplitude.
However, this presentation is not suitable for evaluating the probability of squealing events. Therefore, corresponding histograms are shown in
Figure 8. These histograms illustrate the percentage of the respective frequency of squealing events related to the total number of events measured. This plot visualizes that increasing the drum damping significantly reduces the squeal tendency in the entire squeal frequency range. However, the squeal events at approx. 2 kHz could not be reduced and even slightly increased. A similar behavior can be seen with the additional damping added to the brake shoes. A further reduction of squealing events in the squeal frequency range above 2 kHz can be observed. However, an increase in squealing events at 2 kHz is attended by this. This behavior can be elucidated by the damping paradox phenomenon outlined earlier, in which, under specific conditions, an increase in damping has an adverse impact on stability.
In summary, the following interrelations between the damping and squealing behavior can be established.
damping the drum reduces the probability of squealing events.
additional damping reduces the intensity (loudness) of squealing.
there may be individual squealing frequencies where corresponding events cannot be avoided by the applied kind of damping.
As described, all three test configurations are performed at defined pressure levels allowing us to investigate this influence in detail.
Figure 9 shows the percentage of the respective frequency of squealing events, referring to the total number of braking events including all three test configurations that are classified according to the brake pressure. The plot clearly depicts that the positive influence of the additional damping mainly plays a role in the lower brake pressure range. Overall, these results show that adding damping by using shims can significantly improve the squealing behavior of drum brakes, for the brake system under study, especially for squealing at lower pressure levels.
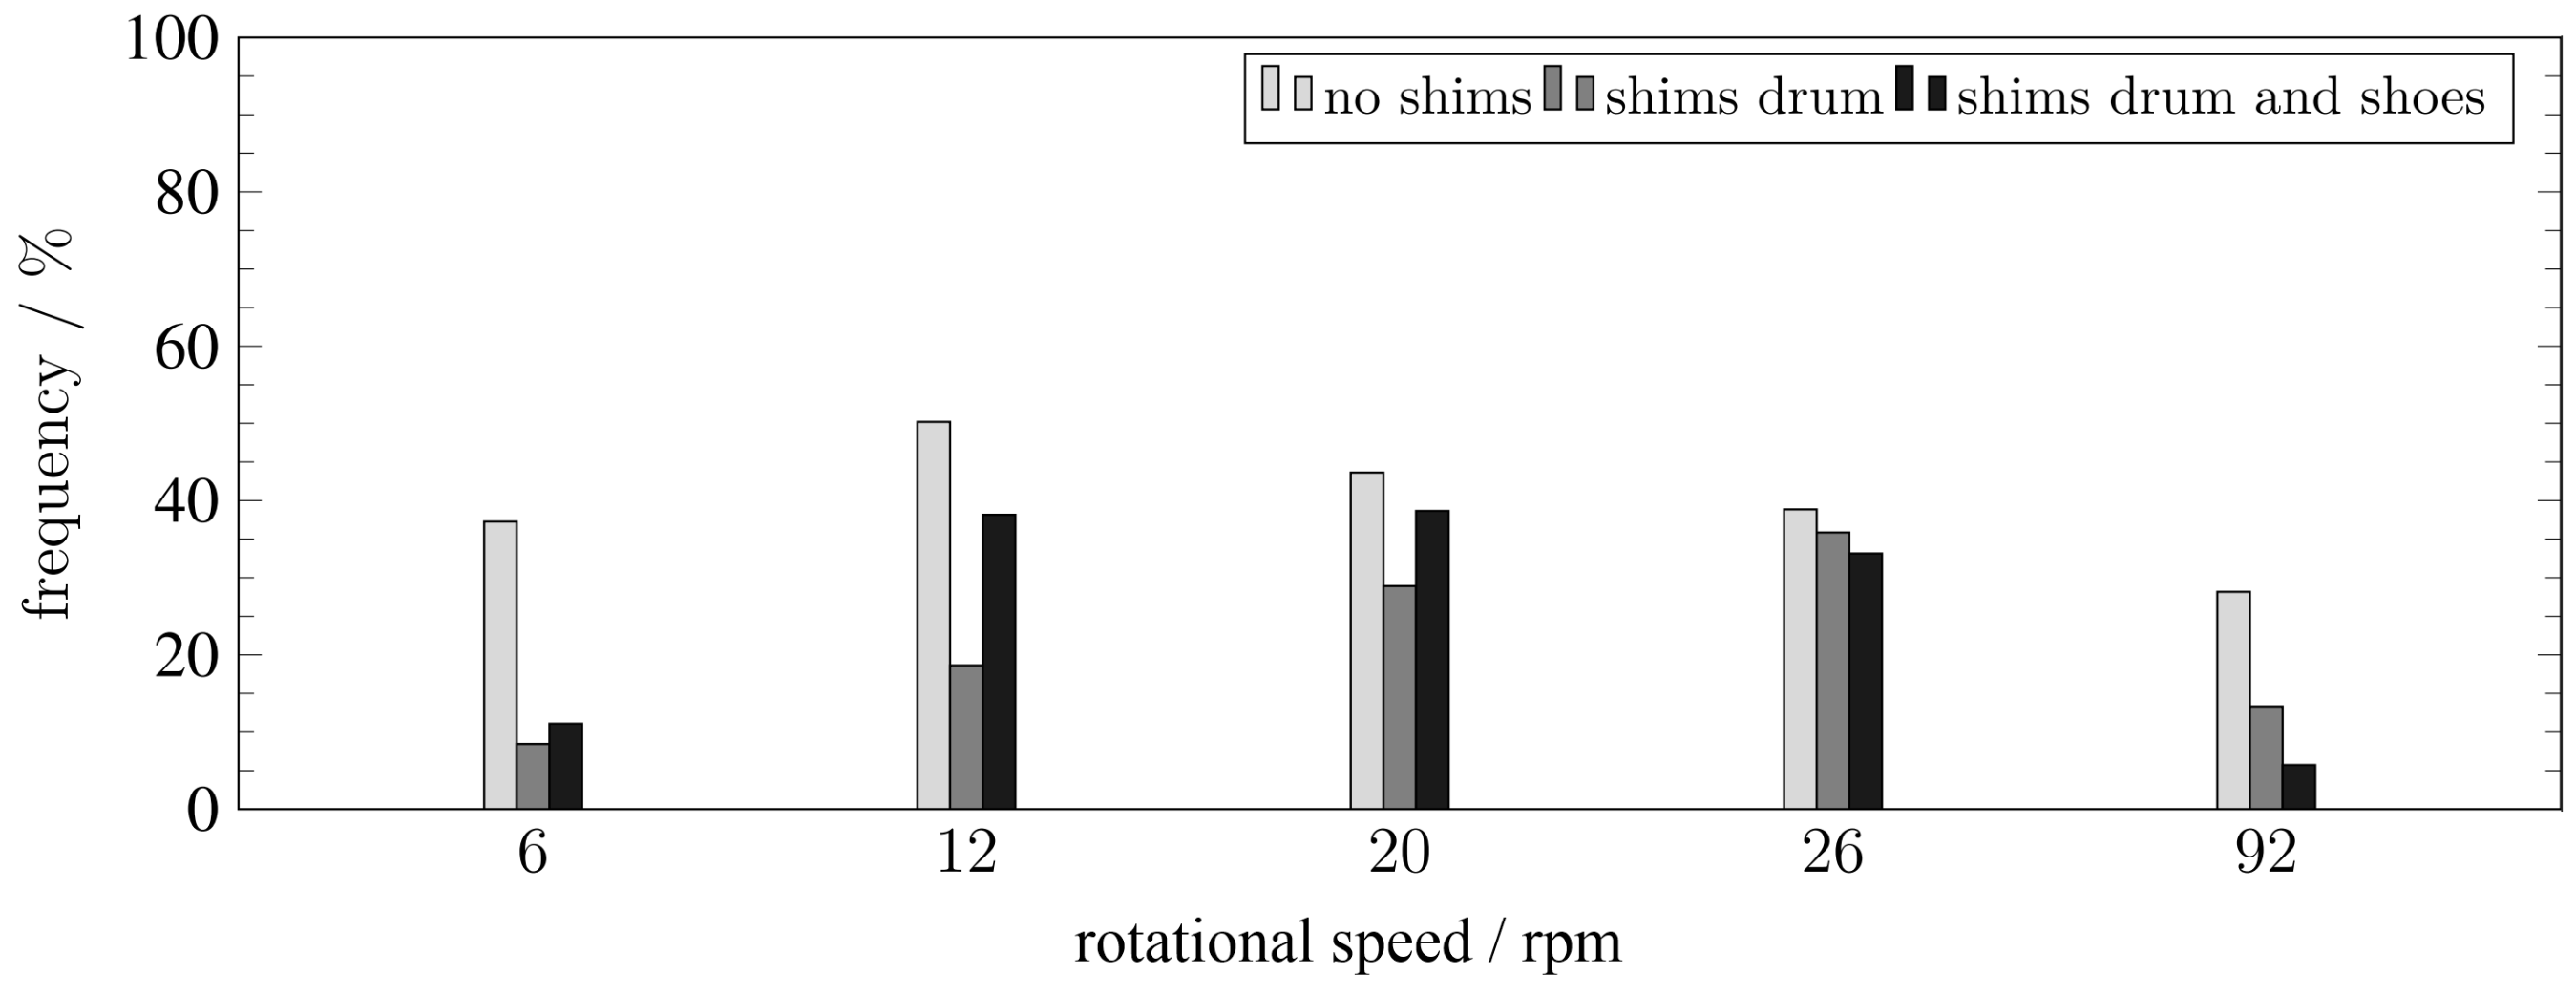
Figure 10 shows the percentage of the respective frequency of squealing events, referring to the total number of braking events related to the speed levels considered. This clarifies that the influence of the additional damping is also strongly dependent on this parameter.
When comparing the results obtained from the test bench with those of the simulation (
Figure 2), it is essential to consider that the simulation does not accurately replicate actual squealing behavior. This limitation stems from the fact that Complex Eigenvalue Analysis (CEA) exclusively assesses the stability of the trivial solution and disregards the nonlinearities that are necessary for determining limit cycle behavior. Consequently, making a direct comparison becomes challenging. For this reason, CEA often tends to be overpredictive, as the presence of a single eigenvalue with a positive real part already indicates instability in the occurrence of self-excited oscillations. In cases where multiple eigenvalues exhibit positive real parts, the nonlinearities within the system determine both the amplitude and frequency of the limit cycle solution [
36]. In practice, eigenvalues with positive real parts are often used as an indication of potential squealing frequencies, with the magnitude of the real part serving as an indicator of amplitude or probability.
The measurements clearly indicate that the predominant squealing frequency of the drum brake is approximately 2 kHz, and that the probability of squealing at this frequency is not significantly affected by the additional damping measures
Figure 8. However, this is not the case for the remaining measured squealing events at 2.4 kHz, 2.7 kHz, and 3.2 kHz, as they decrease significantly with an increase in damping. The lowest squealing frequency identified by CEA, featuring a substantial positive real part, is at 2.3 kHz. The real part of this eigenvalue significantly decreases when additional damping to the drum is applied (2) (
Figure 2). This is also the case for the eigenvalue at 3.5 kHz. However, the application of further additional damping to the brake shoes (3) results in eigenvalues at 2.3 kHz and 3.4 kHz appearing with a positive real part. A consideration of the measured squealing events above 4 kHz shows that they disappear when additional damping is applied to the drum and shoes (3). This is also reflected in the real parts of the eigenvalues in this frequency range. In general, however, the influence of damping is partly comparable. It can be seen that an increase in damping leads to a significant improvement in the squealing tendency in the higher frequency range of the CEA model. At low frequencies, on the other hand, the influence of additional shims is not clear. The measurements also show that the influence of the damping on the squealing behavior is strongly dependent on the brake pressure and the rotational speed. Since these were not varied in the simulation due to too much computational effort required for this, a valid comparison is not possible. The overall result is, that even taking into account the external parameters, the squealing behavior of the brake can only be determined as a tendency from the measurements and the simulation is only very partially capable of representing reality.
6. Conclusions
The paper aimed to analyze the behavior of a drum brake with respect to squeal and considering damping measures. For simulation, an FE model was developed and the measurement results were analyzed using different measures from time series data analysis. All results show that damping measures by applying shims can improve the squealing behavior of the considered drum brakes significantly. In particular, the application of shims on the outer surface of the drum has a significant influence. This possibility of squeal optimization is only possible in drum brakes (as shim elements cannot be applied to brake disk surfaces) and should be further taken into consideration. However, the results also show that a quantitative evaluation of an improved squealing behavior proves to be difficult. The results clearly underline that many measurements are necessary to investigate the influence of special countermeasures.
A major improvement for evaluating measurement results is the use of the applied supervised feature-based classification algorithm. Even if the preparation of the training data initially requires a large amount of effort, the identification of squealing events could be significantly improved. In addition, the created model could probably be used directly for similar test evaluations without re-training. In particular, it has been shown that reliable statements regarding the squealing tendency of brakes are possible even when using a simple test rig that has not been optimized for NVH testing and even if the recorded signals contain significant noise influences coming from the test rig. This could also be interesting in terms of measurements on vehicles where usually high-level disturbing noise occurs, which is not related to squeal.
The results of the CEA show that the damping discussed here can in general be taken into account in the state-of-the-art simulation method. However, the results also indicate that the model used in this study does a reasonable job of representing the influence of damping, but does not precisely reflect all aspects of the actual squealing behavior of the real brake. This is first of all caused by the simplified model used here. However, even a more complex model that also includes the internal structure of the drum brake would not necessarily be able to reproduce the complete squeal behavior that is measured on a test rig. The reason for this can be explained by the problem described above. This should be also considered by varying parameters and performing robustness studies within the simulation ultimately resulting in an increase in time and effort required for this purpose.


