Author Contributions
Conceptualization, M.W. and H.G.; methodology, M.W.; software, H.G.; validation, M.W. and H.G.; formal analysis, M.W.; investigation, M.W.; resources, M.W.; data curation, H.G.; writing—original draft preparation, M.W.; writing—review and editing, M.W.; visualization, H.G.; supervision, M.N.; project administration, M.N.; funding acquisition, Y.L. All authors have read and agreed to the published version of the manuscript.
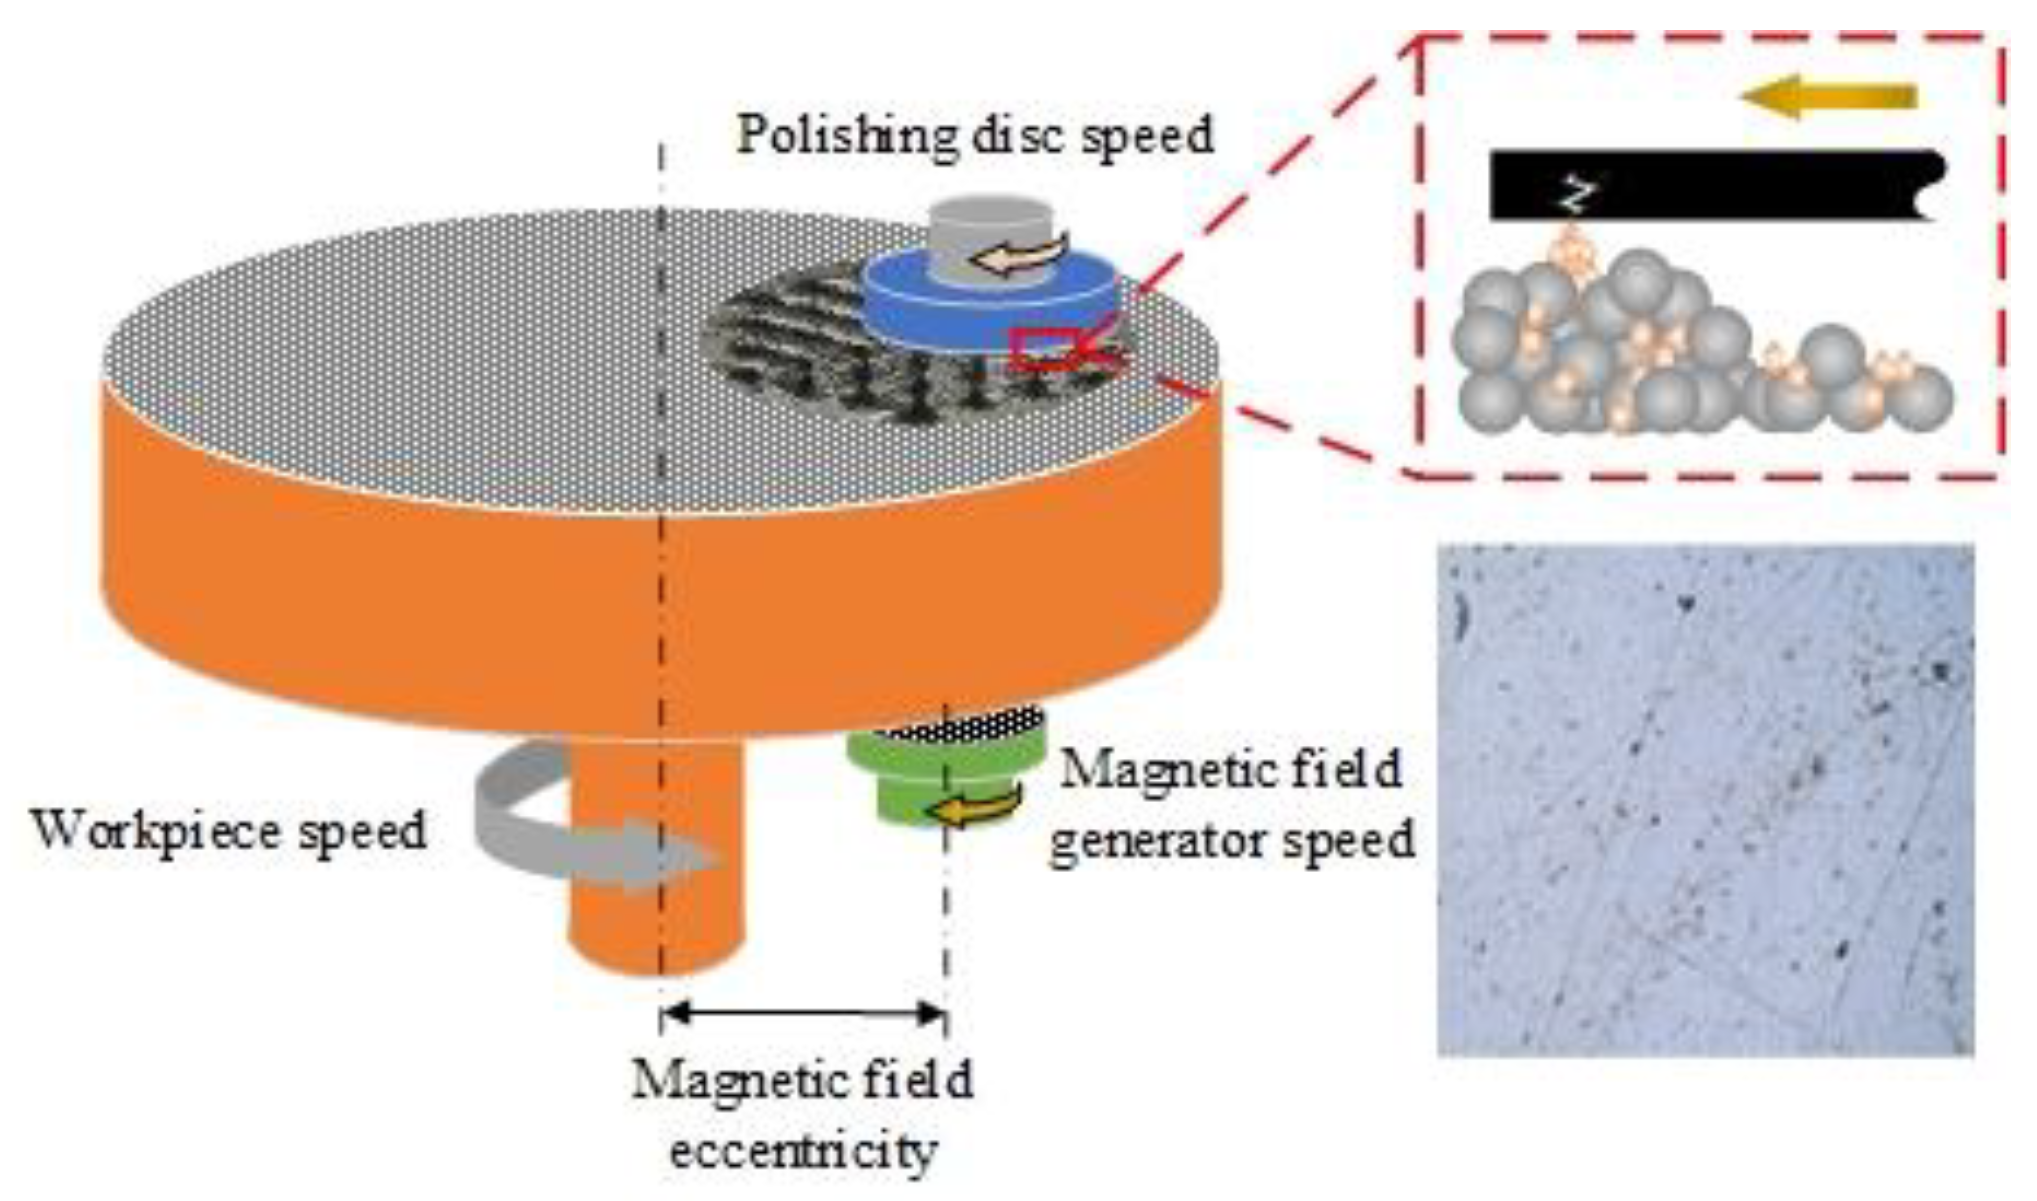
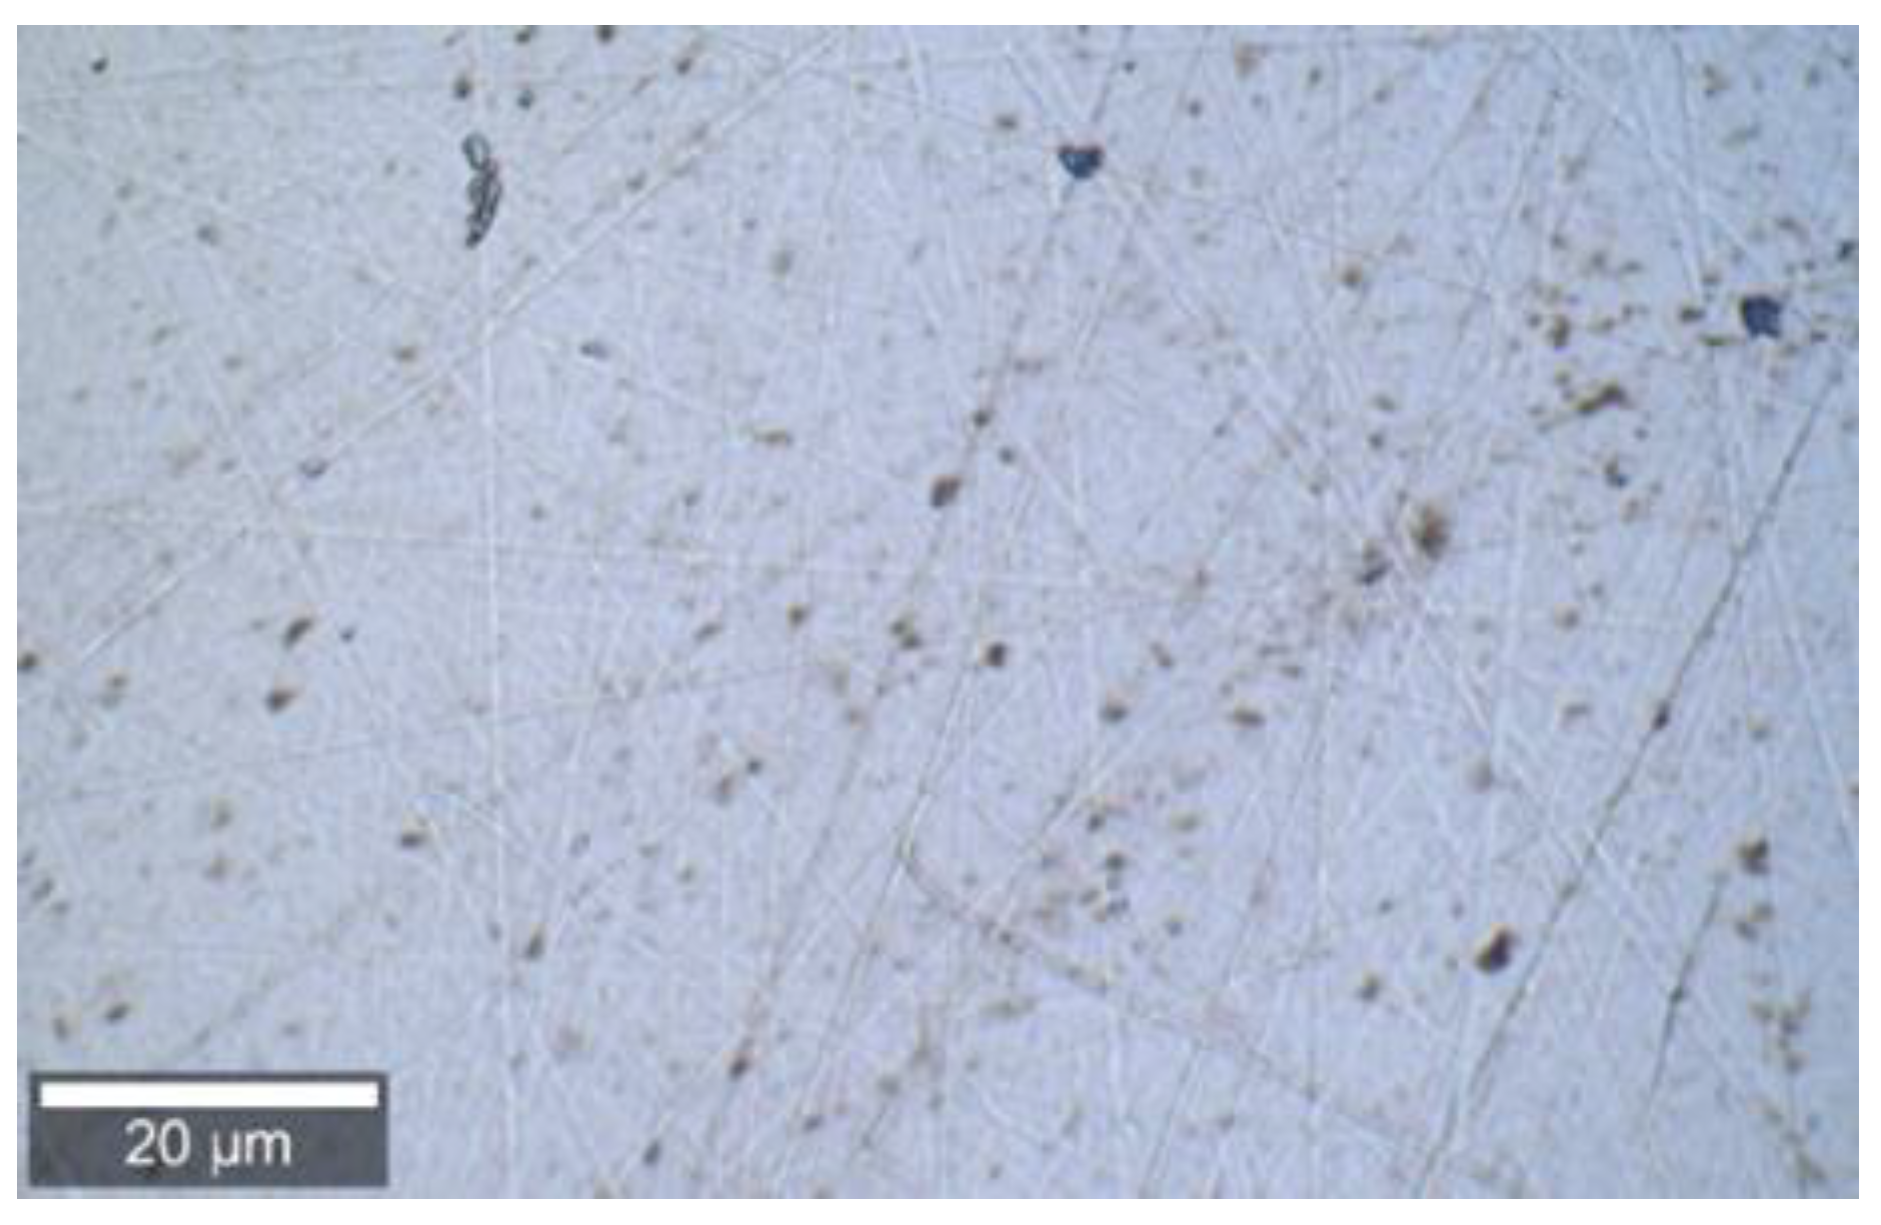
Figure 1.
Surface pits and scratches caused by particle agglomeration on a wafer surface.
Figure 1.
Surface pits and scratches caused by particle agglomeration on a wafer surface.
Figure 2.
Scratch movement between agglomerated particles and workpiece surface.
Figure 2.
Scratch movement between agglomerated particles and workpiece surface.
Figure 3.
Scratch damage with different scratch lengths.
Figure 3.
Scratch damage with different scratch lengths.
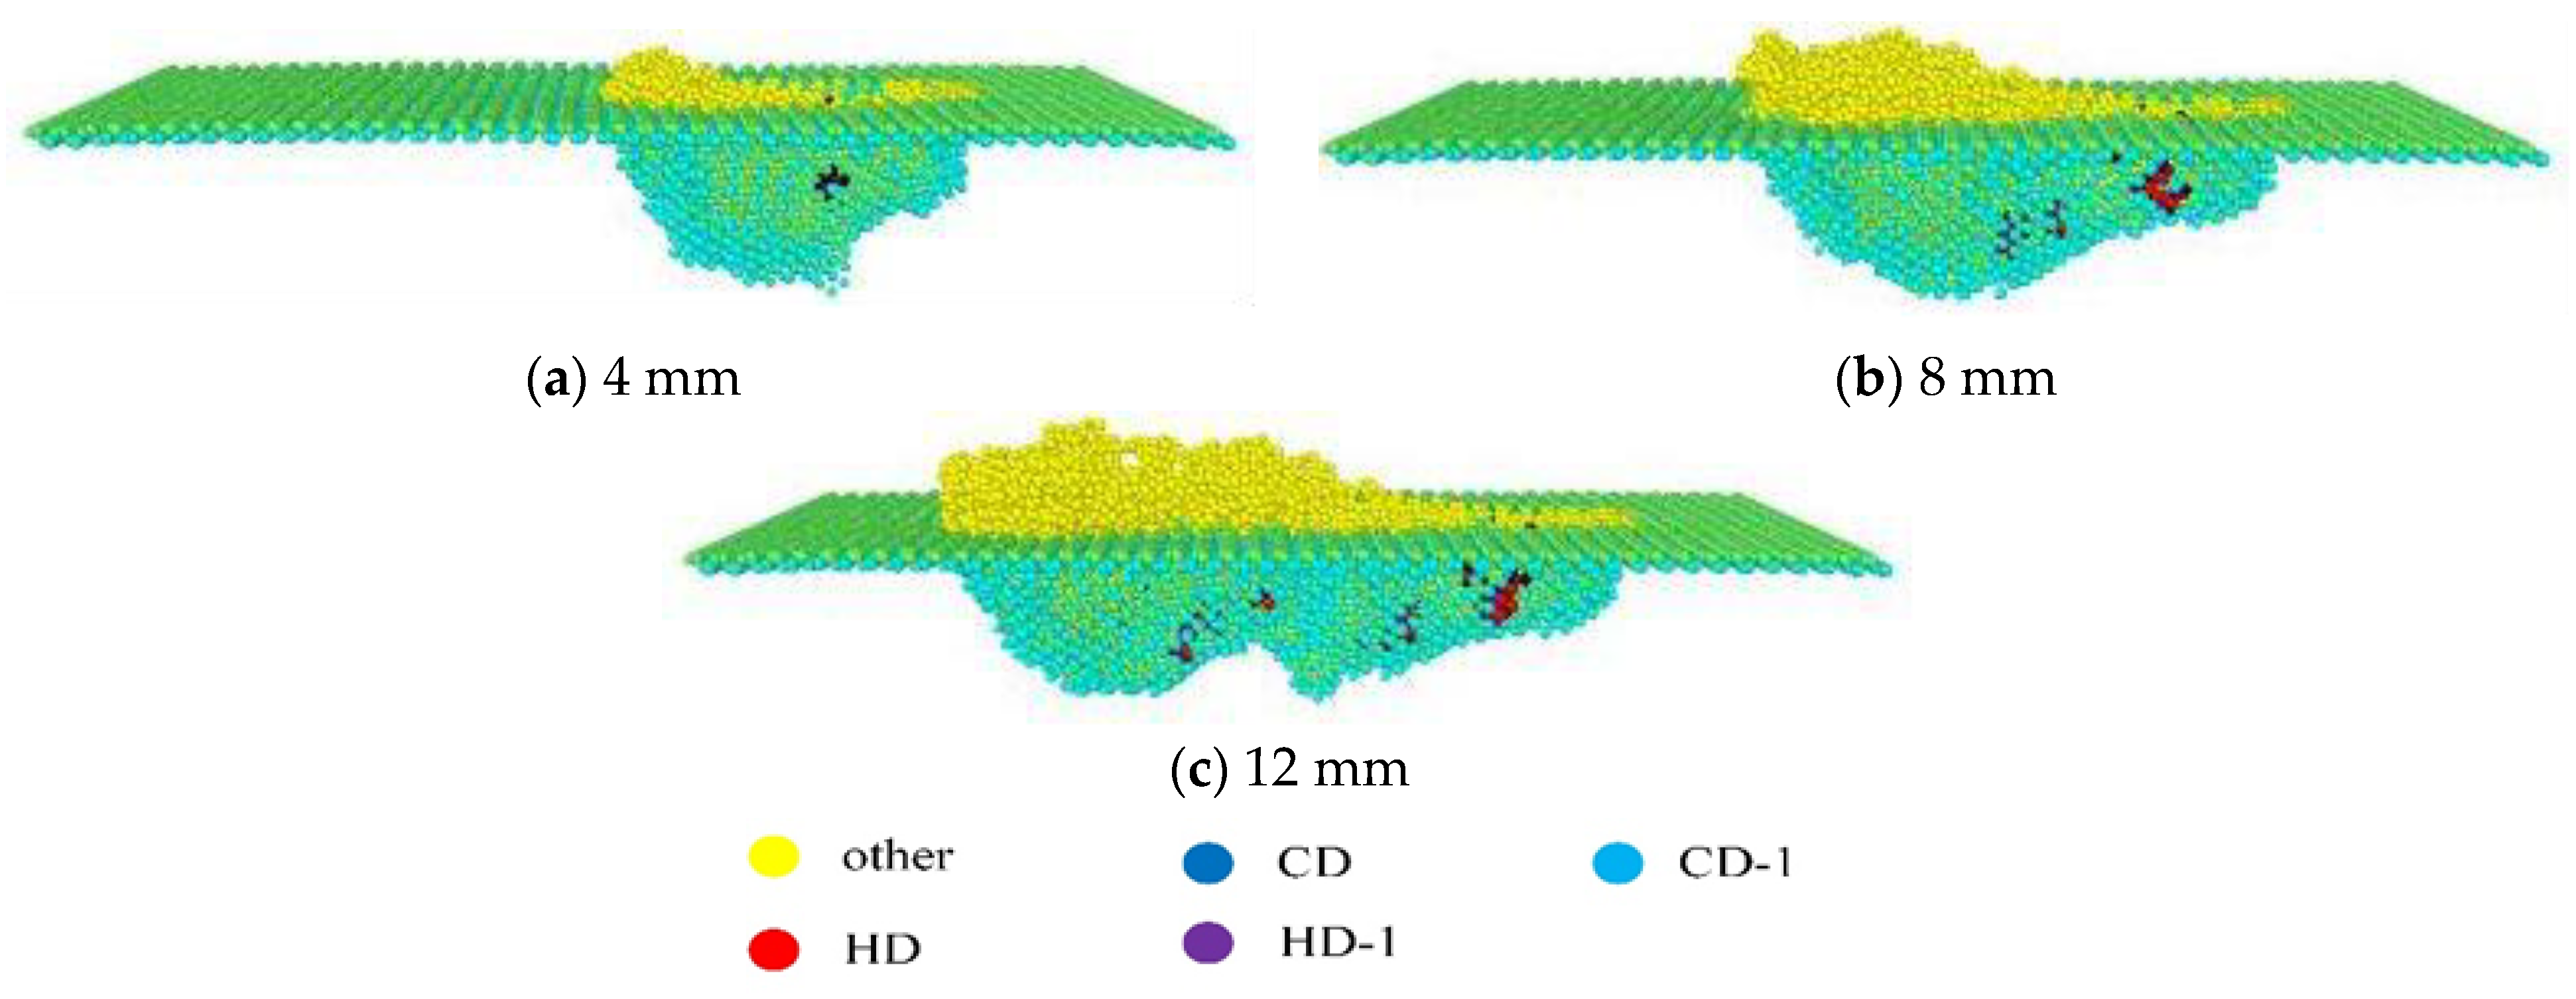
Figure 4.
Atomic structure with different scratch lengths.
Figure 4.
Atomic structure with different scratch lengths.
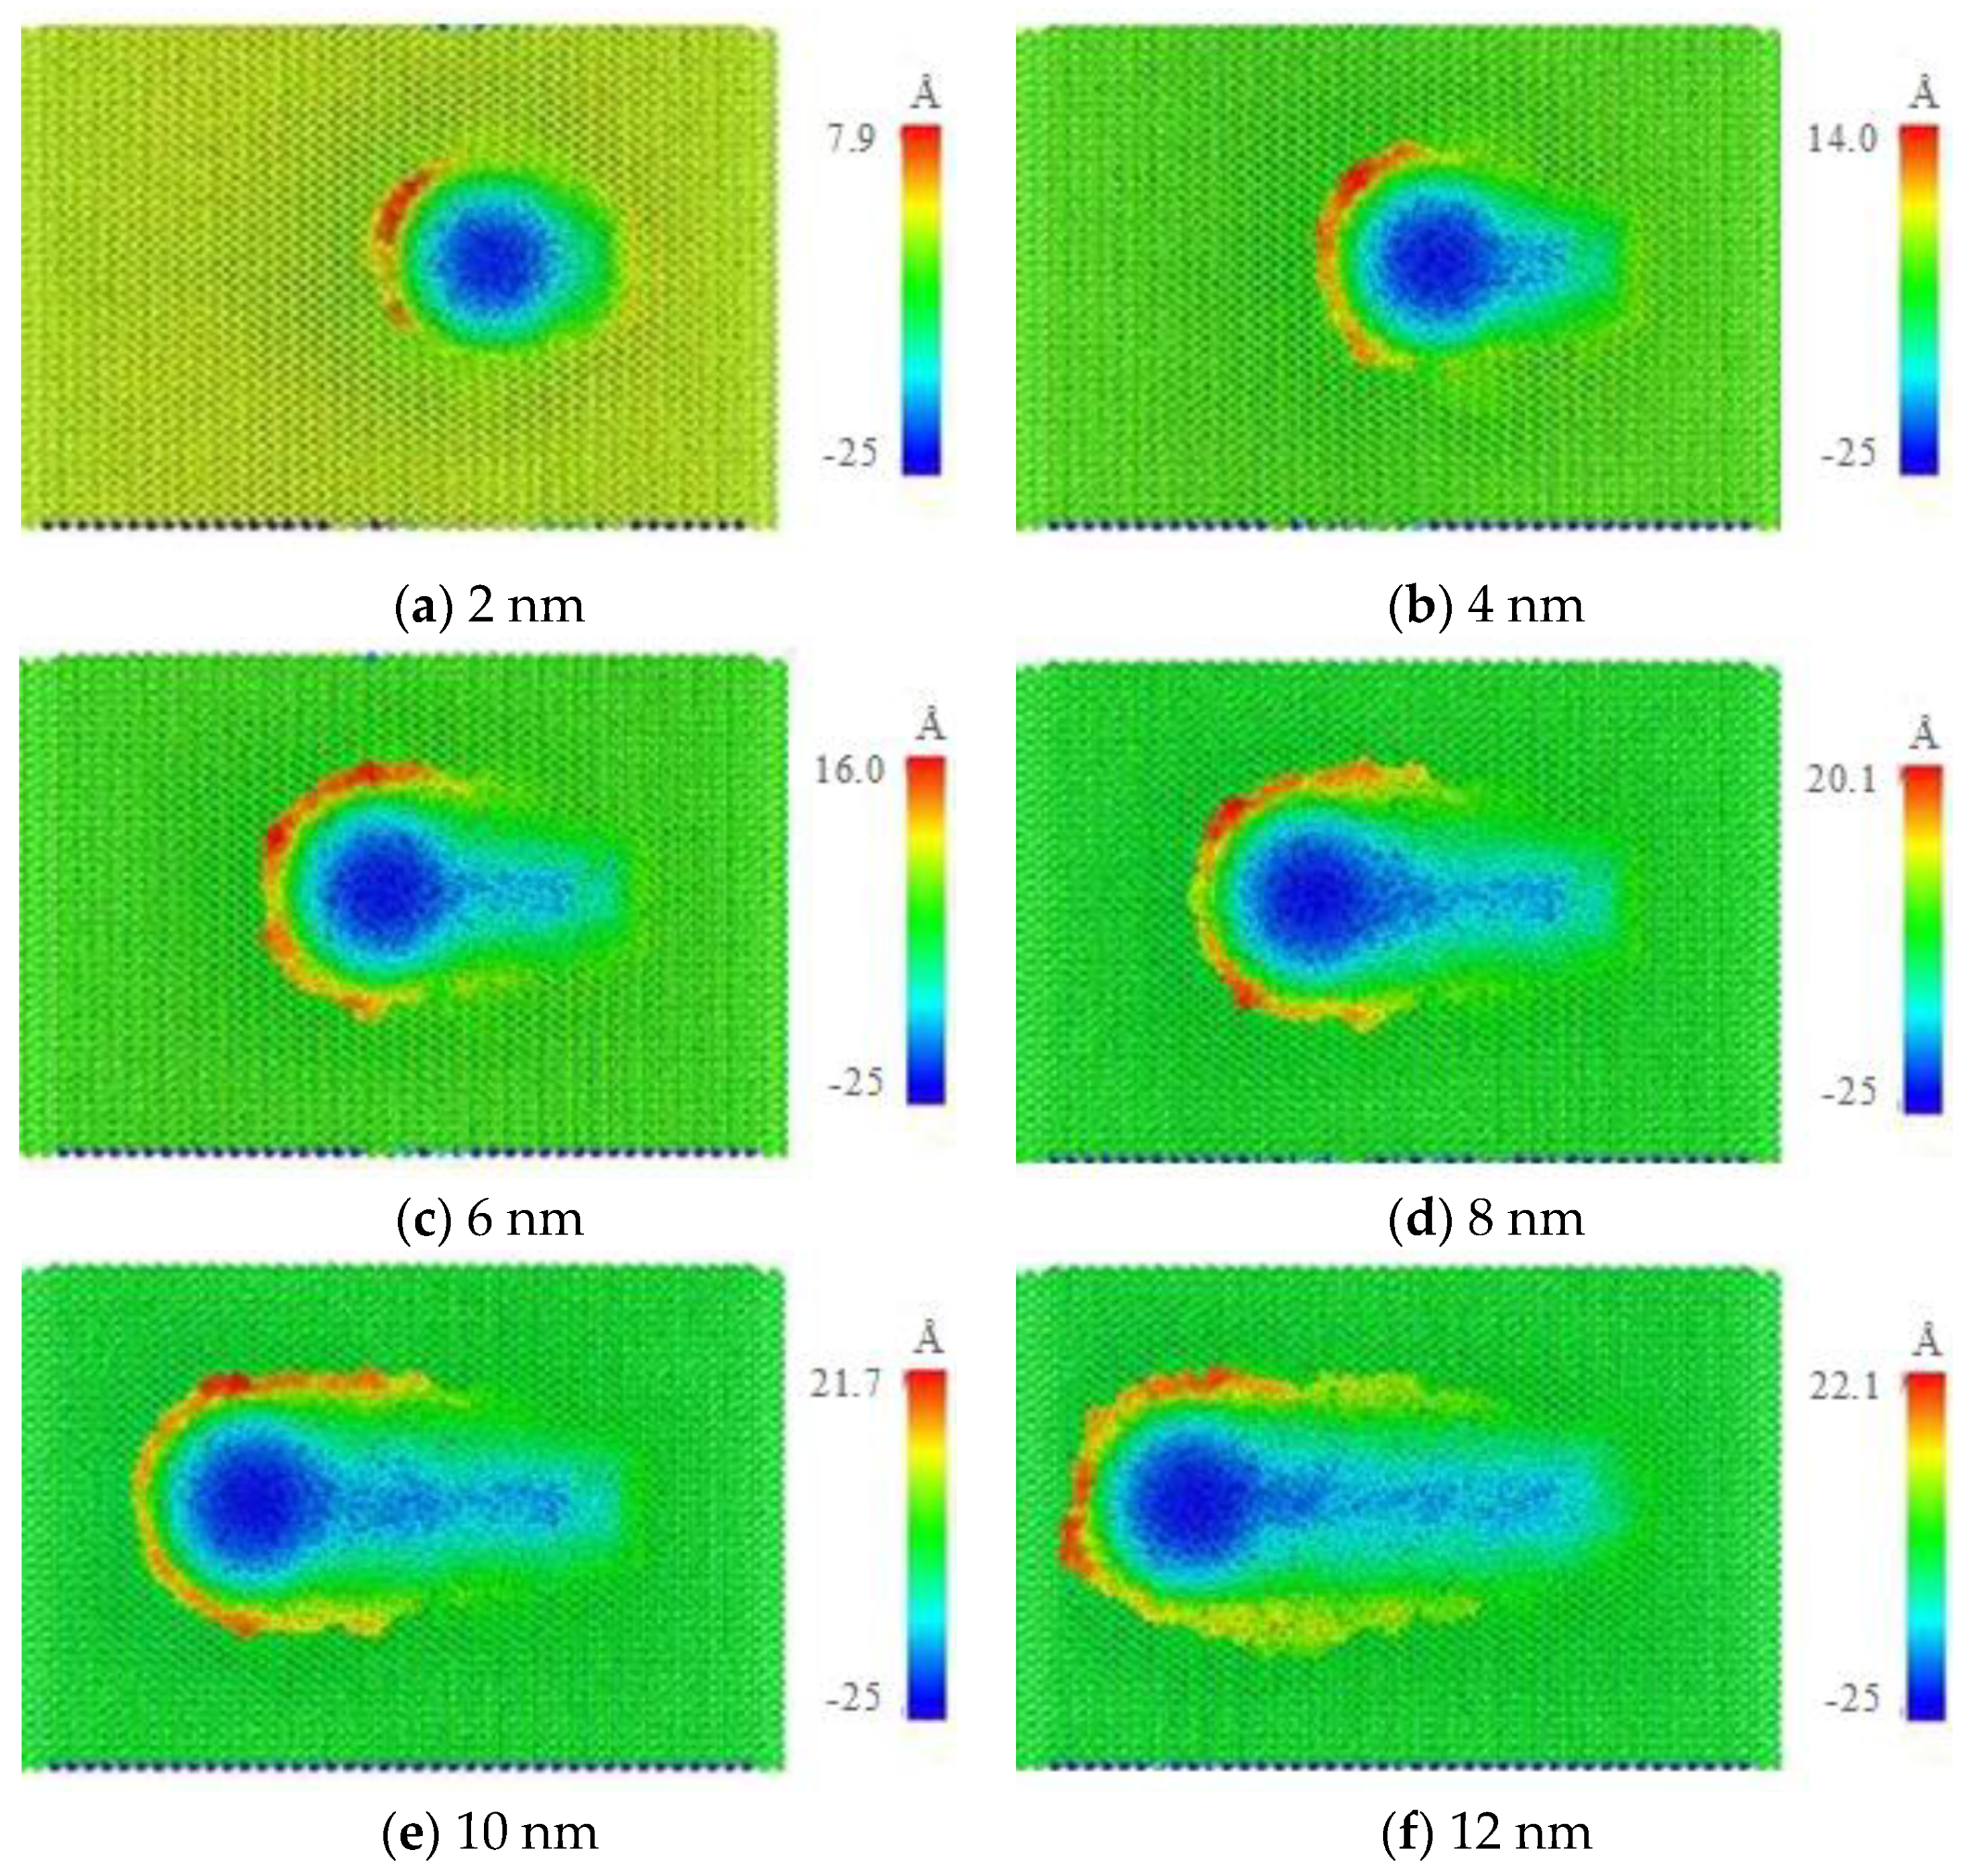
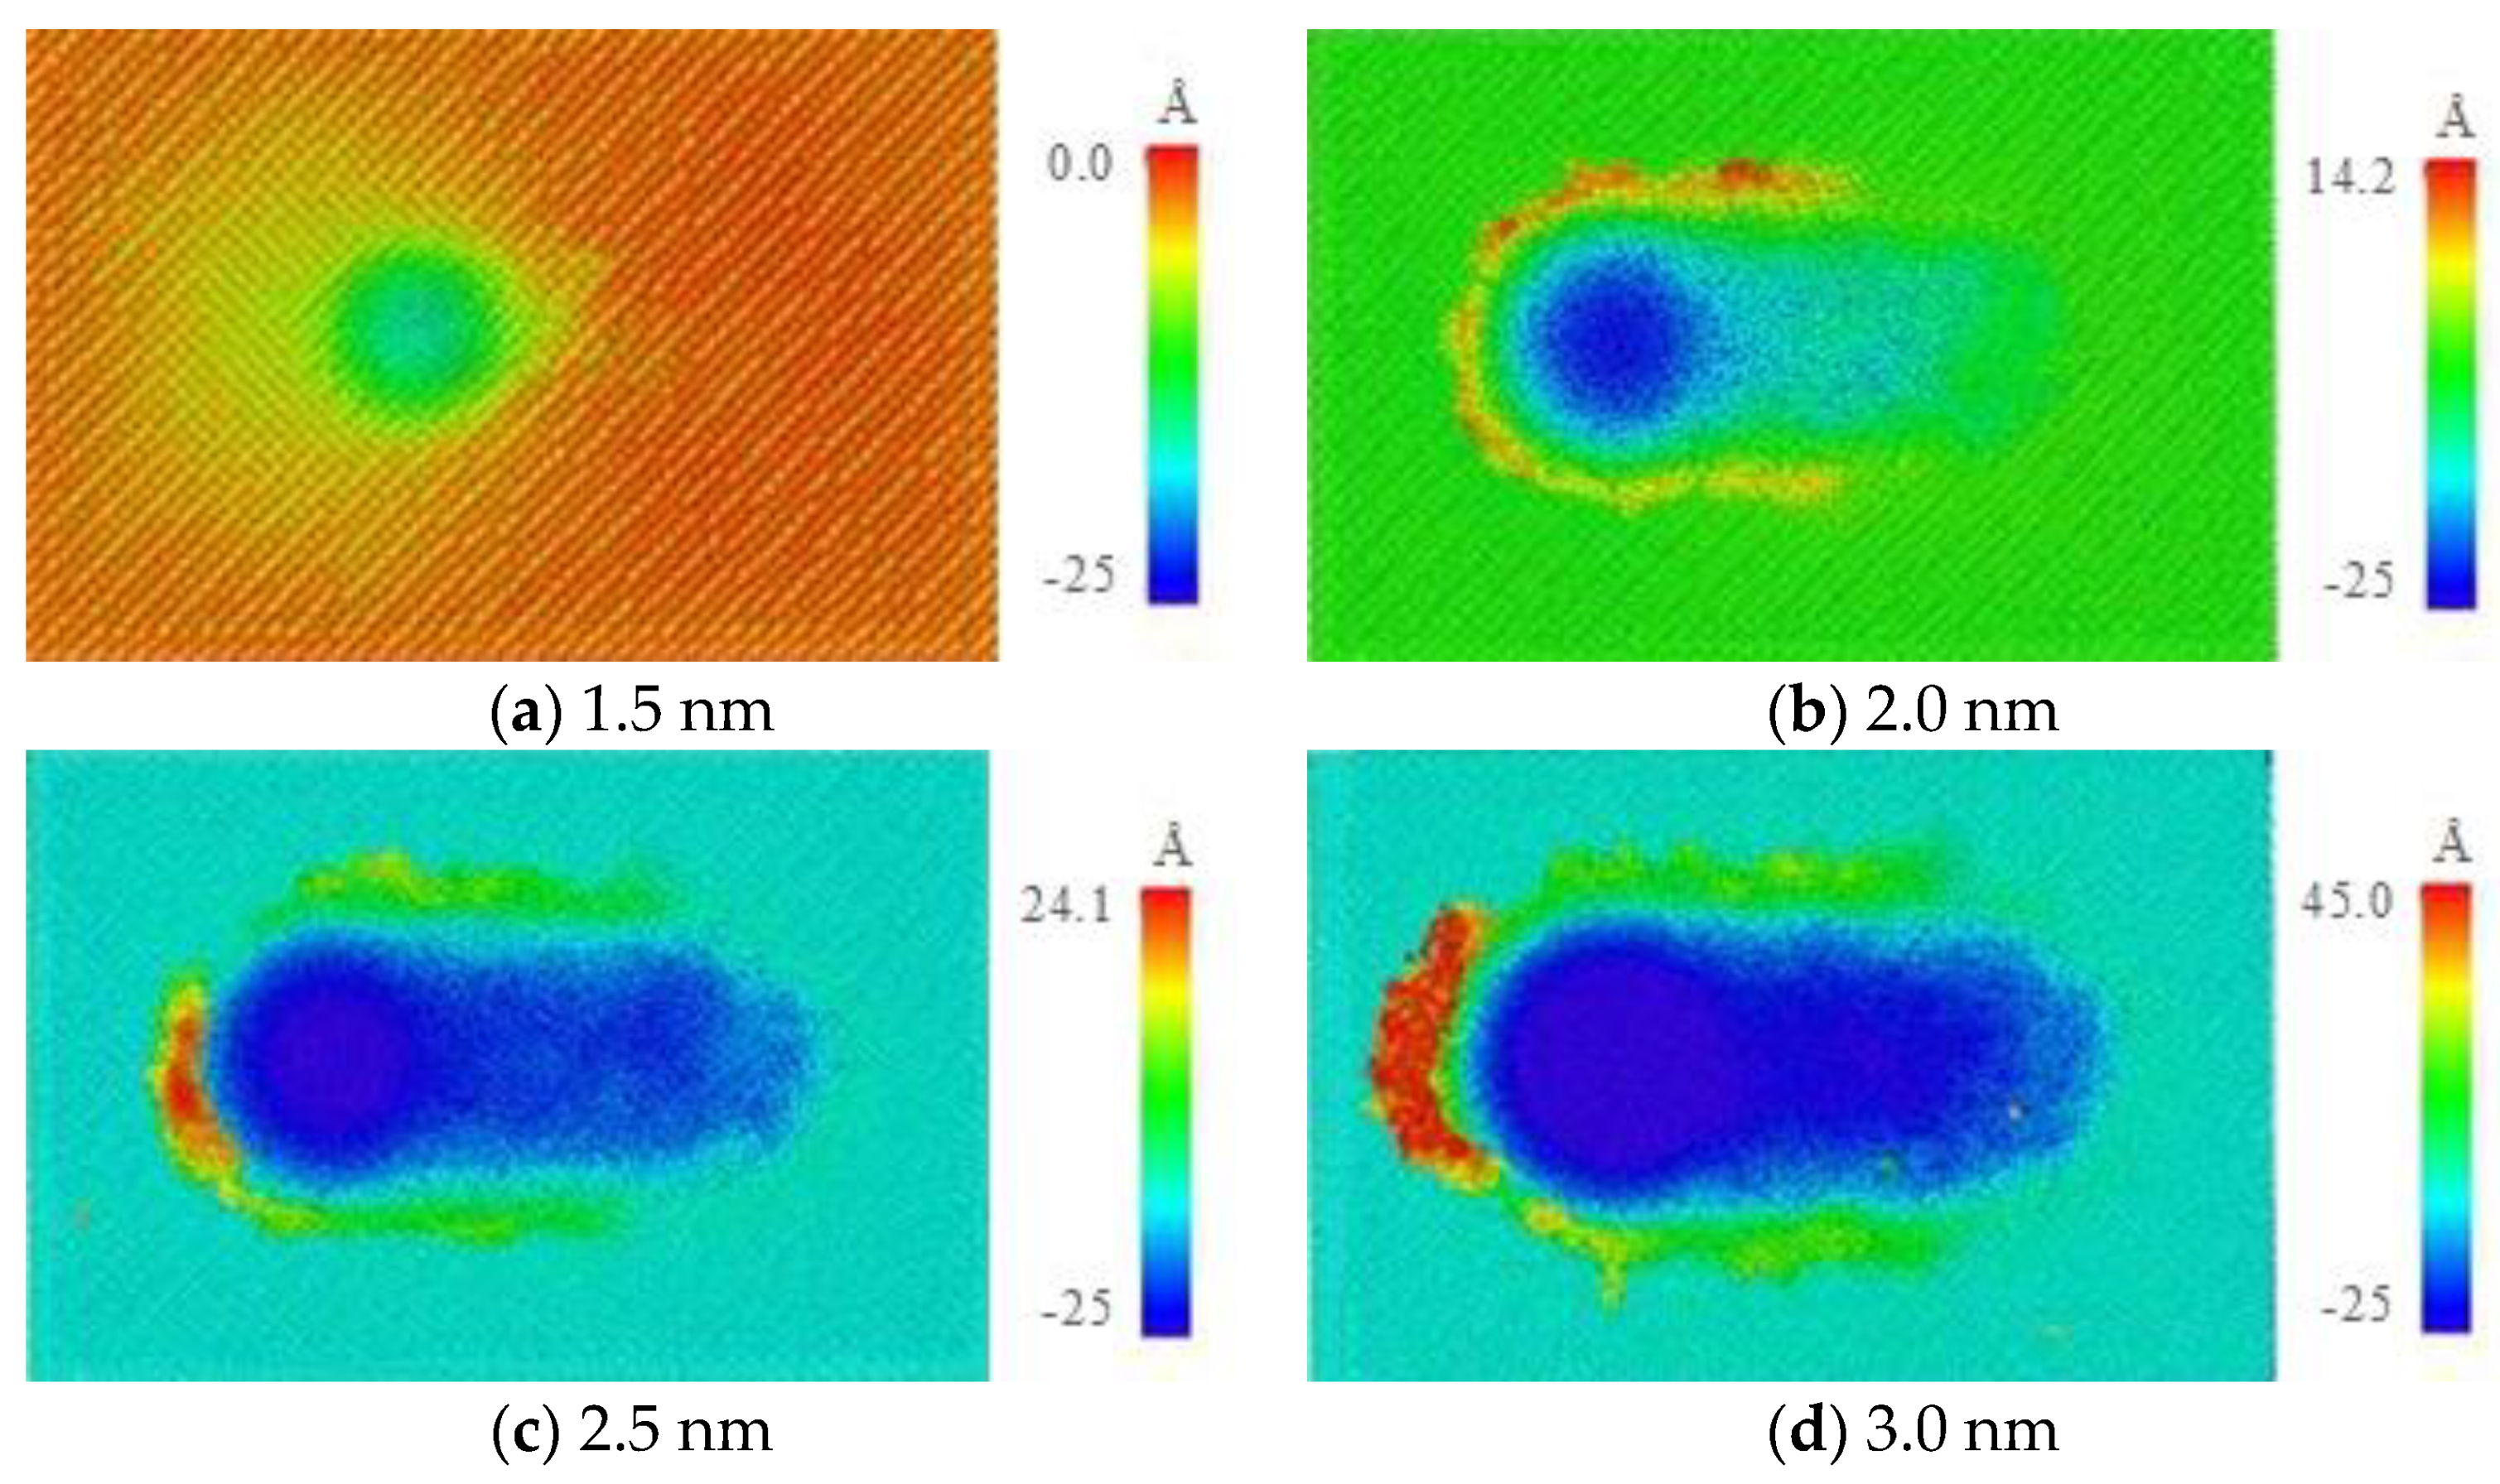
Figure 5.
Scratch morphology with different indentation depths.
Figure 5.
Scratch morphology with different indentation depths.
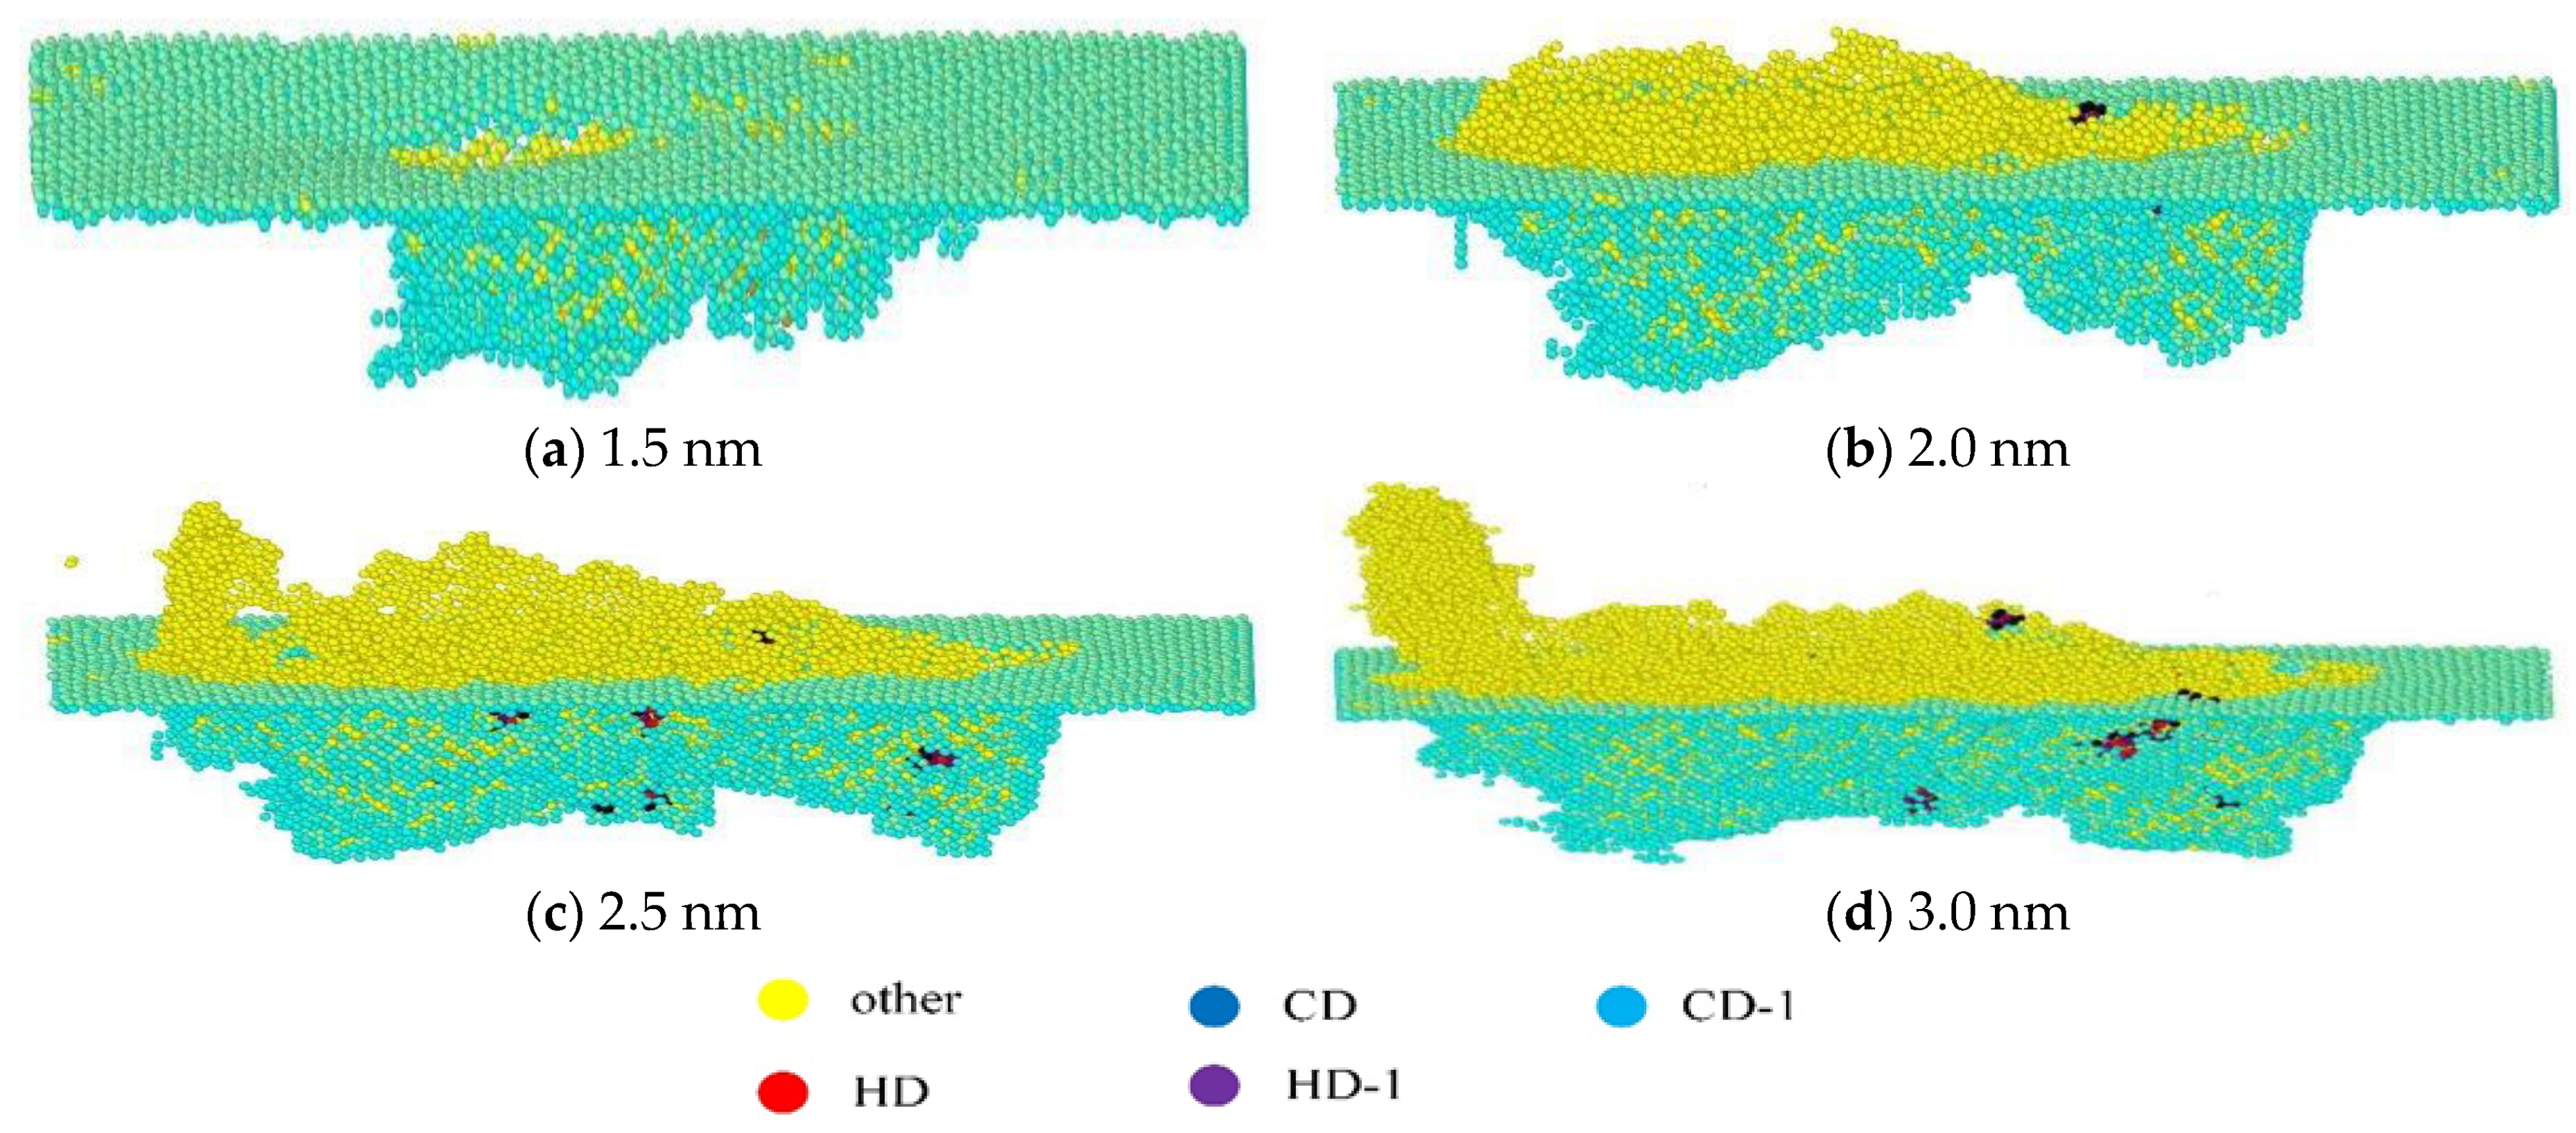
Figure 6.
Atomic structure with different indentation depths.
Figure 6.
Atomic structure with different indentation depths.
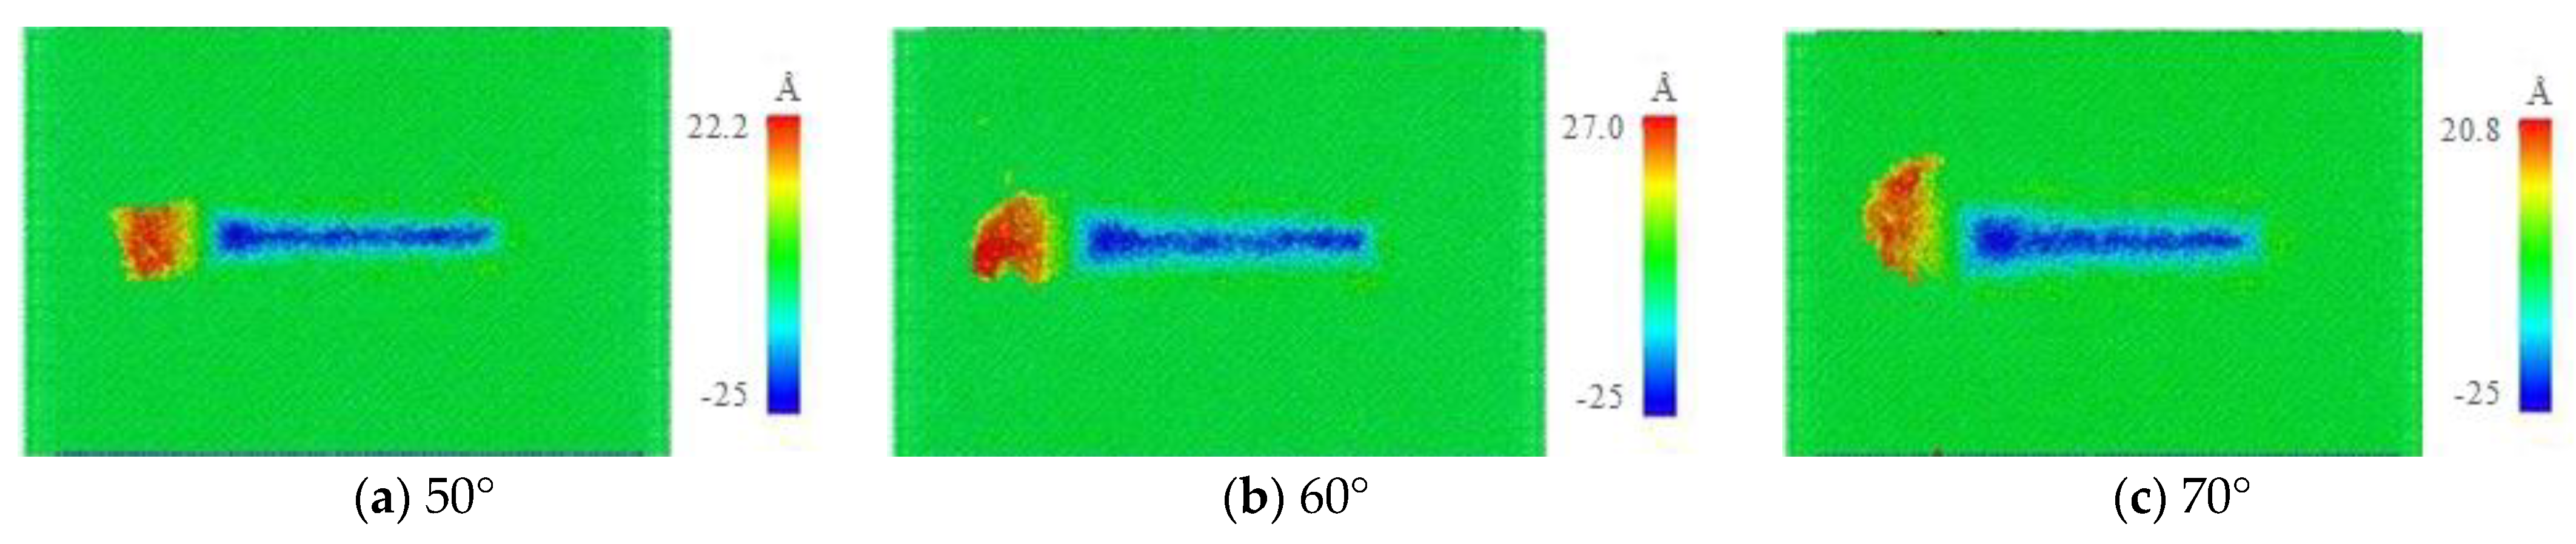
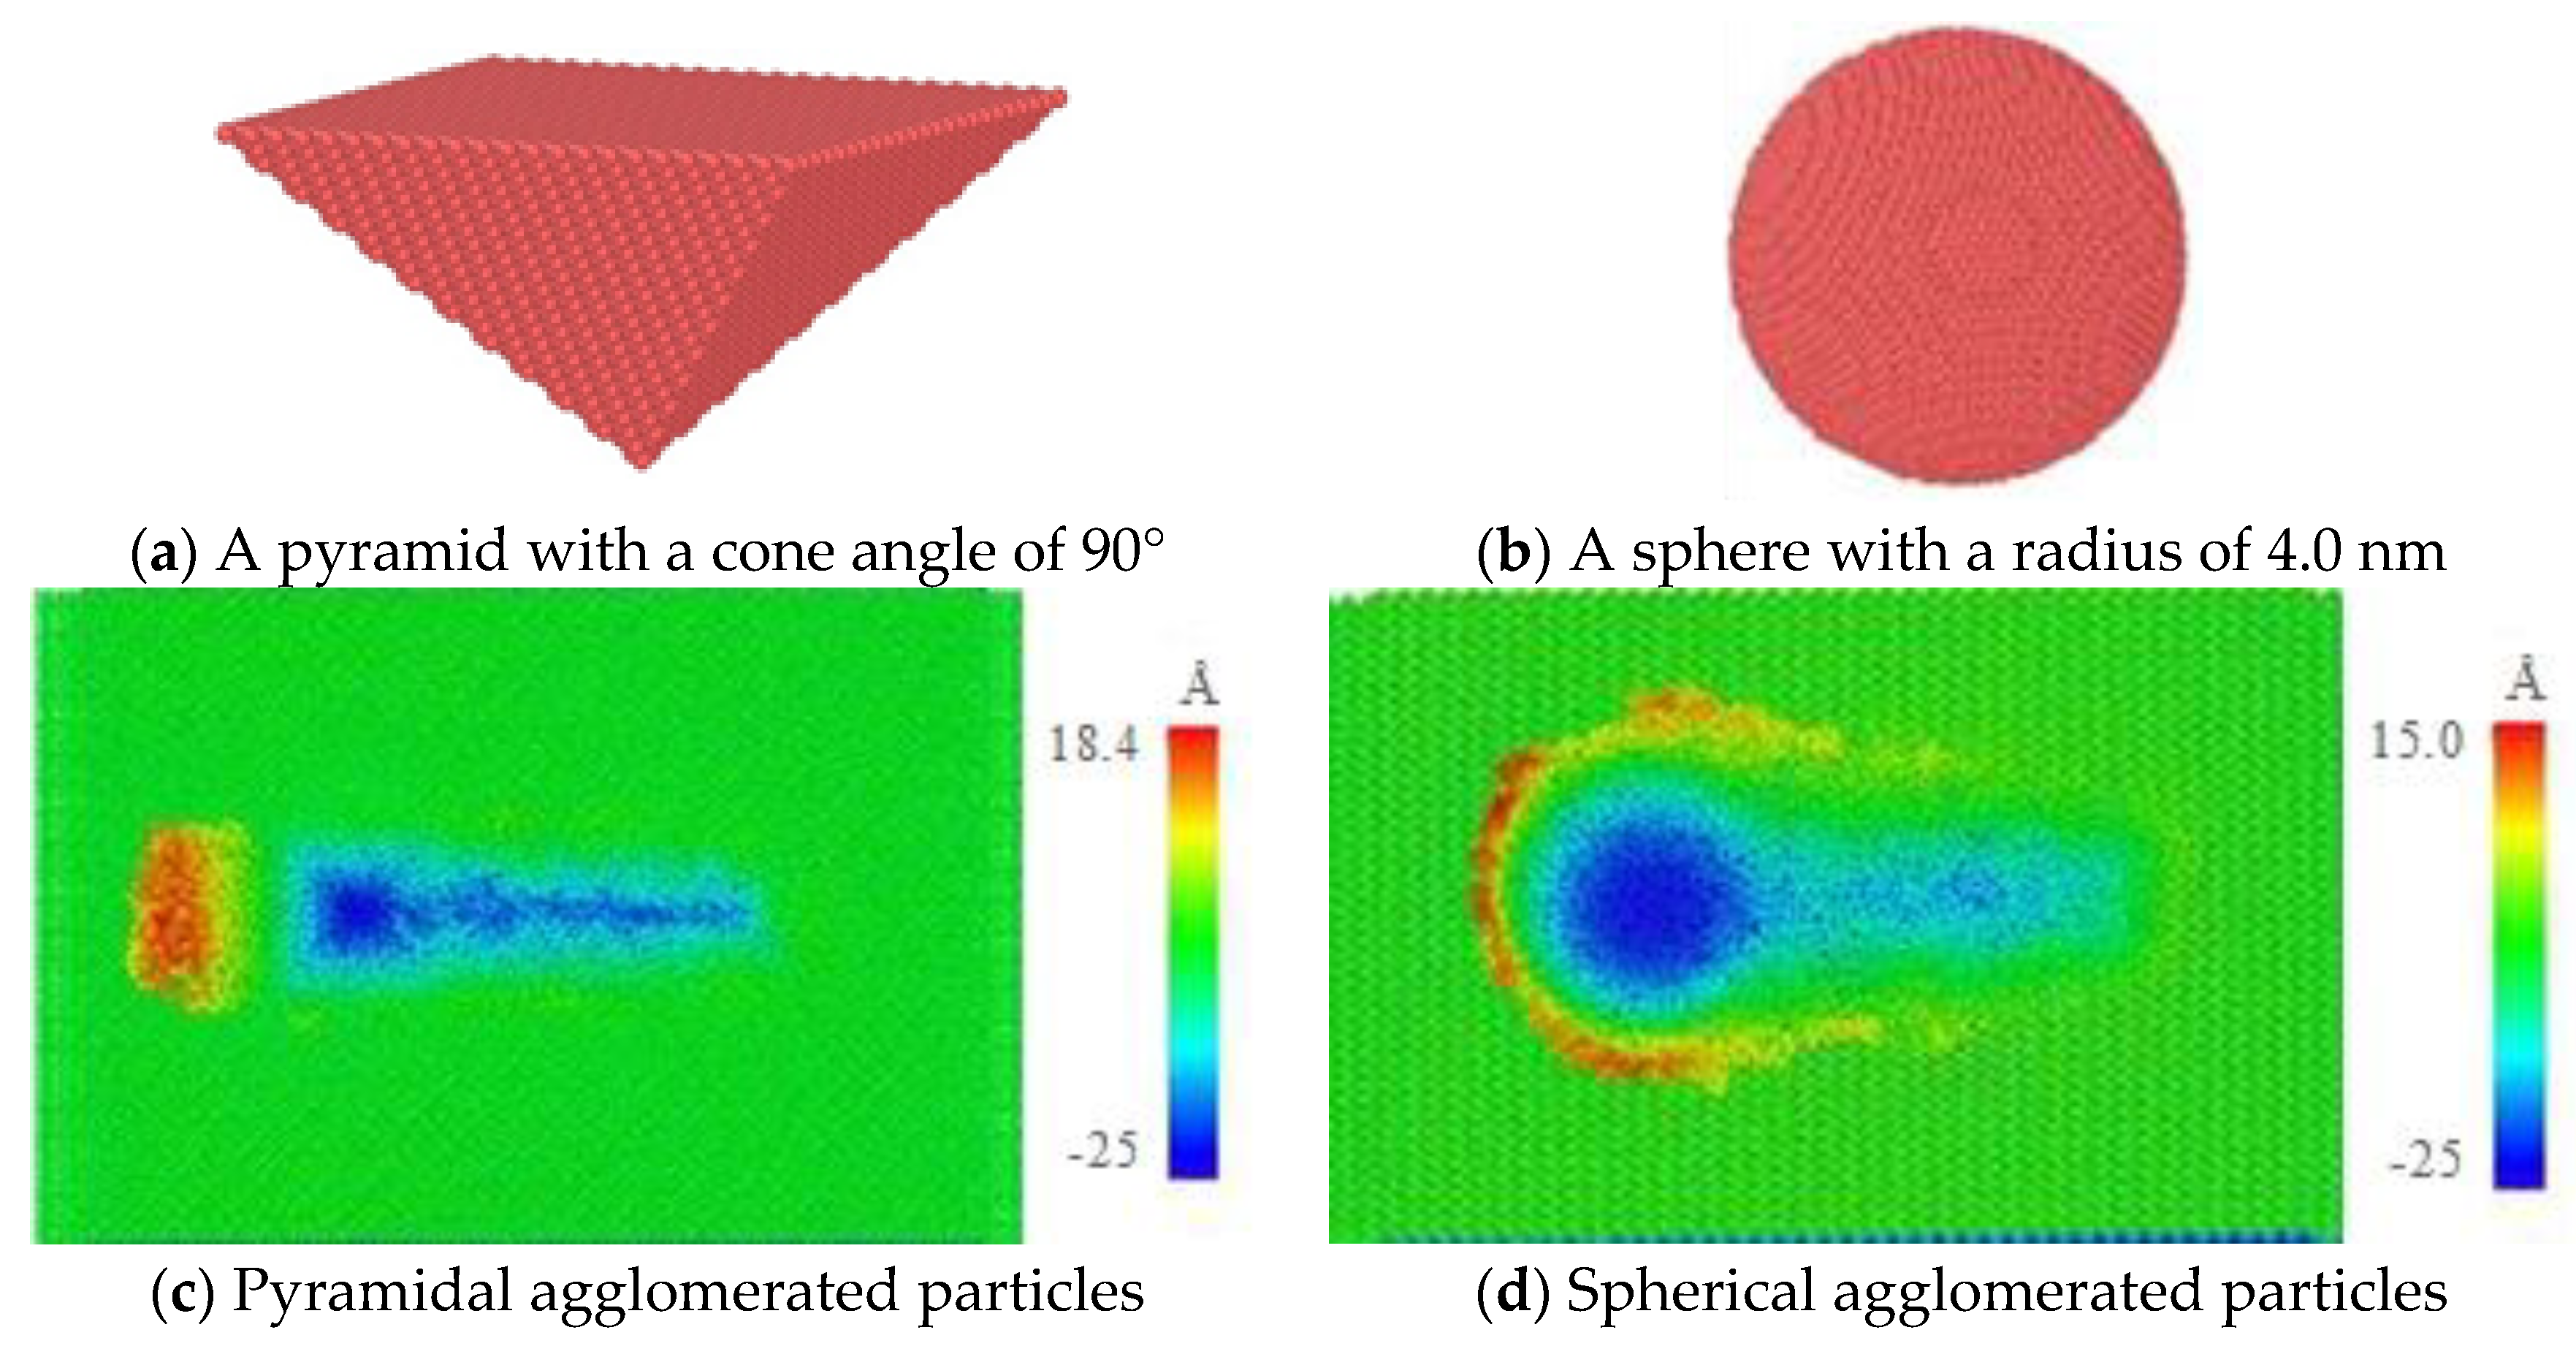
Figure 7.
Scratch damage of agglomerated particles with different shapes.
Figure 7.
Scratch damage of agglomerated particles with different shapes.
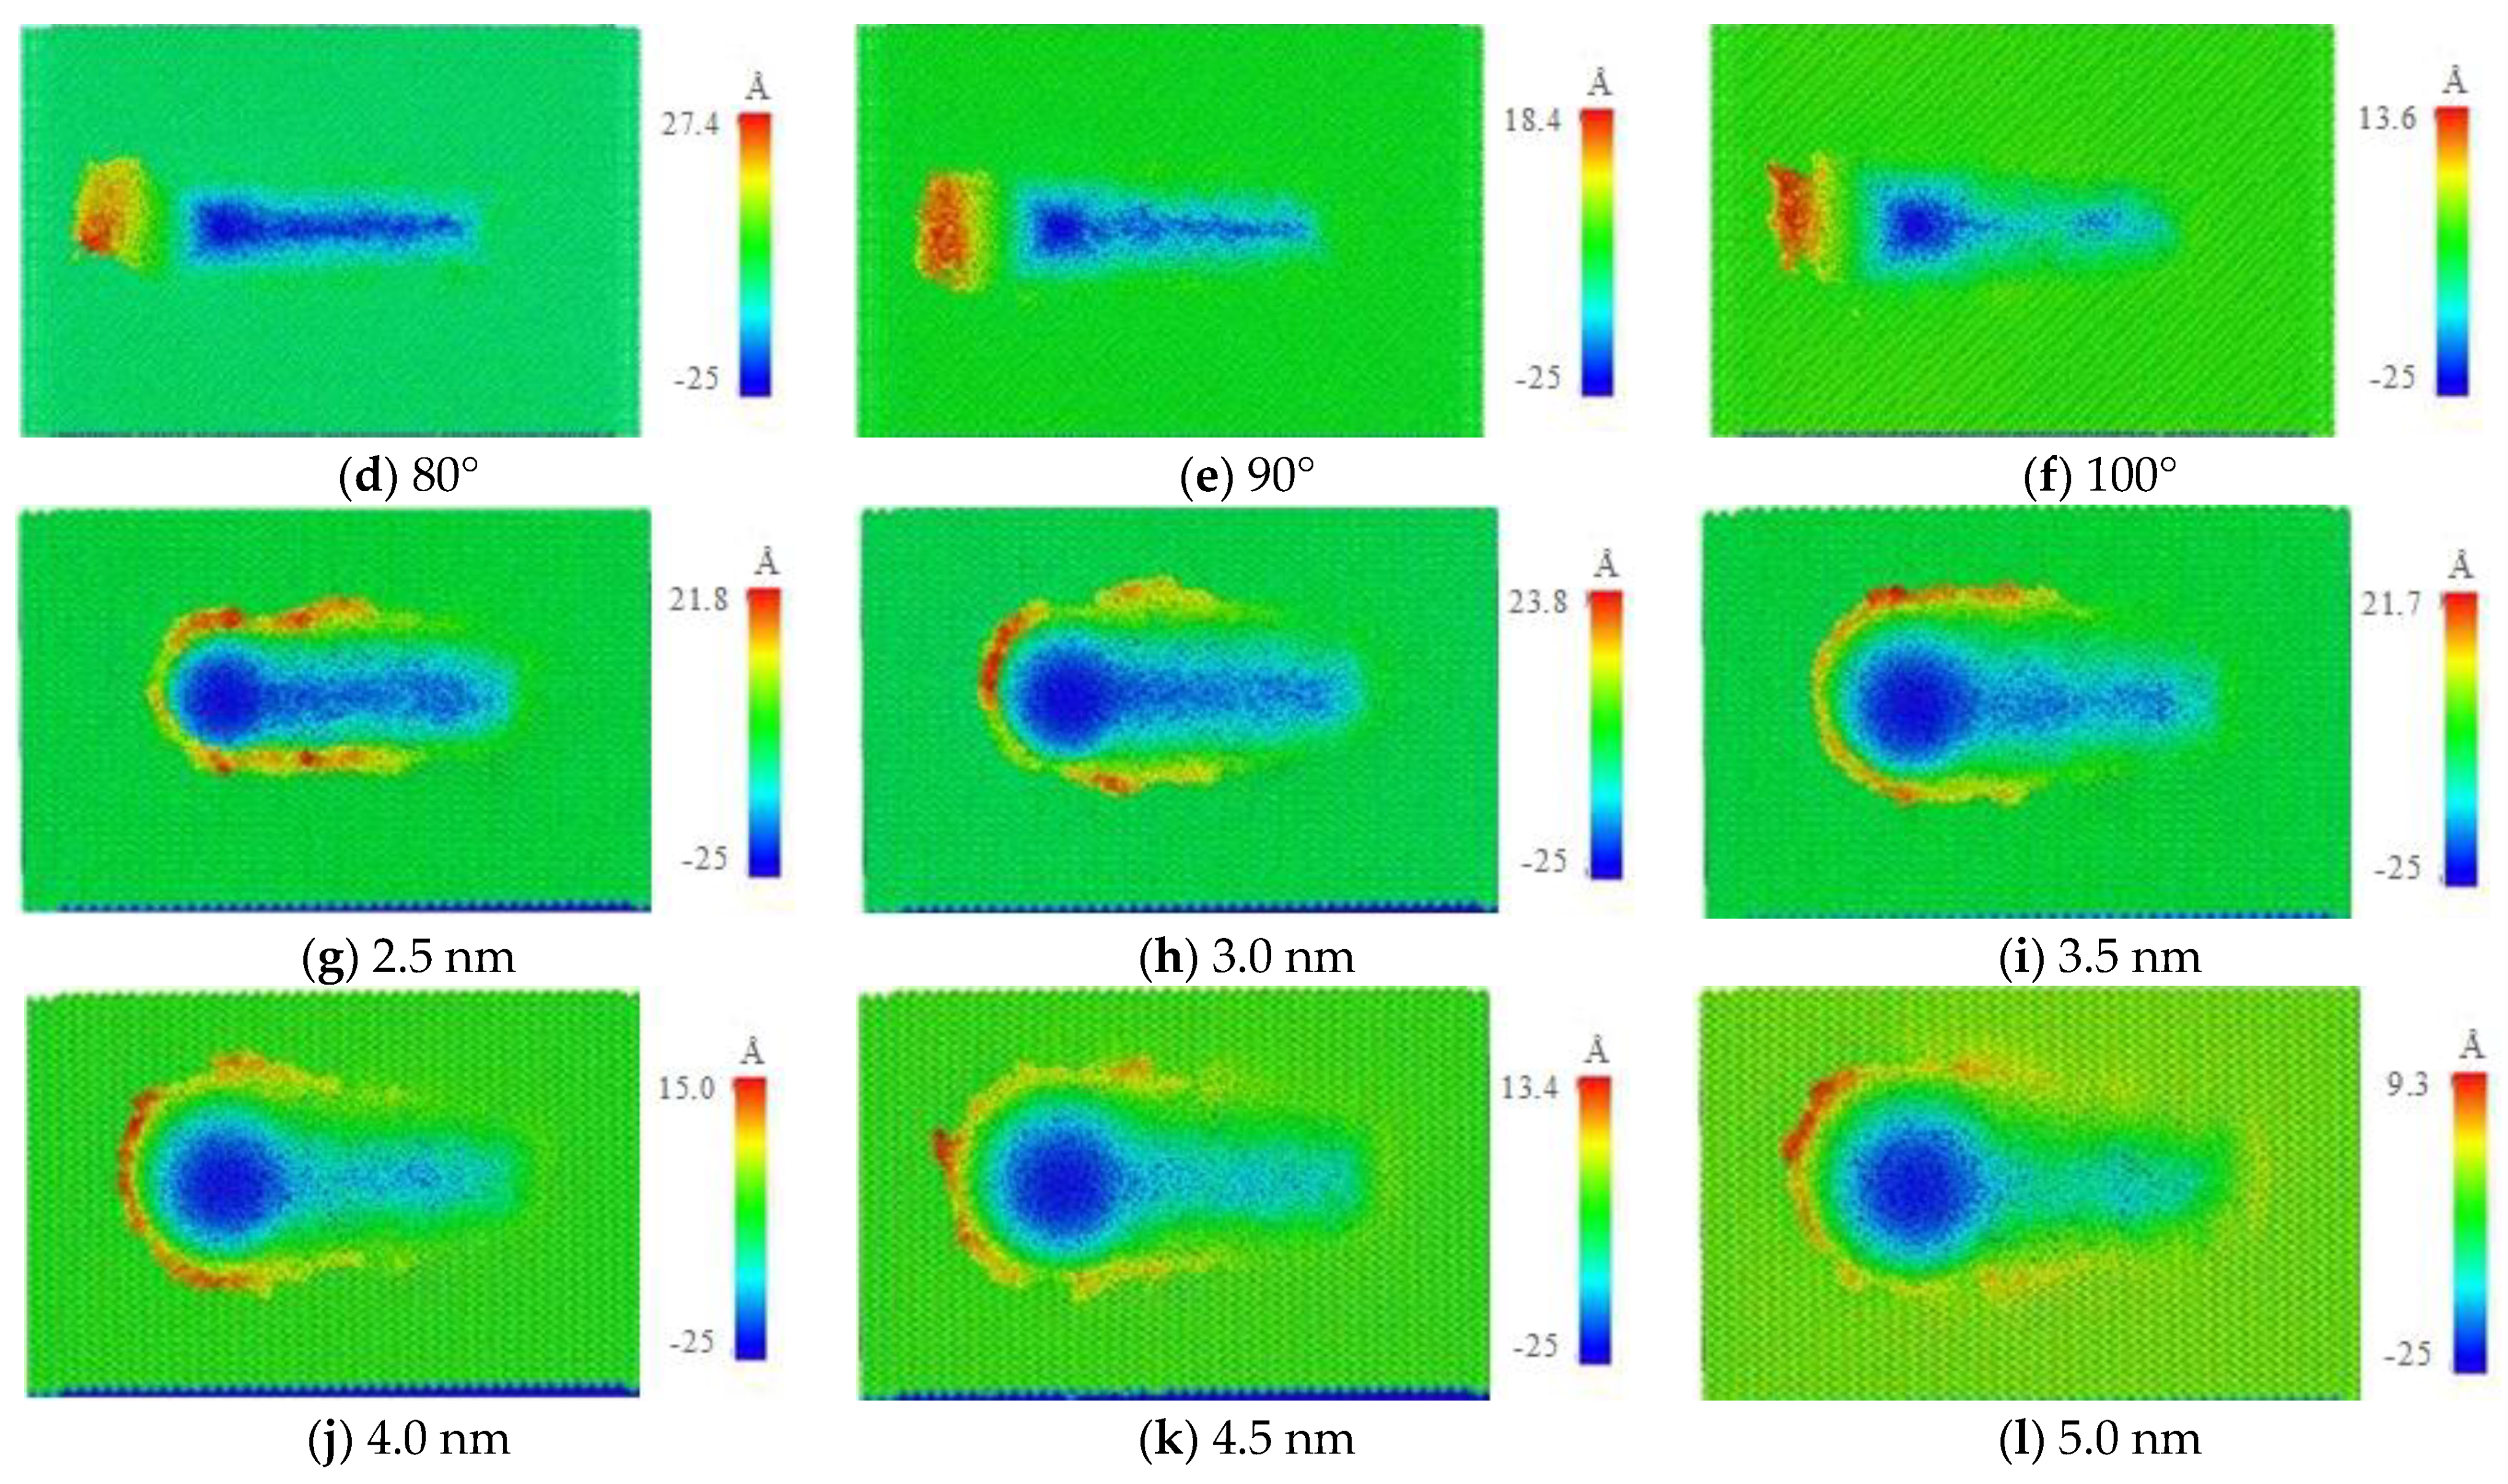
Figure 8.
Scratch damage morphology with agglomerated particles of different shapes and sizes.
Figure 8.
Scratch damage morphology with agglomerated particles of different shapes and sizes.
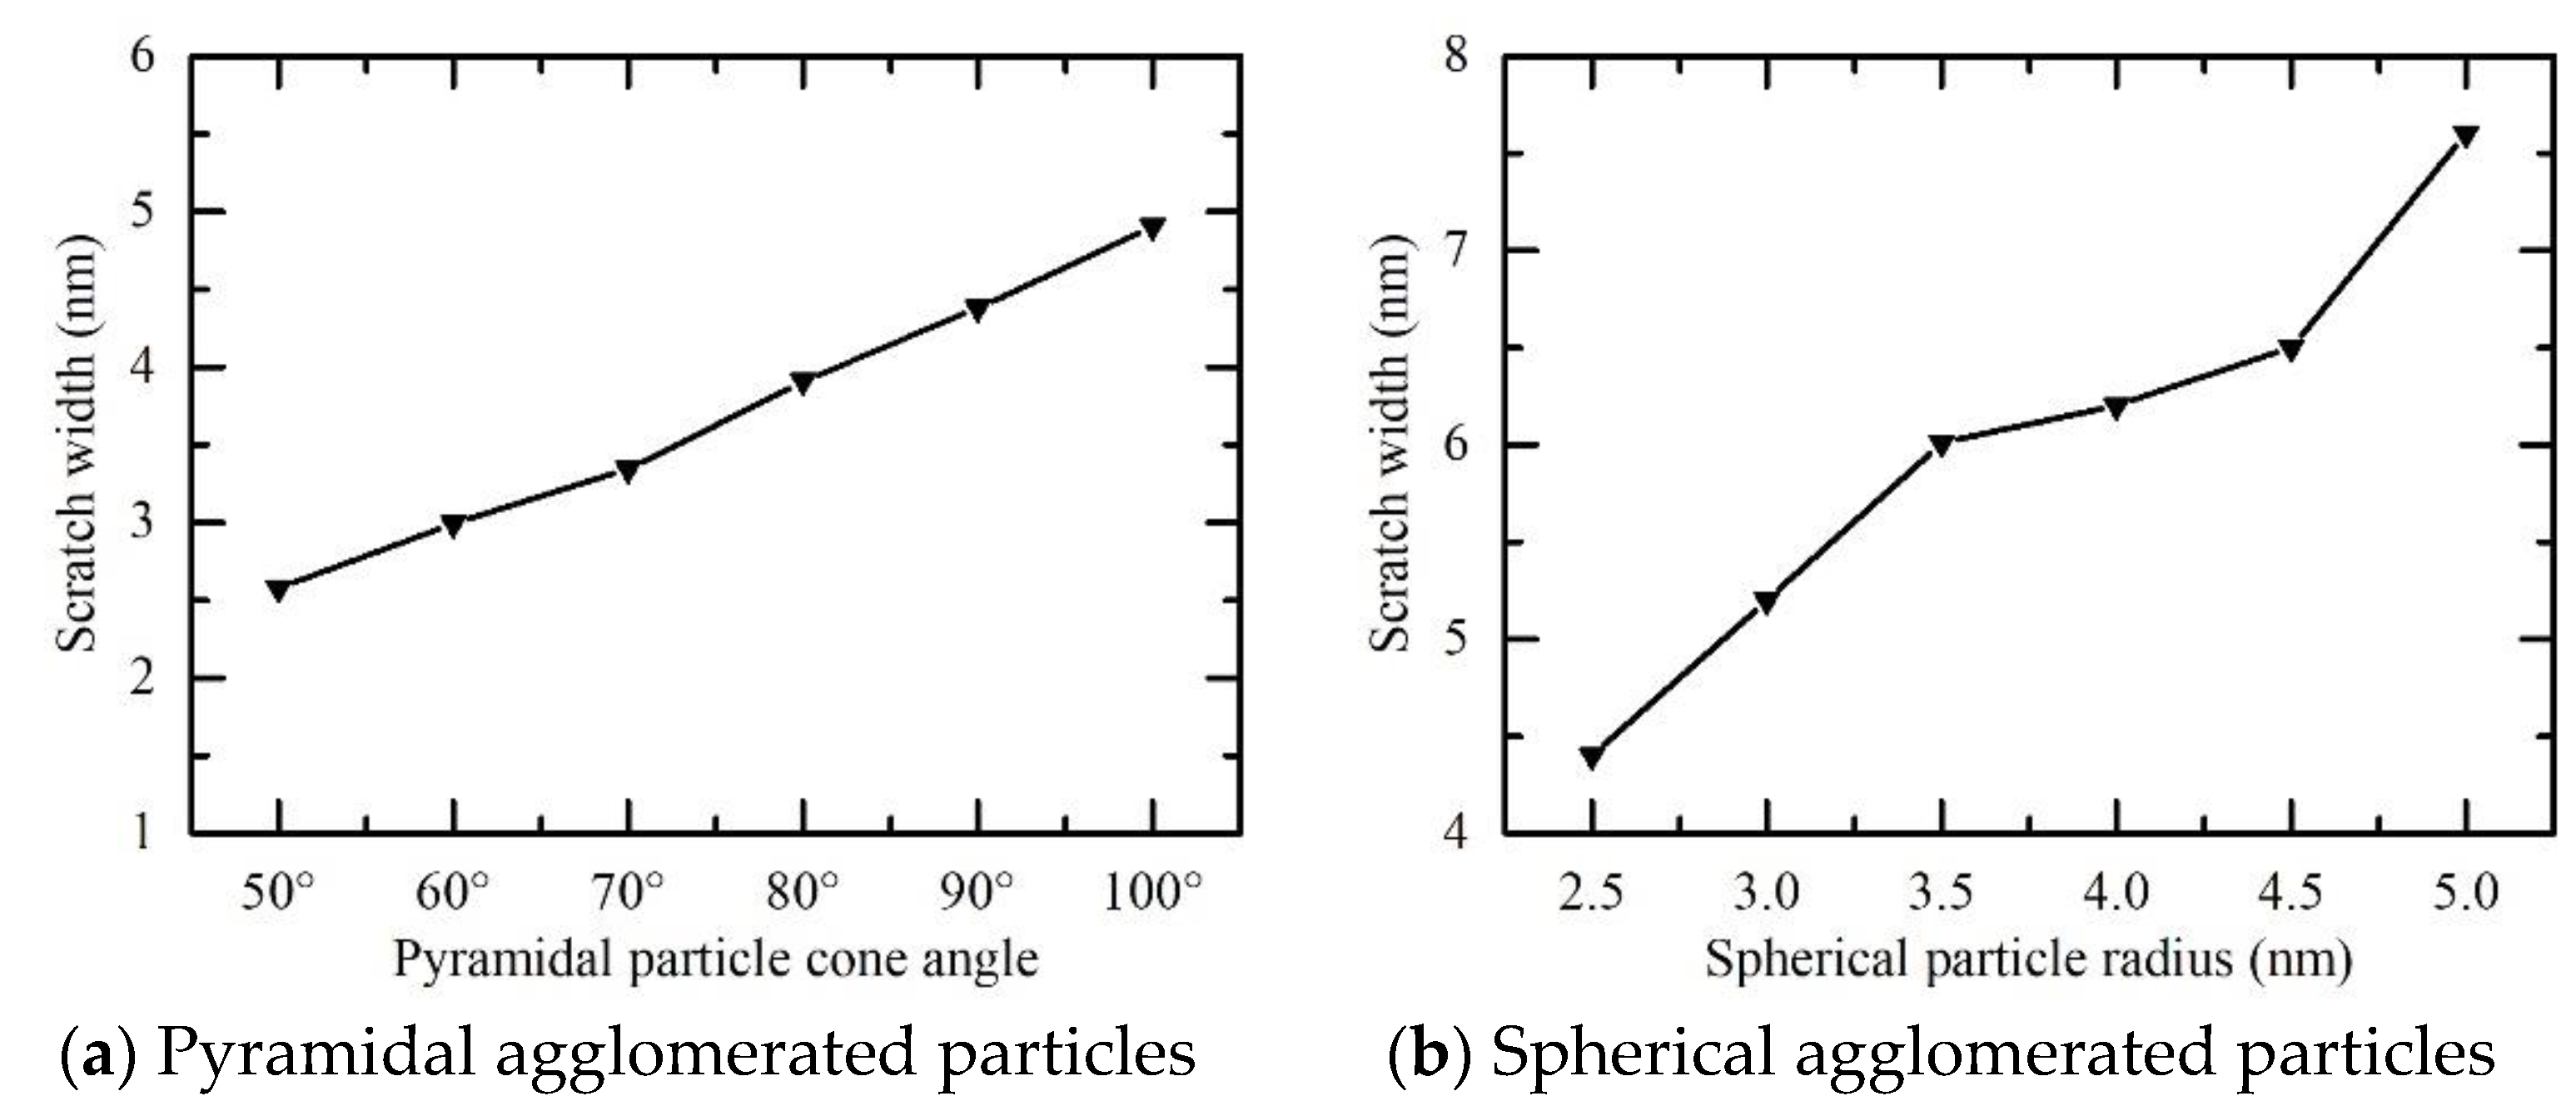
Figure 9.
The actual scratch width with agglomerated particles of different shapes and sizes.
Figure 9.
The actual scratch width with agglomerated particles of different shapes and sizes.
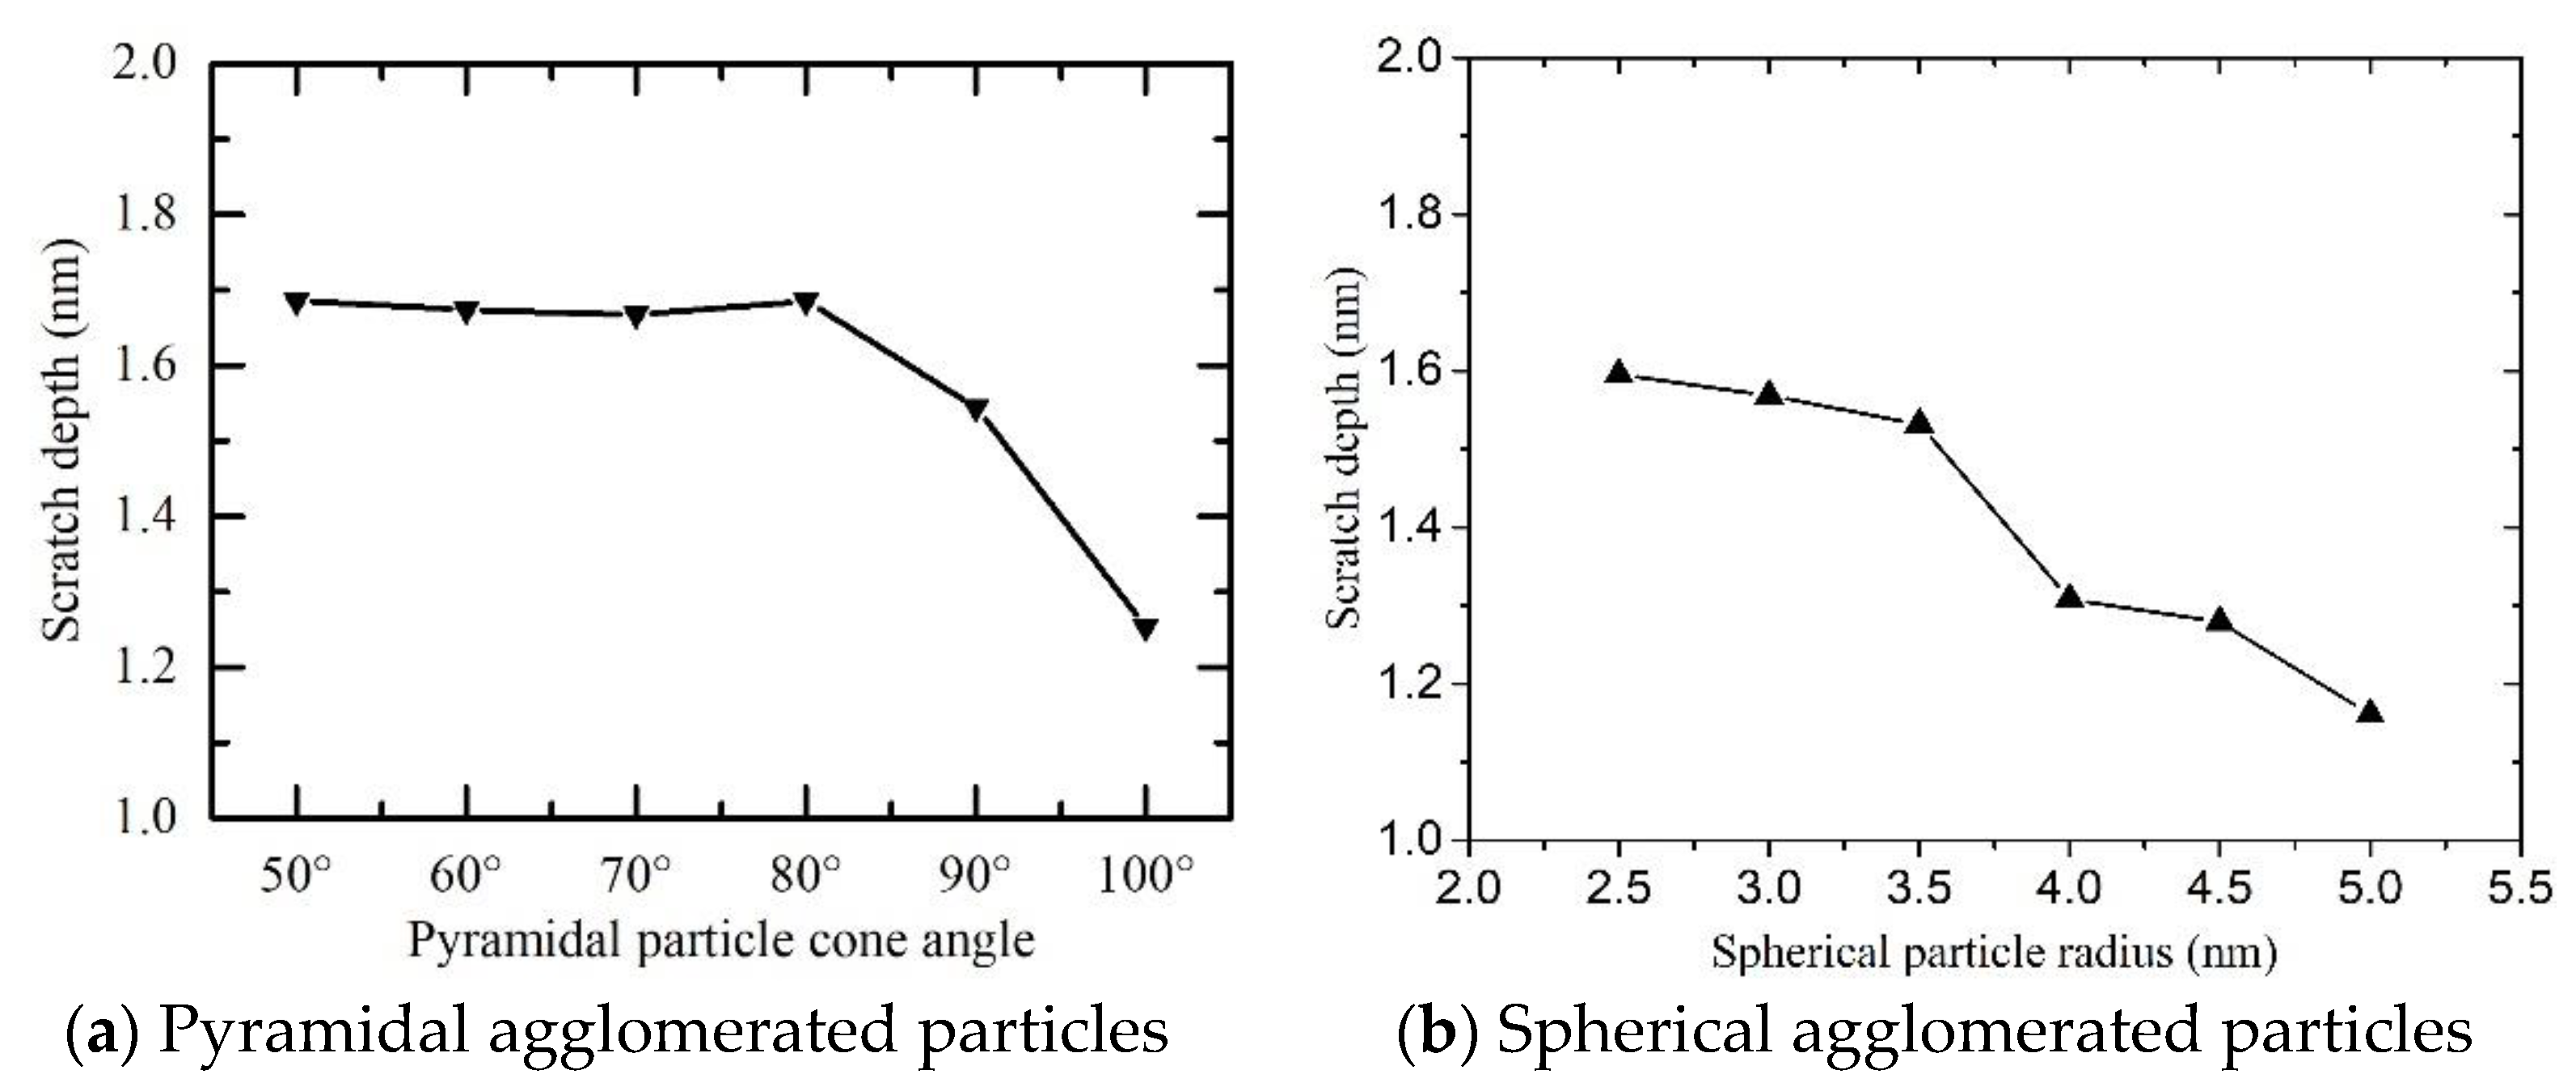
Figure 10.
The actual scratch depth with different shapes and sizes of agglomerated particles.
Figure 10.
The actual scratch depth with different shapes and sizes of agglomerated particles.
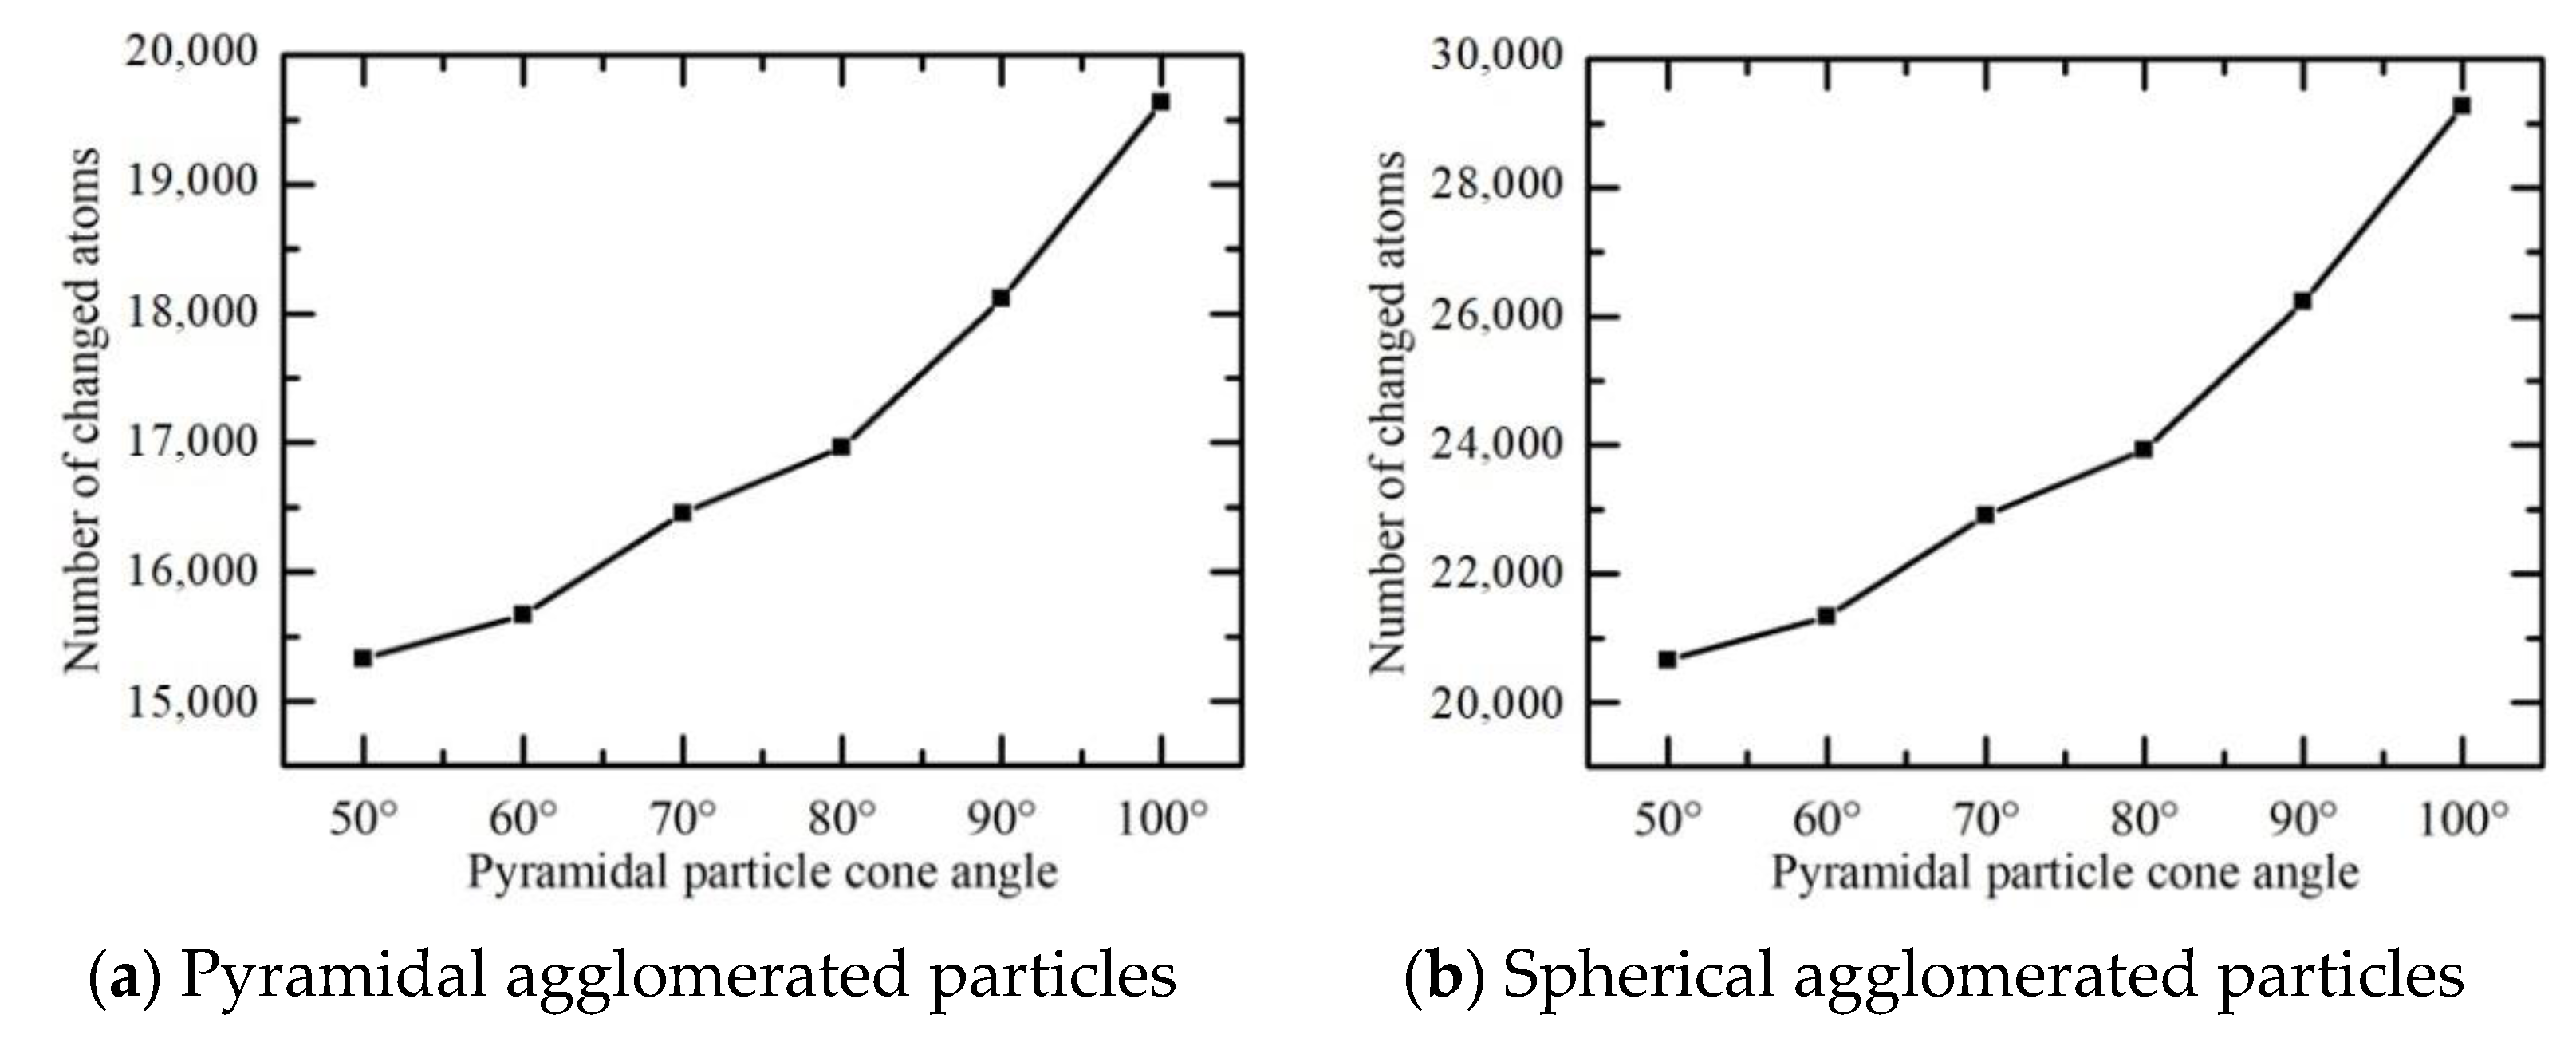
Figure 11.
The number of atoms undergoing atomic structural change with agglomerated particles of different shapes and sizes.
Figure 11.
The number of atoms undergoing atomic structural change with agglomerated particles of different shapes and sizes.
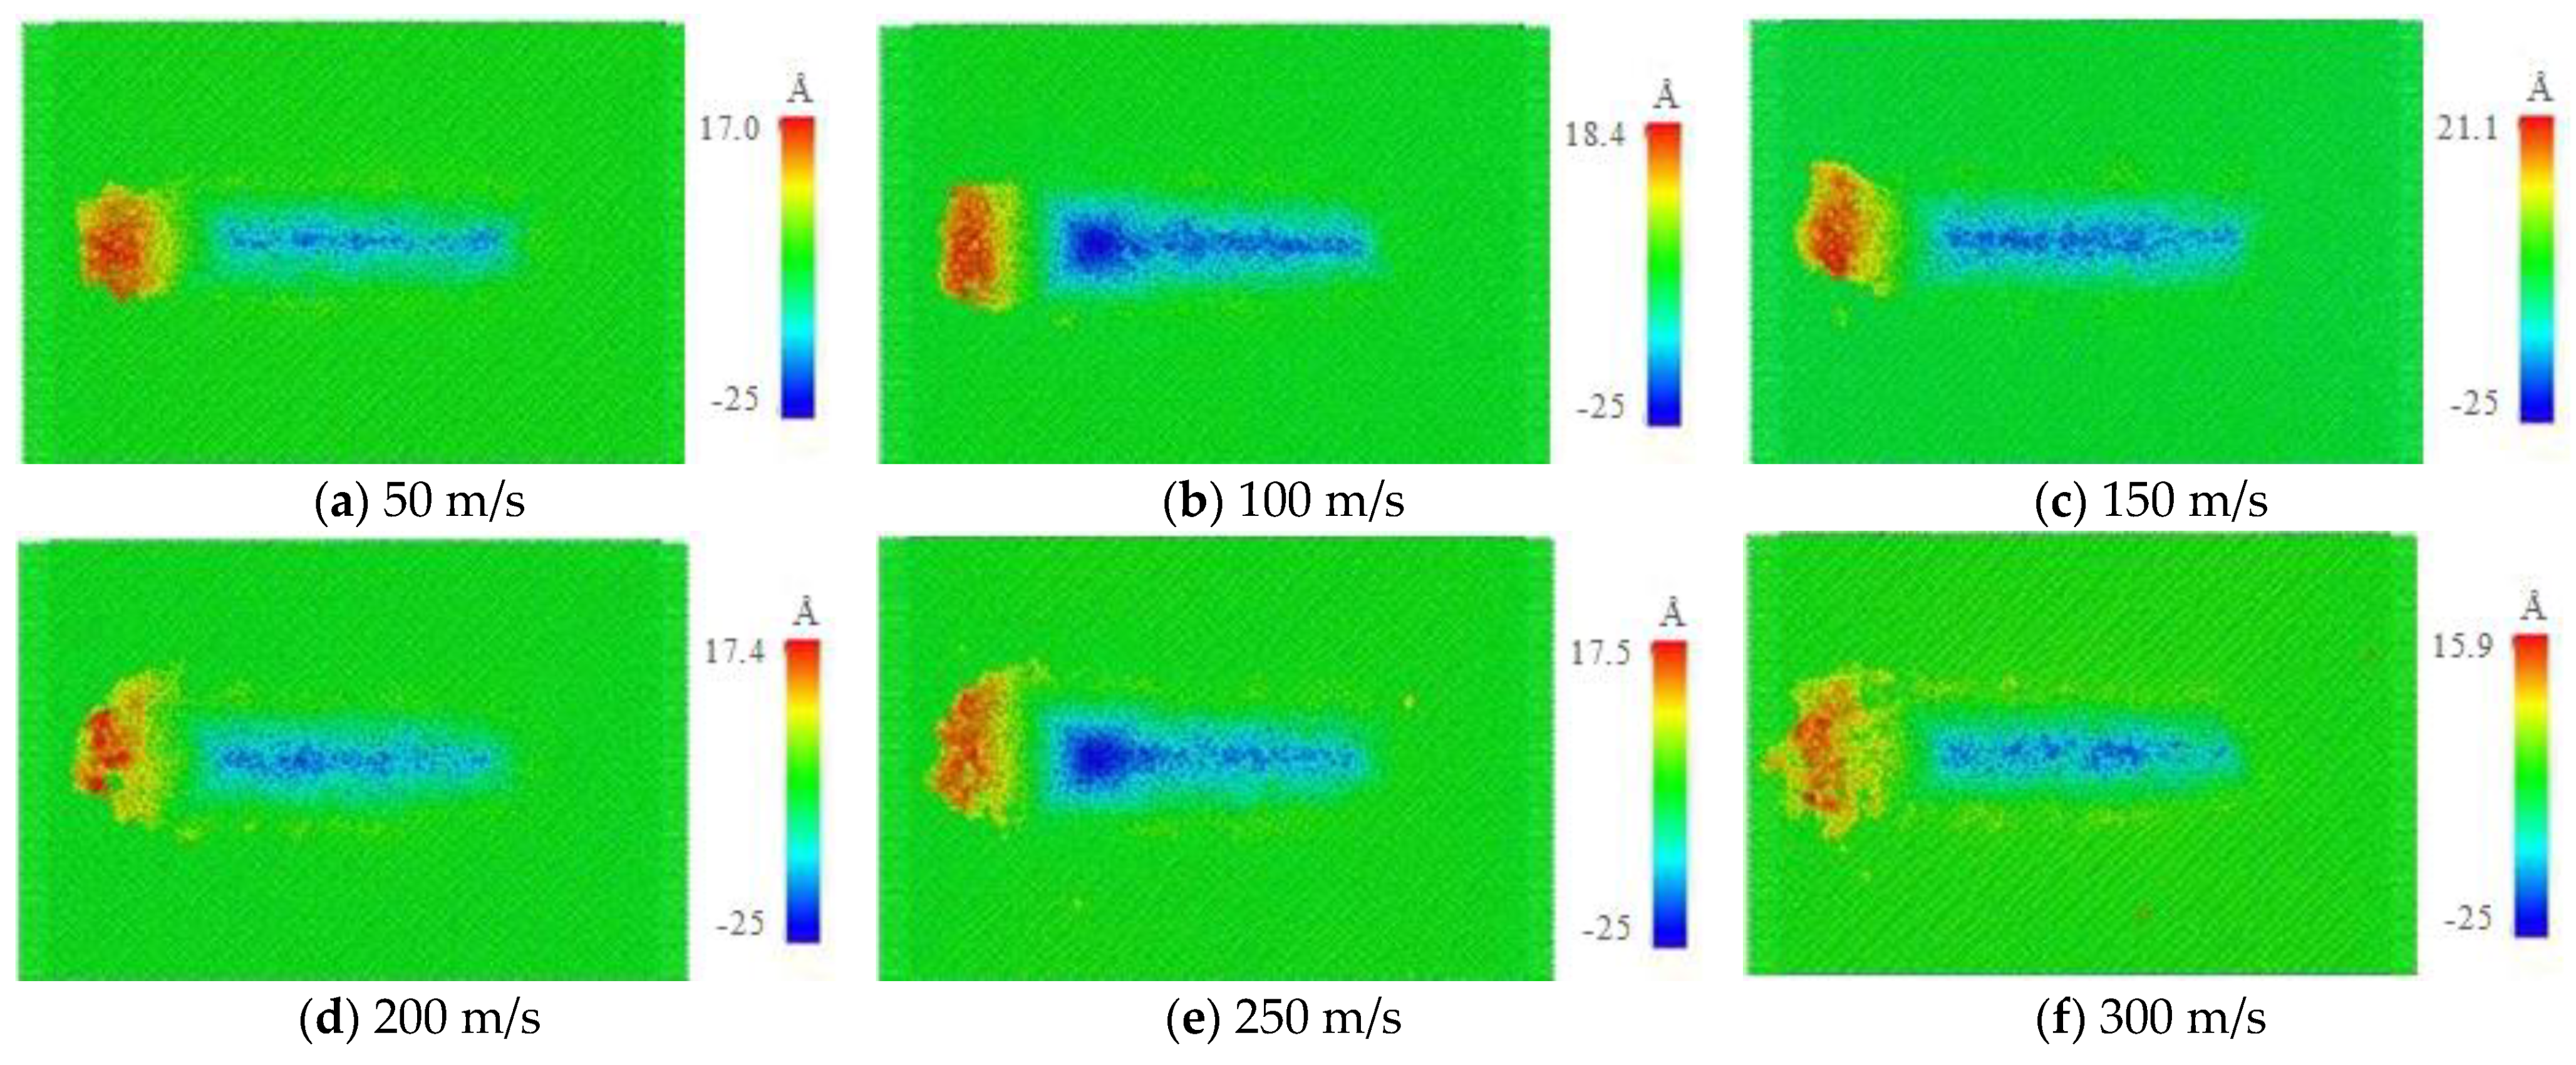
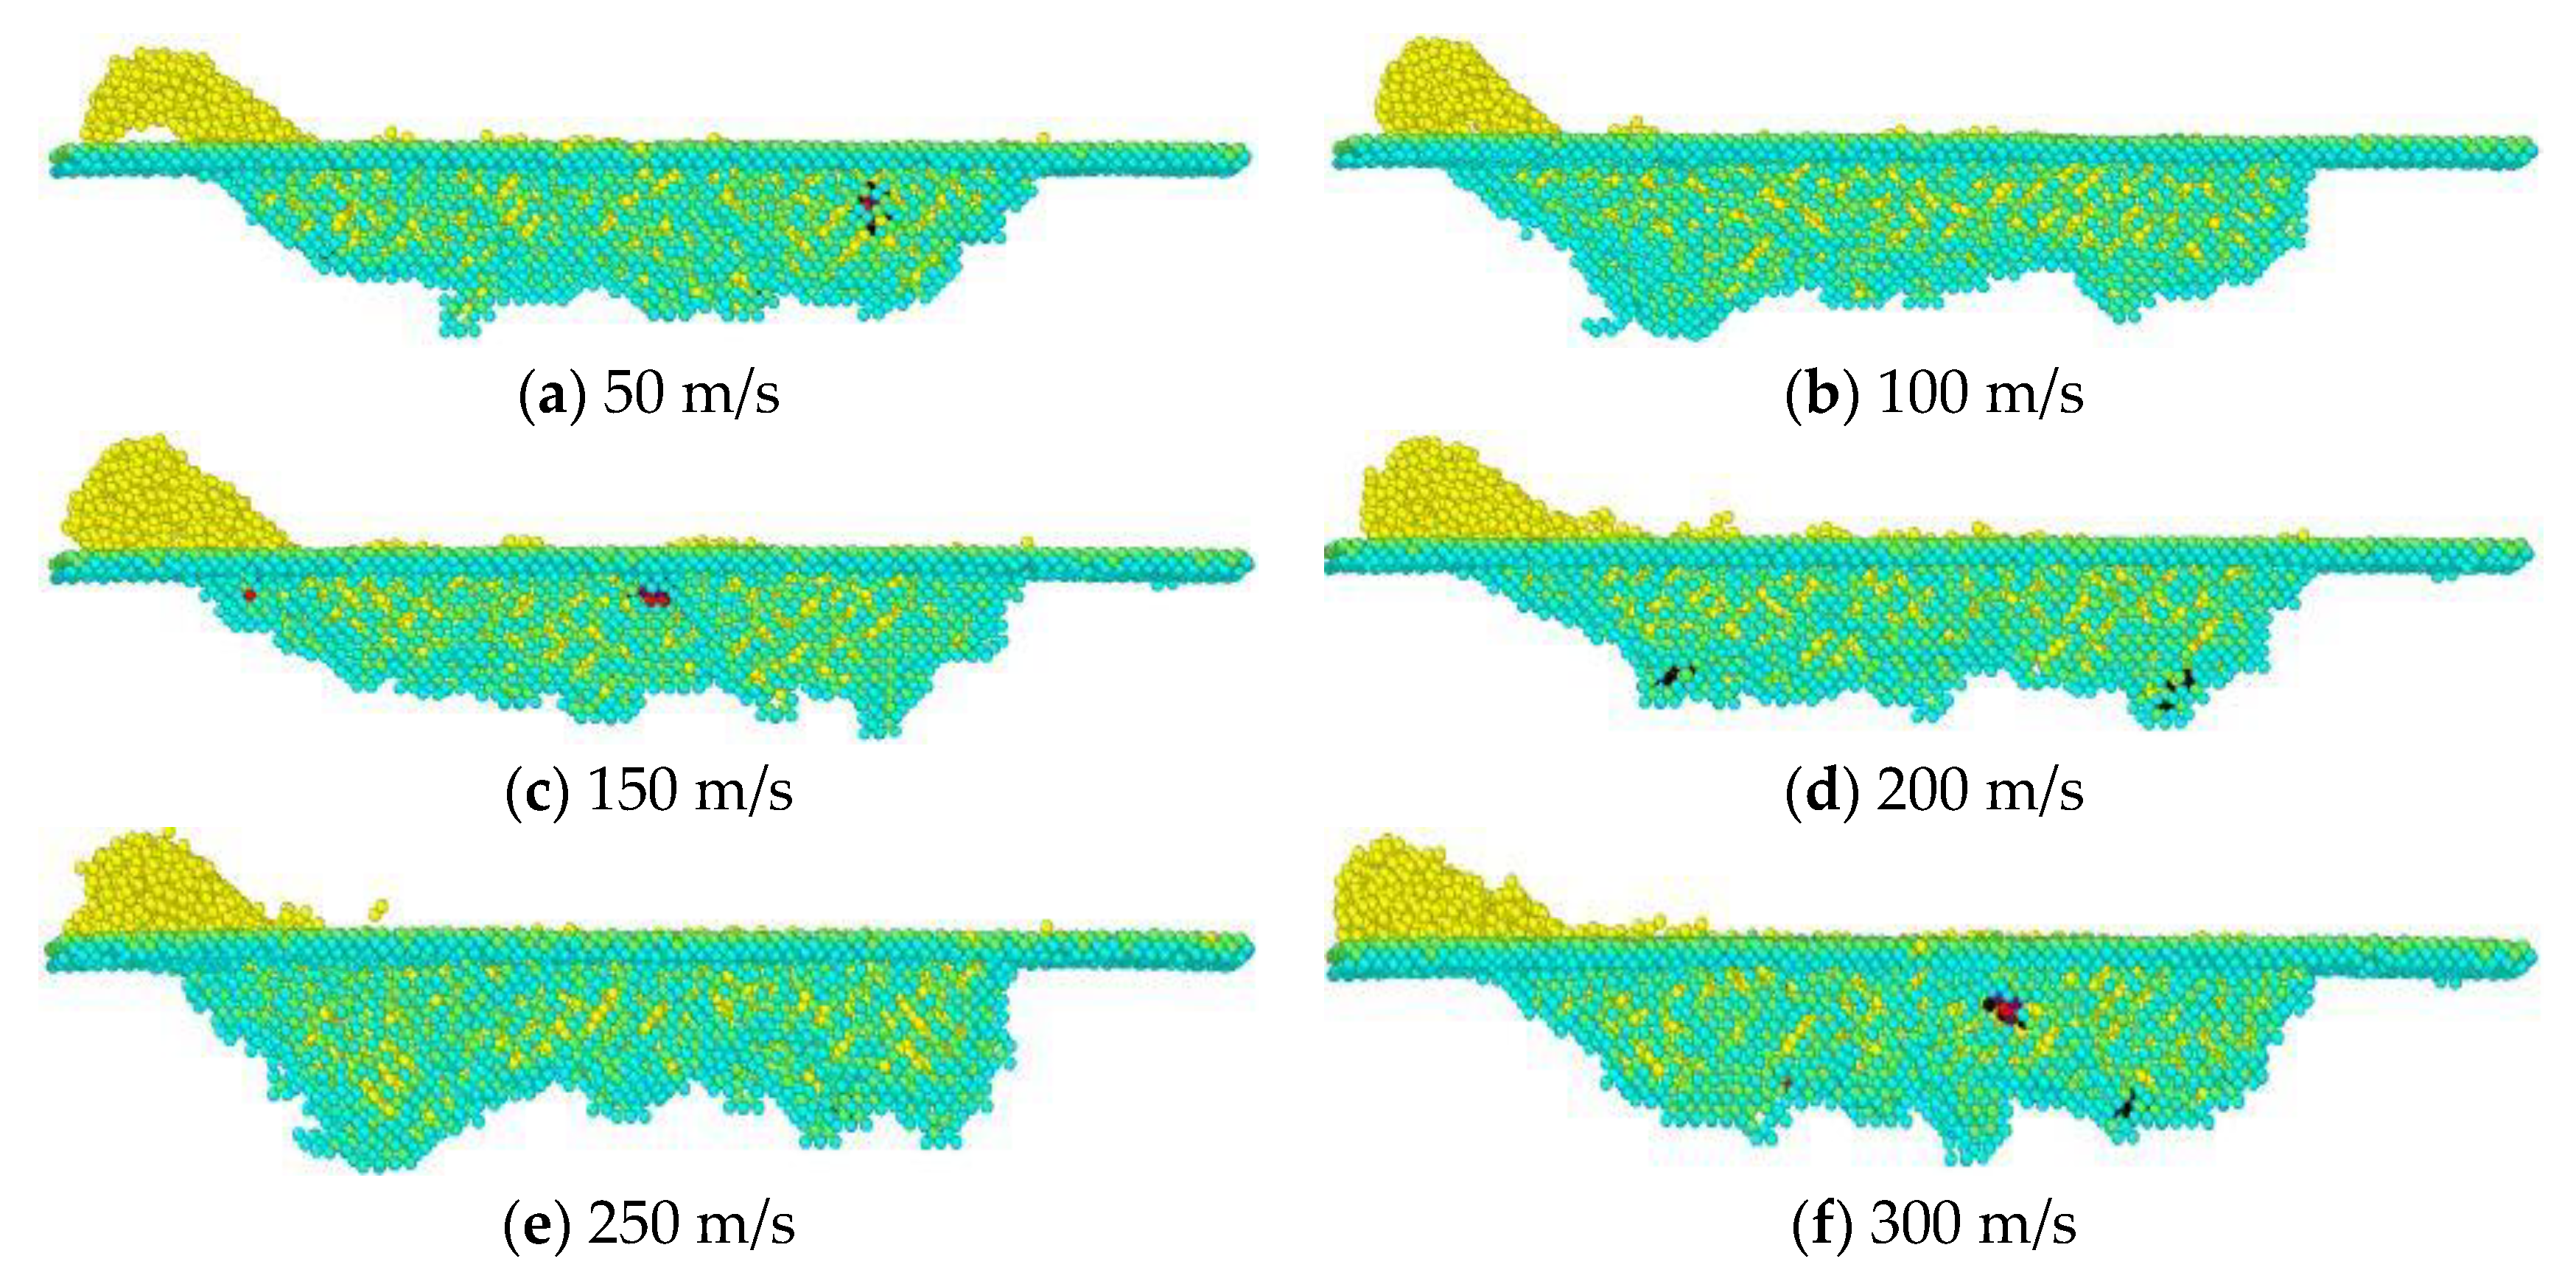
Figure 12.
Scratch damage morphology with different scratch speeds.
Figure 12.
Scratch damage morphology with different scratch speeds.
Figure 13.
Internal structure with different scratch speeds.
Figure 13.
Internal structure with different scratch speeds.
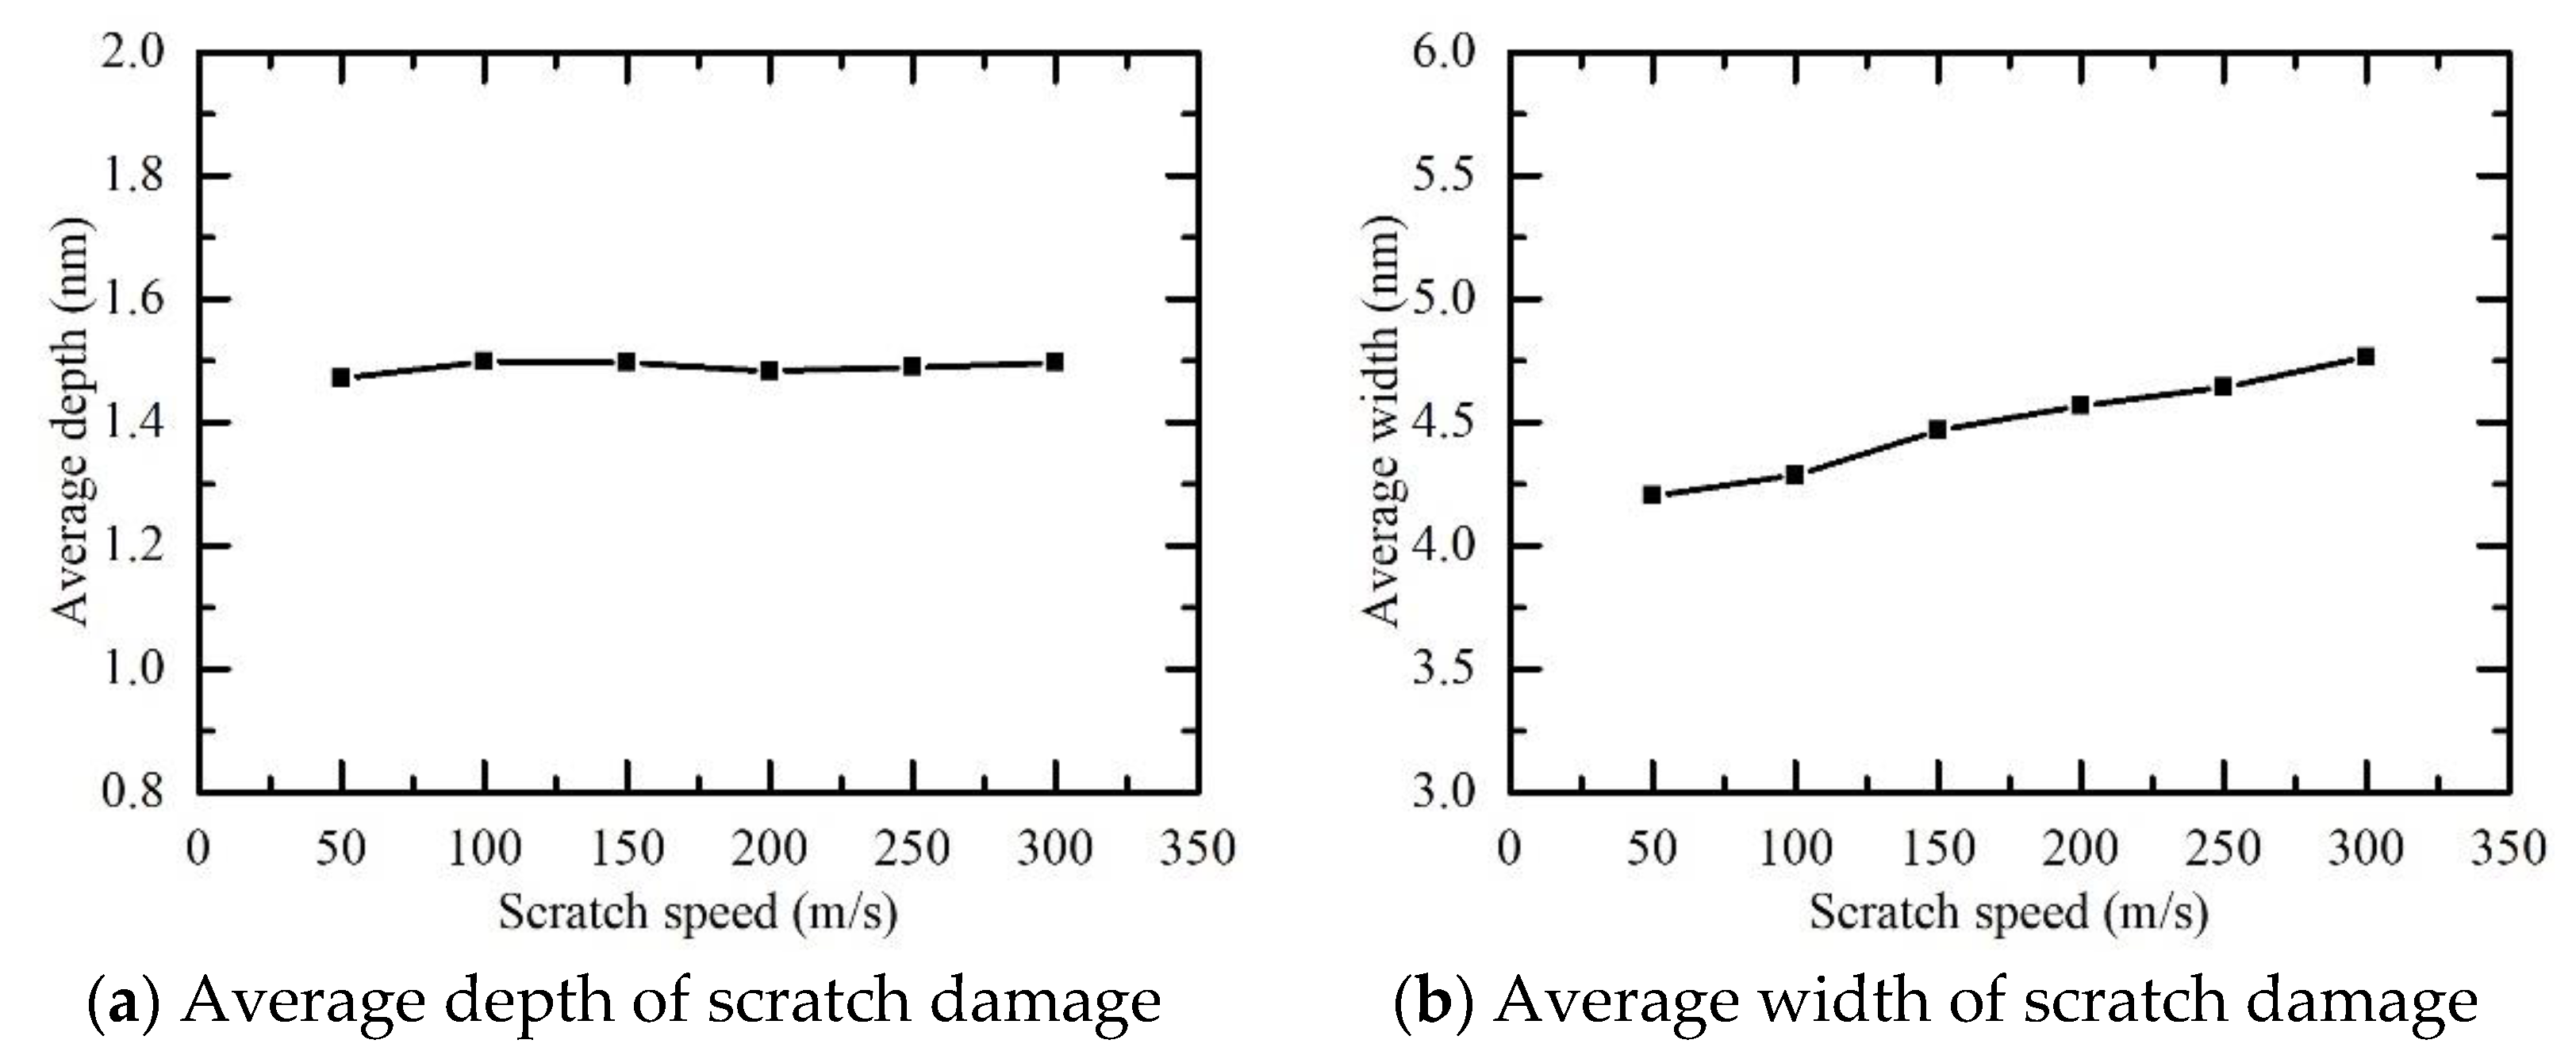
Figure 14.
Variation curve for average scratch damage depth and width.
Figure 14.
Variation curve for average scratch damage depth and width.
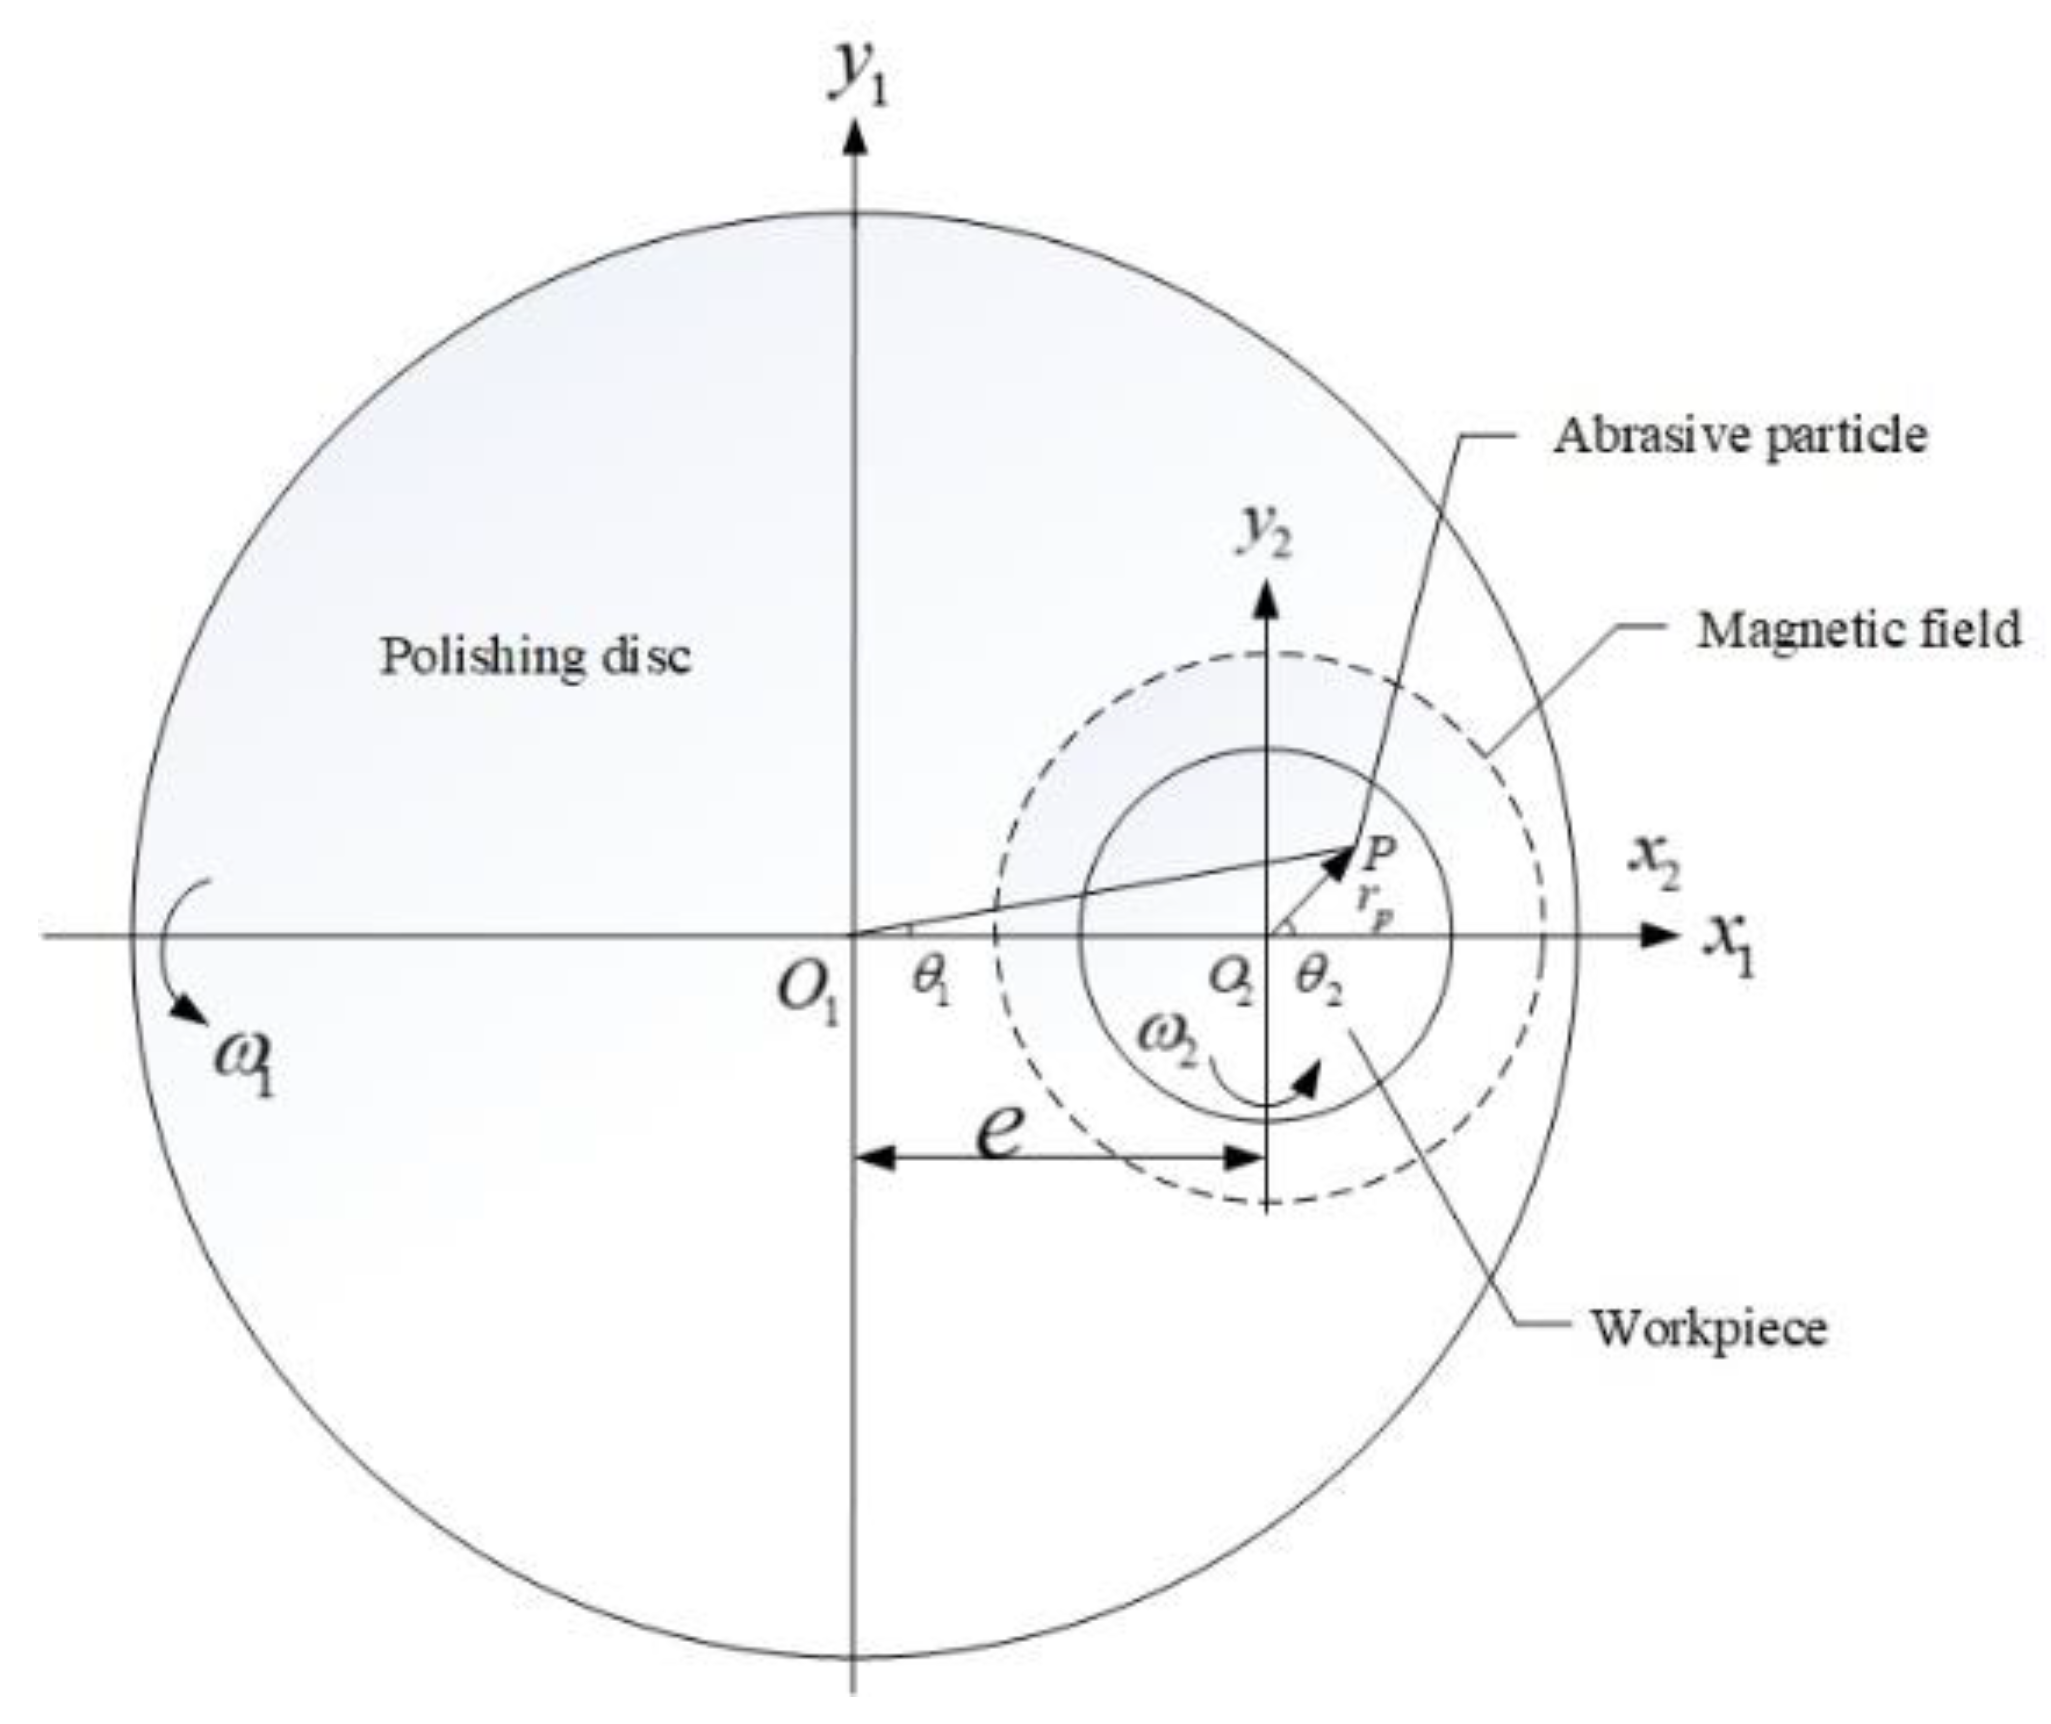
Figure 15.
Kinematic MRPF model.
Figure 15.
Kinematic MRPF model.
Figure 16.
Motion trajectory of agglomerated particles with different workpiece speeds.
Figure 16.
Motion trajectory of agglomerated particles with different workpiece speeds.
Figure 17.
Scratch damage depth with different workpiece speeds.
Figure 17.
Scratch damage depth with different workpiece speeds.
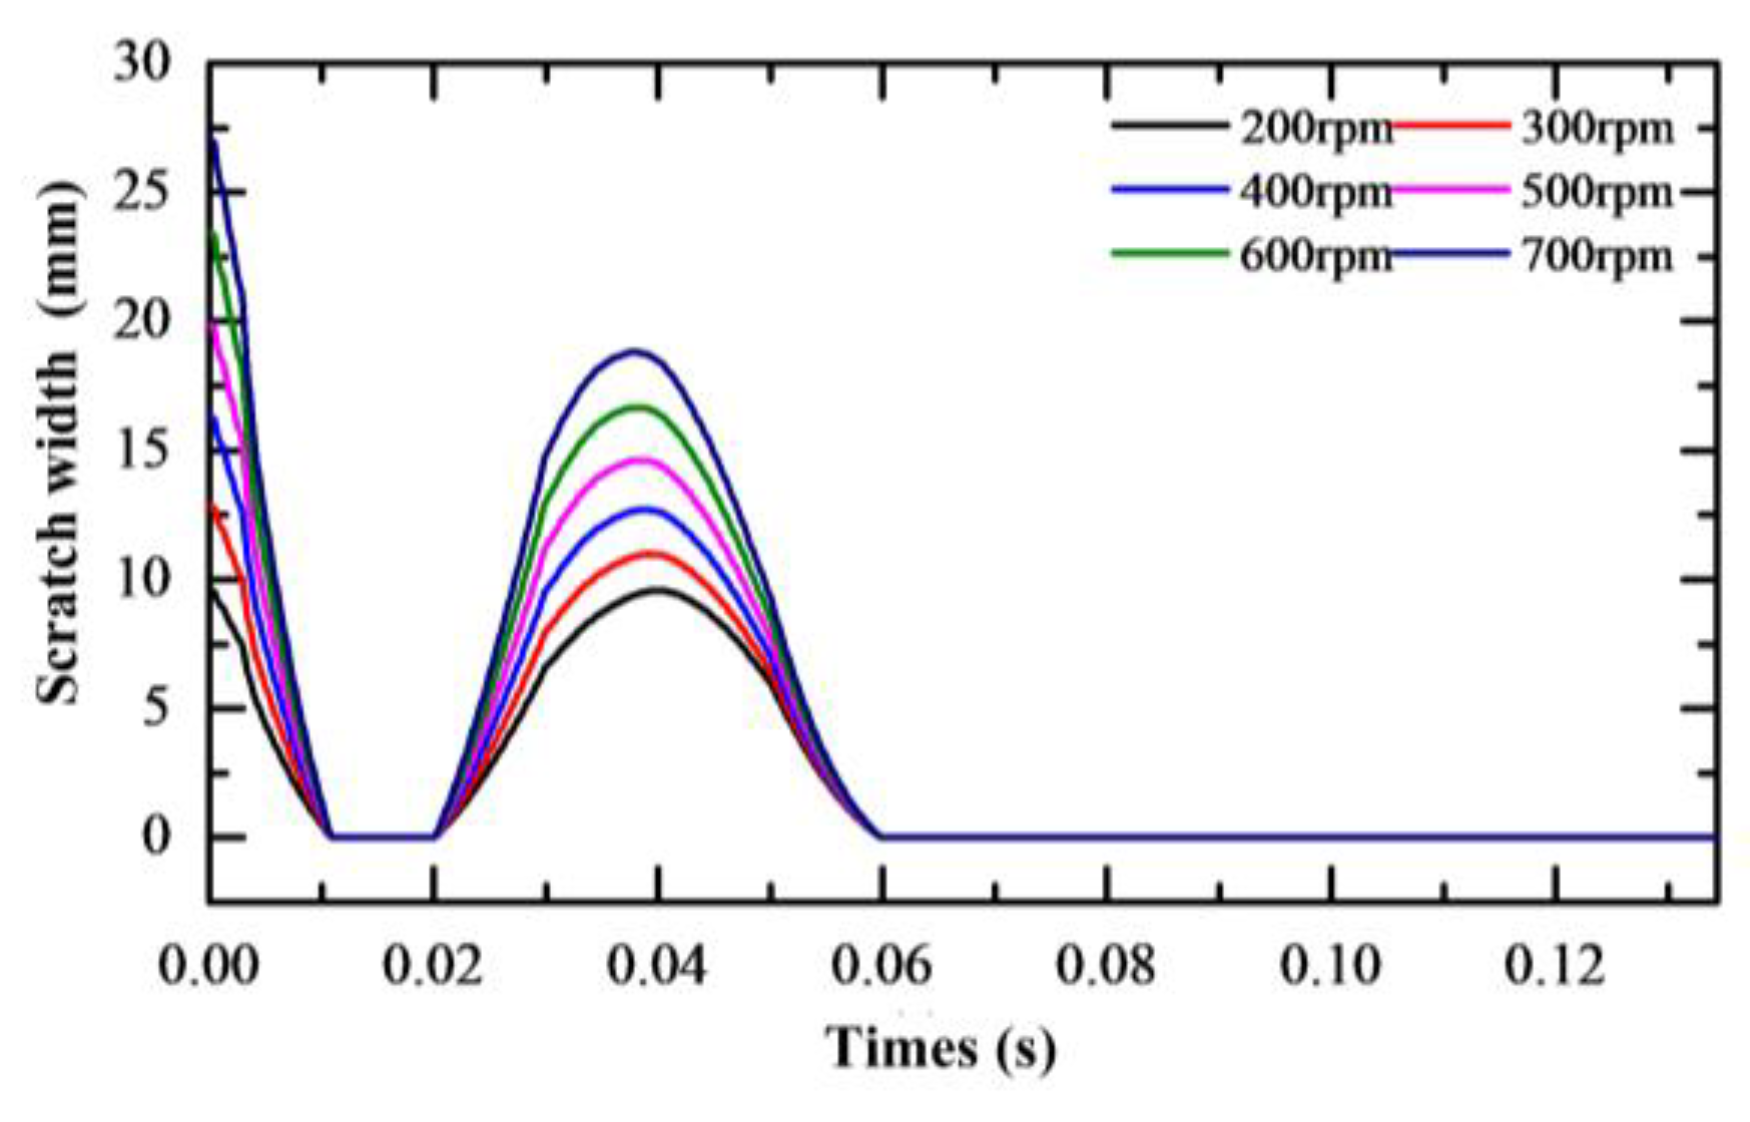
Figure 18.
Scratch damage width with different workpiece speeds.
Figure 18.
Scratch damage width with different workpiece speeds.
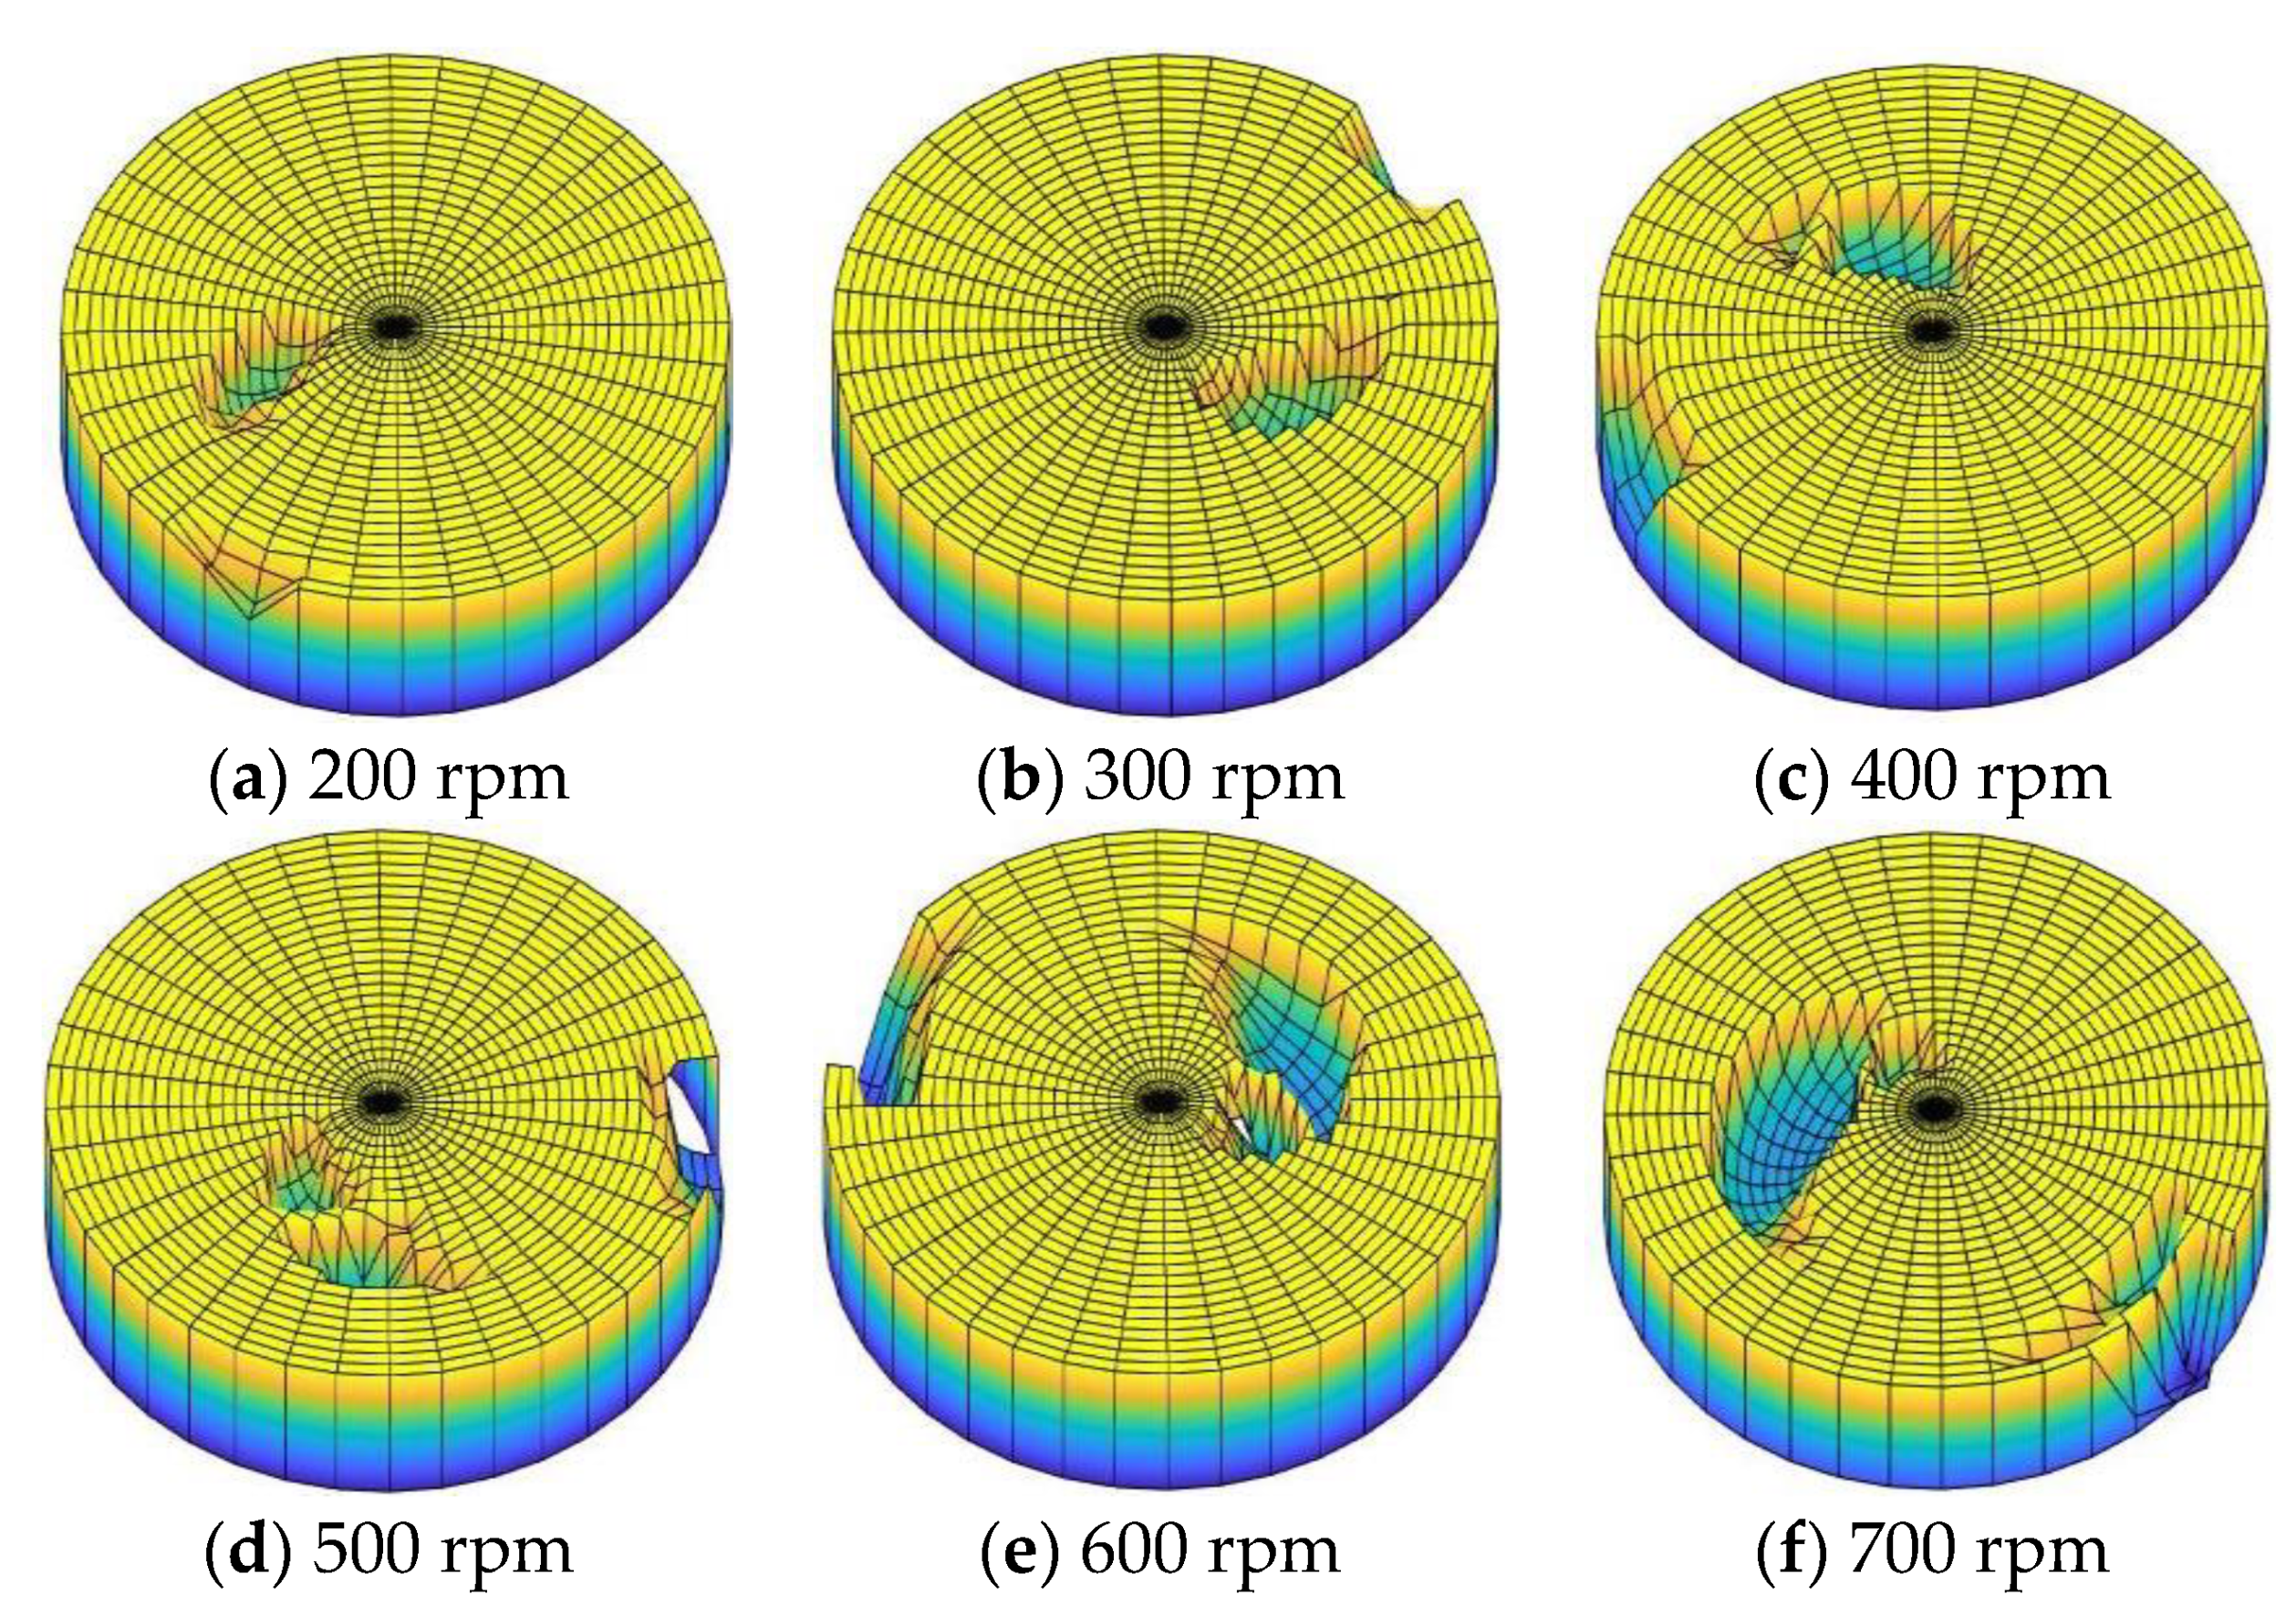
Figure 19.
Scratch damage morphology on the workpiece surface with different workpiece speeds.
Figure 19.
Scratch damage morphology on the workpiece surface with different workpiece speeds.
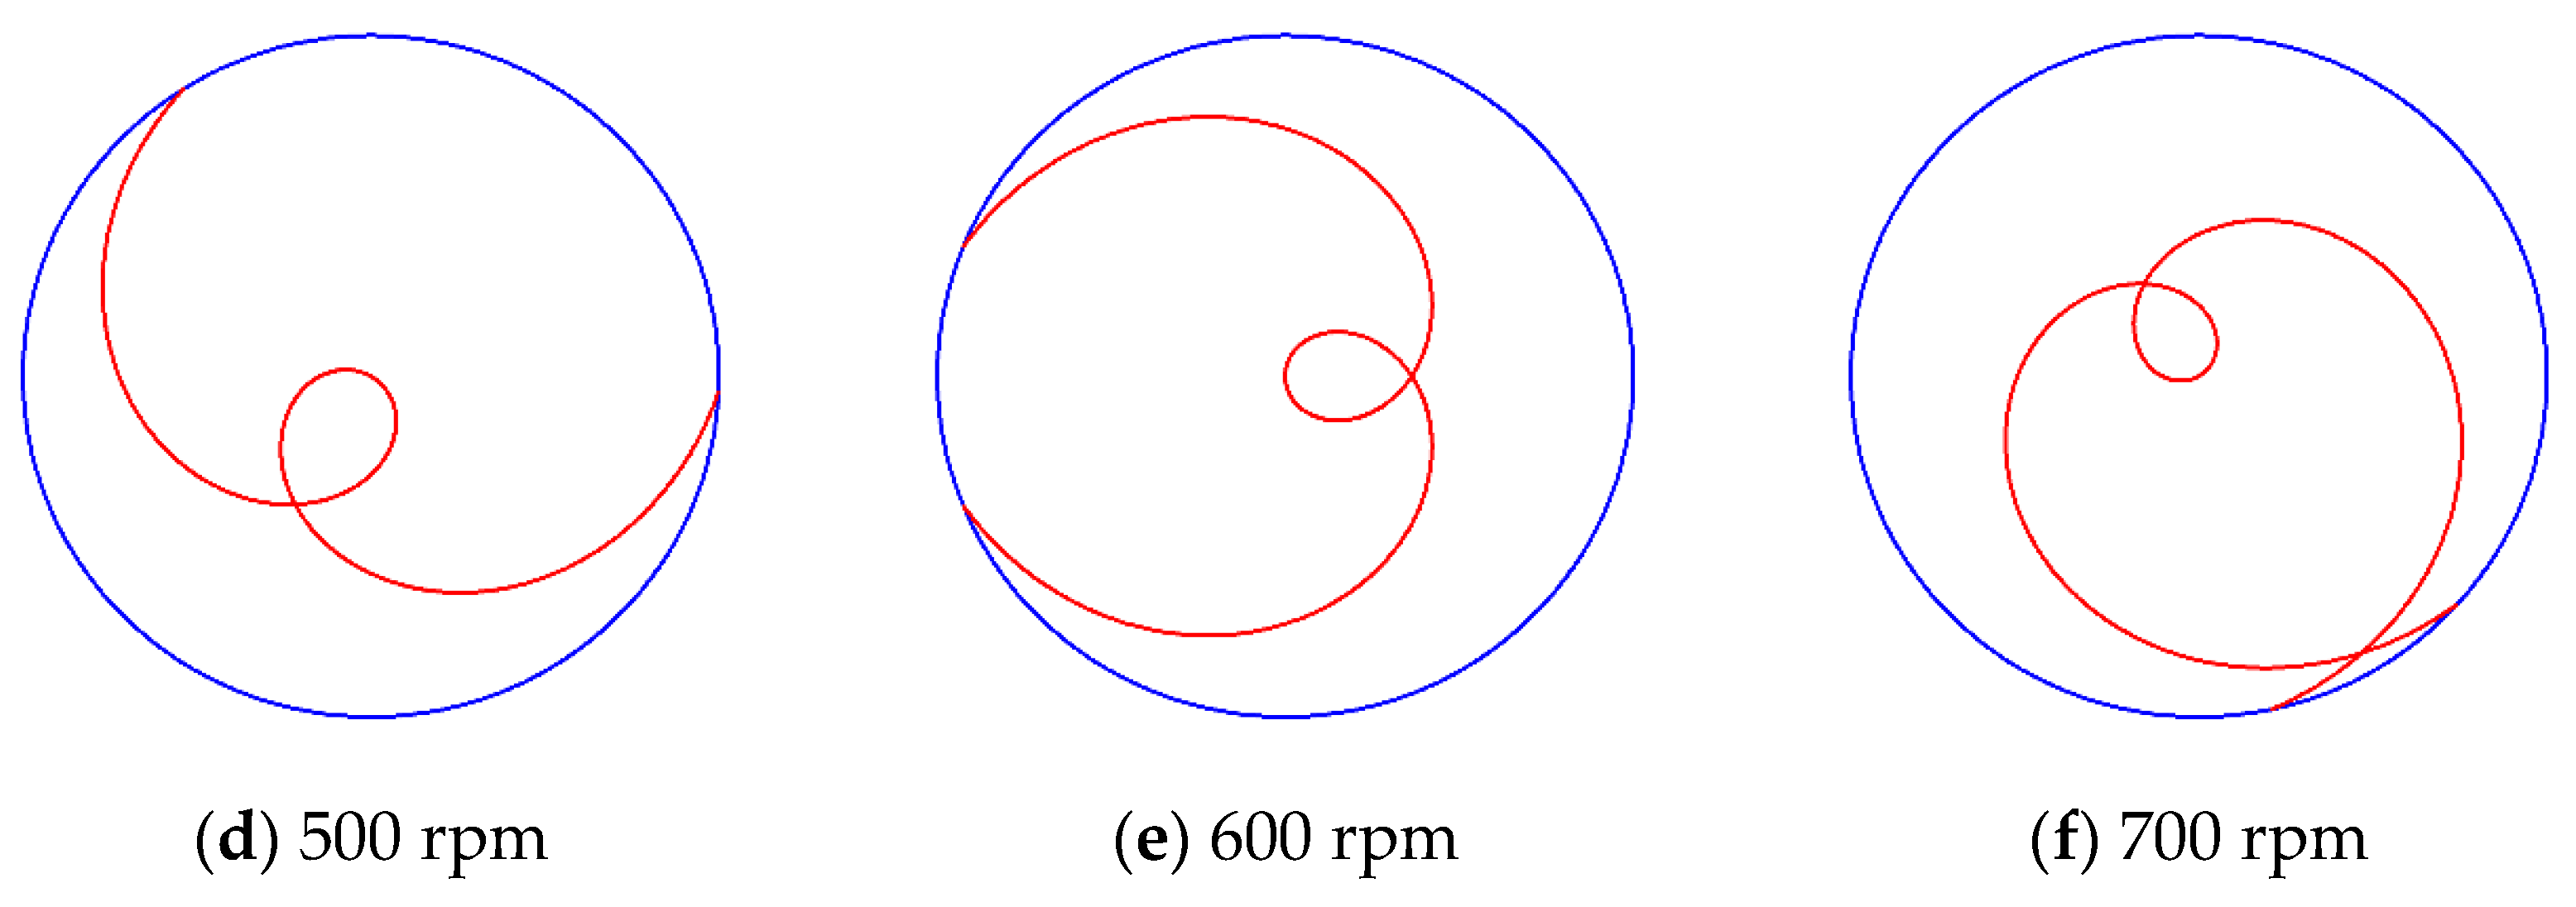
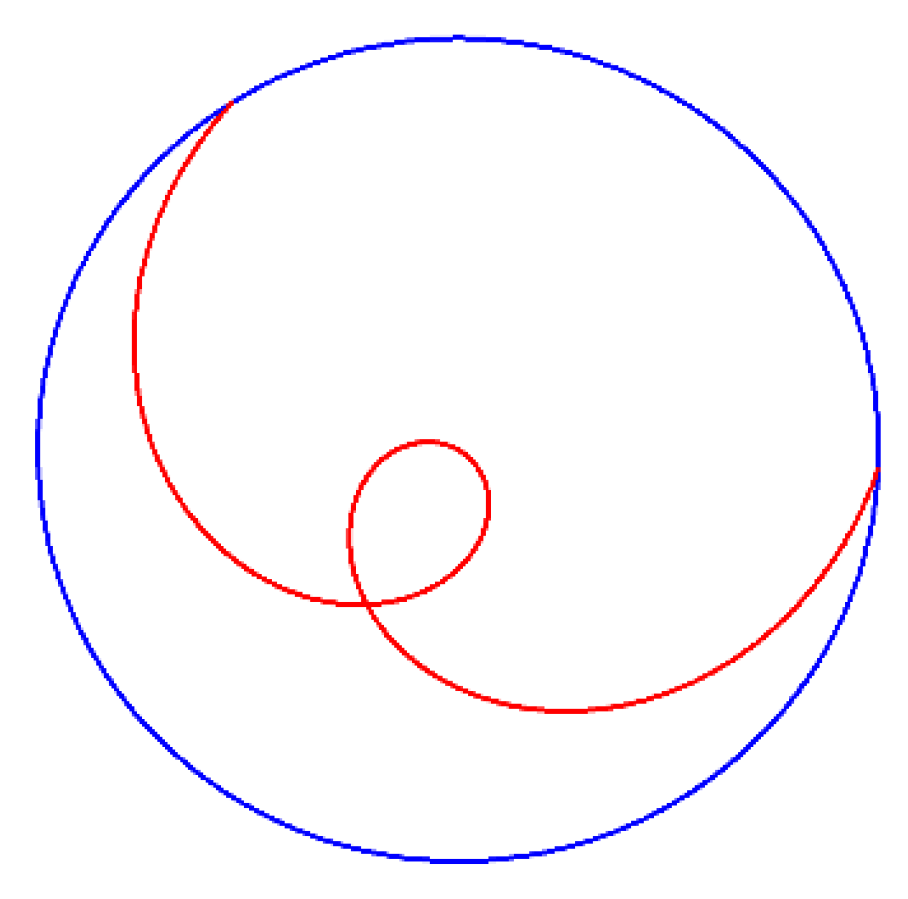
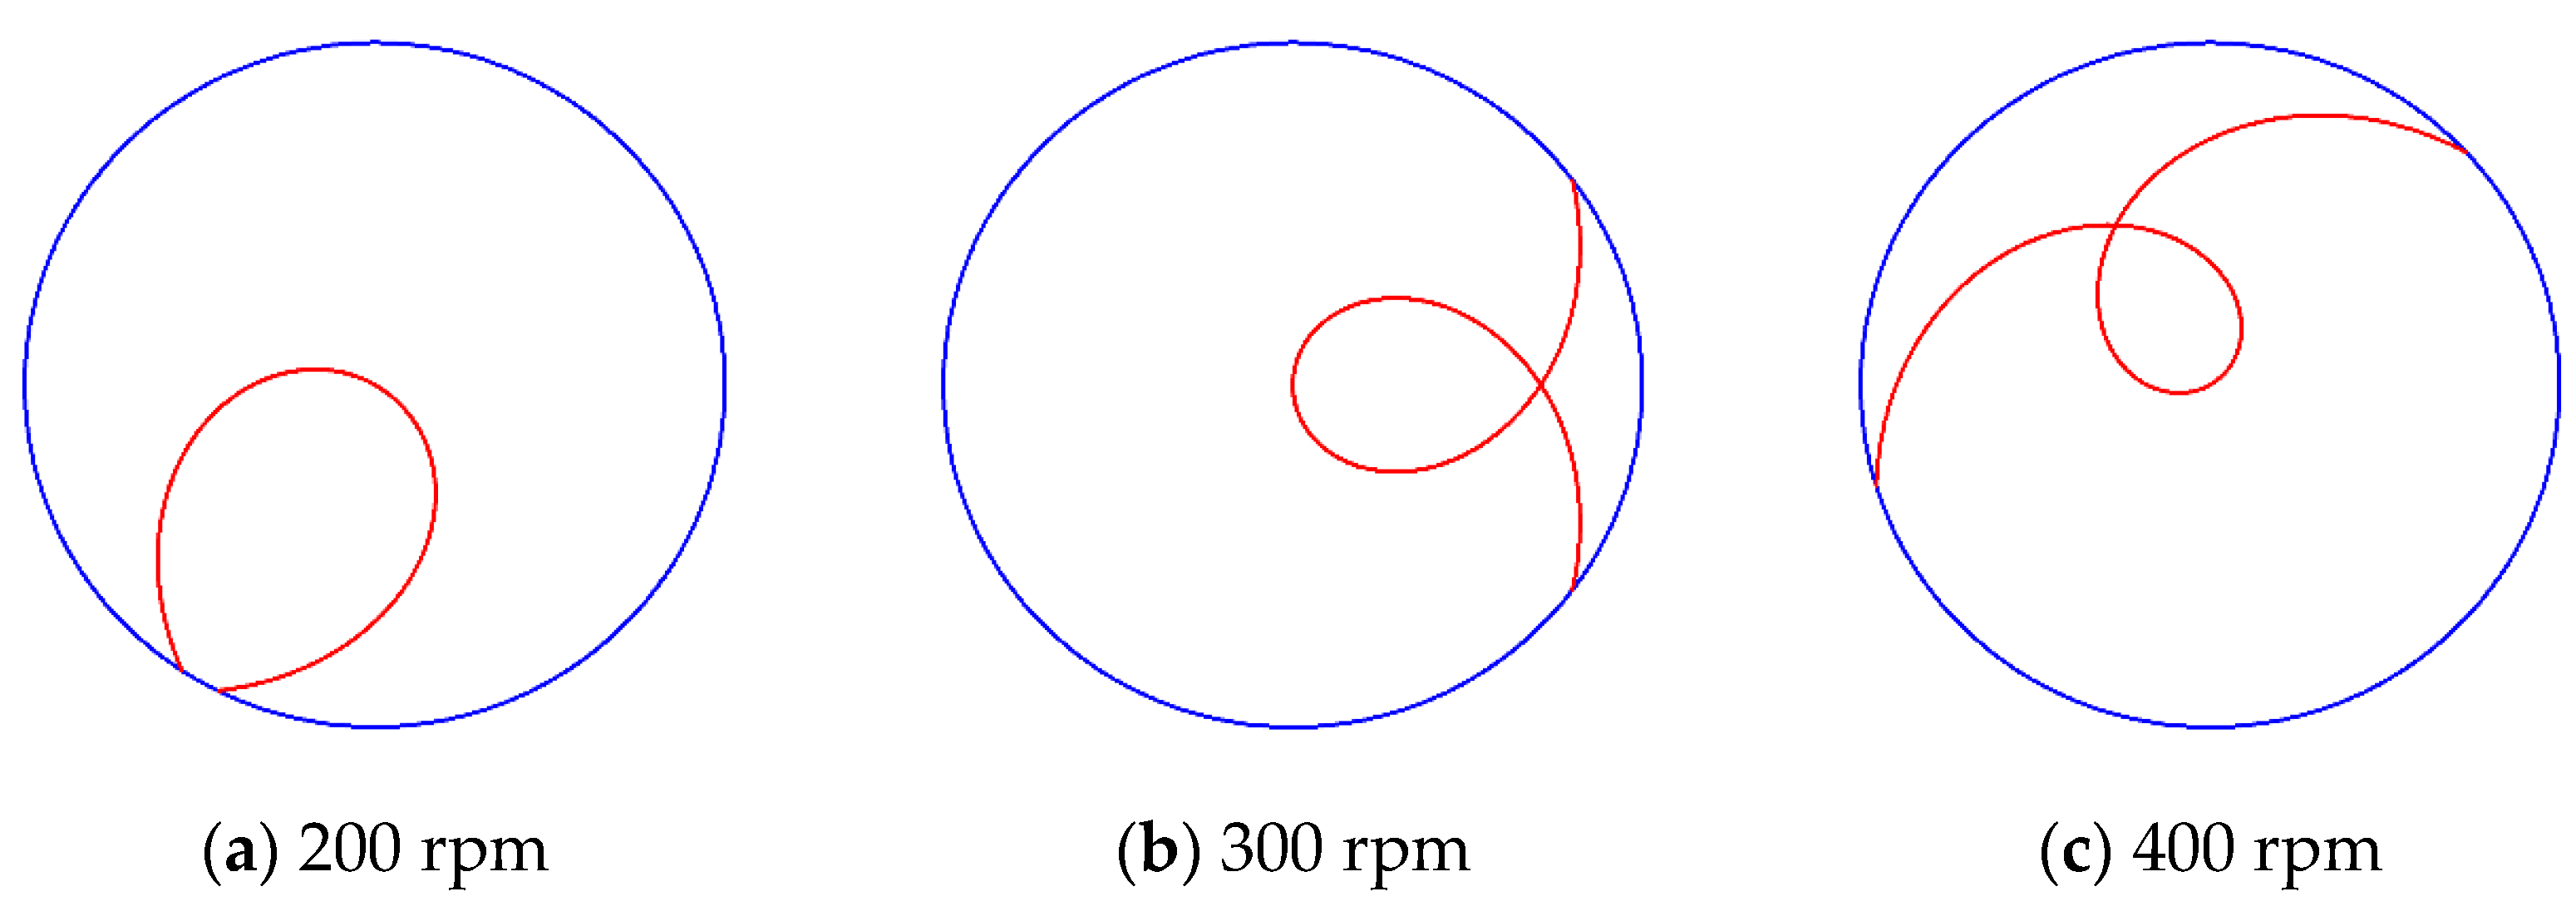
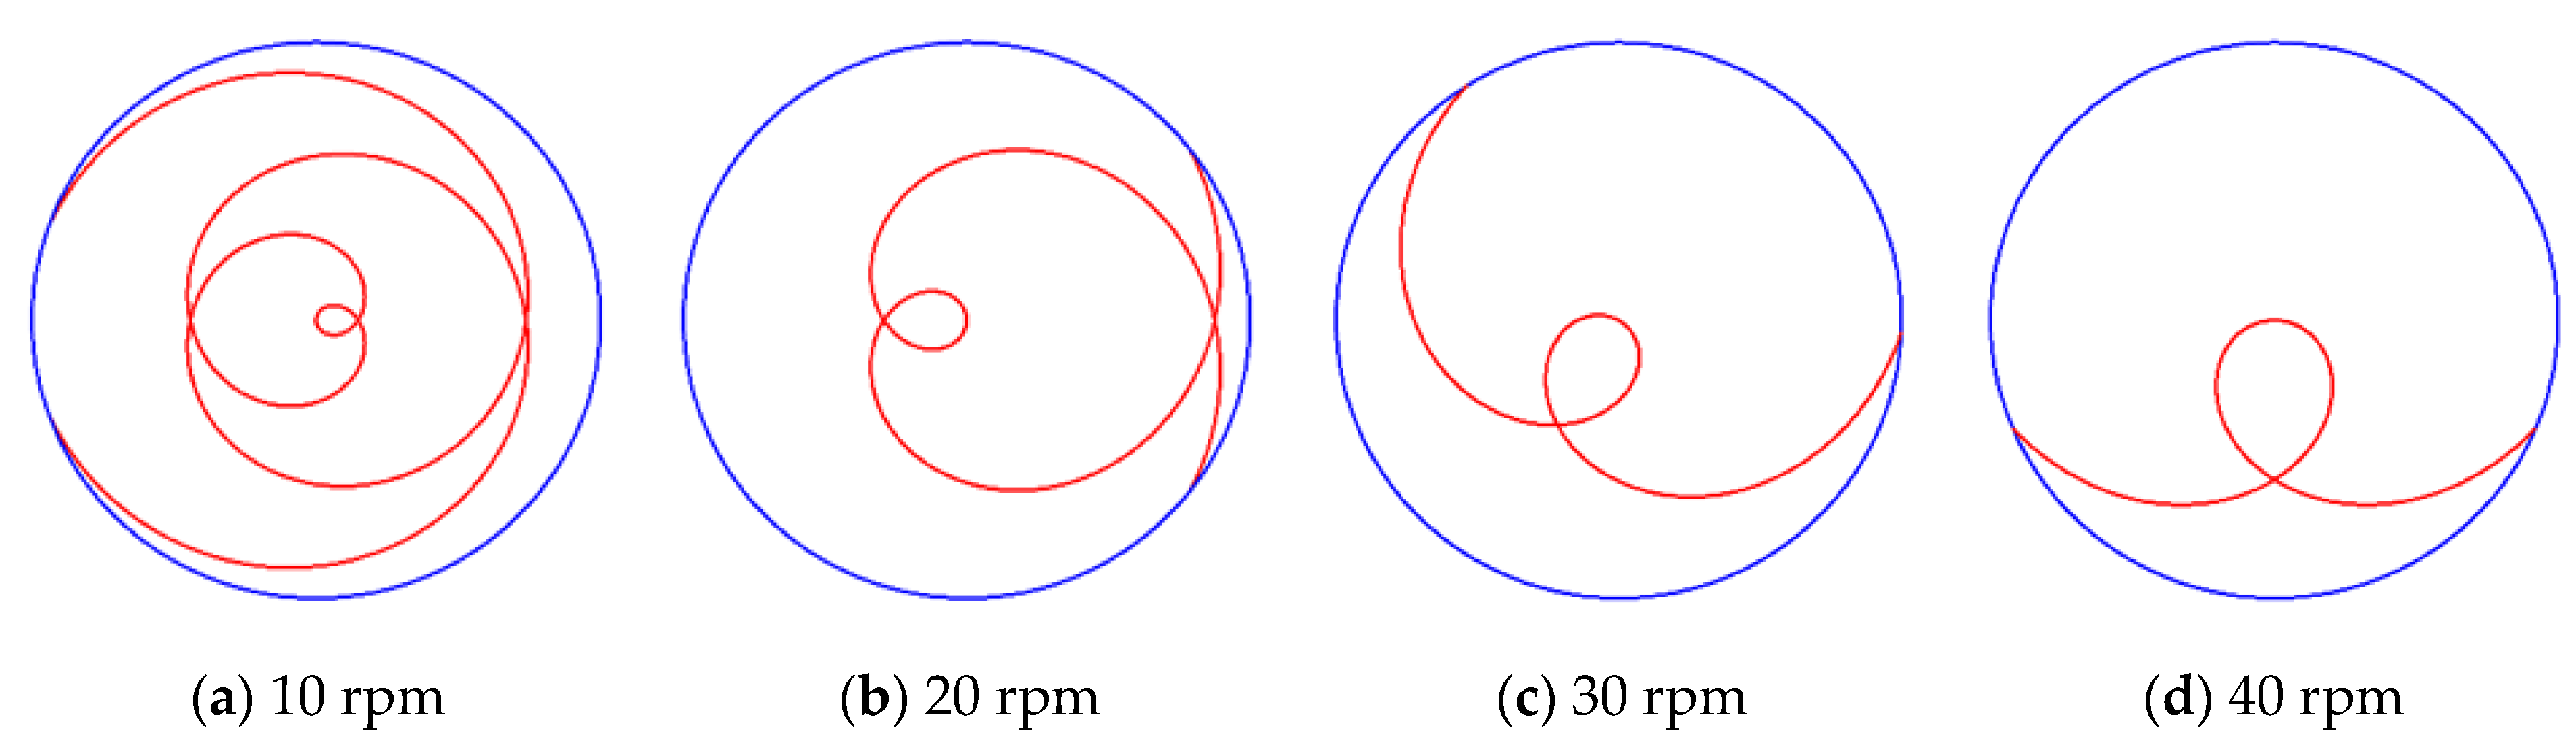
Figure 20.
Motion trajectory of agglomerated particles with different polishing disc speeds.
Figure 20.
Motion trajectory of agglomerated particles with different polishing disc speeds.
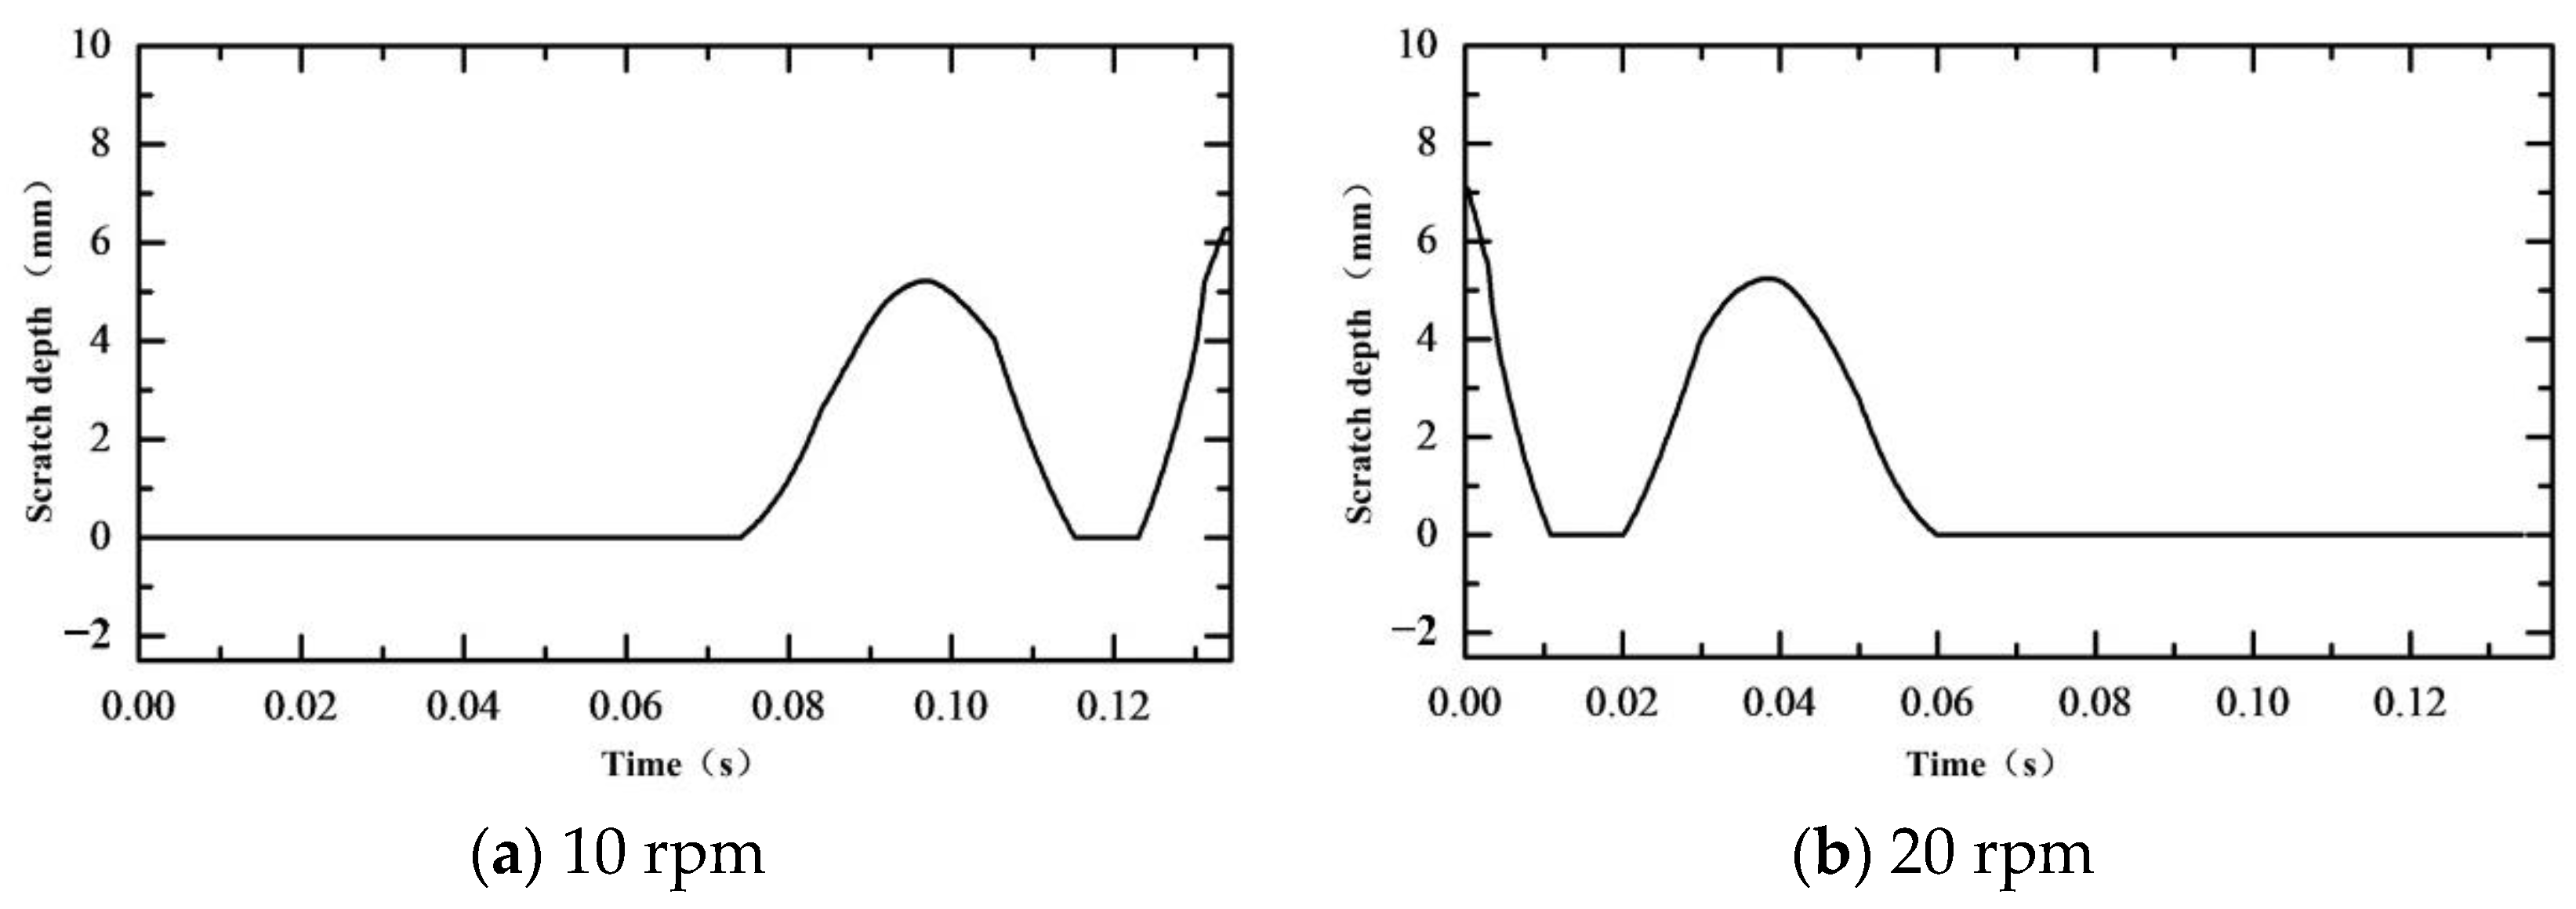
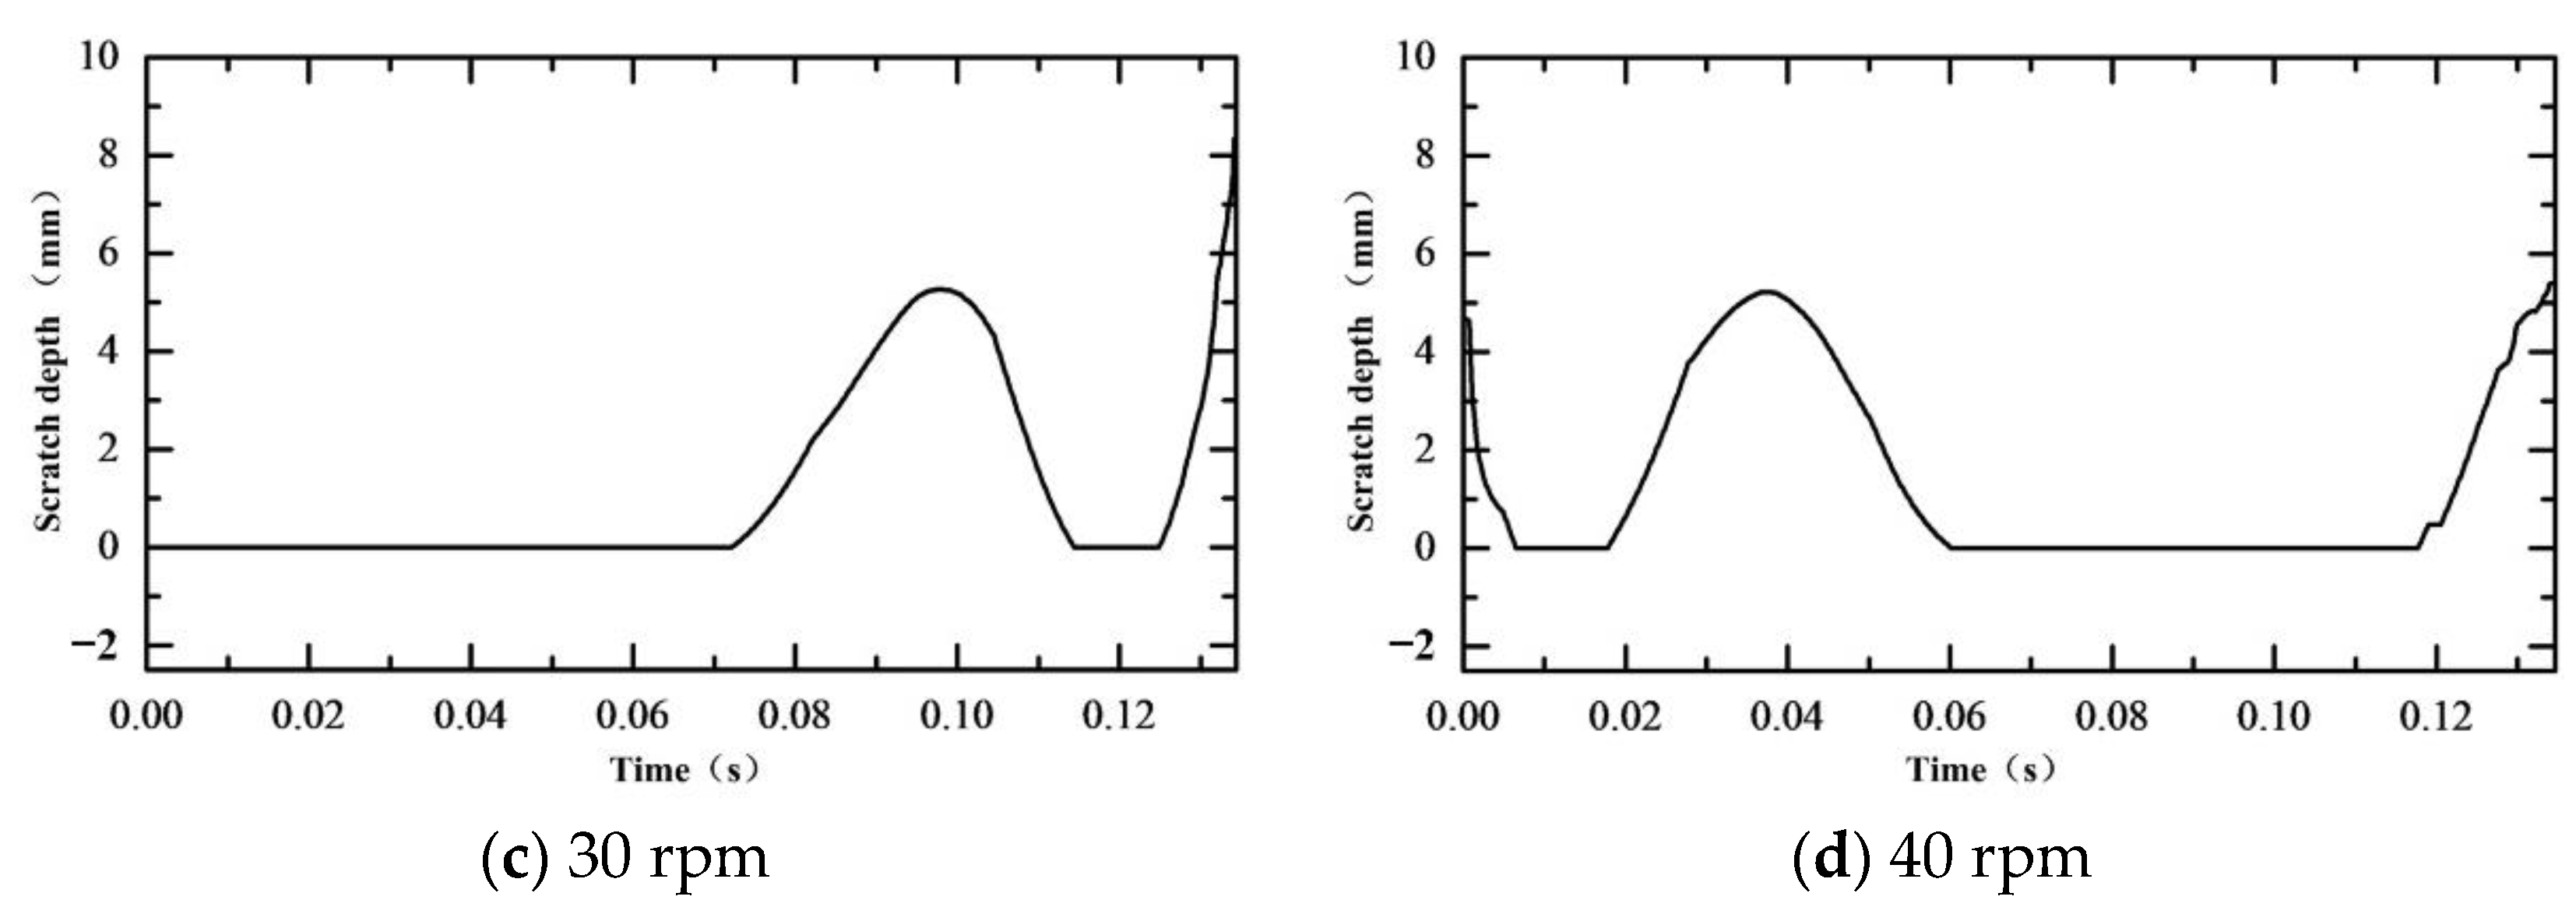
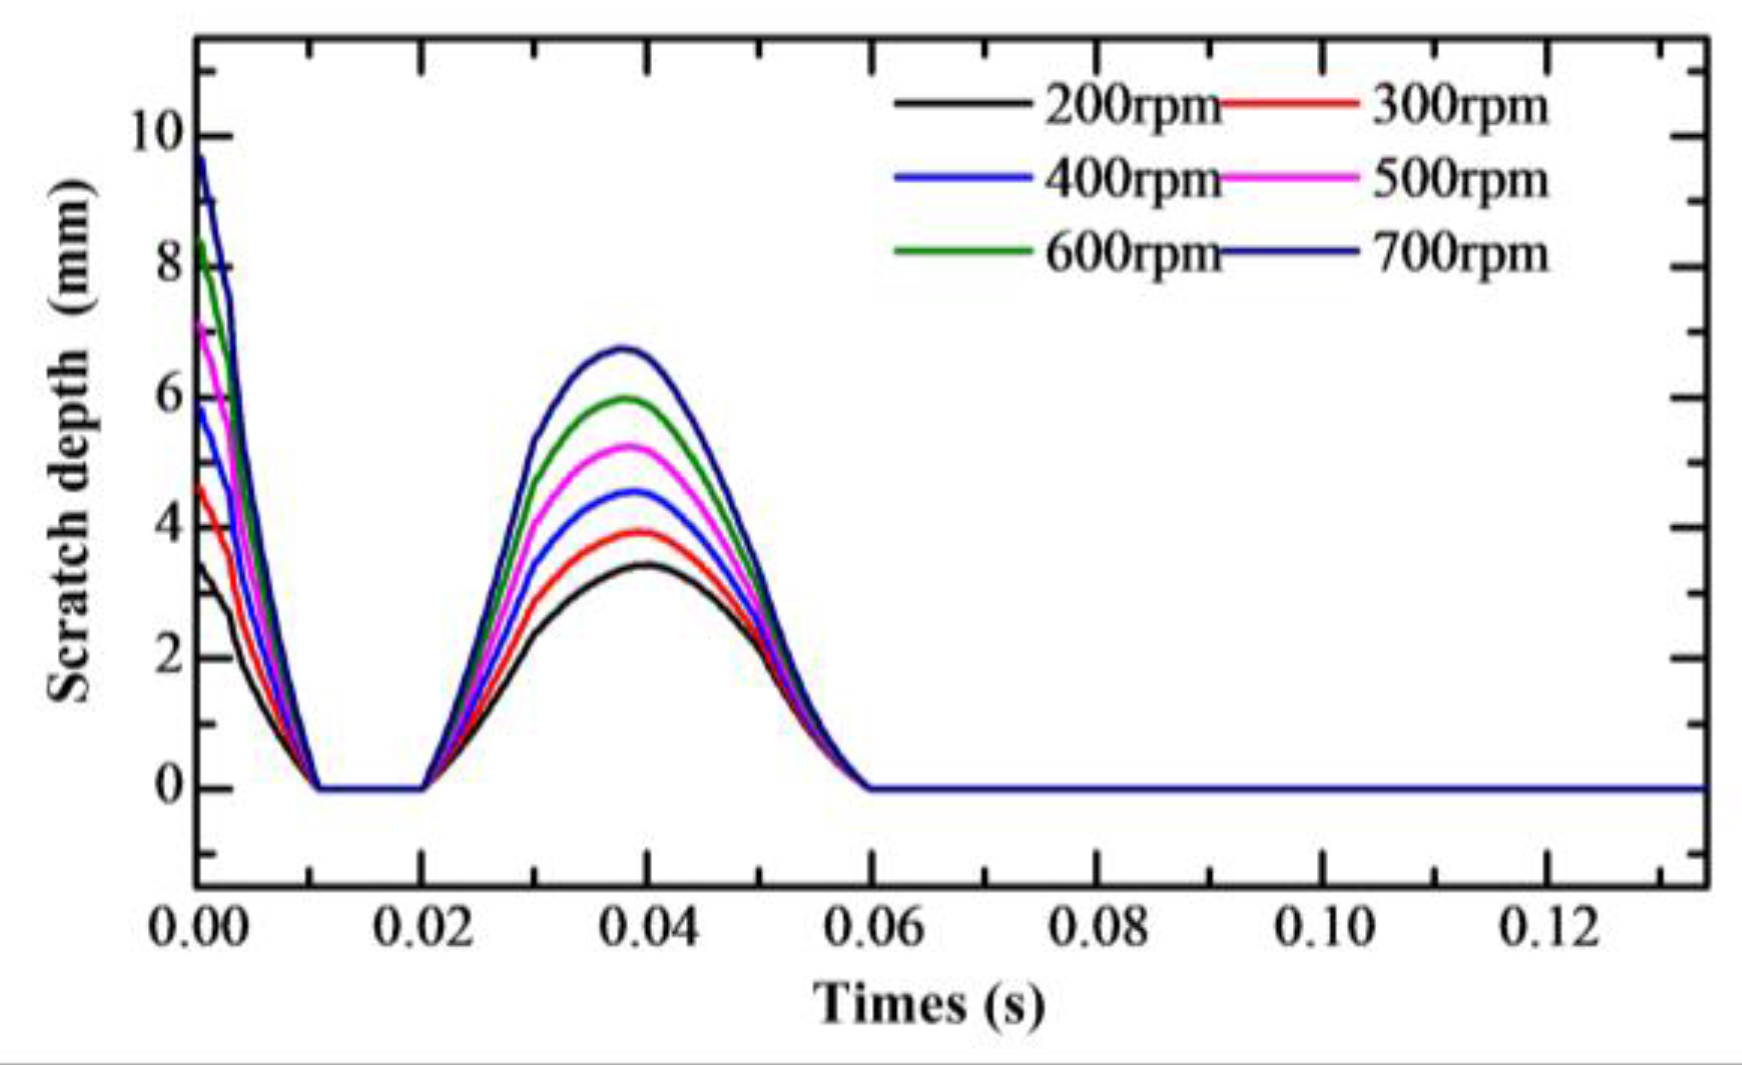
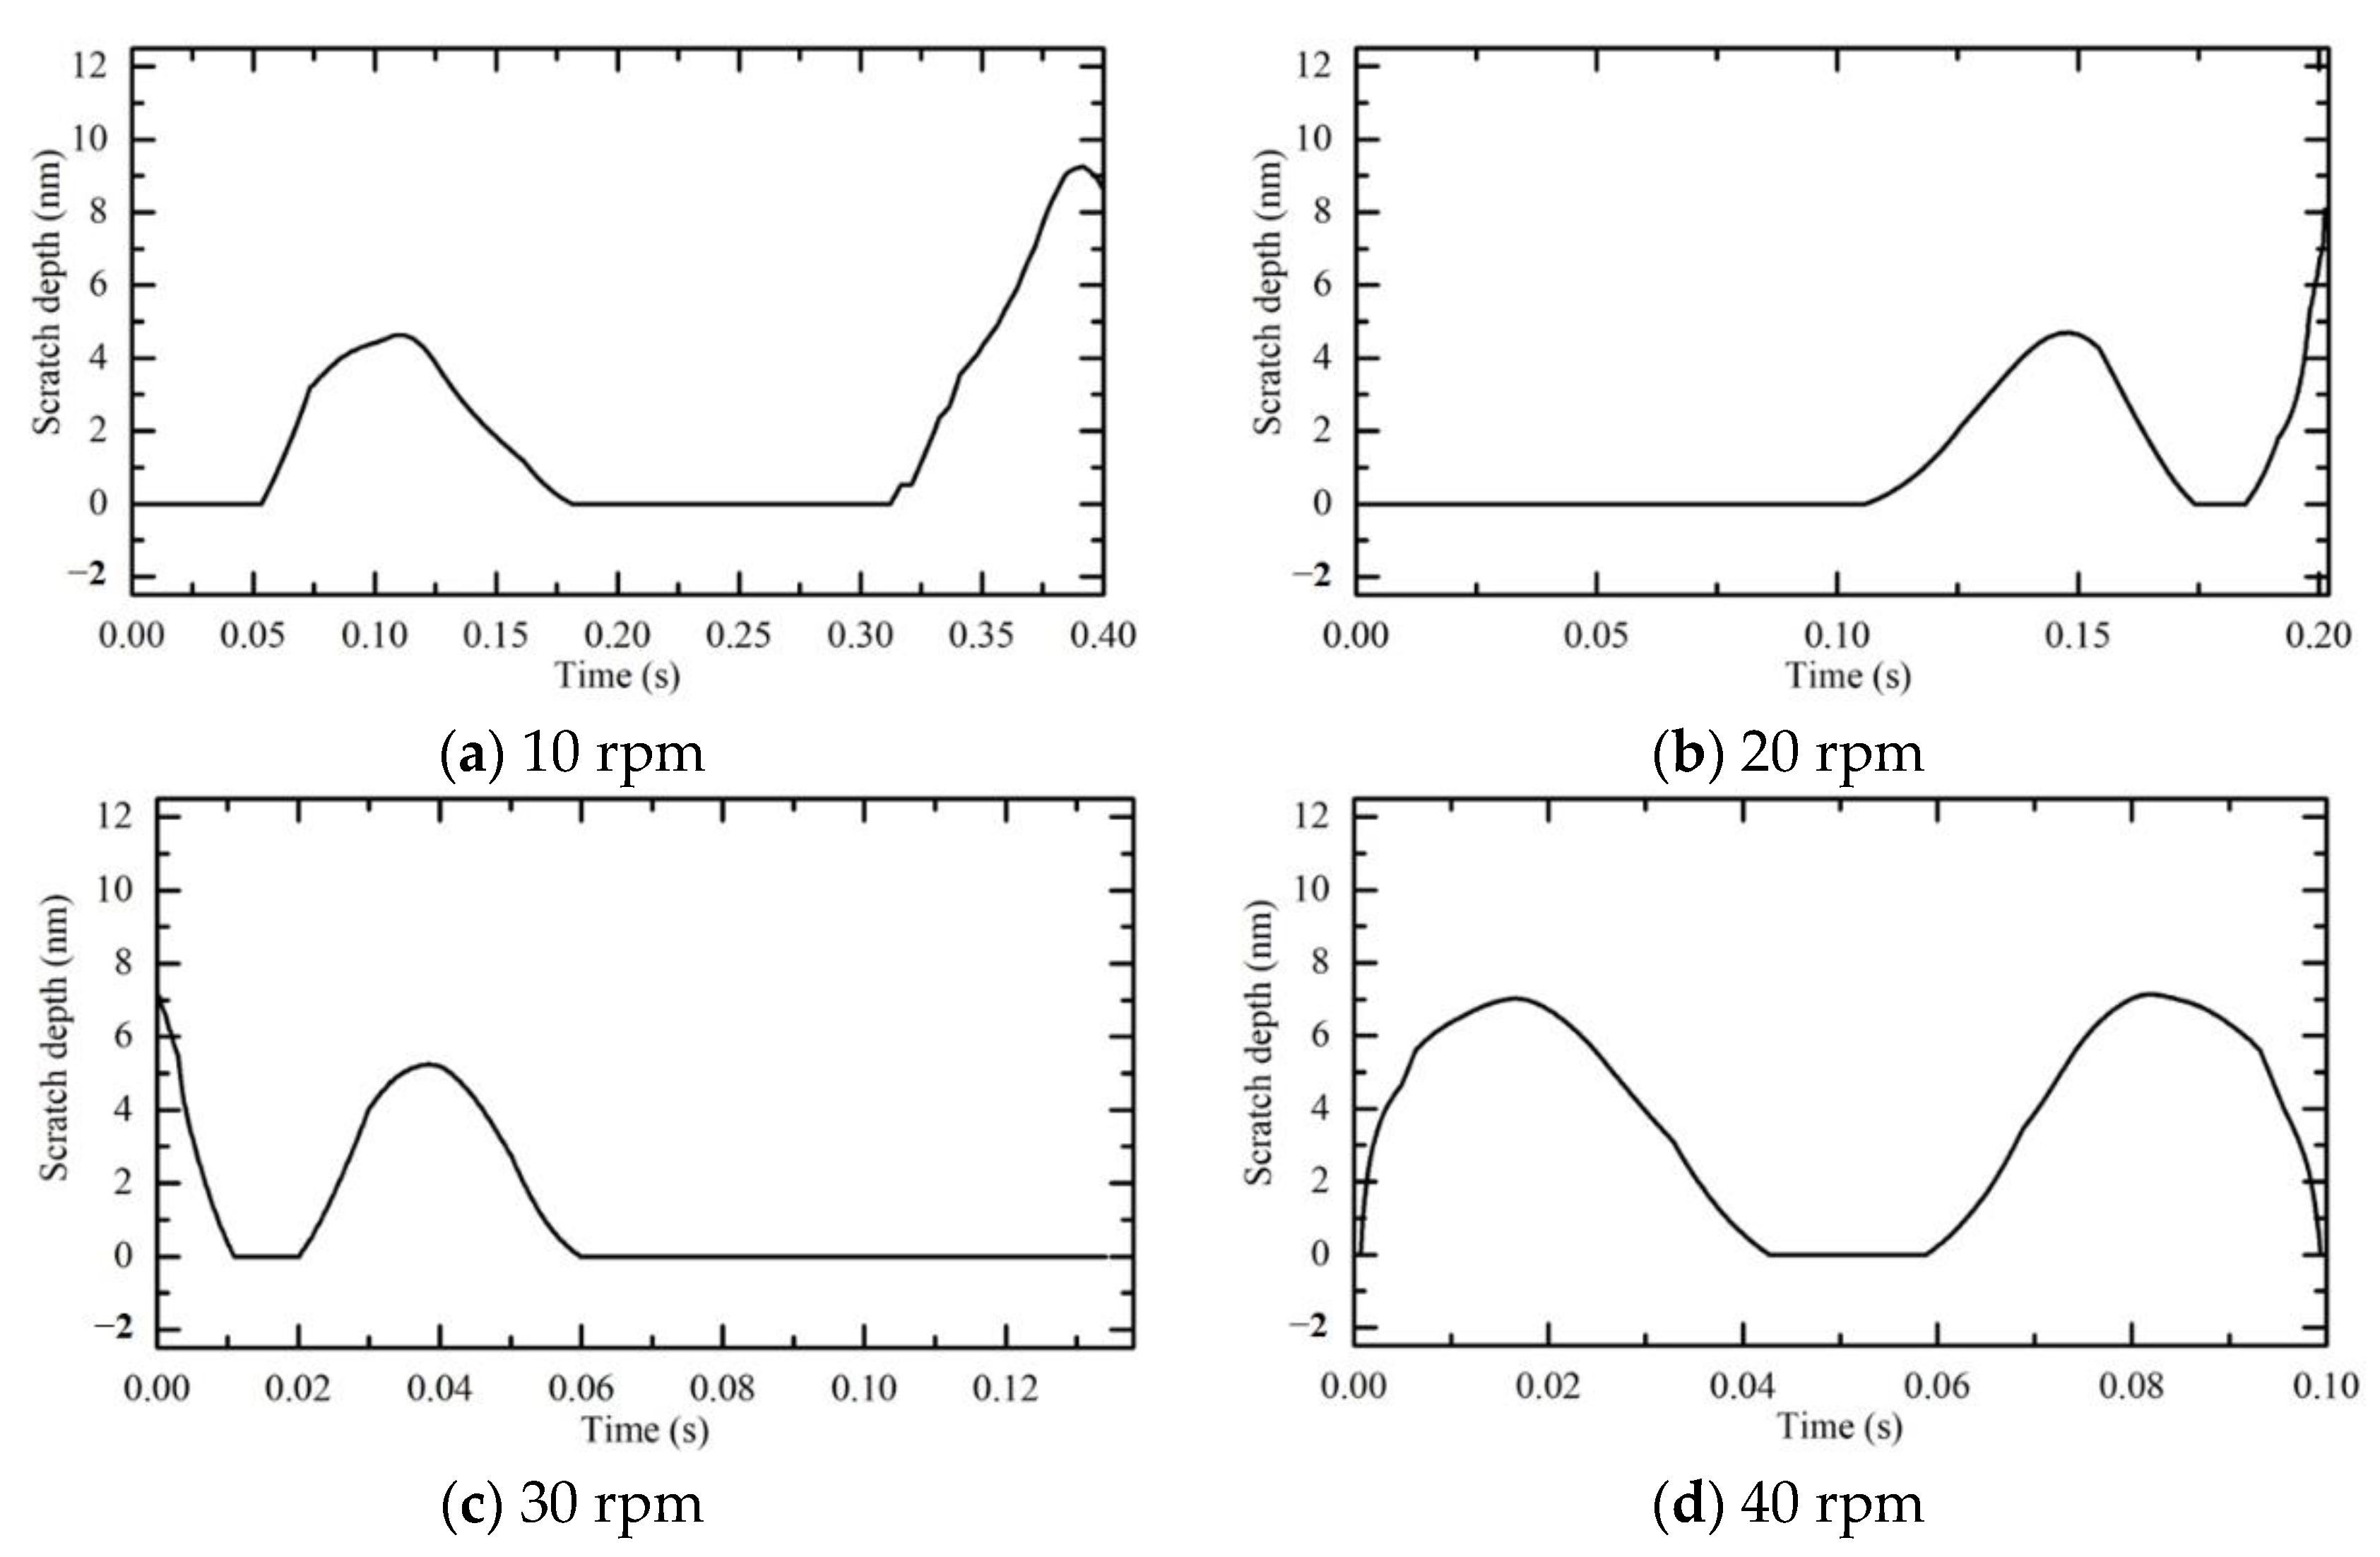
Figure 21.
Scratch damage depth with different polishing disc speeds.
Figure 21.
Scratch damage depth with different polishing disc speeds.
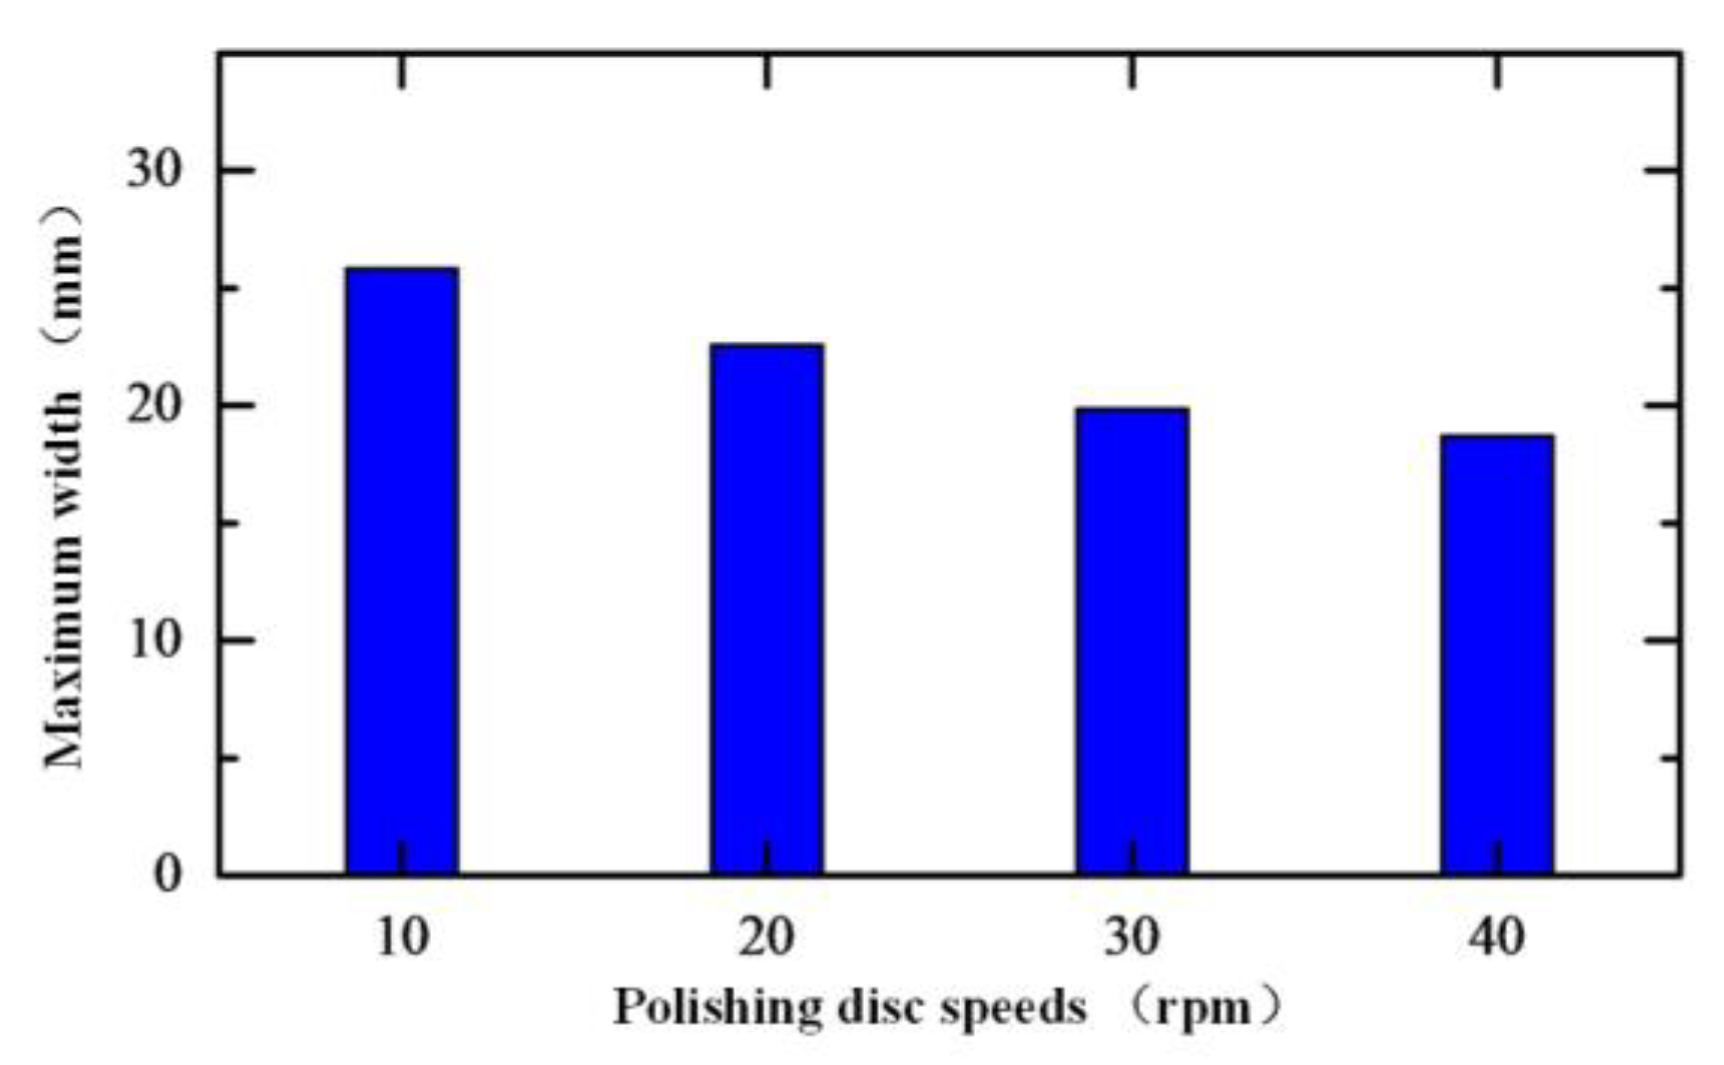
Figure 22.
Scratch damage maximum width with different polishing disc speeds.
Figure 22.
Scratch damage maximum width with different polishing disc speeds.
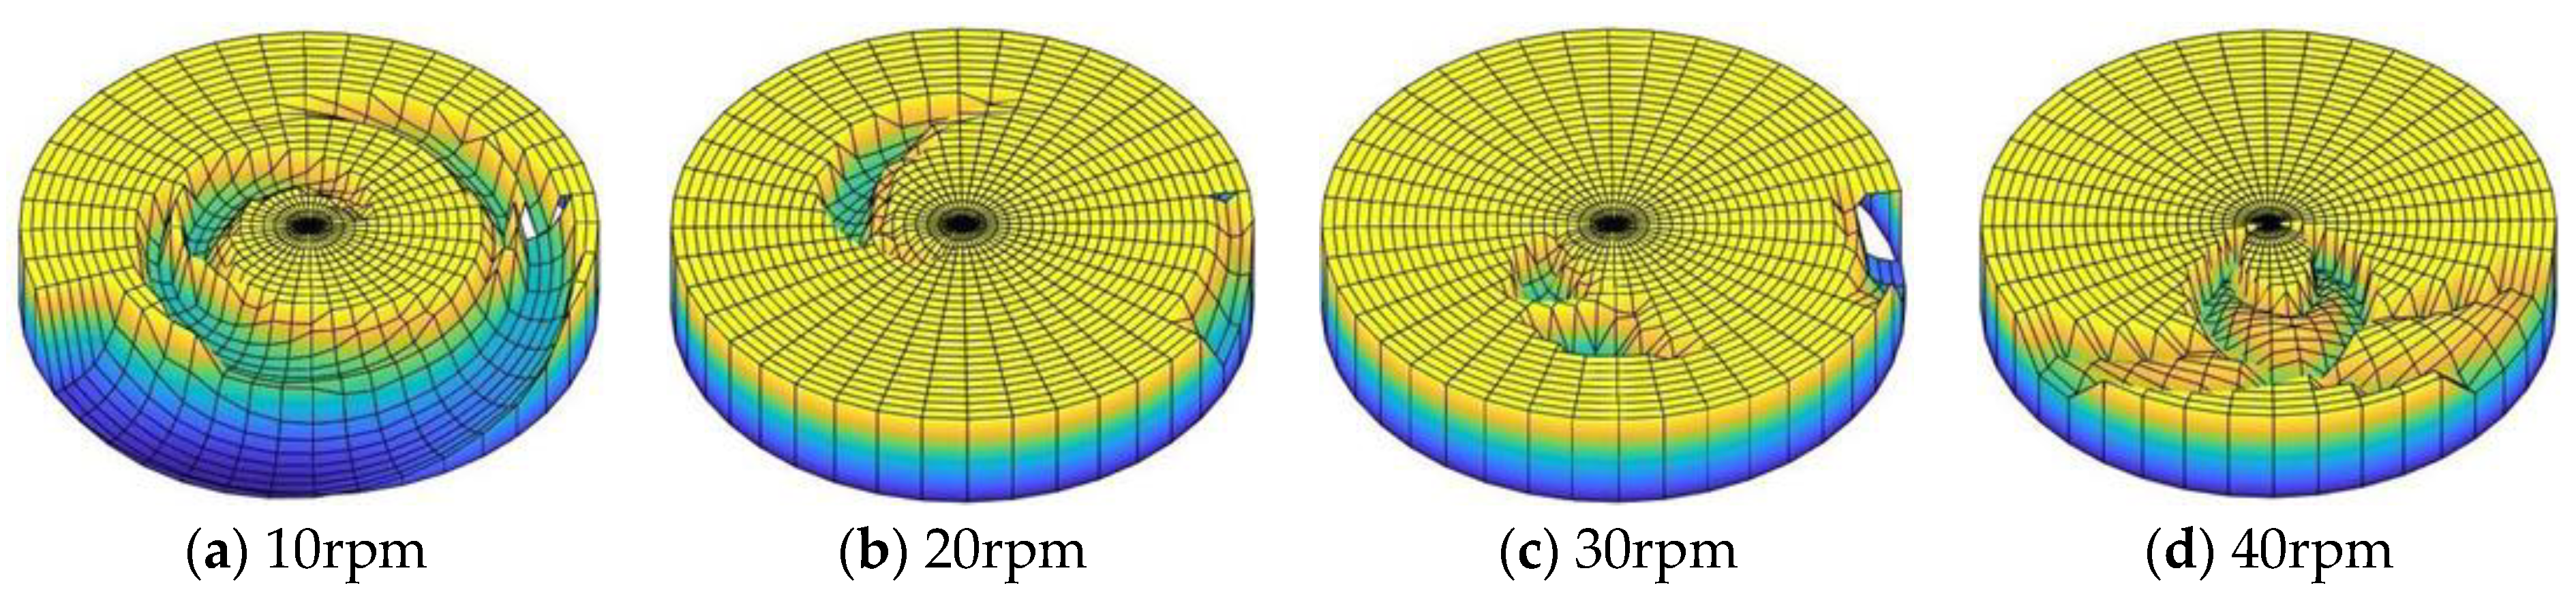
Figure 23.
Scratch damage morphology on the workpiece surface with different polishing disc speeds.
Figure 23.
Scratch damage morphology on the workpiece surface with different polishing disc speeds.
Figure 24.
Motion trajectory of agglomerated particles with different magnetic field speeds.
Figure 24.
Motion trajectory of agglomerated particles with different magnetic field speeds.
Figure 25.
Scratch damage depth with different magnetic field speeds.
Figure 25.
Scratch damage depth with different magnetic field speeds.
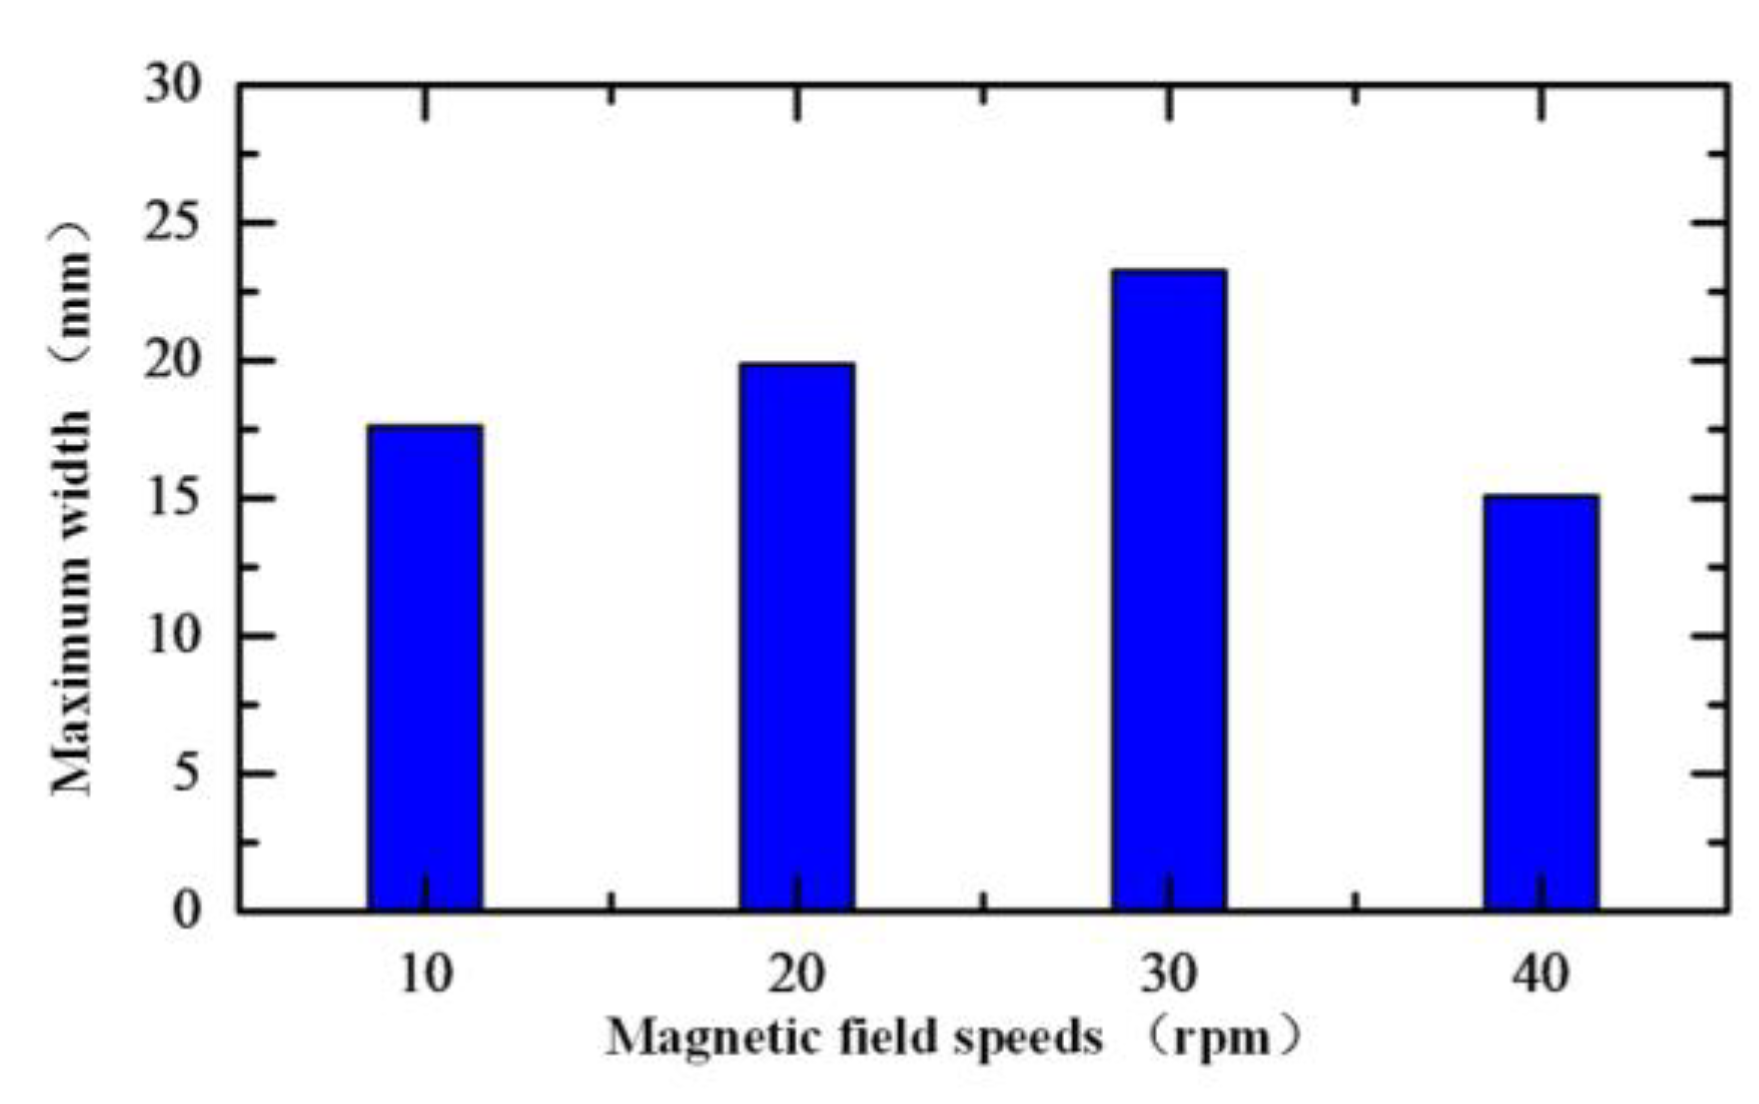
Figure 26.
Scratch damage maximum width with different magnetic field speeds.
Figure 26.
Scratch damage maximum width with different magnetic field speeds.
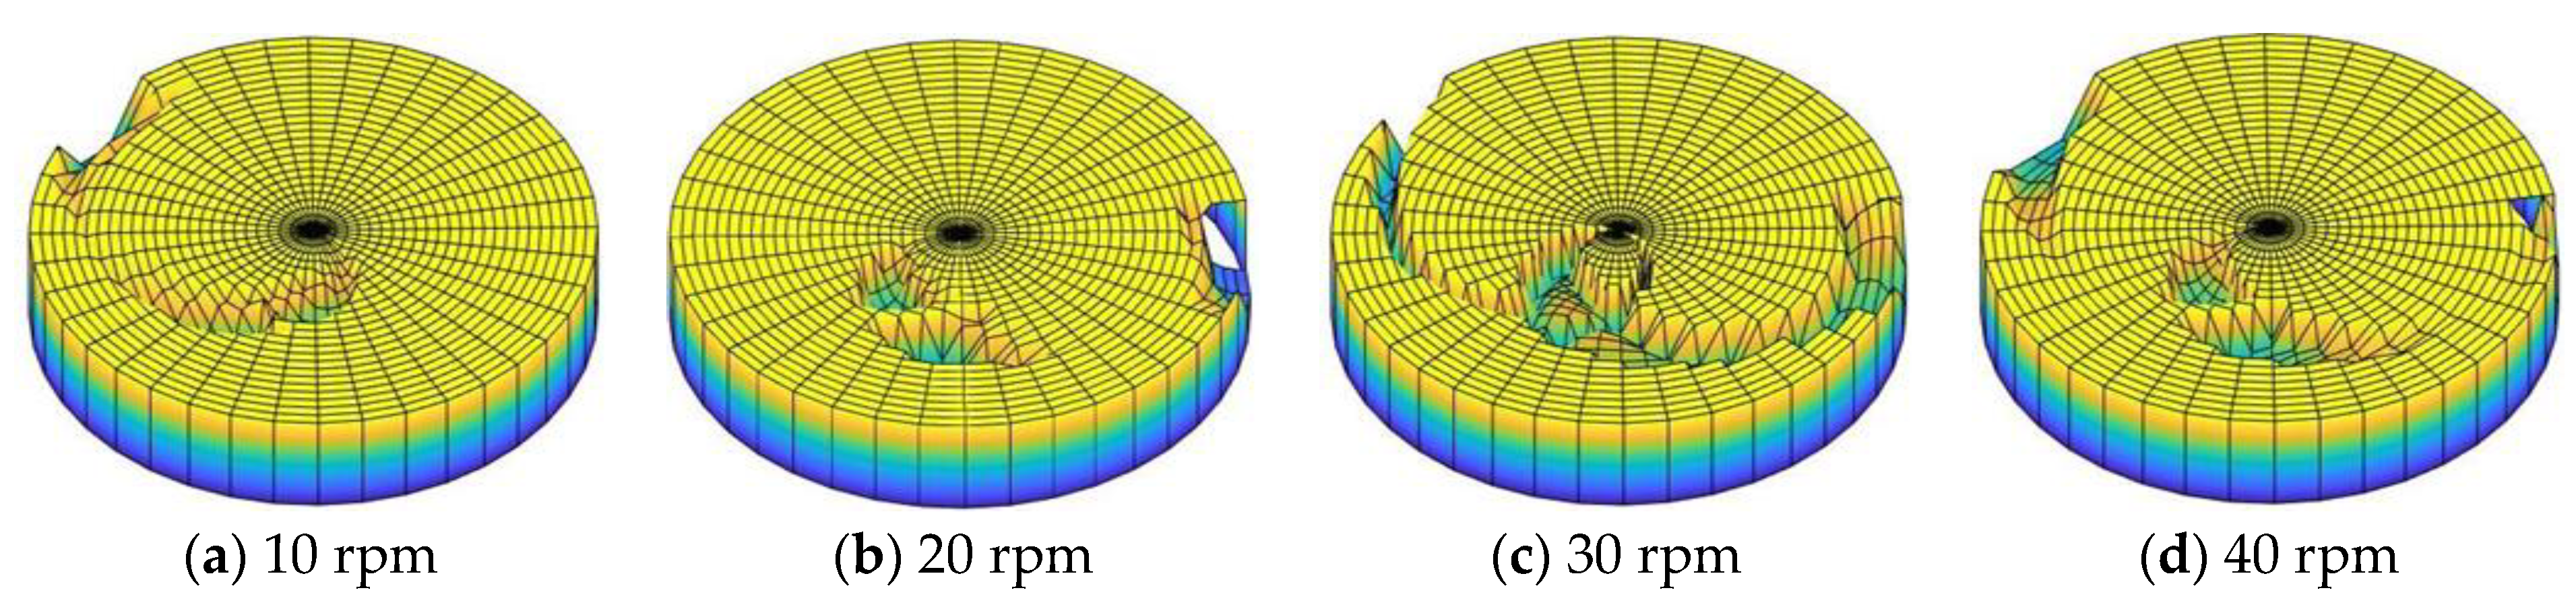
Figure 27.
Scratch damage morphology on the workpiece surface with different magnetic field speeds.
Figure 27.
Scratch damage morphology on the workpiece surface with different magnetic field speeds.
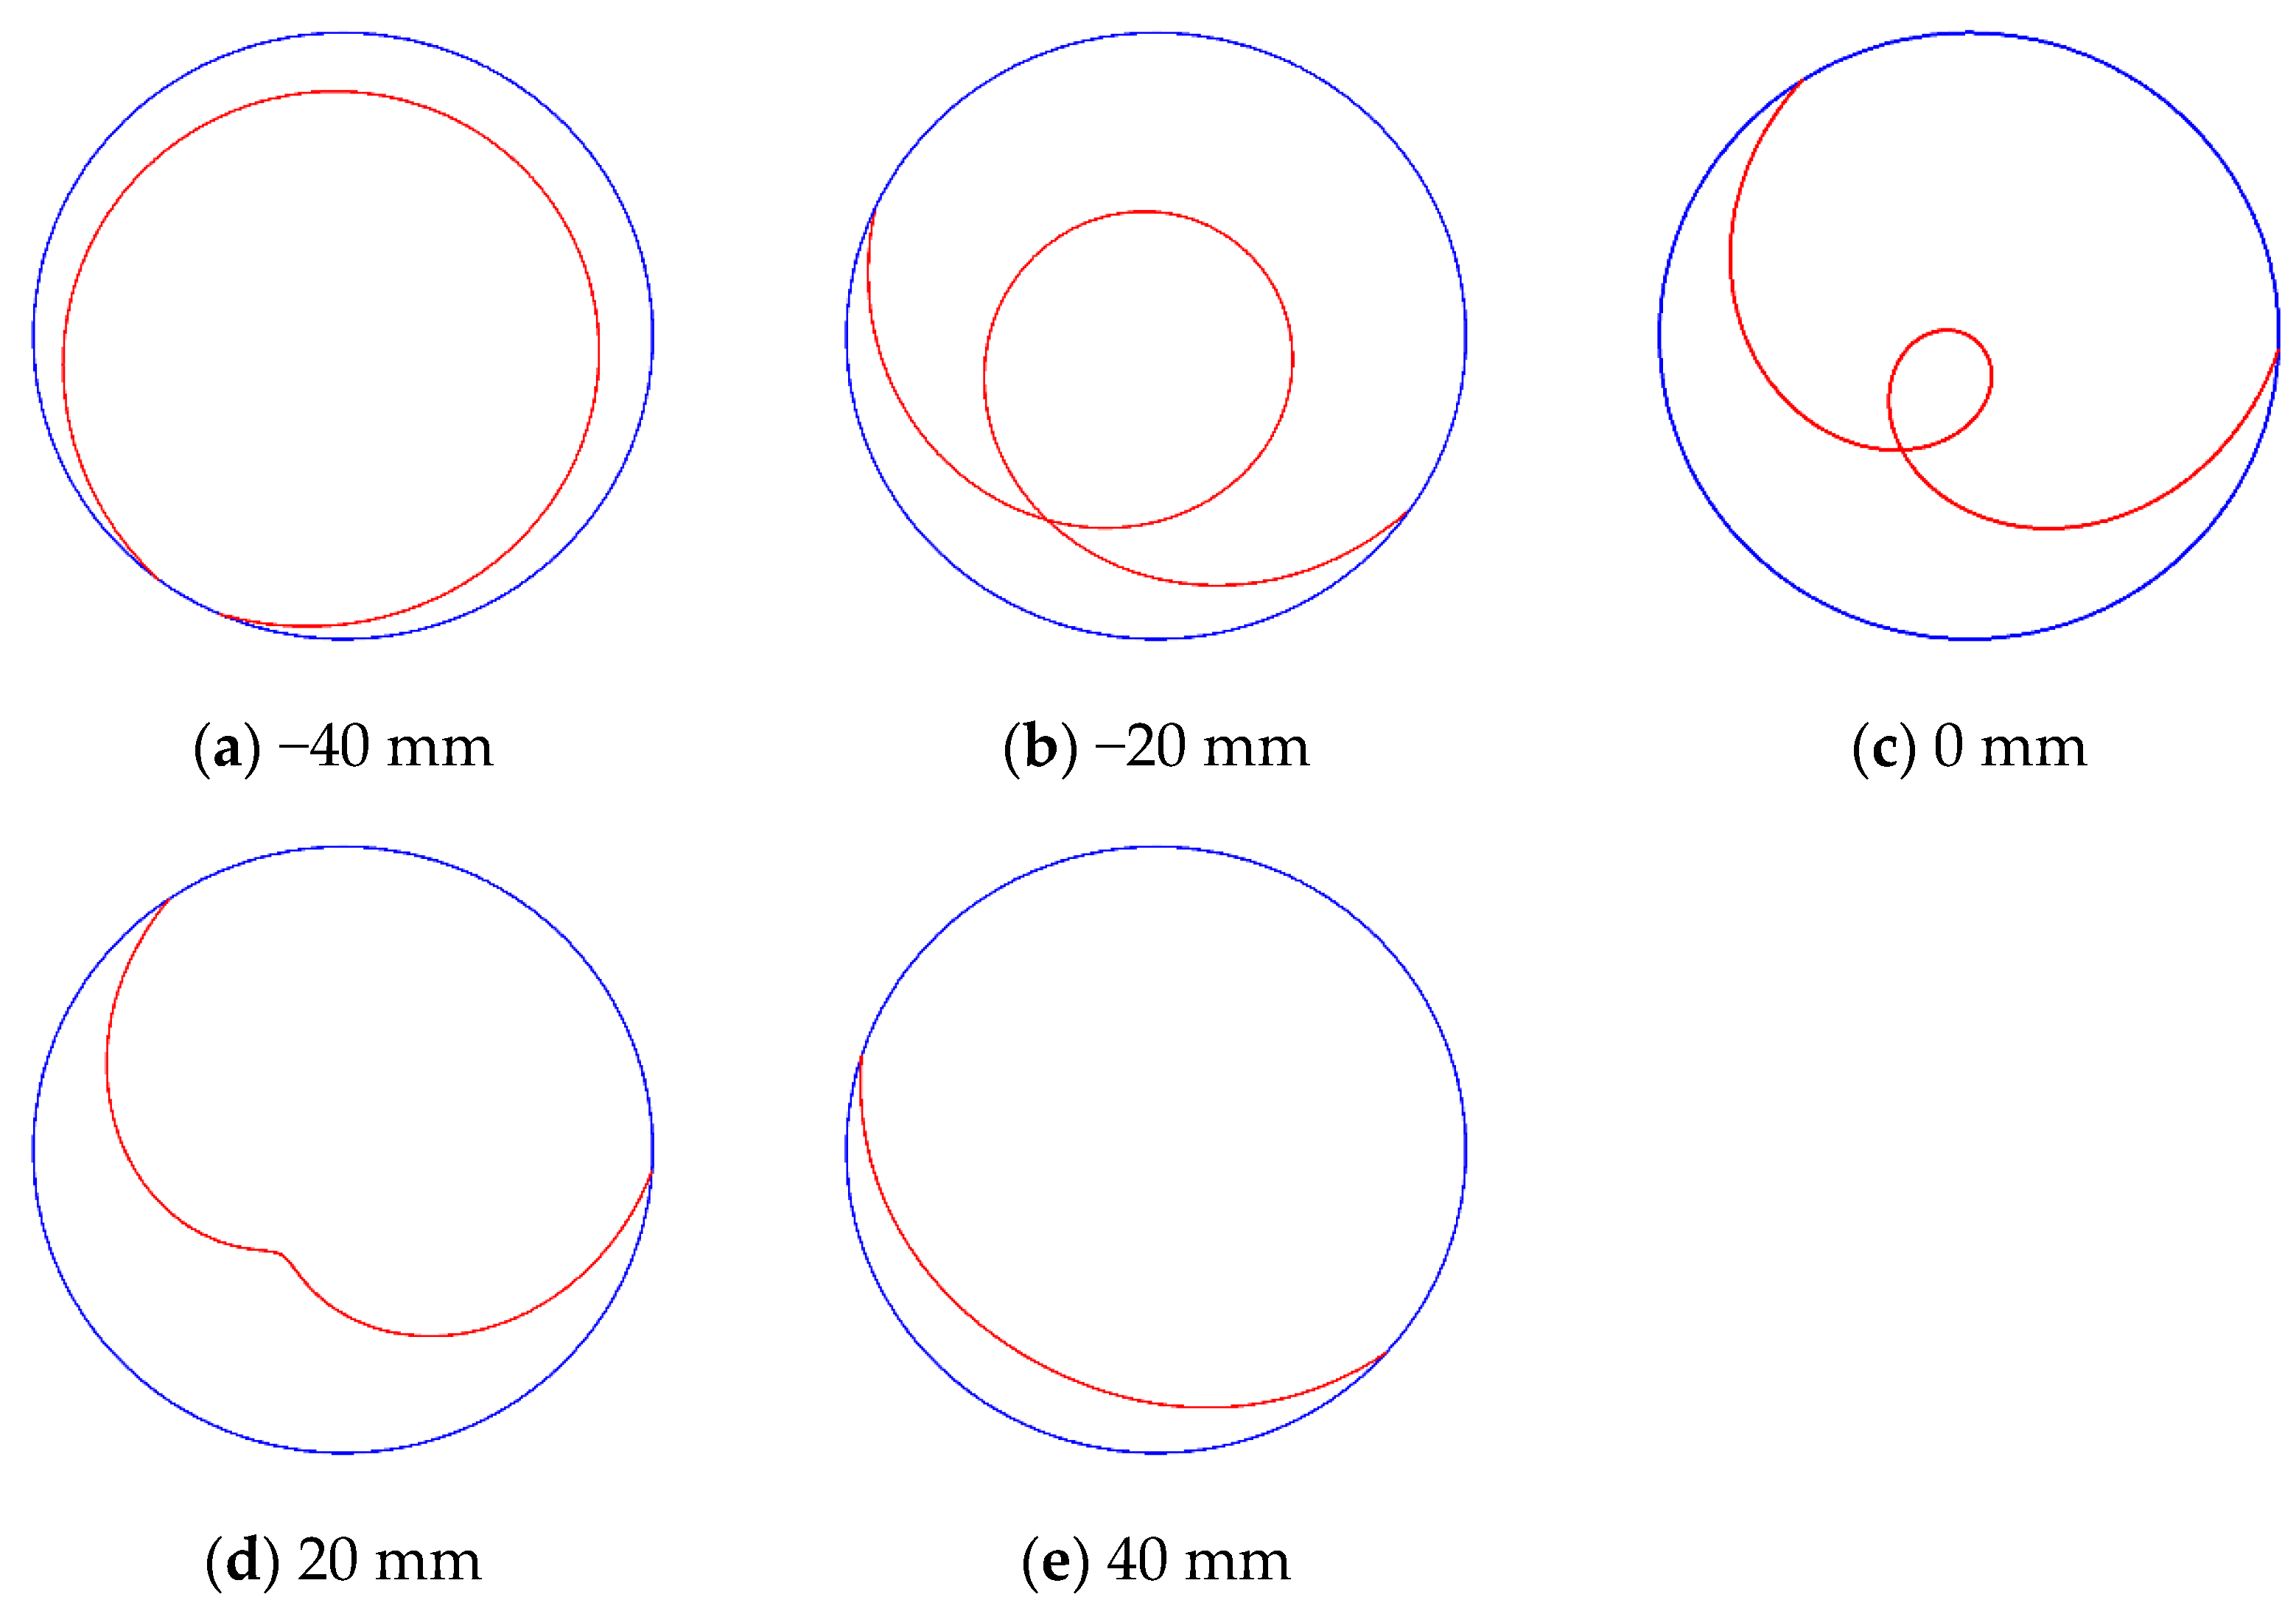
Figure 28.
Motion trajectory of the agglomerated particles with different magnetic field eccentricities.
Figure 28.
Motion trajectory of the agglomerated particles with different magnetic field eccentricities.
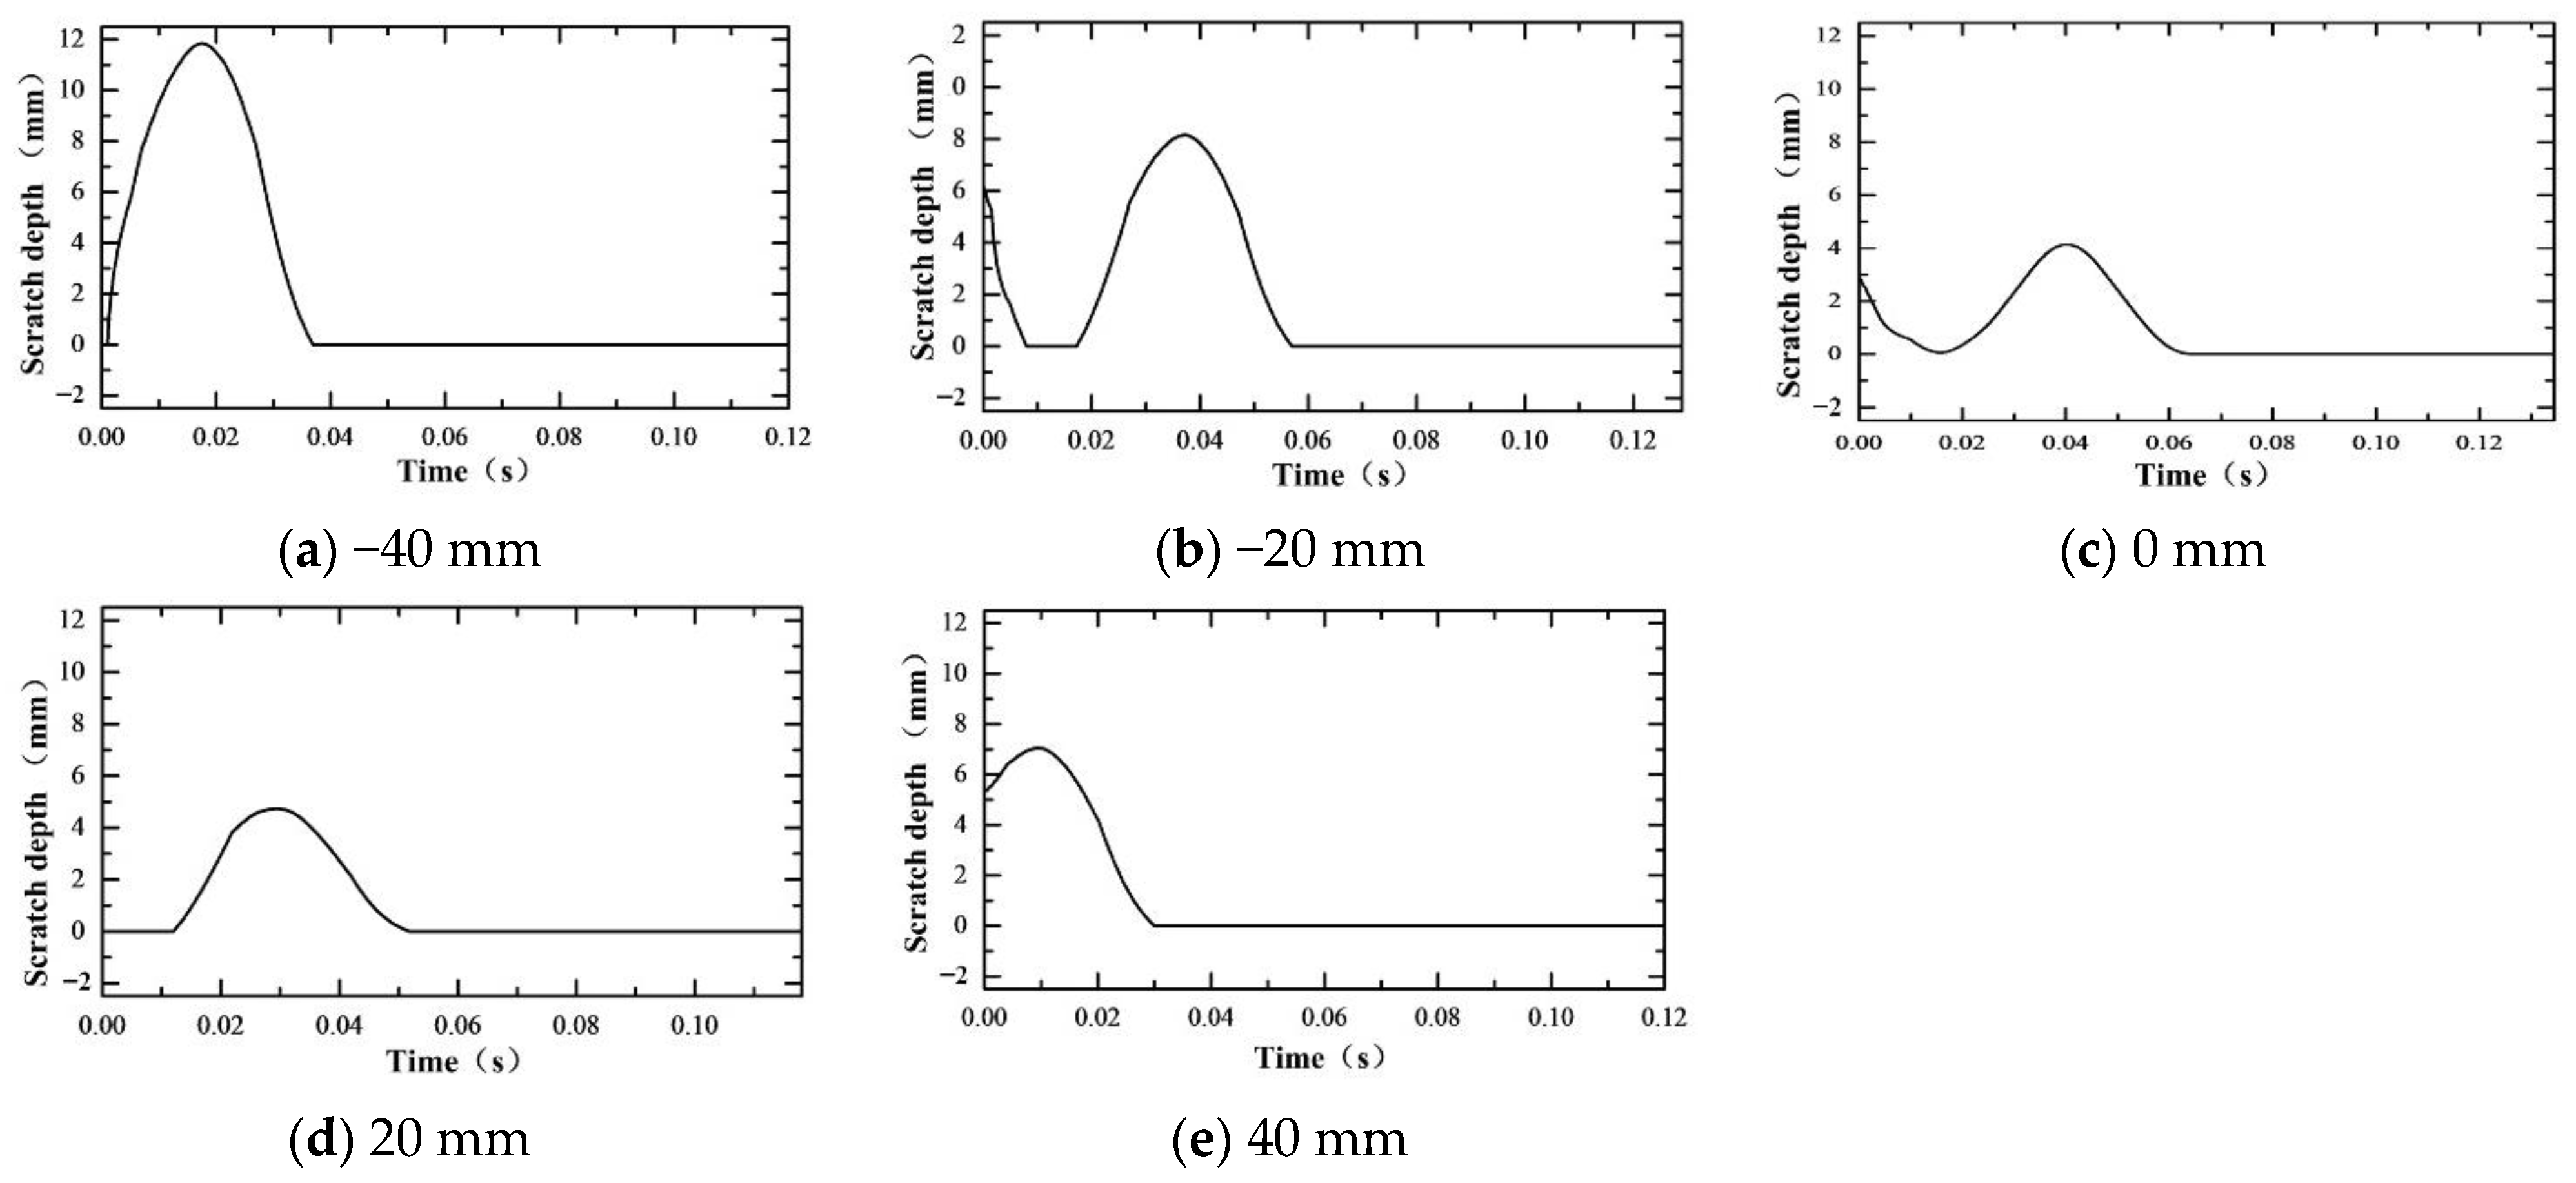
Figure 29.
Scratch damage depth with different magnetic field eccentricities.
Figure 29.
Scratch damage depth with different magnetic field eccentricities.
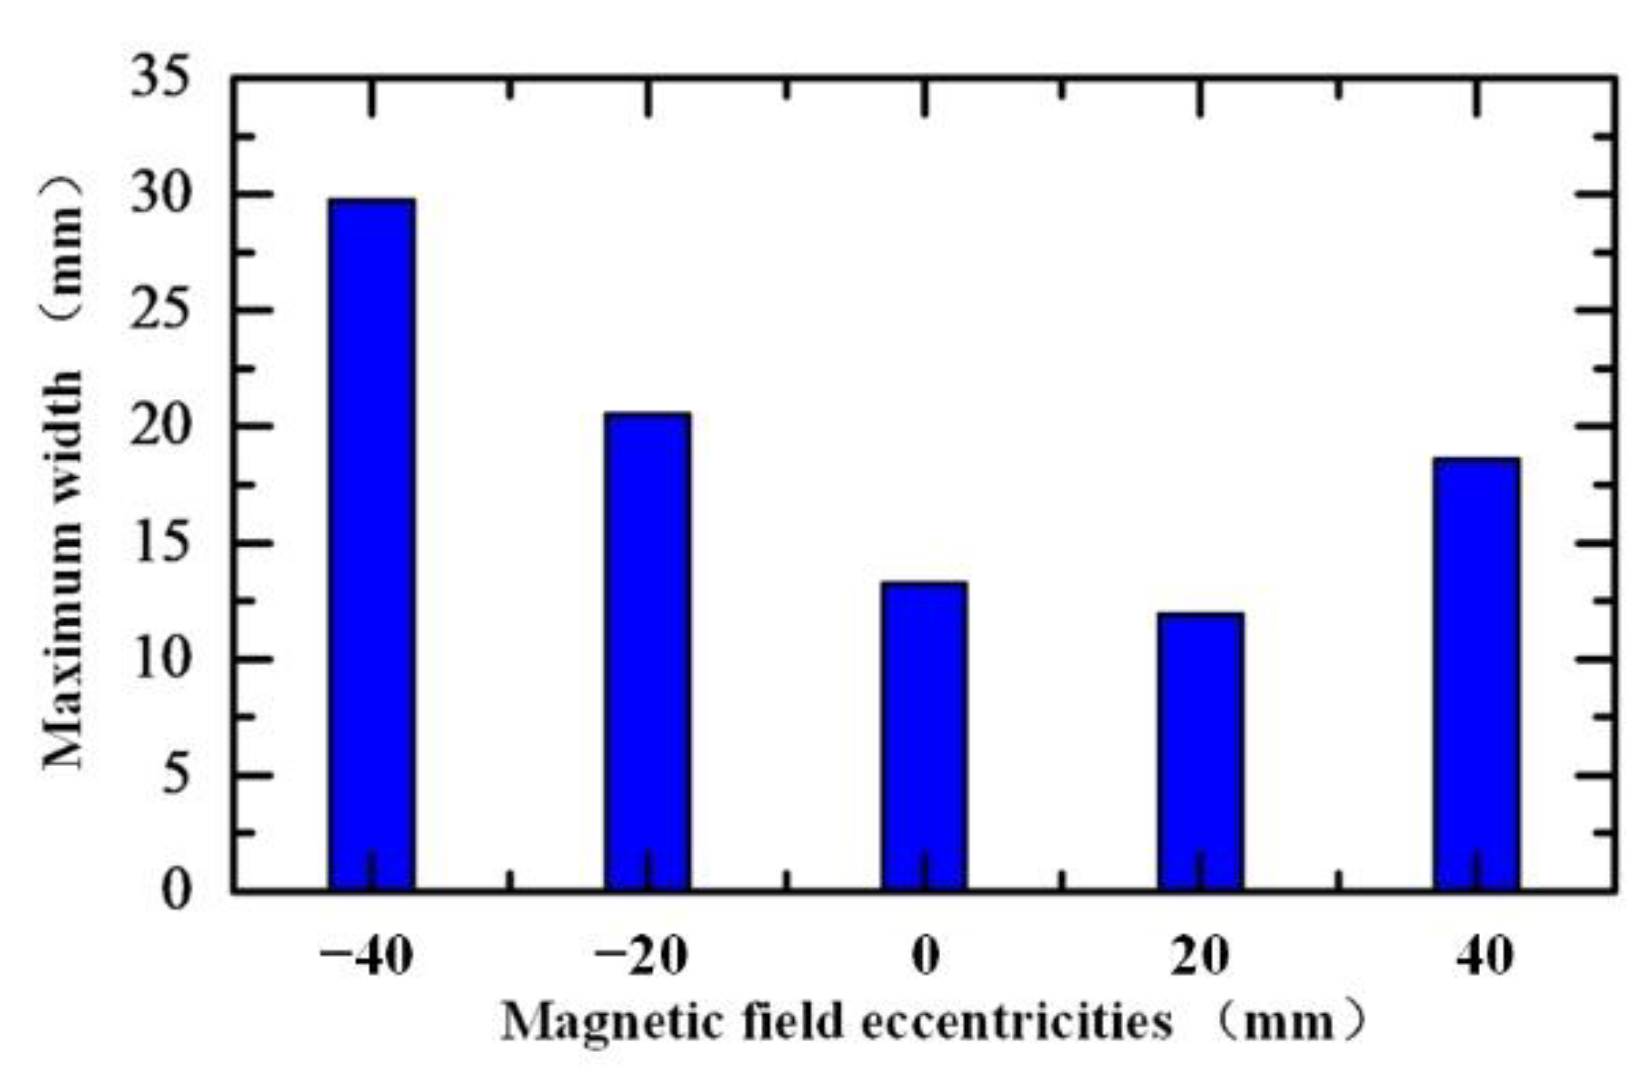
Figure 30.
Scratch damage maximum width with different magnetic field eccentricities.
Figure 30.
Scratch damage maximum width with different magnetic field eccentricities.
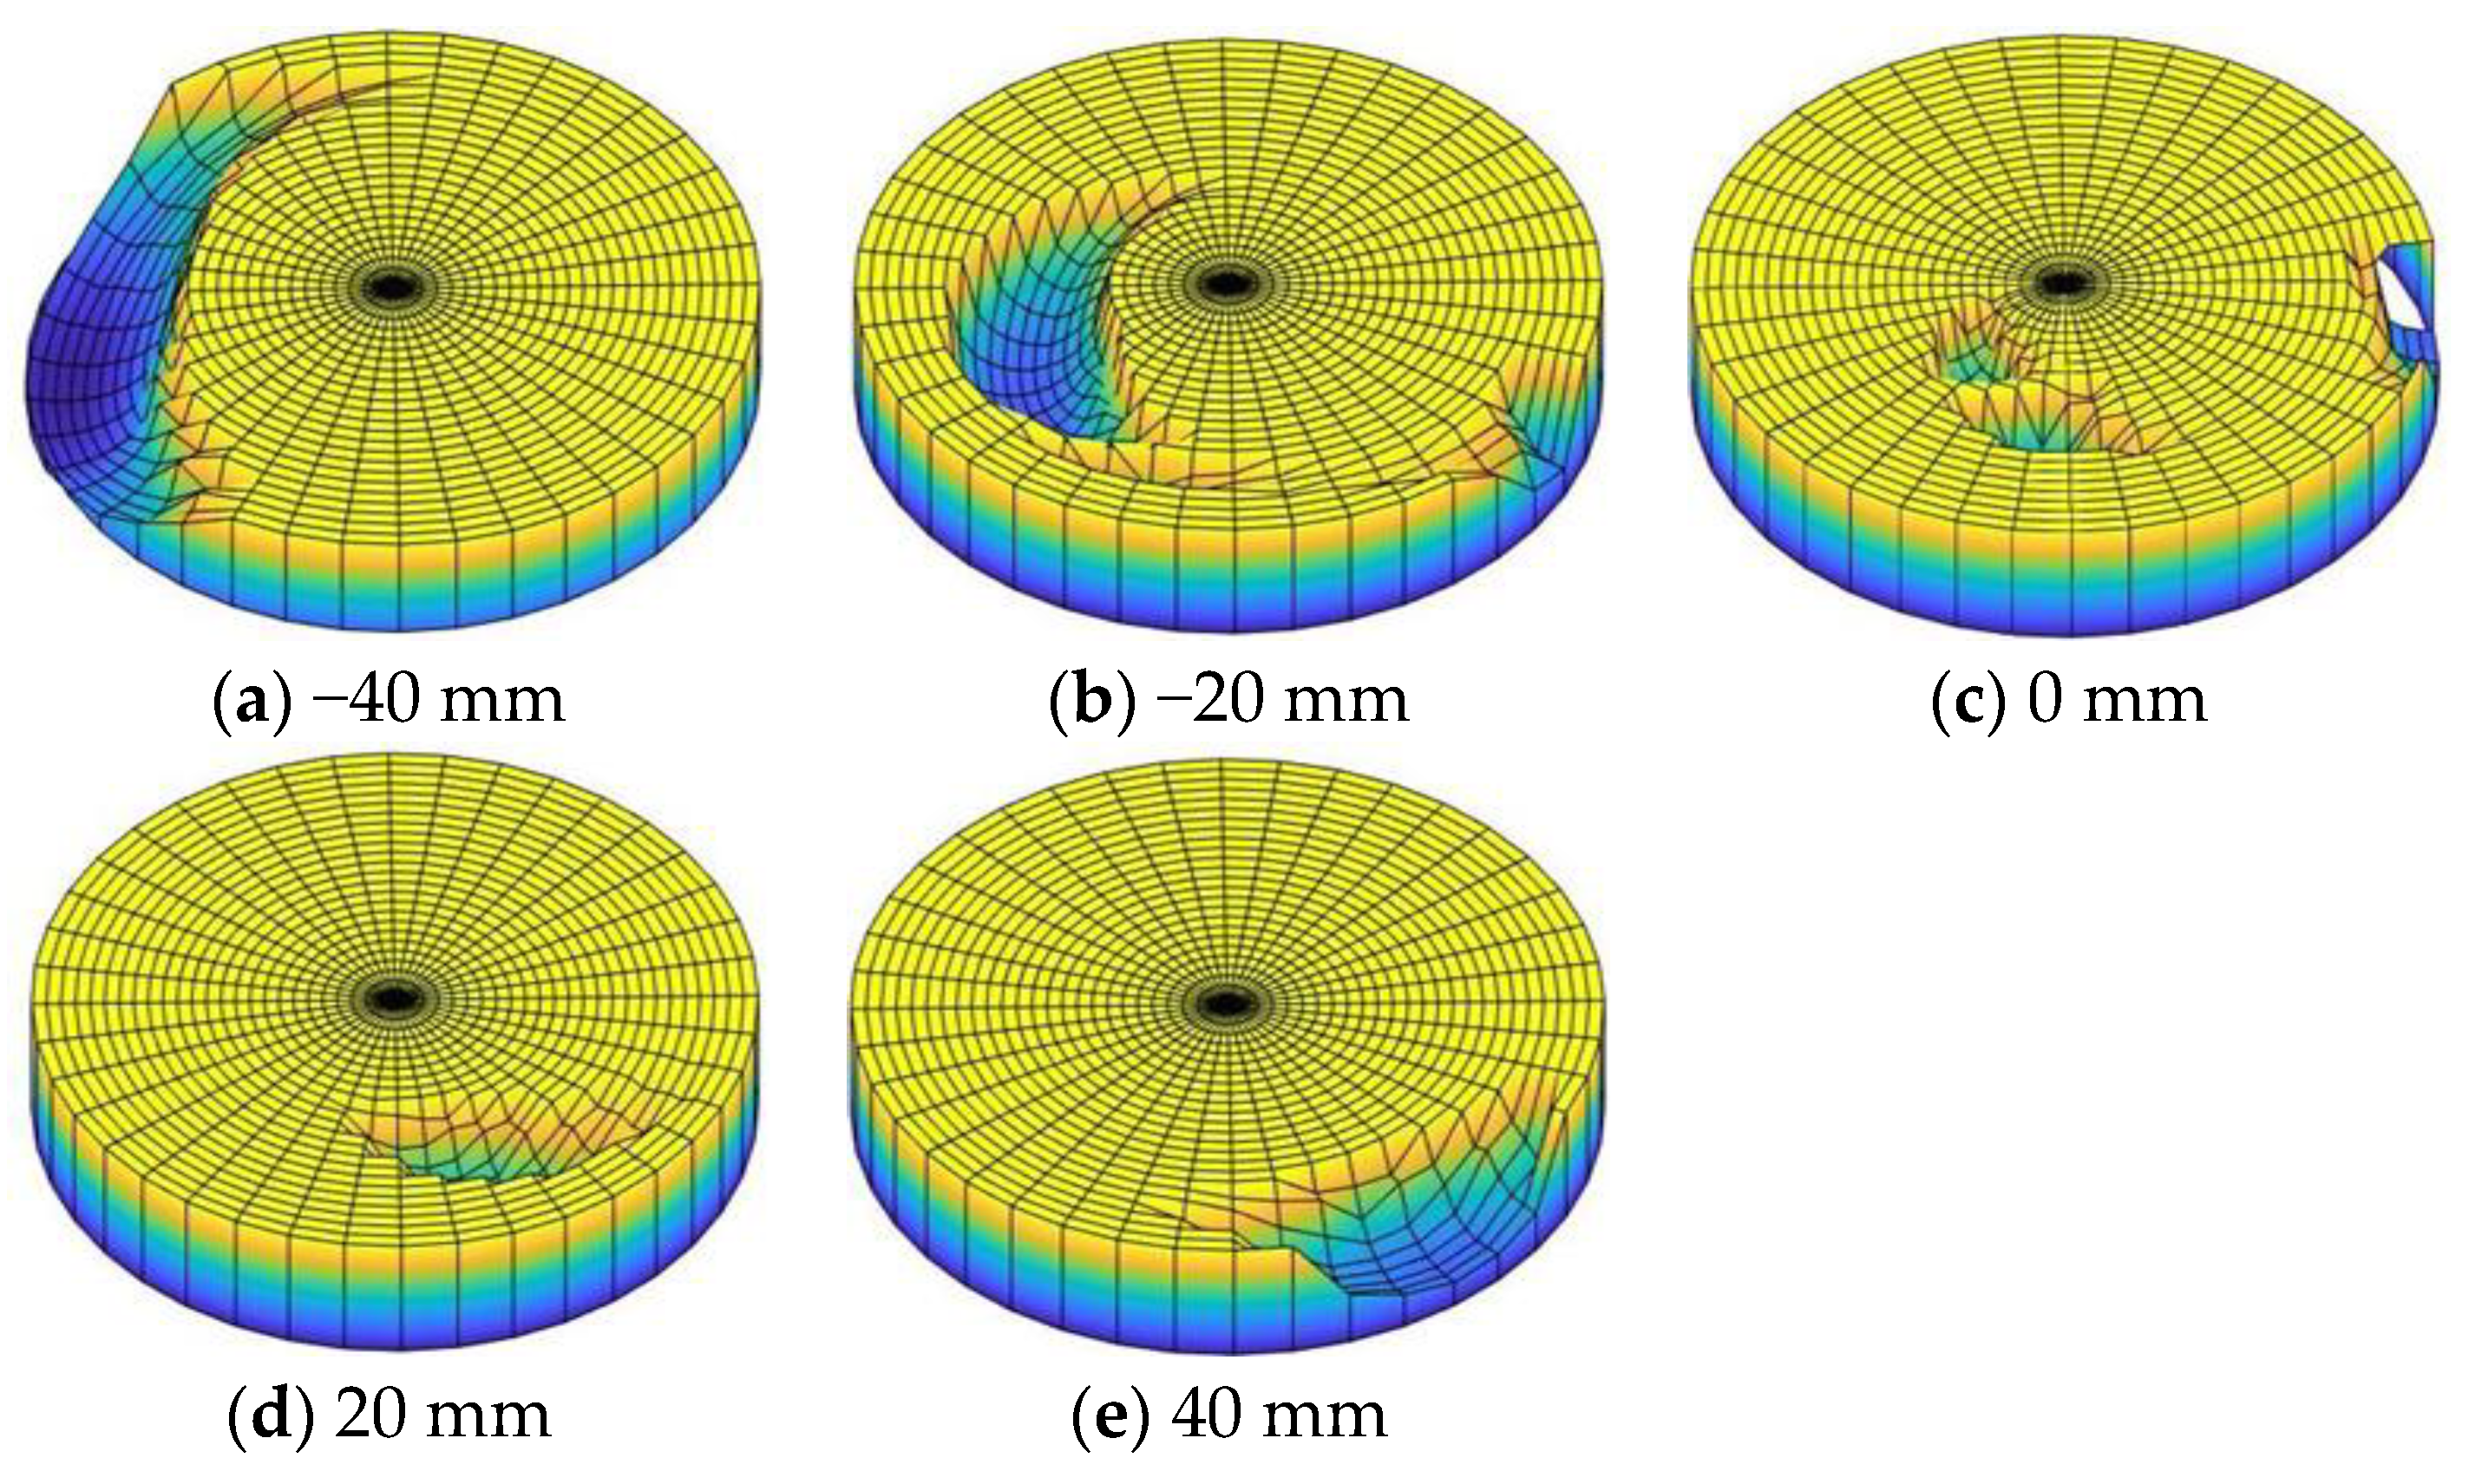
Figure 31.
Scratch damage morphology on the workpiece surface with different magnetic field eccentricities.
Figure 31.
Scratch damage morphology on the workpiece surface with different magnetic field eccentricities.
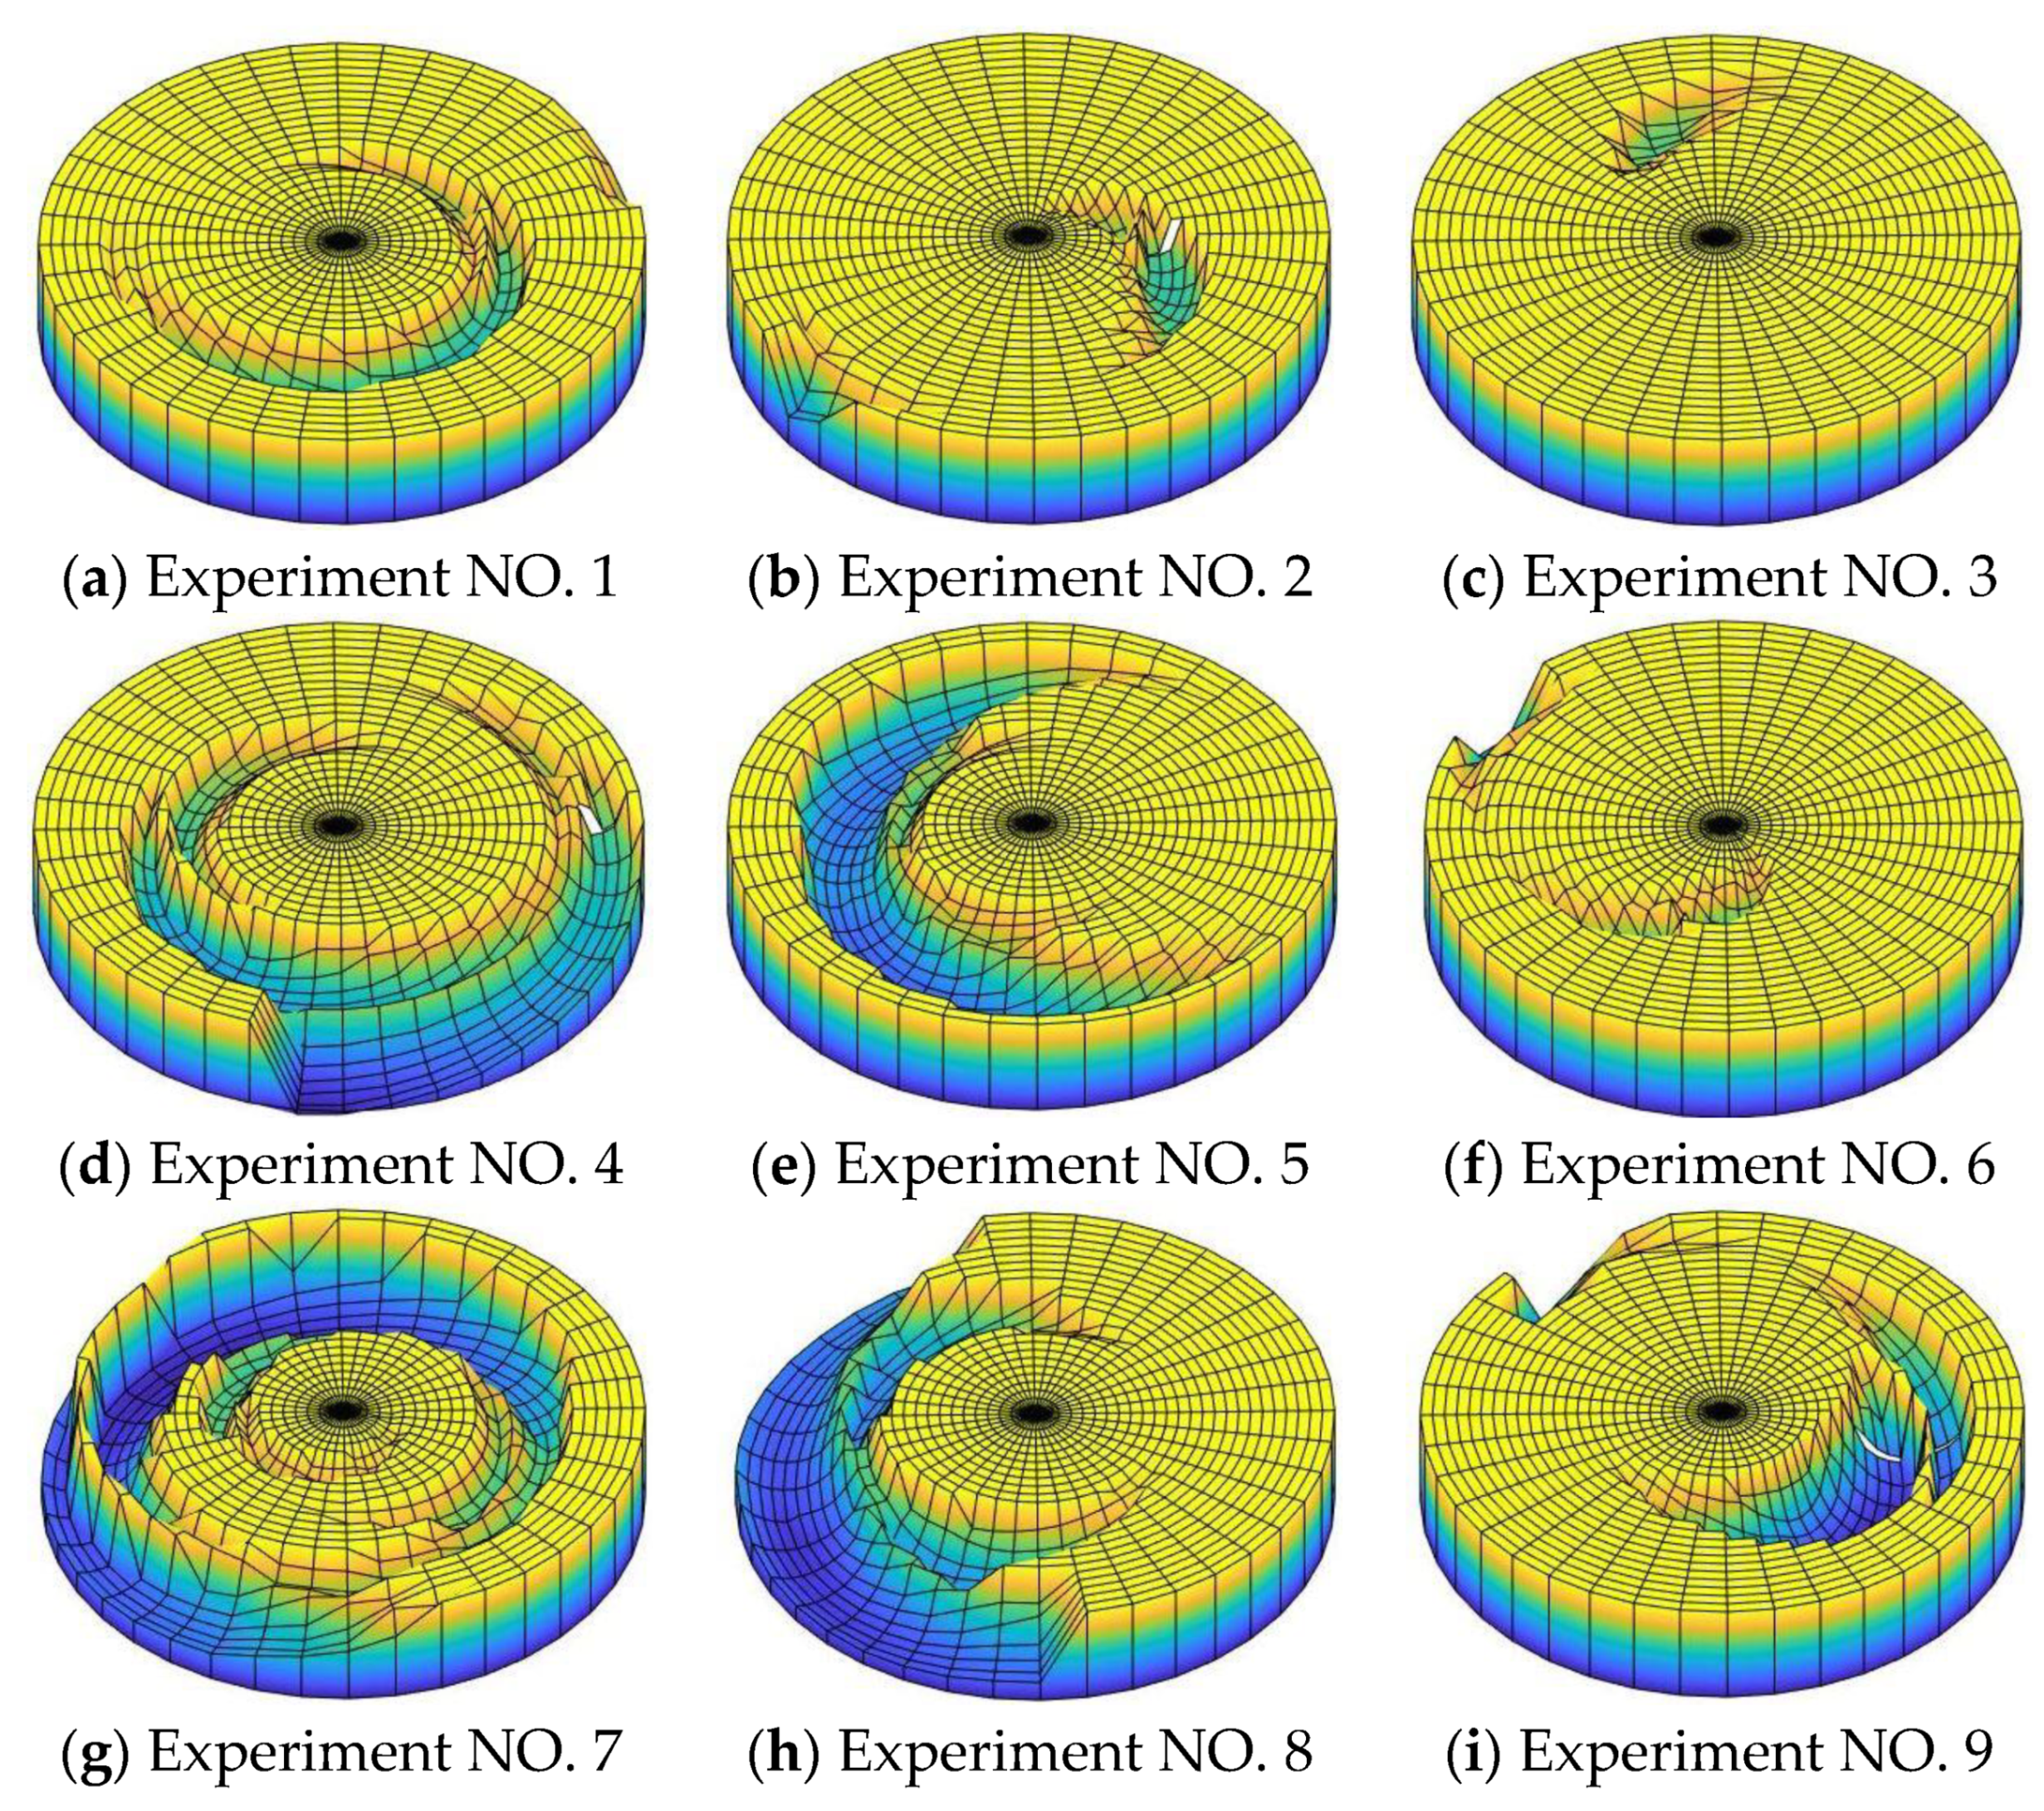
Figure 32.
Scratch damage morphology on the workpiece surface with experimental parameters.
Figure 32.
Scratch damage morphology on the workpiece surface with experimental parameters.
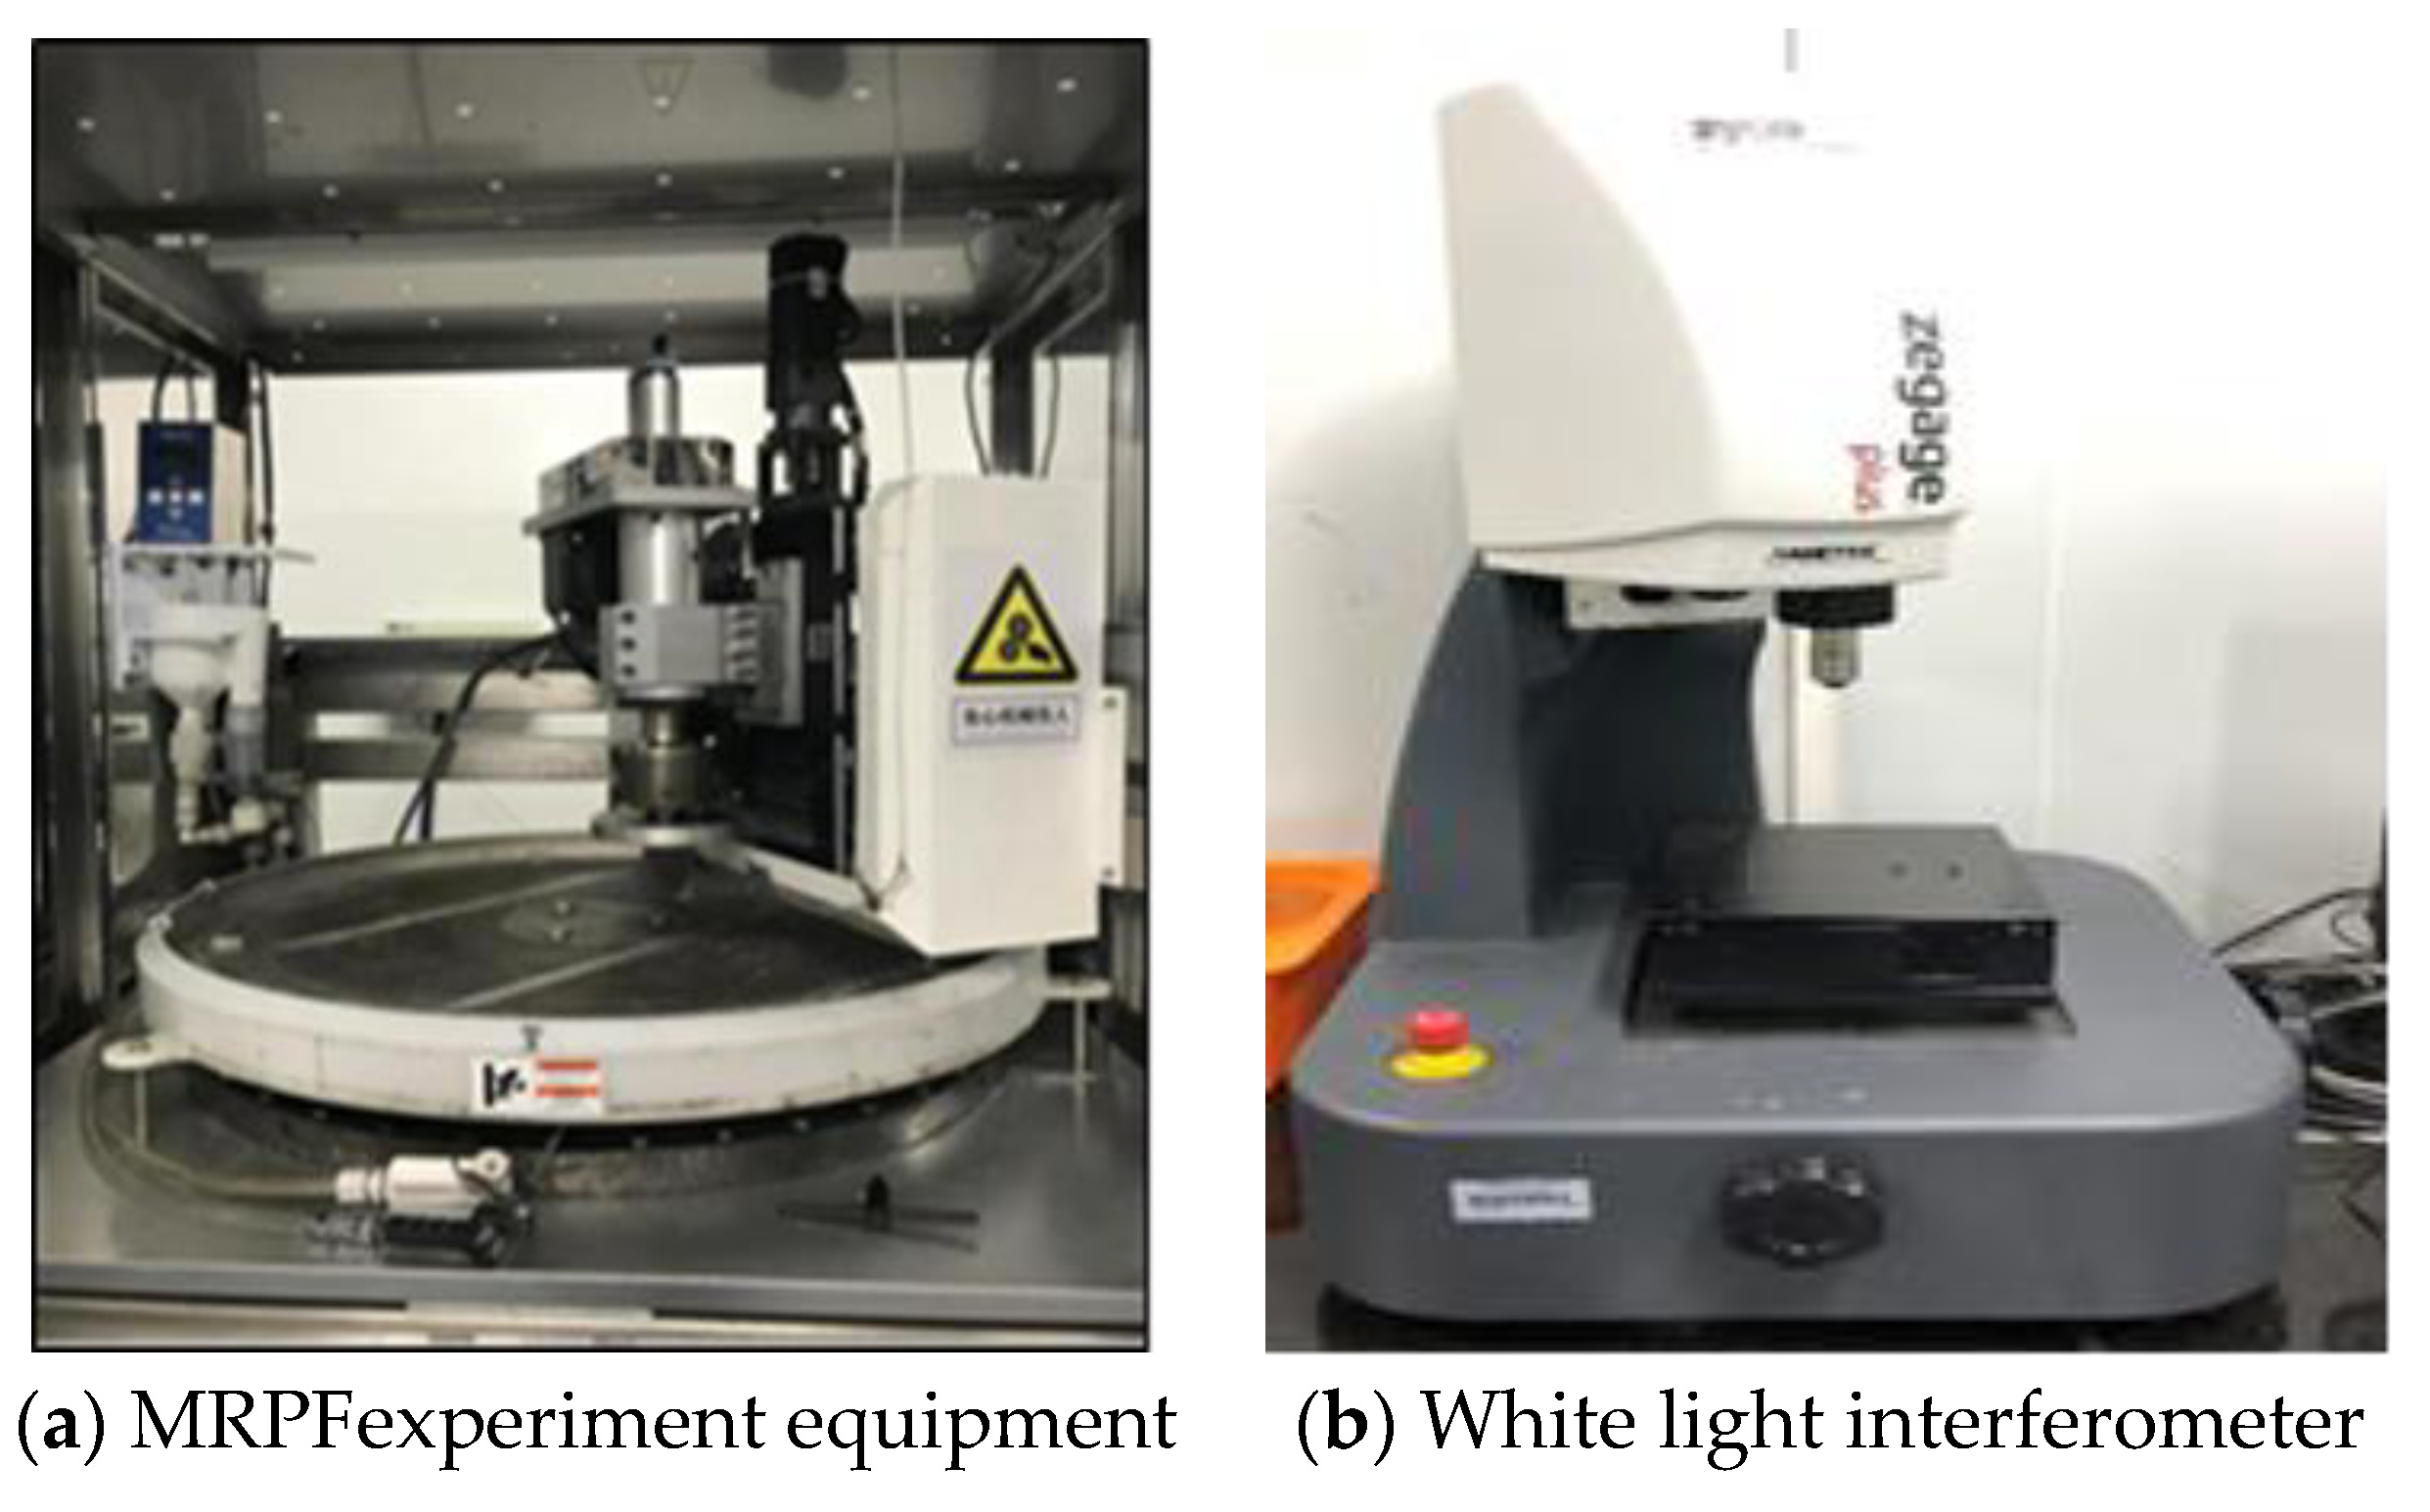
Figure 33.
Experimental equipment.
Figure 33.
Experimental equipment.
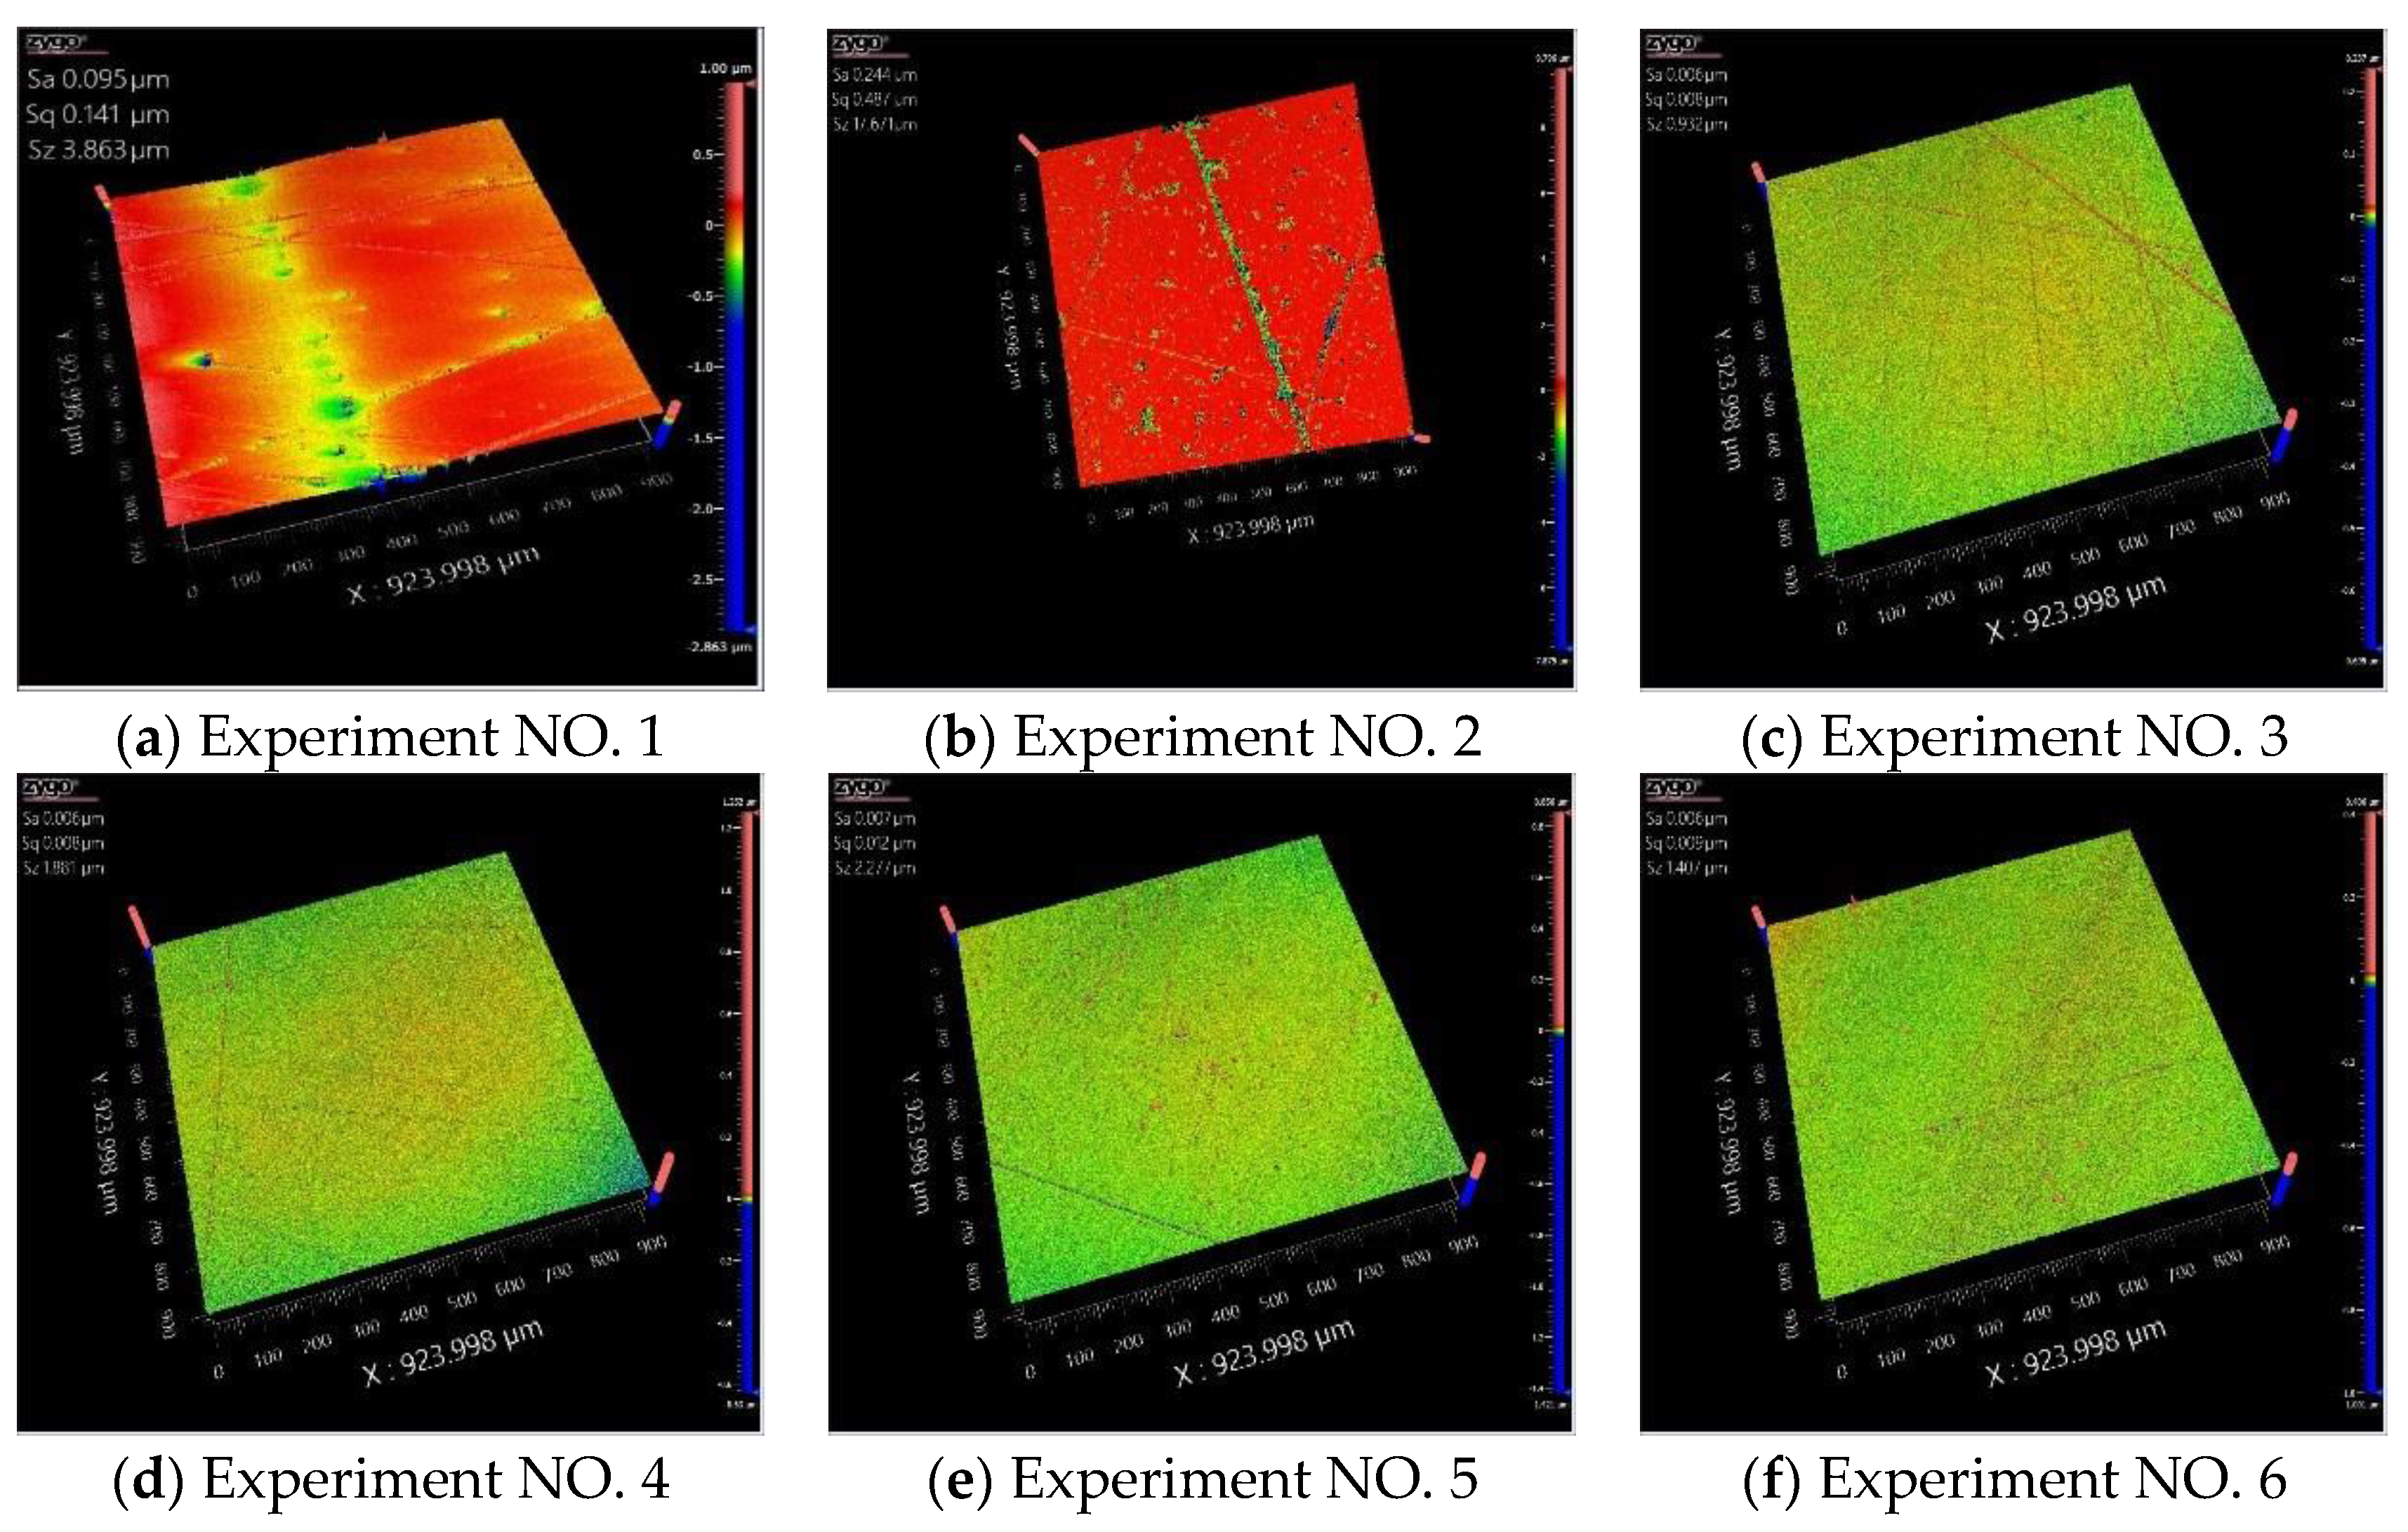
Figure 34.
Workpiece surface morphology.
Figure 34.
Workpiece surface morphology.
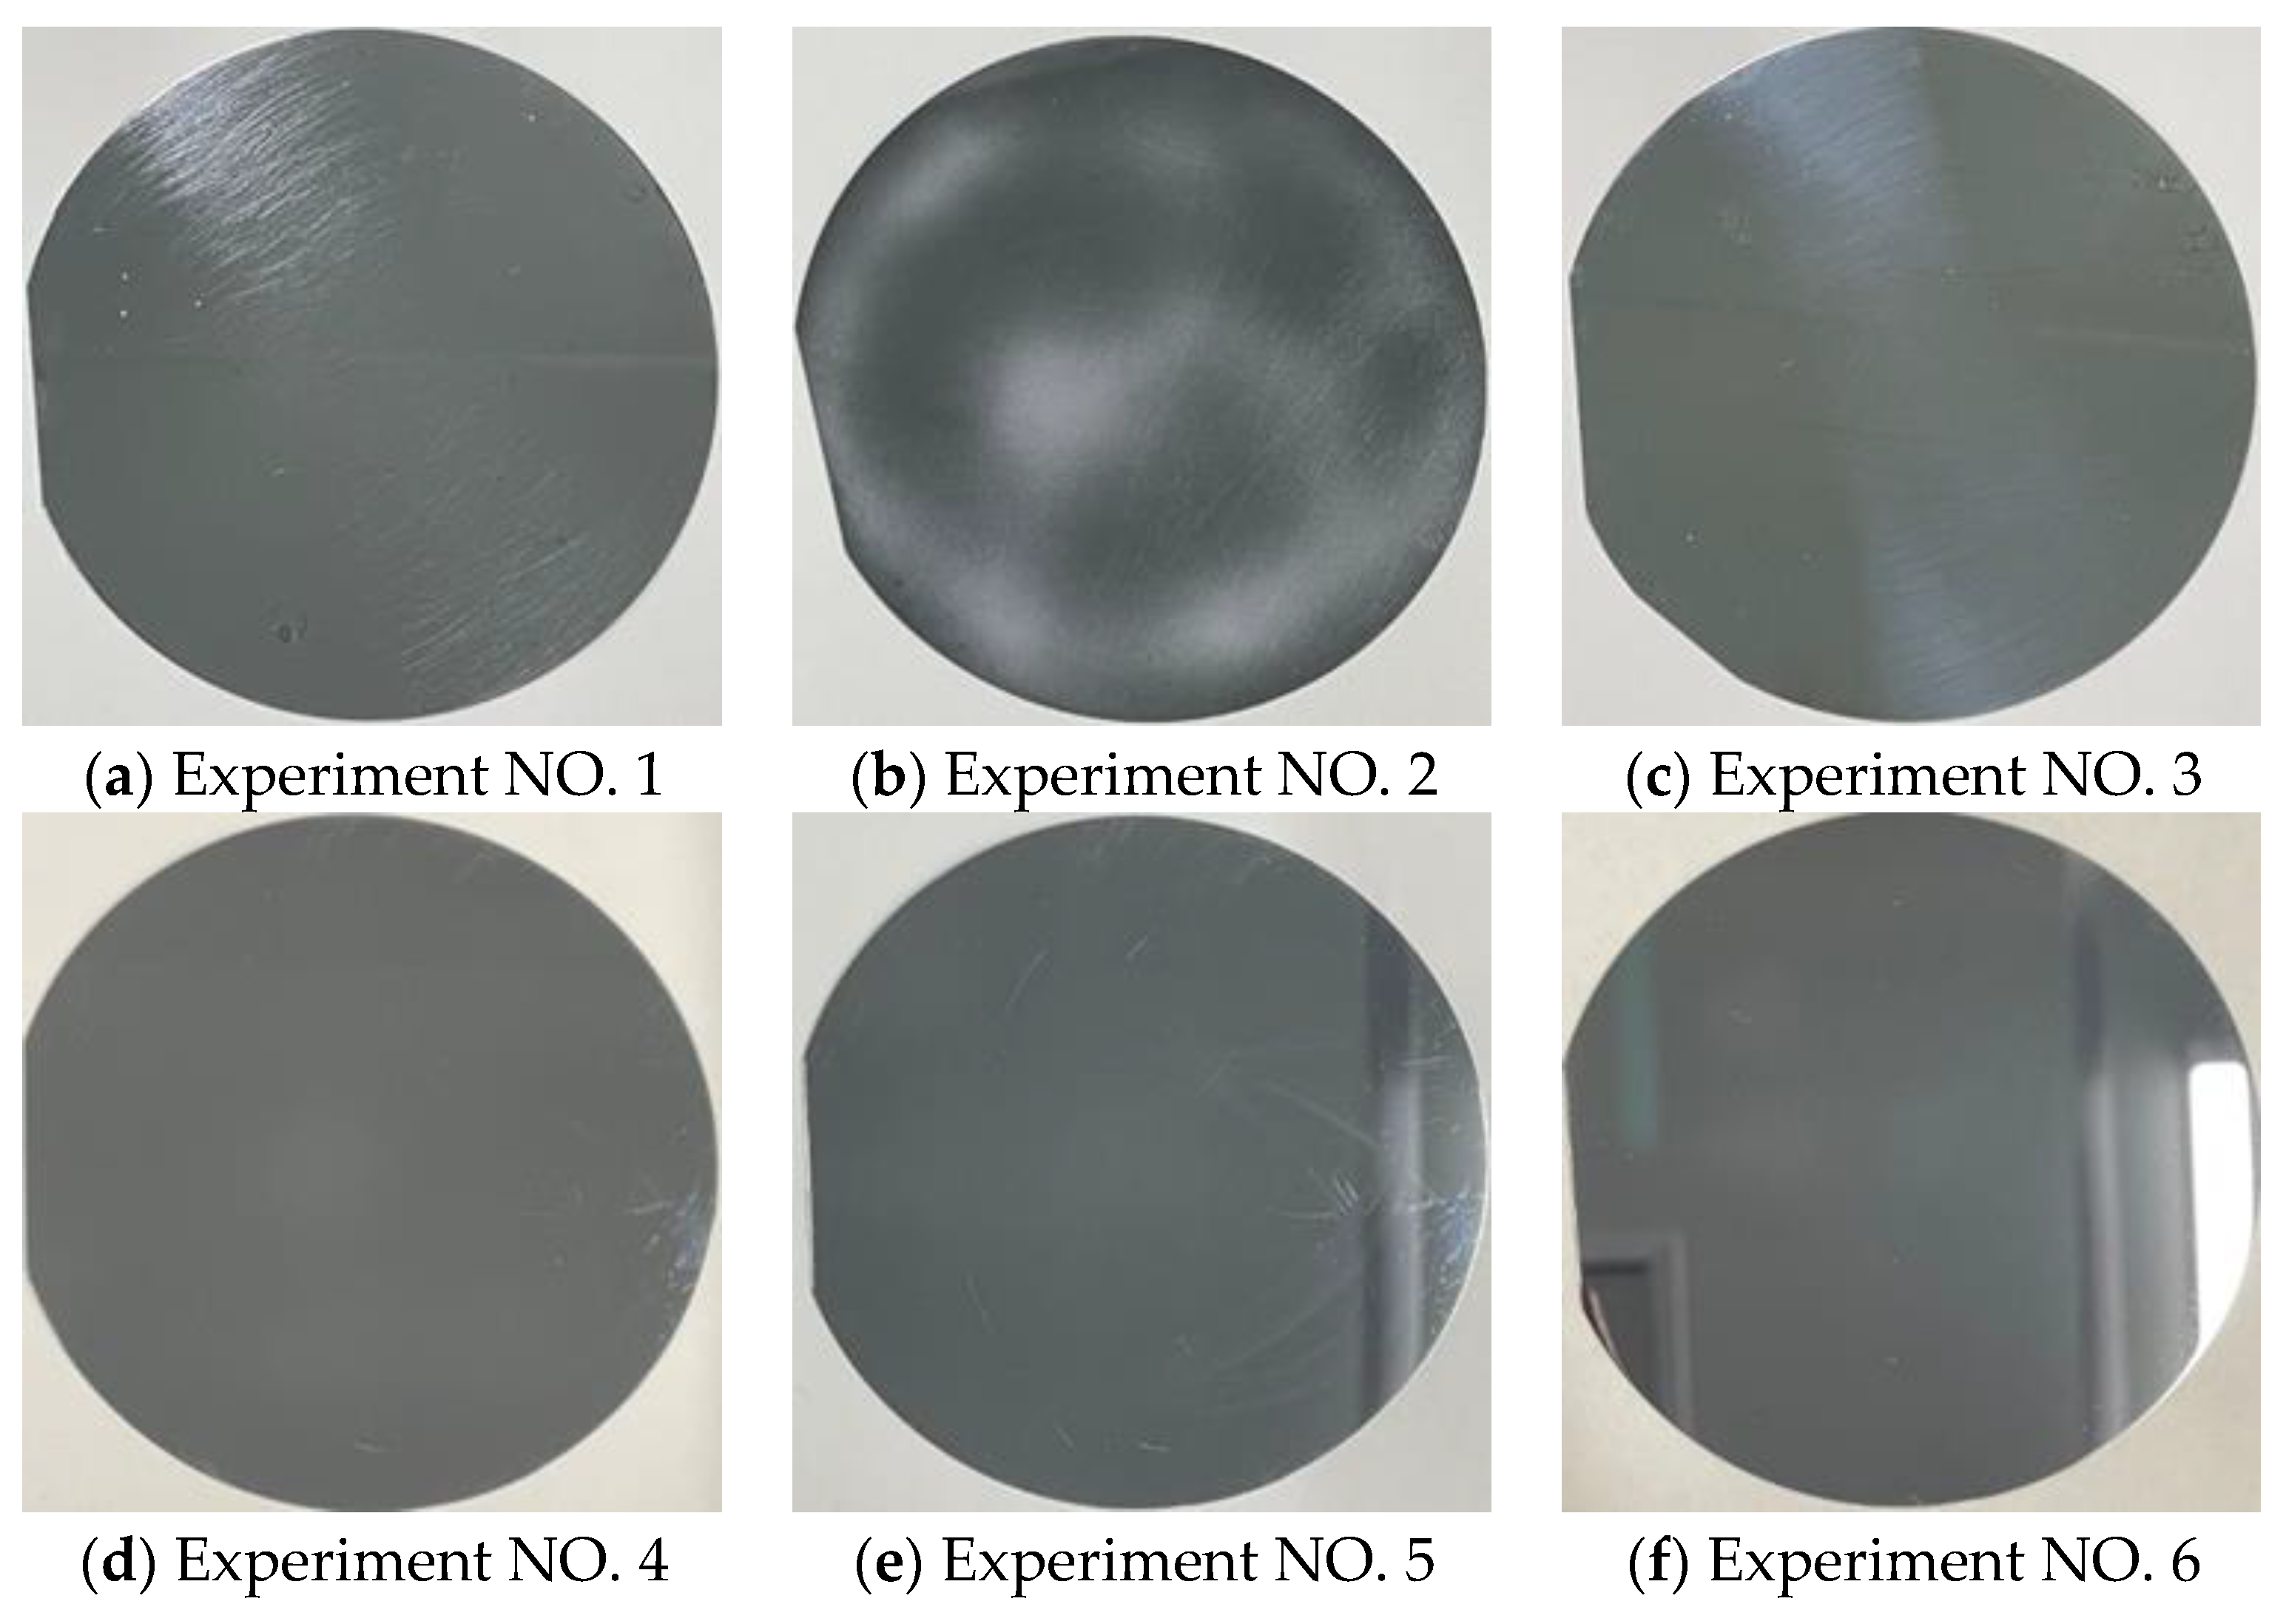
Figure 35.
Scratch morphology of the workpiece surface.
Figure 35.
Scratch morphology of the workpiece surface.
Table 1.
Parameters applied in the simulation model.
Table 1.
Parameters applied in the simulation model.
| Variable Name | Variable Value |
|---|
| Matrix material | GaAs |
| Matrix size | 45a × 30a × 15a (a = 0.565 nm) |
| Agglomerated particles material | C |
| Agglomerated particles size | R = 80 nm |
| Boundary condition | Periodic boundary conditions |
| Ensemble | Microcanonical ensemble |
| Temperature control method | Nose–Hoover method, maintain 300 K |
| Velocity model | Velocity-Verlet algorithm |
| Potential function | BOP potential function describes the interaction between GA and As atomsZBL potential function describes the interaction between agglomerated particles and GaAs |
| Time step | 1 fs |
| Scratch speed | 100 m/s |
| Scratch distance | 2 nm, 4 nm, 6 nm, 8 nm, 10 nm, 12 nm |
Table 2.
Orthogonal experimental factors and level parameters.
Table 2.
Orthogonal experimental factors and level parameters.
| Factors | Parameters | Level 1 | Level 2 | Level 3 |
|---|
| A | Workpiece speed (rpm) | 400 | 500 | 600 |
| B | Polishing disc speed (rpm) | 10 | 20 | 30 |
| C | Magnetic field generator speed (rpm) | 10 | 20 | 30 |
| D | Magnetic field eccentricity (mm) | −20 | 0 | 20 |
Table 3.
Orthogonal experimental design table.
Table 3.
Orthogonal experimental design table.
| | Factor | A | B | C | D |
|---|
| Levels | |
|---|
| 1 | 1 | 1 | 1 | 1 |
| 2 | 1 | 2 | 2 | 2 |
| 3 | 1 | 3 | 3 | 3 |
| 4 | 2 | 1 | 2 | 3 |
| 5 | 2 | 2 | 3 | 1 |
| 6 | 2 | 3 | 1 | 2 |
| 7 | 3 | 1 | 3 | 2 |
| 8 | 3 | 2 | 1 | 3 |
| 9 | 3 | 3 | 2 | 1 |
Table 4.
Scratch depth mean value analysis.
Table 4.
Scratch depth mean value analysis.
| | Factor | A | B | C | D |
|---|
| Levels | |
|---|
| 1 | 5.263 | 7.644 | 6.582 | 7.077 |
| 2 | 7.554 | 7.336 | 7.964 | 7.154 |
| 3 | 8.334 | 6.171 | 6.605 | 6.920 |
| δ | 3.070 | 1.473 | 1.381 | 0.233 |
| Patch | 1 | 2 | 3 | 4 |
Table 5.
Scratch width average analysis.
Table 5.
Scratch width average analysis.
| | Factor | A | B | C | D |
|---|
| Levels | |
|---|
| 1 | 14.22 | 21.17 | 18.30 | 19.95 |
| 2 | 20.96 | 20.45 | 18.01 | 19.20 |
| 3 | 23.23 | 16.80 | 22.09 | 18.80 |
| δ | 9.01 | 4.37 | 4.08 | 1.15 |
| Patch | 1 | 2 | 3 | 4 |
Table 6.
Scratch track length average analysis.
Table 6.
Scratch track length average analysis.
| | Factor | A | B | C | D |
|---|
| Levels | |
|---|
| 1 | 317.5 | 592.6 | 368.7 | 438.1 |
| 2 | 382.9 | 315.6 | 372.2 | 371.9 |
| 3 | 429.7 | 221.9 | 389.1 | 320.0 |
| δ | 112.2 | 370.7 | 20.3 | 118.1 |
| Patch | 1 | 2 | 3 | 4 |
Table 7.
Experimental parameters.
Table 7.
Experimental parameters.
| | Workpiece Speed (rpm) | Polishing Disc Speed (rpm) | Magnetic Field Generator Speed (rpm) | Magnetic Field Eccentricity (mm) |
|---|
| (a) | 600 | 20 | 20 | 0 |
| (b) | 600 | 30 | 20 | 0 |
| (c) | 500 | 20 | 20 | 0 |
| (d) | 500 | 30 | 20 | 0 |
| (e) | 400 | 20 | 20 | 0 |
| (f) | 400 | 30 | 20 | 0 |


