Abstract
The relevance of the problem is justified and the review of existing methods for determining the overhead line sag by the period of the conductor owned oscillations is conducted. The method of controlling the sag by the period of its own oscillations is briefly presented. The experimental installation for conducting full-scale tests is described, which includes the conductor (64 m), rigid fasteners at the points of conductor suspension, accelerometer, and temperature sensor mounted on the conductor, data from which are processed and recorded by the specialized software. The measurement method is explained with a detailed description. The conductor oscillations spectral analysis is performed. The results of experimental main harmonic frequency measurements, conductor, and changes in the sag are presented. A comparative results analysis showed the efficiency of the proposed method. The described method for determining the sag is easy to use (it is enough to install an accelerometer on the conductor and process data from it) and can be recommended for monitoring the condition of overhead power lines. The correlation of changes in the conductor oscillations spectral harmonics amplitude with temperature was studied. It is found that the correlation coefficient initially increases with the growth of the harmonics number. It is maximal for the ninth harmonic R = −0.9, and then slowly weakens, remaining between 0.9 and 0.8. This property of high-frequency harmonic oscillations can be used in the high-voltage lines condition diagnosis.
1. Introduction
Electrical energy is transferred from power plants or substations to the consumer via power lines (mainly overhead power lines), which are part of electrical systems. An overhead power line is a device for transmitting electrical energy through conductors located in the open air and secured with insulators and linear fittings to the supports. The length of overhead power lines in the Russian Federation is over 2.8 million km. The power grid is rapidly becoming obsolete. The level of equipment wear reaches 70% [1]. At the same time, due to the increase in electricity consumption and commissioning of new sections of overhead power lines, the need for full-fledged monitoring to prevent emergencies increases.
All elements of overhead power lines experience mechanical stress and can be damaged if their mechanical strength limit is exceeded. Structural elements of overhead power lines experience both horizontal (for example, mechanical stresses in a stretched conductor/cable) and vertical loads (for example, from their own weight). Conductors and cables are elements of the overhead line on which changes in mechanical loads are observed to a greater degree. This is due to changes in the tension of the conductor/cable depending on temperature and formation of icy-rime deposits (IRD) on it [2], as well as fluctuations from wind gusts.
A real-time direct local detection of ice accretion can be useful in a number of applications, and in particular for monitoring the transmission and distribution network. This is because the accretion of ice, snow, wet snow, frost, etc., and their mixtures can lead to potential clearance violation, damage, and power outages due to important static and/or dynamic mechanical overloads. The main mechanical stresses in the conductor/cable of the overhead line are associated with its extension. With an increase in the tensile strength of the conductor or rods (cores) of which it is made, its tension also increases. Exceeding the tensile strength of an overhead power line element can lead to its damage in the following ways: conductor/cable breakage, failure or breakdown of the insulator, interphase short circuit due to conductor “dancing,” and others. Mechanical overload of a power line structural element can occur due to the appearance of icy-rime deposits (IRD), the development of fatigue of the air power transmission line structural element, errors in the construction of the line, as well as repair and restoration work. Among the listed reasons, the appearance of IRD is accompanied by the most serious consequences. Therefore, in the future, this problem will catch special attention.
According to the map of ice loads, the Republic of Tatarstan belongs mainly to the second risk group (the normative ice wall thickness on a conductor/cable is at least 15 mm). However, the Bugulminsky district, for example, belongs to the fourth, most dangerous group (the normative ice wall thickness on the conductor/cable is at least 25 mm). Problems with ice formation were also detected in Leninogorsk, Nurlat, and Almetyevsk regions. The number of temperature transitions through 0 °C increased. This led to an increase in the probability of ice formation, since icy-rime deposits on the conductors/cables of power lines are formed when supercooled drops of rain, drizzle, or fog freeze at temperatures 0 °C and below [3].
During a relatively mild winter, with a sharp change in ambient temperature from positive to negative, drops of water settle on the conductors/cables and an avalanche-like process of formation of a thick ice crust begins. It reaches a thickness of several tens of millimeters, which significantly increases the weight of conductors/cables. Deposits of ice, rime, and wet snow pose a great danger to the normal operation of overhead transmission lines (OTL). They can cause: (a) misalignment of conductors and cables and their rapprochement with each other; (b) rapprochement of conductors and cables during a jump due to non simultaneous discharge of ice; (c) intense galloping, causing short circuits between conductors and between conductors and cables, burns of conductors and cables, and in some cases damage to linear fittings and fixtures; (d) a significant overload of conductors and cables and their breaks; (e) destruction of supports as a result of breakage of conductors and cables during overloading from ice, when unbalanced loads on supports from remaining whole conductors and cables significantly exceed the calculated loads, as well as when ice is combined with strong wind; and (f) overlap of the linear insulation of overhead lines during ice melting, due to a significant decrease in the ice discharge characteristics of insulators as compared to moisture discharge characteristics, which usually select the required level of linear insulation [2]. Thus, it is necessary to accurately localize a site or defect that is problematic with ice, since it is often difficult to travel along overhead lines (deep snowdrifts, natural barriers, marshy terrain, reliefs, etc.), and the time of preventing/eliminating an emergency directly related to the losses incurred.
2. Overview of Existing Methods and Means of Determining Mechanical Loads on an Overhead Power Line
Conductors and cables suspended to the supports of an overhead power line are constantly exposed to a vertical load from their own weight, evenly distributed along the length of the line. In addition, other loads can affect them: a vertical load from ice and a horizontal load from wind. Therefore, the task of determining mechanical loads on an overhead power line from a practical point of view is inextricably linked with the determination of ice-wind loads.
Given the importance of power line monitoring, several devices and methods have been proposed to date in order to measure the sag in the presence of snow, wet snow, frost, etc., and any of their mixtures designated shortly hereinafter by ice accretion and/or atmospheric icing, with respect to a suspended span of cable of an overhead electrical power line. Continuous online monitoring of electrical high-voltage overhead power lines is essential to timely detect anomalous conditions which could lead to a power outage. Measurement of power line spans between successive supports to determine whether the sag (clearance resp.) is lower (higher resp.) than an acceptable maximum (minimum resp.) value became a mandatory requirement in some countries, including Russian Federation.
Several devices and methods have been proposed to measure the sag and other relevant parameters, either directly or indirectly related to sag. A number of different methods that perform sag measurement are known [4].
The sag of power lines monitoring can be performed by using visual inspection of overhead lines [5], models, weather models, measuring using image-processing and detection of a target installed on the conductor, measuring using a conductor replica attached to the tower to catch an assimilated conductor temperature without Joule effect, measuring the surface temperature of the phase conductor, measuring conductor tension, measuring using global positioning systems (GPS), measuring the angle of the conductor at the pole or at a location along the span, and measuring vibrations of the conductor, etc.
However, the disadvantage of visual assessment of the type of deposit is the limited coverage of all problem areas of overhead lines, since the capabilities of field teams are limited.
The technique of 3D modeling of overhead lines is associated with the restoration of three-dimensional models of its elements, by which it is possible to determine all the current geometric parameters of an overhead power transmission line (wire/cable sag and span lengths) [6,7].
This technique can be implemented in two ways: photogrammetric and laser scanning of overhead lines. As a platform for placing the equipment necessary for the implementation of this technique, unmanned aerial vehicles or small-sized manned aircraft are used [8].
The advantages of constructing a 3D model of overhead lines are high accuracy in determining the geometric parameters of power transmission line elements and their relative position. This information can be used in calculations of mechanical loads at the time of video recording or laser scanning.
The disadvantages of this technique for determining the mechanical loads on overhead lines include: limitations in conducting a survey associated with adverse weather conditions (high wind speed, poor visibility) and the lack of possibility of carrying out full monitoring in real-time (in the conditions of the formation of IRDs on overhead lines, the speed of making a decision to combat ice is of great importance), since it takes time not only to obtain the necessary amount of data but also to process them.
The optical method of examination implies the use of video surveillance cameras mounted on overhead lines to control icing [9].
Video cameras can act as independent units of inspection of overhead lines and as a component of the camera system—an optical mark, which monitors the current geometric parameters of overhead lines (wire sag, support tilt). This method is quite effective and cheap, since the price of modern web cameras is only tens of dollars and the installation of systems based on the optical principle is very simple.
However, this method also has disadvantages: in case of poor visibility, this technique cannot be used; the video camera and the optical label must be protected from external influences (icing on the optics, getting covered with snow).
The capacitive method of monitoring the state of overhead power lines works because the permittivity of a space depends on what it is filled with [10].
The dielectric constant between two contacts in the presence of ice deposits between them will be greater than without ice. Therefore, the capacity will also be larger. Measurement of the capacitance of the sensor and its comparison with the calibrated value (in the absence of ice deposits) allows one to determine the presence/absence of ice deposits and/or their thickness [11].
The main disadvantage of this type of device is that the ice layer is determined only directly near the sensor, and there is no way to determine the thickness of the ice layer over the entire span.
The thermodynamic method [11], does not control the size of the IRD sleeve on wires/cables of overhead lines and not its weight, but determines the conditions for the occurrence of IRD.
Ice, crystalline, and granular frost are formed as a result of desublimation of water vapor into precipitation and freezing of super-cooled water. To determine the desublimation point and dew point, it is necessary to know the temperature of the wire and the environment as well as air humidity.
According to the authors. [12], the thermodynamic method makes it possible to analytically determine not only the conditions for the occurrence of IRD on the wire, but also the intensity of IRD formation and maximum possible mass of IRD for certain conditions.
With a large number of advantages, the thermodynamic method has also a number of disadvantages, such as the workload of the method with mathematical calculations (preliminary data on dew points and desublimation points for each specific territory are required since weather conditions are different) and the need for significant hardware costs for measuring and processing a large number of synoptic measurement parameters for predicting the type of deposits.
The following systems based on stationary devices are used to monitor the state of overhead lines: SAT-1 (USA) [13], DiLin (RF) [14], Astrose (Germany) [15], LINDSEY (USA) [16], etc.
The SAT-1 system monitors weather conditions and mechanical loads at the points of conductor suspension to the support. The system is quite simple, but due to the patented analysis algorithms, it is possible to determine such OTL parameters as sag arrow, the presence of IRD. The main disadvantage of this system is the use of strain gauges mounted on the traverse of the supports, which complicates the installation of the SAT-1 system [13].
The operation of the DiLin system (RF) is based on the frequency method [17,18] for controlling ice formation on overhead lines. Monitoring the presence of icy-rime deposits on overhead line conductors is determined by the change in the speed of the electromagnetic field wave along the power line conductor. The appearance of ice on the conductors is equivalent to the appearance of a large number of short-circuited circuits covering the linear conductor in the icing zone. With an increase in the icing zone of conductors and the thickness of the ice layer, the influence of these “active-inductive” circuits also increases. This, in turn, leads to an increase in the wave impedance of the overhead line. The active component of the resistance of icy contours leads to an increase in the attenuation of the amplitude of high-frequency signals moving along the line. The reactive resistance of the ice contours slows down the speed of the electromagnetic field wave along the line conductors. However, this method has several disadvantages a high error in the localization of defect sites (up to kilometers) and an increased influence of connections to the overhead line and environmental factors (the internal resistance of line changes, which affects the reflected signals) [19].
The LINDSEY (USA) [16] and Astrose (Germany) [15] systems have proven themselves as best for monitoring the state of overhead lines by indirect methods. They include a tilt angle sensor, temperature sensor, and current sensor, which allow for determining the mechanical loads and parameters of the overhead line [17]. LINDSEY and Astrose systems are very informative and form a self-organizing conductor-less data network. However, these systems have a number of drawbacks: the mathematical model does not allow tracking of the icing process and does not take into account the hauling of the conductor between adjacent spans or the change in the overhead line geometry, depending on the conductor temperature [15].
Methods measuring sag using image processing and detection of a target installed on the conductor [20,21,22] are sensitive to reduction of visibility induced by meteorological conditions, and in particular, in case of ice fog and freezing fog.
Thus, two methods are mainly used to calculate the mechanical loads of overhead power lines: (1) direct determination (using Tensometric sensors) or indirect (inclinometer methods, which are based on the inclination angle of the conductor); (2) improved inclinometer method for determining mechanical loads on an overhead power line. The most promising method for determining mechanical loads on a conductor/cable is the inclinometer method based on measuring the angle of inclination of various objects relative to the gravitational field of the earth. As a verification method, a technique is being developed to determine the mechanical loads on a conductor/cable depending on the angle of its rotation around its axis. In this case, the monitoring device should be installed in close proximity to the point of suspension of the conductor/cable to the string of insulators on the anchor support (for example, 1 m from the point of suspension of the conductor/cable). This is possible because when the conductor/cable is stretched, its rotation around its axis is observed, which allows for obtaining additional information. This therefore improves the existing inclinometer method for determining the tension of the conductor/cable from its angle of inclination. The spiral shape that is attached to the conductor when twisting a high-voltage conductor/cable is subsequently maintained due to residual strains obtained by twisting. Stresses that occur in the conductor during twisting are mainly driven by bending and torsion. If the stresses are within the elastic range, then the conductor will restore its original direct shape after the termination of the impact from external forces. In fact, when twisting a conductor/cable, its rods always get residual deformations [23]. Due to the presence of mechanical deformations during tension of the conductor/cable, its rotation around its axis is observed, which allows obtaining additional information about the behavior of the conductor/cable on the overhead power line. As such, consider it not within a single span, but as a whole interconnected section with the redistribution of mechanical loads between spans.
It is possible to use the third method. This method to be considered is the measurement of the span swaying period together with temperature measurements. The third method takes partly into account the influence of wind. When a span moves under the wind pressure, free and enforced swings can be observed. However, we will consider only main free swing of a conductor as a whole. We can make it because the main period can be evaluated by modern mathematical methods from data collected during a sufficiently long time of measurement.
There are some papers [24] considering the mathematical models of mechanical motion of the conductor in span. The results of these papers confirm that the frequencies of oscillations of a tightly stretched string made by analytical methods and by using digital methods of calculations coincide with the errors of some percentages. The results of experimental methods of measurement are also very close to the theoretical results.
Therefore, at present, the high-voltage power transmission lines state is under constant control. Various monitoring the condition of transmission lines methods are used [2,3,4,13,14,16,19,20]. Several systems and monitoring overhead power lines methods have been developed in Kazan State Power Engineering University [19,23,25,26,27,28]. They can be divided into static and dynamic methods. Static methods include the inclinometer method and the measuring the conductor twisting angle method in the span [23,26]. Dynamic methods include measuring the conductor oscillation period methods [27,29,30].
3. The Method of Measurement
The developed monitoring system is designed to track the transmission line condition [23]. Therefore, it has a rather complex structure and should monitor not only the power transmission line’s technical characteristics, but also the environmental state. The monitoring system includes a power supply unit, sensor unit, microprocessor control unit, and communication unit. The sensor unit includes accelerometers measuring the conductor inclination angle with respect to the ground and the conductor deviation angles with respect to the vertical and horizontal planes, conductor, and environment temperature sensors, as well as a humidity sensor.
The development inclinometer method is the determining the sag method according to the conductor oscillation period measurement in the span as a whole [27,31]. In this method, the accelerometer is fixed near (0.7–1 m) the conductor attachment point. According to the measurement of the conductor deviation amplitude from the vertical span plane, the first harmonic is allocated, i.e., the method is actually a method of decomposing oscillations into spectral components, but the higher (odd) harmonics are neglected as not affecting the sag. The sag is determined by the formula [27]:
where is the acceleration constant, T is the period of oscillation. If the difference in the conductor suspension points height in relation to the span length does not exceed 10%, then its influence on the error of determining the sag value can be neglected [27,31]. The advantage of the sag determining method by the conductor oscillation period as a physical pendulum is that the main harmonic does not depend on such quantities as gravity, mass and span length, and on conditions such as temperature and icing.
In this paper, the following task is set—to analyze what useful information is carried by the high-frequency components of the conductor oscillations spectrum in the span and how to use it to monitor the overhead line state.
Historically, the analysis of transverse conductor oscillations by representing it as a rigid physical pendulum fixed and suspended at the two extreme span points has been discussed for a long time [32,33]. Physical pendulum fluctuations at small angles are usually discussed. For small oscillation angles, only harmonic oscillations at one fundamental frequency are considered. When increasing the deviation angle, the third and fifth harmonics are considered [24].
At the same time, when analyzing oscillations, it is customary to distinguish between oscillations with a small amplitude (the size of several conductor diameters) and galloping—vertical oscillations with an amplitude of up to 5 m. The first affects the gradual conductor destruction at the attachment points, and the second breaks and short circuits by clashing the neighboring phase conductors. This means that the higher conductor oscillations harmonics still play an important role in the overhead line operation. They need to be considered in monitoring and diagnosing the overhead line condition.
Theory of Conductor Oscillations in a Span under the Influence of Wind
Consider the transverse oscillations of a string of length l, tightly stretched with a gravitational force T0, H, which is affected by a force of g(x,t)/ρ. Here ρ is the density of the string material mass, kg, per unit length, m, x—horizontal coordinate, —time.
where
This equation is called the string oscillations equation [34]. This equation solution consists of two parts, one of which describes the forced string vibrations, and the second of which describes free vibrations when g(x,t) = 0. The transverse vibrations of a string can be described as the sum of n harmonic vibrations .
where
with
= −—the phase of the harmonic oscillations with the number n. Each string point x0 performs harmonic vibrations:
at the frequency (they are the same for all string points and are called their own frequencies) with an amplitude that depends harmonically on the point position : . The circular frequency of the harmonic with the number n is related to the tension force T0, length l, and density per unit conductor length ρ by the ratio,
So, if then
This means that with the sensor suspended from the string (conductor) in the span middle, only odd harmonics of vibrations with , k = 0, 1, 2, 3 …; can be measured.
The problem of the overtones spectral composition, depending on the location, strength, duration in time, and length along the string length of the shock applied to the string, is considered in the book [34]. The considered examples show that the interval width over which the impact is made and impact time duration have a very significant effect on the energy value of high overtones. In addition, it is noted that the presence of a multiplier with the impact location indicates that if the center of the hammer impact falls on the node of the number harmonic n, then the energy of this harmonic will be zero.
Thus, this consideration of the problem [34] allows us to refine the string vibrations spectrum. It turns out that this spectrum depends on the coordinate c and the impact on the string method.
1. In the case of a concentrated impact at point c having an impulse K, oscillations take form of
The nth harmonic energy is equal to
2. The string is excited by a hammer having a width of 2δ at the point c. However the hammer is not perfectly rigid. The vibrations of the string are determined not by the initial velocity, but by the force that changes with time. In this case, the equation is solved with the right part
The solution of this equation for the moment of time t > τ is written as :
Let’s imagine that we are dealing with a high-voltage line conductor stretched “like a string”, which is affected by the wind directed perpendicular to the line connecting the conductor suspension points. The wind structure is a laminar or turbulent flow. Since high-voltage power lines are located in areas with changing terrains, the building’s presence, shrubs, and tall trees randomly distributed in relation to the overhead line, it is logical to assume that the flow structure within the span is heterogeneous. Different stream sections have different flow rates. Complex forced conductor vibrations are observed. In this case, according to Formula (12), the conductor, which we represent as a string, performs forced and free oscillations with a rich frequency spectrum. The frequency spectrum composition depends on the size, strength, and duration of the wind flow components. The presence in the expression denominator (12) of terms containing multipliers
indicates that with the growth of the harmonic number n, the contribution of high harmonics can grow to a certain limit. In our opinion, this means that high-frequency harmonics can play an important role in diagnosing the conductor condition. For example, when the conductor is iced with a decrease in the ambient temperature, its stiffness will increase. The flexible conductor will gradually turn into a rigid structure, similar to a physical pendulum. In this case, some high-frequency harmonics will weaken and disappear from the oscillation spectrum. This phenomenon of the high frequencies disappearance in the conductor vibrations spectrum with temperature decreasing can be used as a conductor icing indicator.
4. Description of an Experimental Setup for Control Conductor Oscillations
Conductor elongation depends on its temperature and determines the sag. Therefore conductor sag is related to its temperature. Thus, a high correlation with the conductor oscillations by its temperature would confirm the possibility of determining the conductor sag according to its oscillations.
An experimental installation for conducting full-scale tests includes a conductor, rigid fasteners at the conductor suspension points, accelerometer, and temperature sensor mounted on the conductor, data from which are processed and recorded by specialized software (Figure 1). In the experiment, the AS-70/11 conductor is used. The span length is 64 m, and the height difference between the suspension points is 0 m. Thus, the experimental installation simulates the operation of a 64-m-long overhead line span.
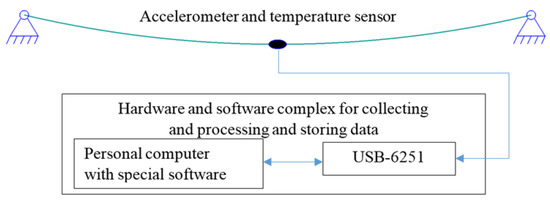
Figure 1.
Experimental setup description.
The ADXL311 analog accelerometer that measures the conductor’s frequency at 1000 Hz is installed at the conductor center. Frequencies above 50 Hz are filtered by hardware. The conductor temperature is determined by the LM60B sensor, having a temperature measurement error of no more than 1 °C. Data from the accelerometer and temperature sensor are transmitted to the data collection and processing point (Figure 1), which includes a personal computer with specialized software in the LabView development environment and a multifunctional input-output device USB-6251.
Specialized software allows us to receive data from the accelerometer and the conductor temperature sensor, perform primary data filtering by averaging the sample data for a given number of measurements, and setting a required range of signal amplitude from the accelerometer. Signal averaging allows amplifying the signal/noise ratio.
The average data packet values are output to the final diagrams of the average values of the temperature and conductor oscillations frequency for the entire time of the experiment from 29 December 2020 to 13 January 2021. These data are used to detect the relation between the temperature and the conductor oscillations frequency.
5. Experimental Research Results
In the course of experimental studies, data on the first 25 odd harmonics were analyzed. The experimental data accumulated over 16 days contain many random outliers. Therefore, the data undergo primary filtering by dividing the complete set of measured data into samples of a given duration and finding the arithmetic mean of each sample. Then the resulting arithmetic mean values of the samples are output to the final data packet, which undergoes further processing and analysis. The data sample size for the primary filtering in the program was taken at 400,000 measurements for the first harmonic and 40,000 measurements for the odd harmonics from the third to the twenty-fifth. This is due to the large period of the first harmonic compared to multiple harmonics. Thus, the data are averaged for the first harmonic over 400 s, and for subsequent odd harmonics over 40 s.
The results of processing data samples after primary filtering are loaded into the final diagrams of the average values of the temperature and frequency for the entire duration of the experiment from 29 December 2020 to 13 January 2021. These data are used to detect the relation between temperature and conductor oscillations frequency.
Further, the secondary data filtering on the conductor temperature and on the conductor oscillations frequency is completed. Filtering the totals is completed by rejecting outliers by removing 2.5% of the extreme data in the upper and 2.5% of the extreme data in the lower ranges. The final filtering is completed by the moving average method with a window width of 15 points. The graph of the conductor temperature variation before and after secondary filtration, prepared for the first harmonic, is shown in Figure 2 and for subsequent odd harmonics in Figure 3. The conductor oscillation frequencies data before and after secondary filtering for the first harmonic are shown in Figure 4 and for the ninth harmonic in Figure 5.
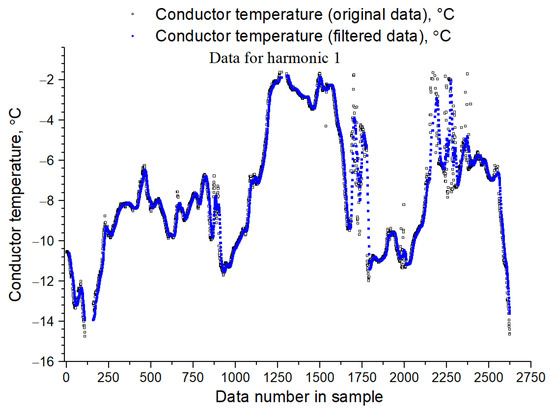
Figure 2.
Graphs of conductor temperature variation before and after secondary filtration, prepared for joint processing of temperature data with the first harmonic.
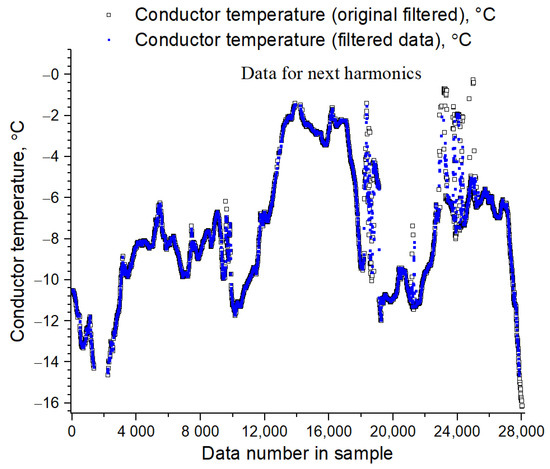
Figure 3.
Graphs of conductor temperature variation before and after secondary filtration, prepared for joint processing of temperature data with odd harmonics from the third to the twenty-fifth.
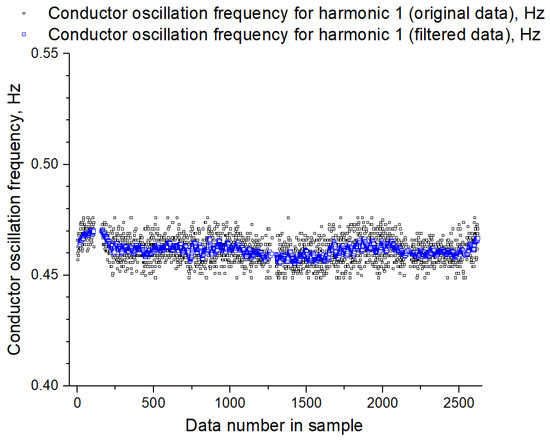
Figure 4.
Graphs of variations in the conductor oscillations frequency before and after secondary filtering for the first harmonic.
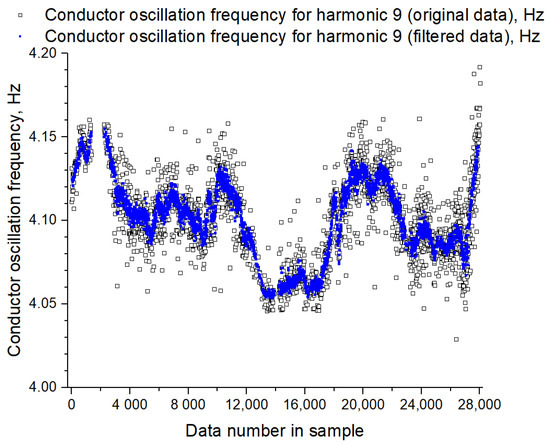
Figure 5.
Graphs of variations in the conductor oscillations frequency before and after secondary filtering for the ninth harmonic.
The diagrams of the conductor oscillation frequency dependence on its temperature for harmonic 1 (Figure 6) and for harmonic 9 (Figure 7) are presented below. The diagrams show a high correlation between the conductor oscillation frequency and conductor temperature.
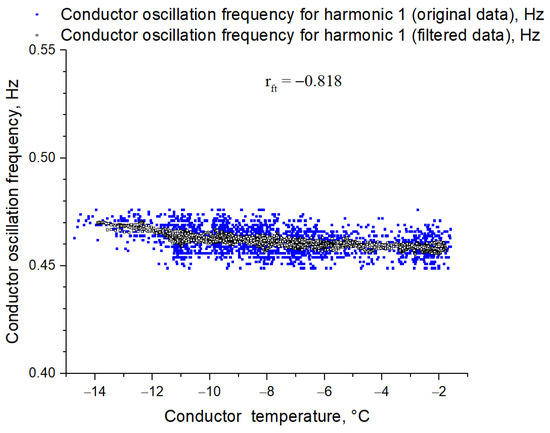
Figure 6.
Conductor oscillation frequency vs. conductor temperature diagram for harmonic 1 (correlation coefficient −0.818).
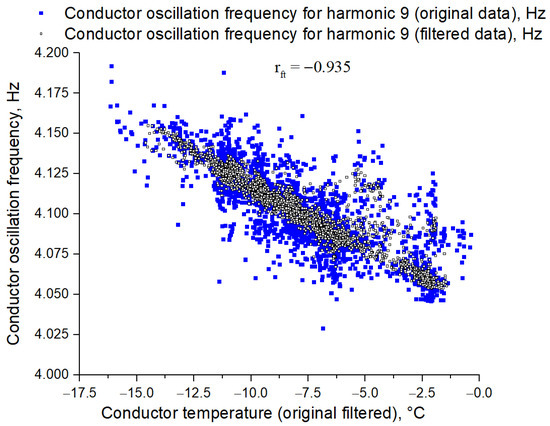
Figure 7.
Conductor oscillation frequency vs. conductor temperature diagram for harmonic 9 (correlation coefficient −0.935).
Thus, in the studies, there is a relation between the conductor oscillation frequency and its temperature for odd harmonics from the first to the twenty-fifth (Figure 8). The results demonstrate a high or very high correlation between these parameters. The correlation coefficient increases to the ninth harmonic and then starts to decrease.
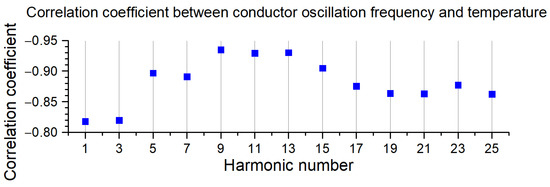
Figure 8.
Correlation coefficients between the conductor oscillation frequency for odd harmonics from 1 to 25 and its temperature.
After the final analysis, linear regressions were observed for the first, ninth, and twenty-fifth harmonics (Figure 9). COD (coefficient of determination) has values of between 0.669 and 0.873, which confirms the high correlation between the conductor oscillation frequency and conductor temperature.
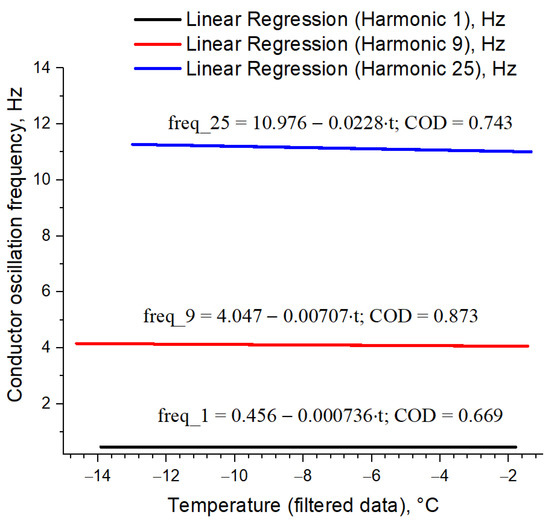
Figure 9.
Linear regressions for first, ninth, and twenty-fifth harmonics.
Thus, there is a close relation between the conductor oscillation frequency and conductor temperature, and, therefore, between the conductor oscillation frequency and the sag value. This confirms the possibility of using the previously developed method for determining the sag by the conductor oscillations period on real overhead lines. In this case, the best solution may be to work not with the fundamental harmonic of the conductor oscillations, but to recalculate the fundamental harmonic frequency according to the data of higher multiple harmonics. This will allow one to more accurately determine the sag of the overhead line conductor.
6. Conclusions
The results of experimental main harmonic frequency measurements, the conductor temperature, and variations in the sag are presented. A comparative results analysis showed the efficiency of the proposed method. The described method for determining the sag is easy to use (it is enough to install an accelerometer on the conductor and process data from it) and can be recommended for monitoring the condition of overhead power lines. The correlation of variations in the conductor oscillations spectral harmonics amplitude with temperature was studied. It is found that the correlation coefficient initially increases with the growth of the harmonics number is maximal for the ninth harmonic R = −0.935, and then slowly weakens, remaining between −0.818 and 0.935. This property of high-frequency harmonic oscillations can be used in high-voltage lines’ conditional diagnostics.
Author Contributions
Conceptualization, D.Y. and M.S.; methodology, D.Y.; software, D.Y., M.S. and M.G.; validation, M.G., D.I. and N.A.; formal analysis, M.G.; investigation, D.Y. and N.A.; data curation, M.S. and M.G.; writing—original draft preparation, N.A.; writing—review and editing, N.A. and D.I.; visualization, M.G.; supervision, D.Y.; project administration, D.Y.; funding acquisition, D.Y. and M.S. All authors have read and agreed to the published version of the manuscript.
Funding
The research work was carried out under the financial support of the Ministry of Science and Higher Education within the scope of the state Research and Development task no. 075-03-2022-151 of 14.01.2022 “Distributed automated systems of monitoring and diagnostics for technical condition of overhead power lines and substations based on broadband data transmission technology through power lines and the industrial Internet of Things”.
Institutional Review Board Statement
Not applicable.
Informed Consent Statement
Not applicable.
Data Availability Statement
Not applicable.
Conflicts of Interest
The authors declare no conflict of interest.
References
- Bokov, G. Technical re-equipment of Russian electric networks. How much can it cost? Electr. News 2002, 2. Available online: http://www.news.elteh.ru/arh/2002/14/03.php (accessed on 5 June 2022).
- Panasenko, M.V. Analytical review of methods and devices for monitoring the intermediate span of an overhead power line. Int. J. Appl. Fundam. Res. 2014, 11, 572–576. [Google Scholar]
- Satsuk, E.I. Software and Hardware for Monitoring Overhead Power Lines and Managing the Power System in Extreme Weather Conditions. Ph.D. Thesis, Moscow Power Engineering University, Moscow, Russia, 2011. [Google Scholar]
- Godard, B. Method and System for Measuring/Detecting Ice or Snow Atmospheric Accretion on Overhead Power Lines. U.S. Patnent 20170227677A1, 22 November 2019. [Google Scholar]
- Geoscan, G.K. Russia. Obsledovanie OHPL. Available online: https://www.geoscan.aero/ru/services/power_lines/ (accessed on 12 June 2022).
- Sumper, A.; Boix-Aragones, O.; Rull-Duran, J.; Amat-Algaba, J.; Wagner, J. Assessment of the Visual Impact of Existing High-Voltage Lines in Urban Areas. Electricity 2021, 2, 17. [Google Scholar] [CrossRef]
- Kompania “Artgeo”, Russia. Vozdushnoje Lazernoye Skanirovanie I Ziffrovaya Fotos’emka. Available online: http://artgeo.ru/technology/vozdushnoe_lazernoe_skanirovanie/ (accessed on 12 June 2022).
- Ghanbari Parmehr, E.; Amati, M. Individual tree canopy parameters estimation using UAV-based photogrammetric and LiDAR point clouds in an urban park. Remote Sens. 2021, 13, 2062. [Google Scholar] [CrossRef]
- Gu, I.Y.; Sistiaga, U.; Berlijn, S.M.; Fahlström, A. Intelligent Video Surveillance for Detecting Snow and Ice Coverage on Electrical Insulators of Power Transmission Lines Conference: Computer Analysis of Images and Patterns. In Proceedings of the 13th International Conference, CAIP 2009, Münster, Germany, 2–4 September 2009; pp. 1179–1187. [Google Scholar] [CrossRef]
- Khawaja, A.H.; Huang, Q.; Khan, Z.H. Monitoring of Overhead Transmission Lines: A Review from the Perspective of Contactless Technologies. Sens. Imaging 2017, 18, 1–18. [Google Scholar] [CrossRef]
- Kucheryavenkov, A.A.; Rukavitsyn, A.A. Device and Method for Determining the Thickness of Ice Deposits on a Wire. Russia Patent RU2614988C1, 3 April 2017. Available online: https://patents.google.com/patent/RU2614988C1/ru (accessed on 12 June 2022).
- Titov, D.E.; Soshinov, A.G.; Shewchenko, N.L. Thermodynamic method of glaze ice monitoring on air lines wires. In Applied Mechanics and Materials; Trans Tech Publications: Freienbach, Switzerland, 2015; pp. 803–807. [Google Scholar]
- Kostikov, I. Monitoring System “SAT-1”-Effective Protection of Overhead Lines from Ice. Electr. Power Transm. Distrib. 2011, 1–4. Available online: http://www.ruscable.ru/article/sistema_monitoringa_sat_1_effektivnay (accessed on 12 June 2022).
- DiLin—System for Monitoring the Presence of Ice on the Wires of Overhead Lines. Available online: https://dimrus.ru/dilin.html (accessed on 25 January 2018).
- Otto, T.W.; Kurth, S.; Morschhauser, A.; Hiller, K.; Moebius, M.; Vogel, M. Integrated Microsystems for Smart Applications. Sens. Mat. 2018, 30, 767–778. [Google Scholar]
- Lindsey, K.E.; Spillane, P.E.; An-Chyun, W. Dynamic Real Time Transmission Line Monitor and Method of Monitoring a Transmission Line Using the Same. U.S. Patent 9,784,766, 10 October 2018. [Google Scholar]
- Rui, X.; Ji, K.; McClure, G. Dynamic response of overhead transmission lines with eccentric ice deposits following shock loads. IEEE Trans. Power Deliv. 2017, 32, 1287–1294. [Google Scholar] [CrossRef]
- Minullin, R.G.; Kasimov, V.A.; Filimonova, T.K. Lokacionnoe obnaruzhenie gololyoda na vozdushnyh liniyah elektroperedachi. Pt1. Sposoby obnaruzheniya gololyoda. Nauchno-tekhnicheskie vedomosti SPbGPU. Informatika. Telekommunikacii. Upr. 2014, 2, 61–73. [Google Scholar]
- Minullin, R.G.; Kasimov, V.A.; Yarullin, M.R. Determination of ice deposits thickness on overhead power lines conductors by location method. In Proceedings of the International Workshop in Atmospheric Icing of Structure (IWAIS 2015), Uppsala, Sweden, 28 June–3 July 2015; pp. 101–104. [Google Scholar]
- Golinelli, E.; Perini, U.; Ogliari, G. A new IR laser scanning system for power lines sag measurements. In Proceedings of the 18th Italian National Conference on Photonic Technologies (Fotonica 2016), Rome, Italy, 6–8 June 2016. [Google Scholar]
- Wydra, M.; Kisala, P.; Harasim, D.; Kacejko, P. Overhead transmission line sag estimation using a simple optomechanical system with chirped fiber Bragg gratings. Part 1: Preliminary measurements. Sensors 2018, 18, 309. [Google Scholar] [CrossRef] [PubMed]
- Wang, H.; Han, S.; Lv, L.J.; Jin, L.J. Transmission line sag measurement based on single aerial image. In Proceedings of the 24th International Conference on Mechatronics and Machine Vision in Practice (M2VIP), Auckland, New Zealnd, 21–23 November 2017. [Google Scholar]
- Goryachev, M.P.; Sadykov, M.F.; Yaroslavskiy, D.A. Method for control the mechanical parameters of overhead power lines based on improved inclinometry. Power Eng. Res. Equip. Technol. 2019, 21, 160–171. [Google Scholar] [CrossRef][Green Version]
- Ivanova, O.A. Numerical and analytical determination of multispan cable eigenfrequencies. In Proceedings of the ECCOMAS 2012 European Congress on Computational Methods in Applied Sciences and Engineering e-Book Full Papers, Vienna, Austria, 10–14 September 2012. [Google Scholar]
- Goryachev, M.P.; Yaroslavsky, D.A.; Sadykov, M.F.; Konov, A.B.; Ivanov, D.A. Methodology of ice coating monitoring on overhead transmission lines considering misalignment using wireless communication channel sensors. ARPN J. Eng. Appl. Sci. 2017, 12, 6479–6482. [Google Scholar]
- Yaroslavsky, D.; Sadykov, M.; Konov, A.; Ivanov, D.; Goryachev, M.; Yambaeva, T. Method for monitoring ice deposits on wires of overhead lines, taking into account the misalignment of linear fittings. News High. 2017, 19, 89–97. [Google Scholar]
- Sadykov, M.F.; Yaroslavsky, D.A.; Goryachev, M.P.; Nguyen, V.V.; Andreev, N.K.; Ivanov, D.A. Analysis of Current Ways of Determining the State of Overhead Power Lines According to the Mechanical Parameters of Conductors: A Review. Bull. Russ. Acad. Sci. Phys. 2021, 85, 1262–1268. [Google Scholar] [CrossRef]
- Sadykov, M.F.; Goryachev, M.P.; Yaroslavskij, D.A.; Ivanov, D.A.; Koryshkin, I.M. Ustrojstvo Operativnogo Monitoringa Tekhnicheskogo Sostoyaniya Vysokovol’tnyh Linij Elektroperedachi. Russia Patent RUS. NO 185311.30.05.2018, 29 November 2018. [Google Scholar]
- Yaroslavsky, D.A.; Nguyen, V.V.; Sadykov, M.F.; Goryachev, M.P.; Ivanov, D.A. Determination of the Conductor Sag According to the Period of Own Harmonic Oscillations, Taking into Account the Difference in Heights of the Suspension Points. In International Symposium on Sustainable Energy and Power Engineering; Springer: Singapore, 2022; pp. 73–81. [Google Scholar]
- Yaroslavsky, D.A.; Nguyen, V.; Sadykov, M.F.; Goryachev, M.P.; Ivanov, D.A.; Galieva, T.G.; Vassunova, Y.Y.; Tyurin, A.N. Studying the model of free harmonic oscillations of overhead power lines. Int. J. Emerg. Trends Eng. Res. 2020, 8, 2663–2667. [Google Scholar] [CrossRef]
- Yaroslavsky, D.; Sadykov, M.; Goryachev, M.; Ivanov, D.; Andreev, N. Determination the conductor sag according to the period of own harmonic oscillations. In Proceedings of the E3S Web of Conferences, Saint-Petersburg, Russia, 29–30 October 2020; p. 01036. [Google Scholar]
- Ishino, R.; Ishikawa, T. Measurement of frequency response of overhead power lines to wind. In Proceedings of the IEEE Power Engineering Society: 1999 Winter Meeting (Cat. No. 99CH36233), New York, NY, USA, 31 January–4 February 1999; pp. 1327–1332. [Google Scholar]
- Ivanova, O.A. Numerical simulation of wind induced conductor motion. In Proceedings of the Fifth International Conference on Vortex Flow and Vortex Methods, San Leucio, Italy, 8–10 November 2010. [Google Scholar]
- Tikhonov, A.N.; Samarskii, A.A. Uravneniya Matematicheskoy Fiziki; Nauka: Moscow, Ruassian, 1972; p. 735. [Google Scholar]
Publisher’s Note: MDPI stays neutral with regard to jurisdictional claims in published maps and institutional affiliations. |
© 2022 by the authors. Licensee MDPI, Basel, Switzerland. This article is an open access article distributed under the terms and conditions of the Creative Commons Attribution (CC BY) license (https://creativecommons.org/licenses/by/4.0/).