1. Introduction
Rail transport is key for our economy and society. Good transport development can effectively increase gross domestic product (GDP). However, train collisions usually cause huge casualties and economic losses [
1,
2]. Therefore, the passive safety of trains has received widespread attention. To reproduce the impact response of the train collision process and truly evaluate the safety performance of train collisions, the most intuitive method is to carry out a train-to-train collision test. However, there are many uncertain factors in the test process, which may lead to derailment and other phenomena, as shown in
Figure 1 [
3,
4]. The derailed train is uncontrollable, which will cause huge safety hazards and may cause damage to the test platform. Therefore, it is of great engineering significance to carry out research on derailment protection in the train-to-train collision test.
To reduce derailment behavior, researchers have studied the derailment resistance of the vehicle itself. For example, Jun et al. [
5] mentioned that lowering the transverse rigidity of the primary suspension can be an effective measure to prevent derailment. Ling et al. [
6] proposed that improving the design of train suspensions, including secondary and inter-vehicle lateral dampers, has a higher potential to mitigate the severity of collision-induced derailments. In addition, Brabie and Andersson [
7] reduced derailment by installing mechanical restrictions between the wheelsets and the bogie. Based on the dynamic behavior after derailment, Wu et al. [
8] designed a device installed under the axle box to limit the lateral displacement of the vehicle during derailment, and Guo et al. [
9] also proposed a similar device. Mikhailov et al. [
10] proposed a method of independently rotating wheels to improve running safety. However, for the train-to-train collision test, the purpose of the test is to evaluate the crash safety performance of the vehicle, so the type of vehicle in each test is different. Therefore, it is unrealistic to prevent derailment by changing the performance and structure of the vehicle itself.
Therefore, for the train-to-train collision test, a protective structure installed outside the vehicle is better. In South Korea, protective walls are generally installed to reduce train derailment [
11]. In contrast, more studies have proposed the use of guard rails. Nishimura [
12] proposed that the anti-derailment guard rail can prevent the lateral movement of the wheels, which is verified by simulation and tests. Lai et al. [
13] used guard rails to prevent secondary damage caused by derailed trains on high-risk lines. Ling et al. [
14] studied the efficacy of the guard rail system (GRS) to minimize the derailment potential of trains laterally collided with heavy road vehicles at level crossings. These studies show that the guard rail can effectively reduce the risk of train derailment and the impact conditions and the relevant parameters of the guard rail have an impact on the protection ability of the train. However, these rails are installed in places where earthquakes are common, high-risk lines, curves, and other special places. In contrast, the risk of derailment in train-to-train collision tests is greater. Although these have reference significance for the design of the guard rail in the train-to-train collision test, the guard rail cannot be exactly the same due to the particularity of the test. Additionally, these studies are on the impact of guard rail on train dynamics, which is undeniably the most important, but the damage risk of the guard rail is also worthy of attention.
The impact energy of train-to-train collision tests is large, and the risk of accidents during the test is higher than the general situation. The guard rail structure used in the test needs to have two characteristics. First, it is necessary to effectively prevent the lateral displacement of the wheels after the train derails within its protection range. Second, the structure is simple, easy to install and replace, and low cost. Guard walls are expensive and not conducive to replacement. Additionally, existing guard rails often use running rails, which is not conducive to installation and replacement. Therefore, this paper proposes a method of using a U-steel as a guard rail. The U-steel is often used in building structures, mechanical equipment, and automobile manufacturing. It is easy to obtain, has a certain strength, is low in cost, and is easy to install and replace.
In order to study whether U-steel can be used as a guard rail in the test, in this study, the protection range of the guard rail in the train-to-train collision test is firstly studied. Then, based on the finite element model of the train colliding with the guard rail, the influence of the rotation conditions, the impact velocity and the installation position on the protection ability, and the damage risk of the guard rail are studied. Finally, in view of the damage risk of the guard rail itself, the section shape of the guard rail is optimized.
2. Protection Range of Guard Rail
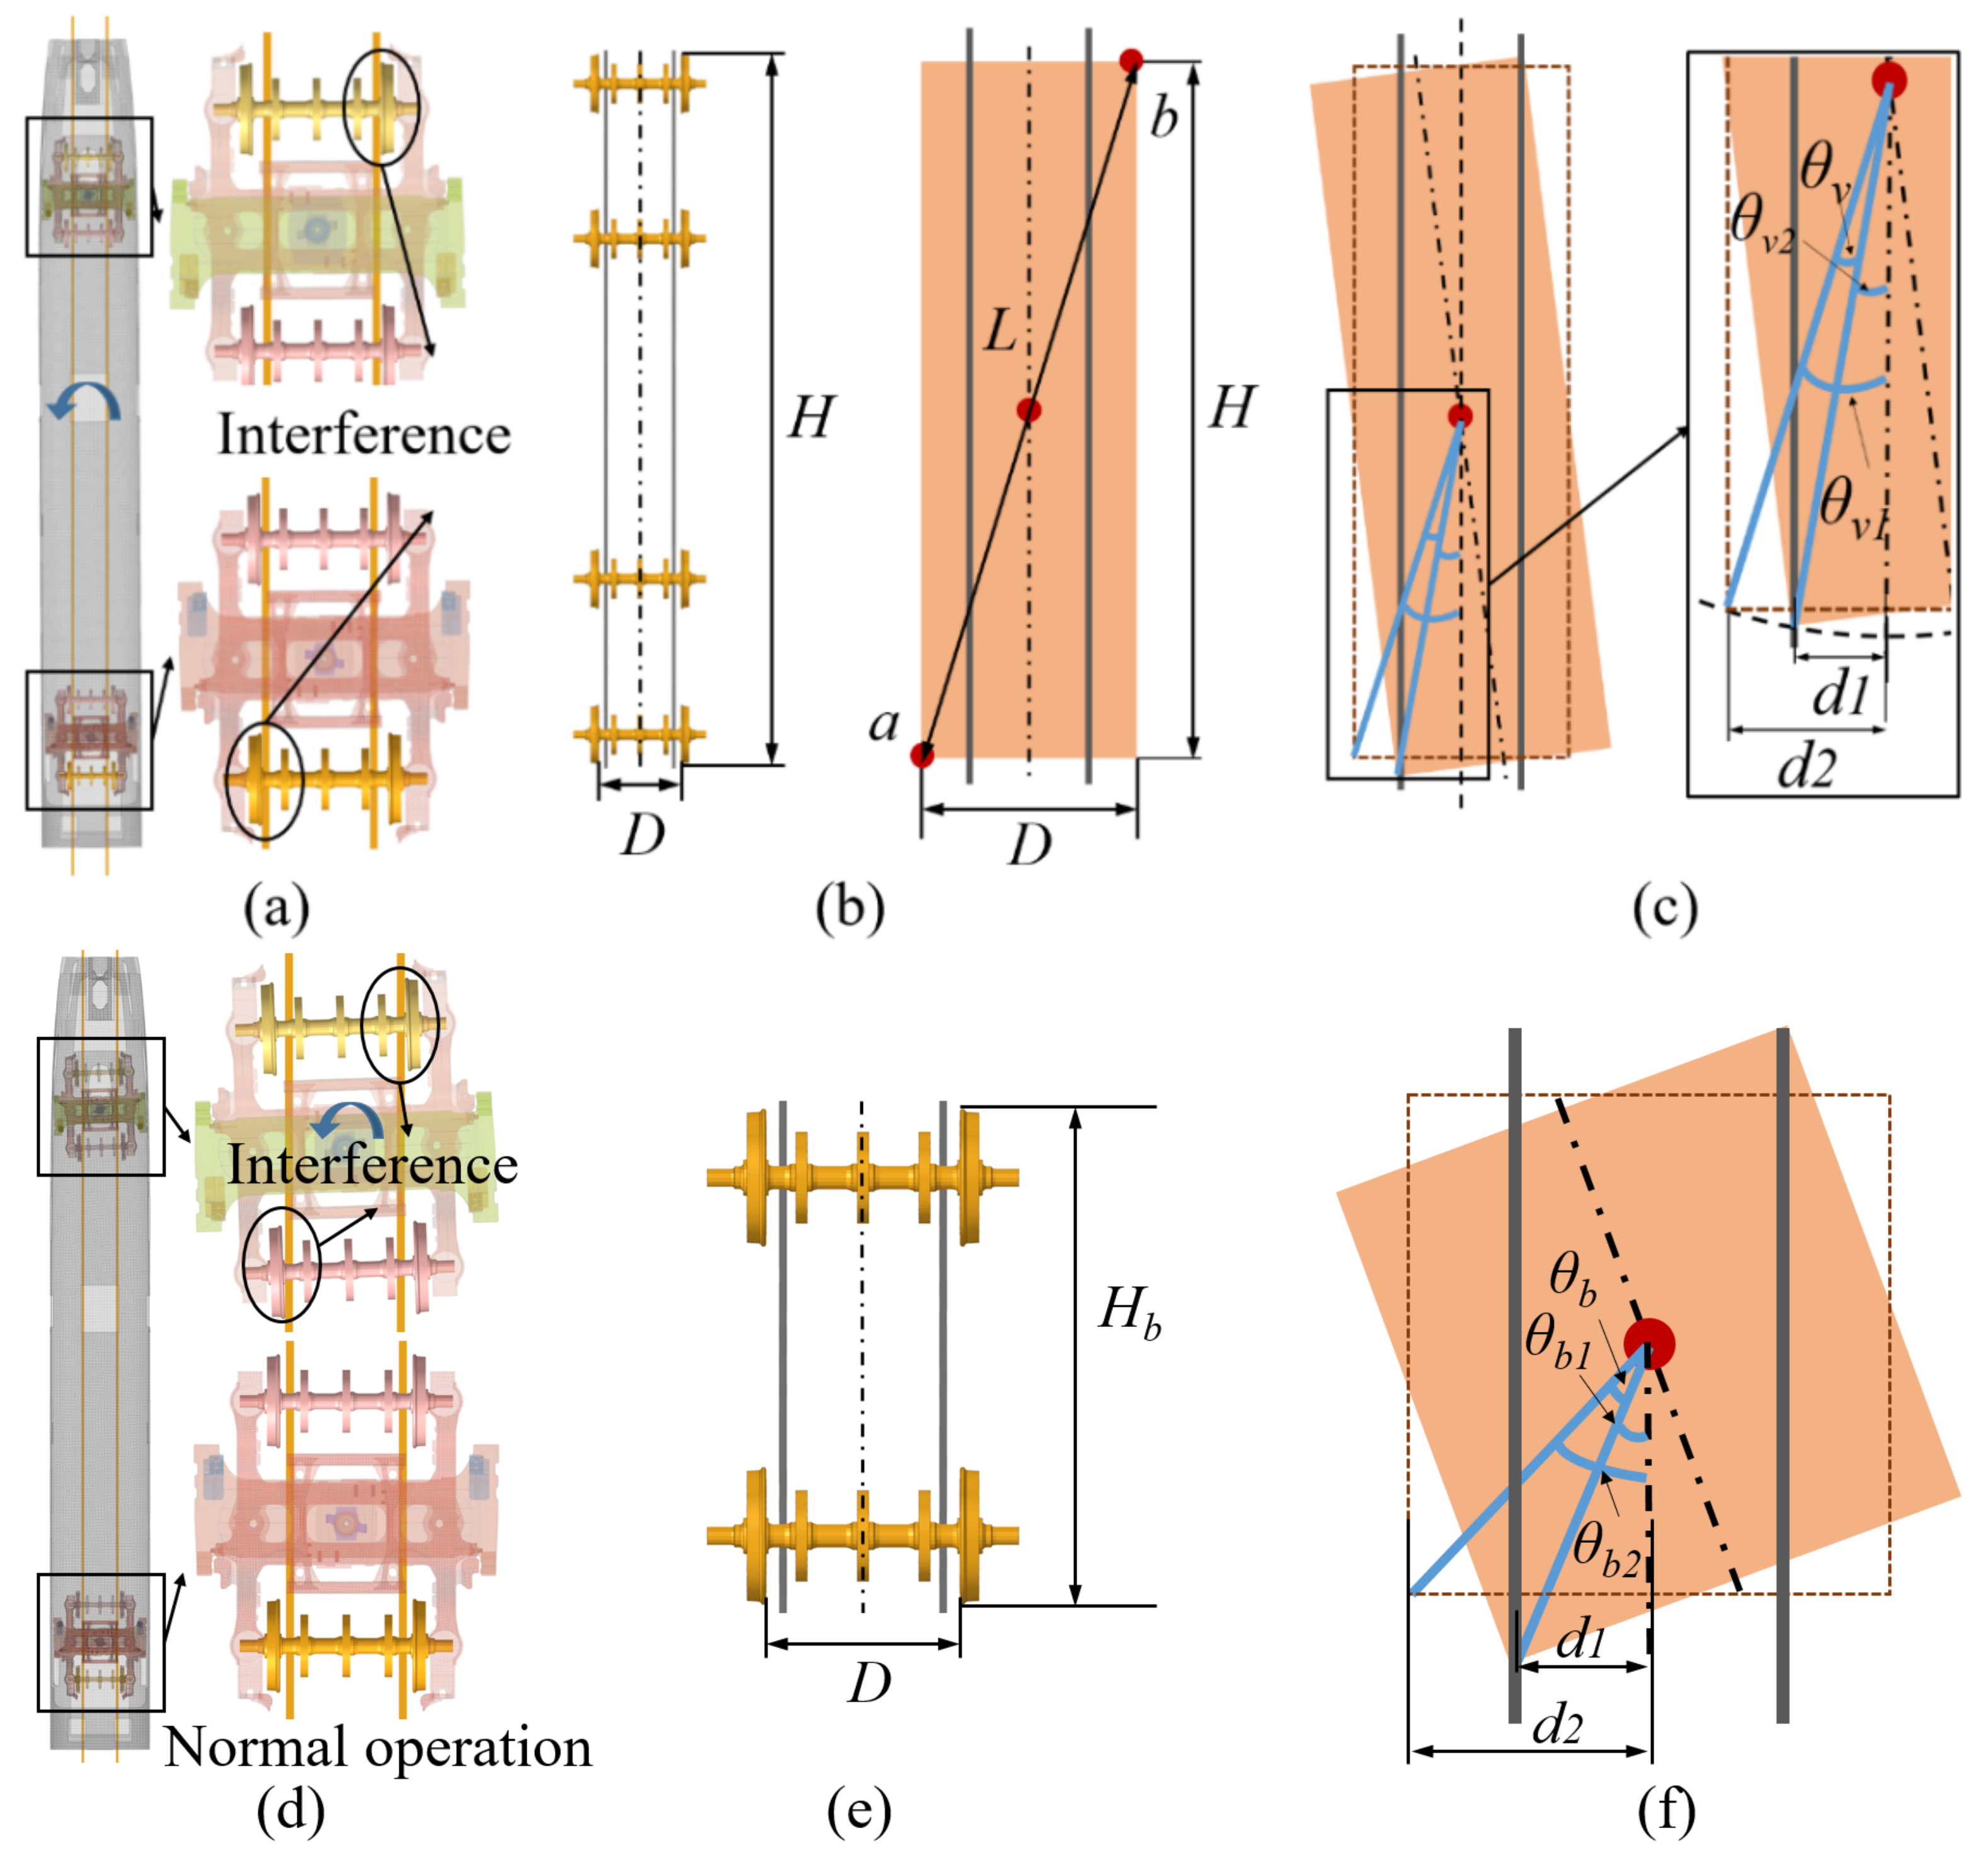
The guard rail is installed on the inner side of the operating track and has a certain distance from the operating track. Assuming that the vehicle has been derailed, the influence of the operating track on the wheelset is not considered. After derailment, the wheel impacts the guard rail at a certain angle, and the maximum value of this angle is affected by the guard rail, as shown in
Figure 2. Therefore, the protection range of the guard rail is the range within the maximum angle that the wheelset can rotate. The rotation of the wheelset is divided into two conditions, one is the rotation of the vehicle as a whole (Condition 1), and the other is the rotation of one bogie (Condition 2), as shown in
Figure 2a,d, respectively.
In Condition 1, the relative position of the wheelset and the guard rail before rotation is shown in
Figure 2b, where
H is the maximum distance between the front wheelset and last wheelset,
D is the distance between the innermost wheels of the same wheelset,
D = 1353 mm,
H = 21,226.924 mm, and the diagonal distance of the rectangle
L = 21,270 mm. When the vehicle rotates around the center point, the distance between point a/b and the guard rail is gradually reduced. When point a/b is in contact with the guard rail, the rotation angle of the vehicle reaches the maximum, as shown in
Figure 2c. The maximum rotation angle of the vehicle is
θv =
θv1 −
θv2, where:
Additionally,
d1 is the distance between the guardrail and the central axis and
d2 is half of
D. Because
d1 can be changed,
d2 =
D/2 = 676.5 mm, the relation between the maximum rotation angle of vehicle
θv and
d1 is:
In Condition 2, the relative position of the bogie and the guard rail before rotation is shown in
Figure 2e, where
Hb is the maximum distance between the front and rear wheelset of a bogie,
Hb = 3409.766 mm, and the diagonal distance of the rectangle
Lb = 3684.347 mm. Through a calculation process similar to Condition 1, the relationship between the maximum rotation angle and
d1 can be obtained as shown in
Figure 2f:
3. Finite Element Model
At present, many derailment studies use the multi-rigid body simulation method, but the rigid body cannot reflect the flexible deformation of the guard rail [
15,
16,
17]. In order to study the protective ability of the guard rail, a finite element model of train impact guard rail is established. A 25c U-steel is selected, and its section size is shown the
Figure 3, where
h = 250 mm,
b = 82 mm,
d = 11 mm,
t = 12 mm, and rounded corners
r and
r1 are 12 mm and 6 mm, respectively. To study the contact force between the wheel and the guard rail and the stress of the guard rail, the material model *MAT_3 is selected for simulation. The used 25 c U-steel is made of 45# steel; its density is 7850 kg/m
3, the elastic modulus is 210 GPa, and yield stress is 355 MPa. Considering the calculation time and accuracy, a size of 8 mm was selected for the elements [
18].
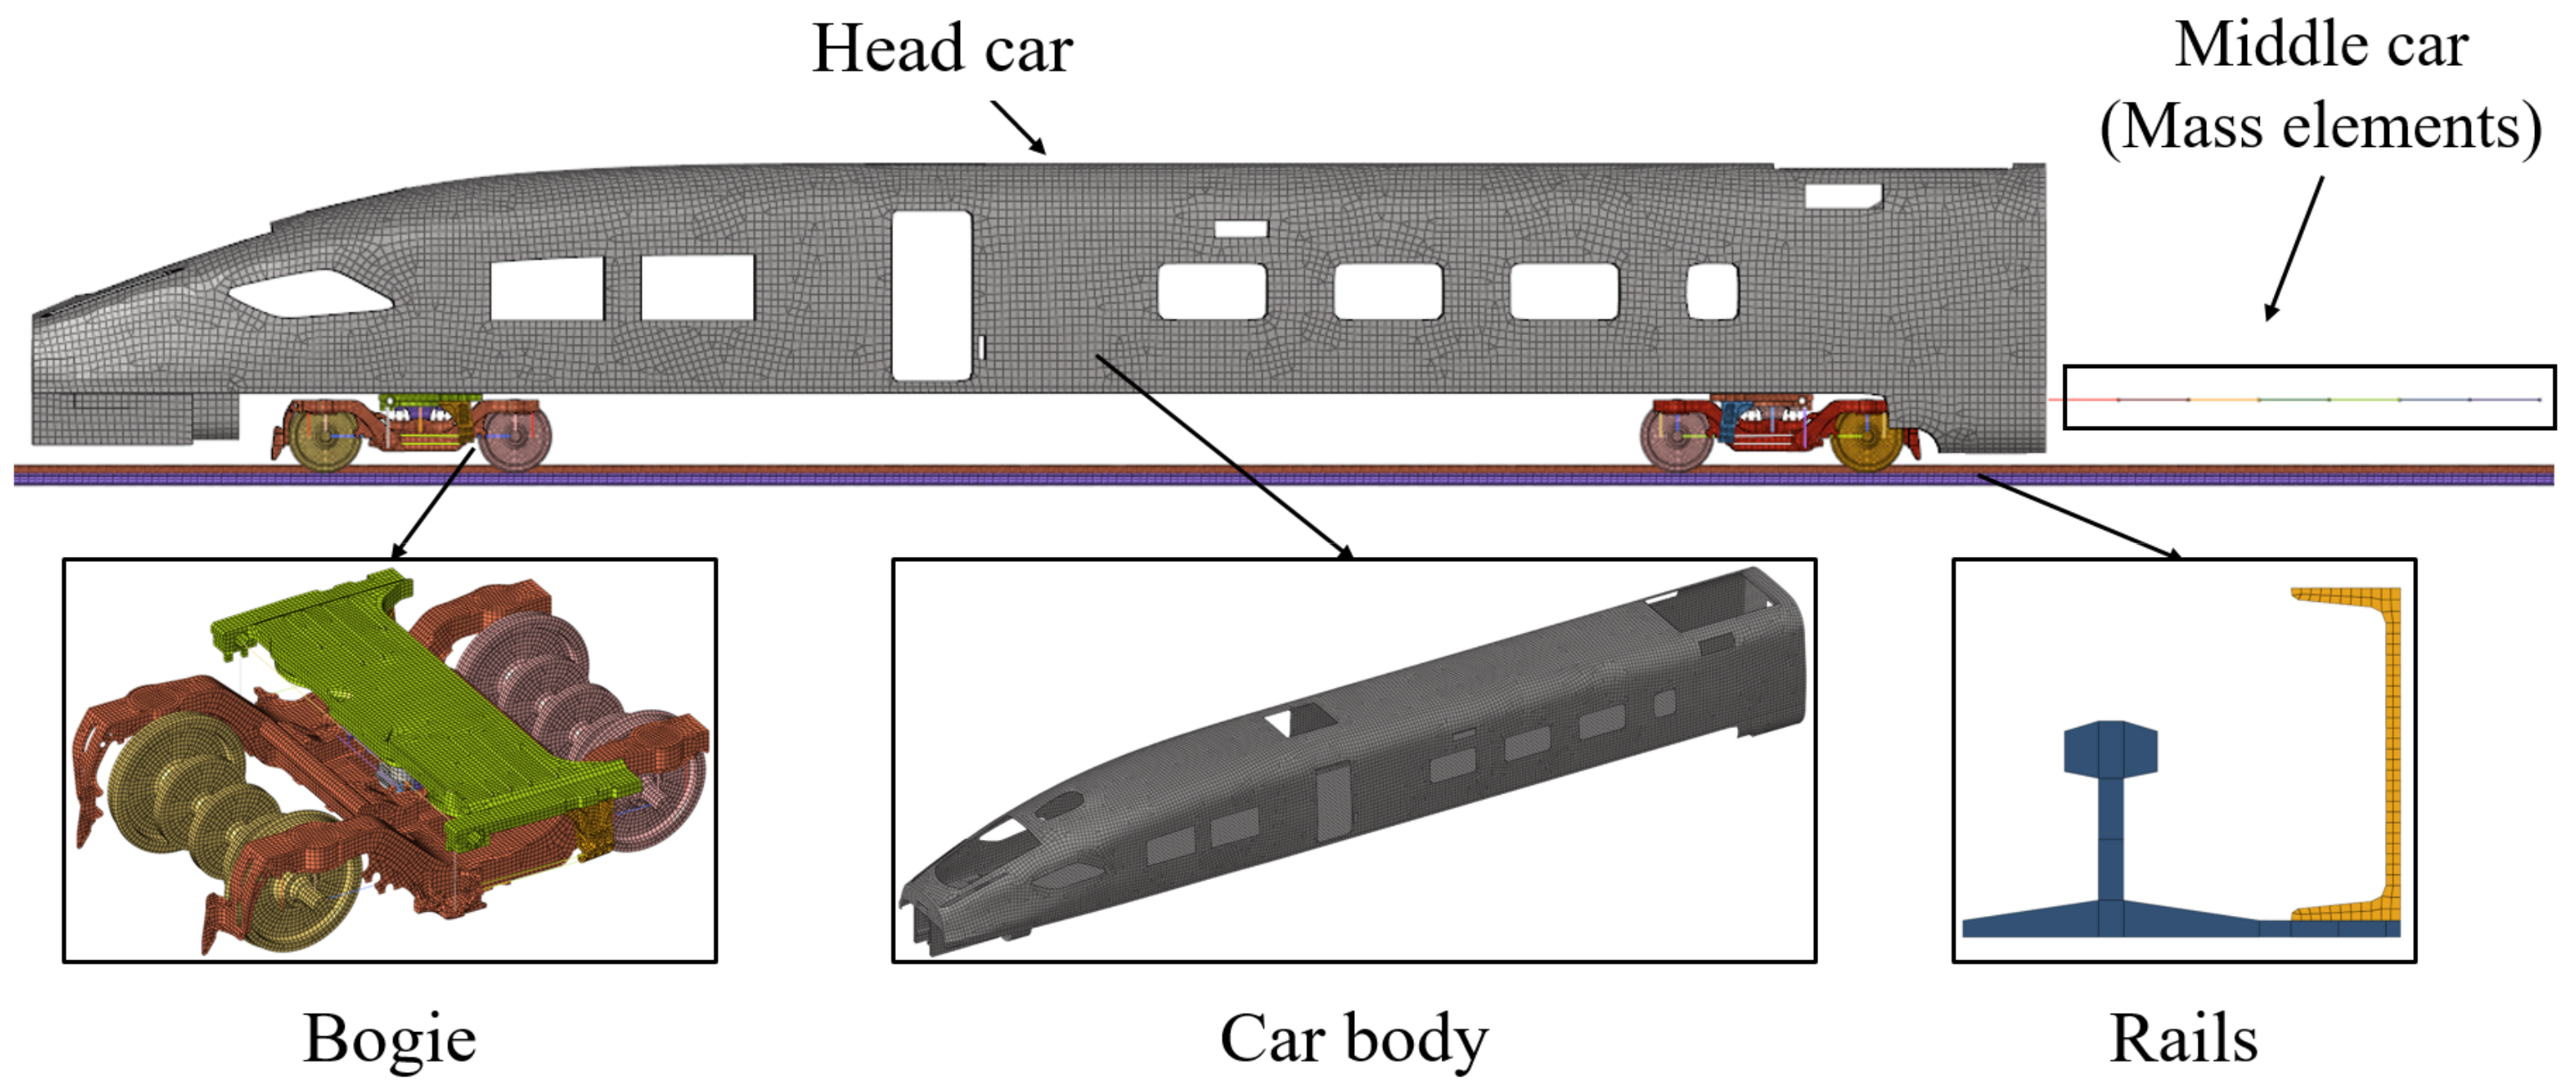
The finite element model of the train is shown in
Figure 4. The train is a formation with eight vehicles. As mentioned in standard EN15227, normally, only the first or the first two vehicle models shall incorporate energy absorbing elements and deforming structure in detail. The remaining vehicles of the train unit can be represented as lumped mass/spring systems, etc., representing their overall behavior [
19]. Therefore, considering the calculation cost and standards, all vehicles except the first vehicle are simulated by mass elements.
The length of the first vehicle is 26.52 m, and its structure is mainly composed of the underframe, side wall, end wall, roof and driver’s cab. These structures are mainly made of profiles and plates, and their dimensions in the thickness direction are much smaller than those in the length and width direction, so the model is simulated by shell elements. The material of the car body is aluminum alloy. The density is 2.7 × 10⁻⁹ t/mm3, the elastic model is 71 GPa, the Poisson ratio is 0.3, and the yield strength is 215 MPa. Assuming that the car body is not deformed, the rigid body material *MAT_RIGID is selected for simulation. The element size of the car body remains at 100 mm × 100 mm. The number of nodes and elements of the car body are 30,766 and 30,496, respectively.
The bogie is mainly composed of wheelsets, a frame, a center pin, and suspension components. Among them, the parts that do not have large deformation, such as the frame and center pin, are simplified by rigid materials, and the mesh size is maintained at 40 mm × 40 mm. Generally, the yield strength of the train wheel is above 800 MPa, which is much greater than that of the guard rail, so the wheelsets are also simplified as a rigid body [
20,
21,
22]. The density of the bogie and wheelsets is 7.85 × 10
9 t/mm
3, the elastic model is 210 GPa, and the Poisson ratio is 0.3. *MAT_GENERAL_NONLINEAR_6DOF_DISCRETE_BEAM is used to simulate the primary suspension and the secondary suspension, and *MAT_DAMPER_NONLINEAR_VISCOUS is used to simulate the shock absorbers. The vertical stiffness of the primary suspension is 886.5 N/mm, and the transverse and longitudinal stiffness is 919.8 N/mm. The vertical stiffness of the secondary suspension is 185 N/mm, and the lateral and longitudinal stiffness is 113 N/mm. The number of nodes and elements of the bogie are 50,867 and 52,557, respectively. In the train-to-train collision test, the mass of the first vehicle is 54.36 t, and the mass of the other vehicles is 60 t. In order to reflect the attitude response of the vehicle in the collision process, the center of gravity of the finite element model is consistent with the actual situation.
*CONSTRAINED_RIGID_BODIES is used to simulate the connection between the car body and the bogie. The coupler connection between the mass elements is simulated using spring elements, and *MAT_SPRING_INELASTIC is used to simulate. The maximum compression load of the coupler is 1500 kN.
ANSYS/LS-DYNA software provides a variety of contact types. In this paper, the “contact automatic single surface” is used to define the internal contact of the car body during the collision process; the „contact automatic surface to surface” is used to define the contact between the wheel and rail. The contact friction coefficients between vehicle body structures and bogies are set as 0.2 [
23]. The static and dynamic wheel-rail contact friction is set as 0.35 [
24,
25].
The running track is fixed relative to the ground, and the lower end of the guard rail is fixed with the running track. The initial velocity of the train is 48 km/h, which is the standard velocity for a moving train that collides with an identical stationary train. Because the train rotates an angle after derailment, the initial longitudinal and lateral velocities of the train are related to the rotation angle.
4. Protective Ability of Guard Rail
In order to evaluate the protective ability of the guard rail, the lateral displacement of the wheel and contact forces are selected as the evaluation indicators. At the same time, the damage risk of the guard rail itself is evaluated through the deformation and stress.
4.1. Effect of the Rotation Conditions
When the rotation conditions are different, the protection range of the guard rail will also be different, and the protection ability of the guard rail will change. Therefore, the protection capability under Condition 1 and Condition 2 is evaluated. At this point, the impact velocity is set to 48 km/h, the height h of the guard rail from the operating track surface is 100 mm, and the distance d from the operating track is 100 mm. According to Equations (2) and (3), the maximum rotation angle of the vehicle and the bogie are 0.32° and 1.96°, respectively.
When the vehicle rotates as a whole (Condition 1), the lateral displacement of the wheelsets in the front bogie is shown in
Figure 5a. Compared with the lateral displacement of the wheelset without the guard rail, the front wheelset in contact with the guard rail produces a reverse lateral displacement under the action of the guard rail. Because the bogie is considered a rigid body, the lateral displacement of the rear wheelset is slightly larger than that without a guard rail. The lateral displacement of the wheelset without the guard rail is 4.33 mm, and the lateral displacement of the front wheelset with the guard rail is 0.75 mm, which is reduced by 82.68%. The lateral displacement of the rear wheelset is 4.58 mm, an increase of 5.77%. The results show that the guard rail can effectively prevent the lateral movement of the wheelset. The lateral displacement of the two bogies is shown in
Figure 5b. Under the action of the guard rail, the lateral displacement of the front bogie is limited, and the displacement at this time is 3.10 mm, which is 28.41% less than the displacement without a guard rail. Because the vehicle is considered a rigid body, the lateral displacement of the rear bogie is slightly larger, reaching 4.68 mm, which is an increase of 8.08% compared with the displacement without the guide rail. According to Equation (2), the maximum rotation angle of the vehicle is 0.319°. Under the action of the guard rail, the rotation angle of the vehicle becomes 0.302°, which is reduced by 5.33%. It can be seen from the lateral displacement and angle change that the U-steel guard rail has a protective effect.
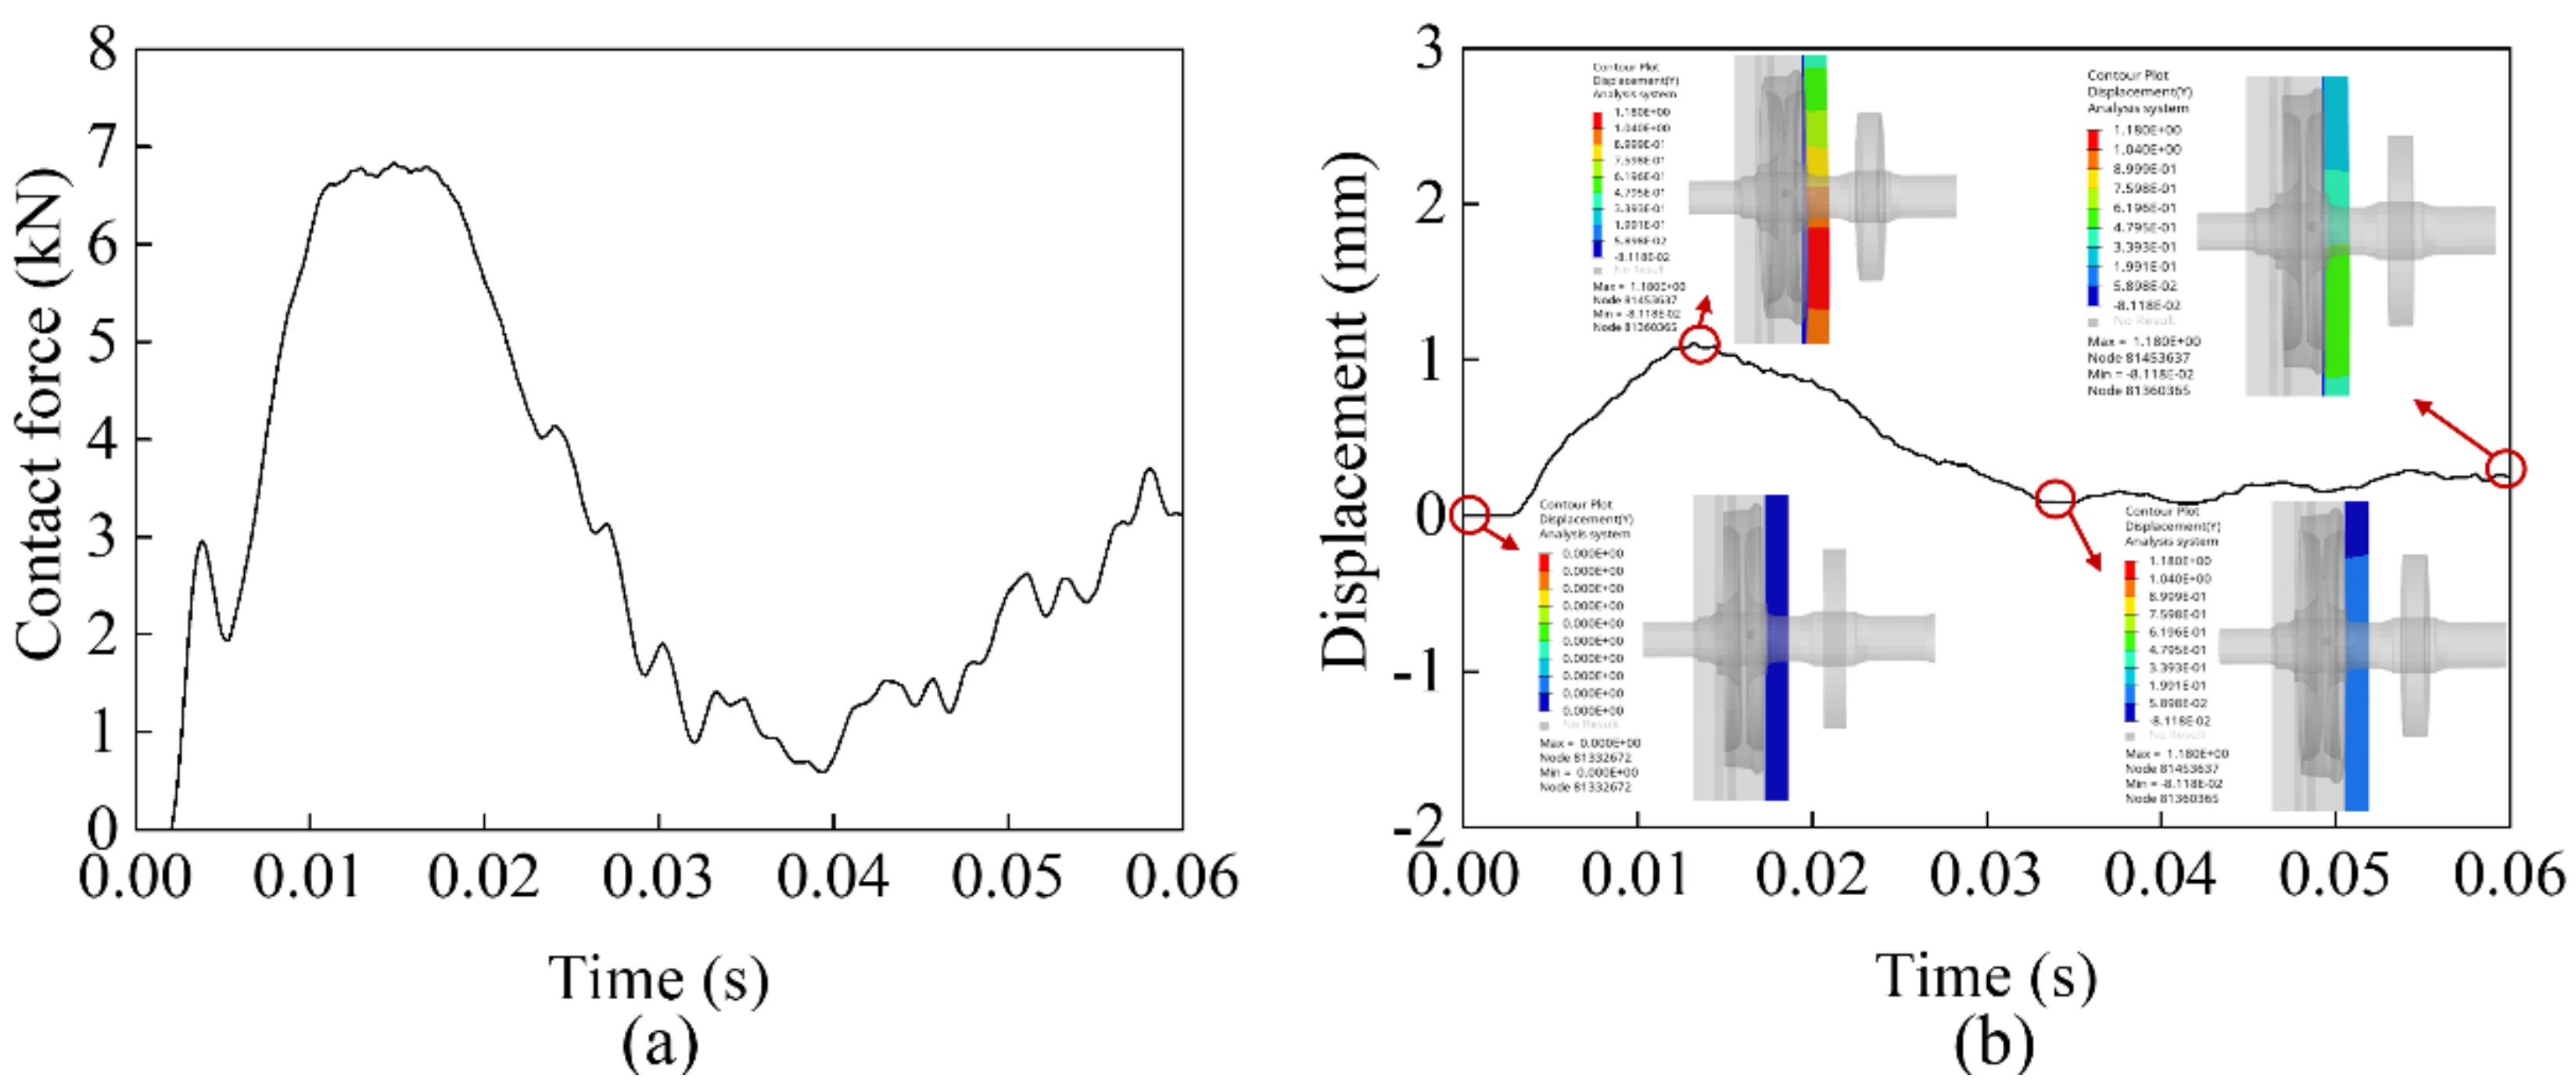
The contact force between the guard rail and the wheel is shown in
Figure 6a. The first peak in contact force occurs when the wheel impacts the guardrail, which is 6.83 kN. Then, the reverse movement of the wheel and the deformation of the guard rail reduce the contact force between the two. In the process, the deformation of the guard rail at a magnification of 20 times and the curve of its lateral displacement are shown in
Figure 6b. The maximum lateral displacement occurs at the position where the wheel contacts the guard rail and then reduces to near zero. It shows that the deformation of the guard rail is mainly elastic.
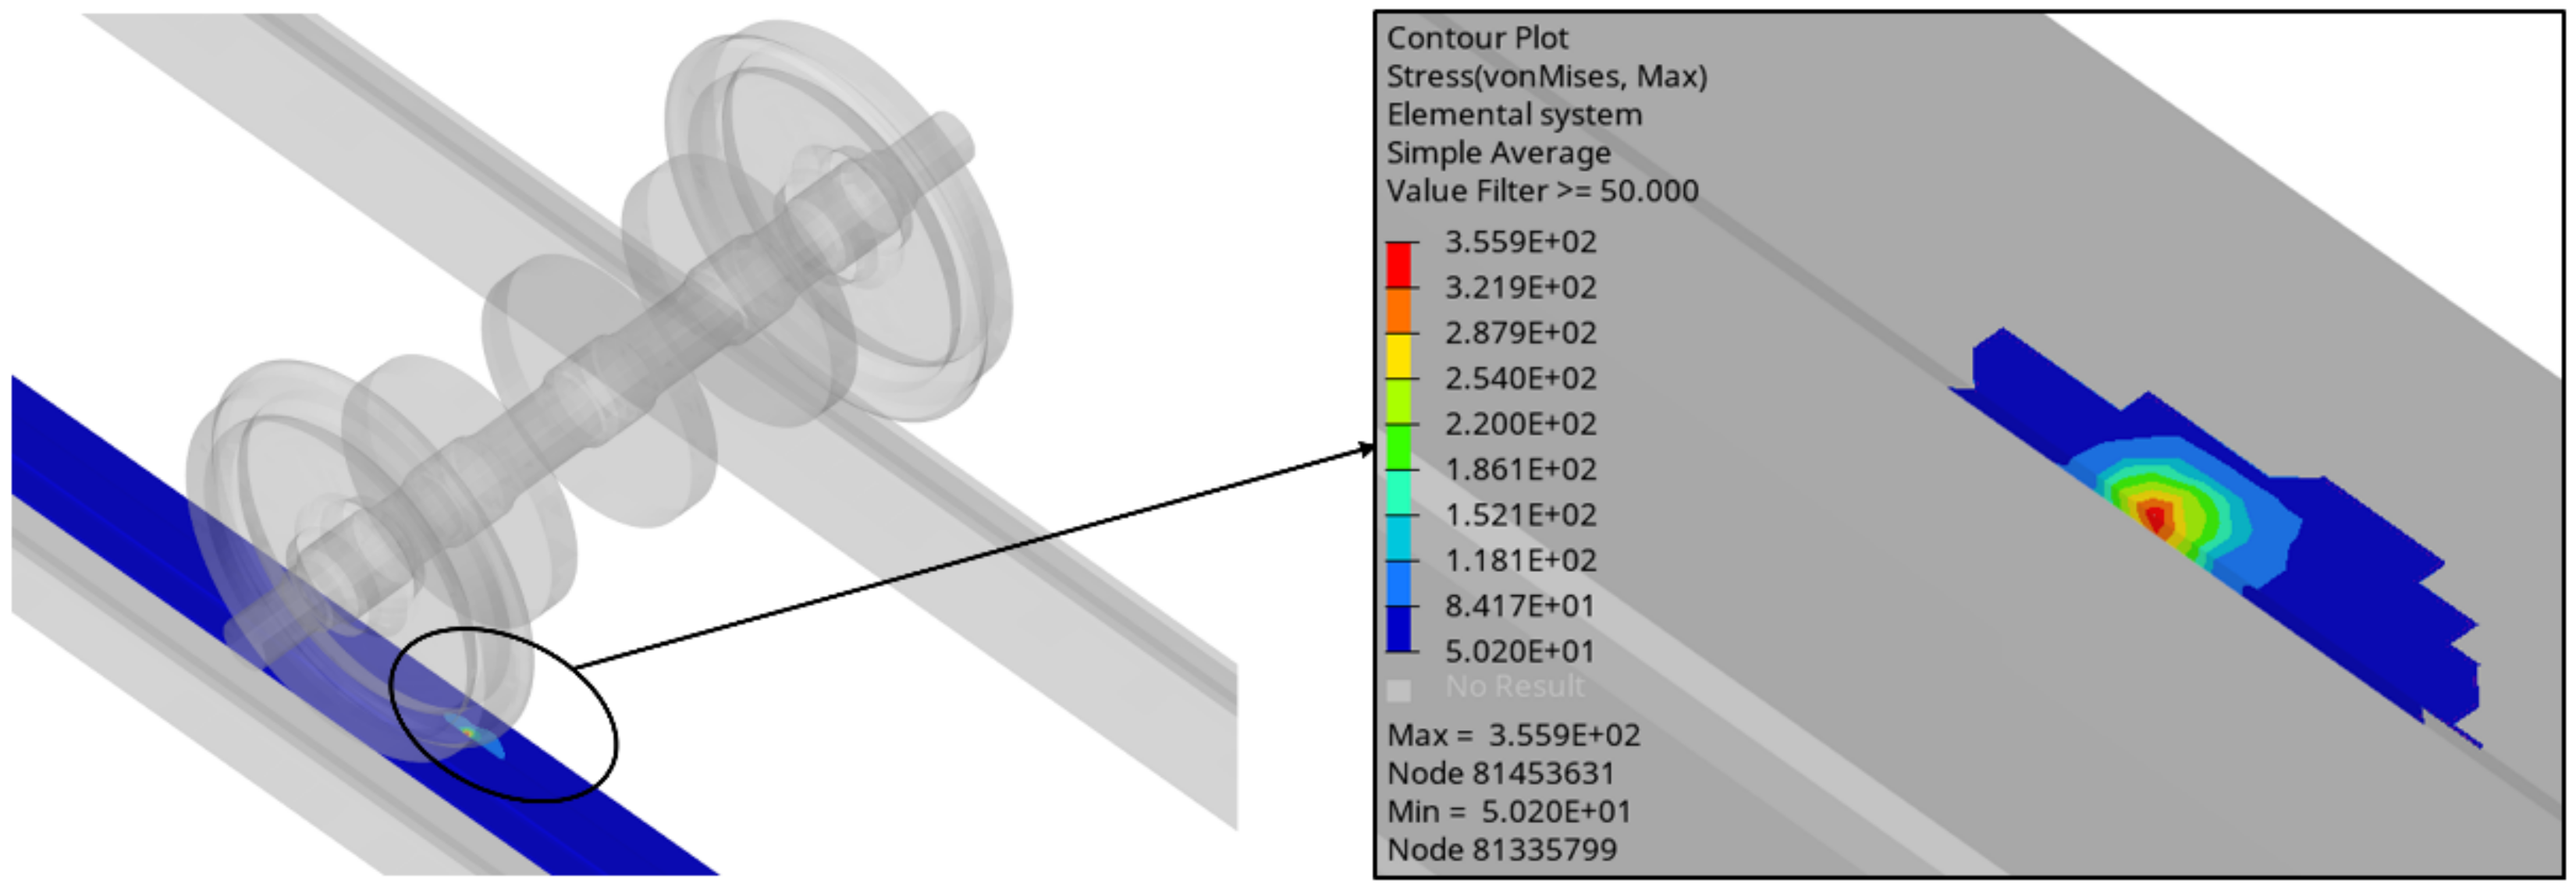
Figure 7 show the stress cloud when the stress of the guard rail is the largest during the deformation process. The maximum stress occurs at the contact part of the wheel and the guard rail, and then the stress is transferred from the contact part to both ends and gradually decreases. The maximum stress is 355.9 MPa, which exceeds the yield strength of the material, but does not exceed its ultimate strength.
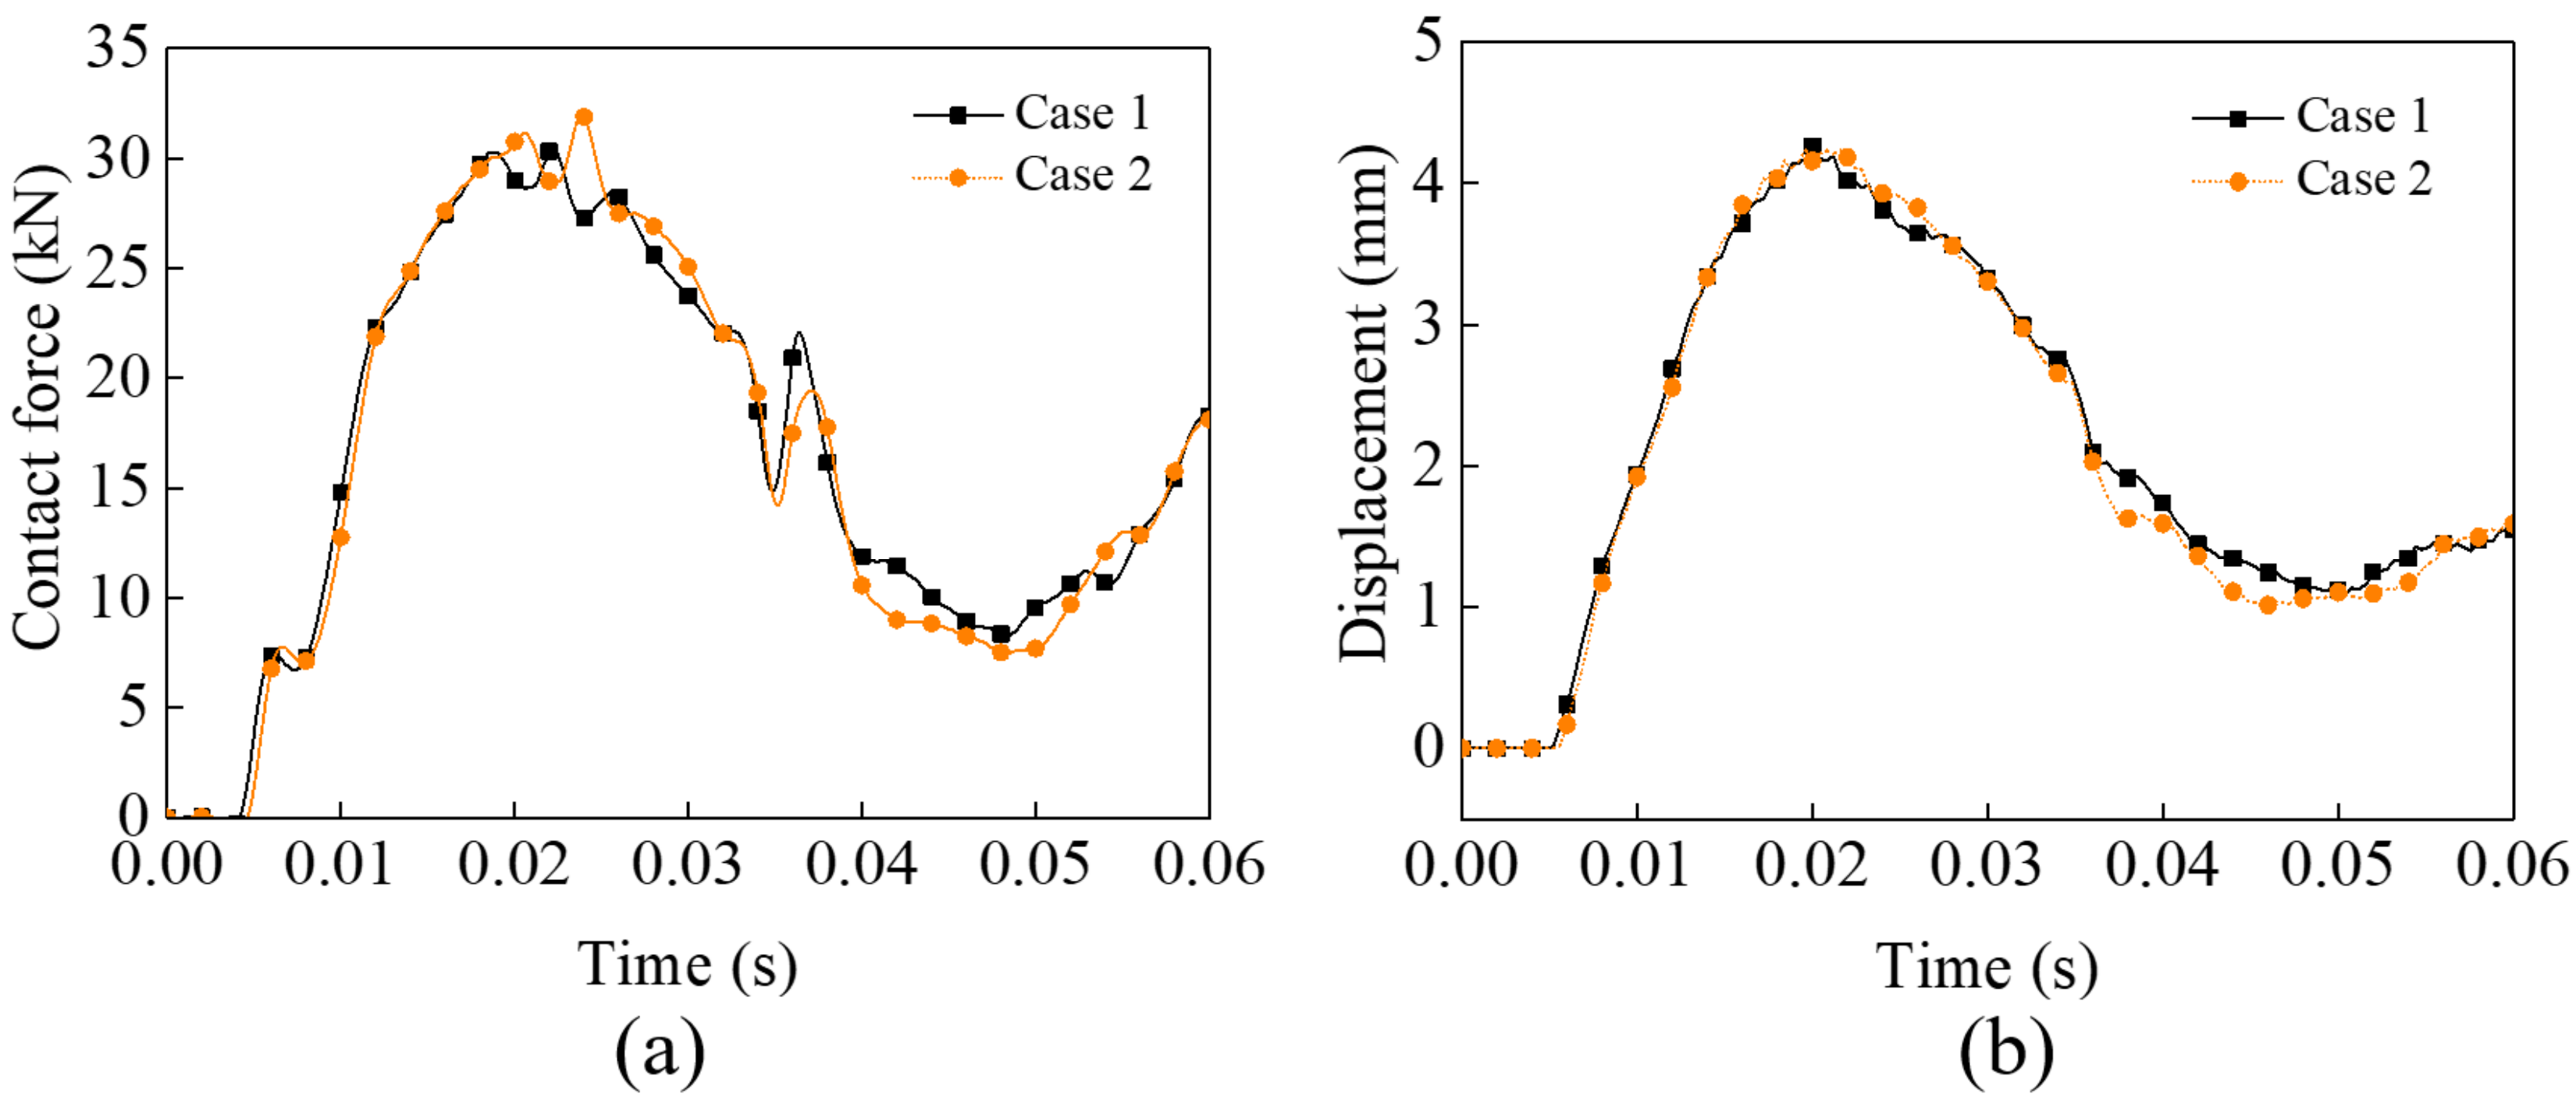
For rotation of the bogie, the front bogie rotation (Case 1) and the rear bogie rotation (Case 2) are analyzed. The lateral displacement of the wheelsets and the bogie in contact with the guard rail are shown in
Figure 8a. Compared with Condition 1, the lateral displacement of the wheelset has a similar trend. The guard rail prevents the lateral movement of the wheelset in contact with the guard rail, but there is no reverse movement of the wheelsets. At the end of the calculation, the lateral displacements of the wheelset in Case 1 and Case 2 are 7.86 mm and 8.03 mm, respectively, which are reduced by 71.31% and 70.69% compared with the lateral displacement without the guard rail. The guard rail also reduces the lateral displacement of the impacted bogie. As shown in
Figure 8b, the displacements in Case 1 and Case 2 are 23.18 mm and 23.44 mm, respectively, which are reduced by 15.40% and 14.45% compared with the displacement without the guard rail. The rotation angle of the bogies becomes 1.93° and 1.94°, which are reduced by 1.44% and 1.02%, respectively. Although the reduction of the rotation angle is small, it can still show that the guard rail can protect the vehicle.
The maximum peak forces of Case 1 and Case 2 are 32.04 kN and 30.53 kN, respectively. Due to the larger impact angle of the wheelset, the contact force is much greater than Condition 1. The maximum lateral displacements of Case 1 and Case 2 are 4.27 mm and 4.24 mm, respectively, which are much larger than those of Condition 1. The maximum stresses of Case 1 and Case 2 are 388.9 MPa and 389.1 MPa, respectively, which far exceed their yield strength, but have not reached the ultimate strength. This shows that the guard rail has plastic deformation at this time, but no damage has occurred.
When the bogie rotates, the contact force between the guard rail and the wheels in two cases is shown in
Figure 9a. The maximum peak forces of Case 1 and Case 2 are 32.04 kN and 30.53 kN, respectively. Due to the larger impact angle of the wheelset, the contact force is much greater than Condition 1. The lateral displacement of the guard rail in the two cases is shown in
Figure 9b. The maximum lateral displacements of Case 1 and Case 2 are 4.27 mm and 4.24 mm, respectively, which are much larger than those of Condition 1. The stress cloud of the guard rail in two cases is shown in
Figure 10. The maximum stresses of Case 1 and Case 2 are 388.9 MPa and 389.1 MPa, respectively, which far exceed their yield strength, but have not reached the ultimate strength. This shows that the guard rail has plastic deformation at this time, but no damage has occurred.
For the protection ability, the ability of the guard rail in Condition 1 is better than that of Condition 2. Additionally, for the guard rail itself, the larger impact angle results in a greater contact force, and the maximum deformation and maximum stress of the guard rail are also greater. At the same time, the results of Case 1 and Case 2 are similar. Therefore, Case 1 in Condition 2 is selected for subsequent analysis.
4.2. Effect of the Impact Velocity
The collision standard EN15227 [
19] specifies that the impact velocities of C-I (example, locomotives, coaches, and trains) and C-II (example, metro vehicles) in collision scenario 1 (a leading end impact between two identical trains) are 25 km/h and 36 km/h, respectively. The velocity of the C-I collision with a 15 t deformable obstacle reached 110 km/h. Therefore, the protection capability and the risk of damage to the guard rail at velocities of 25 km/h, 36 km/h, 48 km/h, 60 km/h, 72 km/h, and 110 km/h are studied.
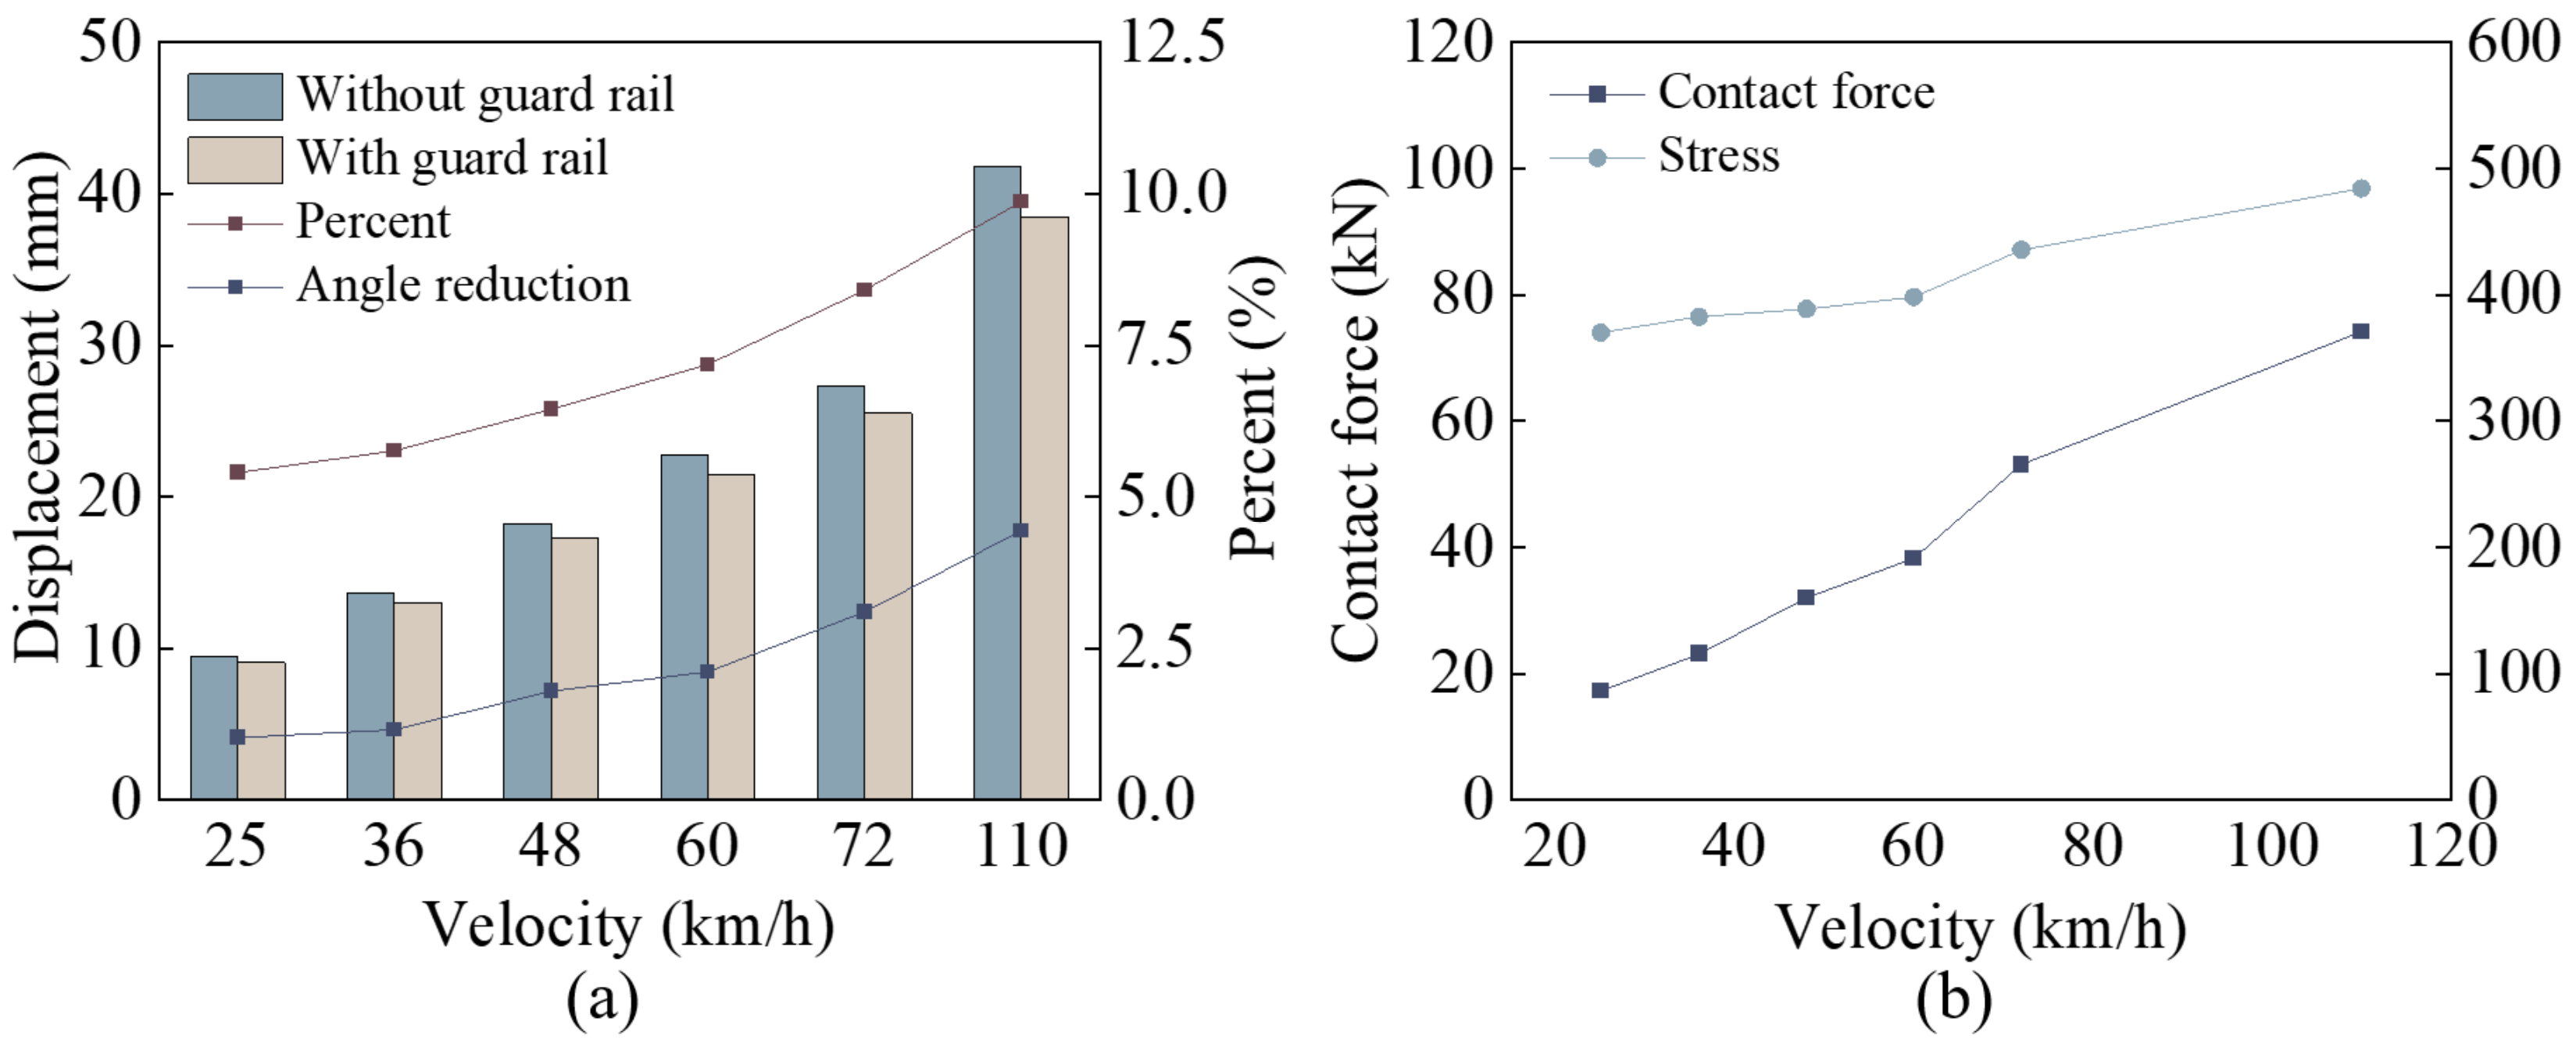
The lateral displacement of the bogie that impacted the guard rail in Case 1 at different velocities is shown in
Figure 11a. Compared with the lateral displacement without the guard rail, the lateral displacement with the guard rail decreases. The percentage reduction in lateral displacement and rotation angle at different velocities are shown in
Figure 11a. It can be seen that with the increase in velocity, the protective ability of the guard rail is more obvious. The maximum contact force and maximum stress of the guard rail with velocity are shown in
Figure 11b. With the increase of velocity, the maximum contact force and the maximum stress increase, and both show a linear trend. Therefore, the higher the velocity, the better the protection ability of the guard rail, but the risk of its own damage is also greater. In order to obtain the most severe boundary conditions, a velocity of 110 km/h is selected as the boundary condition for the subsequent analysis.
4.3. Effect of the Installation Position
In order to obtain the influence of the installation position of the guard rail on the protective ability, the factors h and d are analyzed. The width of the guard rail from the operating track is mainly determined by the geometry of the wheel. The flange width of the wheel model used in this paper is 85 mm, and the thickness of the wheel is 135 mm; an installation width of 80–140 mm is analyzed.
As the installation width increases, the maximum rotation angle of the bogie increases, the lateral velocity of the bogie increases, and the lateral displacement of the bogie increase accordingly. As shown in
Figure 12a, with the increase of installation width
d, the lateral displacement reduction of the bogie does not change significantly, and the rotation angle reduction of the bogie increases slightly, indicating that the protective ability of the guard rail increases slightly with the increase of
d.
The maximum contact force between the wheel and the guard rail and the maximum stress of the guard rail with
d are shown in
Figure 12b. With the increase of
d, the maximum contact force increases with a linear trend. Similarly, the maximum stress of the guard rail also increases, but the growth rate decreases with the increase of
d. Compared with
d = 80 mm, the maximum contact force and maximum stress of
d = 140 mm increased by 105.06% and 20.18%, respectively. With the increase of
d, the damage risk of guard rail increases.
According to the standard EN15227, when the vehicle is equipped with an anti-climbing device, the maximum distance between the wheels and the ground is 100 mm. Therefore, the protective ability of the guard rail when the installation height h is 80–120 mm is analyzed.
With the increase of
h, the lateral displacement reduction and the rotation angle reduction do not change much, as shown in
Figure 12c, indicating that the installation height
h has no significant effect on the protection ability of the guard rail. The maximum contact force between the wheel and the guard rail and the maximum stress of the guard rail with
h is shown in
Figure 12d. With the increase of
h, both the maximum contact force and the maximum stress increase. Compared with
h = 80 mm, the maximum contact force and maximum stress of
h = 120 mm increased by 4.36% and 9.00%, respectively. With the increase of
h, the protective ability of the guard rail does not change significantly, but the damage risk of the guard rail increases. In addition, compared with the installation height
h, the installation width
d has a greater impact on the protective ability and damage risk of the guard rail.
5. Optimization of Section for Guard Rail
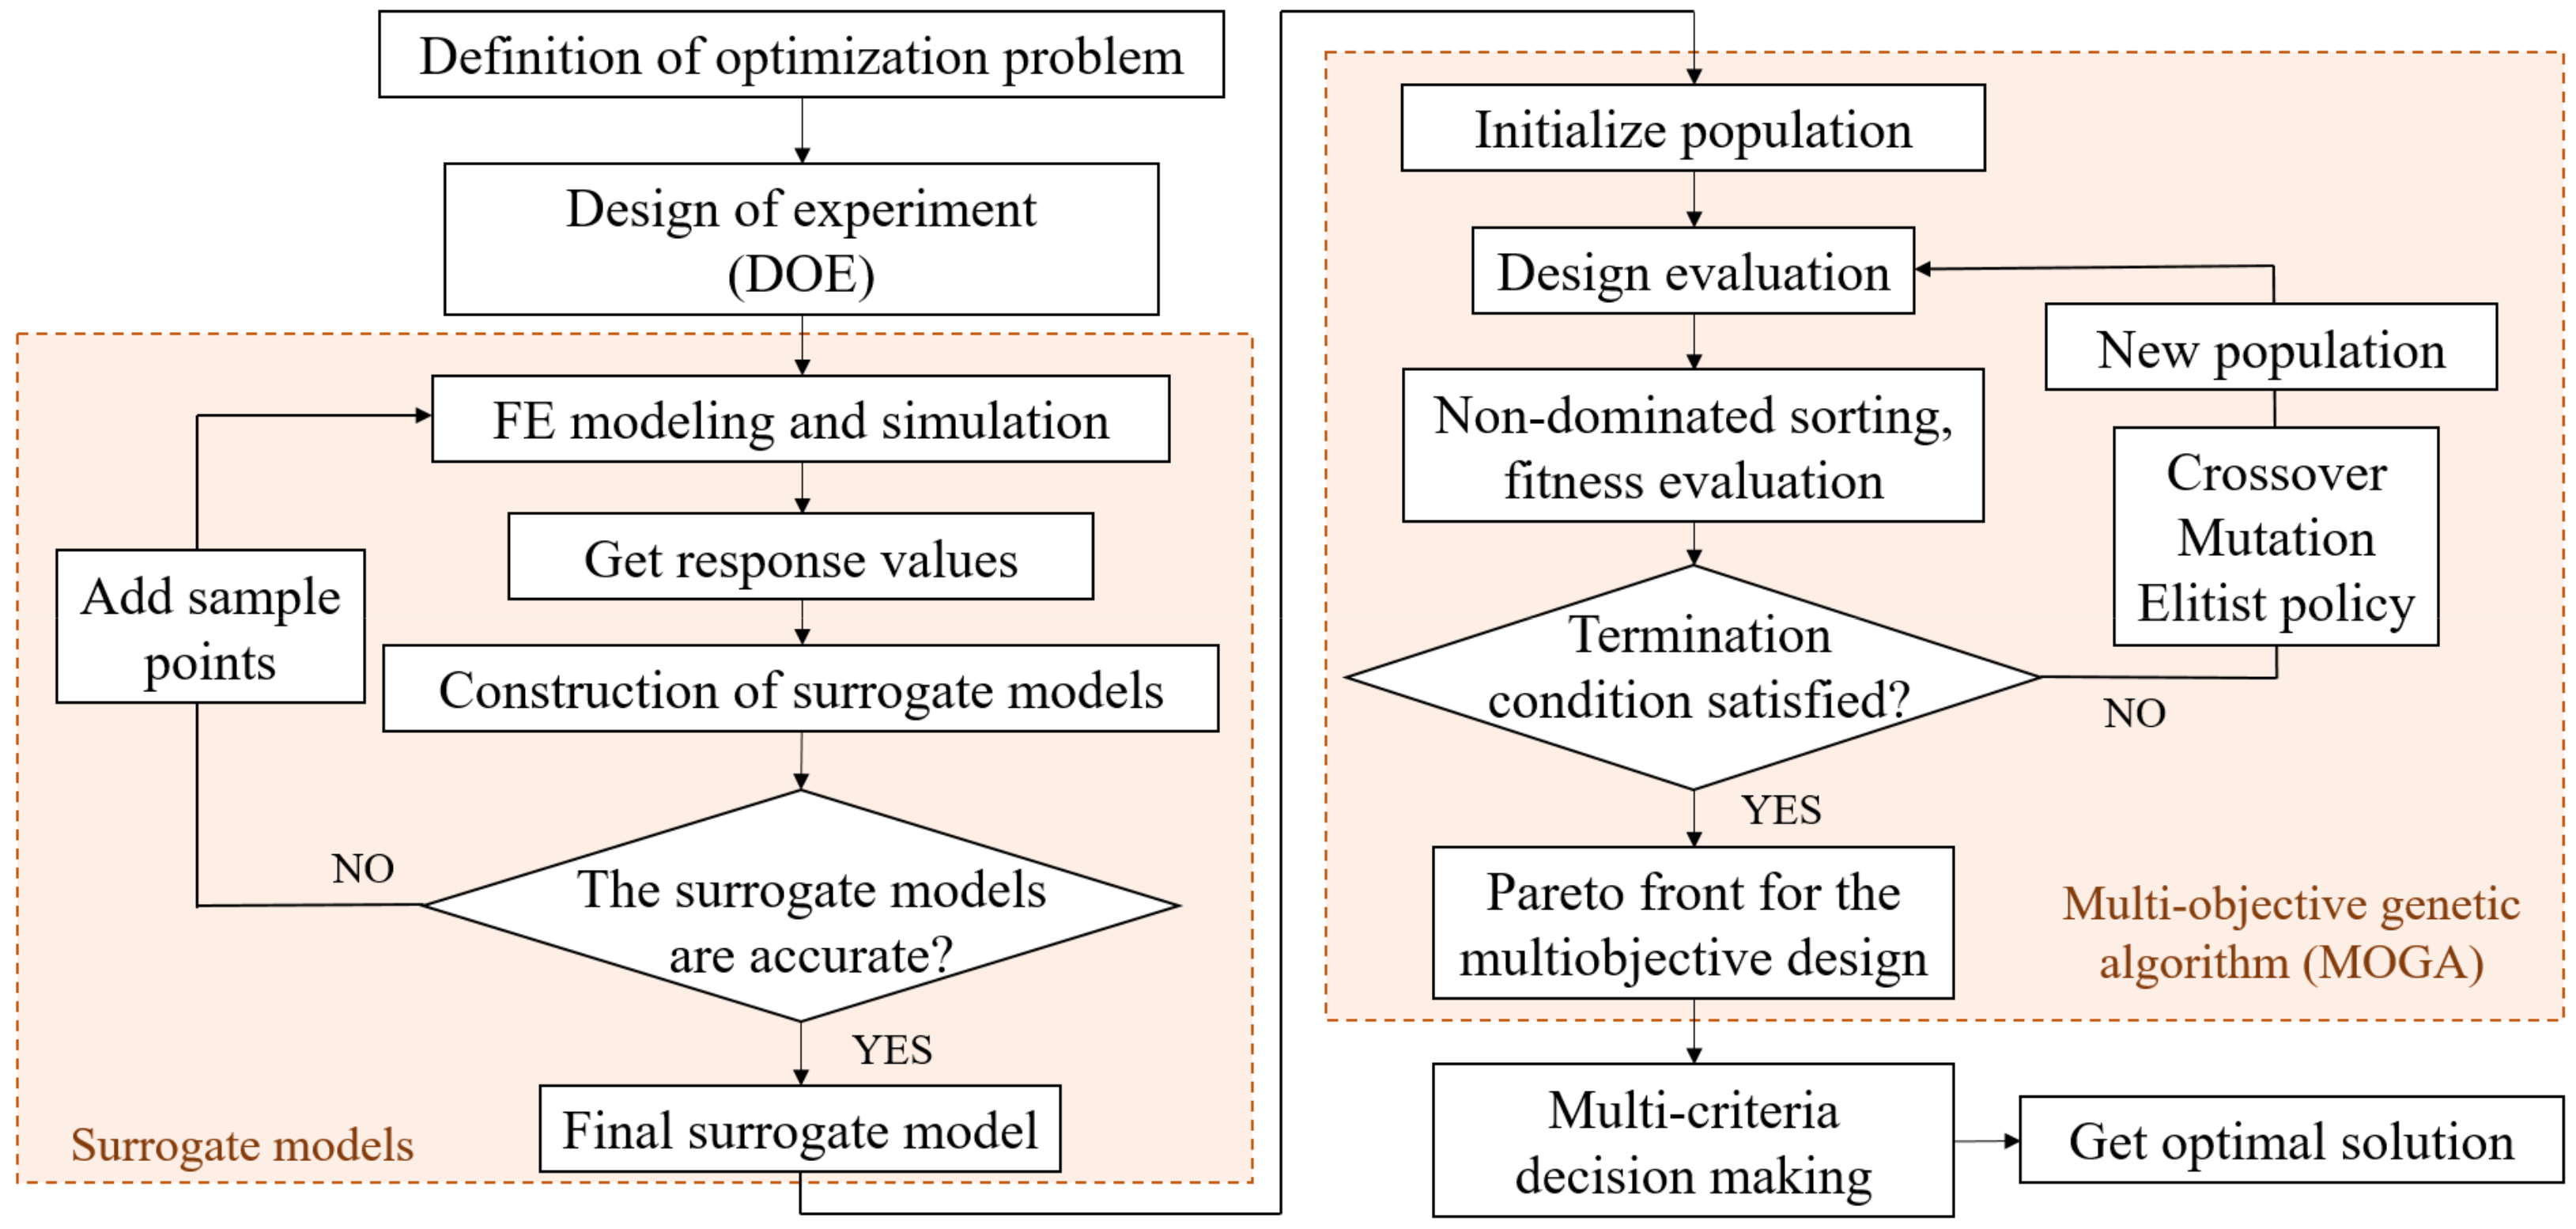
The above results show that the guard rail can reduce the lateral displacement and rotation angle of the bogie within the protective range. However, in Condition 2, with the change of velocity and installation position, the maximum stress of the guard rail reaches 400–500 MPa, and the risk of damage to the guard rail itself increases. In order to reduce the maximum stress of the guard rail, changing the cross-section of the guard rail is a choice. This section uses surrogate models and optimization algorithms to solve the optimization problems. The flowchart is shown in
Figure 13.
When impacted by the wheel, the maximum stress of the guard rail occurs where it is in contact with the wheel, while the stress elsewhere is relatively small. Using mesh deformation technology, two shape variables of the cross-section are established, as shown in
Figure 14.
In addition, as a structure, the quality of the guard rail should not be too large; otherwise, the cost will be high, and the installation will be inconvenient, so lightweight should be considered in the design process. In summary, the multiobjective optimization problems for guard rails are in Equation (4). The optimization objective is to minimize
and mass per meter, and the design variables are
S1 and
S2.
There are many different DOE methods available, such as full factorial design, fractional factorial design, central composite design, Latin Hypercube design, and Hammersley design [
26,
27,
28,
29]. The Hammersley method is one of the first high-dimensional QRLD (quasi-random low discrepancy) sequences proposed to tackle the issues associated with MCS (Monte Carlo sampling) and SMCS (stratified Monte Carlo sampling) [
30]. Because the Hammersley method can obtain achievable results with fewer sample points and has a good uniform distribution on the hypercube, it is used by many researchers [
31,
32,
33]. In this paper, 100 sample points are selected to establish the surrogate model, and 20 sample points are selected to verify the accuracy.
The crashworthiness optimization of guard rails requires iterative analysis. The huge time cost in the iterative process greatly reduces the efficiency of the optimization design, so we establish a surrogate model. The surrogate model can provide an approximate functional relationship to link the design variables with the optimization goal, thereby reducing the cost of simulation calculation and improving the efficiency of optimization design [
34]. At present, the surrogate model has been widely used in optimization problems in various fields [
35,
36,
37].
There have been many surrogate modeling methods available for crashworthiness optimization, such as polynomial response surface (PRS), radial basis function (RBF), Kriging, and support vector regression (SVR). For highly nonlinear problems, the Kriging method has better accuracy [
38], so this method is chosen to establish the surrogate model. The response surface established by the Kriging method is shown in
Figure 15. For maximum stress
, the interaction between the design variables
S1 and
S2 is significant. When
S1 and
S2 are close to 0 at the same time, the stress is maximum; when
S1 is close to 0 and
S2 is greater than 15 mm, the stress is relatively small. For mass per meter, there is no obvious interaction between
S1 and
S2. With the increase of
S1 and
S2, the mass increases linearly.
Table 1 summarize the results of the accuracy assessment of the surrogate models. The results show that the surrogate models are adequately accurate to replace the finite element analyses.
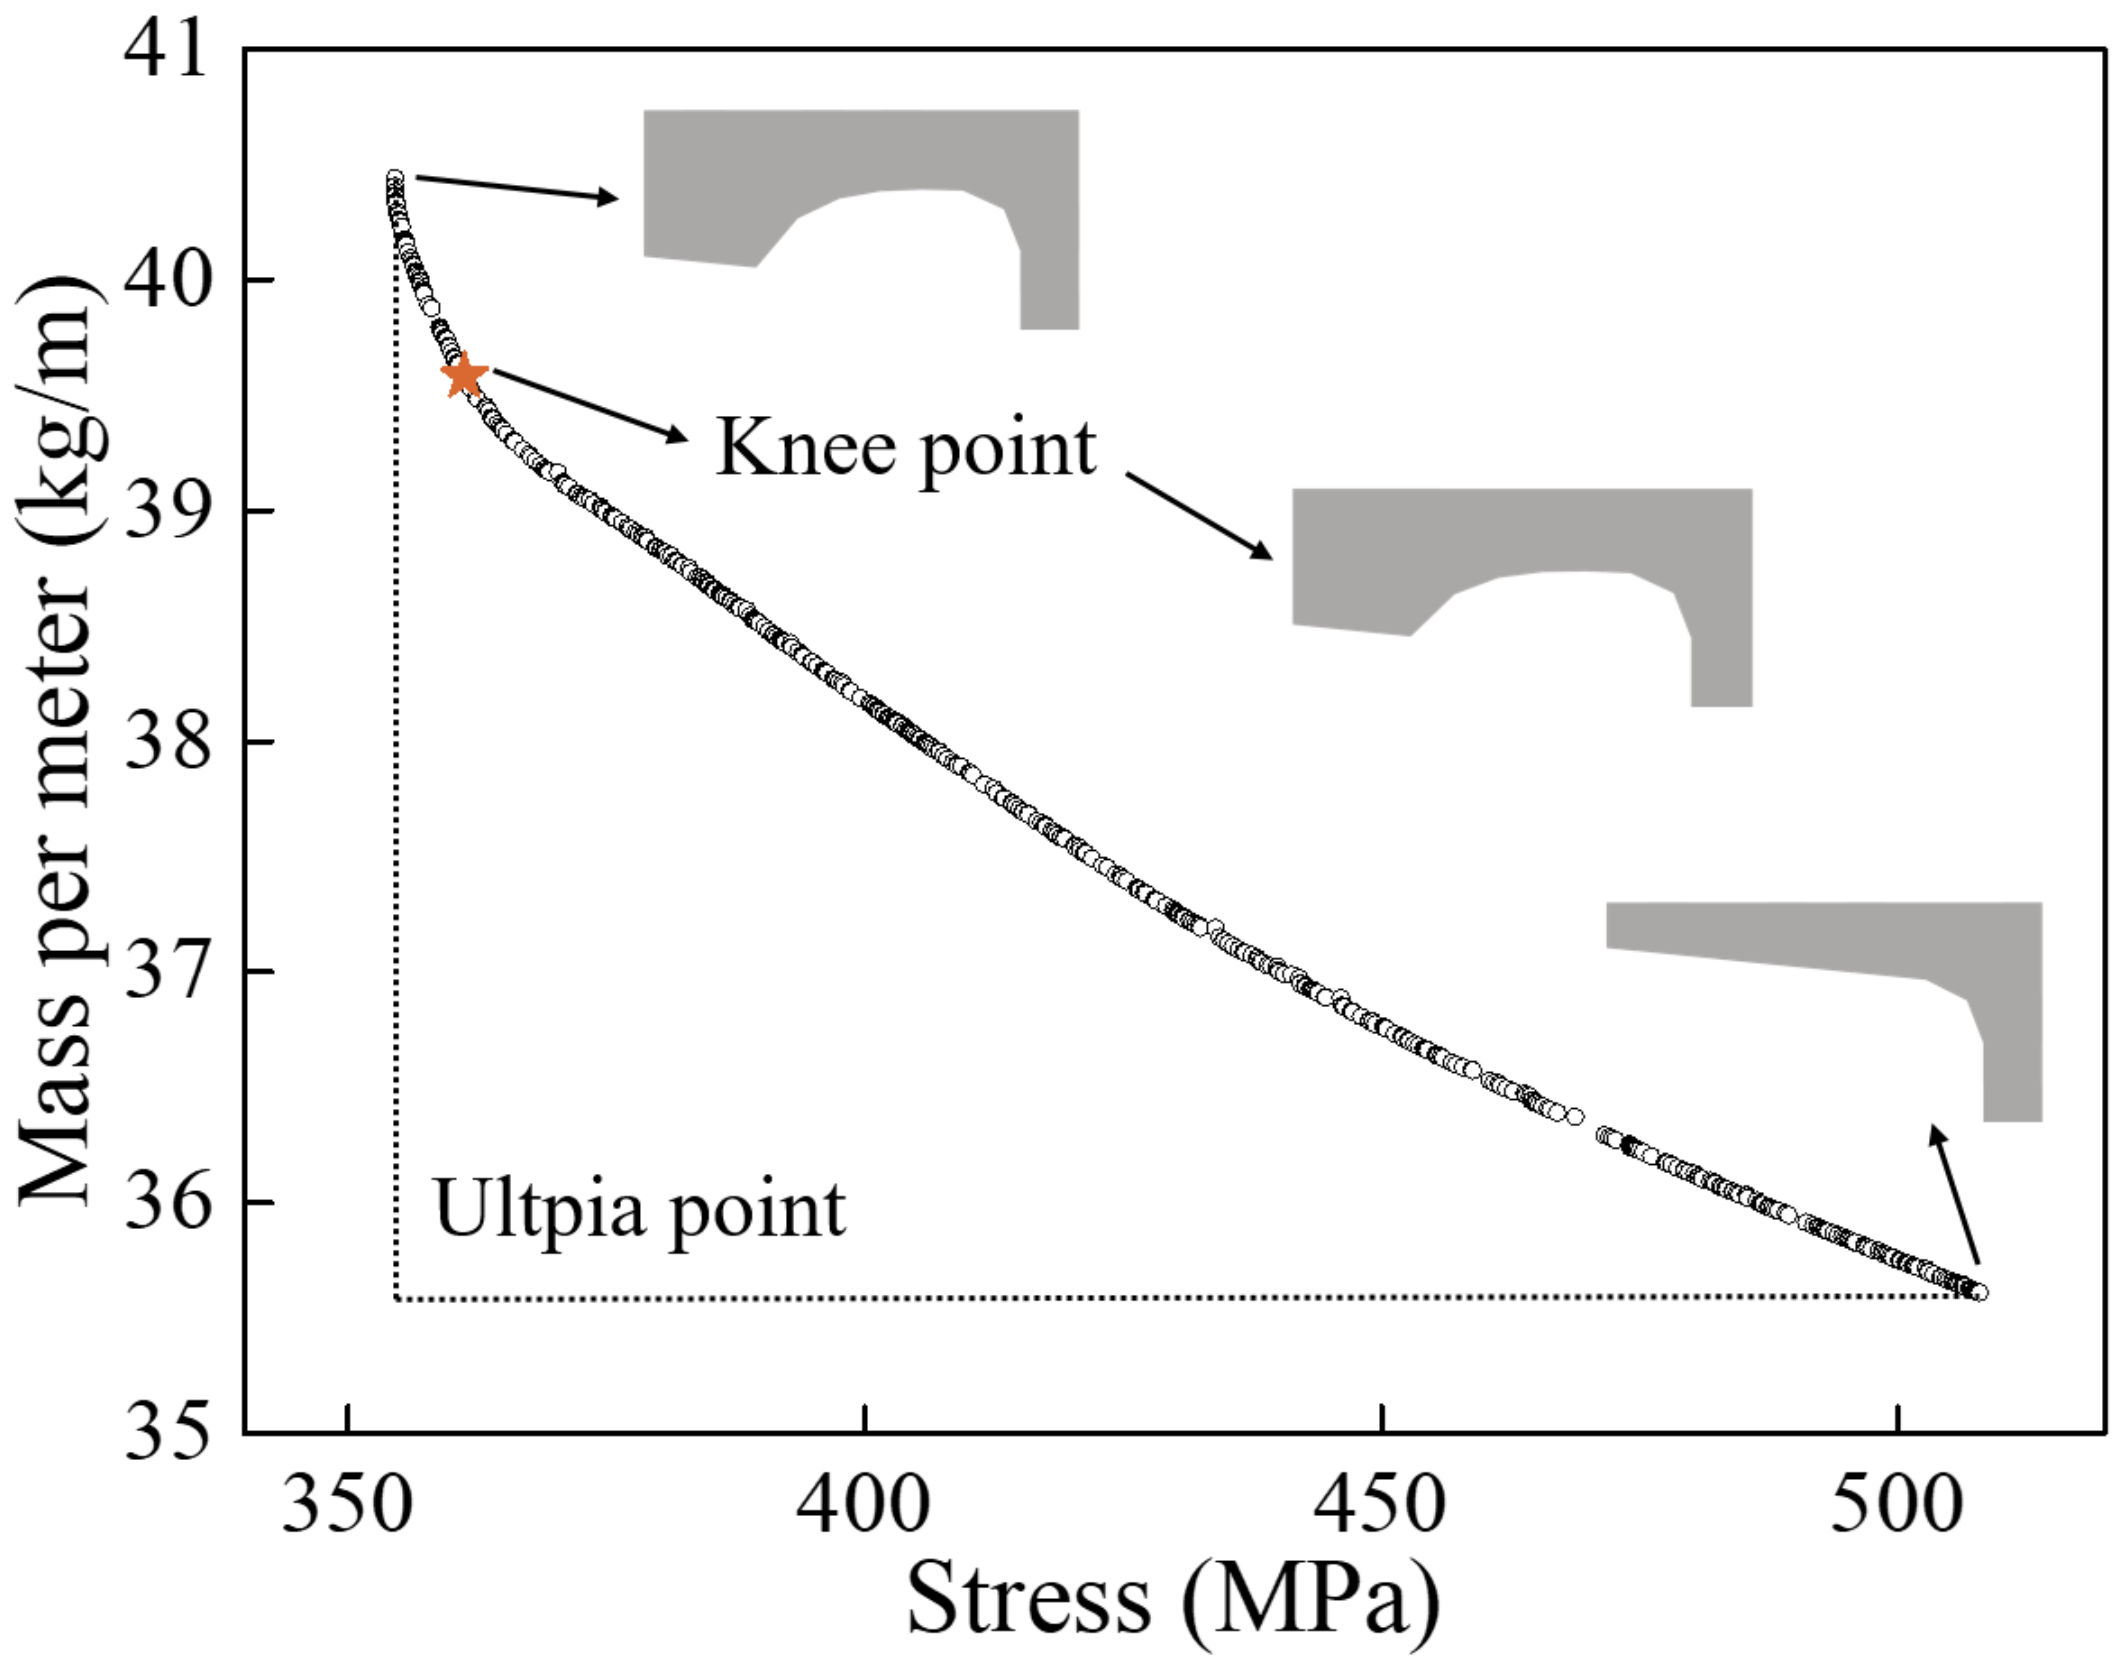
Using a multi-objective genetic algorithm, the Pareto solution set is shown in
Figure 16. Clearly, as the mass per meter of the guard rail increases, the maximum stress decreases. In order to select an optimal solution, the ideal point method in multi-criteria decision-making is used. The steps are as follows:
Step 1: First, use the normalization method to normalize the optimization design objective. The formula is as follows:
where
and
are the mean and standard deviation of all optimization results in the Pareto solution set
Ψ to the
jth objective function, respectively. m is the number of optimization objective functions and
and
are the initial value and normalized value of the
jth objective function, respectively.
Step 2: Calculate the objective weight. The formula is as follows:
where
gj(
i) is the
jth weighted objective function and
wj is the weight coefficient of the
jth objective. The weight coefficient affects the selection of the optimal structure. The entropy method can effectively eliminate the influence of subjective factors and determine the weight of the objective. The specific steps are as follows [
39,
40]:
First, establish a matrix
X for the objective function, the evaluation matrix composed of m objectives and n sets of objective test values is as follows:
Then, standardize the matrix. If the objective is a benefit, that is, the bigger, the better, it is standardized as:
where
pij is the standardized value and max
j{
xij} and min
j{
xij} are the maximum and minimum values in the
jth objective, respectively.
If the objective is non-benefit, that is, the smaller, the better, it is standardized as:
Then, normalize the decision matrix. The formula is as follows:
where
rij is the
ijth value in the matrix.
Additionally, then calculate the entropy
ej of the
jth objective:
Finally, the weighting factor
wj is calculated. The weight of each objective can be expressed as:
According to the results of 100 sets of sample points designed by DOE, the weights of the minimum stress and the minimum mass obtained by the entropy weight method are w1 = 0.3164 and w2 = 0.6835.
Step 3: Define the ideal point.
Assuming that all objectives have the feature of smaller-the-better, then the ideal point
G can be defined as:
where
G is the set of minimum values of all objectives.
Step 4: Determine the optimal result.
The distance between all points in Pareto and the ideal point is calculated and sorted. The distance calculation formula is as follows:
where
gj(
i) is the
jth objective of the
ith point after weighted.
The point closest to the ideal point is the final optimized solution. The final optimized point and the cross-section shape of the optimal solution are shown in
Figure 16. The structure of the optimal solution is analyzed by the finite element method, and the results of the FEA and surrogate model are summarized in
Table 2. We found that the error between the FEA and the Kriging model is less than 1.0%, which is within the acceptable error range in the engineering field, indicating that the optimized result is reliable. The maximum stress and mass per meter of the initial and optimized structures are shown in
Table 3. We find that although the quality of the optimized result is increased by 11.18%, the maximum stress is reduced by 28.19%, which reduces the possibility of damage to the guard rail.
In order to verify the protective ability of the optimized guard rail, the reductions of the lateral displacement and rotation angle of the bogie are evaluated, and they are reduced by 9.21% and 7.53%, respectively. It indicates that the optimized guard rail has a good protective ability and can effectively reduce its own damage risk.


