Abstract
Hydropower is at the backbone of low-carbon clean energy, while large hydroelectric generators play a key role in hydropower systems. In this paper, the tightness detection of stator trough wedges in the offline state of large hydroelectric generators is mainly studied. The offline state means that the generator stops running but does not need to move the stator and rotor. The traditional detection of generator stator wedges has problems, such as long maintenance intervals and low work efficiency. According to the structural characteristics of the generator, a generator maintenance robot device based on the track mechanism is designed. The device can simultaneously visualize the internal of the generator and detect the tightness of the stator slot wedge, effectively improving the maintenance efficiency. According to the electromagnetic magnitude of the stator rod in the alternating magnetic field, different stator slot wedge models are built for tightening, slightly tightening and loosening. For the conventional slot wedge loosen detection, there is a problem that the characteristic parameter is single, and the state of the slot wedge cannot be fully fed back. In this paper, a method for extracting the Linear Prediction Cepstrum Coefficient (LPCC) and Mel Frequency Cepstrum Coefficient (MFCC) of percussion sound signal is proposed, and the tightness recognition of the stator slot wedge is realized by combining the BP neural network algorithm. Experimental results show that the proposed method can effectively identify stator slot wedges in different states.
1. Introduction
It is predicted that China’s hydropower generation will reach 450 million kilowatts in 2030. In the face of heavy power generation tasks, the periodic maintenance of generators is indispensable. High-quality maintenance keeps the hydroelectric generator in a good maintenance condition, ensuring that it can operate stably and efficiently. Among them, the loosening detection of the stator wedge is the core component to ensure the long-term stable operation of the generator [1]. According to an IEEE expert investigation report, more than half of the stator windings of the 25 MVA generator in the investigation are caused by loose windings. Vibration stress has become the culprit responsible for the frequent failure of generators [2]. The stator wire rod inside the generator slot wedge is affected by the alternating electromagnetic force of 100 Hz for a long time during operation, resulting in different degrees of vibration. Under the continuous action of electromagnetic force, the stator slot wedge appears to loosen, and even some of the slot wedges fall off. The vibration intensifies, causing wear and corrosion of the wire rod insulation material. It is easy for insulation wear to cause eddy currents and vibration Electrical Discharge Machining (EDM) discharge, the main insulation layer, is broken down and shutdown events may occur, even causing safety accidents [3]. In summary, maintenance of the stator slot wedge is the key to ensuring the normal operation of large hydroelectric generators.
In 1998, First Hydro Corporation (UCNW) jointly introduced a wedge percussion device. When all the slot wedges are tapped, the data can be automatically processed on a computer to get the degree of loosening of the stator slot wedges. However, this device is too large and difficult to use [4]. In 2008, Jia Zhidong, Gao Shengqiang, and others of Tsinghua University developed a portable detection system based on the theory of Digital Signal Processor (DSP) embedded system. In the test, it was found that it is more convenient to detect loose slot wedges than traditional detection methods [5]. In 2009, Peng Xiang, Jia Zhidong, and others used 300 MW of generator samples produced by the Beijing Steam Turbine Generator Company to build a model of the generator stator trough wedge structure. Then, the tightness of the slot wedge was determined by the change in amplitude and frequency based on the signal collected by the microphone [6].
In this paper, the main research object is the large hydroelectric power generator, China Yangtze River Electric Power Company, which belongs to the vertical structure. The speech signal characteristics extracted based on the sound signal generated by percussion vibration are combined with neural network algorithms to achieve nondestructive detection of generator stator slots. The results show that the MFCC characteristics of the extracted sound signal have a good recognition effect on the classification of stator slot wedges. It provides a reliable theoretical research basis for the detection of stator slots in large hydroelectric generators.
2. Generator Overhaul Robot Motion Structure Design and Database Establishment
2.1. Design of Electromagnetic Percussion Device
This study is aimed at a large vertical hydroelectric generator with a rotor diameter of 18 m, the length of 3 m, and a stator and rotor gap of only approximately 32 mm. The traditional detection of the stator wedge used a copper hammer to strike the surface of the slot wedge, the state of the slot wedge is judged by the sound generated by the vibration. This approach relies too much on the subjective experience of the operator, and there is no completely uniform standard within the industry. Therefore, an automated percussion device needs to be designed.
According to the requirements of space size and percussion force, the electromagnet motion distance is 12 mm and the maximum force is 35 N. As shown in Figure 1, the difference between the top and horizontal height of the tapping rod reaches 32 mm. Where the electromagnet device can be regarded as a moving slider, the angle between the connecting rod 1 and the dotted plane is 30°. Linkage 2 can be divided into two parts, and the length of the two rods (2–1:2–2) is approximately 1:2. From the mechanical analysis of the mechanism, the force at the end of the tapping rod is roughly calculated to be 8 N.
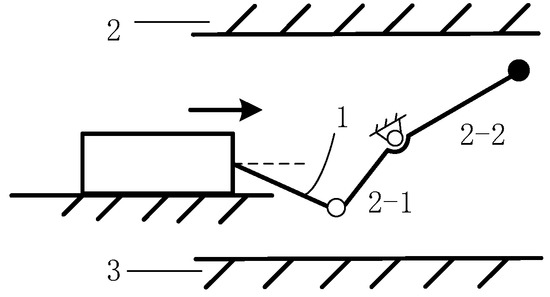
Figure 1.
Schematic diagram of the motion structure of the percussion device. 1—connecting rod 2—stator 3—rotor. In order to reduce the interference of manual operating factors, this paper uses an electromagnetic tapping device instead of a copper hammer. When the voltage magnitude is constant, the force of the electromagnetic tapping device can be well maintained. At the same time, in order to achieve continuous operation of the percussion device, the use of an optocoupler isolation drive module can effectively control the number of percussions and time intervals.
As shown in Figure 2, automated control facilitates the performance of stator slot wedge tightness detection without the rotor extraction of the generator. In the design, the low-power stm32 microcontroller is used to control the generation of signals. The signal acts on the optocoupler isolation module and controls the electromagnet action. The control chip uses a timer to achieve time error control of the tapping device.
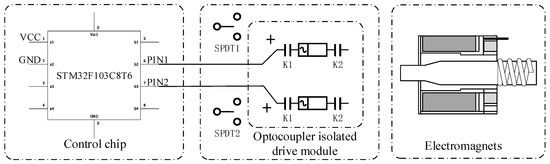
Figure 2.
Schematic diagram of the control of the electromagnetic tapping device.
2.2. Generator Overhaul Robot Structure Design
Maintenance robots generally use bionic negative pressure and magnetic adsorption when driving on the wall. The generator’s stator wedge is made of a combination of multi-layered silicon steel sheets. Therefore, it is also possible to use adsorption to move. However, it is necessary to combine the requirements of the working environment and processing accuracy to choose the appropriate mode of movement. Table 1 lists the advantages and disadvantages of several common adsorption methods.

Table 1.
Advantages and disadvantages of common adsorption methods.
Each adsorption method has certain differences in the surface properties and installation accuracy requirements of the generator. During the long-term operation of the generator, the surface of the trough wedge accumulates thick dust, debris, etc. Faced with the dual needs of visual detection and stator slot wedge tightness detection, there are also problems such as a small robot working space and high reliability requirements. From the analysis of Table 1, it can be seen that the movement mode of wall driving is difficult to meet the maintenance task. The structure driving on the stator surface cannot meet the visual inspection of the rotor surface.
The research object of this project belongs to the vertical generator, and the height direction is limited, it can be designed from the height direction. Therefore, it is considered to avoid direct contact with the wall as much as possible and to improve the stability of the device. In order to meet the needs of the generator maintenance task, the motion mechanism of the generator maintenance robot needs to be further optimized.
In this project, a generator maintenance robot based on the track mechanism is proposed, and the length of the moving guide rail can be designed according to the height of the generator. As shown in Figure 3, the sliding tapping device assembly uses bearings with shafts to achieve stable motion in the orbit driven by the traction line (not marked in the figure). During movement, the unit simultaneously performs internal visual inspection of the generator and knocks on the slot wedge. The overall thickness of the robot is maintained at approximately 23 mm, which can meet the needs of two inspection tasks at the same time.
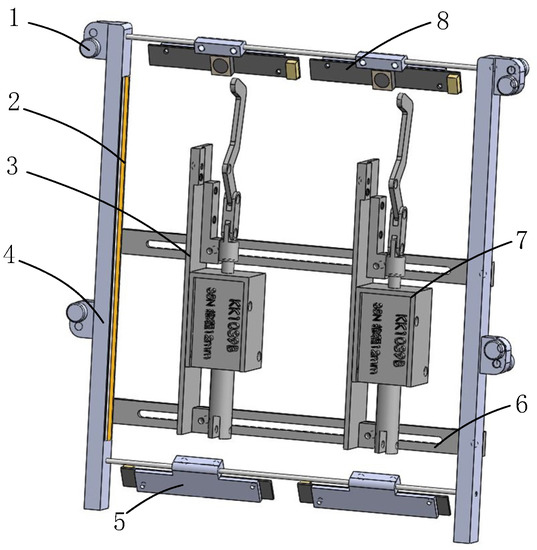
Figure 3.
Sliding tapping device assembly. 1—Bearing with shaft 2—LED strip 3—Percussion device mounting plate 4—Bearing bracket linkage 5—Rotor camera module 6—Crossbar 7—Electromagnetic tapping device 8—Stator camera module.
As shown in Figure 4a, the scenario where the prototype of the overhaul robot is tested in a laboratory environment. The sliding tapping device can achieve free movement under the drive of the traction device. In Figure 4b, the camera device can detect the target object well with the help of an auxiliary light source. After the camera is adjusted to the appropriate position, the percussion device can be monitored by the host computer. Figure 4c shows the external structure diagram of the stator slot wedge captured by the device inside the generator, verifying the feasibility of the camera unit. In Figure 4d, it can be seen that the environment of the test site is harsh and the operation is difficult. Figure 4e is the guide rail on the generator stator for placing the maintenance robot, which is composed of four carbon fiber tubes. It is very stable, and it can place multiple maintenance robots. The percussion device works well in field tests, verifying the feasibility of the design.
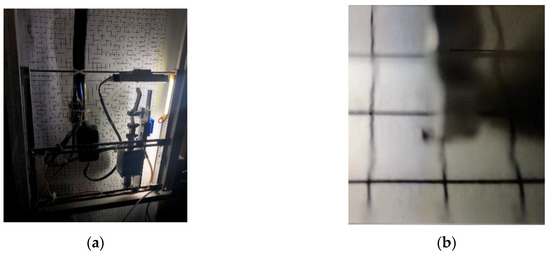
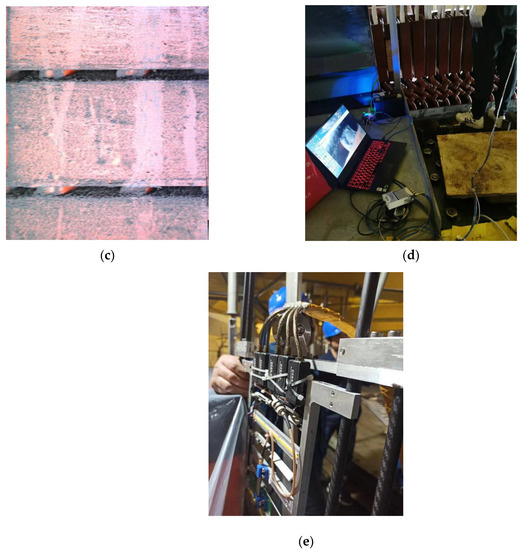
Figure 4.
Generator overhaul robot device. (a) Overhaul the robot prototype; (b) Host computer monitoring interface; (c) Captured stator slot wedge structure; (d) Overhaul robot power plant site testing; (e) the guide rail of the maintenance robot.
Compared with other wedge-shaped condition monitoring equipment, our advantages are as follows:
- Compared with permanent magnet adsorption type and crawler type robots, the generator maintenance robot based on the track mechanism can detect not only the stator but also the rotor, and it does not need to contact the surface of the stator and rotor, which will not affect the detection results of knocking sound;
- Compared with the crawling detection robot, the sliding tapping device moves faster, multiple sliding tapping devices can be installed on the guide rail at one time, and the position of the knocking device can be adjusted according to different generator models. The surface of multiple stator slot wedges can be inspected at one time, and the efficiency of detecting the generator can be greatly improved.
2.3. Build a Sample Library of Percussion Sound Signals
Next, in a laboratory environment, the different tightening states of the generator stator slot are simulated to collect the corresponding sound signals. The generator is mainly composed of stators, rotors, and other structures, and the main maintenance work here revolves around the generator stator. Among them, stator slot wedge tightness detection is an important part of generator fault diagnosis. The generator stator slot wedge is mainly composed of stator wire rods, gaskets, corrugated plates, slot wedges, and other parts, and the structure of the slot wedges is shown in Figure 5.
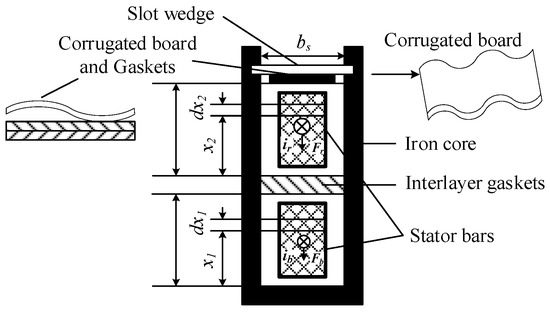
Figure 5.
Stator slot wedge corrugated plate fastening structure.
The stator rod inside the slot wedge is subjected to alternating electromagnetic forces at 100 Hz for a long time [7]. When the incoming current of the rod is in phase, the electromagnetic force on the stator rod is vertically wedged down, and the force on the corrugated plate is not considered. Conversely, the electromagnetic force on the upper wire rod will exert a certain pressure on the corrugated plate, which in turn increases the corrugated plate shape variable [8]. According to the calculation formula of the electromagnetic force of the conductor in the magnetic field, it is obtained that:
The current of the lower stator rod is , and the current of the upper rod is . Where is the peak current and is the width of the slot wedge.
Substitute the current values of the upper and lower layers into Expression (1) to obtain the electromagnetic force on the wire rod:
From Expression (2), it can be seen that during normal operation of the generator, the electromagnetic force received by the stator rod is proportional to the square of the working current. As the installed capacity of the generator increases, so does its rated operating current. Therefore, the electromagnetic force generated by the stator rod will also increase sharply. In particular, when the generator is short-circuited or a major accident occurs, the electromagnetic force of the stator wire rod will reach more than 100 times. To improve the safety factor, this article takes the electromagnetic force Fm = 120 Fr on the stator bar when the generator is short-circuited. Fr is denoted as F1 and Fm as F2, so when the electromagnetic force of the corrugated plate is greater than F2, it is called a tightening state, when the electromagnetic force is less than F2 and F1, it is called a slightly tight state, and when it is less than F1, it corresponds to a loose state. At this point, the tightness of the slot wedge can be divided into three different states.
As can be seen from Table 2 above, this article divides the state of the slot wedge into three states. It corresponds to the three situations in which the generator is not destroyed in the event of an unexpected accident, the normal operation under the rated conditions, and the inability to work normally for a long time.
Table 2.
Stator slot wedge fault classification criteria.
After establishing the classification standard, the mechanical analysis of corrugated plates is carried out to solve the shape variables corresponding to different states. Based on this, the stator slot wedge models of different states corresponding to corrugated plate shape variables are built under laboratory conditions. The slot wedge structure of a large hydro generator is shown in Figure 6. It can be clearly observed that the slot wedge plate is composed of three complete sections. When manually knocking the slot wedge to judge whether it is in a loose state, it is generally believed that there are two sections (two knocking nodes) in the third section of the slot wedge, and if it is loose, it is determined that the slot wedge needs to be tightened. In this paper, the slot wedge model corresponding to different states is manually adjusted under laboratory conditions. In order to avoid deviation in the installation process, the data of intermediate node ① is selected as the test point.
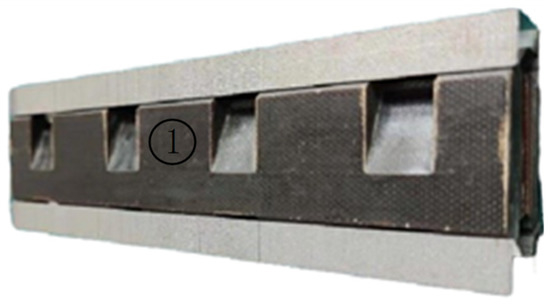
Figure 6.
Stator slot wedge striking node.
As shown in Figure 7, after the simulation test bench is completed, the shape variable of the corrugated plate in stator slot wedge is adjusted by replacing the gaskets of different thicknesses, simulating the corresponding three different states of the slot wedge. In this paper, 100 sets of tests were carried out on the slot wedge structures in three different states, with a total of 300 sets of experimental data.
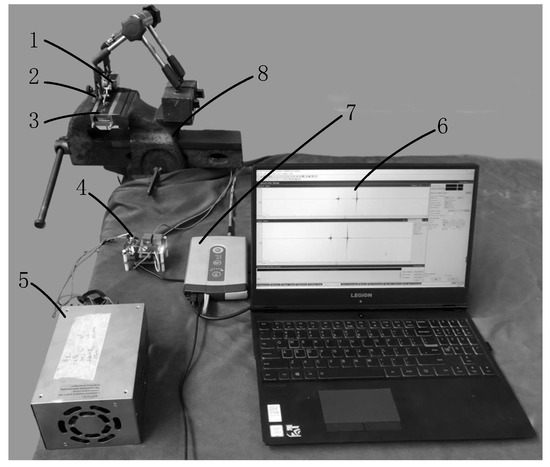
Figure 7.
Simulation bench. 1—electromagnetic percussion device, 2—microphone, 3—slot wedge model, 4—control circuit, 5—24 V transformer, 6—laptop, 7—portable collector, 8—caliper.
3. Sample Data Preprocessing
3.1. Spectral Subtraction Noise Reduction Treatment for Multi-Window Spectral Estimation
Different from the periodic graph method to solve for power spectral density, the multi-window spectral estimation method uses multiple orthogonal data windows to obtain a direct spectrum of sample data. Then, a spectral estimate is obtained after smoothing. This is more accurate than the period graph method, and it reduces the variance from the original data.
Based on the slots, gaskets, and corrugated plates of the generator stators provided by the Gezhouba Hydropower Station, the percussion test environment is simulated in the laboratory. In order to test the noise reduction effect of the adopted method, the Gaussian white noise of SNR = 3 dB is added, and the SNR of the sound signal after spectral subtraction is 10.54 dB. This method can effectively improve the signal-to-noise ratio of the sound signal. The noise reduction effect is shown in Figure 8:
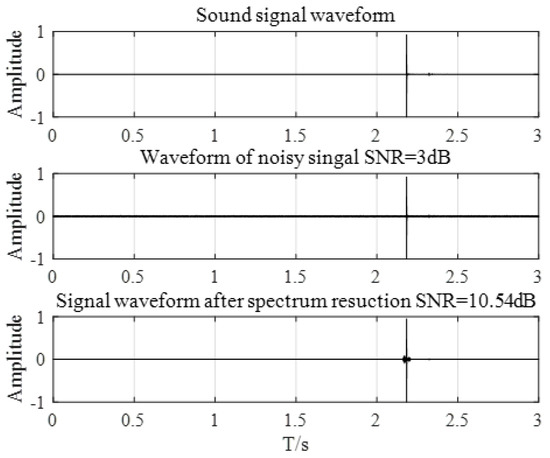
Figure 8.
Comparison of noise reduction of laboratory knock signals.
When the power plant is tested on the spot, the surrounding units are still operating normally, and there is more ambient noise. Therefore, noise reduction is required for the sound signals collected in the field. In order to further verify the effect of spectral subtraction noise reduction treatment, the percussion sound signal collected at the generator plant site is used as a test. As shown in Figure 9 above, the percussion sound signal waveform after noise reduction treatment has been significantly improved, which further verifies the effectiveness of the noise reduction algorithm.
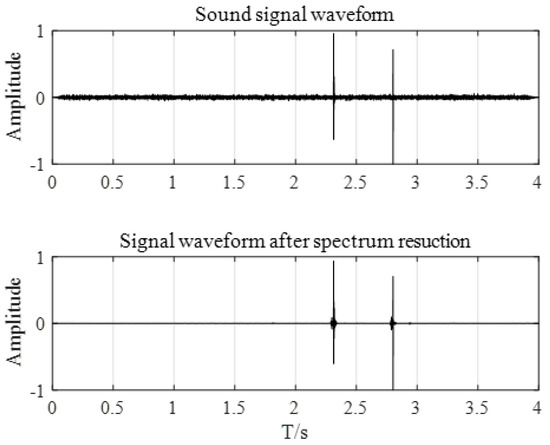
Figure 9.
Noise reduction comparison diagram of generator field knock signal.
3.2. Capture of Valid Fragments of Tapping Sound Signals
In speech signal processing technology, endpoint detection is an important and effective means of segment recognition. The traditional double threshold detection method has a rear-end point deviation and is less robust under noisy conditions. In this study, short-term spectral entropy and short-term energy were used to intercept the effective fragments of the sound signal after noise reduction.
Short-term energy is a common means of signal time domain analysis, which can effectively distinguish whether it is a voice signal. Speech signals are generally continuous non-stationary signals, and the energy will vary with this feature. In the process of signal processing, the non-stationary signal of 10–30 ms can be regarded as a stationary signal. Then, the original acoustic signal is framed and windowed. Hamming window can effectively reduce the leakage of percussion sound signal spectrum, and the Hamming window function is selected in this article.
For the percussion sound signal, the sample data is x(n), xi(m) is a frame after the percussion sound signal is windowed, and the length of the signal is N. The corresponding short-term energy is:
After improving the resulting energy relationship, short-term energy ELi:
If the constant a is larger, ELi helps to be alleviated when the peak of AMPi is abruptly changed, which helps to distinguish noise in speech signals. The energy of the signal mainly depends on the magnitude of the amplitude, and the energy curve is shown in Figure 10:
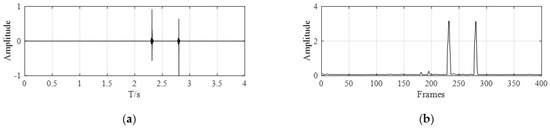
Figure 10.
Raw signal vs. energy curve. (a) Raw signal curve; (b) Energy curve.
Entropy is used in statistical thermodynamics to express the probability of a random event occurring. In 2011, Nemanja et al. proposed a speech recognition algorithm based on spectral entropy, which has better detection accuracy than short-term energy in a low signal-to-noise ratio environment [9].
is the percussion sound signal of the i frame after the framing and windowing, followed by a discrete Fourier transform to calculate the energy spectrum of the frequency component of each spectral line. In order to avoid singular data in the energy spectrum, the spectral probability density function corresponding to the frequency component is further calculated.
The short-term spectral entropy of each frame of the percussion sound signal is defined as:
As shown in Figure 11, the spectral entropy of a signal is determined by the degree of confusion of the signal, regardless of the amplitude of the signal. Spectral entropy values and zero-crossing rates exhibit the same characteristics for changes in signals, and the degree of disorder within the percussion signal segment is low. As with short-time energy and zero-crossing rate endpoint detection, the energy–entropy ratio can be used to detect the location of the valid signal. The entropy ratio expression is:
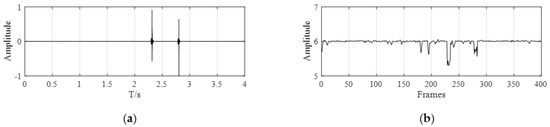
Figure 11.
Raw signal vs. spectral entropy curve. (a) Raw signal curve; (b) Spectral entropy curve.
In this study, the percussion detection of the stator slot wedge surface is mainly performed, and the excitation is equivalent to a pulse signal. As can be seen from Figure 12 above, the energy–entropy ratio curve can well detect the position of the effective signal fragment.
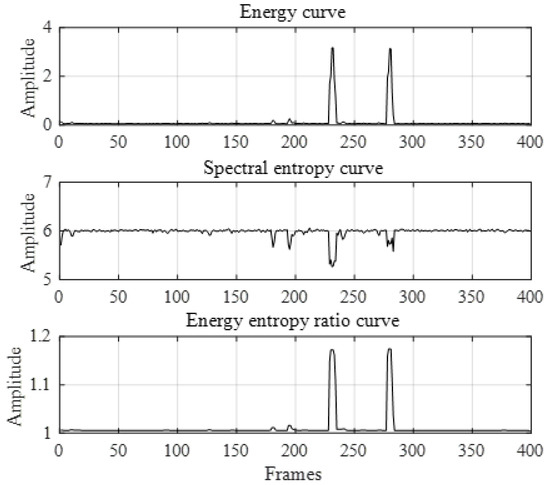
Figure 12.
Energy—entropy ratio curve.
After calculating the energy–entropy ratio curve of the original signal, the signal curve is smoothly filtered, then the range of the effective fragment is determined according to the changing trend. During spectral subtraction noise reduction, the leading segment of the tapping sound signal has a noise segment with a frame length of Ntl. By solving the maximum value of the energy curve and the mean eth of the leading segment, the difference between the two obtains the positioned threshold Det. Set the conditions for the judgment interval:
The position of the valid segment can be obtained by observing Figure 13, but sometimes there may be multiple places that are judged to be speech segments. Therefore, it is necessary to intercept the corresponding length of signal according to different needs and the position of the fragment. As shown in Figure 14, in order to ensure the subsequent classification effect and the integrity of the signal, the signal fragment of 0.5 s is intercepted.
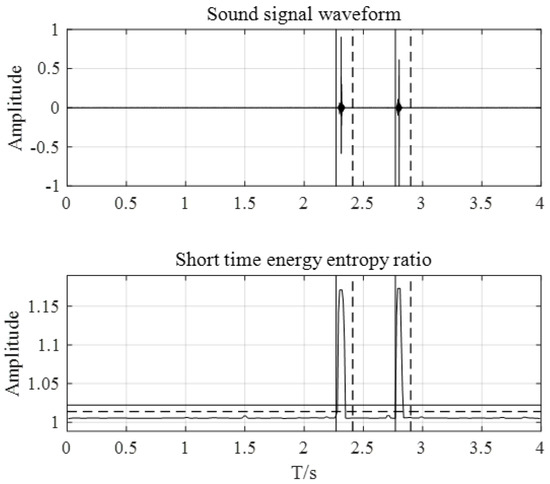
Figure 13.
Valid fragment of the original signal.
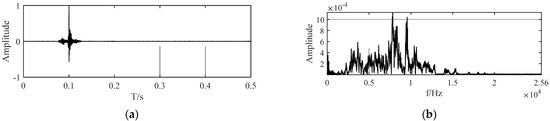
Figure 14.
Tapping sound signal after interception. (a) 0.5 s valid signal fragment; (b) Spectral map of effective signal fragments.
4. Percussion Sound Signal Feature Extraction and Screening Based on Speech Features
Before using the neural network algorithm for classification, it is necessary to perform feature extraction and feature screening on the data signals to obtain a better prediction classification result of slot wedge tightness. (1) Feature extraction. Extracting feature vectors from raw time domain signals that distinguish between different states. (2) Feature vector screening. In the extracted feature vectors, the optimal vectors characterizing different states can be screened out, and the dimensions of the feature vectors can be reduced.
Yunnan University proposes an algorithm based on MFCC and LPCC to identify congenital heart disease, which can effectively initially screen and diagnose coronary heart disease [10]. The traditional tightness test of the stator wedge is usually performed by manually tapping the surface of the slot wedge with a copper hammer. The tightness of the slot wedge is judged based on the sound signal generated by the vibration of the slot wedge. Therefore, in combination with the experimental scene test method, the sound signal generated by percussion vibration is extracted by using the speech signal processing method.
4.1. Based on MFCC Feature Parameter Extraction
MFCC has become the most commonly used speech recognition algorithm because of its simple extraction method, fast speed, and good noise resistance. The MFCC feature parameter extraction process is shown in Figure 15.
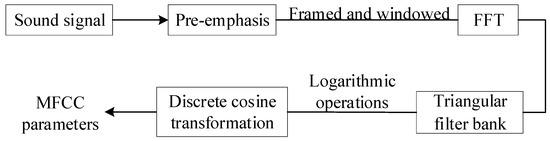
Figure 15.
MFCC extraction process.
As shown in Figure 16, the sound signals that strike the surface of the stator slot are extracted by using 12-dimensional and 24-dimensional feature parameters, respectively. The three sets of MFCC feature parameter matrices of fastening, slightly tightening and loosening corresponding to 12-dimensional and 24-dimensional corresponding fastening, slightly tightening, and loosening are converted into corresponding three-dimensional diagrams. Here, three sets of data are selected for three different states.
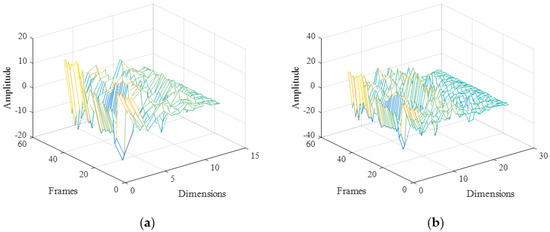
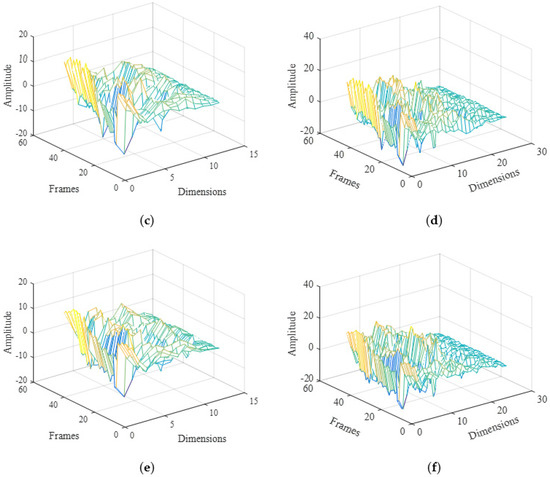
Figure 16.
Characteristics of the MFCC of the percussion sound signal. (a) 12-dimensional (Run15) fastening state; (b) 24-dimensional (Run15) fastening state; (c) 12-dimensional (Run115) slightly tight state; (d) 24-dimensional (Run115) slightly tight state; (e) 12-dimensional (Run215) loose state; (f) 24-dimensional (Run215) loose state.
From the comparison of data in the same dimension, it can be concluded that the amplitude of each frame of the sound signal in the same dimension of the MFCC characteristic parameter matrix in three different states is not obvious. The corresponding values in different dimensions under the conditions of the same frame are very different. From the data in different dimensions, the 24-dimensional MFCC feature parameter matrix contains more information than the 12-dimensional parameter matrix. Therefore, the MFCC same frame feature coefficient can be used as a data source in subsequent feature classifications in different dimensions.
4.2. Based on LPCC Feature Parameter Extraction
The Linear Prediction Cepstrum Coefficient feature is obtained on the basis of the linear prediction coefficient eigenvalue. The model function formula for known linear prediction coefficients is:
If the impulse response of H(z) is h(n), the corresponding reciprocal coefficient is calculated. Then, there are:
Substitute Expression (9) into Equation (10), and at the same time derive the z on both sides of the expression:
After merging the two sides of Expression (11) with the same kind of terms, the coefficients of the same type corresponding to the two sides are equal, and the following expression relationship is obtained:
From the above Equation (12), we can get the corresponding reciprocal coefficient , where in the expression is calculated from the linear prediction coefficient.
In order to verify the effect of failure prediction in different dimensions of LPCC and MFCC at the same time. Therefore, LPCC feature vectors of 12 and 24 dimensions are extracted, respectively. The three sets of eigenvectors correspond to the stator slot wedge model of the fastened, slightly tight, and loose states, respectively. Convert it into a corresponding three-dimensional diagram and see if differences between different states can be discovered. As shown in Figure 17, the same three sets of data are selected for three different states.
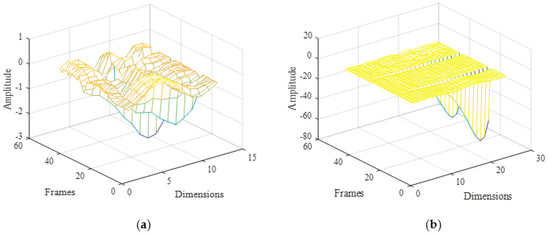
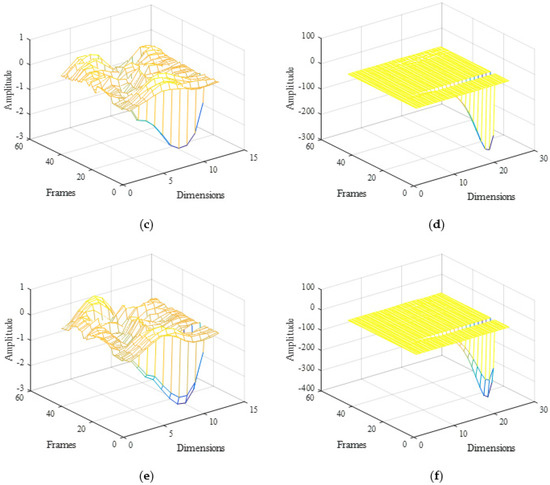
Figure 17.
LPCC characteristics of percussion sound signals. (a) 12-dimensional (Run15) tight state; (b) 24imensional (Run15) tight state; (c) 12-dimensional (Run115) slightly tight state; (d) 24-dimensional (Run115) slightly tight state; (e) 12-dimensional (Run215) loose state; (f) 24-dimensional (Run215) loose state.
From the perspective of the LPCC feature parameters of the same dimension, the amplitude of the corresponding feature parameters is small. However, it was found that there is a sudden amplitude mutation near the frame number of 20, which can be used as a basis for subsequent feature screening. As the number of dimensions of the feature parameters increases, the amplitude of the feature parameters becomes extreme. This shows that there are also large differences between different dimensions, which can be used as a basis for subsequent classification.
4.3. Principal Component Analysis Method Feature Vector Dimensionality Reduction
The differences in the MFCC and LPCC feature parameters of 12-dimensional and 24-dimensional extraction are mainly reflected in two aspects. (1) In feature extraction, the difference in amplitude corresponding to the increase in dimensionality increases, indicating that it may contain different information. (2) In the process of LPCC feature extraction, it is obvious that the amplitude with a frame number of around 20 can be observed to have a peak. However, it is difficult to determine the frame number range in the MFCC, and further feature screening is required to reduce dimensionality.
According to the different states of the stator slot wedge, it is divided into three types: tightening, slightly tightening, and loosening, which is a typical fault classification problem. In classification problems, the key to eigenvectors is that the difference between sets of data under the same fault type is as small as possible, and the difference between eigenvectors is larger under different failure types. Taking the 12-dimensional eigenvectors extracted by LPCC as an example, the vector matrix of each set of data extraction is 45 × 12. Follow these steps for data processing:
The extracted feature vectors may vary greatly from row to row, so the data needs to be uniformly standardized. Standard deviation expression:
Homogenization:
Step 2: Matrix Covariance Calculation
Using the Matlab Toolbox, the correlation coefficient of the matrix and its covariance matrix are obtained. Further, the eigenvalues and eigenvectors corresponding to the matrix covariance matrix can be obtained.
Step 3: Principal Component Matrix Calculation
After obtaining the eigenvalues of the matrix, the eigenvectors are converted into a new identity matrix P in descending order. At the same time, the P matrix is multiplied to obtain the principal component matrix.
Step 4: Principal ingredient extraction
Variance can be used to evaluate the degree of dispersion of the data, where the eigenvalue of the covariance matrix of matrix is the variance of the principal components. Therefore, it is possible to calculate the proportion of each principal component to the total component:
Therefore, the cumulative variance contribution rate of the principal components of the first k items is:
When the cumulative contribution rate of variance exceeds a specified value (such as 90%), this component can replace the original n-dimensional matrix. This can achieve the effect of reducing the dimension of the data, without losing the main information of the original matrix. The eigenvectors extracted from LPCC are processed by PCA dimensionality reduction method. Here is an example of the LPCC feature vector extracted by Run115:
From the observation of Table 3, the cumulative contribution rate of the first five items exceeded 98%. Thus, the first five terms contain most of the information about the eigenvectors, and it can be used as eigenvectors in subsequent classification identification. By sorting the data of each component, the first five items are extracted as the main components.
Table 3.
Characteristics of PCA principal components.
It can be obtained by sorting the cumulative contribution scores of each principal component in the Table 4, and the first 5 principal components retained are 11, 12, 15, 16, and 14. These five principal components are then extracted from the original dataset to form the sample set in the subsequent chapter classification model. Similarly, the PCA method is used to reduce the dimensionality of the feature vectors extracted by MFCC, and the first 5 principal components 13, 14, 15, 12, and 17 are retained. This is consistent with the LPCC dimensionality reduction treatment method, so it will not be repeated here.
Table 4.
Principal Component Contribution Scoring Table.
5. Classification Recognition of Stator Slot Wedge Tightness Based on BP Neural Network
The BP neural network is an algorithm based on gradient descent proposed by Rumelhart and Hinton in 1986. By constantly adjusting the weights between the connection layers, the difference between the final output of the algorithm and the target value is as small as possible [11]. BP neural networks can predict and classify data regression according to different needs, and they are widely used in mechanical fault diagnosis, image recognition, and biomedicine.
The steps for the BP neural network to implement stator slot wedge tightness classification are as follows:
(1) Normalization of data. Due to the extraction of LPCC and MFCC feature vectors, there are certain differences in values between frames. To avoid the impact of individual data spikes, normalization is performed before being used as input.
(2) Build a BP neural network model. LPCC is known to extract 12-dimensional and 24-dimensional eigenvalues with five sets of eigenvectors. Therefore, the number of input nodes is 60 or 120. Calculated according to Formula (18), the number of layers that determine the hidden layer is 12.
where is the number of neuron nodes in the input layer, is the number of neuron nodes in the output layer, a ∈ [1, 10].
During the training process, the weights and biases of each neuron are zero at the beginning, and the learning rate is 0.01. The BP neural network iterates repeatedly until the set training accuracy requirement reaches 0.001 or the maximum number of training iterations reaches 1000.
(3) Network training classification. A total of 300 sets of percussion sound signals are known to have been collected. In order to better train the model, the number of training sets is 240 groups, the remaining groups are used to test the classification effect of the model. Using the extracted feature vectors as inputs for training iterations, the classification effect of LPCC feature training in different dimensions is shown in Figure 18:
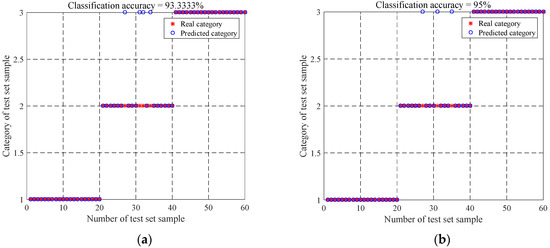
Figure 18.
Classification accuracy of LPCC features in different dimensions in BP neural networks. (a) 12-dimensional LPCC feature parameter classification accuracy; (b) 24-dimensional LPCC feature parameter classification accuracy.
When the 12-dimensional LPCC is used as input, the number of trainings reaches 1000. The mean square normalization error of the training set is 0.0127, and the multiple correlation coefficient is 0.97094. When the 24-dimensional LPCC is used as input, the mean square normalization error of the training set is 0.0162, and the multiple correlation coefficient is 0.96296. The multiple correlation coefficients of both are relatively close to 1, indicating that the training set can well identify the slot wedges in different states.
When comparing the accuracy rates in different dimensions, it is found that the 24-dimensional LPCC feature vector has a higher accuracy. In order to verify the classification effect of 24-dimensional feature vectors, the classification accuracy of MFCC feature parameters needs to be further verified.
When the 12-dimensional MFCC is used as input, the normalization error of the training set is 0.0025, and the multiple correlation coefficient is 0.9944. When the 24-dimensional MFCC is used as input, the mean square normalization error of the training set is 0.0009994, and the multiple correlation coefficient is 0.99775. This confirms that the training set has a good recognition effect.
As shown in Figure 19, the accuracy of the 24-dimensional MFCC feature vector is higher when comparing the accuracy rates in different dimensions.
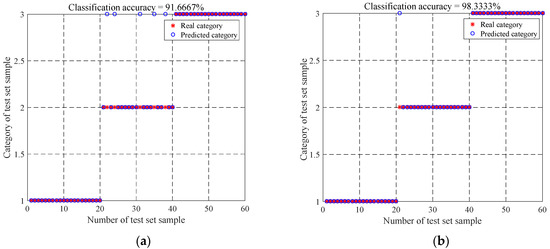
Figure 19.
Classification accuracy of MFCC features in BP neural networks in different dimensions. (a) 12-dimensional MFCC feature parameter classification accuracy; (b) 24-dimensional MFCC feature parameter classification accuracy.
As can be clearly seen from Table 5, the stator slot wedges trained in the fastened and loose states using the BP neural network can be accurately identified. When establishing a classification model of stator wedges in different states, the difference in shape variables between slightly tight and loose slot wedge models is small, which may be caused by operational errors. Under the same eigenvectors, the 24-dimensional eigenvectors showed good advantages, and the classification accuracy of the 24-dimensional MFCC reached 98.33%.
Table 5.
Classification accuracy of eigenvectors BP neural networks of different dimensions.
6. Conclusions
This study proposes a generator overhaul robot based on the orbital mechanism, which can simultaneously complete internal visualization and stator slot wedge tightness detection. Its advantages are as follows:
- The sliding tapping device is installed on the guide rail and moves faster. The sliding tapping device does not contact the surface of the stator and rotor, and it will not affect the detection results of the knocking sound. It can detect not only the stator under an offline state but also the rotor under an offline state, with wider applicability;
- Multiple sliding tapping devices can be installed on the guide rail at one time to detect the stator slot wedge faster;
- Compared with manual knocking on the stator slot wedge, the knocking force of our automatic knocking device is very stable, which ensures the stability of the inspection slot wedge state;
- Compared with the detection results of traditional manual identification and the detection robot slot wedge, this paper combines BP neural network to classify and to identify the tightness of the generator slot wedge, which identifies the tightness of the slot wedge faster.
Those effectively improve the overhaul efficiency of the generator. By analogy with the method of manual percussion slot wedge listening to sound judgment, the phonological characteristics of percussion sound signal are extracted. Then, combined with the BP neural network algorithm, the tightness of the stator slot wedge is classified. Experimental results show that the recognition accuracy of the eigenvector of the 24-dimensional MFCC reaches 98.33%. In this paper, the tightness of the stator slot wedge is introduced into the direction of mechanical fault diagnosis, combined with a variety of digital signal data processing methods. It provides a theoretical research basis for the detection of stator trough wedges of large hydroelectric generators.
Author Contributions
Conceptualization, X.X. and C.L.; methodology, X.X.; software, X.X.; validation, X.X., C.L., X.L. and W.C.; formal analysis, C.L.; investigation, X.X.; resources, X.X. and W.C.; data curation, C.L.; writing—original draft preparation, X.X.; writing—review and editing, X.X.; visualization, C.L. and W.C.; supervision, C.L. and X.L.; project administration, X.X. All authors have read and agreed to the published version of the manuscript.
Funding
This research was funded by the Natural Science Foundation of Hunan Province, (Grant No. 2022JJ30147), Features Extraction and Tracing of Unsteady Signals in Mechanical Systems.
Data Availability Statement
Not applicable.
Conflicts of Interest
The authors declare no conflict of interest.
References
- Hao, Y.; Wang, G.; Jia, Z.; Xie, H. Application of ultrasonic pulse-echo method to insulation condition diagnosis for large generators. IEEE Trans. Dielectr. Electr. Insul. 2005, 12, 104–113. [Google Scholar] [CrossRef]
- Peng, X.; Jia, Z.; Gao, S.; Wang, L.; Guan, Z.; Yang, J.; Wang, T. Laboratory Studies of a New Stator Slot Wedge Tester for HV Generators. IEEE Trans. Energy Convers. 2009, 24, 146–152. [Google Scholar] [CrossRef]
- Liese, M.; Brown, M. Design-dependent slot discharge and vibration sparking on high voltage windings. IEEE Trans. Dielectr. Electr. Insul. 2008, 15, 927–932. [Google Scholar] [CrossRef]
- Locke, D.H. Stator slot wedge testing of large pumped storage generator motors. In Proceedings of the 1998 First IEE/IMechE International Conference on Power Station Maintenance—Profitability through Reliability, Edinburgh, UK, 30 March–1 April 1998; pp. 190–195. [Google Scholar] [CrossRef]
- Jia, Z.; Gao, S.; Peng, X.; Wang, L.; Guan, Z.; Wang, T. A DSP based stator slot wedge tester for large generators. In Proceedings of the 2008 International Conference on Condition Monitoring and Diagnosis, Beijing, China, 21–24 April 2008; pp. 842–845. [Google Scholar] [CrossRef]
- Peng, X.; Jia, Z.; Gao, S.; Guan, Z.; Wang, L.; Wang, T. A new method for stator slot wedge testing of large generators. IEEE Trans. Dielectr. Electr. Insul. 2008, 15, 933–940. [Google Scholar] [CrossRef]
- Stone, G.C.; Sasic, M.; Dunn, D.; Culbert, I. Recent problems experienced with motor and generator windings. In Proceedings of the 2009 Record of Conference Papers—Industry Applications Society 56th Annual Petroleum and Chemical Industry Conference, Anaheim, CA, USA, 14–16 September 2009; pp. 1–9. [Google Scholar] [CrossRef]
- Wang, S.; Zhou, D. Operational Characteristics and Test of Insulation for Large Generators, 1st ed.; Water Resources and Electric Power Press: Beijing, China, 1992; pp. 65–67. [Google Scholar]
- Majstorović, N.; Andrić, M.; Mikluć, D. Entropy-based algorithm for speech recognition in noisy environment. In Proceedings of the 19th Telecommunications Forum (TELFOR) Proceedings of Papers, Belgrade, Serbia, 22–24 November 2011; pp. 667–670. [Google Scholar] [CrossRef]
- Lili, Z.; Jiahua, P.; Jihong, S.; Hongbo, Y.; Weilian, W. Research on Recognition of CHD Heart Sound Using MFCC and LPCC. J. Phys. Conf. Ser. 2019, 1169, 98–104. [Google Scholar] [CrossRef]
- Rumelhart David, E.; Hinton Geoffrey, E.; Williams Ronald, J. Learning representations by back-propagating errors. Nature 1986, 323, 533–536. [Google Scholar] [CrossRef]
Publisher’s Note: MDPI stays neutral with regard to jurisdictional claims in published maps and institutional affiliations. |
© 2022 by the authors. Licensee MDPI, Basel, Switzerland. This article is an open access article distributed under the terms and conditions of the Creative Commons Attribution (CC BY) license (https://creativecommons.org/licenses/by/4.0/).