Abstract
Ultrasonic fatigue testing is a key technology that is more efficient and energy saving compared to conventional fatigue testing. In order to investigate the behavior of metallic materials at ultra-high frequencies and to verify the validity of ultrasonic fatigue test results, this paper builds a test apparatus that can be used to conduct ultrasonic fatigue tests, and this paper proposes a complete procedure from theoretical analysis to the investigation of test laws for 20 kHz tensile and the compression test. Firstly, the initial sizes of the sample are calculated with an analytical method, then the three-dimensional model is simulated and optimized with finite element software, and the optimum result for the sample size is then obtained according to the sensitivity of the sample size to the effect of frequency. The next step is to analyze the influenced trend of the sample size, including L1, L2, L3, R1 and R2, on the resonant frequency and maximum stress of the sample. According to the optimized results, the sample was processed, and an ultrasonic fatigue test was carried out to ensure the sample fatigue fracture finally occurred. Finally, the S-N curve of the material was plotted based on the data recorded in the test and compared with the conventional fatigue life curve to verify the feasibility of the ultrasonic fatigue test device and test method. The fracture of the sample was observed using an optical microscope, and its macroscopic fracture morphology was analyzed. The fracture morphology of the sample can be divided into three typical zones: the fatigue crack source zone, the extension zone and the transient zone, where the fatigue cracks all originate from on the surface of the sample. The results demonstrate the validity of the ultrasonic fatigue test results and provide new ideas for the design and optimization of ultrasonic fatigue samples and shorter processing times, providing a reference for subsequent ultrasonic fatigue tests on typical materials.
1. Introduction
In recent years, with the rapid development of technology in aerospace, transportation, nuclear industry, machinery and other fields, some structural components bear high-frequency and low-amplitude vibration loads in the working process, and bear cyclic loads as high as 108~1011 cycles [1,2]. For example, aircraft engines generally operate at high speeds of tens of thousands of revolutions per minute and the blades in the engine are subjected to forces between 170 Hz and 2000 Hz; the axles of high-speed railway trains are subjected to 109 cycles of dynamic loads during an overhaul period (200 × 104 km); a gasoline engine operating at 3000 rpm is subjected to 8.5 × 10⁹ cycles of dynamic loads during its 15-year service life. This kind of vibration load is characterized by small stress amplitude, but high vibration frequency [3], which can reach thousands of Hertz [4]. The compound damage caused by high-frequency and low-amplitude loads superimposed with other loads will greatly accelerate the damage of structural components, and seriously threaten the safety and reliability of structural components. In conventional fatigue testing, it is difficult to guarantee the requirements of key technologies [5], such as long life and high reliability for large aircraft projects and key projects such as high-speed railways. There is an urgent need for the development and manufacture of test methods and reliable test equipment for low-amplitude and ultra-high cycle fatigue life testing of mechanical structures [6].
Conventional fatigue testing techniques to simulate mechanical damage to materials in excess of 107 cycles are time-consuming, costly and even impossible. In contrast, ultrasonic fatigue testing is fast, efficient and consistent with the real forces on the component. Ultrasonic frequencies can reach tens of thousands of Hertz per second [7], and using a 20 kHz ultrasonic vibration fatigue test machine can save time compared to conventional methods, and can study the fatigue life range from millions to billions of times. For example, it takes 10 h to perform a 106-cycle fatigue test on a 30 Hz conventional fatigue testing machine, but less than 1 min on a 20 kHz ultrasonic vibration fatigue testing machine. It takes 11 years to perform a 1010 cycle fatigue test with a conventional fatigue testing machine, but only 6 days with a 20 kHz ultrasonic vibration fatigue test machine [5]. Conventional fatigue testing machine can only extend the fatigue life to 106 cycles, whereas with a 20 kHz ultrasonic vibration fatigue testing machine, the fatigue life can be extended to 1010 cycles. At the same time, the ultrasonic fatigue test method saves energy compared to conventional fatigue test techniques due to the shorter test time and the relatively low power requirement of the resonance system.
The core of the ultrasonic fatigue testing machine is the resonant system, which consists of the transducer, the amplitude transformer and the sample. The entire system is required to work in a resonant state during the fatigue test. The first ultrasonic fatigue testing machine was reported in 1950, designed by Dr. Masion. Professor Stanzl’s laboratory in Austria [8], Professor Bathias’ research team in France [9] and Professor Puskar’s research team in Slovakia [10] are industry leaders who have obtained great progress in the manufacture and related experiments of ultrasonic fatigue testing machines. The ultrasonic fatigue testing machines developed by these teams, although varying in structure, all contain the following basic units [11]: generators, transducers, amplitude transformers and the sample. Additionally, these units need to be designed according to fatigue test loads and resonant frequencies. In addition, there are control, detection and recording systems. The USF-2000 ultrasonic fatigue test machine, produced by Shimadzu Scientific Company, can test a wide range of materials [12]. The ultrasonic fatigue experimental system developed by the research team at the University of Kaiserslautern in Germany was used to study the ultra-high cycle fatigue life of Ti6A4V, with an amplitude of up to 55 μm.
At present, many scholars put their research direction on the realization of tensile, compression, bending [13], torsion [14,15] and other functions [16,17] of the testing machine, but the whole process of the test is not involved, and the research on the sample design mostly stays in the simulation analysis stage [18], and the optimization design of the sample is rarely touched. This paper starts with the composition of ultrasonic fatigue equipment, and designs the sample based on the one-dimensional vibration differential equation. The geometric size of the sample was calculated by the mathematical analytical method [19], and the stress state of the sample was analyzed by finite element software. The modal analysis and harmonious response analysis of the sample were carried out. The tensile and compression vibration characteristics of the sample were theoretically clarified, and the optimum design method for the sample size was obtained, and the influence trend of the sample size on frequency and stress was analyzed. The fatigue life of the ultra-high cycle axial tension and compression samples was predicted, and the S-N curve was compared with the conventional S-N curve. The fracture morphology of ultrasonic tension and compression samples was analyzed, and the initiation and extension modes of ultra-high cycle fatigue cracks were described.
2. Test Equipment and Test Sample
2.1. Test Principle
The ultrasonic vibration control system, sample and ultrasonic fatigue test equipment constitute a mechanical vibration system [20]. The loading of the sample is realized by the resonance of the sample excited by the external signal, and the resonant wave is generated in the sample [21]. Taking the symmetric tension and compression test as an example, one end of the sample is fixed at the end of the amplitude transformer, and the other end is free. The external force at the free end of the sample is zero. In order to satisfy the resonance condition, the displacement of the middle section of the sample is required to be zero. According to the symmetry condition, when the sample meets the resonance condition, the resonant wave is generated in the sample, and the longitudinal displacement and stress (strain) fields are established along the axial direction of the sample. At this point, the displacement of the middle section of the sample is zero and the stress is maximum, and the stress at both ends of the sample is zero, and the displacement is maximum. When the resonance occurs, the displacement and stress curves along the length direction of the sample are shown in Figure 1.
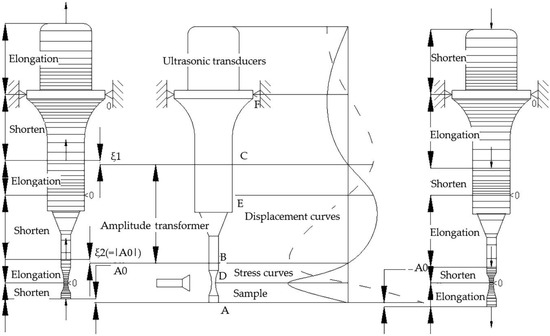
Figure 1.
Resonance test system and displacement-stress curve.
Figure 1 shows an ultrasound resonance system totaling one and a half wavelengths with a displacement of 90° ahead of the stress. There are three displacement nodes D, E and F (maximum stress and zero displacements), and three stress nodes A, B and C (zero stress and maximum displacement) in the vibration direction of the whole system. The ultrasonic fatigue test system consists of a transducer, an amplitude transformer and a sample, which is a unified whole, and a resonant system with a total of one and a half wavelengths is formed by rational design. The transducer, the amplitude transformer and the sample vibrate with their own amplitude, respectively, but the overall goal is that when the sample resonates, the length of the sample is half a wavelength [22], with the maximum strain in the middle, and with the maximum strain level in accordance with Hooke’s Law, where the displacement is zero; the sample has maximum displacement at both endpoints, but has zero stress. For installation purposes, the fixed position displacement of the vibration system is generally zero. Displacement and stress nodes for the above systems can be obtained through rational design and correct calculations. The calculation method can be analytical, for more complex systems, a finite element method is more appropriate.
2.2. Test Equipment
Although ultrasonic fatigue testing has been carried out for many years, there is currently no uniform test specification. Research teams in various countries carry out ultrasonic fatigue tests. Although the resonance systems built are slightly different in individual structures, the ultrasonic fatigue resonance systems built are generally similar with basically the same core components. The ultrasonic fatigue test system proposed by the research institutes consists of an ultrasonic generator to provide the test frequency, an ultrasonic transducer [23] to convert the electrical signal into a mechanical vibration signal, an ultrasonic amplitude transformer to amplify the displacement amplitude, test samples (tensile, bending and torsion samples) and an electronic measurement and control system (computer control system, laser displacement transducer, non-contact infrared thermometer and cooling system) [24]. This paper selects a suitable ultrasonic generator and electronic measurement and control system, calculates and designs the transducer, amplitude transformer and test samples to meet the test requirements, and builds a resonant system with a 20 kHz resonance frequency. The ultrasonic fatigue test frequency (20 kHz) far exceeds the conventional fatigue test frequency (less than 300 Hz), greatly reducing the fatigue test time and enabling rapid completion of material fatigue tests. However, due to the significantly increased test frequency, strict design requirements are placed on the structural dimensions and mounting of the ultrasonic sample in order to meet the system’s resonance conditions. The schematic diagram of the ultrasonic fatigue test system and the actual test machine are shown in Figure 2.
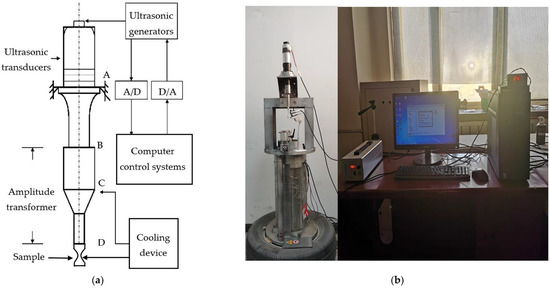
Figure 2.
Ultrasonic fatigue test system (a) Schematic diagram of ultrasonic fatigue system; (b) actual test machine.
- (1)
- Ultrasonic generator
The function of an ultrasonic generator is to convert electrical signals into ultrasonic signals, that is, to convert the low-frequency sinusoidal 50 Hz alternating current into a 20 kHz high-frequency alternating current. In ultrasonic fatigue testing, the amplitude of the output amplitude at the end of the sample can be changed by adjusting the ultrasonic generator input power, thus, achieving the purpose of controlling the stress amplitude in the middle section of the sample. The TJS-3000 intelligent CNC ultrasonic generator V6.0 used in this test can output frequencies from 19 kHz to 21 kHz and power from 100 W (10%) to 1000 W (100%).
- (2)
- Ultrasonic transducer
The ultrasonic transducer converts the 20 kHz high-frequency electrical signal from the ultrasonic generator into a mechanical vibration signal. The amplitude of the end output of the ultrasonic transducer can be controlled by varying the input power of the ultrasonic generator. The 2-2000CS series ultrasonic transducer from FUNSONIC was used for this experiment.
- (3)
- Ultrasonic amplitude transformer
In this paper, the amplitude transformer produced by Sunsonic ultrasonic company was used to build the test system to gather the energy. It was necessary to amplify the output amplitude of the end of the ultrasonic transducer by means of an ultrasonic amplitude transformer, so that the sample could obtain a larger displacement and stress amplitude to meet the test requirements.
- (4)
- Ultrasonic sample
The sample was not only a component of the ultrasonic vibration system, but also a working object and load of the working system. Its special feature is that it forms a complete ultrasonic vibration system with the transducer and the amplitude transformer, which is driven and monitored by the ultrasonic generator until the properties of the material are changed. However, as a sample, it is entirely possible for the properties of the material to change as the test proceeds, thus, changing the resonance conditions of the vibration system during the test. Therefore, one of the important tasks of the ultrasonic fatigue test is to timely detect and meet the resonance conditions, and timely judge the mechanical properties of the sample.
- (5)
- Electronic measurement and control system
The electronic measurement and control systems were composed of a laser displacement sensor, a non-contact temperature sensor and a computer control system. In order to meet the requirements of the resonance test and obtain accurate test results, it was necessary to use a laser displacement sensor to monitor the amplitude of the sample end in real-time, so as to achieve the purpose of monitoring the stress in the middle of the sample. The laser displacement sensor chosen for this test was LK-H020 with a sampling period of 2.55 μs; a non-contact temperature sensor was used to monitor the temperature of the sample, and stop the test immediately when the sample overheats. For this test, the infrared thermometer sensor SA50AS-SA50ASF and the intelligent display controller were chosen to implement the temperature detection; the computer was used to collect and record the test data to draw the S-N curve of materials.
2.3. Test Sample Design
The ultrasonic fatigue sample is the end element of the high-frequency resonant system and is also the load of the resonant system [25]. The performance of the sample in the ultrasonic fatigue test will directly influence the final evaluation of the high-frequency fatigue properties of the sample material. Therefore, the dimensional structure of the sample and its mechanical performance in the resonant system requires special attention. According to the one-dimensional differential equation of vibration, the known resonance frequency and the mechanical properties of the sample, the size of the sample can be preliminarily calculated [26]. Simulation analysis [27,28,29] of the sample model to derive its intrinsic frequency and stress in the middle section was performed by optimizing the design and fine-tuning the dimensions of the sample. It is possible to ensure that the sample meets the high-frequency resonance conditions and that the stress level in the middle section is such that fatigue damage occurs, thus, ensuring that the high-frequency fatigue test is carried out successfully.
From the composition of the aforementioned ultrasonic fatigue test devices, the sample needs to be screwed into the amplitude transformer to complete the clamping, thus, the rod-shaped samples can meet the requirements. For an equal cross-section bar sample, although it is easy to process, its vibration load is dispersed and lacks a stress concentration area, making it difficult for the sample to achieve the requirements to produce fatigue damage. Thus, samples are often designed with variable cross-sectional shapes in ultrasonic fatigue testing to increase the stress level in this region by reducing the cross-sectional area of the middle section of the sample. As shown in Figure 3, a variable-section sample can be divided into an hourglass-shaped sample and a dog-bone-shaped sample according to the presence or absence of equal-diameter areas in the middle section of the sample.
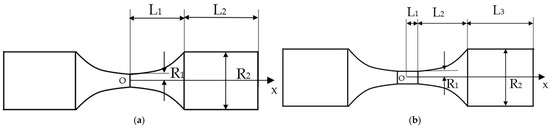
Figure 3.
The variable-section sample: (a) The hourglass-shaped sample; (b) the dog-bone-shaped sample.
Although the shape of the hourglass sample is simple and easy to process, there are certain limitations. The effective test zone (the area where fatigue fracture occurs during the test to obtain reliable and valid fatigue data) [30] of the hourglass sample is only the middle section at the maximum stress, and the stress variation on both sides is more obvious at the maximum stress section. It can be seen from the numerical analysis that the stresses in the middle section of the dog-bone-shaped sample vary very little, and it can be said that the stresses in this section are almost always at the maximum stress level, therefore, this whole section is an effective test zone. In this paper, the dog-bone-shaped sample was used as an example for analysis.
The dog-bone-shaped sample belongs to the long rod type axisymmetric structure, theoretically there is only axial vibration displacement [31,32]. The axial direction of the sample is taken as the X axis to establish the coordinate system, and the right half of the sample is selected for analysis. According to the vibration theory, the one-dimensional longitudinal vibration fluctuation equation of the sample is:
where S(x) is the cross-sectional area of the sample at x; u(x,t) is the vibration displacement at x at moment t; ρ is the material density; Ed is the Young’s modulus.
The distribution of the cross-sectional area along the axial direction of the sample is:
where S1(x) is the cross-sectional area of the intermediate equal section; S2(x) is the cross-sectional area of the variable section and S3(x) is the end cylindrical cross-sectional area, and
the fluctuation equation for each partial segment is then simplified to
The equation for the vibration displacement of the sample can be obtained as:
where
combined with the displacement distribution, the stress distribution function can be found according to
and
the displacement stress coefficient
CS is proportional to the constant M, the magnitude of M reflects the magnitude of the stress amplification level, and the resonant length L3 equation is obtained analytically by:
At this time, the stress amplification factor of sample is:
3. Simulation and Testing
3.1. Initial Sizing and Simulation of Test Sample
The method in the previous section can be used to carry out preliminary analytical calculations of the dimensional parameters of the test sample. According to the requirements of the ultrasonic fatigue test, combined with the actual application of the material in the engineering conditions, this paper selected 6063-aluminum alloy as the material for the production of samples. The ultrasonic fatigue resonance test system cyclic stress loading frequency of 20 kHz, and the mechanical properties of 6063-aluminum alloy are shown in Table 1.

Table 1.
Mechanical properties of 6063-aluminum alloy.
Using software, such as MATLAB R2019b, a commercial mathematics software from MathWorks in USA, the relevant dimensional parameters for the above material sample can be derived as shown in Table 2.
Table 2.
Dimension parameters of a 6063-aluminum dog-bone-shaped alloy sample.
According to the above calculated dimensions, the dog-bone-shaped sample is modeled using software, as shown in Figure 4.
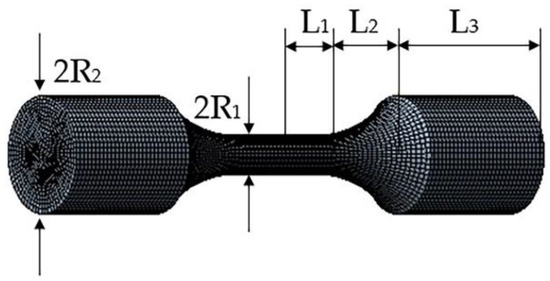
Figure 4.
Simulation model of the dog-bone-shaped sample.
In actual machining, however, one end of the sample needs to be machined with external threads, receding grooves, spanner flats and other structures, as the sample is screwed to the amplitude transformer. The presence of the above machining details inevitably has an effect on the intrinsic frequency of the test sample. Therefore, after the analytical calculation of the sample, the actual machined shape needs to be modeled and simulated to determine whether the resonance conditions can be met, and whether fatigue damage can occur at the stress level to which the sample is subjected. If the design size does not meet the resonant fatigue test requirements, the results should be optimized. In addition, by correlating the dimensional parameters of the sample with its intrinsic frequency and central stress amplitude in an optimized design, the sensitivity of each dimension of the sample to the design results can be investigated, thus, providing a reference for the machining accuracy and dimensional deviation range of the sample.
After modeling the actual machined dog-bone-shaped sample, the model is imported into Workbench for modal analysis and harmonious response analysis. The results are shown in Figure 5.
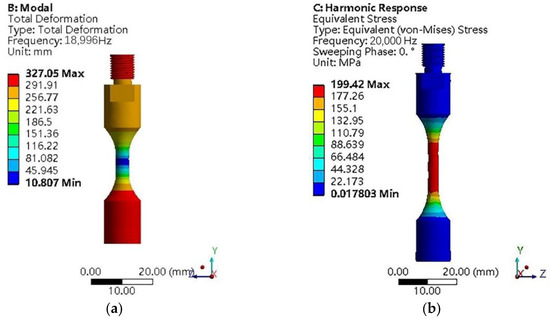
Figure 5.
Finite element analysis results of an actual machined dog-bone-shaped sample: (a) Modal analysis; (b) harmonious response analysis.
Figure 5a shows that the modal frequency of the sample at this time is 18,996 Hz when meeting the longitudinal vibration, which is too far from the test requirement of 20,000 Hz. In Figure 5b, the maximum stress in the middle of the sample is 187.79 MPa. As the sample material is a 6063-aluminum alloy, its strength limit is σb = 412 MPa. For harmonic response vibration, the type of stress needed is a symmetrical cycle with a cyclic characteristic of r = −1, which belongs to the category of dynamic loading. For fatigue damage to occur in the middle section of the sample, the value of the stress acting on it must be greater than the material’s endurance limit. For the same material, the endurance limit σ−1 under symmetrical cyclic alternating stresses is much lower than the strength limit σb under static loading. For an aluminum alloy material, tension and compression tests are:
Since both the test device and the sample are placed vertically, so the vibration is also transmitted vertically in the sample, and the stress of each point on any cross-section of the sample is nearly the same, that is, when the stress in the middle of the sample reaches 142.17 MPa, fatigue failure will occur in the sample.
The stress amplitude in the middle of the sample is 187.79 MPa; it is higher than the conditional fatigue strength of the 6063-aluminum alloy, so it meets the stress conditions for fatigue damage to occur, but the sample still needs to be optimized to meet the frequency requirements of the resonance conditions, and needs to ensure that the stress in the middle of the optimized sample is still higher than its conditional fatigue strength.
3.2. Finite Element Optimization of Test Sample
The sample design is optimized using Workbench’s built-in target-driven optimization method to obtain the optimum sample size from the sample set according to the target set by the parameters. The main optimization objectives were to adjust the sample size to achieve a resonant frequency of 20 kHz and to ensure that the maximum stress in the sample met the test requirements. The flow of the optimization design is shown in Figure 6.
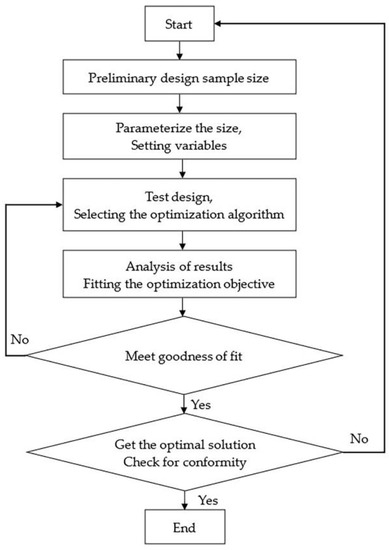
Figure 6.
Flow chart for sample optimization design.
The dimensions L1, L2, L3, R1 and R2 of the sample simulation model as shown in Figure 7 are parameterized and set as the independent variables for optimization. The test resonant frequency and the maximum stress in the middle of the sample are set as the dependent variables for optimization, and the optimization conditions are set to a frequency close to 20 kHz and a maximum stress in the sample greater than 142.17 MPa.
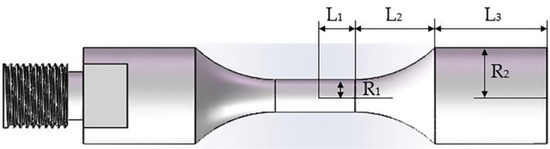
Figure 7.
Dimensioned drawing of the sample simulation model.
Prior to optimizing the design, a design of experiments for the design variables is required to establish sample points. The main objective of the experimental design is to obtain the most comprehensive experimental results possible with the least amount of numerical computation. The construction of the test points has a direct impact on the accuracy required for the solution. The central combination test was conducted between 5 groups of independent variables and 2 groups of dependent variables, and a total of 25 groups of data were obtained, as shown in Table 3.
Table 3.
Table of the range of variation of the dimensional parameters of the sample.
After completing the combination test, a response surface fit is required. The response surface is an approximation function of the actual structural response. A standard second-order response surface was used for this test, and its goodness of fit can be visually displayed by the scatter plot shown in Figure 8, with the vertical axis showing the predicted values of the response surface and the horizontal axis representing the calculated value of the design point. To check the quality of the fit, the response surface can be evaluated by inserting verification points. The verification point is different from the point on the response surface. It is the actual value obtained after calculation and is calculated separately after the calculation of the response surface. Generally, setting the number of verification points to three can be used to verify the fitting of the response surface. In the properties of the response surface, click on the checkbox “Generate Verification Points” and specify the number of verification points as three. This will automatically generate verification points when the response surface is calculated. If the prediction is good, then the scatter points are approximately the 45° line. If there are more points that deviate from the 45° line, the response surface is of poor quality. The fit is good as the scatter points in Figure 8 are largely on the 45° line and the three verification points are also near the line, within the margin of error allowed.
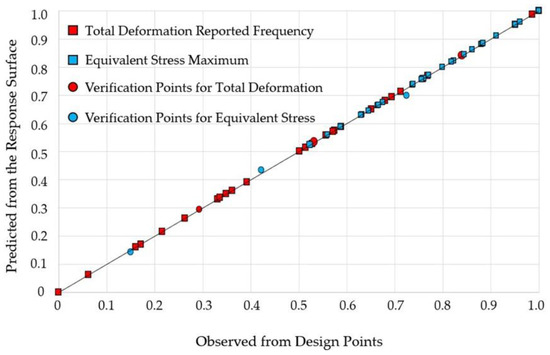
Figure 8.
The fitting curve of the test results.
Once a good fit response surface has been obtained, a full range of design exploration can be carried out using various graphing tools. For example, response charts and local sensitivities can be viewed. A response chart is a curved display of an approximated response function. In a two-dimensional response plot, it is possible to view a curve of the variation of any output parameter with respect to an input parameter. As shown in Figure 9, the curves represent the trend of the effect of changes in the sample size of the resonant frequency and maximum stress. For resonant frequency, L1, L2, L3 and R2 are negatively related to it, and R1 is positively related to it. Additionally, for the maximum stress, L1, L2, L3 and R1 are negatively related to it, and R2 is positively related to it. In addition, in terms of the rate at which the curve rises or falls, L1, L2 and L3 affect frequency and stress to a lesser extent, while R1 and R2 affect them to a greater extent. The next step is to combine the local sensitivity diagrams and set the optimization conditions to arrive at the optimal results.
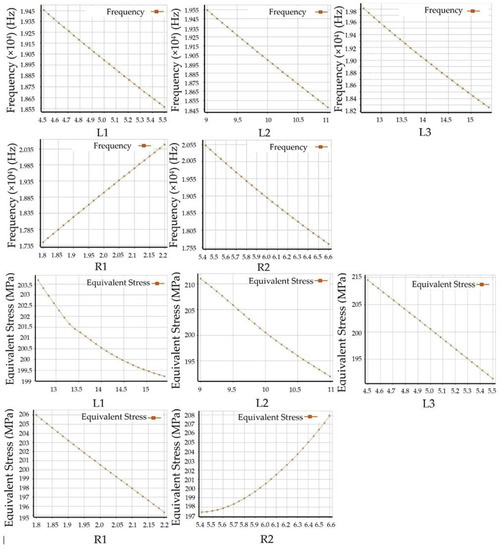
Figure 9.
The influence trend diagram of sample size parameters on the design results.
Figure 10 shows the sensitivity of the various sizes of the samples to the design results. Both the intrinsic frequency of the sample and the maximum stress value of the middle segment have severe effects due to the fluctuation of R1 and R2. In order to avoid the influence due to this situation, in the actual processing of the sample, R1 and R2 should be paid more attention, while the deviations of L1, L2 and L3 and the relative surface roughness requirements can be appropriately relaxed.
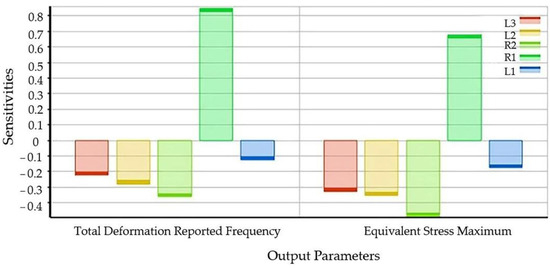
Figure 10.
Sensitivity diagram of sample size to analysis results.
The sample’s intrinsic frequency range was set to 19.99 kHz < f < 20.01 kHz, and the maximum stress in the middle of the sample was set to σmax > 142.17 MPa. After comparing the optimization results of different algorithms, the “Screening” method was finally selected. Based on the above two constraints, the optimum design simulation gives three sets of optimal solutions, as shown in Table 4. According to the calculation results, the inherent frequencies and stress levels corresponding to the three groups of sample sizes can meet the resonance conditions and fatigue test requirements.
Table 4.
Table of optimal solutions for sample size.
In order to reduce errors, the average value of the three sets of data in the above table is taken as the machine size of the sample. The dimensions of the optimized sample were fine-tuned to take into account the actual machining of the sample, and the dimensions obtained from the above analysis were kept to one decimal place to reduce the machining accuracy. Therefore, the value of the actual machined sample can be: L1 = 5.1 mm, L2 = 10.5 mm, L3 = 12.7 mm, R1 = 2.1 mm, R2 = 5.6 mm. The model was remodeled with the optimized dimensions and imported into Workbench for verification. The resonant frequency of the sample in axial tension and compression was found to be 20,087 Hz, as shown in Figure 11a, which meets the required frequency for the test. The maximum stress of 195.7 MPa > 142.17 MPa obtained from the harmonic response analysis under the applied 30 μm displacement condition is shown in Figure 11b, which meets the stress requirement for fatigue fracture of the sample in the ultrasonic fatigue tensile test.
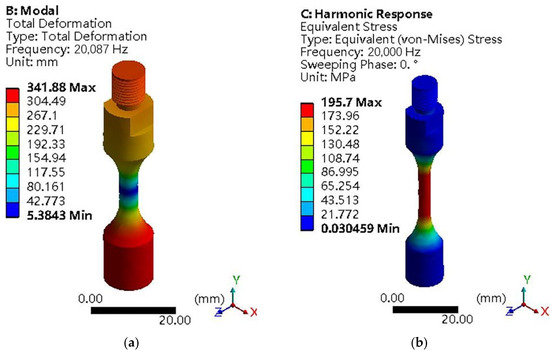
Figure 11.
Finite element analysis results of the optimized sample: (a) Modal analysis; (b) harmonious response analysis.
3.3. Test Procedure
The vibration characteristics of the ultrasonic fatigue test system built according to the resonance theory and the optimized sample were investigated to verify the feasibility of the resonance fatigue test system and the correctness of the simulation and optimization design method of the sample; high-frequency fatigue tests were carried out on 6063-aluminum alloy samples, and the simulation analysis results were analyzed with the test data to verify the feasibility of the design of the high-frequency fatigue test system, based on the observation of the fracture morphology of the sample. The characteristics and laws of fatigue crack generation and expansion are provided. The general flow of ultrasonic fatigue testing from test development to result processing was sorted out to provide a theoretical basis for the subsequent advancement of high-frequency fatigue testing.
The steps of the test are shown in Figure 12. In addition, ultrasonic fatigue testing was generally carried out in the following steps:
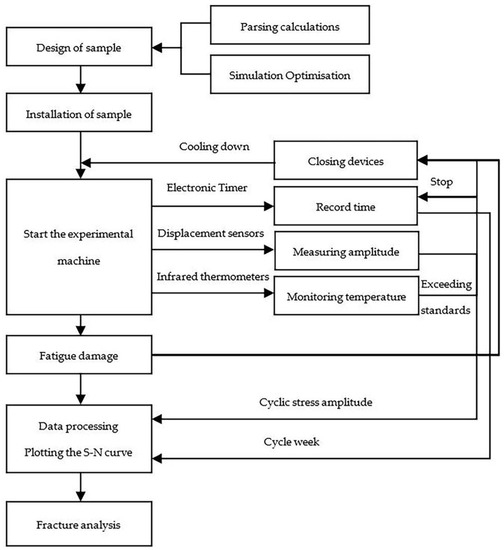
Figure 12.
Flow chart for ultrasonic fatigue testing.
As shown in Figure 13, one end of the sample was screwed to the end of the amplitude transformer and the other end was suspended so that the sample had a cyclic characteristic value of r = −1 under high-frequency fatigue loading. The output frequency of the ultrasonic generator was set to 20 kHz, thus, satisfying the resonance conditions of the test system. The power of the generator can be adjusted in the range of 30–70% to perform ultrasonic fatigue tests on samples based on different stress amplitudes. During the test, the displacement amplitude at the end of the sample was collected and recorded by using a laser displacement sensor. At the same time, in order to avoid deviations in the test results due to heat generation from deformation, the temperature of the middle section of the sample needed to be monitored in real-time (to ensure accurate temperature measurement by the infrared temperature sensor, the sample needed to be painted before installation). A temperature threshold of 50 °C was set for the ambient temperature test, and the test was automatically stopped once the limit was exceeded, and the test sample cooled down before resuming cyclic loading. The above intermittent loading pattern was repeated until fatigue damage occurred, and the end of the sample fell off, at which point the test was immediately stopped and the cyclic loading time shown on the timer was recorded. Based on the cyclic loading time and vibration frequency, the fatigue life N of the sample can be calculated; based on the measured end amplitude of the sample, the stress amplitude S in the middle section of the sample can be found using Equation (11), and then the S-N curve of the sample material under high-frequency loading conditions can be plotted.
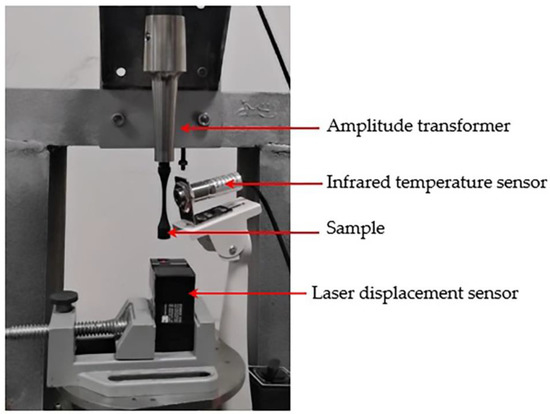
Figure 13.
Installation of ultrasonic fatigue test equipment.
After completing the installation of the sample, the equipment was operated via the computer control system. The interface of the control system is shown in Figure 14a. By clicking on the ‘Turn on ultrasonic output’ button, the ultrasonic generator starts to work, and the displacement sensor and infrared sensor are activated at the same time. Then click on the “ Turn off ultrasonic output” button to stop the test, then click on the “ Stop saving data” button to stop the data recording and export the data in a CSV format, as shown in Figure 14b. The first column is the test sample, the second column is the test temperature and the third column is the test frequency.
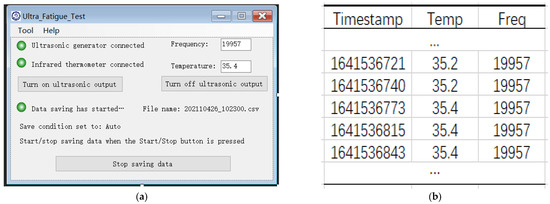
Figure 14.
Computer control system: (a) Control system interface; (b) screenshot of test data.
The ultrasonic generator was adjusted by increasing the output power by 5% at a time within the range of 30–70% to vary the maximum stress in the middle of the sample, and the displacement amplitude of the sample was measured at the end of the sample. The laser sensor has a sampling period of 2.55 μs, and the recorded displacement image is enlarged as shown in Figure 15. Since the difference between the crest and trough is not constant, the time-domain image needs to be processed.
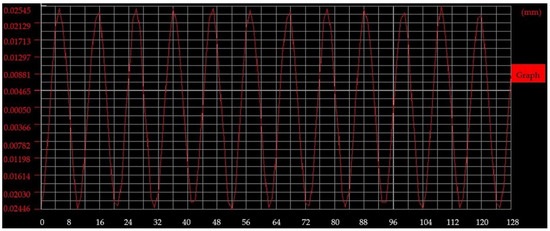
Figure 15.
Data recorded by the laser sensor.
Through the computer program, the collected data points are processed, first removing the influence of the DC component, and then converting the time domain waveform into an amplitude-frequency spectrogram through the fast Fourier transform. The end amplitude of the sample can be obtained, and the frequency domain image after processing is shown in Figure 16.
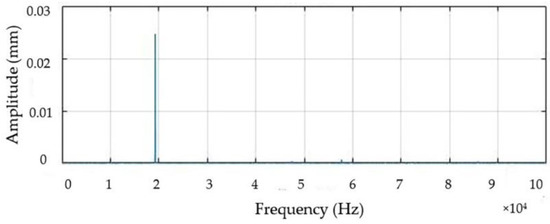
Figure 16.
Frequency domain diagram obtained after fast Fourier transform.
Twenty-seven identical samples of 6063-aluminum alloy were divided into nine groups, each containing three samples. Ultrasonic fatigue tests were carried out at a resonant frequency of 20 kHz, and the data from each group were averaged over the three samples to reduce the test error. The test results are shown in Table 5.
Table 5.
Data from 20 kHz ultrasonic fatigue test on 6063-aluminum alloy.
4. Analysis of Results
4.1. Fatigue Life Analysis of Sample
The fatigue life curve of the sample is plotted according to the data in Table 5, as shown in Figure 17. The red curve is plotted from the ultrasonic fatigue test data of the 6063 aluminum alloy sample, and the black curve is plotted from the conventional high-cycle fatigue test [33]. From the trend, both curves are of a continuous decreasing type, and the nature of the fatigue failure of the material does not change significantly due to the increase in load frequency, thus, confirming the feasibility of the high-frequency resonance fatigue test system built in this paper.
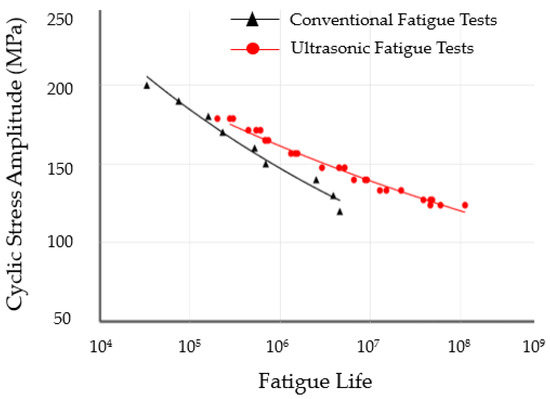
Figure 17.
S-N curves of 6063 samples at different frequencies.
However, the shape of the curve shows that the S-N curve of the sample material based on the high-frequency fatigue test data decreases at a lower rate than its S-N curve based on the low-frequency fatigue test data, so it can be concluded that the loading frequency of the cyclic stress has an effect on the fatigue failure pattern of the material.
The effect of high-frequency cyclic loading on its fatigue properties can be divided into two aspects. On the one hand, under the action of the approximate numerical stress amplitude, the fatigue crack expansion rate to the critical size is lower than that of the low-frequency fatigue test due to the poor fatigue damage accumulation effect caused by the high-frequency cyclic loading, and the macroscopic performance of the sample is higher than its low-frequency fatigue life. On the other hand, when the fatigue life of the samples is approximated, the stress amplitude of the samples subjected to a high-frequency fatigue test is higher than that of a low-frequency fatigue test. This is also due to the insufficient accumulation of fatigue damage of samples in the high-frequency fatigue test, which leads to the samples in the high-frequency fatigue test being able to withstand higher stress amplitudes under the same fatigue crack growth rate, namely under the same fatigue life.
The effect of loading frequency on the material fatigue S-N curve depends on the frequency effect of the material, which is reflected by the change in strain rate. The sensitivity of different metallic materials to loading frequency and strain rate varies [34]. It is generally accepted that if a material exhibits cyclic hardening, there is no frequency effect; conversely, there is a frequency effect. The effect of load frequency on the fatigue properties of a material in ultrasonic fatigue testing can be corrected with an ultrasonic loading frequency correction factor to make the results more reliable [35].
4.2. Fracture Morphology Analysis of Sample
The fracture of the 6063-aluminum alloy sample was not flat, as shown in Figure 18, and the fracture near the crack sprout was at an approximate 45° oblique angle to the axis of the sample, so it can be judged that the crack extension of the 6063-aluminum alloy sample was carried out in a shear manner. The two parts of the sample could be accurately snapped together after fracture, and no necking was seen at the fractured joint, proving that no significant plastic deformation occurred in the sample during the high-frequency fatigue test.
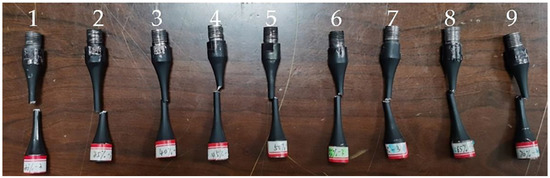
Figure 18.
Sample fractured after test.
The fracture morphology of the third and seventh groups of samples was observed under a microscope, and the fracture morphology is shown in Figure 19. The crack source zone, crack expansion zone and transient zone [36] are arranged in a fan shape and expanded in a radial pattern [37]. In addition, the second and seventh groups were observed under a microscope. It can be observed that the crack source zone and crack expansion zone of the test sample can exist in an obvious stepped distribution, as shown in Figure 20. This is due to the longer cycle time experienced by the fatigue crack in the expansion zone, resulting in a larger expansion zone, and the repeated tearing and squeezing between the two sections of the material during crack expansion, resulting in the formation of more step-like bumps. Additionally, for high cycle fatigue life samples, the fatigue cracks expand in a single shear. For ultra-high cycle life fatigue samples, the fatigue cracks expand in a double shear. The morphologies of the first and third sets of samples are shown in Figure 21.
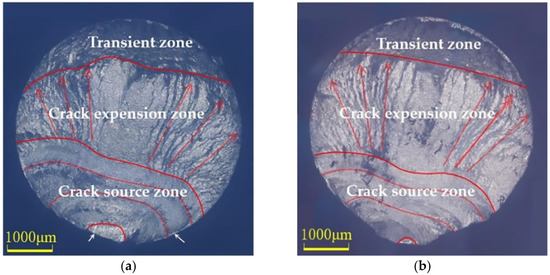
Figure 19.
Fracture morphology of 6063-aluminum alloy samples with different powers. (a) The third set of test pieces, test power = 45%; (b) the eighth set of test pieces, test power = 60%.
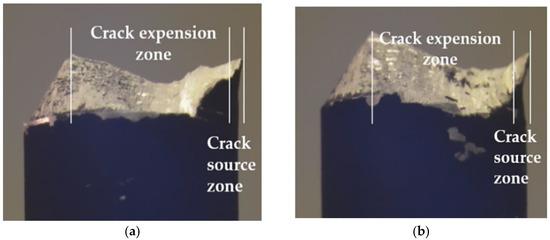
Figure 20.
Section morphology of 6063-aluminum alloy samples with different powers (a) The second set of test pieces, test power = 40%; (b) the seventh set of test pieces, test power = 55%.
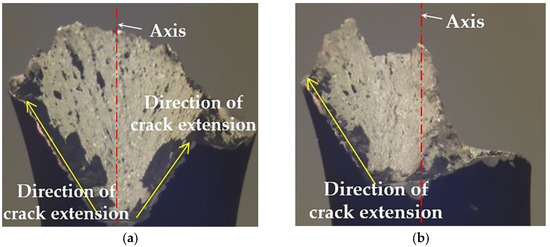
Figure 21.
Direction of crack expansion in aluminum alloy samples with different powers (a) The first set of test pieces, test power = 30%; (b) the third set of test pieces, test power = 45%.
The reason for the high cycle fatigue cracking of 6063-aluminum alloy samples from the surface of the samples can be explained by the preparation process of the sample material. The 6063-aluminum alloy parent material is mostly rolled or forged, with good metallographic organization and few pores, impurities or coarse grains that can be used as internal defects, which weakens the tendency of fatigue cracking from internal defects under the action of ultra-high cycle stress. Therefore, the sample is more sensitive to the surface quality of the material. Fatigue cracks are mostly located at the surface defects of the sample, and the fracture morphology is similar to that of low circumferential fatigue fractures. In addition, the fracture of the sample after the fracture shows that the fracture is located at the variable section near the thread side, which is also due to the sensitivity of the aluminum alloy sample to its surface quality. The complex processing angle of the variable section makes it difficult to guarantee the surface quality, and is prone to machining defects, such as tool scratches; at the same time, repeated clamping is required near the threaded end of the sample, which also leaves dents and causes stress concentrations. These two points are the reasons why the fracture location of the aluminum alloy sample is close to the threaded end and does not correspond to the stress concentration obtained from the simulation analysis.
5. Conclusions
Low amplitude and high-frequency cyclic stress are very typical service conditions in engineering. In order to investigate the fatigue performance of typical service parts, it is necessary to conduct ultrasonic fatigue tests to verify the fatigue performance of materials. This paper completes the analysis of the system composition of each part of the test machine, the calculation of the resonant fatigue sample size and simulation optimization analysis, as well as the analysis of the ultrasonic fatigue test process for material samples, which are summarized as follows.
The five major components of the ultrasonic fatigue experimental device are clarified, including an ultrasonic generator to provide the test frequency, an ultrasonic transducer to convert the electrical signal into a mechanical vibration signal, an ultrasonic amplitude transformer to amplify the displacement amplitude, test samples and an electronic measurement and control system. The design and development of a 20 kHz ultrasonic fatigue test equipment have laid the foundation for ultrasonic fatigue testing.
According to the one-dimensional longitudinal vibration equation, the dimensional calculation of the resonant fatigue sample was completed, and Workbench was used to carry out simulation analysis and optimize the design. The trend of the effect of the sample size on frequency and stress was obtained as follows: frequency increases with L1, L2, L3 and R2 and decreases with R1; maximum stress decreases with L1, L2, L3 and R1 and decreases with R2. Based on the trend and sensitivity of each dimensional parameter on the intrinsic frequency and maximum stress of the sample, the deviation range was determined to reduce the processing difficulty.
Fatigue tests were carried out on 6063 aluminum alloy samples at high frequencies, and it was found that fatigue fracture still occurred in the ultra-high circle range of 6063 aluminum alloy. The fatigue life curves of the samples from the ultrasonic fatigue tests showed the same decreasing trend as the conventional fatigue life curves, indicating that the nature of fatigue failure of the material did not change significantly due to the increase in load frequency, thus, confirming the feasibility of the high-frequency resonance fatigue test system built in this paper.
The fracture morphology of the samples revealed that the fatigue crack extension of aluminum alloy 6063 proceeded in a shear manner and exhibited a crack surface sprouting mechanism. The fatigue source zone of aluminum alloy 6063 is smooth and flat, and there is a clear step between the fatigue source zone and the crack expansion zone.
In the selection of materials for parts in service under similar conditions, the fatigue tests described above can be carried out to select materials based on their fatigue performance parameters, while the fatigue life of the material can be extended by applying the appropriate process for the fatigue failure mechanism.
Author Contributions
Methodology, N.F. and J.G.; conceptualization, N.F.; formal analysis, J.Y.; writing—original draft preparation, Q.L.; writing—review and editing, X.W.; supervision, X.Z. All authors have read and agreed to the published version of the manuscript.
Funding
This study was supported by the Science and Technology Development Plan, projects of Jilin Province under grant no. 20190201020JC.
Institutional Review Board Statement
Not applicable.
Informed Consent Statement
Not applicable.
Data Availability Statement
Not applicable.
Conflicts of Interest
The authors declare no conflict of interest.
References
- Furuya, Y.; Shimamura, Y.; Takanashi, M.; Ogawa, T. Standardization of an ultrasonic fatigue testing method in Japan. Fatigue Fract. Eng. Mater. Struct. 2022, 45, 2415–2420. [Google Scholar] [CrossRef]
- Mayer, H. Recent developments in ultrasonic fatigue. Fatigue Fract. Eng. Mater. Struct. 2016, 39, 3–29. [Google Scholar] [CrossRef]
- Filgueiras, P.F.; Bathias, C.; Palma, E.S.; Wang, C. Inducing very high cycle fretting-fatigue in the ultrasonic regime. Tribol. Int. 2014, 76, 57–62. [Google Scholar] [CrossRef]
- Peng, W.; Yu, L.; Zhang, Y.; Zhang, Y. Application and Research of Ultrasonic Fatigue Testing Technology. Phys. Exam. Test. 2014, 32, 54–58. [Google Scholar] [CrossRef]
- Zhou, L.; Li, G.; Zhang, J. Influencing Factors and Fatigue Mechanism of Ultra High Cycle Fatigue: An Overview. Mater. Rev. 2017, 31, 84–89. [Google Scholar] [CrossRef]
- Willertz, L.E. Ultrasonic fatigue. Int. Mater. Rev. 2013, 25, 65–78. [Google Scholar] [CrossRef]
- Ilie, P.; Lesperance, X.; Ince, A. Development of an ultrasonic fatigue testing system for gigacycle fatigue. Mater. Des. Process. Commun. 2019, 2, e120. [Google Scholar] [CrossRef][Green Version]
- Stanzl-Tschegg, S. Very high cycle fatigue measuring techniques. Int. J. Fatigue 2014, 60, 2–17. [Google Scholar] [CrossRef]
- Bathias, C. Piezoelectric fatigue testing machines and devices. Int. J. Fatigue 2006, 28, 1438–1445. [Google Scholar] [CrossRef]
- Puskar, A.; Bokuvka, O.; Nicoletto, G.; Palcek, P. Equipment and methods for ultrasonic fatigue evaluation of metals. Stroj. Vestn. J. Mech. Eng. 1996, 42, 351–362. [Google Scholar]
- Fitzka, M.; Schonbauer, B.M.; Rhein, R.K.; Sanaei, N.; Zekriardehani, S. Usability of Ultrasonic Frequency Testing for Rapid Generation of High and Very High Cycle Fatigue Data. Materials 2021, 14, 2245. [Google Scholar] [CrossRef] [PubMed]
- Tian, J. Ultrasonic fatigue testing machine. China Rubber Ind. 2007, 54, 397. [Google Scholar]
- Cui, W.; Chen, X.; Chen, C.; Chen, L. Damage evolution process of CFRP in very high cycle fatigue. Acta Aeronaut. Astronaut. Sin. 2020, 41, 198–204. [Google Scholar] [CrossRef]
- Stanzl-Tschegg, S.E.; Mayer, H.R.; Tschegg, E.K. High frequency method for torsion fatigue testing. Ultrasonics 1993, 31, 275–280. [Google Scholar] [CrossRef]
- Marinesgarcia, I.; Doucet, J.; Bathias, C. Development of a new device to perform torsional ultrasonic fatigue testing. Int. J. Fatigue 2007, 29, 2094–2101. [Google Scholar] [CrossRef]
- Costa, P.; Vieira, M.; Reis, L.; Ribeiro, A.; de Freitas, M. New specimen and horn design for combined tension and torsion ultrasonic fatigue testing in the very high cycle fatigue regime. Int. J. Fatigue 2017, 103, 248–257. [Google Scholar] [CrossRef]
- Nikitin, A.; Bathias, C.; Palin-Luc, T. A new piezoelectric fatigue testing machine in pure torsion for ultrasonic gigacycle fatigue tests: Application to forged and extruded titanium alloys. Fatigue Fract. Eng. Mater. Struct. 2015, 38, 1294–1304. [Google Scholar] [CrossRef]
- Jacquemain, V.; Ranc, N.; Cheuleu, C.; Michel, V.; Favier, V.; Castelnau, O.; Vinci, D.; Thiaudiere, D.; Mocuta, C. Estimation of stress in specimens loaded with ultrasonic fatigue machines. Int. J. Fatigue 2021, 153, 106474. [Google Scholar] [CrossRef]
- Lee, H.W.; Basaran, C.; Egner, H.; Lipski, A. Modeling ultrasonic vibration fatigue with unified mechanics theory. Int. J. Solids Struct. 2022, 236–237, 111313. [Google Scholar] [CrossRef]
- Backe, D.; Balle, F.; Eifler, D. Fatigue testing of CFRP in the Very High Cycle Fatigue (VHCF) regime at ultrasonic frequencies. Compos. Sci. Technol. 2015, 106, 93–99. [Google Scholar] [CrossRef]
- Bruchhausen, M.; Hähner, P.; Fischer, B.; Cornu, D. Device for carrying out environmental very high cycle fatigue tests with ultrasonic excitation in asymmetric push–pull mode. Int. J. Fatigue 2013, 52, 11–19. [Google Scholar] [CrossRef]
- Ritchie, R. Fatigue Testing. In ASM Handbook Volume 8: Mechanical Testing and Evaluation; Kuhn, H., Medlin, D., Eds.; ASM International: Materials Park, OH, USA, 2000; Volume 8, pp. 717–729. [Google Scholar]
- Roopa Rani, M.; Rudramoorthy, R. Computational modeling and experimental studies of the dynamic performance of ultrasonic horn profiles used in plastic welding. Ultrasonics 2013, 53, 763–772. [Google Scholar] [CrossRef] [PubMed]
- Lesperance, X.; Ilie, P.; Ince, A. Very high cycle fatigue characterization of additively manufactured AlSi10Mg and AlSi7Mg aluminium alloys based on ultrasonic fatigue testing. Fatigue Fract. Eng. Mater. Struct. 2020, 44, 876–884. [Google Scholar] [CrossRef]
- Matikas, T.E. Specimen Design for Fatigue Testing at Very High Frequencies. J. Sound Vib. 2001, 247, 673–681. [Google Scholar] [CrossRef][Green Version]
- Xue, H.; Tao, H. The Design of Specimen for Fatigue Test at Ultrasonic Frequency. Acta Aeronaut. Astronaut. Sin. 2004, 25, 425–428. [Google Scholar]
- Ni, J.; Zhang, X. Finite element calculation and dynamic modal analysis of ultrasonic fatigue vibration body. Sci. China Ser. E Technol. Sci. 1996, 1996, 97–102. [Google Scholar]
- Xie, Z.; Guan, Y.; Zhu, L.; Jiang, L. Design and optimization of ultrasonic vibration system based on ANSYS Workbench. Forg. Stamping Technol. 2015, 11, 52–57. [Google Scholar] [CrossRef]
- Yan, S.; Li, F. Analysis of harmonic response of ultrasound fatigue test. Forg. Equip. Manuf. Technol. 2011, 6, 87–89. [Google Scholar] [CrossRef]
- Chen, S.; Liu, R.; Liu, Y.; Wang, Q. Effect of initial size on ultrasonic fatigue specimen and the ultrasonic fatigue behavior of aluminum alloy 6063. J. Ship Mech. 2012, 16, 523–532. [Google Scholar]
- Deng, H.; He, B. Design of Ultrasonic Fatigue Specimen of MB8 Wrought Magnesium Alloy by Analytic Method. J. Aeronaut. Mater. 2016, 36, 64–70. [Google Scholar] [CrossRef]
- He, B.; Wei, K. The Design of High Strength Steel Specimen for Very High Cycle Fatigue Testing. Mater. Rev. 2015, 22, 135–140. [Google Scholar] [CrossRef]
- He, G.; Ding, X.; Cheng, C.; Zhang, W. The High Cycle Fatigue Behavior of Aluminum Alloy. Chin. J. Mater. Res. 2007, 21, 62–65. [Google Scholar]
- Geilen, M.B.; Schönherr, J.A.; Klein, M.; Leininger, D.S.; Giertler, A.; Krupp, U.; Oechsner, M. On the Influence of Control Type and Strain Rate on the Lifetime of 50CrMo4. Metals 2020, 10, 1458. [Google Scholar] [CrossRef]
- Wang, H.; Gao, Q. Effect of Load Frequency on Fatigue Behavior of Material in Ultrasoinc Fatigue Testing. Phys. Test. Chem Anal. Part A 2005, 41, 433–435. [Google Scholar]
- Han, W.; Fu, L.; Chen, H. Effect of Welding Speed on Fatigue Properties of TC18 Thick Plate by Electron Beam Welding. Rare Metal. Mater. Eng. 2018, 47, 2335–2340. [Google Scholar]
- Invernizzi, S.; Montagnoli, F.; Carpinteri, A. Experimental Evidence of Specimen-Size Effects on EN-AW6082 Aluminum Alloy in VHCF Regime. Appl. Sci. 2021, 11, 4272. [Google Scholar] [CrossRef]


Publisher’s Note: MDPI stays neutral with regard to jurisdictional claims in published maps and institutional affiliations. |
© 2022 by the authors. Licensee MDPI, Basel, Switzerland. This article is an open access article distributed under the terms and conditions of the Creative Commons Attribution (CC BY) license (https://creativecommons.org/licenses/by/4.0/).