Abstract
Aiming at the multi-parameter identification problem of an electro-hydraulic servo system, a multi-parameter identification method based on a penalty mechanism reverse nonlinear sparrow search algorithm (PRN-SSA) is proposed, which transforms the identification problem of a non-linear system into an optimization problem in a high-dimensional parameter space. In the initial stage of the sparrow search algorithm (SSA), the population distribution is not uniform, and the optimization process is easily disturbed by the local optimal solution. First, adopting a reverse learning strategy increases the exploratory nature of individuals in a population, improves population diversity, and prevents premature maturity. Subsequently, a flexible strain mechanism is provided through the nonlinear convergence factor, adaptive weight factor, and golden sine and cosine factor. The introduction of a nonlinear factor fully balances the global search and local development abilities of the algorithm. Finally, a punishment processing mechanism is developed for vigilantes while retaining the population, providing a suitable search scheme for individuals beyond the boundary, and making full use of the value of each sparrow individual. The effectiveness of each improved strategy is verified through simulation experiments with 23 benchmark functions, and the improved algorithm exhibits better robustness. The results of the model parameter identification of the electro-hydraulic servo system show that the method has a high fitting accuracy between the identification model data and the experimental data, and the fitting degree of the identification model exceeds 97.54%, which further verifies the superiority of the improved algorithm and the effectiveness of the proposed identification strategy.
1. Introduction
Electro-hydraulic systems have been widely applied in various industrial applications for decades because of the key advantage of a high power-to-weight ratio. Recently, rapid developments in engineering machineries, hydraulic robotics, heavy-duty manipulators, industrial pump stations, etc. have put forward ever increasingly stronger demands for high-performance hydraulic systems, which should be more reliable, precise, energy efficient, intelligent, and so on. Owing to structural and environmental factors, system parameters are easily affected, which makes it difficult to control systems and reduce the reliability of system operation [1,2,3,4]. Therefore, to avoid affecting the control performance of the servo system, multi-parameter identification of the nonlinear system is very important, and relevant personnel have made some meaningful attempts and explorations. The existing multi-parameter identification methods of servo systems mainly include the least-squares method [5] and the transfer function identification method based on step response [6,7,8], such as the two-point and three-point methods.
The least-squares and fast Fourier calculation methods are based on classical mathematical theory and require many complex mathematical calculations. Once affected by the nonlinear factors of the servo system, the identification results are affected. In [9], a moment-of-inertia identification method based on an improved model reference adaptive system framework was proposed. The curvature model was used to estimate the load torque to construct an accurate reference model, and the absolute values of the relative error and convergence time of a given gain factor were used as switching conditions, which improved the recognition accuracy and average convergence speed. In [10], the digital electro-hydraulic control system of a steam turbine was divided into linear and nonlinear parameters to be identified. The linear parameters were identified by the neural network, and the nonlinear parameters were determined according to the flow characteristic curve. The simulation results of the proposed method show that the nonlinear factors of high-power units cannot be ignored and that the nonlinear model of the servo system is more accurate. In [11], considering the asynchrony of the input and output sampled signals, an auxiliary model was modeled as a medium of state and output functions, and the state value of the output signal of a two-rate system was estimated using an improved Kalman prediction algorithm. The simulation results indicate that both the state and parameters are close to the true value, and the state value converges faster than the parameter. In [12], a disturbance observer (DOB)-based model identification method was used for model identification of an electronic non-circular gear brake (ENGB) system. By employing the nearest-neighbor search method, parity disturbances can be separated without being affected by hysteresis, even when the control precision is low. The accuracy of the obtained ENGB system model was experimentally verified. In [13], a new method for system identification of dynamic parameter models of rotor-bearing systems based on exogenous input nonlinear autoregressive (NARX) models was proposed, in which the physical parameters of the system appear as coefficients in the model. In [14], observer/Kalman filter identification (OKID) and bilinear transform discretization (BTD) were proposed, and the results showed that the proposed BTD identification algorithm is simpler and more computationally efficient. In [15], the reconstructed multi-innovative least-squares method was used to identify the turntable servo system by introducing intermediate-step updates and decomposing the innovative update steps. The inverse problem of the covariance matrix can be solved, and the recognition performance can be improved. In [16], a recursive least-squares algorithm and a stochastic gradient algorithm with a forgetting factor and convergence index were proposed for closed-loop identification, and the simulation results proved the effectiveness of the proposed algorithm.
Owing to the instability of the actual system and existence of local extreme points in the objective function, it is difficult to obtain high-precision parameter estimates using conventional methods [17]. Accurate identification of the multiple parameters of the servo system remains a significant problem. In recent years, the rapid development of meta-heuristic algorithms, such as the genetic algorithm [18], particle swarm algorithm [19], grey wolf optimizer algorithm [20], whale optimization algorithm [21], and chimp optimization algorithm [22], has introduced many new perspectives for model identification and parameter estimation. In [23], the bat algorithm was adopted for the system identification problem of adaptive infinite impulse systems, achieving a balance between the intensive and diversification phases. In [24], an enhanced global flower pollination algorithm (GFPA) was used for the parameter identification of chaotic and hyperchaotic systems, and the experimental results showed that the introduction of chaotic maps and optimal information-guided search improved identification. In [25], an improved adaptive step-size firefly swarm optimization algorithm (IASGSO) was used for the identification and optimization of nonlinear Wiener system model parameters. In [26], a selfish herd optimization algorithm based on the chaos strategy (CSHO) was applied to solve the IIR system identification problem. The introduction of the chaotic search strategy improves the optimization accuracy, convergence speed, and stability of the identification of the most adaptive infinite impulse response systems. In [27], a type 2 fuzzy neural network (T2FNN) and its learning method using the grey wolf optimizer (GWO) for system identification were proposed. In [28], a variant of the particle swarm optimization (PSO) algorithm called finite-time particle swarm optimization (FPSO) was investigated as a system identification technique. The experimental results show that the FPSO algorithm exhibits excellent performance in estimating the parameters of simulated linear and nonlinear systems with and without noisy data. From [29], it is observed that the chaotic optimization algorithm based on the Lozi map exhibits robust performance, short running time, and ideal ability to find local minima, and is a suitable choice for estimating the unknown parameters of nonlinear dynamic systems. In [30], a genetic algorithm (GA) method was proposed to estimate the characteristic parameters of the operating gear using only the return loss data.
Identification methods, such as the least-squares algorithm [31], require the objective function to be continuously derivable and use gradient information to search, which can easily fall into a local minimum. Although the meta-heuristic algorithm overcomes the shortcomings of the traditional identification algorithm, there is still room for improvement in terms of the algorithm structure and optimization efficiency. The sparrow search algorithm (SSA) [32,33] is a meta-heuristic algorithm based on sparrow foraging simulation, which has the characteristics of good self-organization ability and easy implementation. Therefore, this research introduces a sparrow search algorithm for system identification in practical engineering. To improve the performance of the algorithm and avoid falling into local extreme points, a multi-parameter identification method for an electro-hydraulic servo system based on the penalty reverse nonlinear sparrow search algorithm is proposed, named PRN-SSA. The main contributions of this research are as follows:
- An inverse nonlinear sparrow search algorithm based on a penalty mechanism is proposed.
- PRN-SSA introduces a reverse learning strategy in the initial stage, which increases the traversal and diversity of the initial search. In the sparrow search stage, nonlinear factors are introduced to achieve a balance between the global search and local development capabilities, as well as to improve the overall optimization efficiency of the algorithm. After discovering dangerous sparrow individuals, we carry out the movement method based on the punishment mechanism, and make full use of each sparrow individual.
- The optimization ability of the proposed algorithm is tested on unimodal, multimodal, and fixed-dimensional multimodal benchmark functions.
- The proposed algorithm is compared with six other heuristic algorithms in terms of numerical analysis and convergence curves to determine the performance of the best optimal value.
- A multi-parameter identification method for an electro-hydraulic servo system based on the PRN-SSA is proposed and compared with six other heuristic algorithms. It should be noted that the servo system identification problem can be solved effectively.
The rest of this paper is organized as follows. Section 2 describes the detailed mathematical model of the electro-hydraulic servo system. Section 3 describes the basic and the improved SSA in detail. Section 4 presents a multi-parameter identification method for an electro-hydraulic servo system based on PRN-SSA. Section 5 details the benchmark function search performance comparison that verifies the superiority of the proposed algorithm. Section 6 presents the experimental design and demonstrates the accuracy of the proposed system identification strategy for different input signals. Section 7 provides a summary and discusses potential research directions.
The following Table 1 illustrates all the notations involved in the algorithms that appear in this paper:

Table 1.
Notation descriptions.
2. Basic System Model
2.1. The Composition of the Semi-Physical Simulation Test Bench
As shown in Figure 1, a typical electro-hydraulic servo system includes a workbench, hydraulic cylinder, displacement sensor, electro-hydraulic servo valve, servo amplifier, electromagnetic reversing valve, filter, and an oil source. The worktable in the figure is used to carry external loads and is connected to the piston of the hydraulic cylinder. The displacement of the cylinder is controlled using an electro-hydraulic servo valve. The desired control effect is that the position of the control object can be accurately changed according to the control requirements. During position feedback, the feedback position signal is collected, and the A/D is converted through a displacement sensor data acquisition (A/D) card. The converted signal is compared with a predetermined signal value, thereby generating an error signal. Using the error signal to adjust the input of the system, an overall closed-loop position control is formed [34].
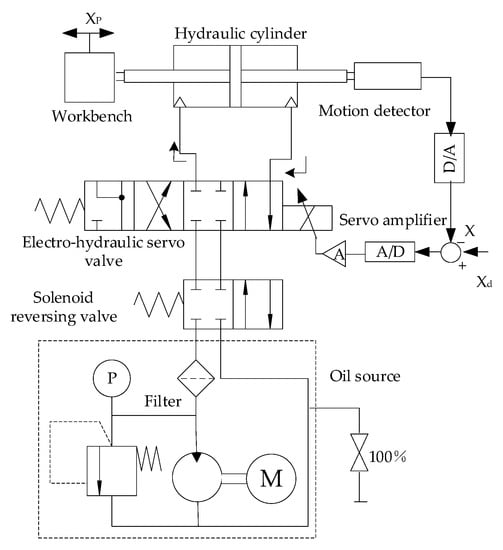
Figure 1.
Schematic diagram of a typical electro-hydraulic position servo system.
2.1.1. Servo Amplifier Model
The servo amplifier of the servo valve is composed of a signal conditioning circuit and power amplifier circuit.
The displacement sensor equation is:
where is the gain coefficient of the displacement sensor, and is the output displacement of the hydraulic cylinder.
Under the condition of ignoring the dynamic characteristics of the system, its output current is:
where is the amplifier gain coefficient.
2.1.2. The Transfer Function of Electro-Hydraulic Servo Valve
The servo valve adopts the second-order oscillation link to discuss:
where is the flow gain coefficient of the servo valve, is the natural frequency of the servo valve, and is the damping ratio of the servo valve.
2.1.3. Basic Equations of Hydraulic Power Mechanism
Considering the time-varying and unmeasured nature of the actual nonlinearity, the mathematical model must be further simplified before model identification of the electro-hydraulic position servo system. The natural frequency of the system is the lowest when the spool is in a neutral position. Based on this position, the linearized flow equation of the servo valve, hydraulic cylinder continuity equation, and hydraulic cylinder force balance equation can be derived as follows [35,36]:
where is the total mass of the piston and the load converted to the piston, is the viscous damping coefficient, is the equivalent spring stiffness of the hydraulic cylinder, is any external load force on the piston, is the friction force acting on the piston, is the flow gain coefficient, is the flow and pressure coefficient, is the load flow, is the load pressure, is the leakage coefficient in the hydraulic cylinder, and is the volume of the hydraulic cylinder cavity.
2.2. Determination of Parameters to Be Identified
According to Equation (4), it can be known that:
where is the pressure coefficient of the total flow of the system, .
Ignoring the relevant nonlinear influencing factors, the block diagram of the control model of the electro-hydraulic position servo system is shown in Figure 2.

Figure 2.
Structure block diagram of an electro-hydraulic position servo system.
The transfer function of the system is established from the block diagram:
where , , , .
According to the transfer function, the electro-hydraulic position servo system is a fifth-order system, the structure of the fifth-order model is known, and closed-loop identification of the system can be carried out. A state-space model of the fifth-order system is established. The state-space model has good mathematical mapping ability and can solve high-order systems and multivariable problems well.
Select the system state variables to be:
Establish the state-space expression for the closed-loop system:
where , , , , , , , , .
Therefore, the parameter vector to be identified is obtained as:
A significant advantage of using the indirect method to identify closed-loop systems is that it avoids all the difficulties in closed-loop identification and can easily and directly identify the parameters of the controlled object model.
3. The Proposed Meta-Heuristic Approach
3.1. Sparrow Search Algorithm
The sparrow search algorithm is a meta-heuristic algorithm that simulates the behavior of sparrow foraging and avoiding predators. Compared to other algorithms, it has the characteristic of higher solving efficiency. Assuming that the population of the standard SSA is N, the optimal solution is searched in the D-dimensional region.
The sparrow group is divided into two parts: discoverers and joiners. The discoverers are mainly responsible for finding food and sending location signals to joiners. Joiners can search for finders who provide the best food. When aware of danger, sparrows at the fringes of the colony move quickly towards the safe area to gain a better position. The finder position update formula is as follows:
where represents the position of the sparrow, is the number of iterations, is a uniform random number between (0, 1], is a random number that conforms to a normal distribution, represents a unit vector, is the warning value, and is a safe value.
The update formula of the joiner position is as follows:
where represents the worst position, represents the individual position with the best fitness in the t + 1 iteration, and represents the matrix, . When , it means that the participant has a low fitness value and has no right to fight for food. It must go to a new location to find foraging opportunities. Otherwise, it will look for foraging opportunities near the optimal location.
Usually, 10–20% of the total number of individuals are selected as vigilantes, monitored incessantly, and the entire population is reminded to conduct anti-predation behavior when in danger. The position update formula is as follows:
where is the step size control parameter, is a uniform random number between [−1, 1]; is the fitness of the current sparrow, is the best fitness, is the worst fitness, and is a sufficiently small number to avoid the case where the denominator is 0.
3.2. Reverse Nonlinear Sparrow Search Algorithm Based on Penalty Mechanism
3.2.1. Opposition-Based Learning
The SSA, like other swarm intelligence optimization algorithms, when its search is close to the global optimum, the diversity of the population still decreases, and it easily falls into the local optimum solution.
Opposition-based learning [37] is a method that can improve the searchability of swarm optimization algorithms. The main idea is to generate reverse individuals in the area where the current individual is located and select individuals with high fitness among the reverse individuals and the current individual to perform the algorithm iteration. This strategy can effectively increase the diversity of the population, and the reverse solution has a 50% probability of being closer to the global optimum than the current solution. Suppose, in the d-dimensional search space, the individual is , which satisfies the boundary conditions of , and its reverse solution is , the mathematical expression is as follows:
In the process of initializing the population, all individuals in the current population can first obtain a reverse population through reverse learning and then select the individuals with the highest fitness values in the current population and the reverse population to construct the initialization population. It not only greatly improves the quality of the solution, but also increases the exploratory ability of individuals in the population, broadens the population search area, and improves the diversity of the population. Simultaneously, it can effectively prevent the algorithm from becoming premature.
3.2.2. Non-Linear Factors
Nonlinear Convergence Factor
One of the important factors in evaluating the performance of a heuristic algorithm is whether it can balance the global search ability and local development ability of the algorithm. According to the convergence function in the finder position update formula, it can be known that as the value of x increases, the value of gradually decreases, and each dimension of the sparrow is shrinking. This linear change cannot adapt to the optimization of the algorithm for complex multimodal functions, resulting in slow optimization of the algorithm and even falling into a local optimum. Therefore, this research introduces a non-linearly changing convergence factor, and the slowly decaying convergence factor in the early stage of the algorithm iteration can improve the population search for the global optimal solution. At a later stage of the algorithm iteration, the population converges, and the rapidly decaying convergence factor is beneficial for the algorithm to locally find the optimal solution. The mathematical expression for the nonlinear convergence factor is as follows:
where is the current iteration number, is the initial value of the convergence factor, and is a controlling factor, which can control the amplitude of attenuation, . The original convergence function and control factor take , and the nonlinear convergence factor comparison of and is shown in Figure 3.
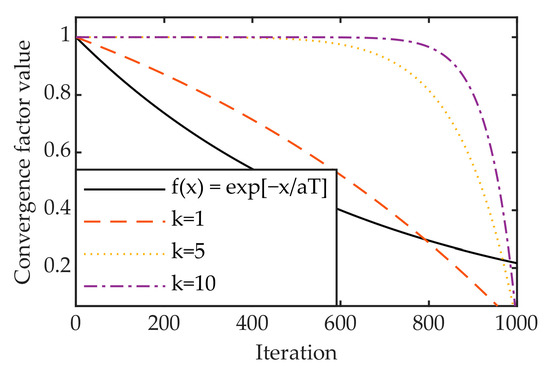
Figure 3.
Convergence factor comparison chart.
Adaptive Weight Factor
The weight factor plays an important role in optimizing the objective function. Appropriate weights can accelerate the convergence of an algorithm and improve its accuracy. To address the problems of slow convergence and low precision in the SSA optimization process, an adaptively adjusted weight factor is introduced. In the early stage of the algorithm iteration, a larger weight is assigned to allow for the population to traverse the entire search space with a large step size, which is conducive to the algorithm quickly searching for the global optimal position and accelerating the algorithm convergence. In the middle and late stages of the algorithm iteration, the algorithm gradually converges and the individual locally searches for an optimal solution. At this time, assigning a small weight will help the algorithm finely explore the optimal position with small steps and improve the convergence accuracy of the algorithm. Finally, at the end of the algorithm iteration, the SSA can easily fall into the local optimum, causing a relatively large disturbance to the individual position, which helps the algorithm jump out of the local optimum solution. The mathematical model of the adaptive weight factor is as follows:
where are constant coefficients, and is the specified number of iterations. The variation of ω with the number of iterations is shown in Figure 4.
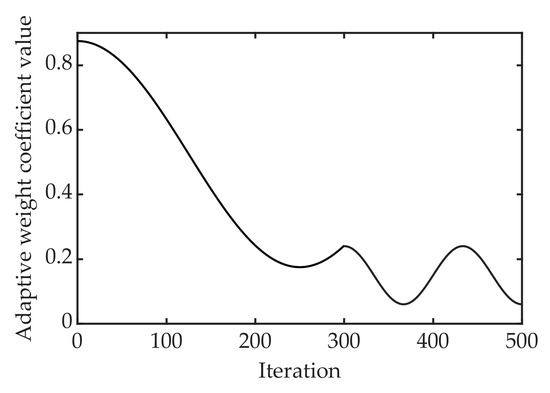
Figure 4.
Schematic diagram of adaptive weights.
After the improvement, the finder position update formula is:
The Golden Sine and Cosine Factor
The golden sine algorithm (golden-SA) [38] is a new intelligent algorithm proposed by Tanyildiz et al., in 2017 based on the idea of a sine function. The algorithm has the advantages of a fast optimization speed, simple parameter adjustment, and good robustness. The golden-SA algorithm uses the special relationship between a sine function and unit circle combined with the golden section coefficient to perform an iterative search and scans the unit circle through the sine function to simulate the process of exploring the search space. The mathematical expression is as follows:
where and are random numbers of [0, 2π] and [0, π], respectively, which represent the distance and direction of the next generation of individuals moving; is the optimal individual position for the first iteration; and are the golden section coefficients, which are used to narrow the search space and guide individuals to converge to the optimal value. , , , where is the golden cut ratio, the value is about 0.618033, and and make up the search interval.
To further improve the convergence accuracy and optimization effect of the algorithm and balance the local development and global search ability, sine and cosine search strategies are combined. According to the updated position status of the finder, a sine and cosine search is performed to obtain the optimal feasible solution. The mathematical expression for updating the joint position based on the sine and cosine search strategy is as follows:
where is a random number uniformly distributed on [0, 1].
The introduction of the sine–cosine search strategy can effectively prevent premature convergence of the algorithm and improve the convergence accuracy to a certain extent, thereby improving the efficiency of each iteration.
3.2.3. Penalty Mechanism
When an individual sparrow is threatened, it will escape to the current global optimal position, and this type of arbitrary jump can easily lead to aggregation and fall into the local optimal solution. Simply placing the alerter in the optimal solution results in resource wastage. The distance between the sparrows at the edge of the population and the safe area is considered for processing.
where is the individual fitness value of the sparrow using the jumping mechanism and is the individual fitness value of the sparrow using the punishment mechanism.
From the analysis of Equation (19) and the penalty mechanism for leaving the safe area shown in Figure 5, it is observed that when the individual sparrow leaves the safe area to a greater extent, the pull-back is closer to . The smaller the escape safe area is, the closer it is to when pulled back.
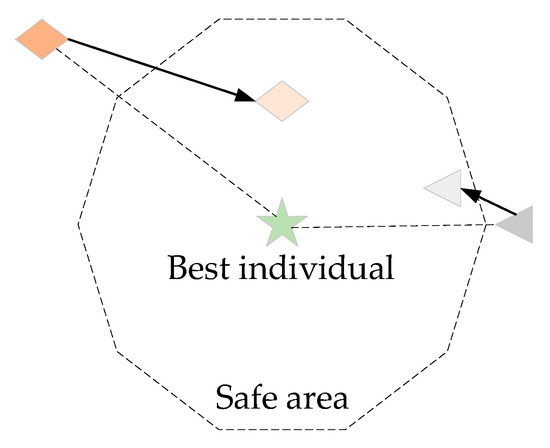
Figure 5.
Schematic diagram of the punishment mechanism for vigilantes.
3.3. Implementation Steps of PRN-SSA
PRN-SSA utilizes an opposition-based learning strategy to enrich the initial population diversity. We introduce nonlinear factors in the location update process of discoverers and joiners, including the nonlinear convergence factor, adaptive weight factor, and golden sine cosine factor, to balance local optimization and global searchability. Simultaneously, according to the degree of danger found by individual sparrows, a punishment mechanism is formulated to make the position distribution of the guards more reasonable. The specific implementation steps are as follows:
Step 1. Randomly initialize the population parameters, including the number of individuals in population N, the maximum number of iterations Max_iter, dimension d, and population search boundaries lb and ub. The relevant parameters, including the proportion of discoverers PD, proportion of joiners SD, and alert threshold .
Step 2. Generating a reverse population.
Step 3. Calculate the fitness value of each sparrow and determine the current optimal fitness value, the worst fitness value, and the corresponding position.
Step 4. Select sparrow individuals with better fitness from the sparrow population as discoverers and perform the position update operation according to Equation (16).
Step 5. The remaining sparrows are used as joiners, and the location update operation is performed according to Equation (18).
Step 6. Some sparrows are randomly selected as alerters from the sparrows, and position update operations are performed according to Equation (19) according to whether they are threatened. For threatened sparrow individuals, the punishment mechanism and jumping mechanism are operated, the greedy rule is introduced, and the update method is determined by comparing the fitness values of the two positions.
Step 7. Determine whether the entire program has reached the end condition, if not, jump to step 3 to restart the iteration, and the number of iterations ; otherwise, determine the end of the loop and output the optimal result.
3.4. Time Complexity Analysis of PRN-SSA
Time complexity is an important indicator for judging the algorithm performance and computing running costs. The population size of the basic SSA is N, dimension is D, maximum number of iterations is T, and time complexity is O (NDT). First, from a macroscopic perspective, the structure of the PRN-SSA did not change; therefore, its time complexity did not increase. The micro-time complexity analysis of the PRN-SSA is as follows:
1. The time complexity of introducing the reverse population is O (ND), and that of SSA introducing the reverse learning strategy is O (NDT + ND) = O (NDT).
2. Assuming that the time required to introduce the nonlinear convergence factor and the adaptive weight factor are t1 and t2, respectively, the time complexity of introducing the golden sine and cosine factor is O (NDT). Therefore, the time complexity of the SSA that introduces nonlinear factors is O (NDT + t1 + t2 + NDT) = O (NDT).
3. The time complexity of introducing a penalty mechanism is O (NDT), and the time complexity of SSA with a penalty mechanism is O (NDT + NDT) = O (NDT).
In summary, the time complexity of the PRN-SSA is O (NDT). It is observed that the time complexity of the PRN-SSA proposed in this research is consistent with that of the SSA.
4. The Proposed Identification Strategy
System identification mainly relies on the selection of the model structure, parameter estimation, and optimization algorithm. When identifying a specific system, it is possible to first analyze its mechanism to gain a general understanding of its characteristics, select a relatively appropriate model structure according to the characteristic analysis, and then identify each parameter in the model based on the collected data [39]. In practical analysis, the process of identifying the parameters of the entire system is a function-fitting process.
4.1. The Error Evaluation Function
To identify the servo system, an evaluation index must be introduced to identify the identification effect. Assuming that in the time domain, the relationship between the input and output of the system is as follows:
where is the number of sampling points, and is the sampling period.
When sets of input and output data and are measured, a known function that approximately matches is obtained through a meta-heuristic algorithm. Considering the nonlinear factors that are difficult to predict in the actual process, the actual identification model can be expressed as follows:
where is the residual value caused by actual factors.
The error evaluation function is defined as follows:
4.2. Identification Strategy
The specific parameter identification flowchart is shown in Figure 6.
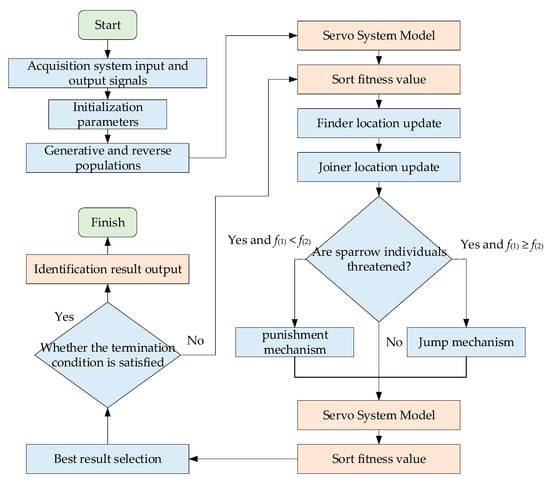
Figure 6.
System identification flow chart.
In general, when using the PRN-SSA algorithm for system parameter identification, the identification problem is transformed into an optimization problem, is the fitness function, and the PRN-SSA algorithm is used to minimize the index. After the optimization calculation, the obtained optimal solution set is the parameter that the servo system model must identify. The specific parameter identification steps are as follows.
Step 1. An identification model is selected according to the characteristics of the object, and the variation range of the parameters to be identified is determined.
Step 2. Obtain the input sampling data and output sampling data of the real system and perform preprocessing.
Step 3. Set the initial basic parameters of the sparrow search algorithm, and establish the initial position information of the sparrow individual as: .
Step 4. Calculate the individual fitness value of the sparrow, use the PRN-SSA algorithm to minimize , and obtain the current best solution, that is, the parameter identification result.
Step 5. The satisfaction of the current identification result is tested, and whether it meets the maximum number of iterations is determined. If satisfied, stop the algorithm from running and obtain the best solution; otherwise, return to the previous step and set the number of iterations to one until the maximum number of iterations is reached.
5. Benchmark Function Experiments
To verify the performance of the PRN-SSA, its performance in terms of convergence speed and solution accuracy are tested. In total, 23 benchmark functions are tested, as listed in Table 2. Among them, are unimodal test functions, are complex multimodal test functions, and are fixed dimension multimodal test functions.

Table 2.
Benchmark function information.
5.1. Comparison of Optimization Performance of Various Improvement Strategies
The computer configuration used in the simulation experiment is Intel Core i7-10750H with a main frequency of 2.60 GHz, 16 GB memory, 64-bit operating system, and computing environment in MATLAB 2020(a).
5.1.1. Performance Analysis of Opposition-Based Learning Strategy
To improve the exploration and diversity of individuals in the population, this research introduces an opposition-based learning strategy to widen the population search area. The population size is N = 30, and the maximum number of iterations is Max_iter = 500. Figure 7 shows a comparison of the basic SSA and SSA with opposition-based learning strategy (RSSA) on test functions .
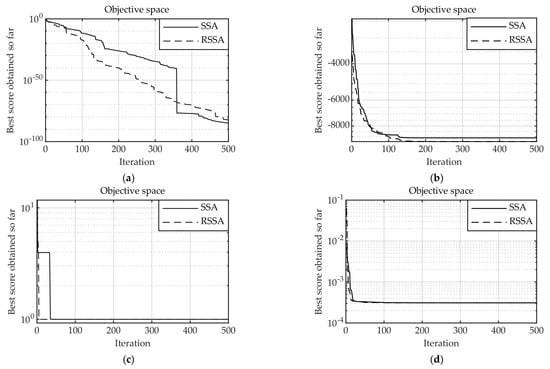
Figure 7.
Convergence comparison between SSA and RSSA: (a) ; (b) ; (c) ; (d) .
As shown in Figure 7, for the test functions , the RSSA can always converge to a value closer to the theoretical optimal value, indicating that the SSA introduced with the reverse learning strategy has certain advantages in the optimization accuracy of the basic function. For the test function , RSSA converges faster than SSA does. This shows that the reverse learning strategy improves the diversity of the population and the convergence speed and accuracy of the algorithm. Although this advantage is not obvious, it is of great help in the introduction of other strategies in later stages.
5.1.2. Performance Analysis of Introducing Nonlinear Factors
The introduction of nonlinear factors plays a crucial role in balancing the global search and local development capabilities of the algorithm. To balance the exploration and development capabilities of the algorithm, a nonlinear convergence factor , an adaptive weight factor and a golden sine–cosine factor are introduced in this research. Taking the dimension d = 30, the population size N = 30, and the maximum number of iterations Max_iter = 500, the adaptive weight factor is set as follows: . Figure 8 shows a comparison between the basic SSA and the SSA with nonlinear factors (NSSA) on the test functions .
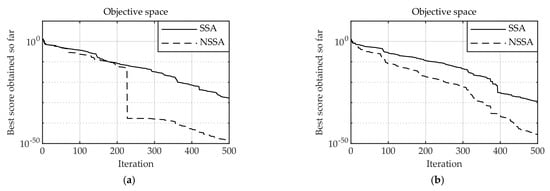
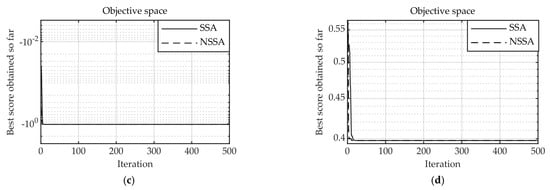
Figure 8.
Convergence comparison between SSA and NSSA: (a) ; (b) ; (c) ; (d) .
As shown in Figure 8, the test functions and , NSSA can directly converge to the theoretical value of 0, and the convergence speed and accuracy are significantly better than those of the SSA. The NSSA convergence speed improvement was limited to the fixed-dimension test functions and . In summary, the introduction of nonlinear factors can improve the convergence speed and accuracy of an algorithm, to a certain extent.
5.1.3. Performance Analysis of Introducing Penalty Mechanism
The introduction of the penalty mechanism makes full use of each sparrow individual and avoids population aggregation. The dimension d = 30, the population size N = 30, and the maximum number of iterations Max_iter = 500. Figure 9 shows a comparison between the basic SSA and the SSA with a penalty mechanism (PSSA) on the test functions .
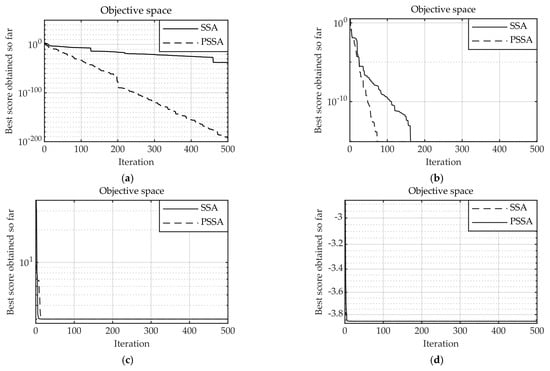
Figure 9.
Convergence comparison between SSA and PSSA: (a) ; (b) ; (c) ; (d) .
As shown in Figure 9, for test functions and , the convergence speed of PSSA is significantly better than that of SSA, and the convergence accuracy is also significantly improved. The PSSA is closer to the theoretical optimum for the more complex test functions and . The results show that the introduction of the penalty mechanism makes full use of each sparrow, which is helpful for the algorithm to improve the convergence speed and accuracy.
5.2. Comparison Algorithms and Parameter Settings
To verify the optimization performance of the PRN-SSA for basic test functions, the basic sparrow search algorithm (SSA) [40], improved sparrow search algorithm (GGSC-SSA) [41], particle swarm optimization algorithm (PSO) [42], grey wolf optimizer algorithm (GWO) [43], whale optimization algorithm (WOA) [44], and harris hawk optimization algorithm (HHO) [45] are compared with PRN-SSA. On the one hand, it aims to judge whether the improvement of this research can exceed the performance of other SSA and its variants, and on the other hand, it can reflect the optimization ability of the improved sparrow algorithm compared with other precision algorithms. The basic parameters of each algorithm are uniformly set as follows: dimension d = 30, population size N = 30, and maximum number of iterations Max_iter = 500. The internal parameters for each algorithm are listed in Table 3.

Table 3.
Internal parameter settings of each algorithm.
5.3. Performance Comparison
5.3.1. Test Function Optimization Results
The 23 basic test functions listed in Table 1 are used to perform the algorithm optimization comparison test. To avoid obtaining the experimental data, each algorithm is run 50 times to obtain the average value and standard deviation, and the optimal data are bolded. The test function comparison results are presented in Table 4, Table 5 and Table 6, respectively.

Table 4.
Unimodal test functions.

Table 5.
Multimodal test functions.

Table 6.
Fixed dimension multimodal test functions.
5.3.2. Analysis of Numerical Results
Table 4, Table 5 and Table 6 show the simulation results of the seven optimization algorithms on the 23 benchmark functions. The unimodal test function can test the convergence speed and local development ability of the algorithm and is suitable for evaluating the utilization of the algorithm. In terms of mean and standard deviation, except that the effect of functions 5 and 6 is worse than that of SSA and GGSC-SSA; for other functions, the results of PRN-SSA are better than those of various intelligent algorithms, among which can find the theoretical optimal value. It is worth mentioning that for and , although PRN-SSA lags behind similar algorithms, it is still significantly better than the classical algorithms. Overall, among the unimodal test functions, the PRN-SSA is the best performing algorithm in terms of optimization ability and stability. Compared with the other six meta-heuristic algorithms, it is very effective and competitive, and the test results show that the PRN-SSA still has a good development ability.
The multimodal test function has greater complexity, and its number increases exponentially with the dimension, which is suitable for measuring the global search ability of the algorithm, while the fixed-dimension multimodal function is suitable for testing the exploration ability and optimization accuracy of the algorithm. In the multimodal test function, for functions and , the PRN-SSA can determine the theoretical optimum. For , the PRN-SSA performs equally well, and its test results are significantly better than those of the other algorithms. SSA is the best for and . It is worth mentioning that in terms of , the PRN-SSA is also better than classical algorithms. For , the PRN-SSA can jump out of the local optimal solution, which is closer to the theoretical optimal value of −12,569.5. For fixed-dimensional test functions, the PRN-SSA can converge to near the optimal value. In particular, functions can directly converge to the theoretical optimal value. For functions , the PRN-SSA can jump out of the local optimal solution compared with other algorithms.
Overall, regardless of whether it is a unimodal or multimodal test function, the PRN-SSA has obvious advantages over other algorithms in optimizing the basic test function.
5.4. High-Dimensional Performance Comparison
5.4.1. Test Function Optimization Curve
To test the optimization ability of PRN-SSA for high-dimensional functions, the basic sparrow search algorithm (SSA), improved sparrow search algorithm (GGSC-SSA), particle swarm optimization (PSO), grey wolf optimization (GWO), whale optimization algorithm (WOA), harris hawk optimization algorithm (HHO) and PRN-SSA are used for high-dimensional function optimization comparison. Owing to space limitations, the most classic functions and are selected for the test function, the dimension d = 100, and the maximum number of iterations Max_iter = 1500. An optimization comparison of each algorithm is shown in Figure 10. Figure 11 shows the boxplots of all algorithms and a partial zoomed in version of some algorithms when the function is computed 30 times, where GGSC-SSA and PRN-SSA are simplified using GGSC and PRN.
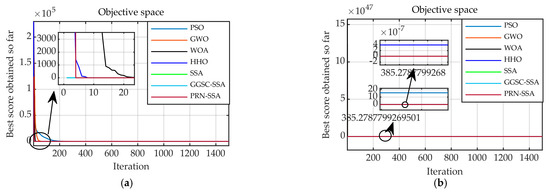
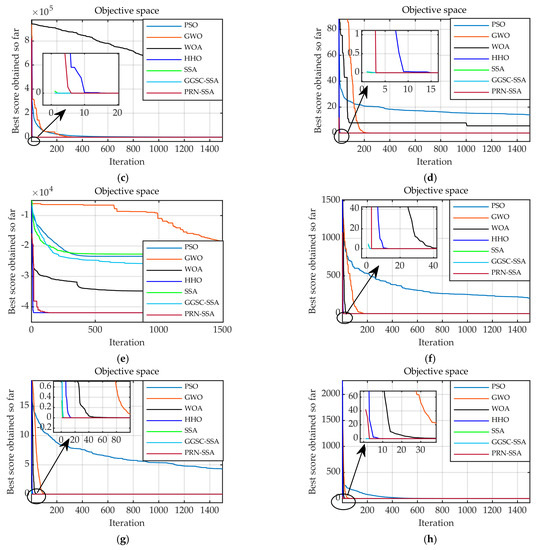
Figure 10.
Optimization and convergence curves of each algorithm (100-dimension): (a) ; (b) ; (c) ; (d) ; (e) ; (f) ; (g) ; (h) .
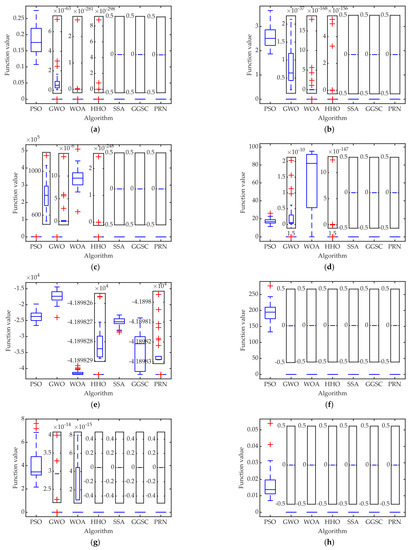
Figure 11.
Boxplot for each algorithm optimization comparison (100-dimension): (a) ; (b) ; (c) ; (d) ; (e) ; (f) ; (g) ; (h) .
5.4.2. Optimization Curve Analysis
As shown in Figure 10, for the unimodal and multimodal functions, the PRN-SSA can still find the optimal value at 500 dimensions. For the 500-dimensional complex multimodal function , the PRN-SSA can still jump out of the local optimal value and converge to the optimal value of −41,898.33333. The convergence curve shows that for high-dimensional functions, the PRN-SSA also has significant advantages.
As shown in Figure 11, the median, upper quartile, and lower quantile of the PRN-SSA boxplot are lower than those of the other algorithms, indicating that the PRN-SSA has a strong ability to balance different functions. When comparing the PRN-SSA boxplot with other algorithm boxplots, we can conclude that the PRN-SSA performs better than the other algorithms. Therefore, these boxplots demonstrate that the PRN-SSA results are statistically significant, not coincidental, and valuable in terms of exploration.
The above description shows that the proposed PRN-SSA considers both speed and stability in the processing of optimization problems and has high robustness.
6. Results and Discussion
To further explore the superiority of the proposed system identification strategy, six contrasting algorithms are selected to compare the system identification problem of the electro-hydraulic servo system: basic sparrow search algorithm (SSA), improved sparrow search algorithm (GGSC-SSA), particle swarm optimization algorithm (PSO), grey wolf optimizer algorithm (GWO), whale optimization algorithm (WOA), and harris hawk optimization algorithm (HHO).
6.1. System Parameters and Working Principle
This experimental bench is composed of a hydraulic pump station and an FF102-30 double-nozzle baffle force two-pole flow servo valve developed by the 609 Research Institute of the Chinese Academy of Astronautics. The displacement sensor FXB-V71/100, double-rod hydraulic cylinder, and BK-2B type force sensor are composed of a PCL-1710HG data acquisition card, an industrial computer device PCA-6180E, and an industrial control base plate PCA-6114P4-B. The system also includes a filter circuit. During the operation of the system, the filter circuit plays a role in eliminating external signal interference and at the same time, the input signal reasonably matches the acquisition card. The computer configuration used in the experiment is a Windows 2000/XP operating system, and the computing environment in MATLAB 2014(b).
In the xPC hardware-in-the-loop simulation environment, a rapid prototyping method is used to convert a standard PC into a real-time system for experimental simulation and real-time prediction of the controller. The system design and hardware device are combined through a combination of RTW and SIMULINK in MATLAB to achieve real-time control. Figure 12 shows the hardware-in-the-loop simulation test bench.
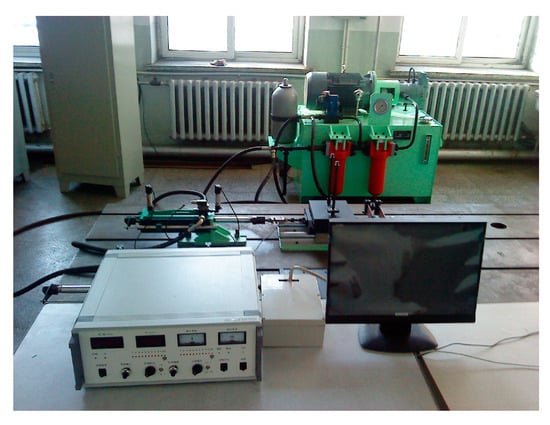
Figure 12.
Semi-physical simulation test bench.
6.2. Semi-Physical Simulation Platform Test
Data collection was performed on the test bench, and the sampling time was 0.001 s. Data obtained from the last sampling were subjected to data preprocessing to eliminate trend items. The preprocessed data are zero-averaged, the corresponding DC component is removed simultaneously, and the required data are obtained and stored. Based on this, two sets of comparative experiments are set up in this section: (1) using the sinusoidal signal as the input signal and (2) the sampling step signal as the input signal. The basic settings of all algorithms are as follows: the population size is 80, the dimension is 30, the maximum number of iterations is 500, and the range of each dimension is (0, 1013). The comparative test of system identification is repeated 20 times, and the result is the average of the results of the 20 runs. The electro-hydraulic servo system does not add control compensation, and the system is unstable at the beginning; therefore, the sine input is selected after 2π s, and the experimental time is set to 10 s. The step input selects the graph after 5 s, and the experimental time is set to 5 s.
6.2.1. Comparative Experiment and Result Analysis
To reduce this chance, sinusoidal input signals with periods of 2 π and 0.5 π and step input signals with amplitudes of 1 and 0.5, respectively, are used. Figure 13 and Figure 14 are the identification plots obtained with step and sinusoidal input signals, respectively, and Figure 15 shows a partially enlarged view of the sinusoidal input signal peak.
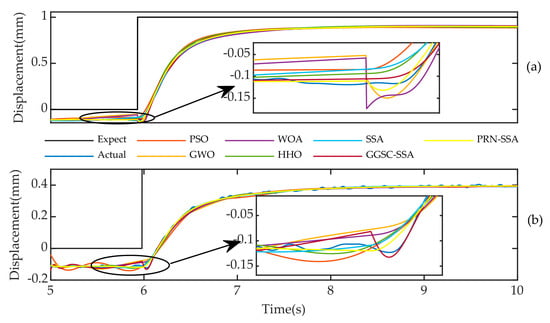
Figure 13.
The actual output of the system and the simulation curve of the system output are identified by each algorithm (step signal): (a) Amplitude is 1; (b) Amplitude is 0.5.
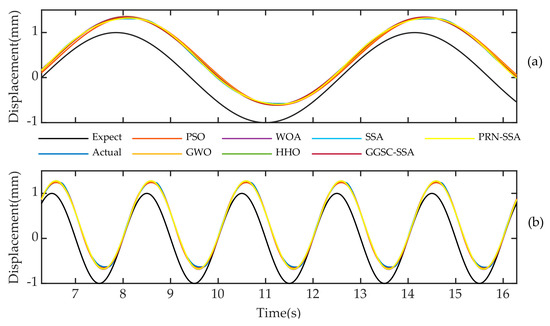
Figure 14.
The actual output of the system and the simulation curve of the system output are identified by each algorithm (sinusoidal signal): (a) Period is 2 π; (b) Period is 0.5 π.
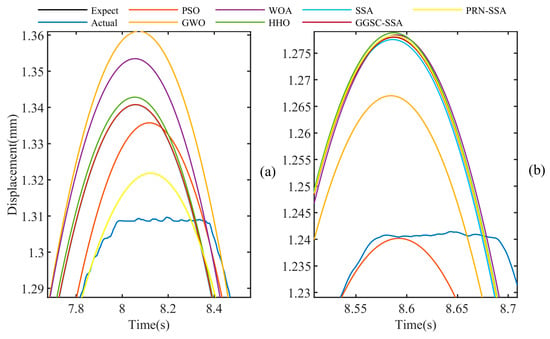
Figure 15.
Partially enlarged view of wave peak (sinusoidal input): (a) Period is 2 π; (b) Period is 0.5 π.
As shown in Figure 13 and Figure 14, the output simulation curve obtained by the system identification strategy based on the PRN-SSA is closer to the given expected output curve than the output simulation curves of the other algorithms. This superiority is again demonstrated by the fit data in Table 7. This further illustrates that the model obtained using the proposed system identification strategy is closer to the actual model of the system.

Table 7.
Curve fitting (%).
6.2.2. Optimization Curve and Result Analysis
The fitness convergence curve of the multi-parameter identification results of the electro-hydraulic servo system with various algorithms under different input signals is shown in Figure 16. As shown in Figure 16, that the PRN-SSA can effectively identify the system parameters for the multi-parameter identification of the electro-hydraulic servo system, and the convergence speed is fast.


Figure 16.
Parameter identification convergence curve: (a) Step (1); (b) Step (0.5); (c) Sinusoidal (2 π); (d) Sinusoidal (0.5 π).
7. Conclusions
In this paper, a multi-parameter identification method for an electro-hydraulic servo system based on the penalty mechanism reverse nonlinear sparrow search algorithm (PRN-SSA) is proposed. To protect the diversity of the population, an opposition-based learning algorithm was introduced into the initial search population of the sparrows, which greatly improved the quality of understanding. The introduction of the nonlinear convergence factor, adaptive weight factor, and golden sine and cosine factor balances the global search and local development abilities of the algorithm and effectively avoids premature maturity of the algorithm. In the problem of boundary processing, a penalty mechanism is introduced that avoids the loss of population diversity to a certain extent and maintains the optimization ability of the population better. Through the optimization test of 23 test functions, each improved strategy of the PRN-SSA can effectively improve the convergence speed and accuracy of the algorithm. Furthermore, 19 of the 23 test functions are ranked first, and there is a significant improvement in order of magnitude. In the experimental study, the method is compared with particle swarm optimization (PSO), grey wolf optimizer algorithm (GWO), whale optimization algorithm (WOA), harris hawk optimization algorithm (HHO), sparrow search algorithm (SSA), and improved sparrow search algorithm (GGSC-SSA). The experimental results show that, in an actual electro-hydraulic servo system that includes nonlinear factors, the proposed system identification strategy can achieve good parameter identification accuracy and effectively solve practical industrial application problems.
Through the analysis of the improved strategy in this research, it is found that the improved algorithm requires more parameters, the optimization performance of the algorithm is greatly affected by nonlinear factors, and there is considerable room for improvement in the selection of parameters. Therefore, future work will continue to investigate improved optimization strategies to improve the operability and applicability of SSA and apply it to more complex mechanical optimization problems.
Author Contributions
Conceptualization, B.G. and W.S.; methodology, B.G. and W.S.; software, H.Z.; validation, all authors; formal analysis, all authors; investigation, B.G. and W.Z.; data curation, W.S.; writing—original draft preparation, W.S.; writing—review and editing, all authors; visualization, B.G. and L.Z.; supervision, B.G., W.S., H.Z. and L.Z.; project administration, all authors; funding acquisition, B.G., W.S., H.Z., W.Z. and L.Z. All authors have read and agreed to the published version of the manuscript.
Funding
This research was funded by the Natural Science Foundation of Heilongjiang Province of China (Grant No. LH2019E064) and National Natural Science Foundation of China (Grant No. 52075134).
Institutional Review Board Statement
Not applicable.
Informed Consent Statement
Not applicable.
Data Availability Statement
Not applicable.
Conflicts of Interest
The authors declare no conflict of interest.
References
- Shen, W.; Liu, X.; Su, X. High-Precision Position Tracking Control of Electro-hydraulic Servo Systems Based on an Improved Structure and Desired Compensation. Int. J. Control Autom. Syst. 2021, 19, 3622–3630. [Google Scholar] [CrossRef]
- Yang, H.; Cong, D.; Yang, Z.; Han, J. Continuous Swept-Sine Vibration Realization Combining Adaptive Sliding Mode Control and Inverse Model Compensation for Electro-hydraulic Shake Table. J. Vib. Eng. Technol. 2022, 10, 1007–1019. [Google Scholar] [CrossRef]
- Shiralkar, A.; Kurode, S.; Gore, R.; Tamhane, B. Robust output feedback control of electro-hydraulic system. Int. J. Dyn. Control 2019, 7, 295–307. [Google Scholar] [CrossRef]
- Gao, B.; Shen, W.; Guan, H.; Zhang, W.; Zheng, L. Review and Comparison of Clearance Control Strategies. Machines 2022, 10, 492. [Google Scholar] [CrossRef]
- Xu, X.; Ding, S.; Jia, W.; Ma, G.; Jin, F. Research of assembling optimized classification algorithm by neural network based on Ordinary Least Squares (OLS). Neural Comput. Appl. 2013, 22, 187–193. [Google Scholar] [CrossRef]
- Popescu, T.D.; Aiordachioaie, D.; Culea-Florescu, A. Basic tools for vibration analysis with applications to predictive maintenance of rotating machines: An overview. Int. J. Adv. Manuf. Technol. 2021, 118, 2883–2899. [Google Scholar] [CrossRef]
- Calgan, H.; Demirtas, M. Design and implementation of fault tolerant fractional order controllers for the output power of self-excited induction generator. Electr. Eng. 2021, 103, 2373–2389. [Google Scholar] [CrossRef]
- Huang, M.X. Recent developments in topological string theory. Sci. China Phys. Mech. Astron. 2019, 62, 990001. [Google Scholar] [CrossRef] [Green Version]
- She, J.; Wu, L.; Zhang, C.K.; Liu, Z.T.; Xiong, Y. Identification of Moment of Inertia for PMSM Using Improved Modelreference Adaptive System. Int. J. Control Autom. Syst. 2022, 20, 13–23. [Google Scholar] [CrossRef]
- Liao, J.L.; Yin, F.; Luo, Z.H.; Chen, B.; Sheng, D.R.; Yu, Z.T. The parameter identification method of steam turbine nonlinear servo system based on artificial neural network. J. Braz. Soc. Mech. Sci. Eng. 2018, 40, 165. [Google Scholar] [CrossRef]
- Huang, P.; Lu, Z.; Liu, Z. State estimation and parameter identification method for dual-rate system based on improved Kalman prediction. Int. J. Control Autom. Syst. 2016, 14, 998–1004. [Google Scholar] [CrossRef]
- Park, H.; Choi, S. Load and load dependent friction identification and compensation of electronic non-circular gear brake system. Int. J. Automot. Technol. 2018, 19, 443–453. [Google Scholar] [CrossRef]
- Li, Y.; Luo, Z.; Shi, B.; He, F. NARX model-based dynamic parametrical model identification of the rotor system with bolted joint. Arch. Appl. Mech. 2021, 91, 2581–2599. [Google Scholar] [CrossRef]
- Peng, C.C.; Li, Y.R. Parameters identification of nonlinear Lorenz chaotic system for high-precision model reference synchronization. Nonlinear Dyn. 2022, 108, 1733–1754. [Google Scholar] [CrossRef]
- Li, L.; Zhang, H.; Ren, X. A Modified Multi-innovation Algorithm to Turntable Servo System Identification. Circuits Syst. Signal Process. 2020, 39, 4339–4353. [Google Scholar] [CrossRef]
- Xu, H.; Ding, F.; Alsaedi, A.; Hayat, T. Recursive identification algorithms for a class of linear closed-loop systems. Int. J. Control Autom. Syst. 2019, 17, 3194–3204. [Google Scholar] [CrossRef]
- Awad, F.; Al-Sadi, A.; Al-Quran, F.; Alsmady, A. Distributed and adaptive location identification system for mobile devices. EURASIP J. Adv. Signal Process. 2018, 2018, 61. [Google Scholar] [CrossRef]
- Fu, Z.; Pun, C.M.; Gao, H.; Lu, H. Endmember extraction of hyperspectral remote sensing images based on an improved discrete artificial bee colony algorithm and genetic algorithm. Mob. Netw. Appl. 2020, 25, 1033–1041. [Google Scholar] [CrossRef]
- Ibrahim, R.A.; Ewees, A.A.; Oliva, D.; Abd Elaziz, M.; Lu, S. Improved salp swarm algorithm based on particle swarm optimization for feature selection. J. Ambient Intell. Humaniz. Comput. 2019, 10, 3155–3169. [Google Scholar] [CrossRef]
- Yu, X.W.; Huang, L.P.; Liu, Y.; Zhang, K.; Li, P.; Li, Y. WSN node location based on beetle antennae search to improve the gray wolf algorithm. Wirel. Netw. 2022, 28, 539–549. [Google Scholar] [CrossRef]
- Turgut, M.S.; Sağban, H.M.; Turgut, O.E.; Özmen, Ö.T. Whale optimization and sine–cosine optimization algorithms with cellular topology for parameter identification of chaotic systems and Schottky barrier diode models. Soft Comput. 2021, 25, 1365–1409. [Google Scholar] [CrossRef]
- Khishe, M.; Mosavi, M.R. Chimp optimization algorithm. Expert Syst. Appl. 2020, 149, 113338. [Google Scholar] [CrossRef]
- Kumar, M.; Aggarwal, A.; Rawat, T.K. Bat Algorithm: Application to Adaptive Infinite Impulse Response System Identification. Arab. J. Sci. Eng. 2016, 41, 3587–3604. [Google Scholar] [CrossRef]
- Chen, Y.; Pi, D.; Wang, B. Enhanced global flower pollination algorithm for parameter identification of chaotic and hyper-chaotic system. Nonlinear Dyn. 2019, 97, 1343–1358. [Google Scholar] [CrossRef]
- Lu, M.; Wang, H.; Lin, J.; Yi, A.; Gu, Y.; Zhao, D. A nonlinear Wiener system identification based on improved adaptive step-size glowworm swarm optimization algorithm for three-dimensional elliptical vibration cutting. Int. J. Adv. Manuf. Technol. 2019, 103, 2865–2877. [Google Scholar] [CrossRef]
- Zhao, R.; Wang, Y.; Liu, C.; Hu, P.; Jelodar, H.; Yuan, C.; Li, Y.; Masood, I.; Rabbani, M.; Li, B. Selfish herd optimization algorithm based on chaotic strategy for adaptive IIR system identification problem. Soft Comput. 2020, 24, 7637–7684. [Google Scholar] [CrossRef]
- Mao, W.L.; Hung, C.W. Type-2 fuzzy neural network using grey wolf optimizer learning algorithm for nonlinear system identification. Microsyst. Technol. 2018, 24, 4075–4088. [Google Scholar] [CrossRef]
- Fernández, M.A.; Chang, J.Y. A study on finite-time particle swarm optimization as a system identification method. Microsyst. Technol. 2021, 27, 2369–2381. [Google Scholar] [CrossRef]
- Ebrahimi, S.M.; Malekzadeh, M.; Alizadeh, M.; HosseinNia, S.H. Parameter identification of nonlinear system using an improved Lozi map based chaotic optimization algorithm (ILCOA). Evol. Syst. 2021, 12, 255–272. [Google Scholar] [CrossRef]
- Mac, T.T.; Iba, D.; Matsushita, Y.; Mukai, S.; Inoue, T.; Fukushima, A.; Miura, N.; Iizuka, T.; Masuda, A.; Moriwaki, I. Application of genetic algorithms for parameters identification in a developing smart gear system. Forsch. Ing. 2022; to be published. [Google Scholar] [CrossRef]
- Zhang, Y.; Fang, F.; Huang, W.; Fan, W. Dwell time algorithm based on bounded constrained least squares under dynamic performance constraints of machine tool in deterministic optical finishing. Int. J. Precis. Eng. Manuf.-Green Technol. 2021, 8, 1415–1427. [Google Scholar] [CrossRef]
- Zhang, Z.; He, R.; Yang, K. A bioinspired path planning approach for mobile robots based on improved sparrow search algorithm. Adv. Manuf. 2022, 10, 114–130. [Google Scholar] [CrossRef]
- Gao, B.; Shen, W.; Guan, H.; Zheng, L.; Zhang, W. Research on Multi-Strategy Improved Evolutionary Sparrow Search Algorithm and its Application. IEEE Access 2022, 10, 62520–62534. [Google Scholar] [CrossRef]
- Gao, B.; Guan, H.; Tang, W.; Han, W.; Xue, S. Research on Position Recognition and Control Method of Single-leg Joint of Hydraulic Quadruped Robot. Recent Adv. Electr. Electron. Eng. 2021, 14, 802–811. [Google Scholar] [CrossRef]
- Jelali, M.; Kroll, A. Hydraulic Servo-Systems: Modelling, Identification and Control; Springer Science & Business Media: Berlin/Heidelberg, Germany, 2002; pp. 69–72. [Google Scholar]
- Milecki, A.; Ortmann, J. Electrohydraulic linear actuator with two stepping motors controlled by overshoot-free algorithm. Mech. Syst. Signal Process. 2017, 96, 45–57. [Google Scholar] [CrossRef]
- Li, M.; Xu, G.; Lai, Q.; Chen, J. A chaotic strategy-based quadratic Opposition-Based Learning adaptive variable-speed whale optimization algorithm. Math. Comput. Simul. 2022, 193, 71–99. [Google Scholar] [CrossRef]
- Tanyildizi, E.; Demir, G. Golden sine algorithm: A novel math-inspired algorithm. Adv. Electr. Comput. Eng. 2017, 17, 71–78. [Google Scholar] [CrossRef]
- Cho, Y.H.; Heo, H. System identification technique for control of hybrid bio-system. J. Mech. Sci. Technol. 2019, 33, 6045–6051. [Google Scholar] [CrossRef]
- Liu, G.; Shu, C.; Liang, Z.; Peng, B.; Cheng, L. A modified sparrow search algorithm with application in 3d route planning for UAV. Sensors 2021, 21, 1224. [Google Scholar] [CrossRef]
- Wu, C.; Fu, X.; Pei, J.; Dong, Z. A Novel Sparrow Search Algorithm for the Traveling Salesman Problem. IEEE Access 2021, 9, 153456–153471. [Google Scholar] [CrossRef]
- Gu, Q.; Hao, X. Adaptive iterative learning control based on particle swarm optimization. J. Supercomput. 2020, 76, 3615–3622. [Google Scholar] [CrossRef]
- Yue, Z.; Zhang, S.; Xiao, W. A novel hybrid algorithm based on grey wolf optimizer and fireworks algorithm. Sensors 2020, 20, 2147. [Google Scholar] [CrossRef] [PubMed] [Green Version]
- Jiang, R.; Yang, M.; Wang, S.; Chao, T. An improved whale optimization algorithm with armed force program and strategic adjustment. Appl. Math. Model. 2020, 81, 603–623. [Google Scholar] [CrossRef]
- Nandi, A.; Kamboj, V.K. A Canis lupus inspired upgraded Harris hawks optimizer for nonlinear, constrained, continuous, and discrete engineering design problem. Int. J. Numer. Methods Eng. 2021, 122, 1051–1088. [Google Scholar] [CrossRef]
Publisher’s Note: MDPI stays neutral with regard to jurisdictional claims in published maps and institutional affiliations. |
© 2022 by the authors. Licensee MDPI, Basel, Switzerland. This article is an open access article distributed under the terms and conditions of the Creative Commons Attribution (CC BY) license (https://creativecommons.org/licenses/by/4.0/).