Article

Automated Identification of Linear Machine Tool Model Parameters Using Global Sensitivity Analysis

Institute for Machine Tools and Industrial Management (iwb), TUM School of Engineering and Design, Technical University of Munich (TUM), Boltzmannstr. 15, 85748 Garching, Germany
*
Author to whom correspondence should be addressed.
Machines 2022, 10(7), 535; https://doi.org/10.3390/machines10070535
Submission received: 2 June 2022 / Revised: 29 June 2022 / Accepted: 30 June 2022 / Published: 1 July 2022
(This article belongs to the Section Robotics, Mechatronics and Intelligent Machines)

Abstract

:
High-fidelity machine tool models are needed for condition monitoring, machine tool development, and process simulation. To accurately predict the dynamic behavior of their real counterparts, these models have to be identified, meaning that the values for the involved physical model parameters have to be found by comparing the model with measured data from its real counterpart. As of now, this can only be performed automatically for comparably simple models, which are only valid under limiting assumptions. In contrast, parameter identification for predictive high-fidelity models requires cumbersome manual effort in many intermediate steps. The present work addresses this problem by showing how to automatically identify the parameters of a complex structural dynamic machine tool model using global sensitivity analysis. The capability of the proposed approach is demonstrated in two steps for simulated reference data: first, with a model being able to perfectly replicate the reference data, and second, with a disturbed model, which can only approximate the reference because modeling is present. It is shown that, in both cases, globally valid model parameters, which lead to high conformity with the reference data, can be found, paving the way for calibrating models based on experimental reference data in future work.

1. Introduction

The dynamic structural behavior of machine tools greatly influences the success of cutting processes, making it the objective of numerous modeling efforts. Fundamentally, two modeling strategies can be distinguished [1]: On the one hand, there is the so-called experimental approach, which is based on measurements of the real system’s behavior and results in a gray-box or black-box model replicating the input–output behavior (e.g., in the form of transfer functions [2,3]). Their identification, that is the process of determining values for the involved model parameters, is often referred to as “system identification” or, in case in situ machining measurements are used, as “rapid identification”. Even though the experimental approach is generally fast and accurate, it offers only limited physical insights due to its high abstraction level. Furthermore, it is only valid in close vicinity to the experimental data it was built with [1].
On the other hand, the theoretical approach is based on physical laws and leads to a bottom-up white-box model of the system. This type of model directly contains physical parameters describing the system. If formulated correctly, the model has a broad range of validity. For machine tools, simple models can be derived analytically [4]. More complex theoretical models can be built by performing finite element analyses (FEAs) [5,6]. With the help of linear and nonlinear local damping models, very accurate models can be achieved [6].
Independent of their origin, theoretical models of machine tools contain physically interpretable parameters [1] such as stiffness or damping values. Since the final simulation outcome crucially depends on these parameters, they must be identified accurately. Determining their values is often referred to as “(parameter) identification”, “parametrization”, or “model updating”. For this, reference (i.e., training) data are required, which, for example, can be measured on the model’s real counterpart. A comprehensive overview of conventional and modern experimental reference data identification methods and possible sources of inaccuracies can be found in Iglesias et al. 2022 [7]. In the literature, many approaches for parameter identification exist, which can be classified as either direct or indirect.
Direct methods aim at identifying the parameters by solving the system of differential equations of motion for the unknown stiffness and damping matrices in one step. However, parameters identified this way may not be physically meaningful anymore. As for the experimental models, this leads to simulation results being only valid in close vicinity to the machine configuration in which the reference data have been recorded [8,9].
In contrast, indirect methods try to identify the model parameters by adapting them iteratively, considering their sensitivity with respect to a chosen simulation outcome [10]. Another way to group parameter identification methods is by the complexity of the underlying system: model updating can either be performed on full-scale machine tool systems or smaller subsystems. The latter can mean, for example, that the parameters of theoretical machine tool simulation models are identified separately on distinct test benches [11,12]. Research with simplified feed drive models [13,14] also belongs to this group, as does the work of Mehrpouya et al. 2015, who identified the stiffness and damping properties of four joints between two plates using receptance coupling [15].
A completely different parameter identification approach on a subsystem is the method of sequential assembly [11,12]. Here, the system is assembled step by step. In parallel, the simulation model is also built incrementally so that it can be compared with the real system in every step. As for the identification using test benches, the basic idea of this method is that, in each step, only a few parameters, corresponding to the component that has been added last, have to be identified. This drastically reduces the complexity of the parametrization. However, identifying the overall model parameters on subsystems may not always be applicable since either appropriate test benches are not available or the disassembly of the machine tool is not possible for economic reasons. Furthermore, it is not guaranteed that the identified parameters are also valid on the completely assembled machine tool. For example, the leveling mount parameters exhibit large deviations depending on the assembly history of the machine tool [10].
Global methods aim to directly identify the parameters of theoretical models on the machine tool in its final assembly state. In Witt 2007, data from experimental modal analyses (EMA) were used as the input for an indirect stochastic optimization of 41 the stiffness and damping parameters of a machine tool [16]. Here, a large FEA model representing the machine tool in a single-axis position was combined with a genetic algorithm (GA). The optimization problem was constrained by expert knowledge, meaning that, for each parameter, a different mode was selected as the optimization target. Garitaonandia et al. 2008 also manually selected three eigenmodes as the target of their optimization, but used a Bayesian parameter-updating technique to identify stiffness parameters for the leveling mounts and the axial ball screw drive (BSD) stiffness [17]. Again, the reference data were acquired through an EMA. In contrast to the approaches presented so far, Hernandez-Vazquez et al. 2014 used two different machine tool configurations, that is two different axis positions, to update the Young modulus, joint stiffnesses, and lumped masses of the considered model [18]. By comparing the parameters with the ones obtained from using only one axis position, it was shown that globally valid parameters could be determined. The approaches presented so far used the computationally expensive FEA or flexible multibody simulation (MBS) models in their optimization routines. In Hernandez-Vazquez et al. 2018, the computational workload was drastically reduced by using quadratic response surfaces as surrogate models [19]. This way, optimal parameters for nine joint stiffnesses were found by matching the surrogate models with data from an EMA. However, no globally valid stiffness parameter for the axial replacement stiffness of the unconstrained degree of freedom (DOF) between the machine bed and the ram could be found. In contrast to the linear approaches presented so far, Semm et al. 2020 used a nonlinear flexible MBS model in their work [12]. However, before they identified the parameters of the leveling mounts and the profile rail system, the model was linearized. Again, the reference data were acquired by an EMA. Furthermore, the performance of two stochastic methods, namely a GA and a particle swarm optimization (PSO), and a deterministic sequential quadratic programming algorithm were compared. All these methods either require expert knowledge and manual effort [12,16,17] or can only be applied to moderately complex machine tool models with a limited number of unknown parameters [15,18,19].
In contrast, the present paper targets a fully automated identification of all unknown parameters for highly complex machine tool models. For this, global sensitivity analysis (GSA) is used to partition the overall identification problem into smaller, solvable subproblems, in a way similar to the involvement of expert knowledge in [12,16,17]. Since this has only been demonstrated exemplarily and only with limited success [20], this is the first such implementation in the field of structural dynamic machine tool models.
The remainder of this paper is structured as follows: In Section 2, requirements for the considered complex machine tool models and the available reference (i.e., training) data are defined, and the theoretical basics of GSA are given. After that, the proposed method for automatically identifying machine tool model parameters is explained generally. Section 3 starts with a detailed description of the used machine tool model and the involved model parameters. Following this, the effectiveness of the proposed approach is shown in two steps: First, reference data are simulated deploying a well-parameterized machine tool model and used to identify another instance of the model while pretending that its parameters are unknown. Here, the term “instance” refers to a copy of the model that may have a different set of machine tool parameters and, thus, may behave differently. Second, the very same reference data are used to parameterize an artificially disturbed model, hinting at the proposed approach’s robustness in terms of modeling errors. The paper is concluded with a summary and an outlook for future research (see Section 4).

2. Proposed Method

Rather than applying expert knowledge and manually splitting up the overall identification problem [12,16,17], an automated procedure is to be followed here. The involved machine tool model and its prerequisites are presented in Section 2.1. Section 2.2 gives an overview of the application of GSA for machine tool model identification. Last, a detailed description of the proposed approach is given in Section 2.3.

2.1. Starting Point

For this work, a position-flexible, dynamic, structural machine tool simulation model needs to exist, which can be evaluated for the modal parameters:
( f r , Φ r , ξ r ) = g ( p , r )
Here, f r is a vector of eigenfrequencies at the machine tool’s axis position r, Φ r is the corresponding matrix of eigenvectors, ξ r is the corresponding vector of modal damping ratios, g is a function representing the machine tool model, and  p is a vector containing all model parameters. Furthermore, four assumptions need to be made:
A1
A set of reference (i.e., training) modal parameters ( f r , r e f , Φ r , r e f , ξ r , r e f ) , which govern the machine tool’s vibrational behavior, exists. Since there is no significant coupling between modes, the eigenvectors and eigenfrequencies are independent of the structure’s damping. This holds true for weakly damped structures [9].
A2
There is a set of parameters p o p t such that
( f r , r e f , Φ r , r e f , ξ r , r e f ) = g ( p o p t , r ) ,
meaning that the model is capable of representing the reference data.
A3
Parameter bounds need to be known such that p o p t [ p m i n , p m a x ] , that is the search space must contain the true and globally valid machine tool parameters p o p t , which are to be identified.
A4
The machine tool model contains linear damping sources only. Thus, the overall modal damping of a mode i can be expressed as
ξ i , r = n = 1 N D Δ ξ i , n , r
with N D being the number of damping sources in the model and Δ ξ i , n , r being the contribution of damping source i to the overall damping [9].
Note that these assumptions have little effect on the universality of the proposed approach: Reference modal parameters can be easily acquired by an EMA, and machine tool structures are generally considered lightly damped [9,11,21], such that modal coupling can be neglected (A1). Assumption A2 only needs to be approximately true for a predictive model. Furthermore, usually, at least some knowledge exists from data sheets, experience, or comparable machines to estimate sufficient parameter bounds (A3), and even if nonlinear damping (A4) is present, it can be easily linearized using the approach presented in [21]. The linearization also remedies the need for extensive time-domain simulations and, thus, speeds up the model evaluations. This is beneficial for both GSA and optimization algorithms that require many model evaluations (see Equation (1)). As examples of suitable models for the approach presented in this work, the position-flexible MBS models of [22] or models created by the simulation environment MORe [23] can be named.

2.2. Global Sensitivity Analysis for Machine Tool Models

For partitioning the overall parameter identification problem into smaller, solvable subproblems, variance-based GSA is used here. Eventually, this leads to a set of parameters such that the model predicts the reference modal parameters well (see Section 2.2). In this publication, the match between the predicted and the reference modal parameters is quantified by the extended modal assurance criterion (MACXP) [24]:
MACXP ( φ 1 , φ 2 ) = | φ 1 * φ 2 | | λ 1 * + λ 2 | + | φ 1 T φ 2 | | λ 1 + λ 2 | 2 | φ 1 * φ 1 | 2 | Re ( λ 1 ) | + | φ 1 T φ 1 | 2 | λ 1 | | φ 2 * φ 2 | 2 | Re ( λ 2 ) | + | φ 2 T φ 2 | 2 | λ 2 |
and the squared natural damping difference (NDD):
NDD 2 ( ξ 1 , ξ 2 ) = ( N D D ( ξ 1 , ξ 2 ) ) 2 = ξ 1 ξ 2 ξ 2 2
analogous to the natural frequency difference (NFD) [25]. Here, φ 1 and φ 2 = φ r e f are the calculated and reference eigenvectors, λ 1 and λ 2 = λ r e f are the calculated and reference eigenvalues, and  ξ 1 and ξ 2 = ξ r e f are the calculated and reference modal damping values. Compared to the standard modal assurance criterion (MAC), the MACXP significantly improves the distinction of modes when only a limited number of measurements is available [24]. Because of this, the MACXP is used not only to measure the model’s accuracy, but also to find the right mode to compare in the first place.
Both the MACXP and the squared natural damping difference (NDD 2 ) can be represented by the so-called high-dimensional model representation (HDMR):
f ( p ) = f 0 + i f i ( p i ) + i j > i f i , j ( p i , p j ) + + f 1 , 2 , , k ( p )
defined for square-integrable functions f (e.g., MACXP or NDD 2 ) whose argument p (e.g., the machine tool model parameters) is defined in an n-dimensional unit hypercube [26]. In Equation (6), f i ( p i ) represents the (first-order) effect of parameter p i on the model’s conformity, f i , j ( p i , p j ) the joint contribution of the parameters p i and p j exceeding their first-order effects, and so on. Equation (6) can be reformulated to the analysis of variance (ANOVA) HDMR using the orthogonality properties between any pairs of terms and square integration [26]:
V = V 0 + i V i + i j > i V i , j + + V 1 , 2 , , k ,
with V = V ( f ) being the total variance, V i = V ( f i ) being the variance caused by parameter p i , and  V i , j = V ( f i , j ) being the variance caused by the interaction of parameters p i and p j [26]. In other words, V represents, for example, the total variance of the model’s NDD 2 value and V i the contribution of parameter p i to the total variance. The so-called Sobol indices are calculated by dividing both sides by the total variance V:
1 = i S i + i j > i S i , j + + S 1 , 2 , , k ,
indicating shares of variance [26]. The total effect of a parameter p i :
S T i = S i + j i S i , j + + S 1 , 2 , k ,
is simply the sum of all its shares. Here, S T i = 0 is a necessary and sufficient condition for parameter p i being non-influential [26].
The GSAs in this work were implemented using the Python package SALib [27].

2.3. Identification Procedure

The parameters of the machine tool model (see Section 2.1) can be identified in three steps, which are visualized in Figure 1: Starting from a preliminary (i.e., only roughly parameterized) machine tool model, the overall identification problem with a high number of unknown parameters is divided into many smaller identification problems with just a few unknown parameters each. This is performed by GSA. Second, all stiffness parameters can be identified by using classical optimization algorithms. Third, the model’s damping parameters are estimated using the least-squares (LS) method, leading to the final identified machine tool model.

2.3.1. Partitioning of the Overall Identification Problem via GSAs

For each reference mode at each machine tool axis position, two GSAs are conducted. One uses the MACXP between the reference and the simulated mode, and the other uses the NDD 2 between the reference and simulated damping as scalar model output. This results in
N G S A = 2 N m o d e s N p o s
separate GSAs with N m o d e s being the number of reference modes and N p o s being the number of axis positions, emphasizing the need for a computationally efficient model. As a result, the model parameters p can now be ranked by their degree of influence on each mode’s shape and damping. In other words, modes can be found that are only affected by a handful of model parameters, leading to the desired partitioning of the overall identification problem. More information can be found in [20], where this was already shown exemplarily.

2.3.2. Stiffness Parameter Identification

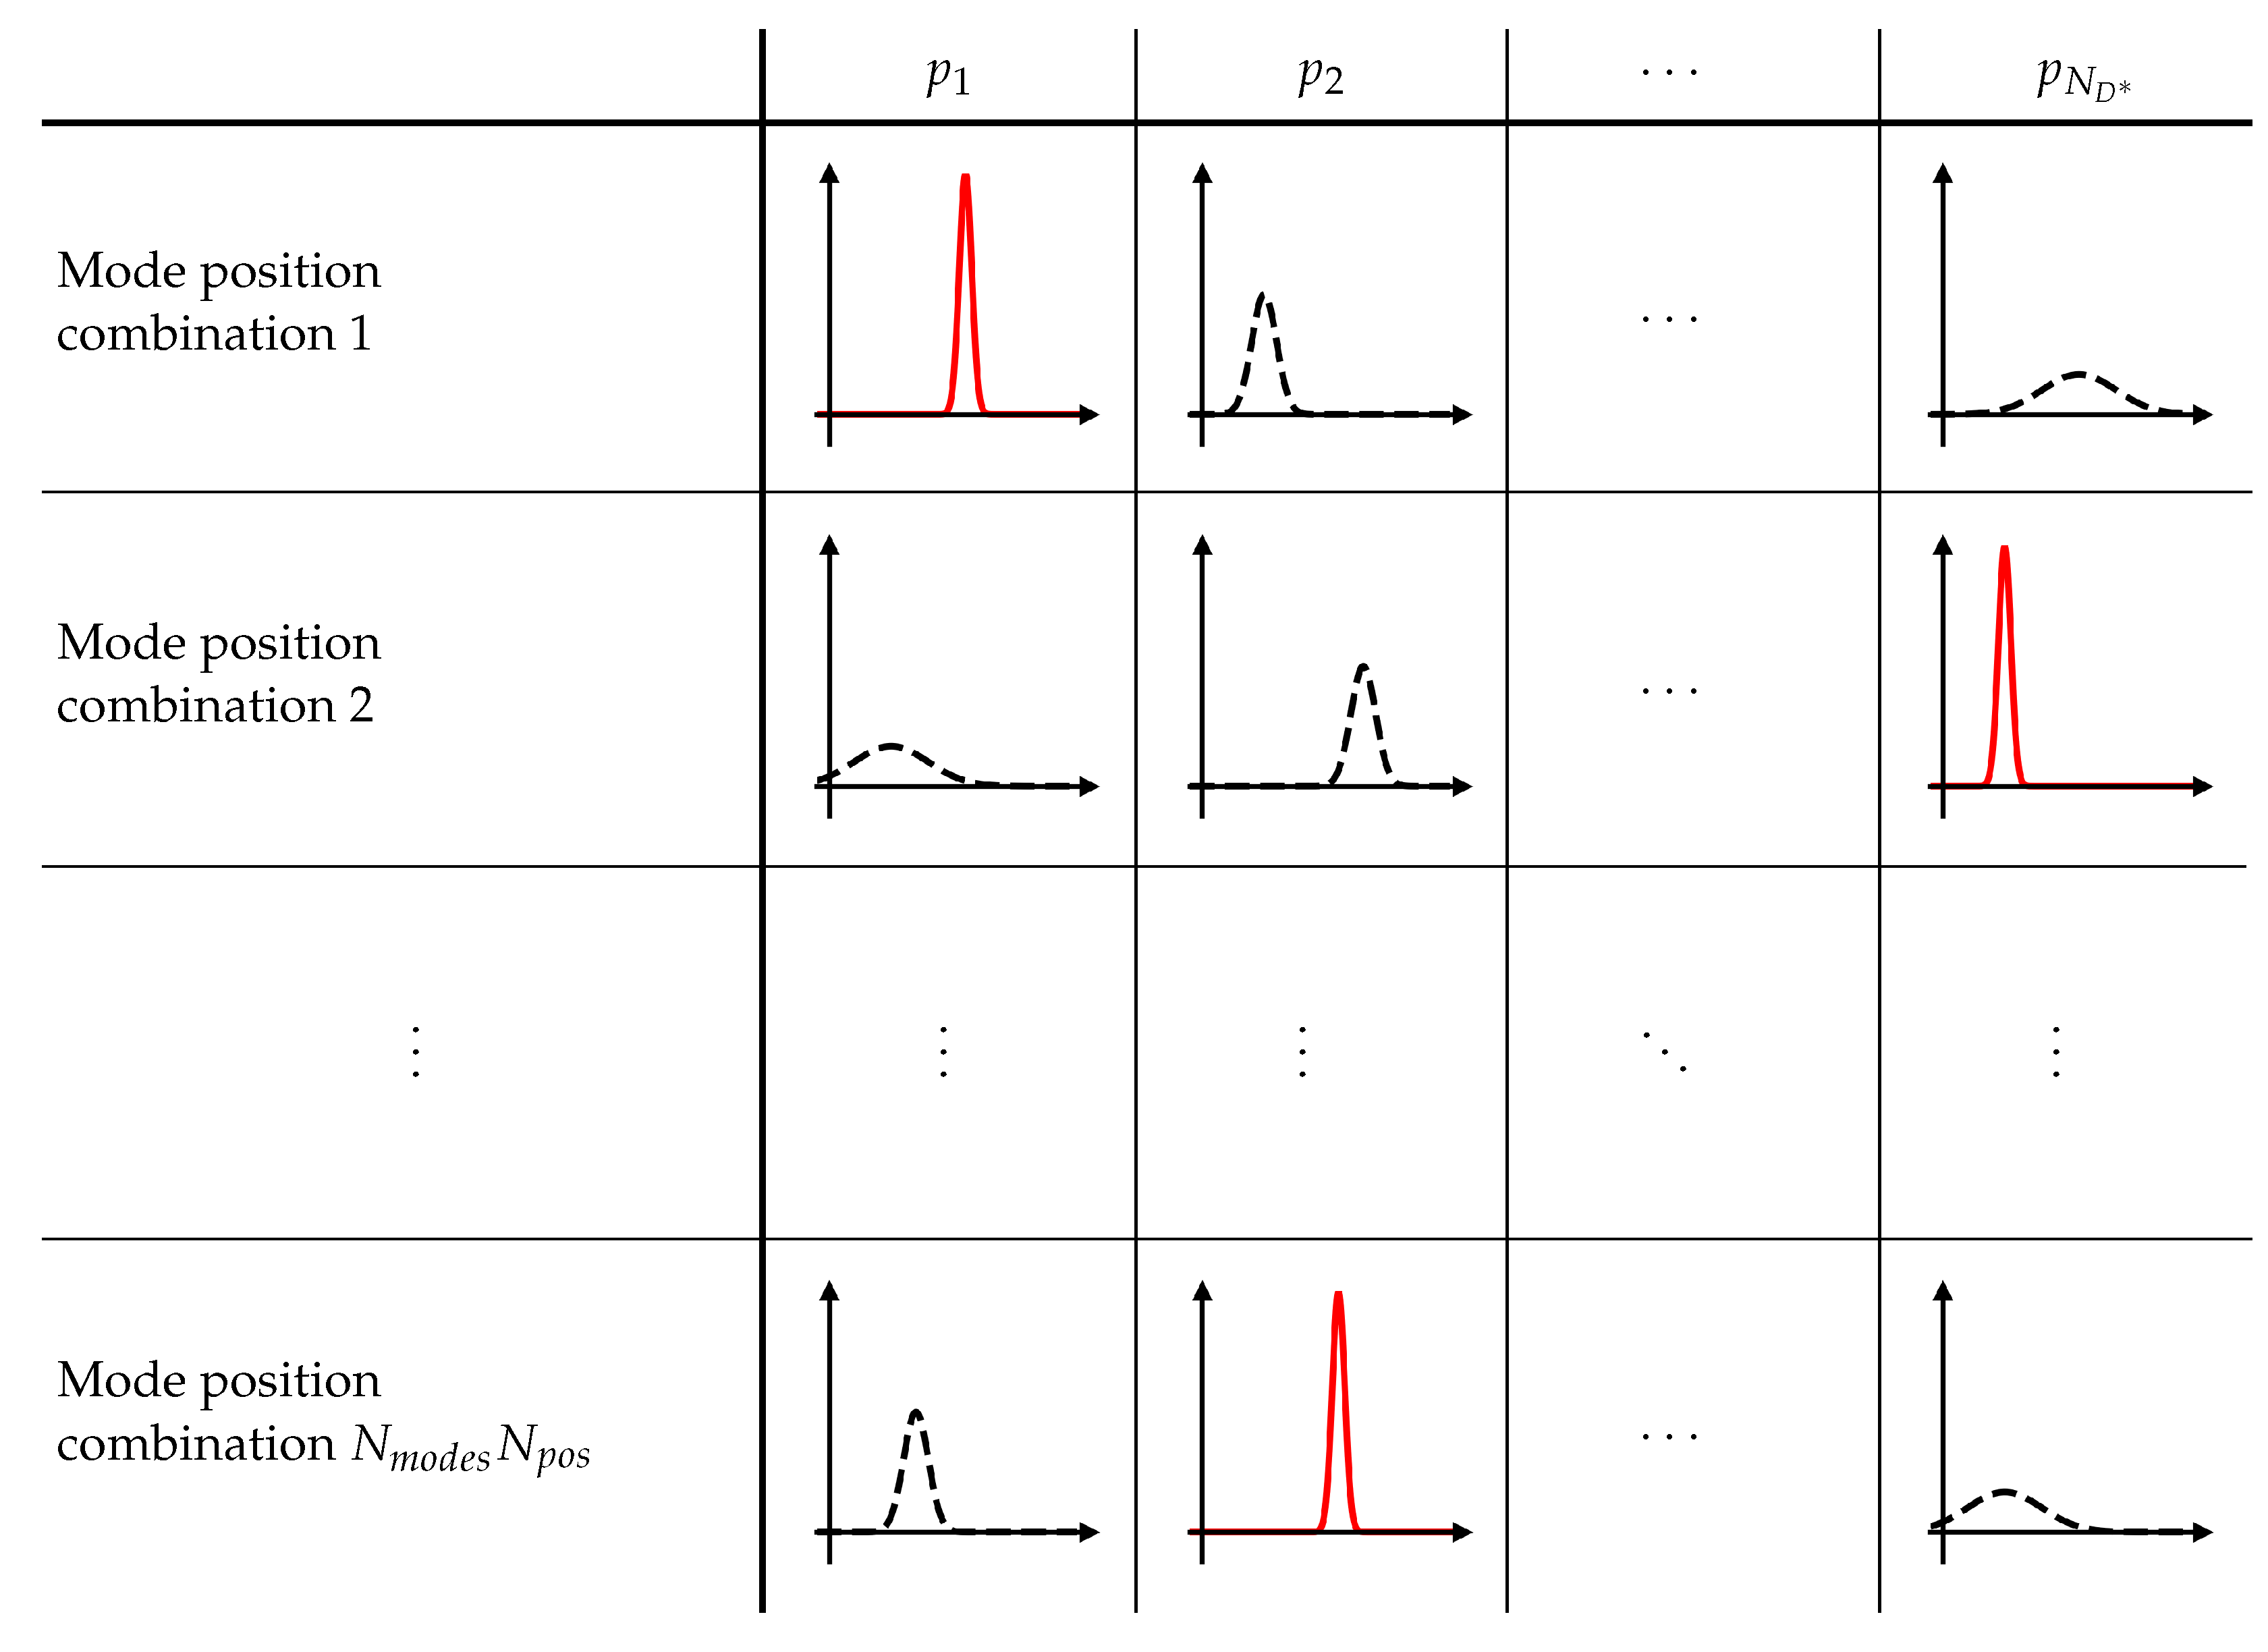
As the model’s damping parameters do not influence the simulated mode shapes and eigenfrequencies (see Assumption A1 in Section 2.1), the overall identification problem can be further simplified by determining the stiffness parameters first. The partitioning via GSAs leads to N m o d e s N p o s (see Equation (10)) identification problems with only a handful of search parameters each [20]. Even though the partitioning eliminates most of the local minima of the overall optimization problem, which would lead to only locally valid and non-physical machine tool model parameters, some are still present [20]. To overcome this problem, a brute-force approach, which is illustrated by Figure 2, is deployed here: Each of the N m o d e s N p o s smaller identification problems is repeated N o p t times. It is assumed that if all repetitions have ended up at (nearly) the same result (i.e., the same values for the search parameters), a global optimum is found. This is assessed by the standard deviation of each parameter for each identification subproblem. In the end, the mean value of all repetitions from the subproblem with the least standard deviation for each parameter is chosen as the final result.
Note that, in contrast to the depiction in Figure 2, not all, but just a few parameters are searched for each position–mode combination as a result of the preceding GSA.

2.3.3. Damping Parameter Identification

For lightly damped machine tool models with linear damping only (see Assumptions A1 and A4 in Section 2.1), the overall modal damping of mode i at machine tool axis position r can be split up as
ξ i , r = ξ i , p , r + ξ i , p ¯ r
with ξ i , p , r being the share depending on the unknown model parameters p and ξ i , p ¯ r already-identified damping sources in the model, such as known damping parameters or material damping. Making use of their linearity [9], the former can be expressed by
ξ i , p , r = n N D * q i , n , r p n = ξ i , r ξ i , p ¯ r = : ξ i , r e s , r .
Here, N D * is the set of all yet-unidentified damping sources with N D * members, ξ i , r e s , r is the residual damping of mode i at position r, and q i , n , r is a factor quantifying the contribution of model parameter p n to the overall modal damping, which depends on the system’s eigenfrequencies and mode shapes [9]. In matrix form, Equation (12) becomes
Q p = ξ r e s , r ,
with the dimensions of Q being N m o d e s N p o s × N D * , as Equation (12) can be set up for each reference mode at each machine tool axis position. If N m o d e s N p o s N D * , the application of the LS on Equation (13) yields a unique solution, resulting in estimates for all unknown damping model parameters.

3. Sensitivity-Guided Parameter Identification

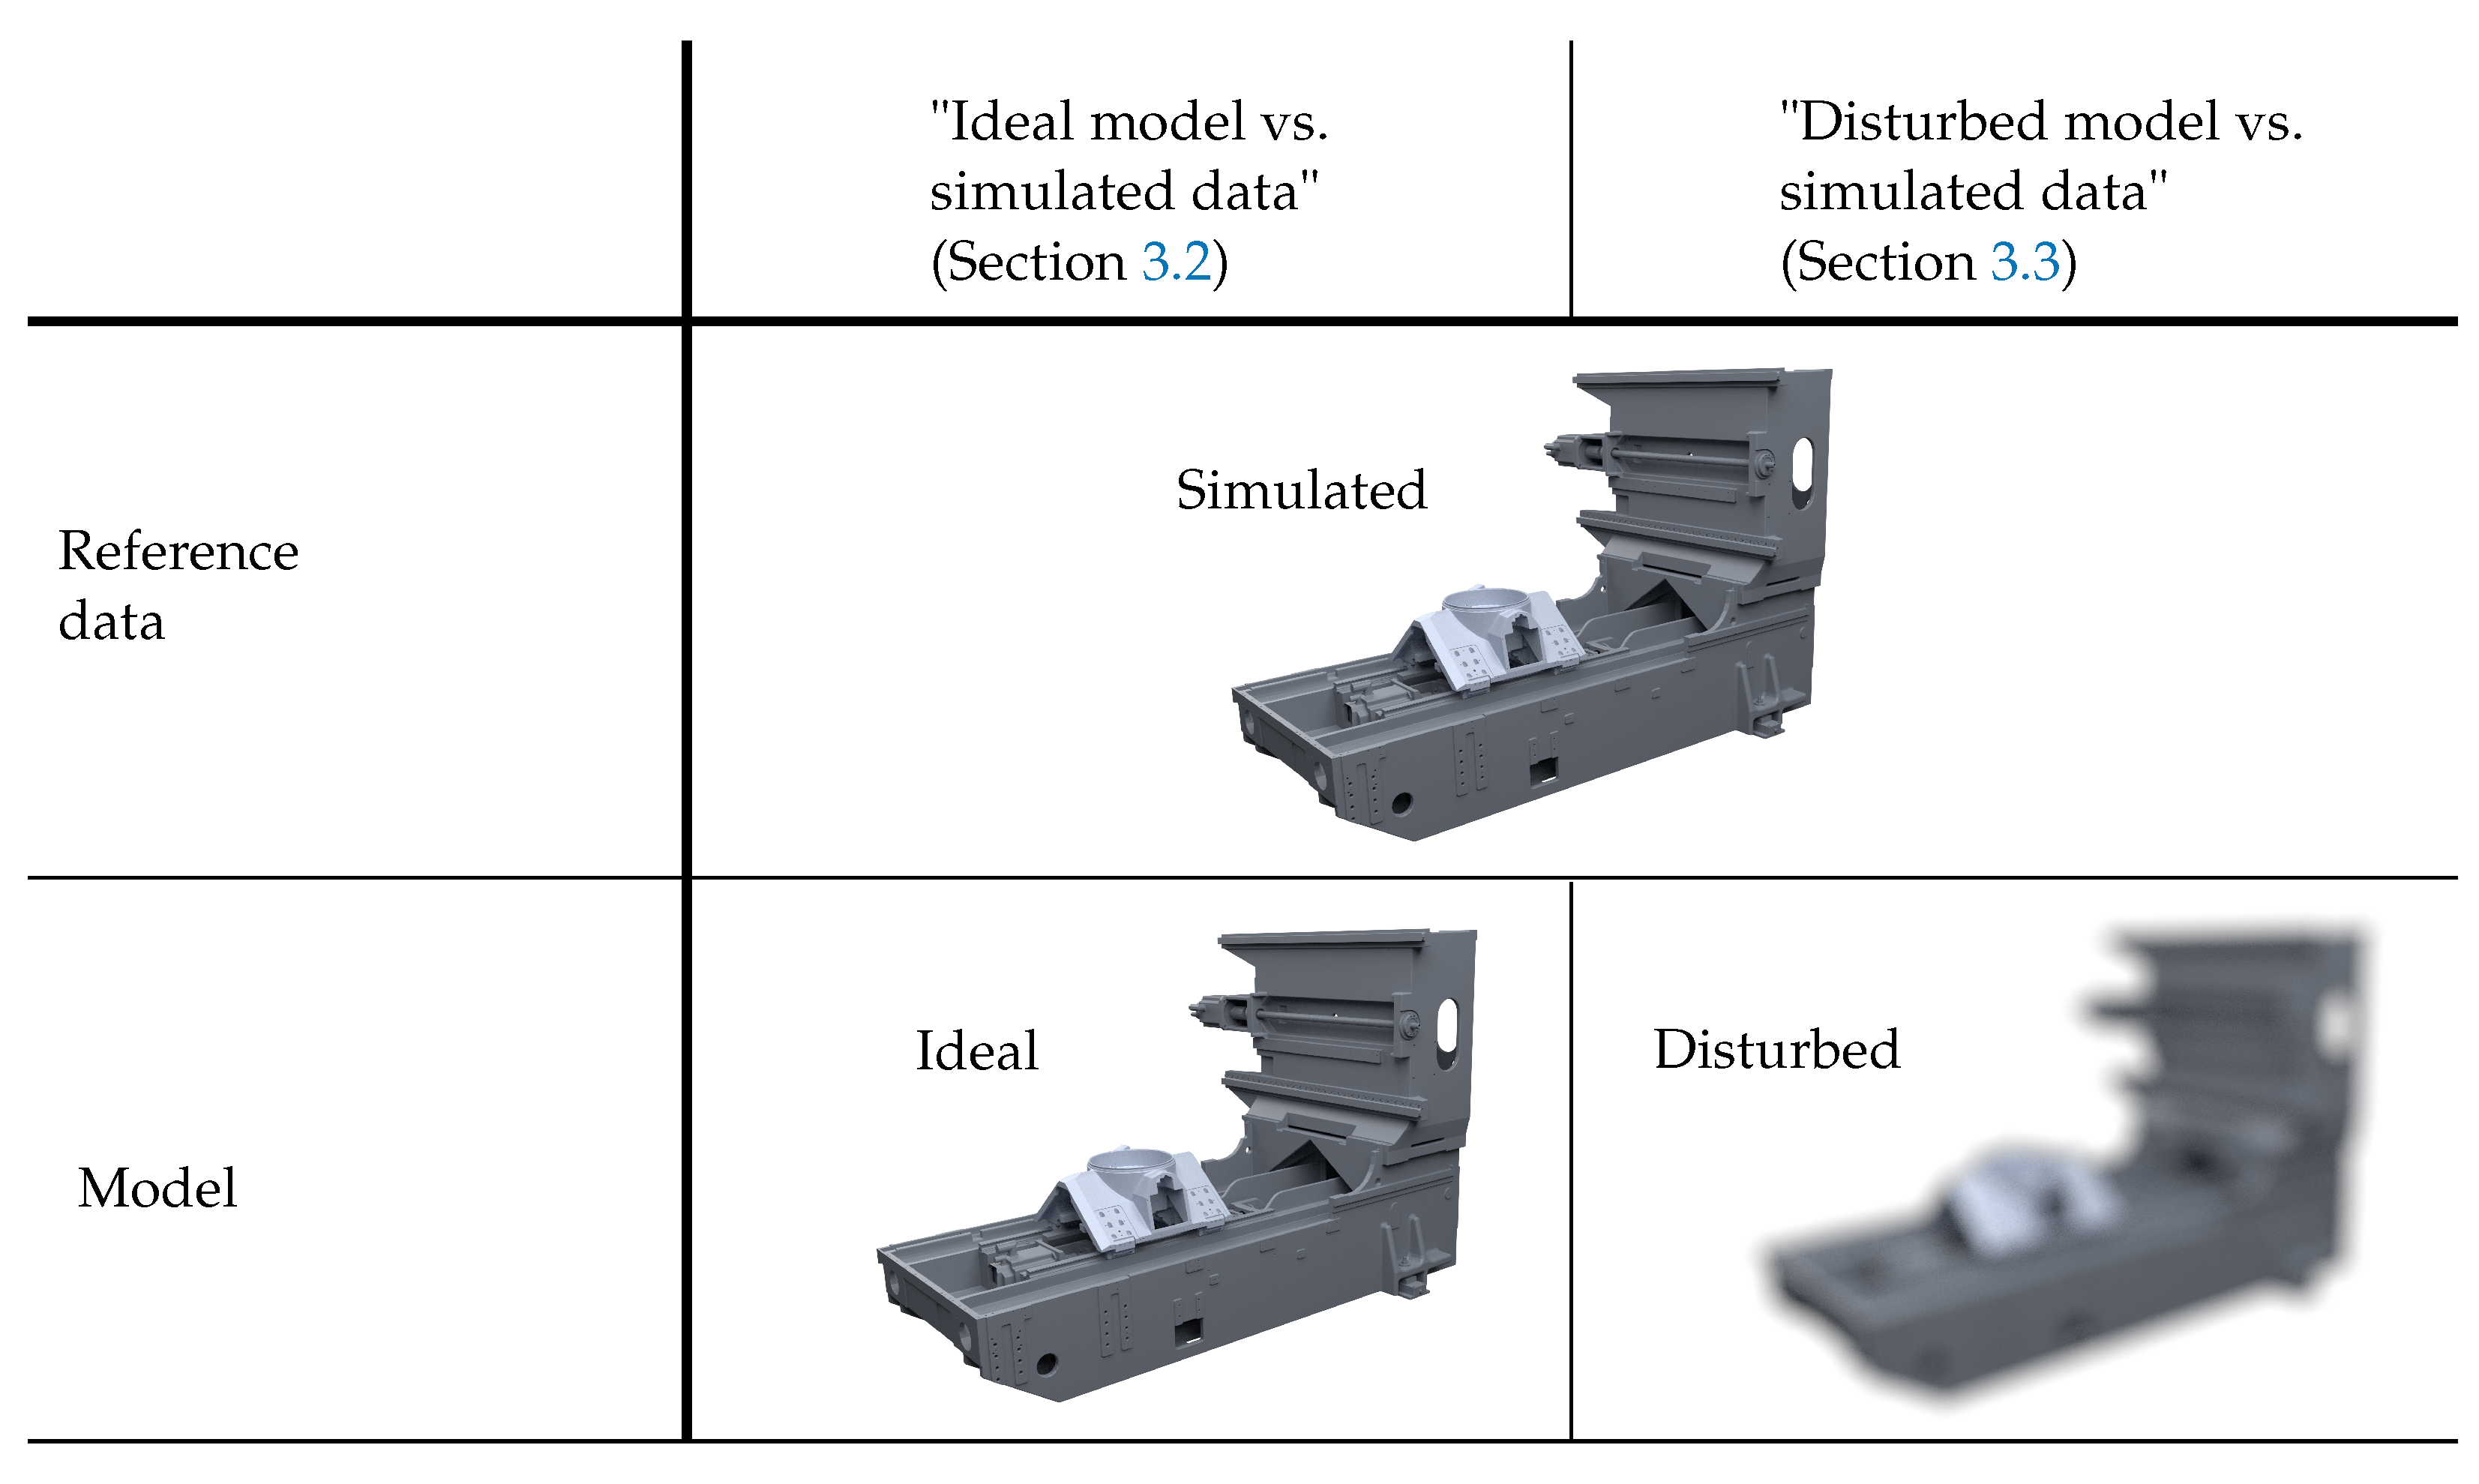
The capability of the proposed approach (see Section 2) is demonstrated in two steps: First, a machine tool model is parameterized using simulated reference (i.e., training) data from another instance of the model with known parameters in Section 3.2. In a second step, a similar, but not identical, model is used for generating reference data for the parameter identification. This is shown in Section 3.3. This procedure is also illustrated in Figure 3. All steps refer to a four-axis machine tool model in uniaxial configuration, which is described in detail in Section 3.1

3.1. Machine Tool Structure and Model Description

Here, the proposed approach was applied to a four-axis machine tool model in uniaxial configuration, which is depicted in Figure 4. For this system, a high-fidelity and well-parameterized model with a high conformity to the real machine tool structure exists [6], which can be used to simulate reference data and validate the method presented here without measurement and modeling errors. Due to a beneficial combination of substructuring, MOR [28], and the linearization of the involved nonlinear friction models [21], the model is computationally efficient, parametric, and, at the same time, position-flexible. Note that some parameters of the original unreduced model, as, for example, the components’ Young’s moduli, are fixed after the MOR and cannot be identified here. However, this is not a drawback of the presented approach, but the examined model and could be overcome with more advanced MOR approaches. The model has already been subjected to a dimensionality reduction step [20], resulting in the following 27 unknown machine tool parameters representing the lumped stiffness and damping properties of:
  • The three mounting elements (MEs) ( k x , k y , k z , b x , b z , d y each)
  • The fixed bearing (FB) supporting the BSD ( k z )
  • The coupling (CPL) between the motor shaft and the BSD ( k r z , d r z )
  • The BSD ( k z , d r z );
  • The linear guiding system (LGS) ( k x , k y , k r x , k r y used for all four shoes)
Here, indices indicate the direction of the stiffness (k) and viscous (b) and hysteretic (d) damping parameters.
Note that the considered machine tool system fulfills all assumptions stated in Section 2.1: Modal parameters can be simulated with high accordance [6], and the machine tool is lightly damped [11,21] (A1 and A2). Suitable bounds can, in this case, be easily chosen since the true model parameters are already known (A3). Here, the intervals:
p i [ 0.7 p i , o p t , 1.3 p i , o p t ]   for stiffness and 1 3 p i , o p t , 3 p i , o p t ]   for damping parameters
are used. In real-world scenarios, where the true model parameters are unknown, these intervals are believed to be large enough to ensure the validity of assumption A3 even when only data sheet values provided by the machine tool component manufacturers or values from similar machine tools are known. Lastly, all nonlinear damping sources were linearized and replaced by spring–damper systems (A4) [21].
For evaluating the machine tool’s modal parameters, 32 nodes (see Table 1 and Figure 4) were used in the simulations. Both the computational modal analysis and the EMA were conducted at four axis positions covering the full motion range of the z-axis ( z 1 = 294   m m , z 2 = 60   m m , z 3 = 135   m m , and z 4 = 330   m m ). Note that there is no unconstrained DOF in the model since the motor brake of the x-axis is applied and the z-axis is constrained by the linear replacement stiffness resulting from the friction model linearization [12].

3.2. Parameter Identification of an Ideal Machine Tool Model

To demonstrate the effectiveness of the proposed approach, an ideal test case was set up first (i.e., “ideal model vs. simulated data”). Reference data were simulated using the model described in Section 3.1. Thus, in this case, the parameters to be identified are already known in advance, enabling a direct evaluation of the final identification results in addition to an indirect evaluation in terms of model evaluation criteria (e.g., frequency response assurance criterion (FRAC) [29], cross-signature scale factor (CSF) [30], MACXP, and NDD). The data comprise the first 20 modes covering the frequency range up to 311 Hz and four axis positions, of which three are used in the identification ( z 2 , z 3 , and z 4 ) and one is held back for validation purposes ( z 1 ). Modes with higher eigenfrequencies are not related to the machine tool structure, but the workpiece or the tool [31,32] and are excluded from further consideration. Afterward, random values (within their bounds defined in Equation (14)) are assigned to all 27 model parameters, providing the starting point for the identification procedure. All computations were performed on a state-of-the-art workstation with 40 Intel® Xeon® Gold 6148 CPU cores.
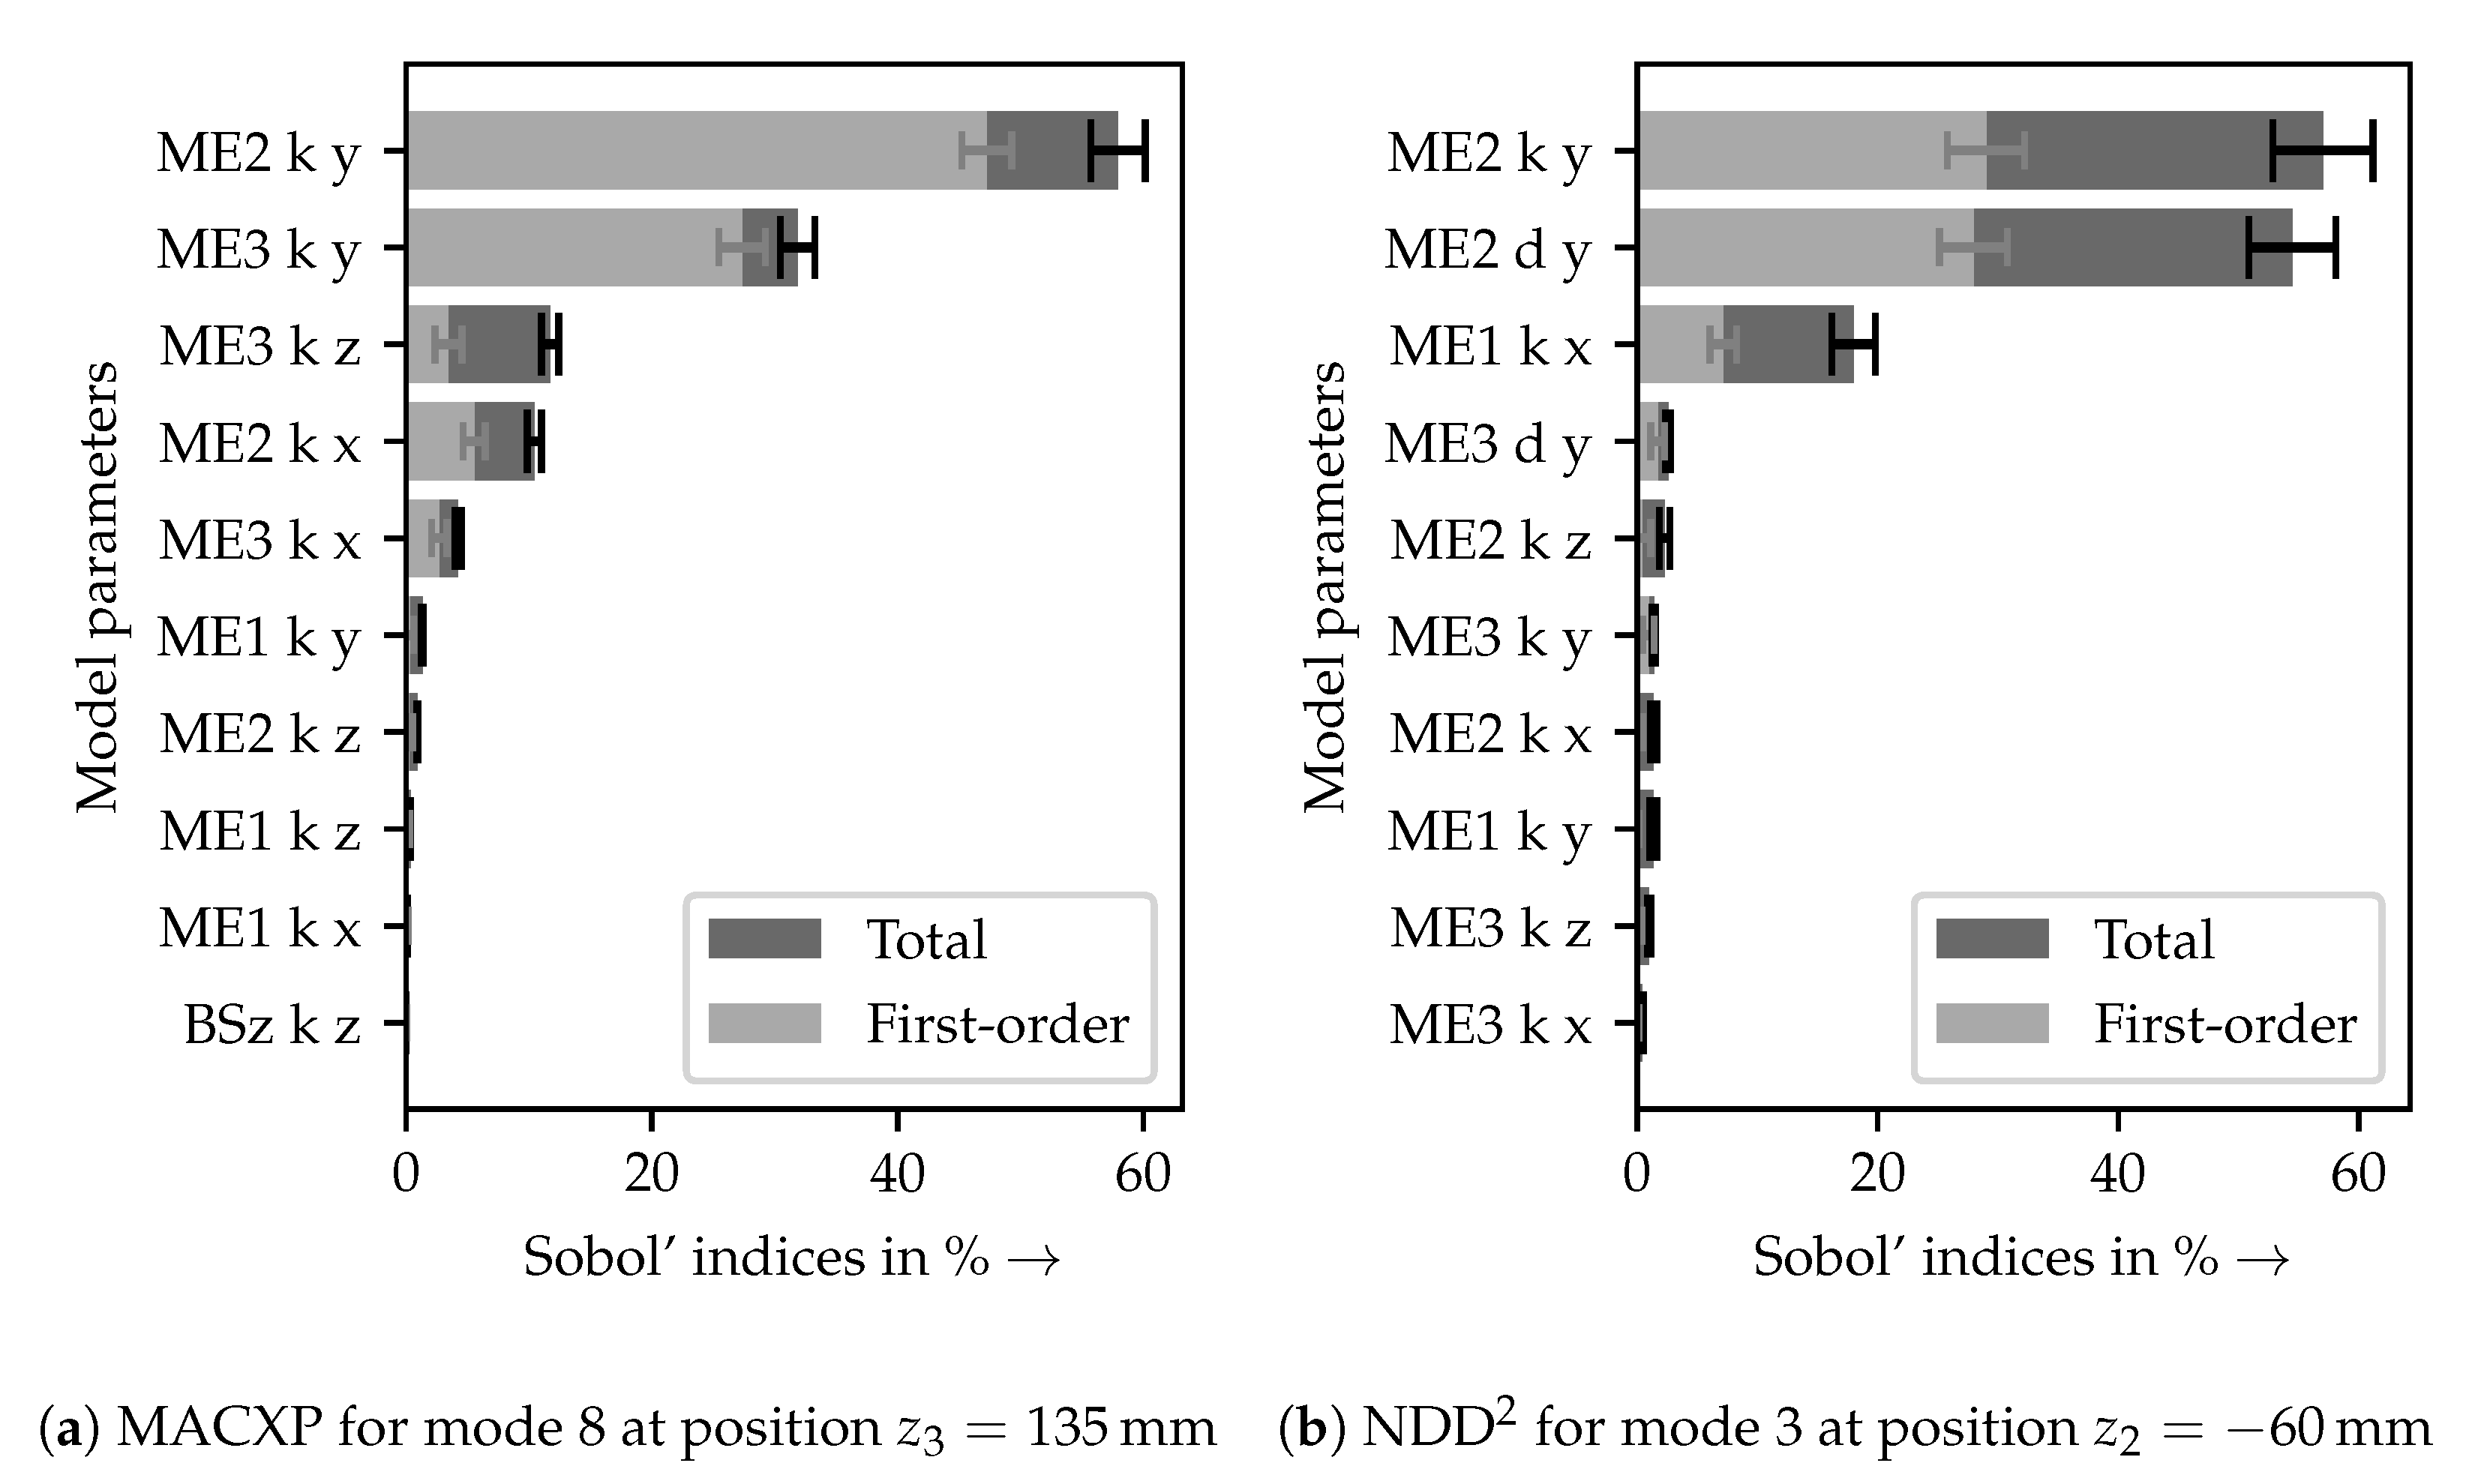
Following the approach in Section 2.3, 120 GSAs (see Equation (10)) were performed for each of the 20 modes at three axis positions for both the MACXP and NDD 2 . On the available workstation, this resulted in a computation time of 1 h 4 min . Figure 5 exemplarily shows two resulting parameter rankings for different position–mode combinations. It can be seen that instead of all 27 model parameters, in both cases, only a few parameters significantly affect the specific model outcomes (i.e., the fit criteria for the displayed modes at the chosen position). The GSA results can also be confirmed by looking at the mode shapes: For example, mode 8 at position z 3 = 135   m m (see Figure 5a) at 75.5   Hz is the first bending mode of the machine tool bed in the y z -plane. This mainly involves large vertical (y-axis) movements of the back MEs (i.e., ME2 and ME3), making them the most significant parameters. Other ME parameters are significant as well due to smaller movements because of asymmetries in the machine tool model. More importantly, feed drive parameters (e.g., BSD, CPL, and FB) are missing here since there is no deformation of the feed drive, but only movement in the unconstrained screw DOF of the BSD. Note that there is, per the definition (see assumption A1 in Section 2.1), no influence of the damping parameters on the MACXP.
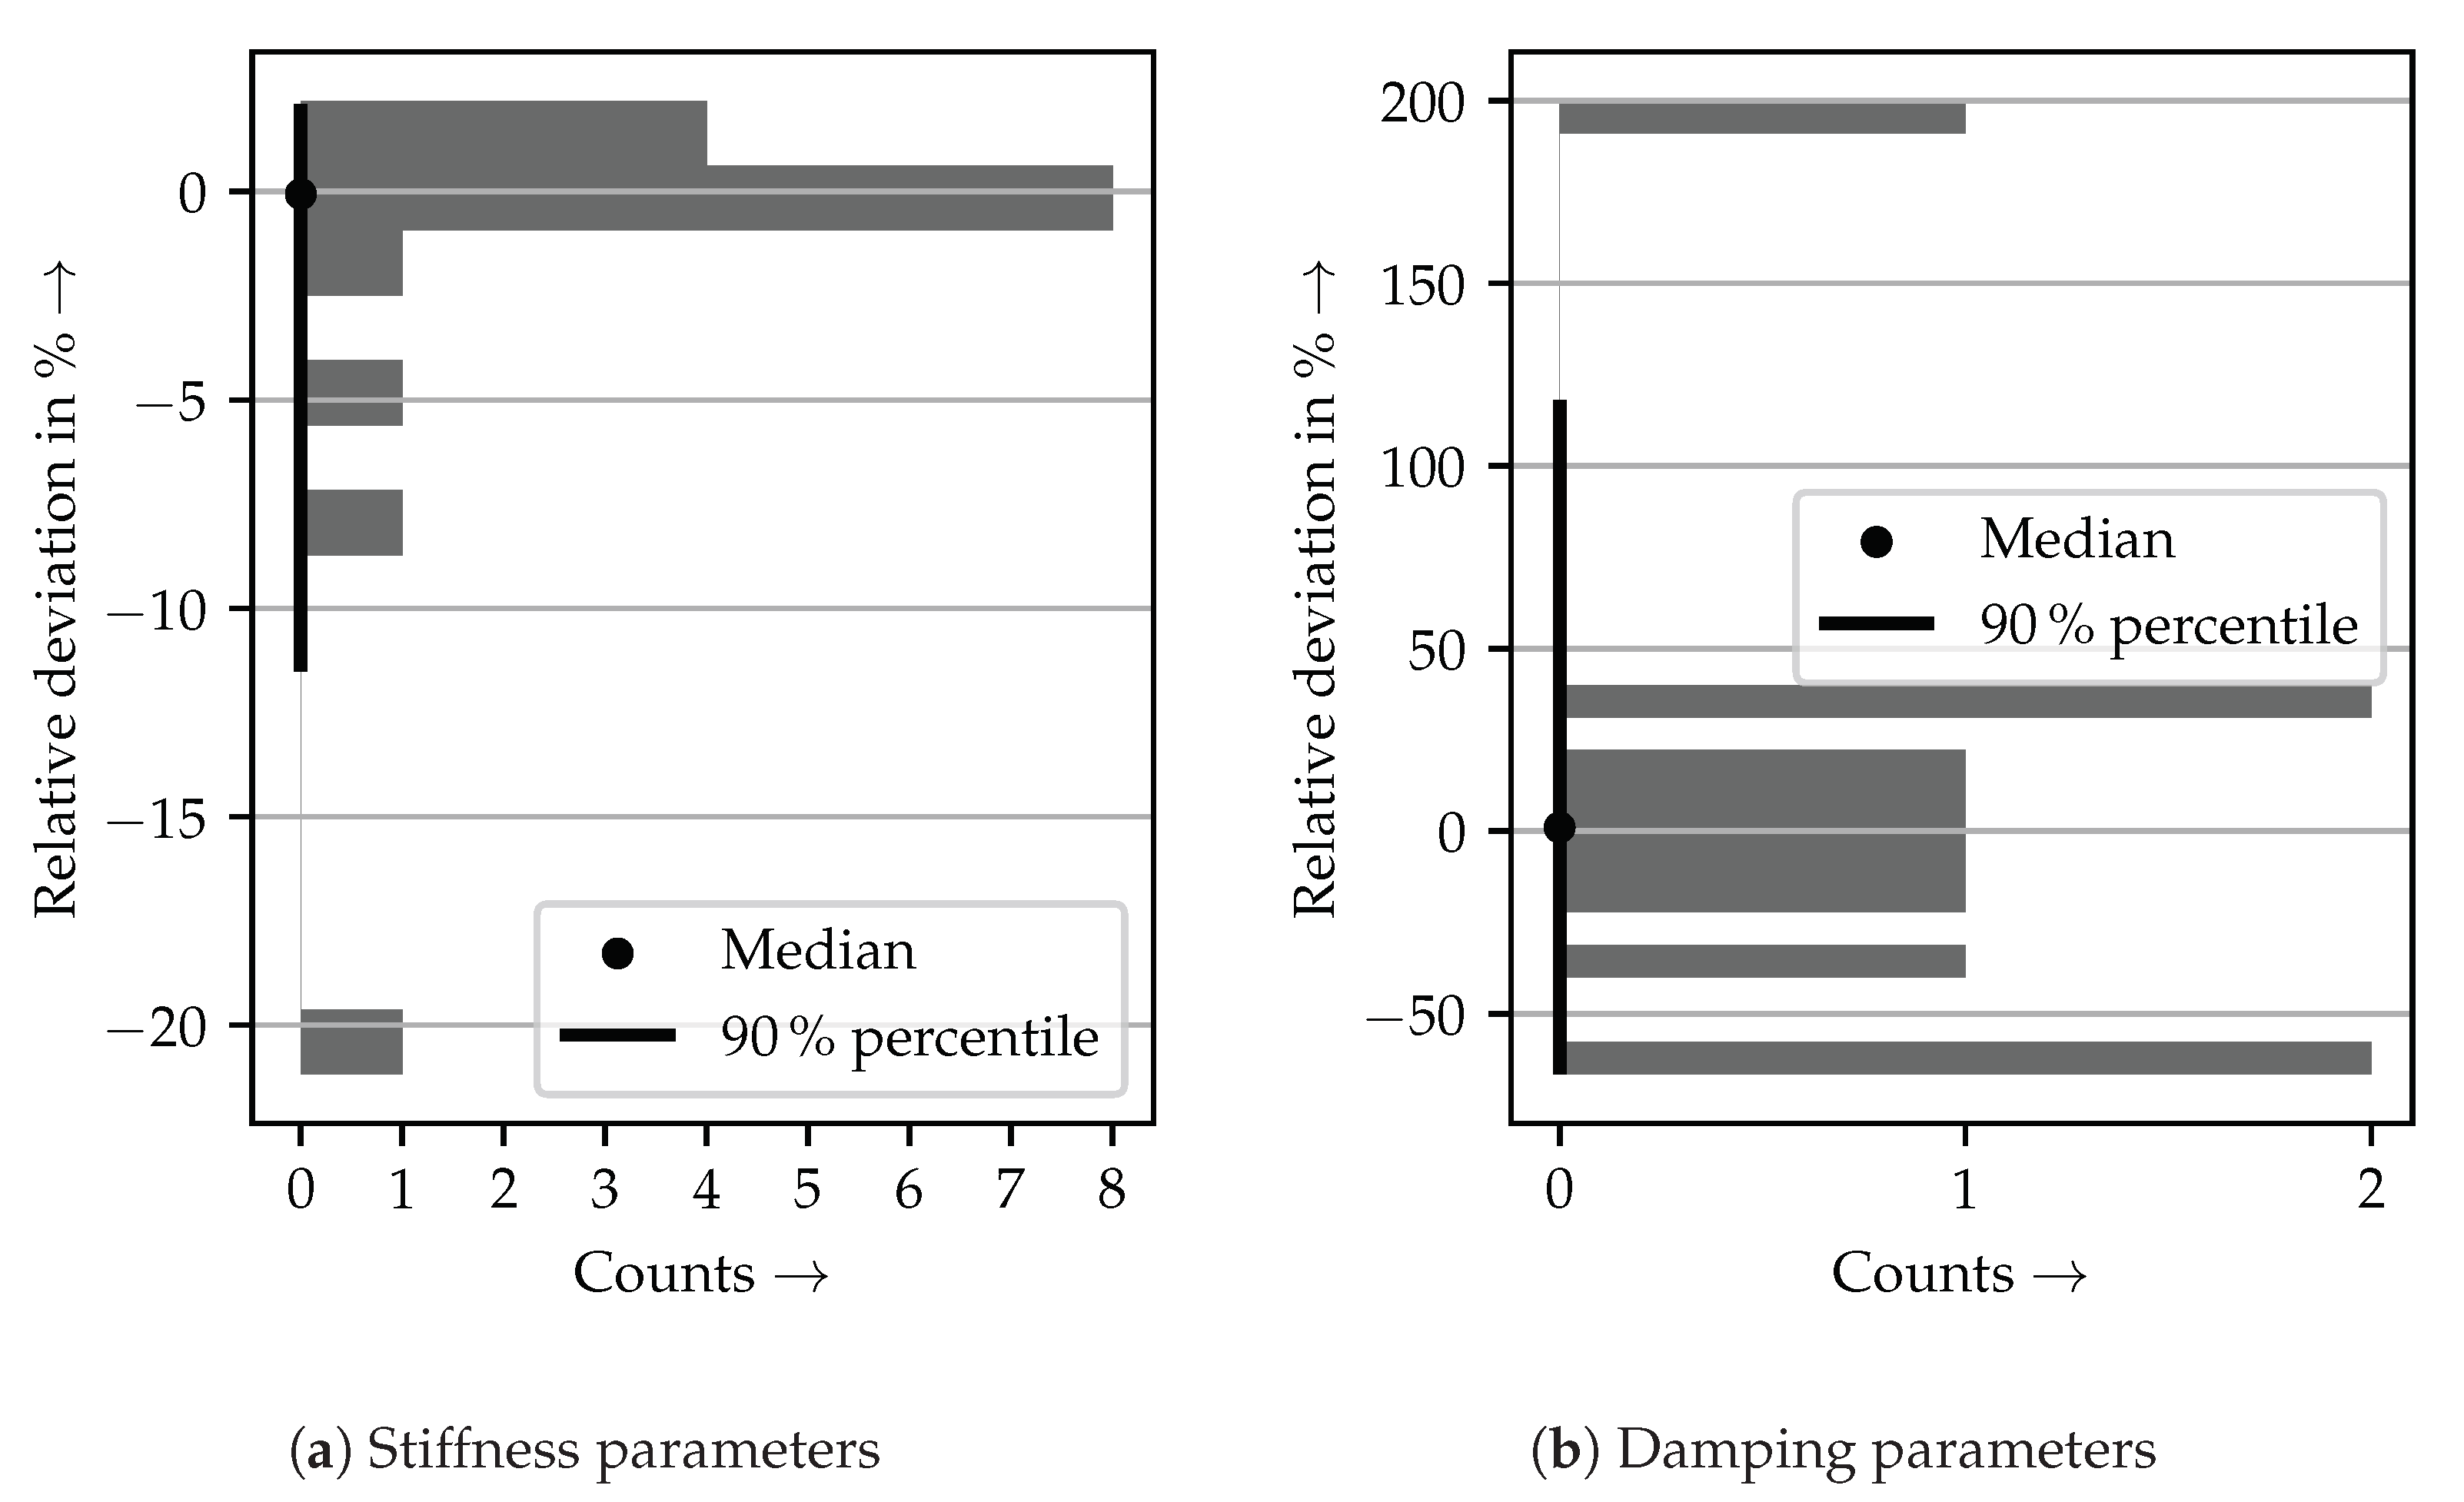
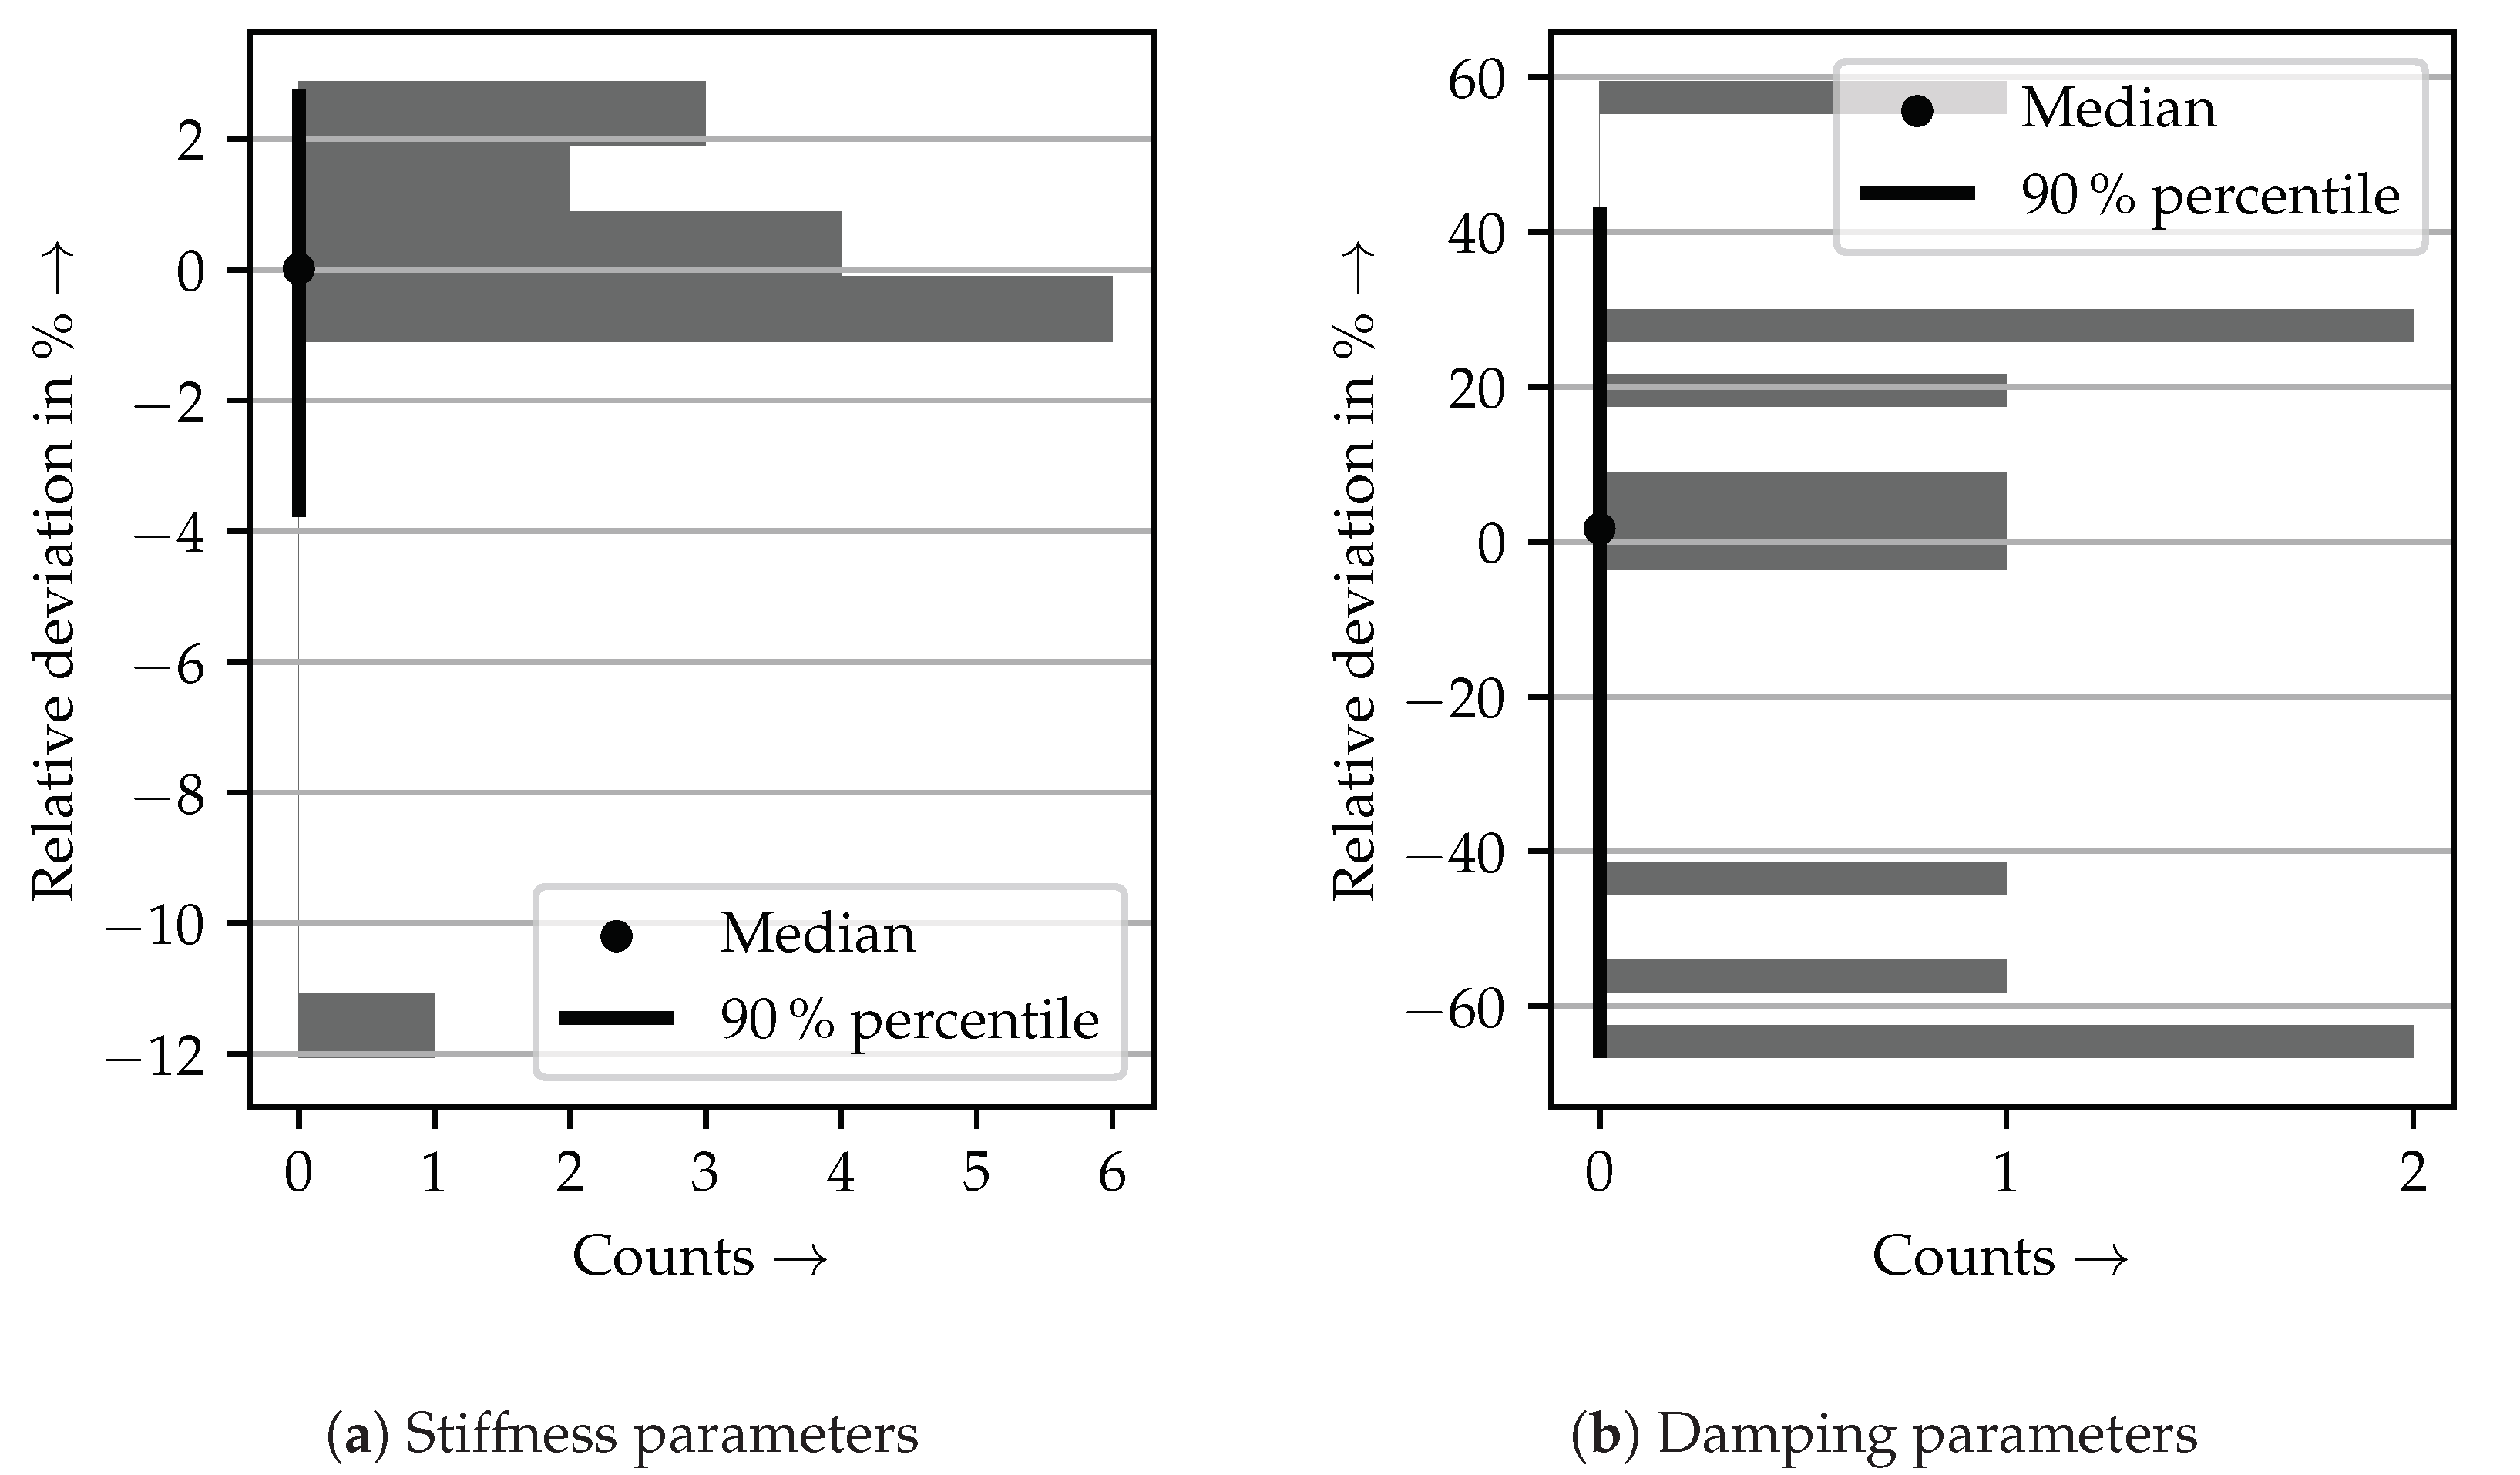
This knowledge can be exploited by setting up optimization problems searching for only the significant parameters while using fixed arbitrary values for the rest. Here, significant parameters were distinguished from non-significant ones by a threshold of 1% regarding their total effect. To circumvent still-existing local minima [20], 60 (i.e., N m o d e s N p o s ) optimization problems were set up for all position–mode combinations with the MACXP and repeated N o p t = 100 times, resulting in total in 6000 independent optimization problems. As the number of unknown parameters is small for each individual run, gradient-based algorithms can be efficiently used. The sequential least-squares programming (SLSQP) approach [33] was implemented in this work, resulting in an overall computation time of 1 h 8 min . Each optimization run ended up at different final values for the significant (search) parameters because local minima are present, and the non-significant parameters and the initial values for the search parameters were chosen randomly. The final identified stiffness parameter values were determined as the mean value of all repetitions from the position–mode combination with the smallest standard deviations (see Section 2.3). Figure 6a shows the relative deviation of the selected stiffness parameter values from their, in this case, true known values. It can be seen that all parameters but two were identified almost perfectly with deviations of less than 5%. Only the stiffnesses of the first and second MEs in the z-direction (ME1 k z and ME2 k z) were identified poorly with deviations of 21.2 % and 8.3 %, respectively. However, the high conformity with the reference frequency response function (FRF) shown in Figure 7 indicates that the influence of these model parameters is small. Minimal deviations toward higher stiffnesses of the other model parameters seem to be able to compensate the underestimated MEs’ stiffnesses in the z-direction.
In the next step, the model’s damping parameters can be identified using an LS approach, which was described in Section 2.3. In principle, an LS problem could be set up with all position–mode combinations with NDD 2 . To avoid the propagation of errors, only the 20 position–mode combinations with the lowest influence of all non-search parameters on the NDD 2 were selected. This information can be directly taken from the GSAs conducted before. To reduce numerical errors, the number of equations was further reduced by removing all rows from Equation (13) with a residual damping ξ i , r e s , r smaller than 0.5%, resulting in 18 equations for 11 unknown damping parameters. The relative deviations of the identified damping parameters from their, in this case, known values can be found in Figure 6b. It can be seen that approximately half of the parameters can be identified with a still reasonably good accuracy of ± 30 %. The rest is spread all over the allowed interval (see Equation (14)) with some parameters even at their limits as, for example, the rotary hysteretic damping of the coupling (CPL d rz) and the viscous damping of the second ME in the x-direction (ME2 b x) with deviations of + 200 % and 67.7 %, respectively. It is important to note that this is not a shortcoming of the damping parameter identification approach. The targeted parameters were found almost perfectly with maximum deviations of 0.01 % when it was assumed that the perfect stiffness parameters were found before. This can be explained by again looking at Figure 5b, which shows that the model’s stiffness parameters influence the NDD 2 value and, with it, the modal damping. From the latter, the right-hand side of the LS problem for the damping estimation was constructed (see Section 2.3.3), leading to the displayed deviations.
Table 2 demonstrates the accuracy of the identified model in terms of common model evaluation criteria (i.e., FRAC, CSF, MACXP, and NDD) for the evaluated modes at the three axis positions considered in the identification ( z 2 , z 3 , and z 4 ). In general, FRAC and CSF values above 80% [11] or even above 70% [21] are considered a good match. Thus, it can be stated that the model’s conformity is very high, with worst-case FRAC, CSF and MACXP values of 84.9 % and mean values close to 100%. Note, that the worst-case NDD indicates a relative and not absolute deviation of 4.1 %, which is also very low. Table 3 shows the same data considering only the validation position z 1 . The FRAC and CSF values are a bit lower, but in the same range. However, the modal fitness values are very similar with worst-case MACXP and NDD values of 99.9 % and 5.5 %, respectively.
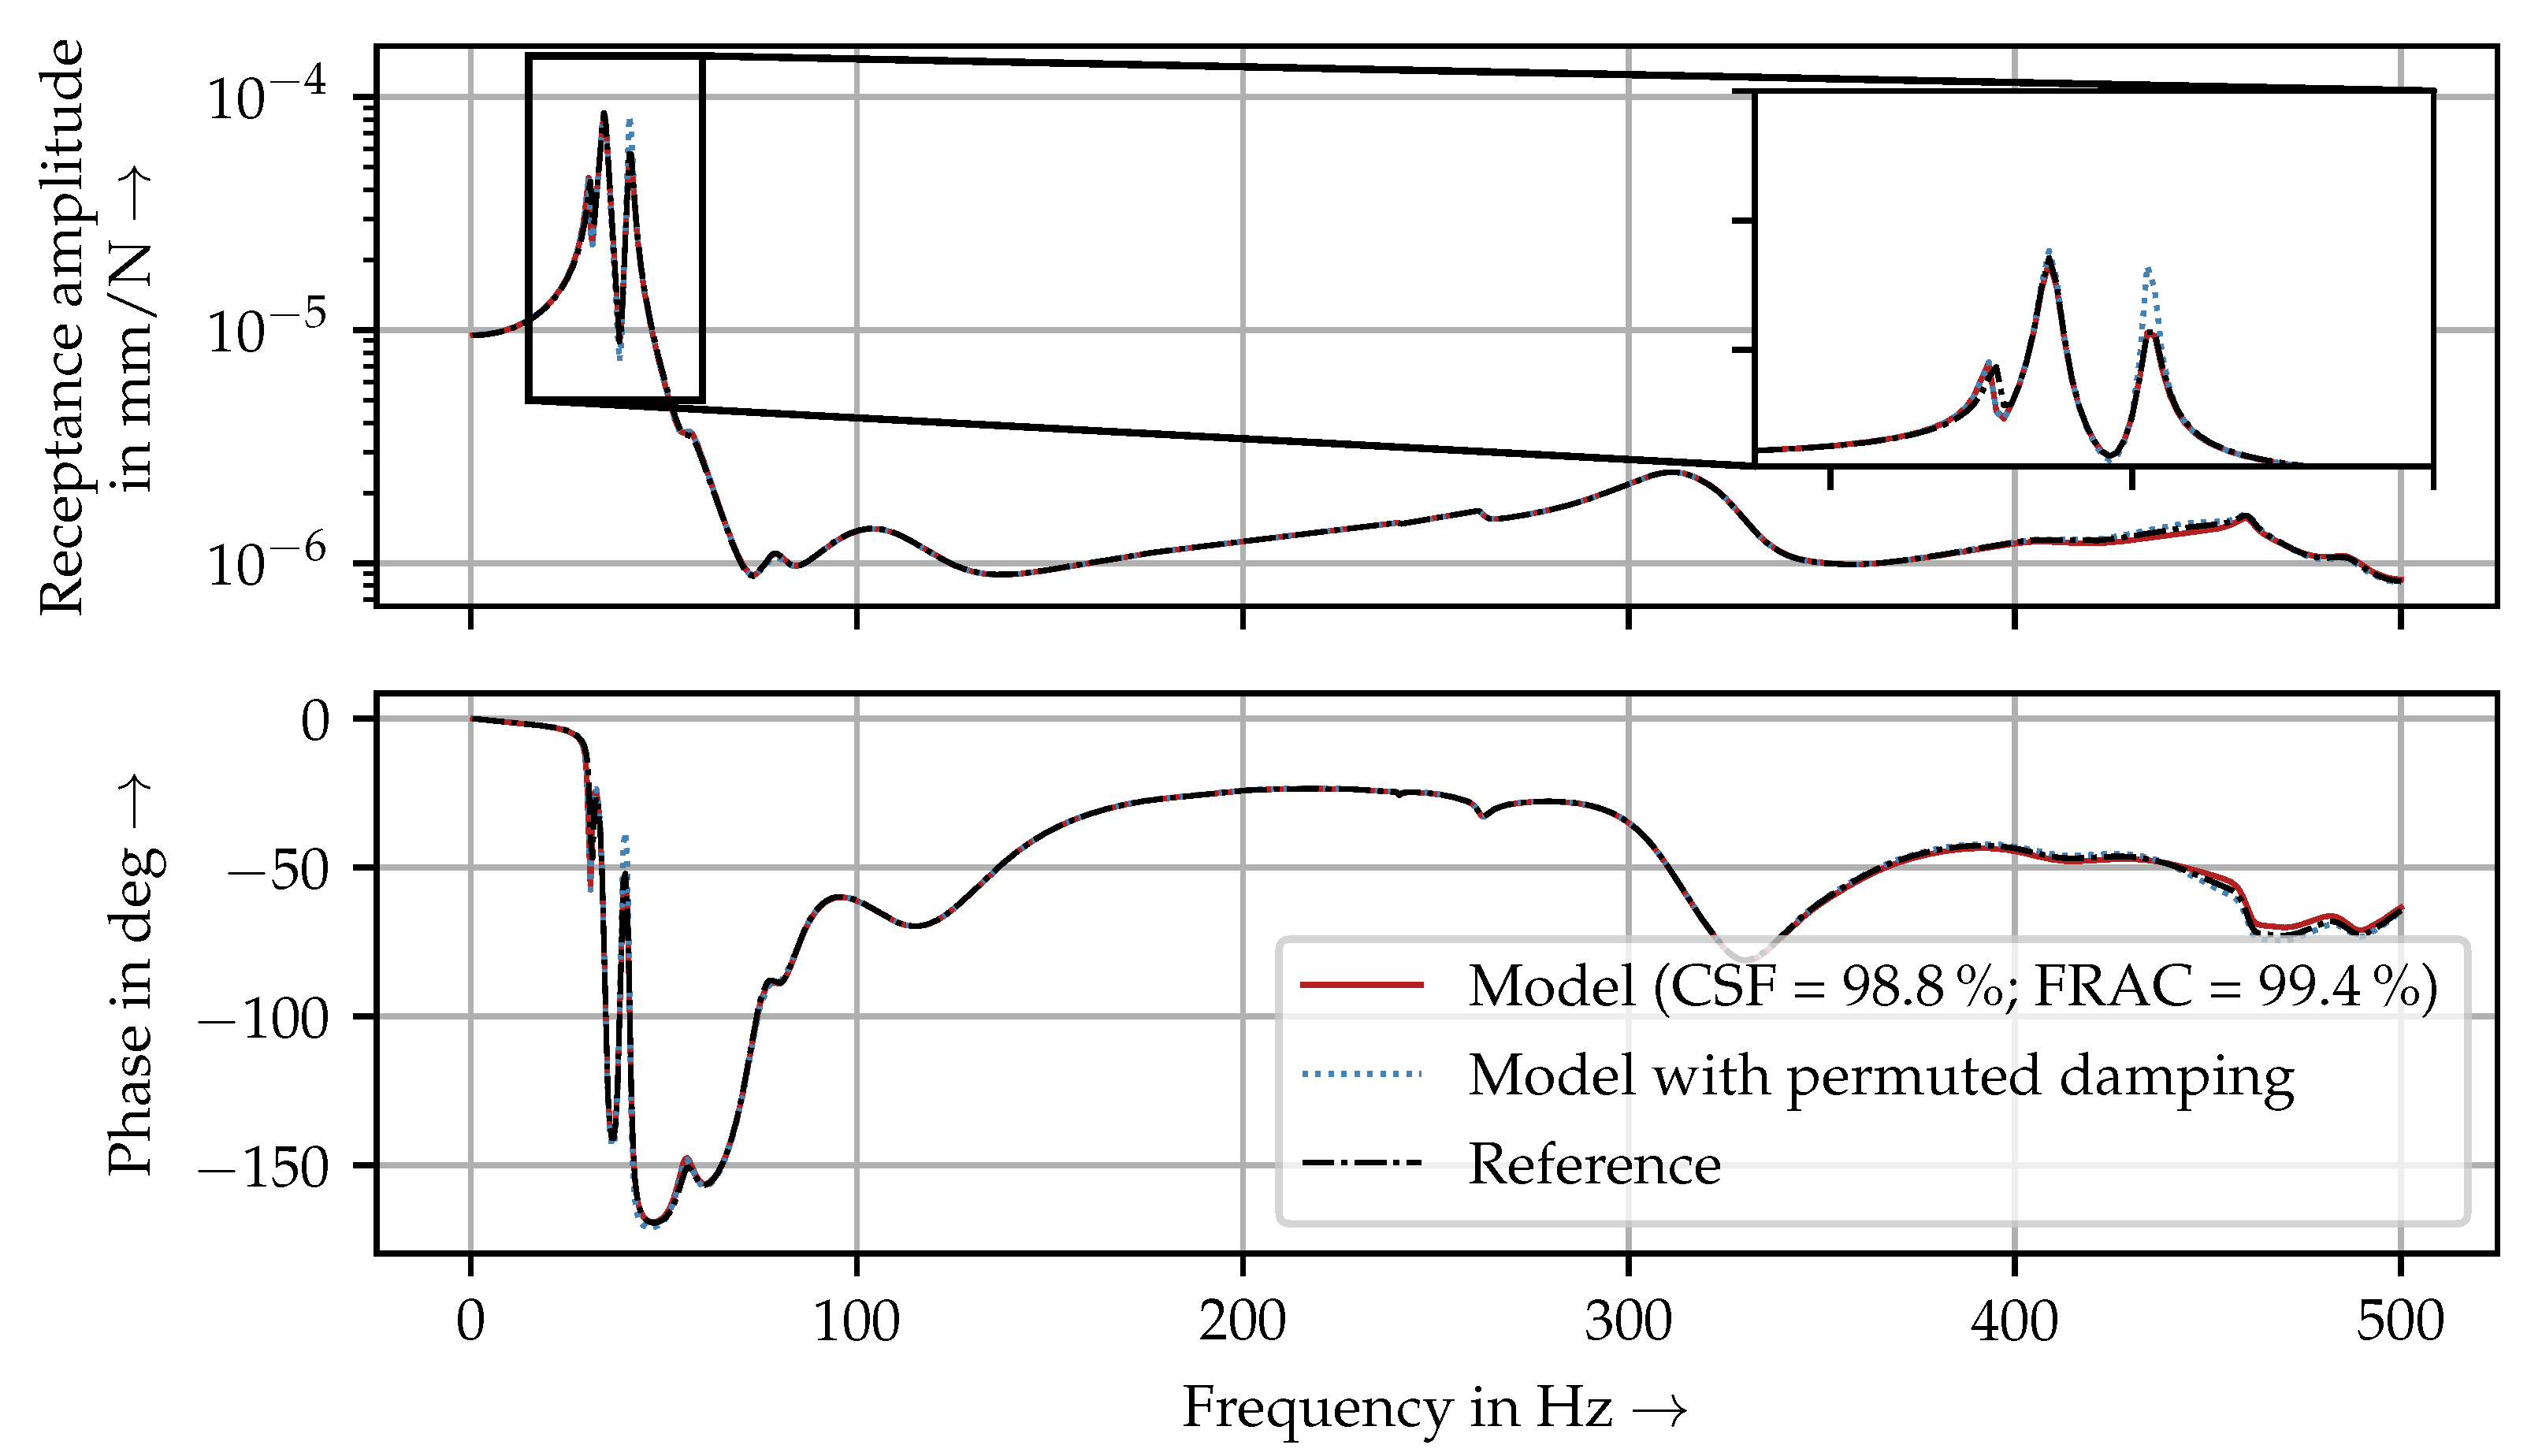
This indicates very high conformity of the model, which is also confirmed by the WPT FRF in the x-direction shown in Figure 7. Here, hardly any deviations from the reference FRF can be seen at all. Note that this holds for the whole frequency range up to 500 Hz , even though only modes up to 311 Hz were considered in the identification, indicating that the global optimum of the model parameters has been found. Additionally, Figure 7 stresses the importance of the damping parameter identification by also showing an FRF of a model with the same damping parameter deviations, but randomly reassigned to other (damping) parameters. For example, the deviation of the rotary hysteretic damping of the coupling (CPL d rz) from its true reference value of 67.7 % could be used to calculate a value for the viscous damping of the first ME in the z-direction (ME3 b z), and so on. This leads to a poor qualitative match with the reference FRF, especially in comparison to the actual identification results.
Summarizing the above, it can be said that the shown approach provided stiffness parameters very close to their global optimum (see Figure 6a). Note that this can only be stated since, in this case, simulated reference data from a model whose parameters are known were used as a starting point for the identification. In general, one would validate the model against reference data not used in the identification, as shown in Table 3 and Figure 7. However, this might lead to a misleading conclusion in the case of the damping parameters: the conformity of the model is very high (see Table 3), as is the overall deviation of the parameters from their true known reference (see Figure 6b). It is assumed that this conflict originates from the high influence of the stiffness parameters on the damping parameters (see Figure 5b), which would mean that the found damping parameters still represent the global optimum of the model. This is supported by the fact that the damping parameters’ deviations almost vanish when it is assumed that the true stiffness parameters have been found. However, it cannot be completely ruled out that this conflict originates from a validation position too close to the identification positions or very different significance values of the damping parameters, resulting in only those with high sensitivity being calculated correctly. This would indicate local and, thus, non-transferable solutions for the damping parameters. More insights into this will be targeted in further research. For the machine tool model considered here (see Section 3.1), the final parameter identification results were found to be comparably insensitive to the sensitivity threshold, the number of repetitions of each optimization problem N o p t , and the number of involved position–mode combinations in the damping parameter identification. However, the importance of these hyperparameters will be reinvestigated in further research.

3.3. Parameter Identification of a Disturbed Machine Tool Model

In this section, the effectiveness of the proposed approach is shown by using reference data from a similar, but not matching model for the identification. Here, the model to be identified is disturbed by setting different values for 44 non-sensitive parameters [20]. Note that, in contrast to Section 3.2, assumption A2 from Section 2.1 is now only approximately true. As the same simulated reference data as in Section 3.2 were used, the identification results, that is the modal parameters, can again be evaluated directly by comparing them to the reference model’s parameters.
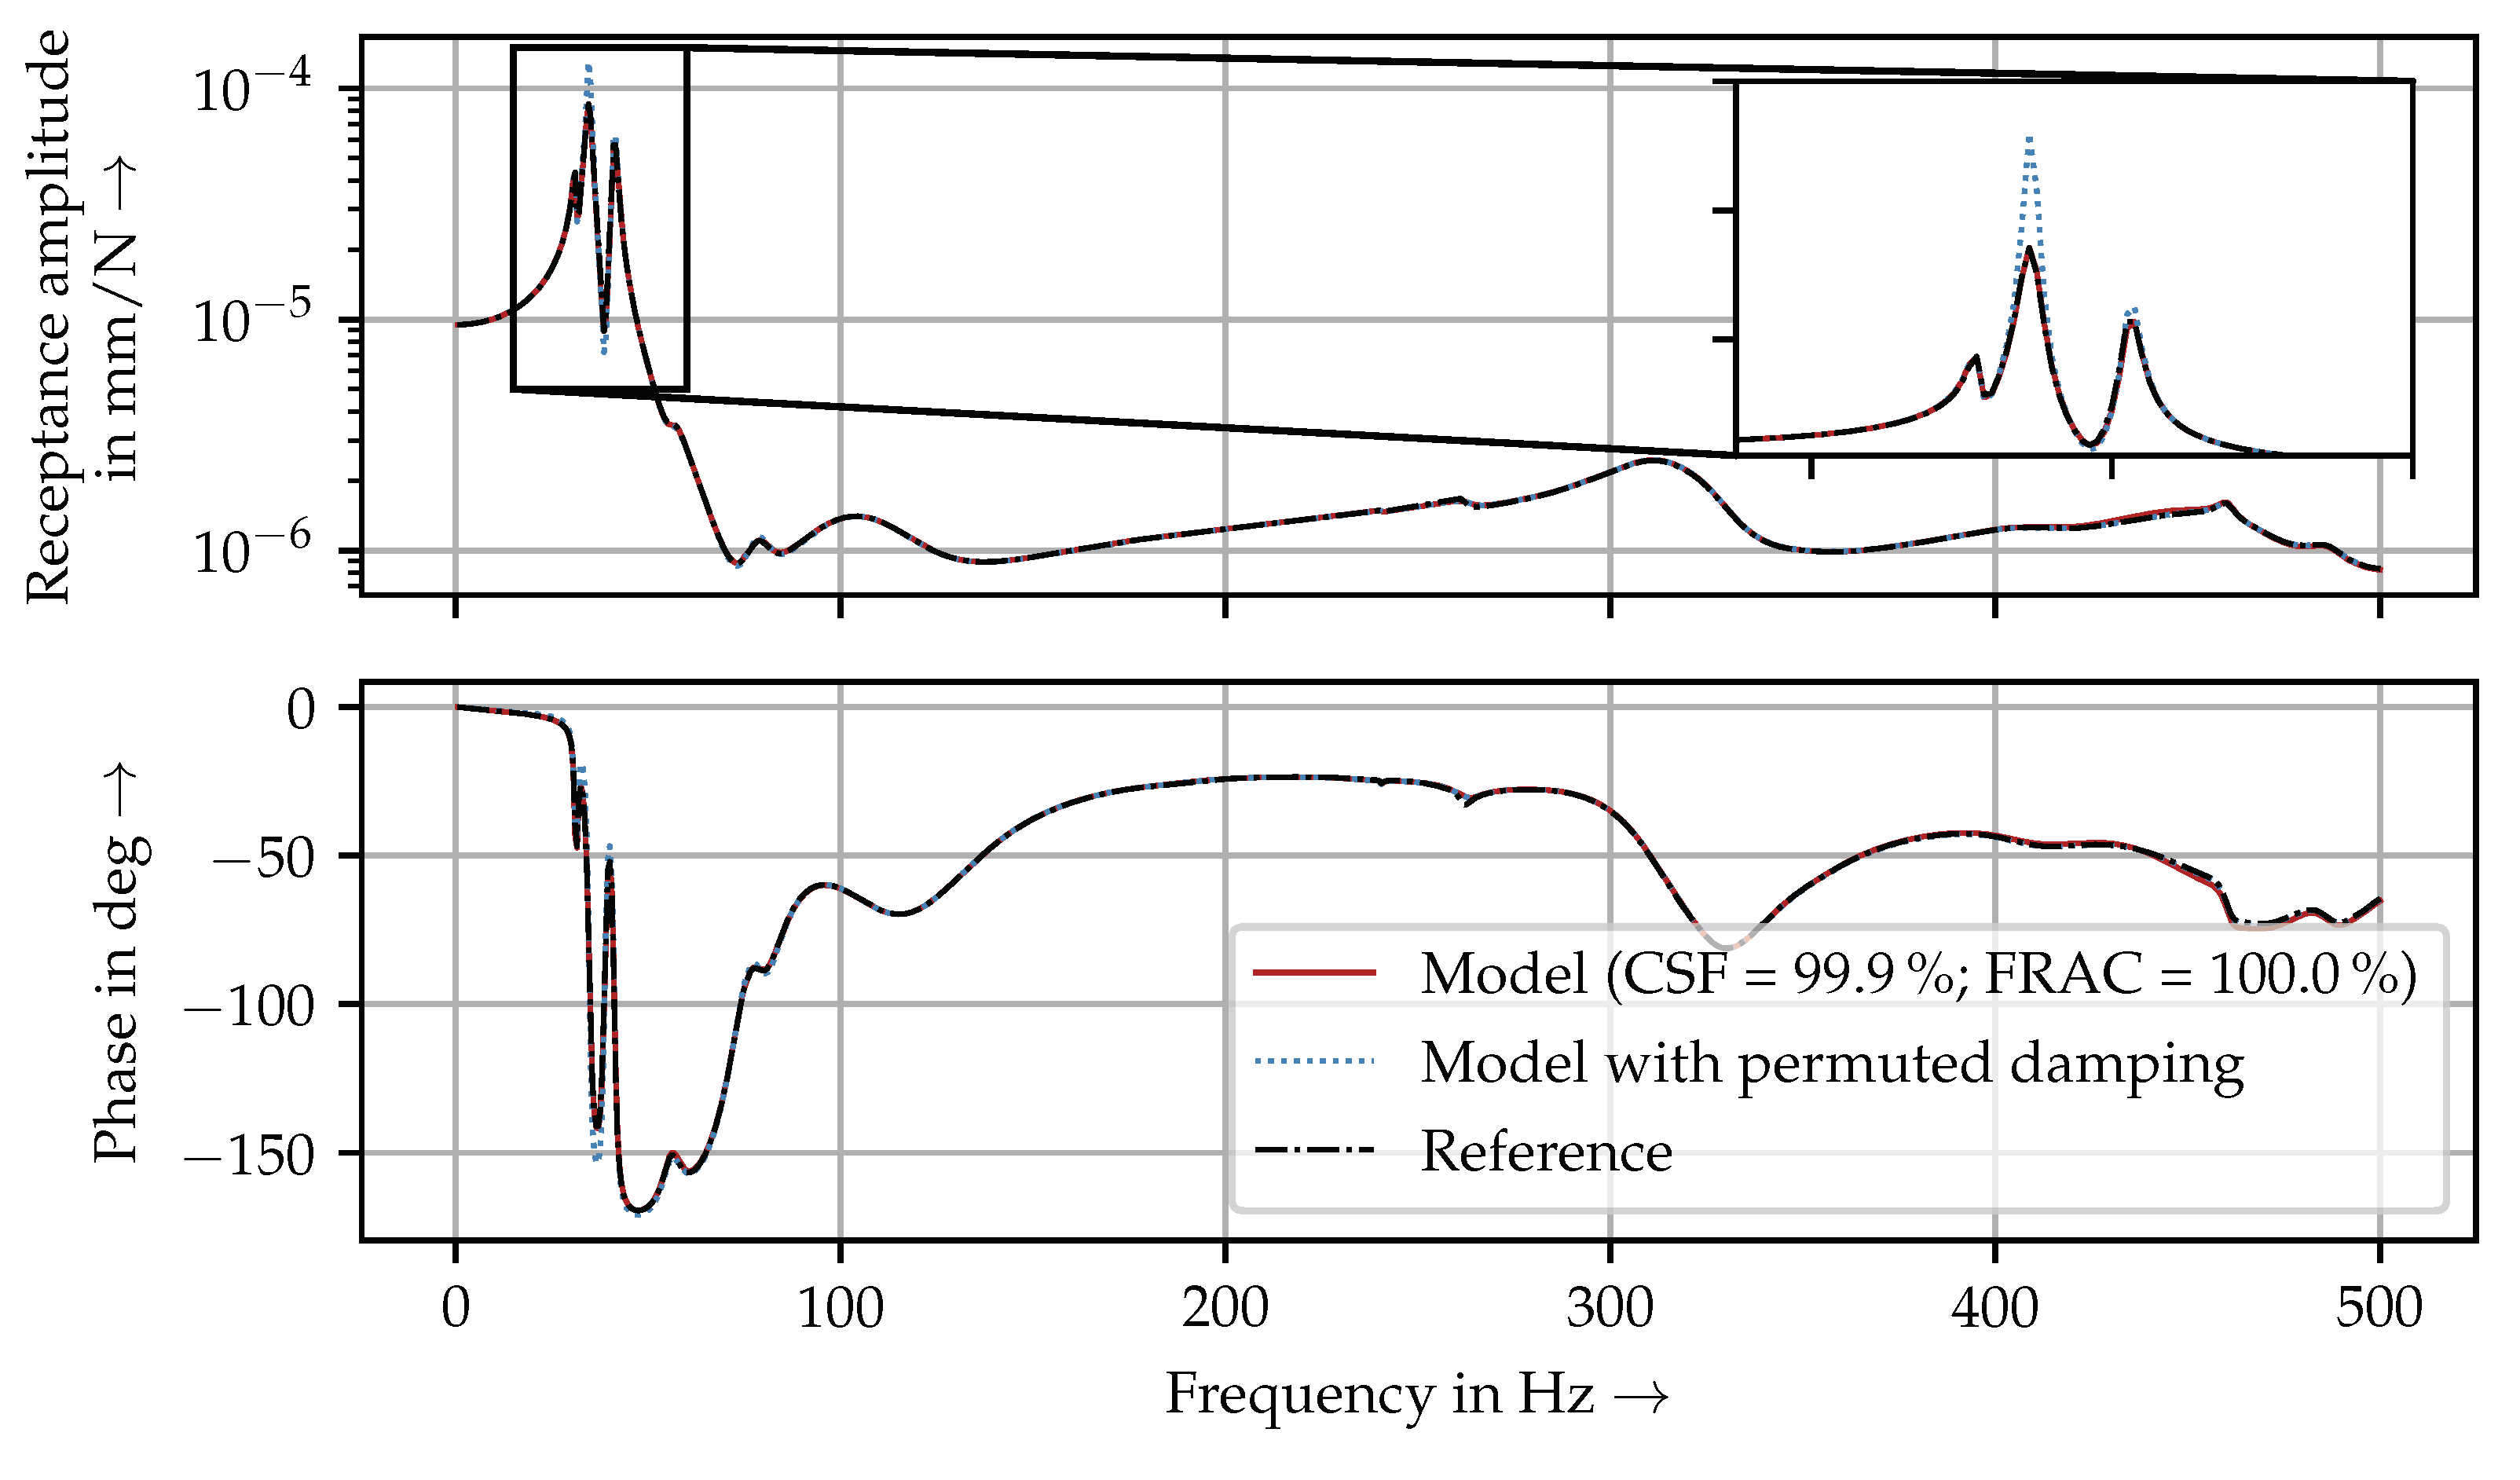
Based on the results of the GSAs for the disturbed model, the stiffness parameters of the model were identified first (see Section 2.3 and Section 3.2). The results can be found in Figure 8a. It can be seen that most of the stiffness parameters were identified well with deviations of even less than 3%. Similar to Section 3.2, the stiffness in the x-direction of the first ME (ME1 k x) shows a larger deviation of 12.1 %. The identified and the reference FRFs in Figure 9 match very well. Additionally, both the modal and the frequency-based conformity measures for the position considered in the identification process in Table 4 are very high, suggesting that the global optimum was approximated well.
This is also supported by Table 5, which, apart from the worst-case and 5% percentile MACXP (and NDD) values, also shows very high conformity for the validation position. The reason for this exception is that there are three poorly identified modes in the range 265 Hz to 311 Hz , in which the FRF has a low amplitude (see Figure 9), leading to only a minor influence on the FRAC (and the NDD).
Similar to Section 3.2, an LS problem was set up and solved for the yet-unknown damping parameters. Again, only the 20 position–mode combinations with the lowest interaction of the non-search parameters on the NDD 2 were selected. The chosen residual damping threshold of 0.5 % did not lead to any further reduction of the number of equations in this case. The final deviations depicted in Figure 8b are slightly higher than in the “ideal model vs. simulated data” case (see Figure 6b). However, it is believed that the identified damping parameters still represent the true and global optimum since the overall conformity shown in Table 4 and Table 5 is, except for three modes in the range 265 Hz to 311 Hz , very high. Furthermore, the identified model’s FRF in Figure 9 matches well with the reference data. Again, the comparison with similar, but randomly assigned damping deviations stresses the importance of the damping parameter identification.

4. Conclusions

In this paper, a method was presented to identify unknown parameters of machine tool models based on the outcomes of GSAs. In contrast to related work, the shown approach also works for highly complex models, needs only a minimum of manual effort, and does not require subsystems for intermediate modeling and measurement steps.
The presented approach relies on breaking down the overall identification problem by means of GSA into considerably smaller subproblems, which can be solved easily and efficiently. This already reduces the occurrence of local minima, which past works have suffered from (e.g., [21]). Additionally, a brute-force approach exploiting the computational efficiency of the model was developed, which led to a globally valid solution for the model’s stiffness parameters. Based on these, the model’s damping parameters can be identified by utilizing their linear influence on the overall model’s energy dissipation. This was proven in two cases: first for an ideal model, which is able to replicate the reference data perfectly, and second, for the more realistic case of a disturbed model with slight imperfections. For both, statistics of common model conformity measures were given, showing a high agreement between the model’s predictions and the provided reference data. Furthermore, it was demonstrated that the model can also replicate reference data that have not been used as the input for the identification process. Additionally, exemplary FRF results were provided, confirming the success of the presented identification approach. Over the course of the parameter identification, it was found that the model’s damping parameters showed strong interaction effects with the previously identified stiffness parameters. Thus, in this paper, the original model’s damping parameters, which were used to simulate the reference (i.e., training) data, were identified correctly only in some cases and with large deviations otherwise. This may imply that the damping parameters are not transferable to other models in general or only in combination with the identified stiffness distribution, which will be examined in more detail in future research.
In order to be fully applicable to full-scale machine tools, the presented approach must be extended to the multi-axis setup of state-of-the-art machine tools. On the one hand, it is believed that the identification will become more difficult because of the increased number of unknown model parameters and the corresponding increase of the number of possible local minima. On the other hand, however, more axes offer more flexibility in finding axis positions that are not prone to local solutions, which is beneficial for the proposed method. Another transition that needs to be made in future research is the one from simulated to measured reference (i.e., training) data. As the shown approach heavily relies on high-quality modal parameters (i.e., eigenfrequencies, mode shapes, and modal damping), ways must be found to determine these inputs with, in the spirit of the automated solution proposed here, as little manual effort as possible.

Author Contributions

Conceptualization, J.E.; methodology, J.E.; software, J.E.; validation, J.E.; investigation, J.E.; resources, J.E. and M.F.Z.; writing—original draft preparation, J.E.; writing—review and editing, J.E. and M.F.Z.; visualization, J.E.; supervision, J.E. and M.F.Z.; project administration, J.E. and M.F.Z.; funding acquisition, J.E. and M.F.Z. All authors have read and agreed to the published version of the manuscript.

Funding

This work was supported by the Bavarian State Ministry for Economic Affairs, Energy and Technology (StMWi) within the research project “Artificial Intelligence and Digital Twin for Predictive Maintenance of Machine Tools (KIDZ)” under Grant Agreement Number DIK0140/01. We would like to thank the StMWi for the funding and the VDI|VDE|IT for the pleasant cooperation.

Data Availability Statement

The reference data presented in this study are available upon request from the corresponding author.

Conflicts of Interest

The authors have no conflicts of interest to declare.

Abbreviations

The following abbreviations are used in this manuscript:
ANOVAanalysis of variance
BSDball screw drive
CPLcoupling
CPUcentral processing unit
CSFcross-signature scale factor
DOFdegree of freedom
EMAexperimental modal analyses
FBfixed bearing
FEAfinite element analysis
FRACfrequency response assurance criterion
FRFfrequency response function
GAgenetic algorithm
GSAglobal sensitivity analysis
HDMRhigh-dimensional model representation
KIDZArtificial Intelligence and Digital Twin for Predictive Maintenance of Machine Tools
LBloose bearing
LGSlinear guiding system
LSleast squares
MACmodal assurance criterion
MACXPextended modal assurance criterion
MBSmultibody simulation
MEmounting element
MORmodel order reduction
NDDnatural damping difference
NDD 2 squared natural damping difference
NFDnatural frequency difference
PSOparticle swarm optimization
SLSQPsequential least-squares programming
StMWiBavarian State Ministry for Economic Affairs, Energy and Technology
WPTworkpiece table

References

  1. Isermann, R. Identifikation Dynamischer Systeme 1; Springer: Berlin/Heidelberg, Germany, 1992. [Google Scholar] [CrossRef]
  2. Ellinger, J.; Semm, T.; Benker, M.; Kapfinger, P.; Kleinwort, R.; Zaeh, M.F. Feed Drive Condition Monitoring Using Modal Parameters. MM Sci. J. 2019, 2019, 3206–3213. [Google Scholar] [CrossRef]
  3. Tseng, G.W.G.; Chen, C.Q.G.; Erkorkmaz, K.; Engin, S. Digital Shadow Identification from Feed Drive Structures for Virtual Process Planning. CIRP J. Manuf. Sci. Technol. 2019, 24, 55–65. [Google Scholar] [CrossRef]
  4. Altintas, Y. Manufacturing Automation: Metal Cutting Mechanics, Machine Tool Vibrations, and CNC Design; Cambridge University Press: Cambridge, UK, 2012. [Google Scholar]
  5. Law, M. Position-Dependent Dynamics and Stability of Machine Tools. Ph.D. Thesis, University of British Columbia, Vancouver, BC, Canada, 2013. [Google Scholar]
  6. Zaeh, M.F.; Rebelein, C.; Semm, T. Predictive Simulation of Damping Effects in Machine Tools. CIRP Ann. 2019, 27, 67–77. [Google Scholar] [CrossRef]
  7. Iglesias, A.; Taner, T.L.; Özsahin, O.; Franco, O.; Munoa, J.; Budak, E. Alternative Experimental Methods for Machine Tool Dynamics Identification: A Review. Mech. Syst. Signal Process. 2022, 170, 108837. [Google Scholar] [CrossRef]
  8. Ren, W.; Chen, H. Finite Element Model Updating in Structural Dynamics by Using the Response Surface Method. Eng. Struct. 2010, 32, 2455–2465. [Google Scholar] [CrossRef]
  9. Niehues, K. Identification of Linear Damping Models for Machine Tool Structures. Ph.D. Thesis, Technical University of Munich, München, Germany, 2015. [Google Scholar]
  10. Schwarz, S. Predictive Capability of Dynamic Simulations of Machine Tool Structures. Ph.D. Thesis, Technical University of Munich, München, Germany, 2015. [Google Scholar]
  11. Rebelein, C. Predictive Simulation of Damping Effects in Mechatronic Machine Tool Structures. Ph.D. Thesis, Technical University of Munich, München, Germany, 2019. [Google Scholar]
  12. Semm, T.; Spescha, D.; Ceresa, N.; Zaeh, M.F.; Wegener, K. Efficient Dynamic Machine Tool Simulation with Included Damping and Linearized Friction Effects. Procedia CIRP 2020, 93, 1442–1447. [Google Scholar] [CrossRef]
  13. Apprich, S.; Wulle, F.; Pott, A.; Verl, A. Online Parameter Identification for a Linear Parameter-Varying Model of Large-Scale Lightweight Machine Tool Structures with Pose-Dependent Dynamic Behavior. In Proceedings of the IEEE International Conference on Advanced Intelligent Mechatronics (AIM), Banff, AB, Canada, 12–15 July 2016; pp. 1558–1563. [Google Scholar]
  14. Zhou, S.; Sun, B.B. Parameter Identification and Optimization of Slide Guide Joint of CNC Machine Tools. IOP Conf. Ser. Mater. Sci. Eng. 2017, 265, 012025. [Google Scholar] [CrossRef]
  15. Mehrpouya, M.; Graham, E.; Park, S. Identification of Multiple Joint Dynamics Using the Inverse Receptance Coupling Method. J. Vib. Control 2015, 21, 3431–3449. [Google Scholar] [CrossRef]
  16. Witt, S.T. Integrierte Simulation von Maschine, Werkstück und spanendem Fertigungsprozess. Ph.D. Thesis, RWTH Aachen University, Aachen, Germany, 2007. [Google Scholar]
  17. Garitaonandia, I.; Fernandes, M.H.; Albizuri, J. Dynamic Model of a Centerless Grinding Machine Based on an Updated FE Model. Int. J. Mach. Tools Manuf. 2008, 48, 832–840. [Google Scholar] [CrossRef]
  18. Hernandez-Vazquez, J.; Garitaonandia, I.; Fernandes, M.H.; Albizuri, J.; Munoa, J. Comparison of Updating Strategies to Improve Finite Element Models of Multi-Axis Machine Tools. In Proceedings of the 9th International Conference on Structural Dynamics, Porto, Portugal, 30 June–2 July 2014. [Google Scholar]
  19. Hernandez-Vazquez, J.; Garitaonandia, I.; Fernandes, M.H.; Munoa, J.; Lacalle, L.N. A Consistent Procedure Using Response Surface Methodology to Identify Stiffness Properties of Connections in Machine Tools. Materials 2018, 11, 1220. [Google Scholar] [CrossRef] [PubMed] [Green Version]
  20. Ellinger, J.; Semm, T.; Zaeh, M.F. Dimensionality Reduction of High-Fidelity Machine Tool Models by Using Global Sensitivity Analysis. J. Manuf. Sci. Eng. 2022, 144, 051010:1–051010:8. [Google Scholar] [CrossRef]
  21. Semm, T.; Sellemond, M.; Rebelein, C.; Zaeh, M.F. Efficient Dynamic Parameter Identification Framework for Machine Tools. J. Manuf. Sci. Eng. 2020, 142, 081003. [Google Scholar] [CrossRef]
  22. Semm, T. Position-Flexible Modeling Approach for an Efficient Optimization of the Machine Tool Dynamics Considering Local Damping Effects. Ph.D. Thesis, Technical University of Munich, München, Germany, 2020. [Google Scholar]
  23. Spescha, D.; Weikert, S.; Wegener, K. Simulation in the Design of Machine Tools. In Reinventing Mechatronics; Yan, X.T., Bradley, D., Russell, D., Moore, P., Eds.; Springer International Publishing: Cham, Switzerland, 2020; pp. 163–177. [Google Scholar] [CrossRef]
  24. Vacher, P.; Jacquier, B.; Bucharles, A. Extensions of the MAC Criterion to Complex Modes. In Proceedings of the 24th International Conference on Noise and Vibration Engineering, Leuven, Belgium, 20–22 September 2010; pp. 2713–2726. [Google Scholar]
  25. Imamovic, N. Validation of Large Structural Dynamics Models Using Modal Test Data. Ph.D. Thesis, Imperial College of Science, Technology & Medicine, London, UK, 1998. [Google Scholar]
  26. Saltelli, A. Global Sensitivity Analysis: The Primer; John Wiley & Sons, Ltd.: Chichester, UK, 2008. [Google Scholar] [CrossRef] [Green Version]
  27. Herman, J.; Usher, W. SALib: An Open-Source Python Library for Sensitivity Analysis. J. Open Source Softw. 2017, 2, 97. [Google Scholar] [CrossRef]
  28. Semm, T.; Nierlich, M.B.; Zaeh, M.F. Substructure Coupling of a Machine Tool in Arbitrary Axis Positions Considering Local Linear Damping Models. J. Manuf. Sci. Eng. 2019, 141, 071014:1–071014:8. [Google Scholar] [CrossRef]
  29. Heylen, W.; Lammens, S. FRAC: A Consistent Way of Comparing Frequency Response Functions. In Identification in Engineering Systems; Friswell, M.I., Mottershead, J., Eds.; Univ. of Wales: Swansea, UK, 1996; pp. 48–57. [Google Scholar]
  30. Haapaniemi, H.; Luukkanen, P.; Nurkkala, P.; Rostedt, J.; Saarenheimo, A. Correlation Analysis of Modal Analysis Results from a Pipeline. In Proceedings of the A Conference and Exposition on Structural Dynamics, Kissimmee, FL, USA, 3–6 February 2003. [Google Scholar]
  31. Zulaika, J.; Campa, J.; Lopez de Lacalle, N. An Integrated Process–Machine Approach for Designing Productive and Lightweight Milling Machines. Int. J. Mach. Tools Manuf. 2011, 51, 591–604. [Google Scholar] [CrossRef]
  32. Semm, T.; Rebelein, C.; Zaeh, M.F. Prediction of the Position Dependent Dynamic Behavior of a Machine Tool Considering Local Damping Effects. CIRP J. Manuf. Sci. Technol. 2019, 27, 68–77. [Google Scholar] [CrossRef]
  33. Kraft, D. A Software Package for Sequential Quadratic Programming; Wiss. Berichtswesen d. DFVLR: Köln, Germany, 1988. [Google Scholar]
Figure 1. Overview of the proposed identification approach.
Machines 10 00535 g001
Figure 2. Exemplary depiction of the brute-force identification results for overcoming local minima; for each position–mode combination, an optimization problem searching for the unknown stiffness model parameters is set up and repeated, leading to different values due to local minima. The position–mode combination with the least standard deviation across all repetitions yields the final identified value for each parameter. This is indicated by red solid lines instead of black dashed lines.
Machines 10 00535 g002
Figure 3. Overview of the different setups considered in Section 3; the blurred illustration indicates a similar, but non-matching model with modeling inaccuracies.
Machines 10 00535 g003
Figure 4. Illustration of a four-axis machine tool model in uniaxial configuration, consisting of a machine bed and a workpiece table (WPT); the non-hidden nodes (see Table 1) considered in the identification are indicated by circular markers.
Machines 10 00535 g004
Figure 5. Sobol indices and corresponding 95% confidence intervals indicated by whiskers for two different position–mode combinations; for better readability, only the ten most significant model parameters are shown. The notation is explained in Section 3.1.
Machines 10 00535 g005
Figure 6. Histogram plots showing the relative deviation of the identified stiffness and damping parameters from their true known value for the case “ideal model vs. simulated data”; additionally, their median value and 90% percentiles are shown.
Machines 10 00535 g006
Figure 7. Identified and reference FRFs in the x-direction from force to displacement at the WPT at the validation position z 1 = 294   m m for the case “ideal model vs. simulated data”; for better readability, the highlighted section has a linear amplitude scale in contrast to the main plot. Additionally, a model FRF is shown where the identified damping deviations were permuted randomly, emphasizing the need for properly identified damping parameters.
Machines 10 00535 g007
Figure 8. Histogram plots showing the relative deviation of the identified stiffness and damping parameters from their true known value for the case “disturbed model vs. simulated data”; additionally, their median value and 90% percentiles are shown.
Machines 10 00535 g008
Figure 9. Identified and reference FRFs in the x-direction from force to displacement at the WPT at the validation position z 1 = 294   m m for the case “disturbed model vs. simulated data”; for better readability, the highlighted section has a linear amplitude scale in contrast to the main plot. Additionally, a model FRF is shown where the identified damping deviations were permuted randomly, emphasizing the need for properly identified damping parameters.
Machines 10 00535 g009
Table 1. Considered model nodes; overlapping nodes are indicated by alphabetic subscripts.
NodeDescription
N 1 a , N 1 b Shoe and rail nodes of the first LGS shoe
N 2 a , N 2 b Shoe and rail nodes of the second LGS shoe
N 3 a , N 3 b Shoe and rail nodes of the third LGS shoe
N 4 a , N 4 b Shoe and rail nodes of the fourth LGS shoe
N 5 a , N 5 b Nut and shaft nodes of the BSD
N 6 , N 7 Workpiece table (WPT) nodes
N 8 a , N 8 b Linear encoder bed and WPT nodes
N 9 a , N 9 b Bed and shaft nodes of the x-axis brake
N 10 a , N 10 b Bed and shaft nodes of the z-axis brake
N 11 , N 12 , N 13 , N 14 , N 15 Bed nodes
N 16 , N 17 , N 18 ME nodes
N 19 a , N 19 b FB bed and shaft nodes
N 20 a , N 20 b Loose bearing (LB) bed and shaft nodes
N 21 a , N 21 b CPL motor and BSD shaft nodes
Table 2. Statistics of model performance indicators using the identified stiffness and damping parameters for the case “model vs. ideal model” for three considered axis positions z 2 , z 3 , and z 4 .
FRAC in %CSF in %MACXP in %NDD in %
Worst84.9391.7299.864.10
5% percentile86.2192.7899.881.99
Mean94.9297.1799.970.52
Median96.1298.04100.000.27
Table 3. Statistics of model performance indicators using the identified stiffness and damping parameters for the case “model vs. ideal model” for the validation position z 1 .
FRAC in %CSF in %MACXP in %NDD in %
Worst79.1788.4399.865.48
5% percentile79.4188.7899.894.73
Mean90.2194.1999.981.07
Median91.6395.58100.000.24
Table 4. Statistics of model performance indicators using the identified stiffness and damping parameters for the case “model vs. disturbed model” for three considered axis positions z 2 , z 3 , and z 4 .
FRAC in %CSF in %MACXP in %NDD in %
Worst92.1595.7399.921.69
5% percentile96.7097.1599.961.51
Mean99.2699.4999.990.40
Median99.8599.91100.000.25
Table 5. Statistics of model performance indicators using the identified stiffness and damping parameters for the case “model vs. disturbed model” for the validation position z 1 .
FRAC in %CSF in %MACXP in %NDD in %
Worst97.5397.3688.5740.65
5% percentile98.4198.3689.7839.83
Mean99.6099.6498.656.05
Median99.8399.9199.990.43
Publisher’s Note: MDPI stays neutral with regard to jurisdictional claims in published maps and institutional affiliations.