Author Contributions
Conceptualization, G.V., G.D. and F.S., methodology, G.V., G.D., F.S., software, G.V.; validation, G.V.; formal analysis, G.V.; investigation, G.V., G.D., F.S.; resources, G.V., G.D.; data curation, G.V.; writing—original draft preparation, G.V., G.D., writing—review and editing, G.V., G.D.; visualization, G.V., G.D.; supervision, G.V., G.D. and F.S.; project administration, G.V., G.D.; funding acquisition, G.V., G.D. All authors have read and agreed to the published version of the manuscript.
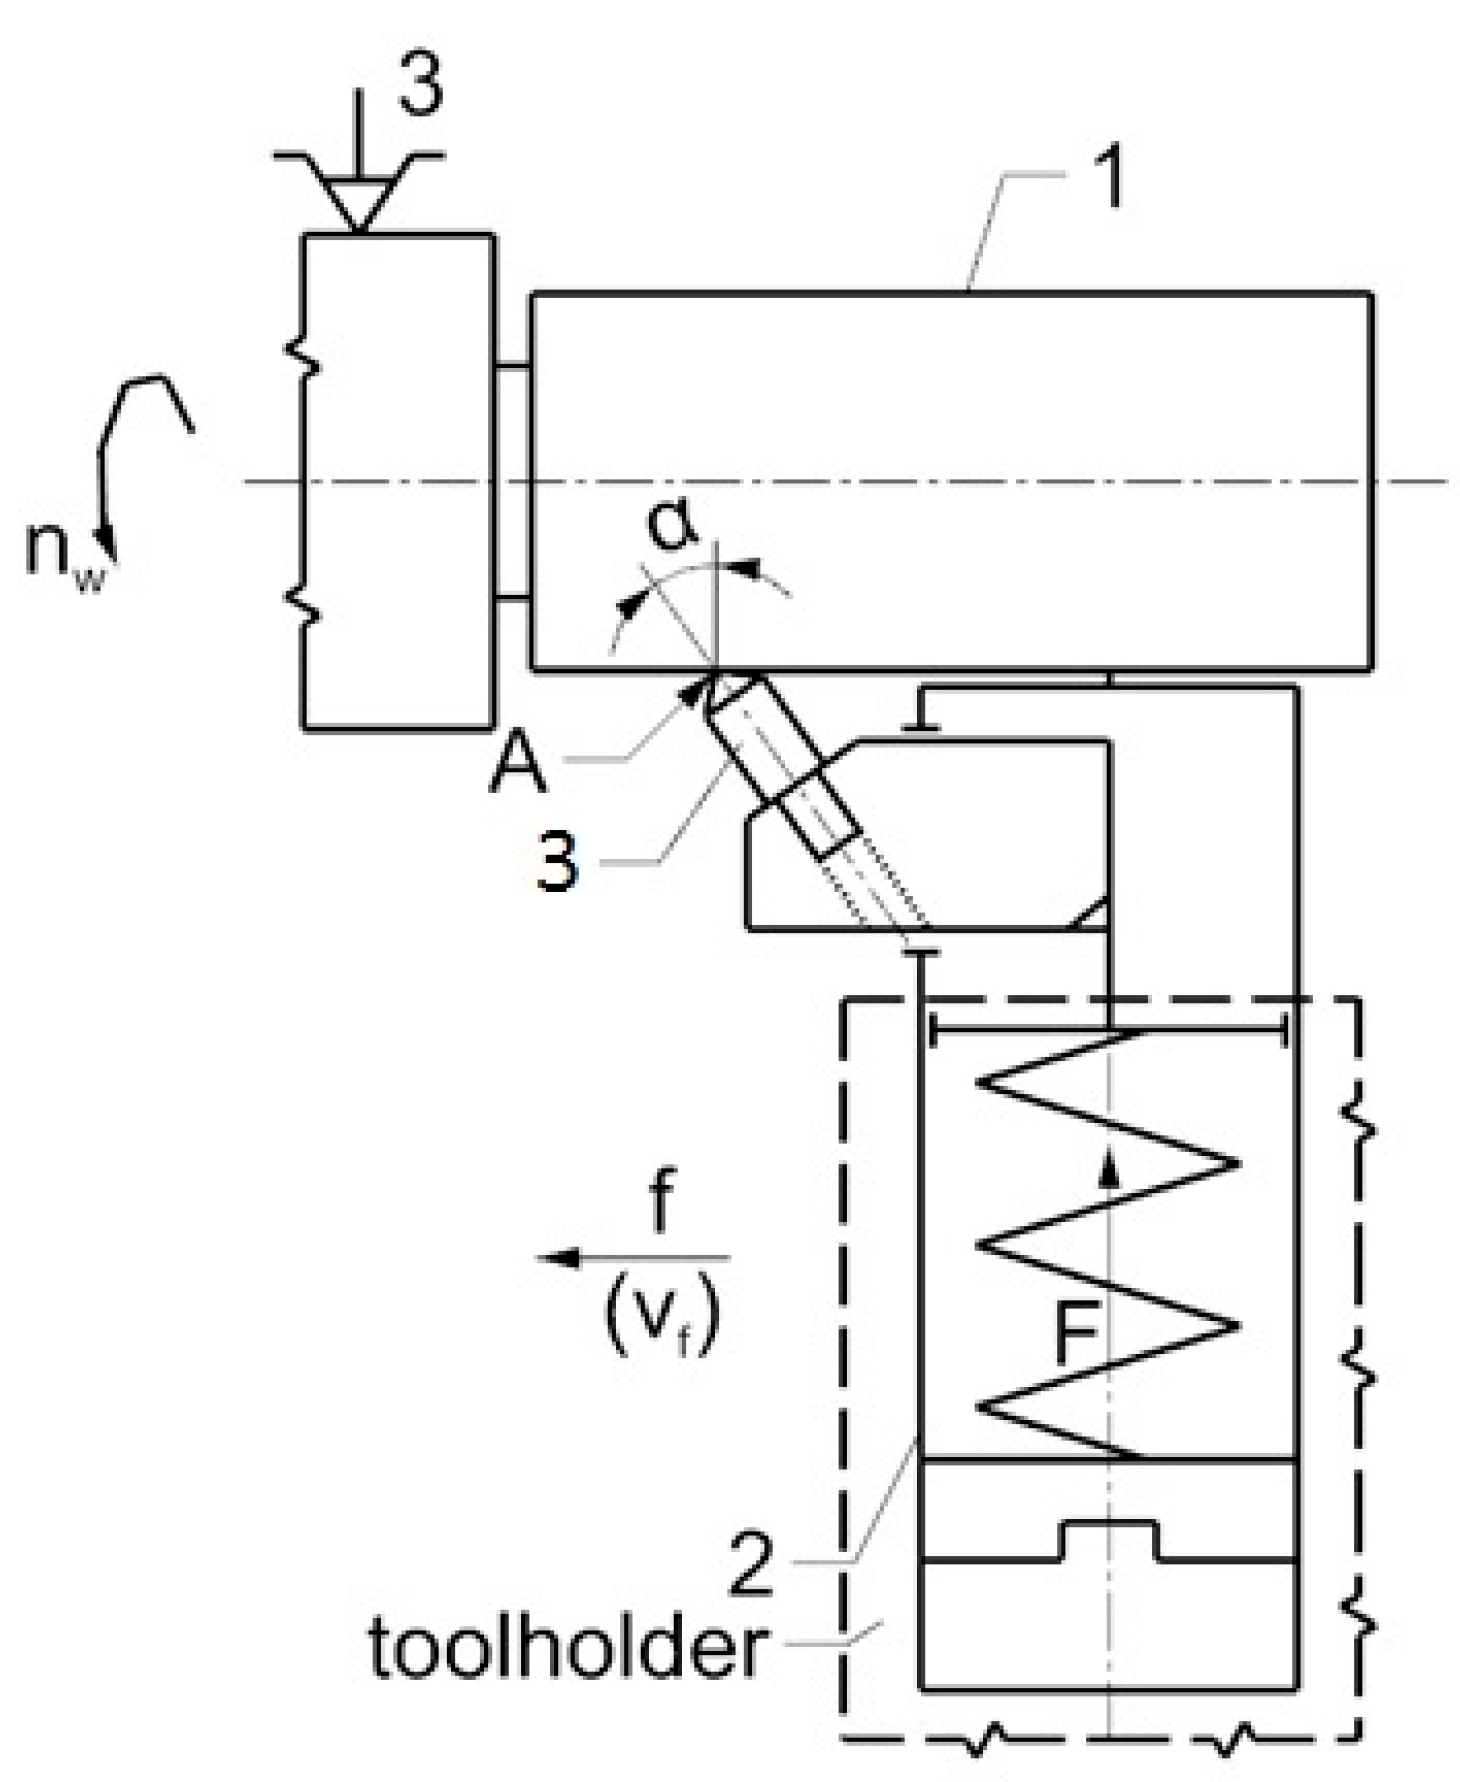
Figure 1.
A schematic diagram of sliding friction burnishing (1—workpiece, 2—burnishing tool, 3—burnishing insert, A—active element of tip).
Figure 1.
A schematic diagram of sliding friction burnishing (1—workpiece, 2—burnishing tool, 3—burnishing insert, A—active element of tip).
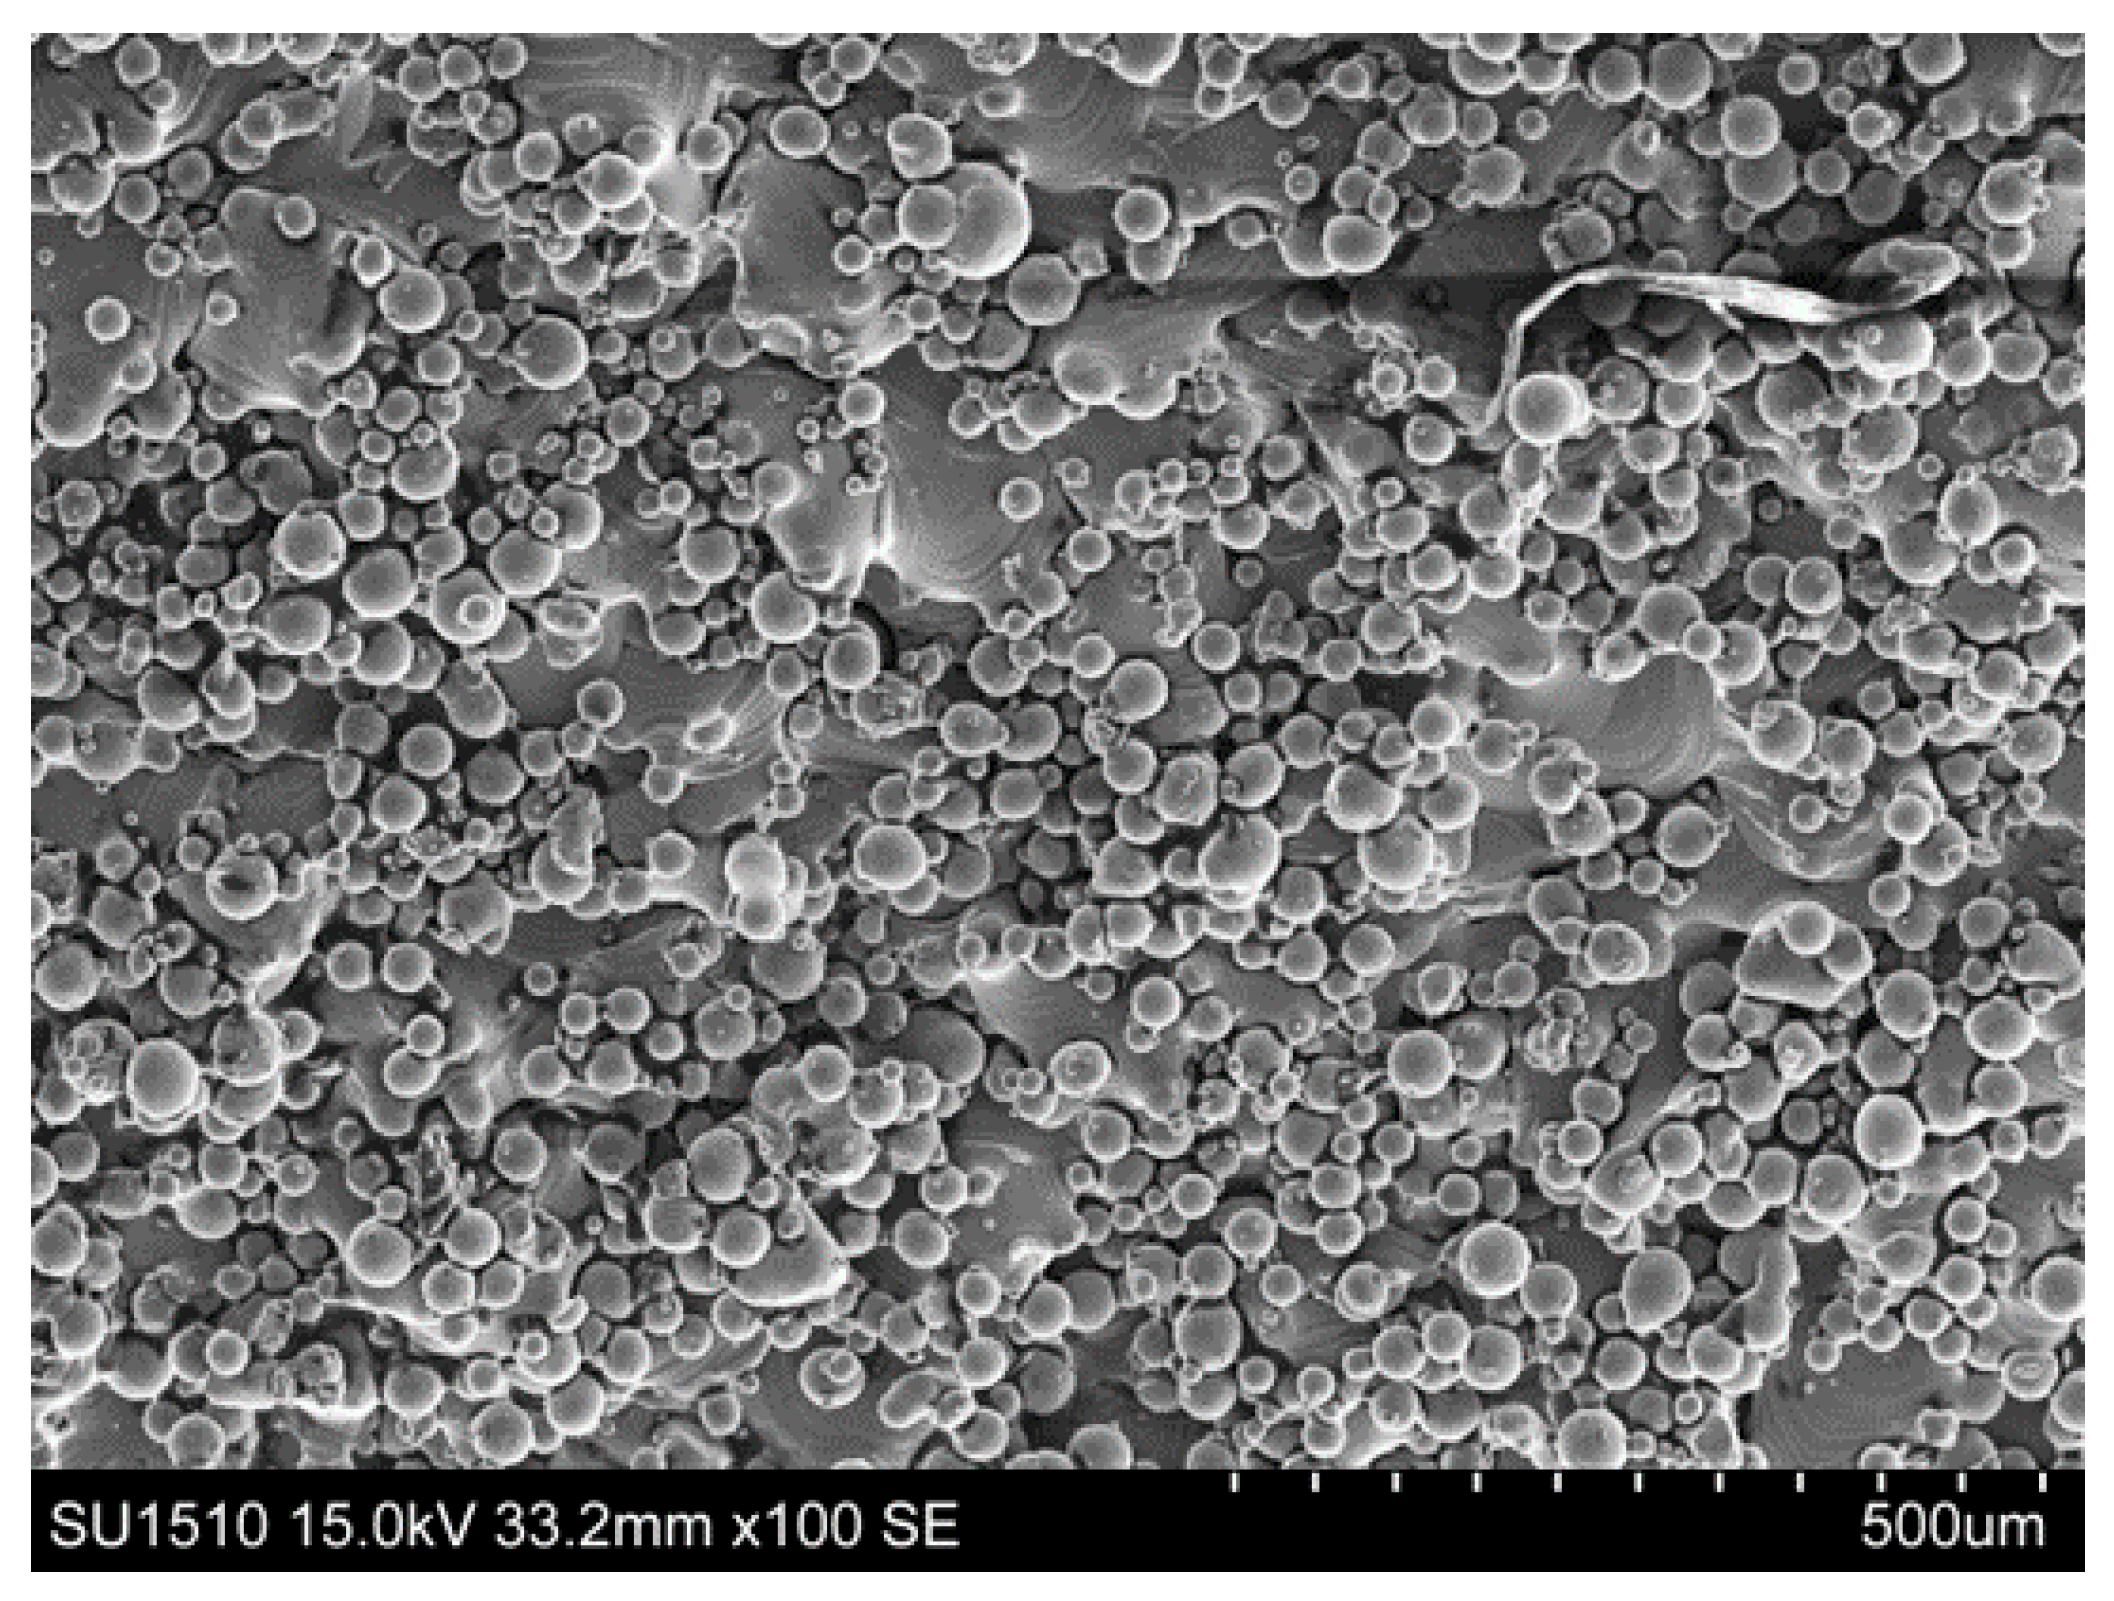
Figure 2.
An electron microscopic image of sample E1, before burnishing.
Figure 2.
An electron microscopic image of sample E1, before burnishing.
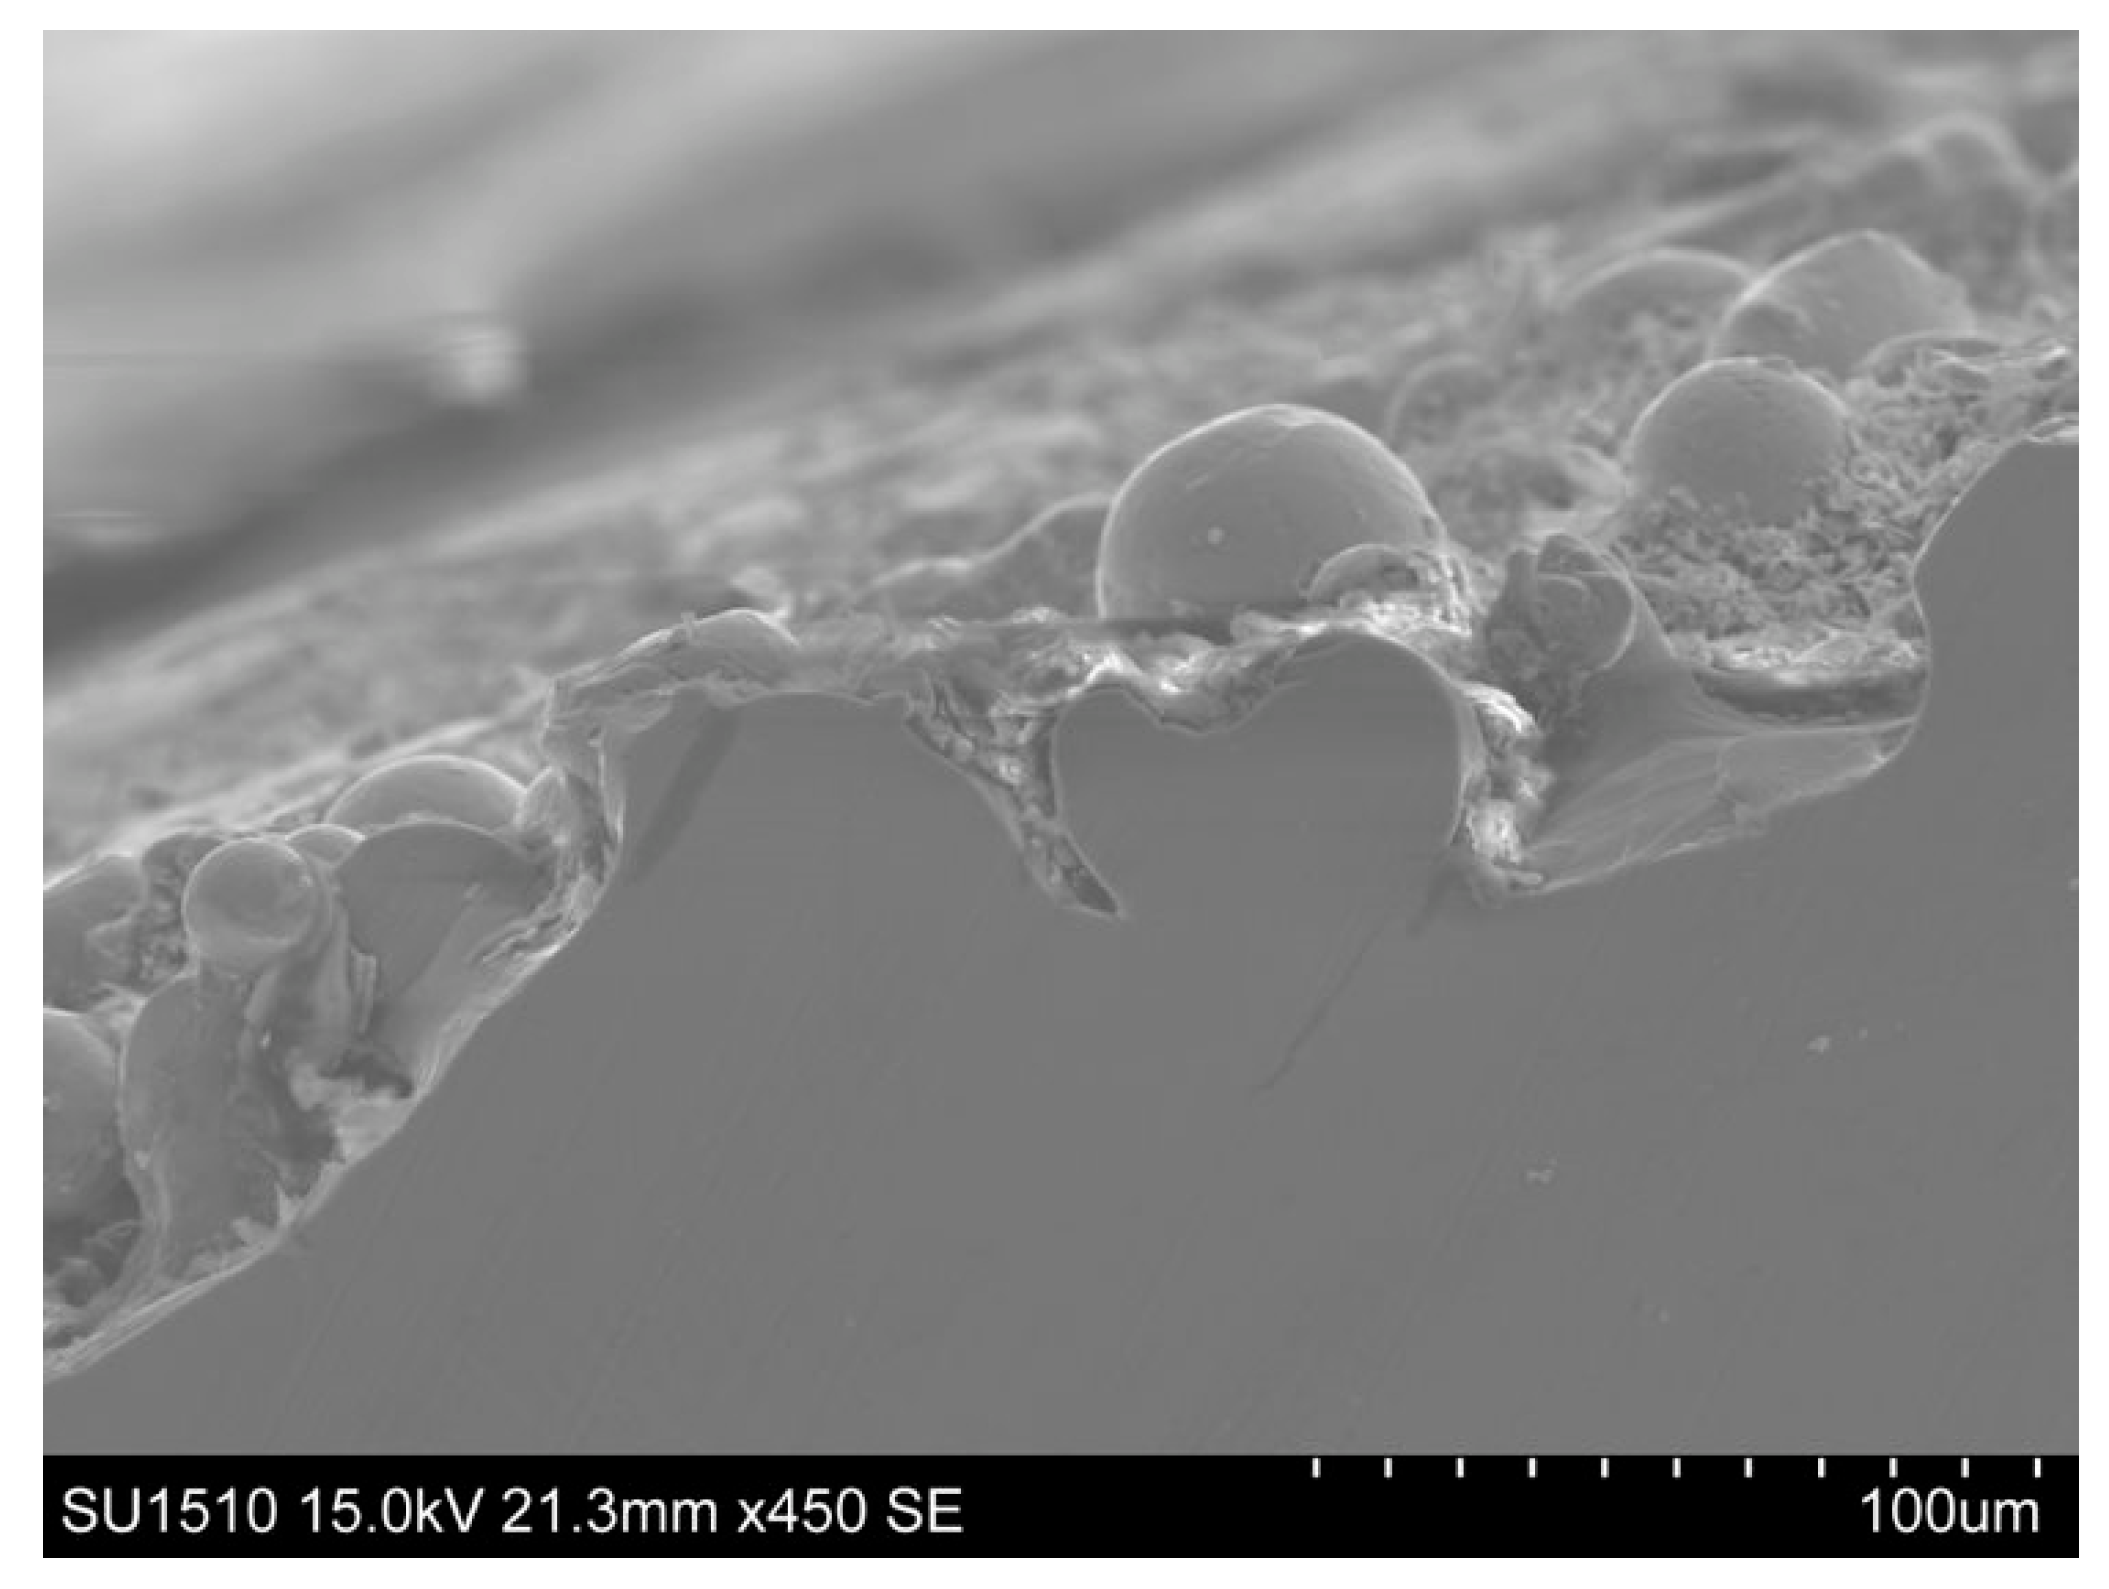
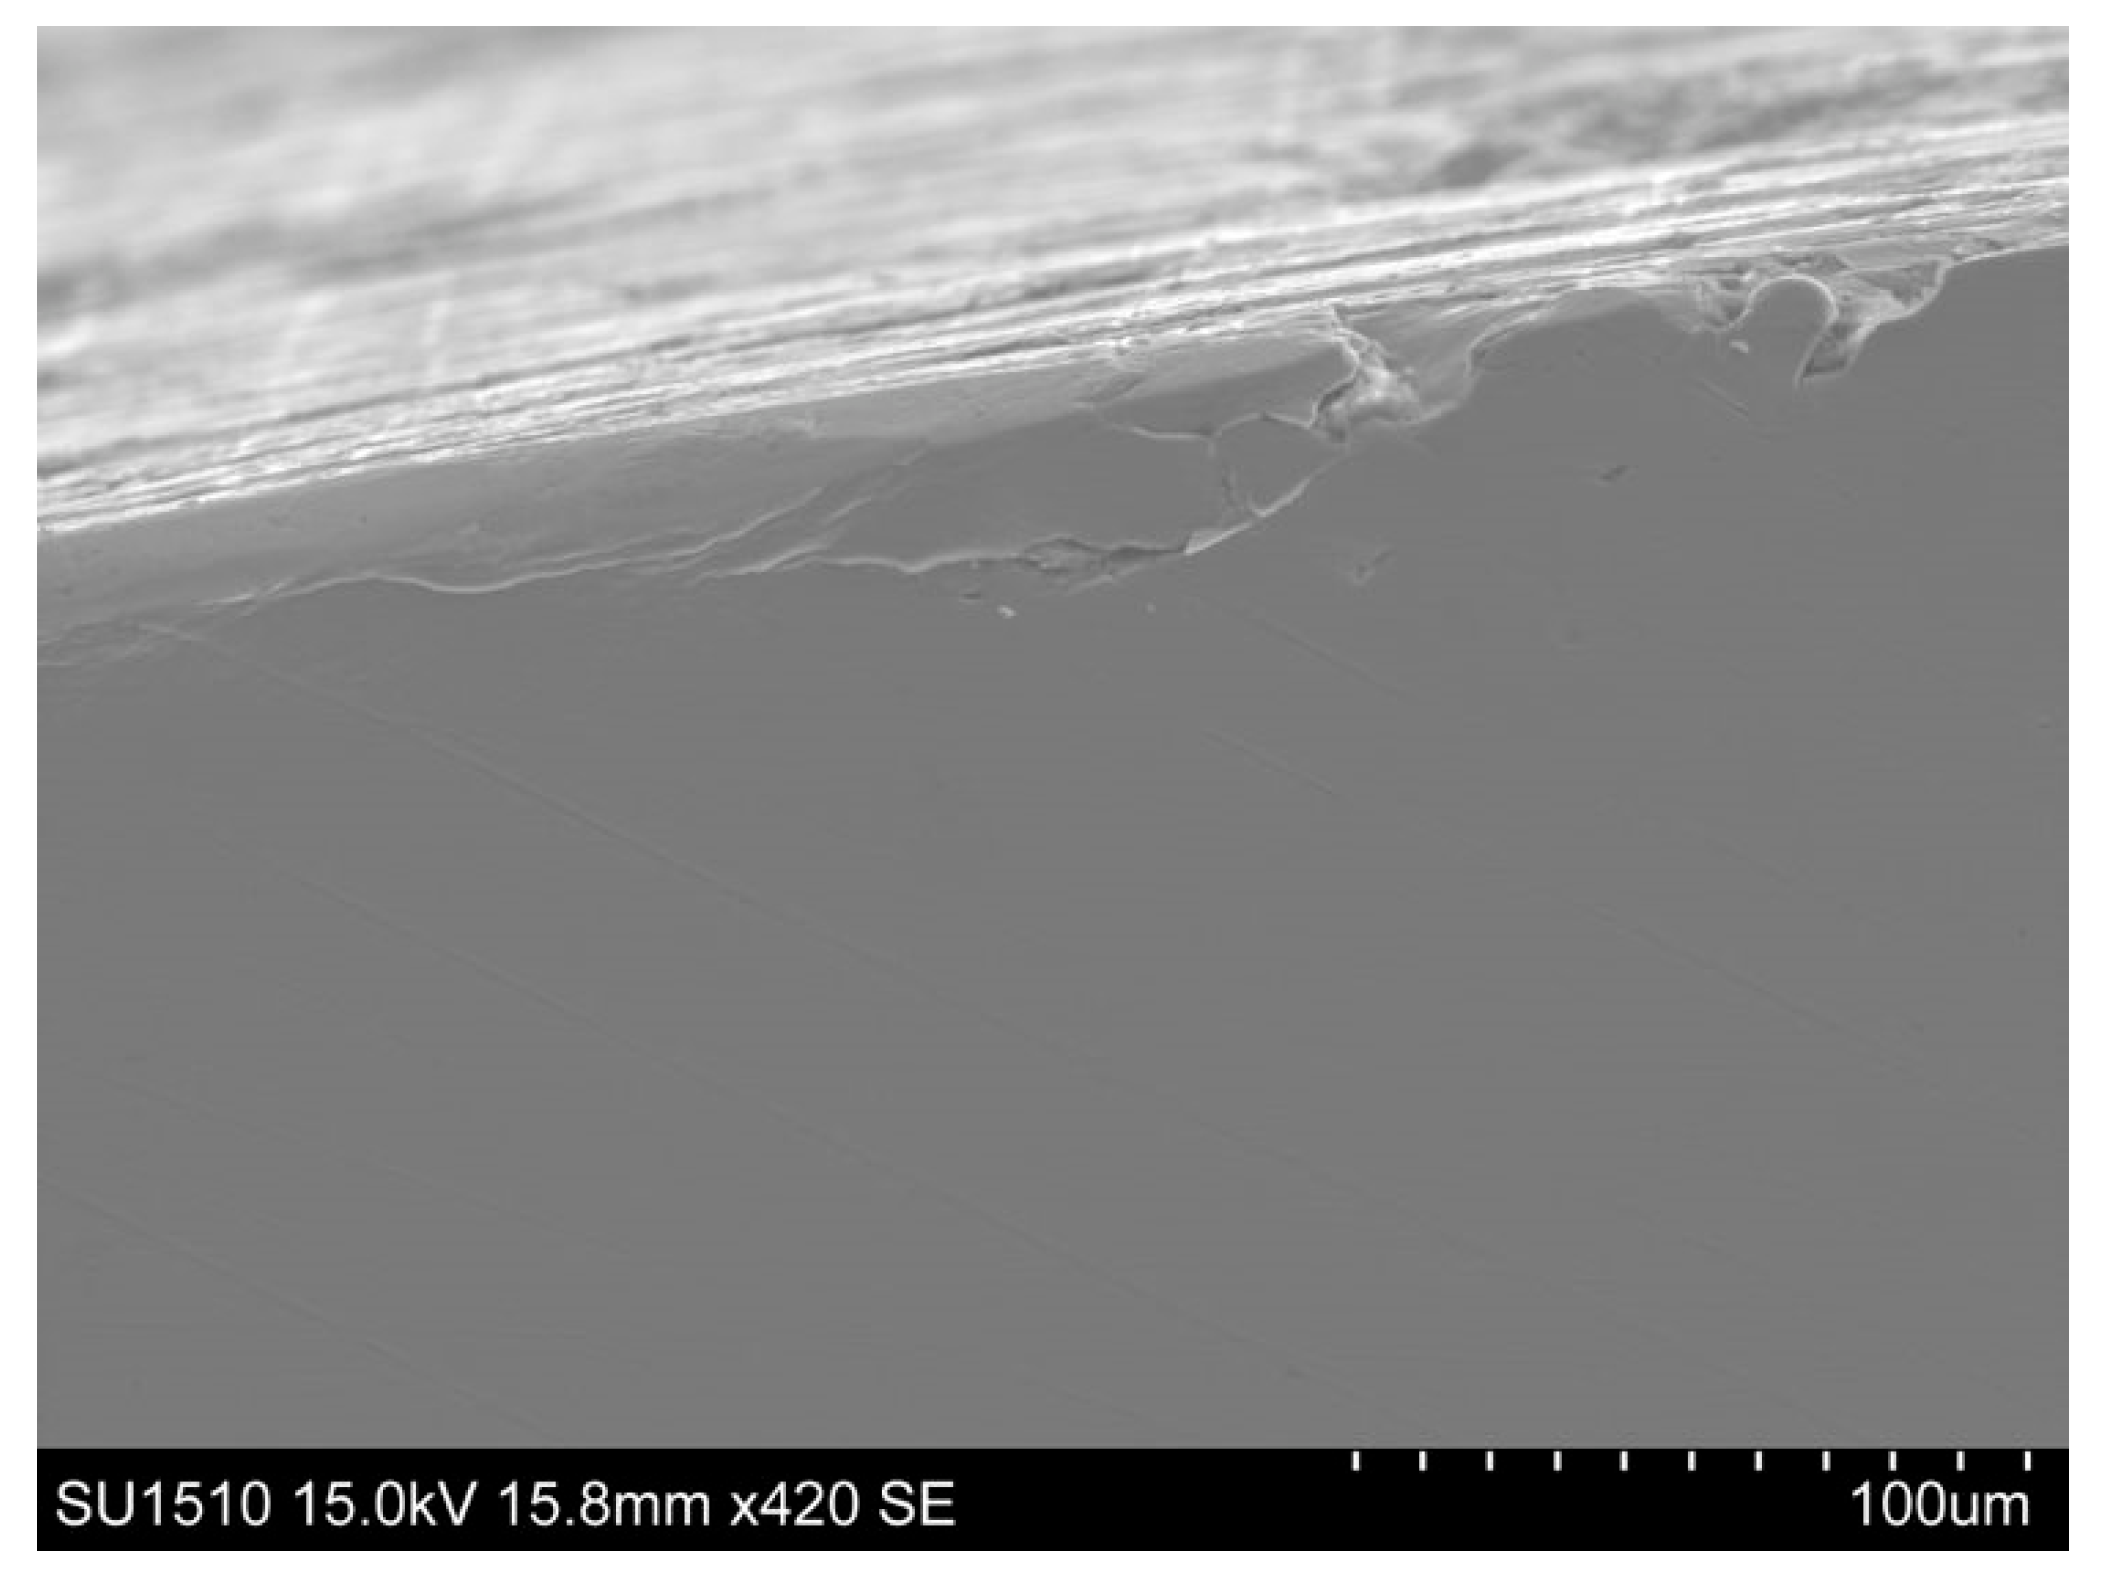
Figure 3.
An electron microscopic cross-cut image of sample E1, before burnishing.
Figure 3.
An electron microscopic cross-cut image of sample E1, before burnishing.
Figure 4.
The roughness measurement locations on the specimen.
Figure 4.
The roughness measurement locations on the specimen.
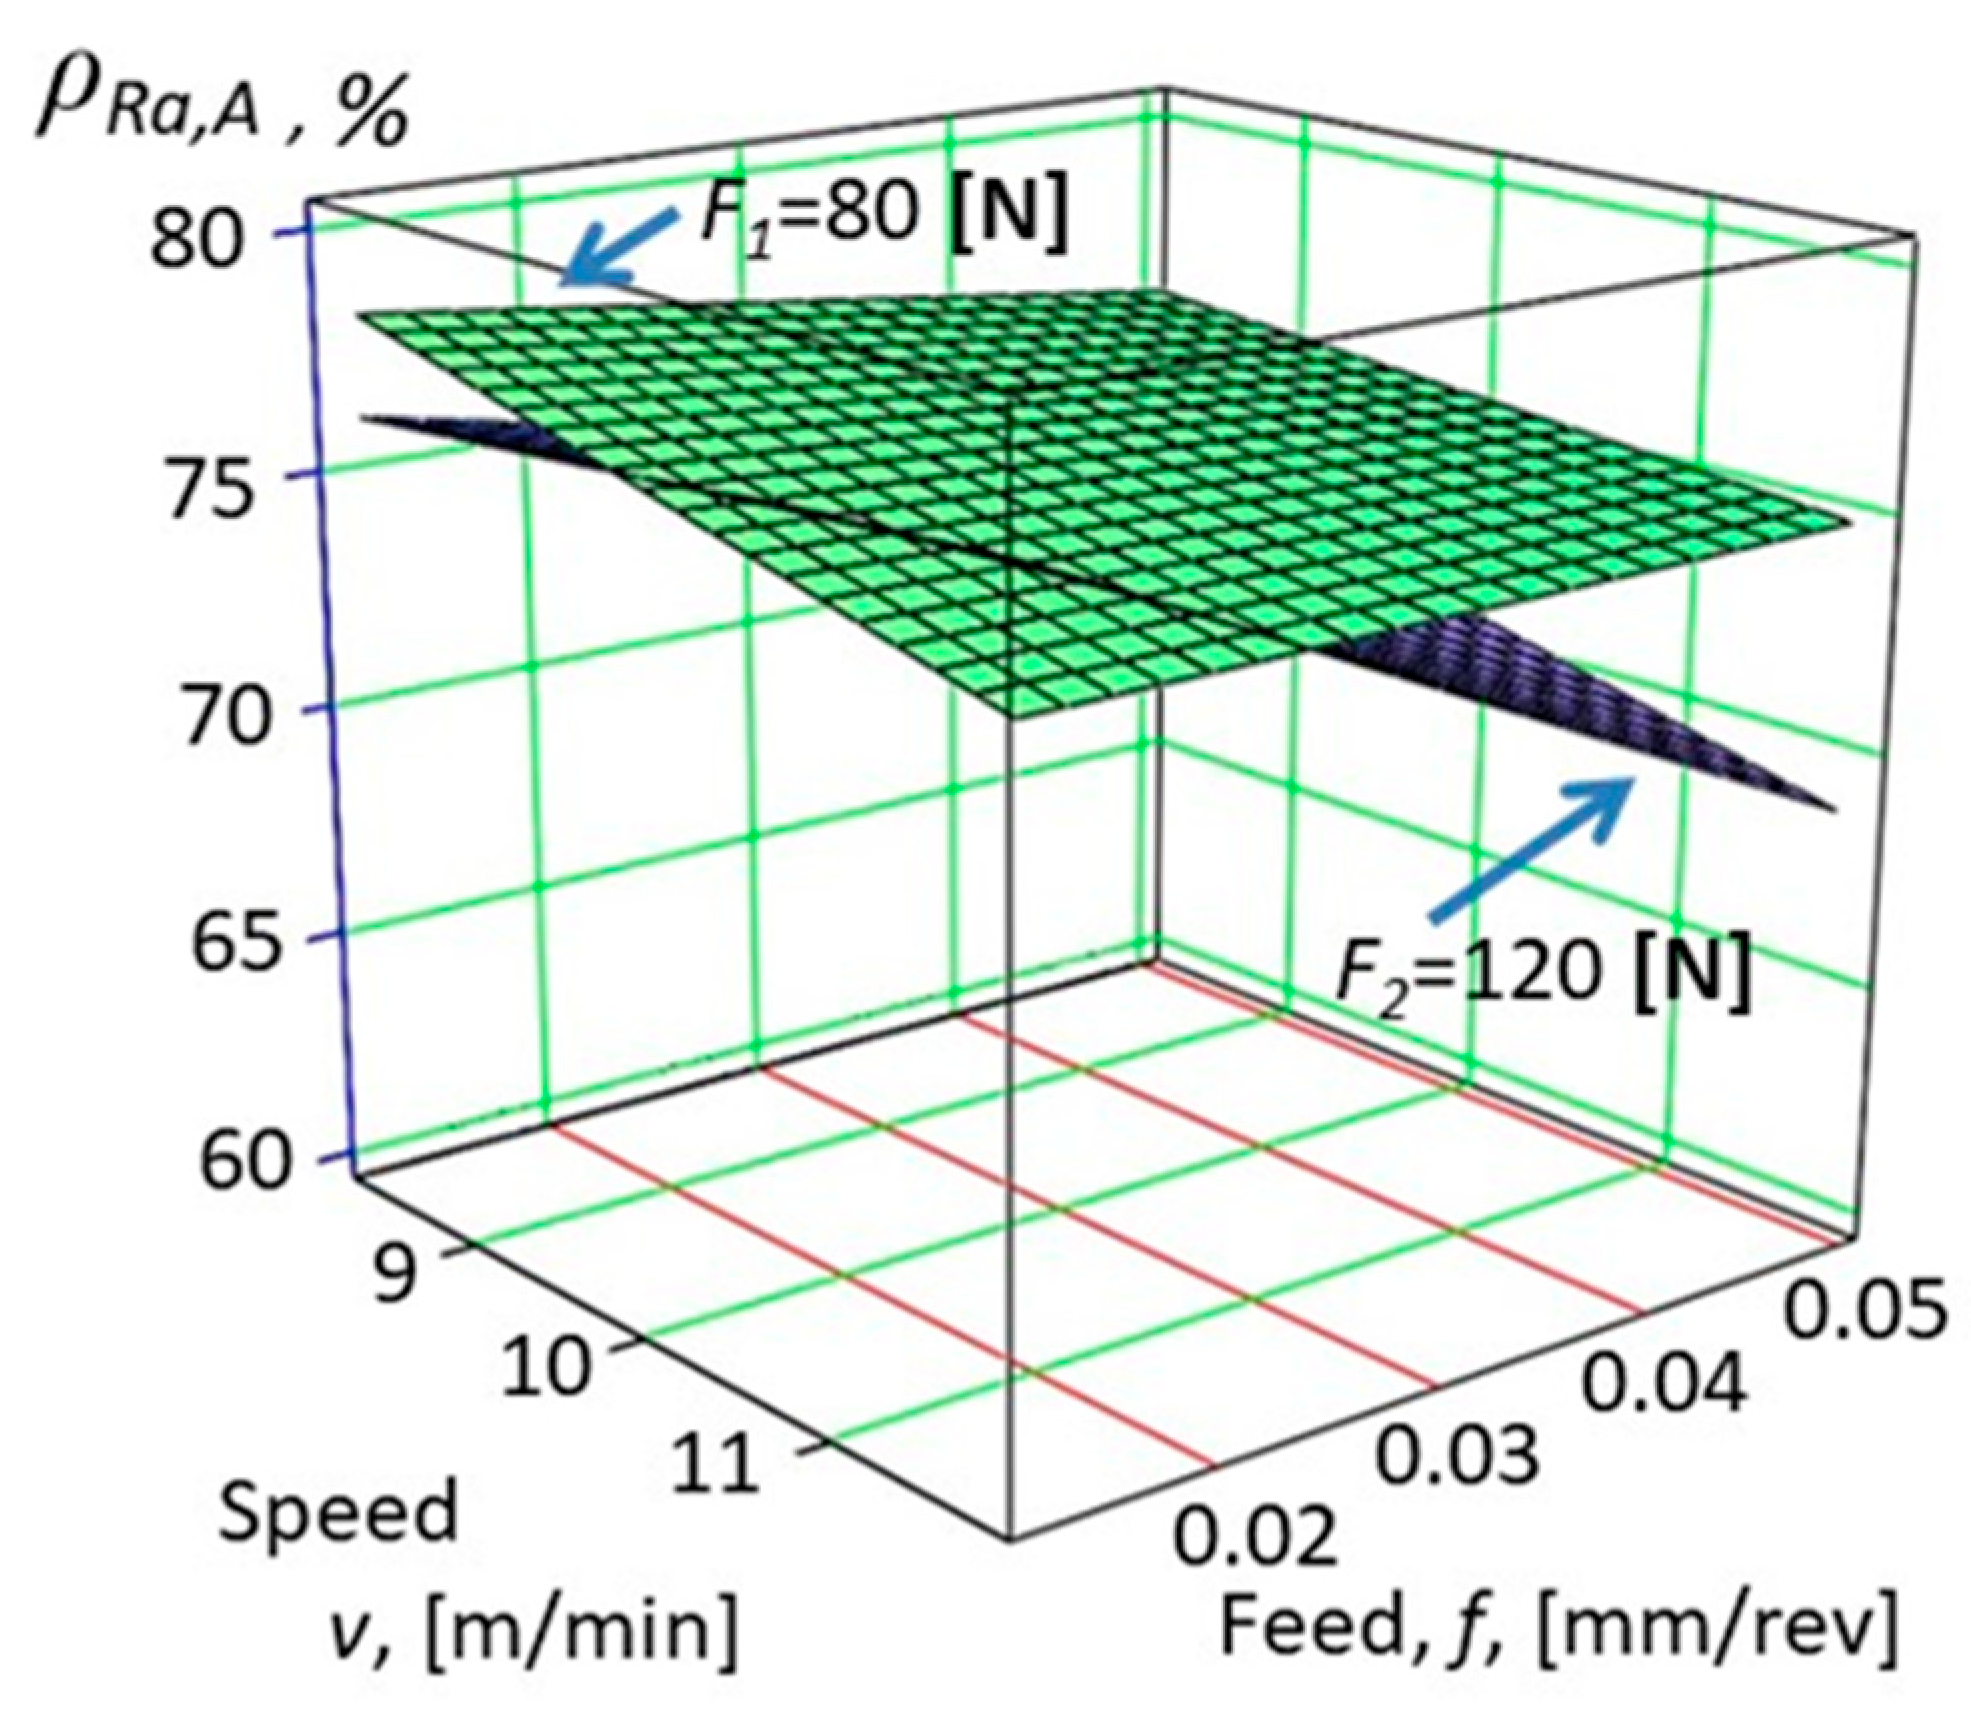
Figure 5.
Improvement of the change of surface roughness on specimens marked A (see Equation (3)).
Figure 5.
Improvement of the change of surface roughness on specimens marked A (see Equation (3)).
Figure 6.
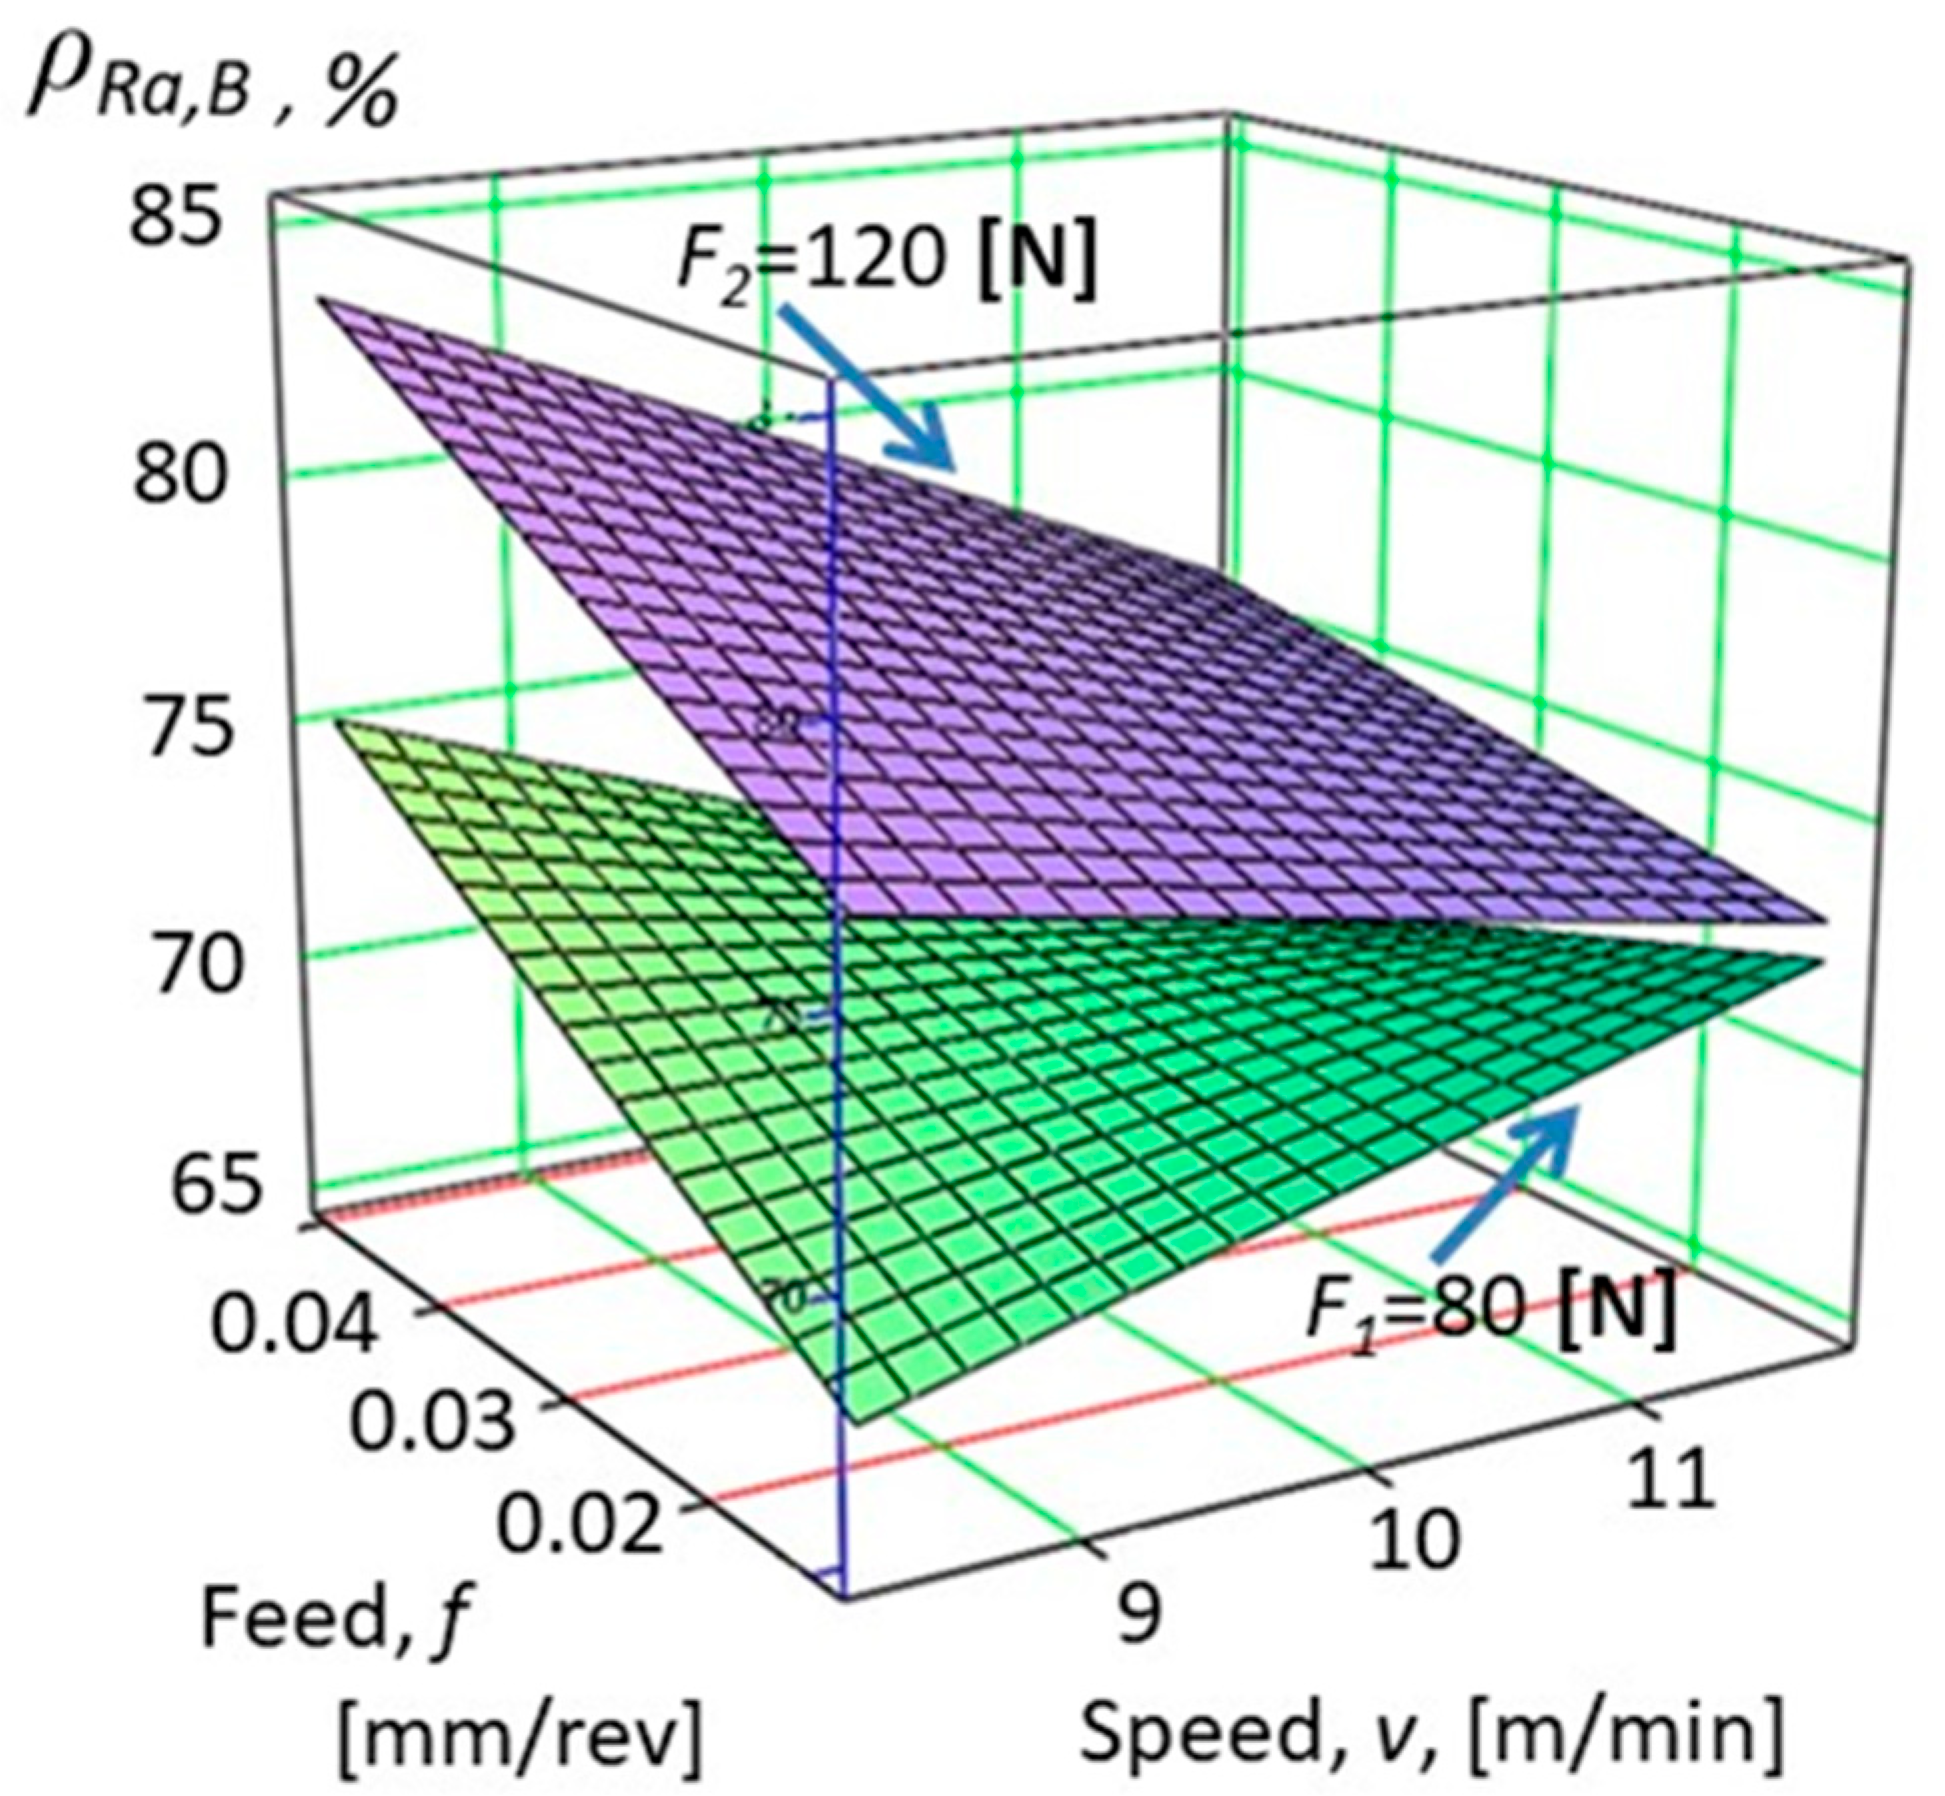
Improvement of the change of surface roughness on specimens marked B (see Equation (4)).
Figure 6.
Improvement of the change of surface roughness on specimens marked B (see Equation (4)).
Figure 7.
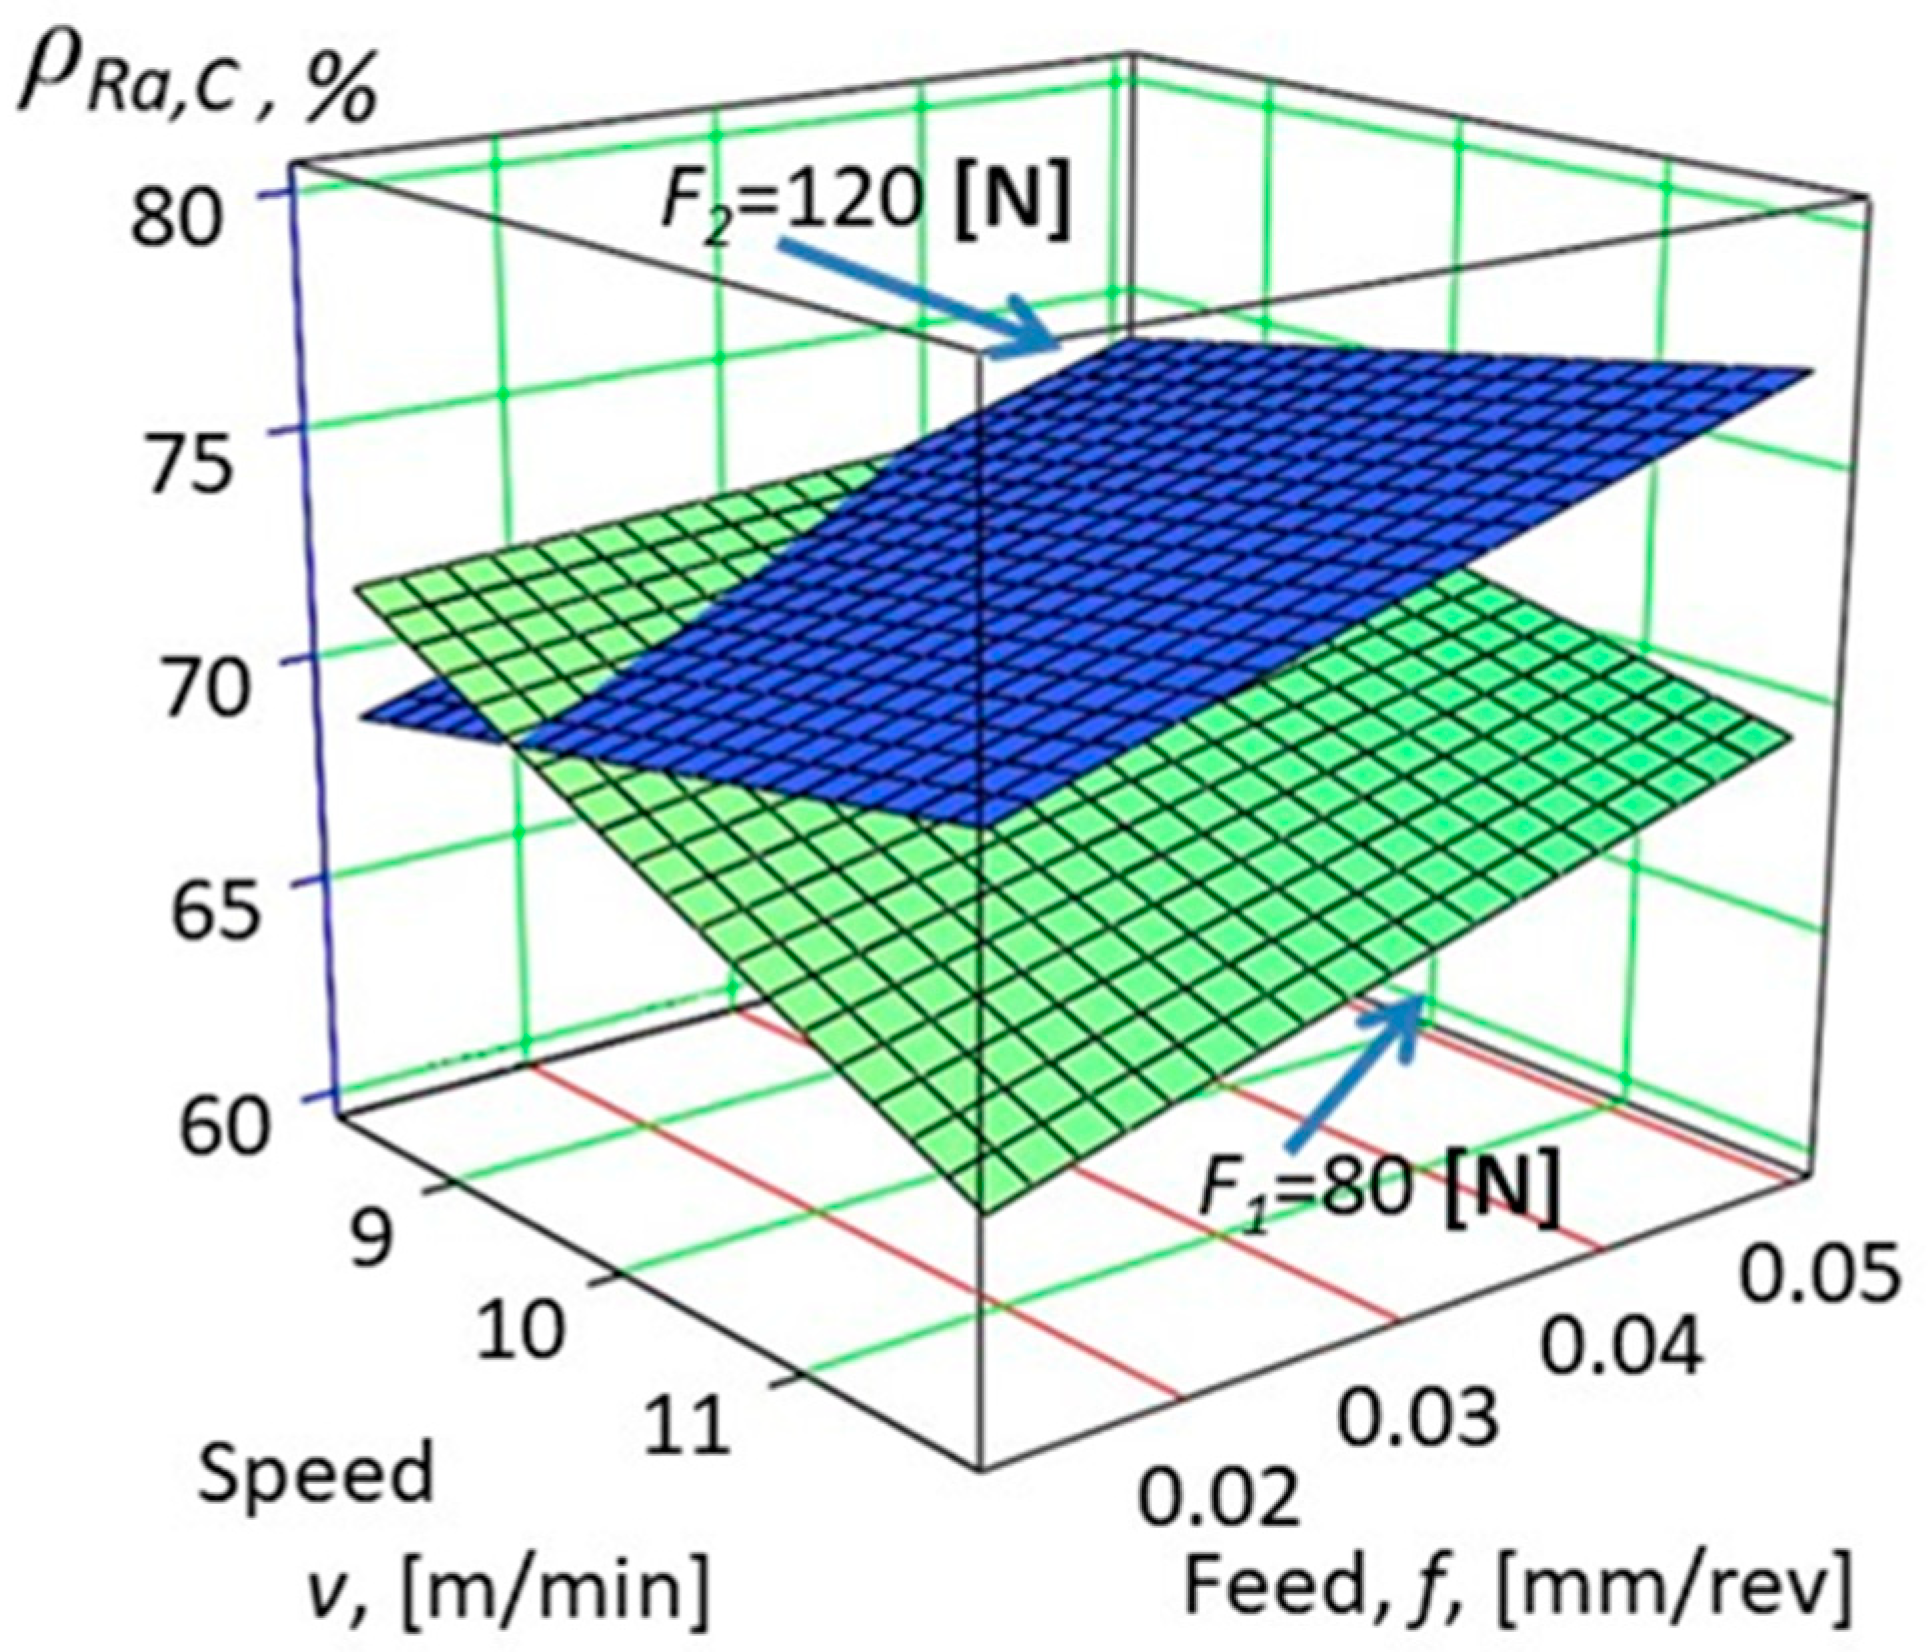
Improvement of the change of surface roughness on specimens marked C (see Equation (5)).
Figure 7.
Improvement of the change of surface roughness on specimens marked C (see Equation (5)).
Figure 8.
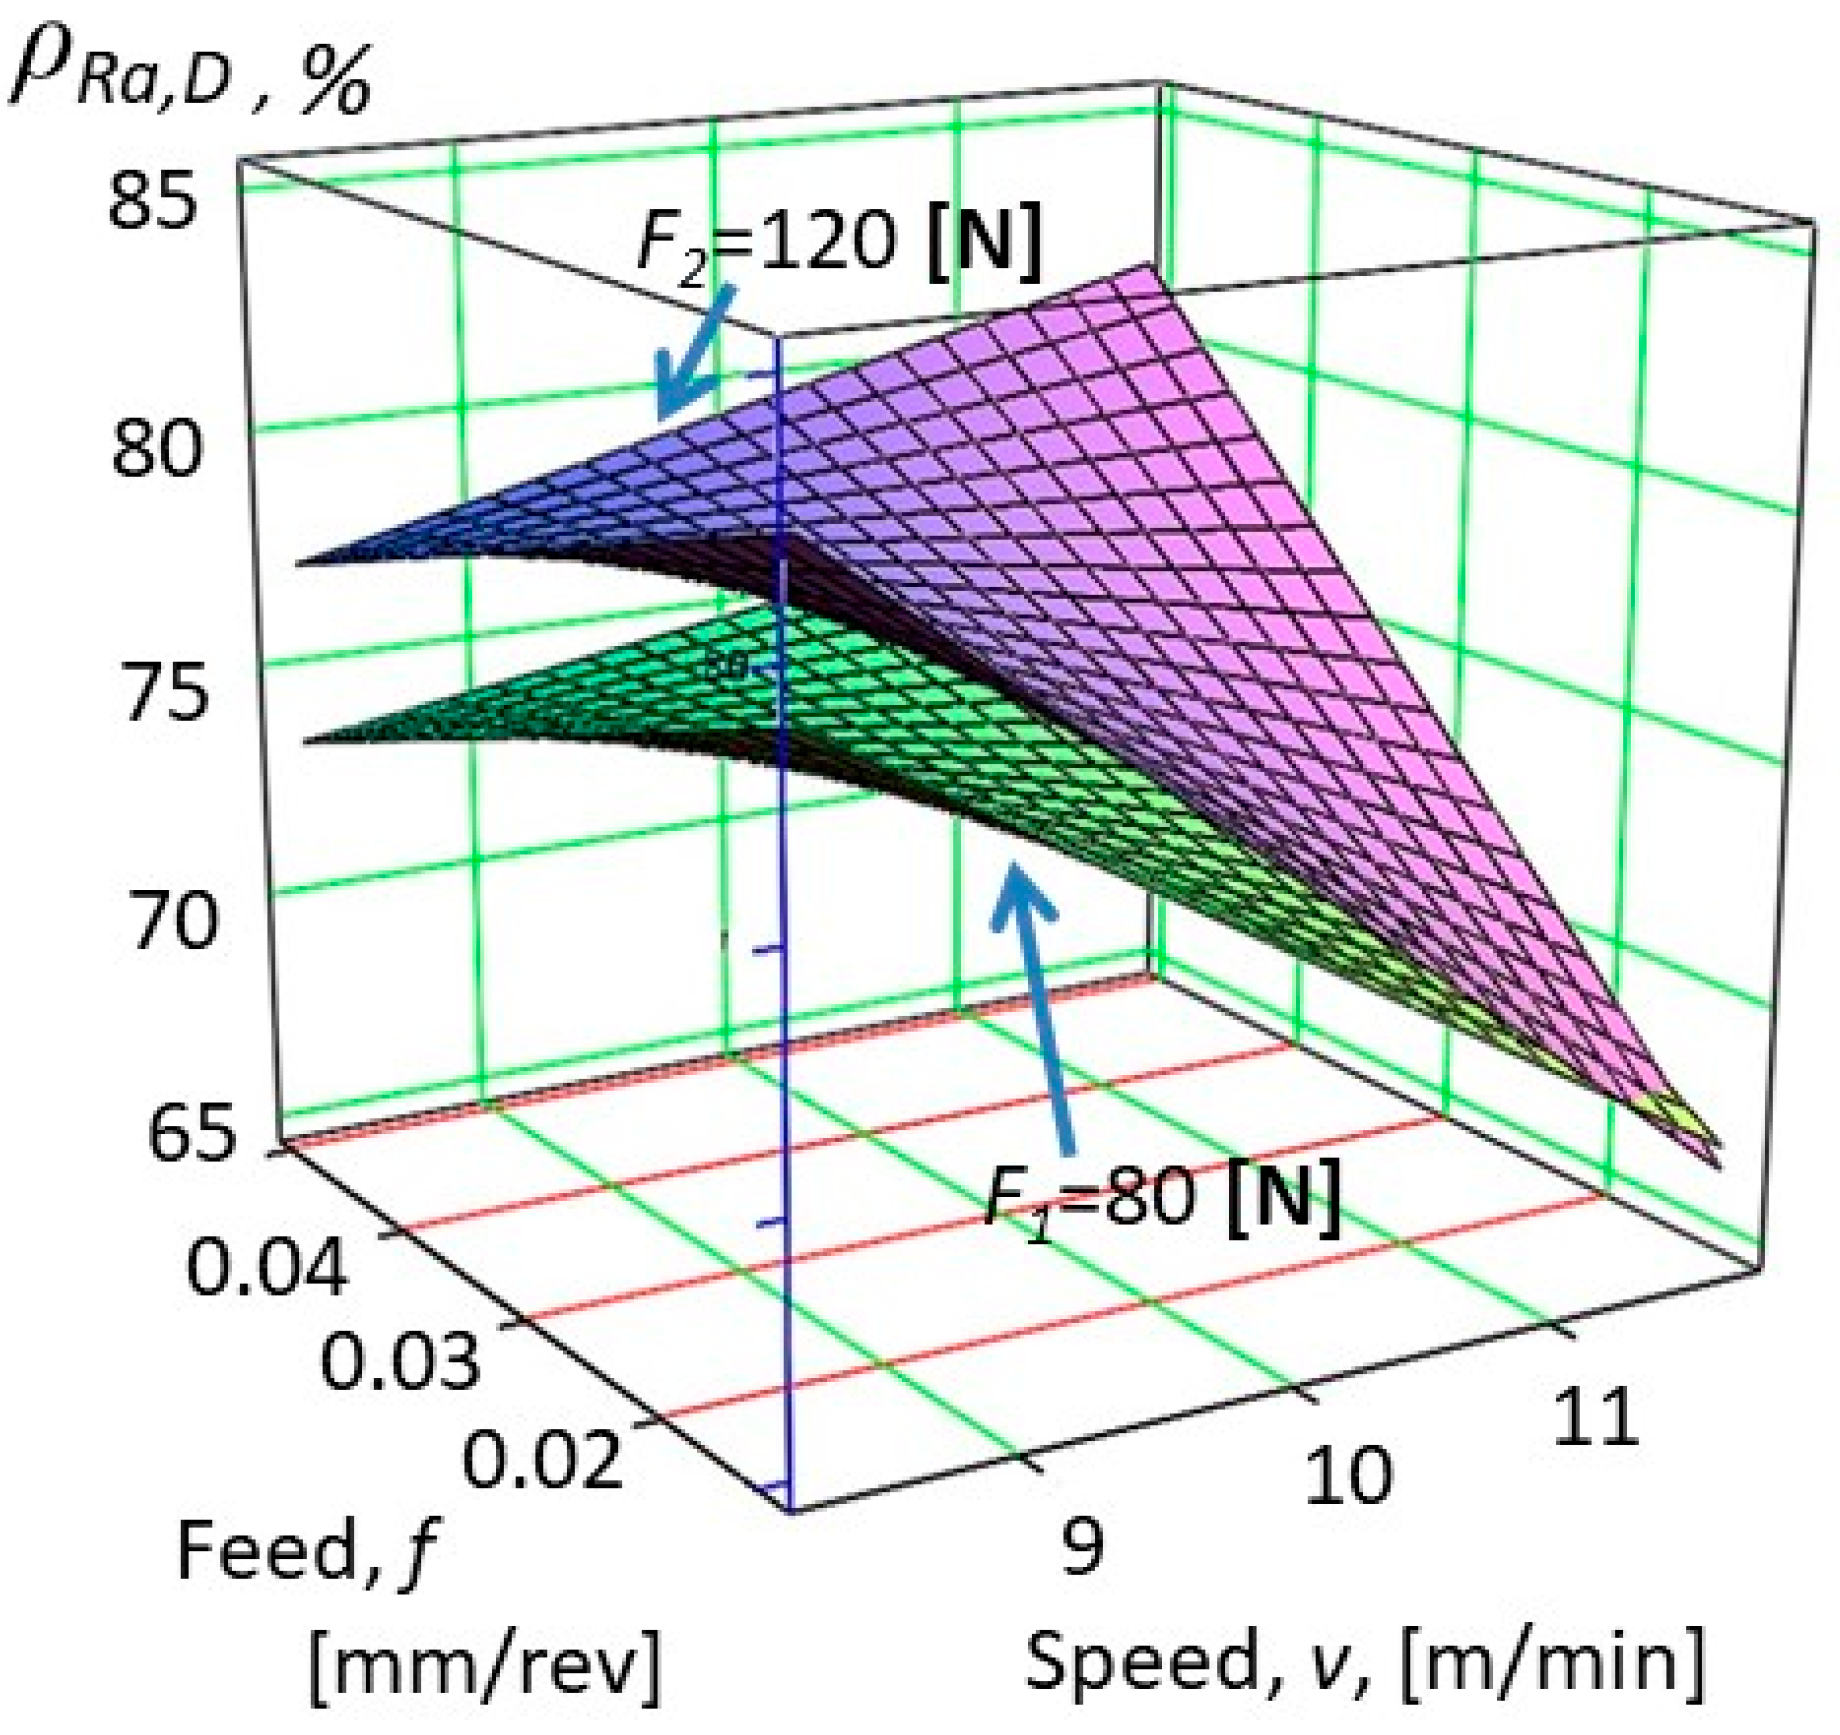
Improvement of the change of surface roughness on specimens marked D (see Equation (6)).
Figure 8.
Improvement of the change of surface roughness on specimens marked D (see Equation (6)).
Figure 9.
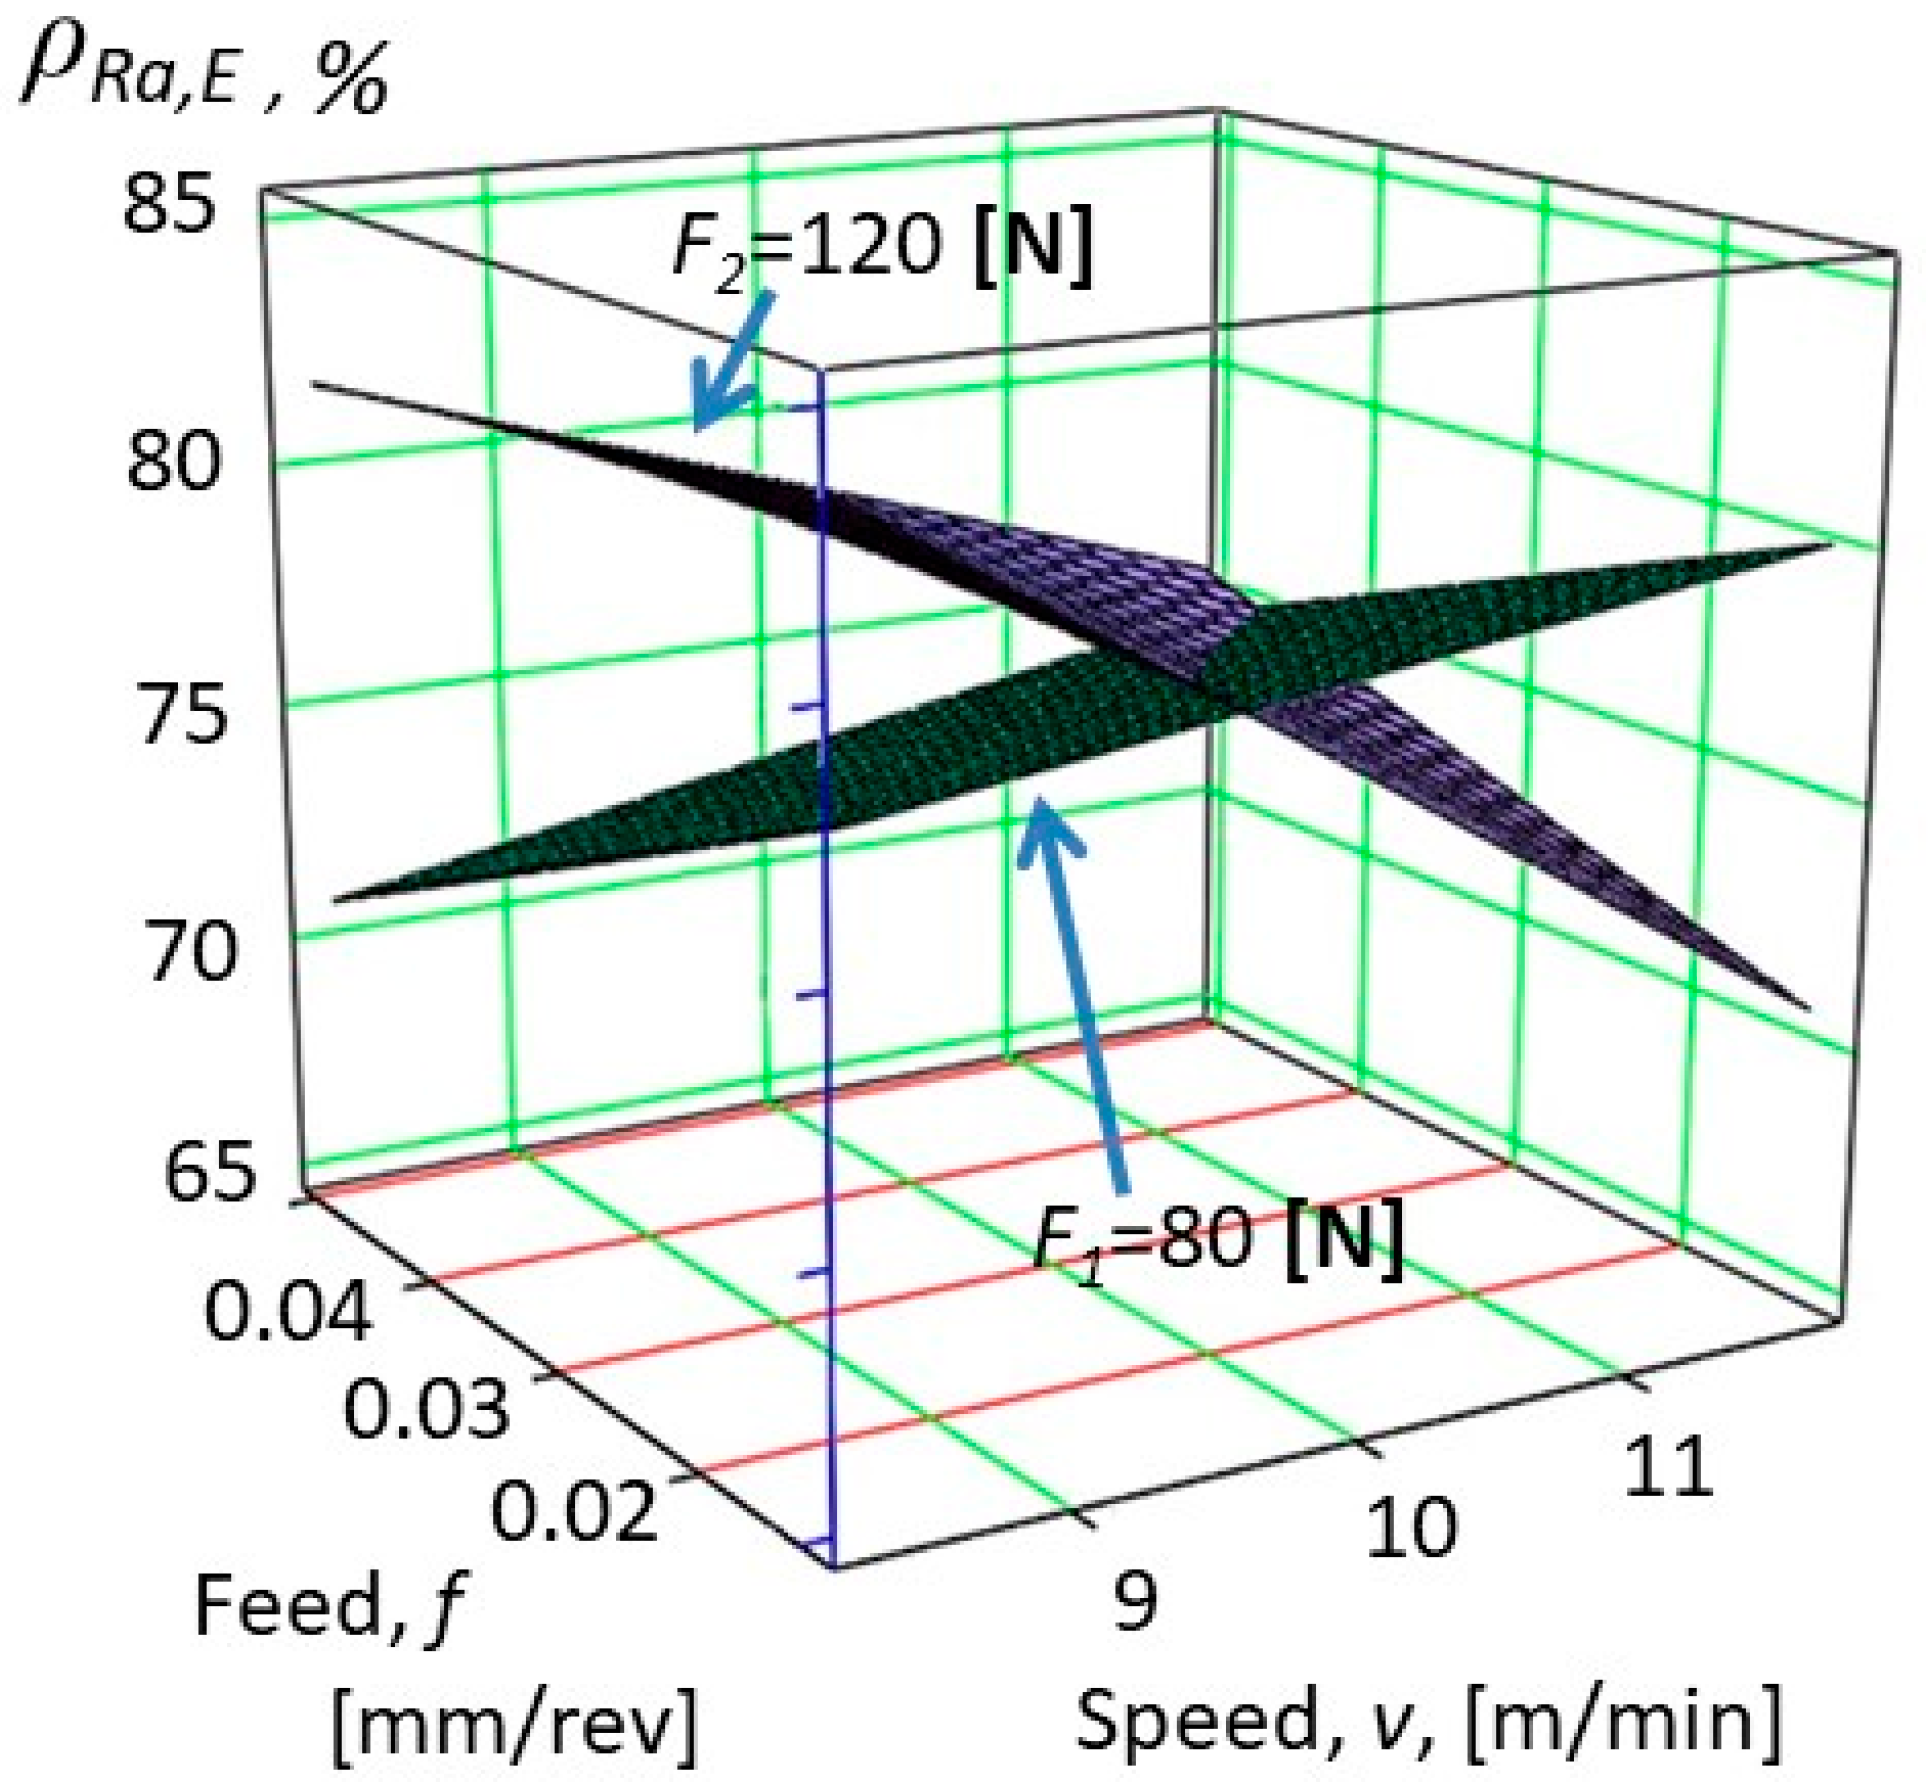
Improvement of the change of surface roughness on specimens marked E (see Equation (7)).
Figure 9.
Improvement of the change of surface roughness on specimens marked E (see Equation (7)).
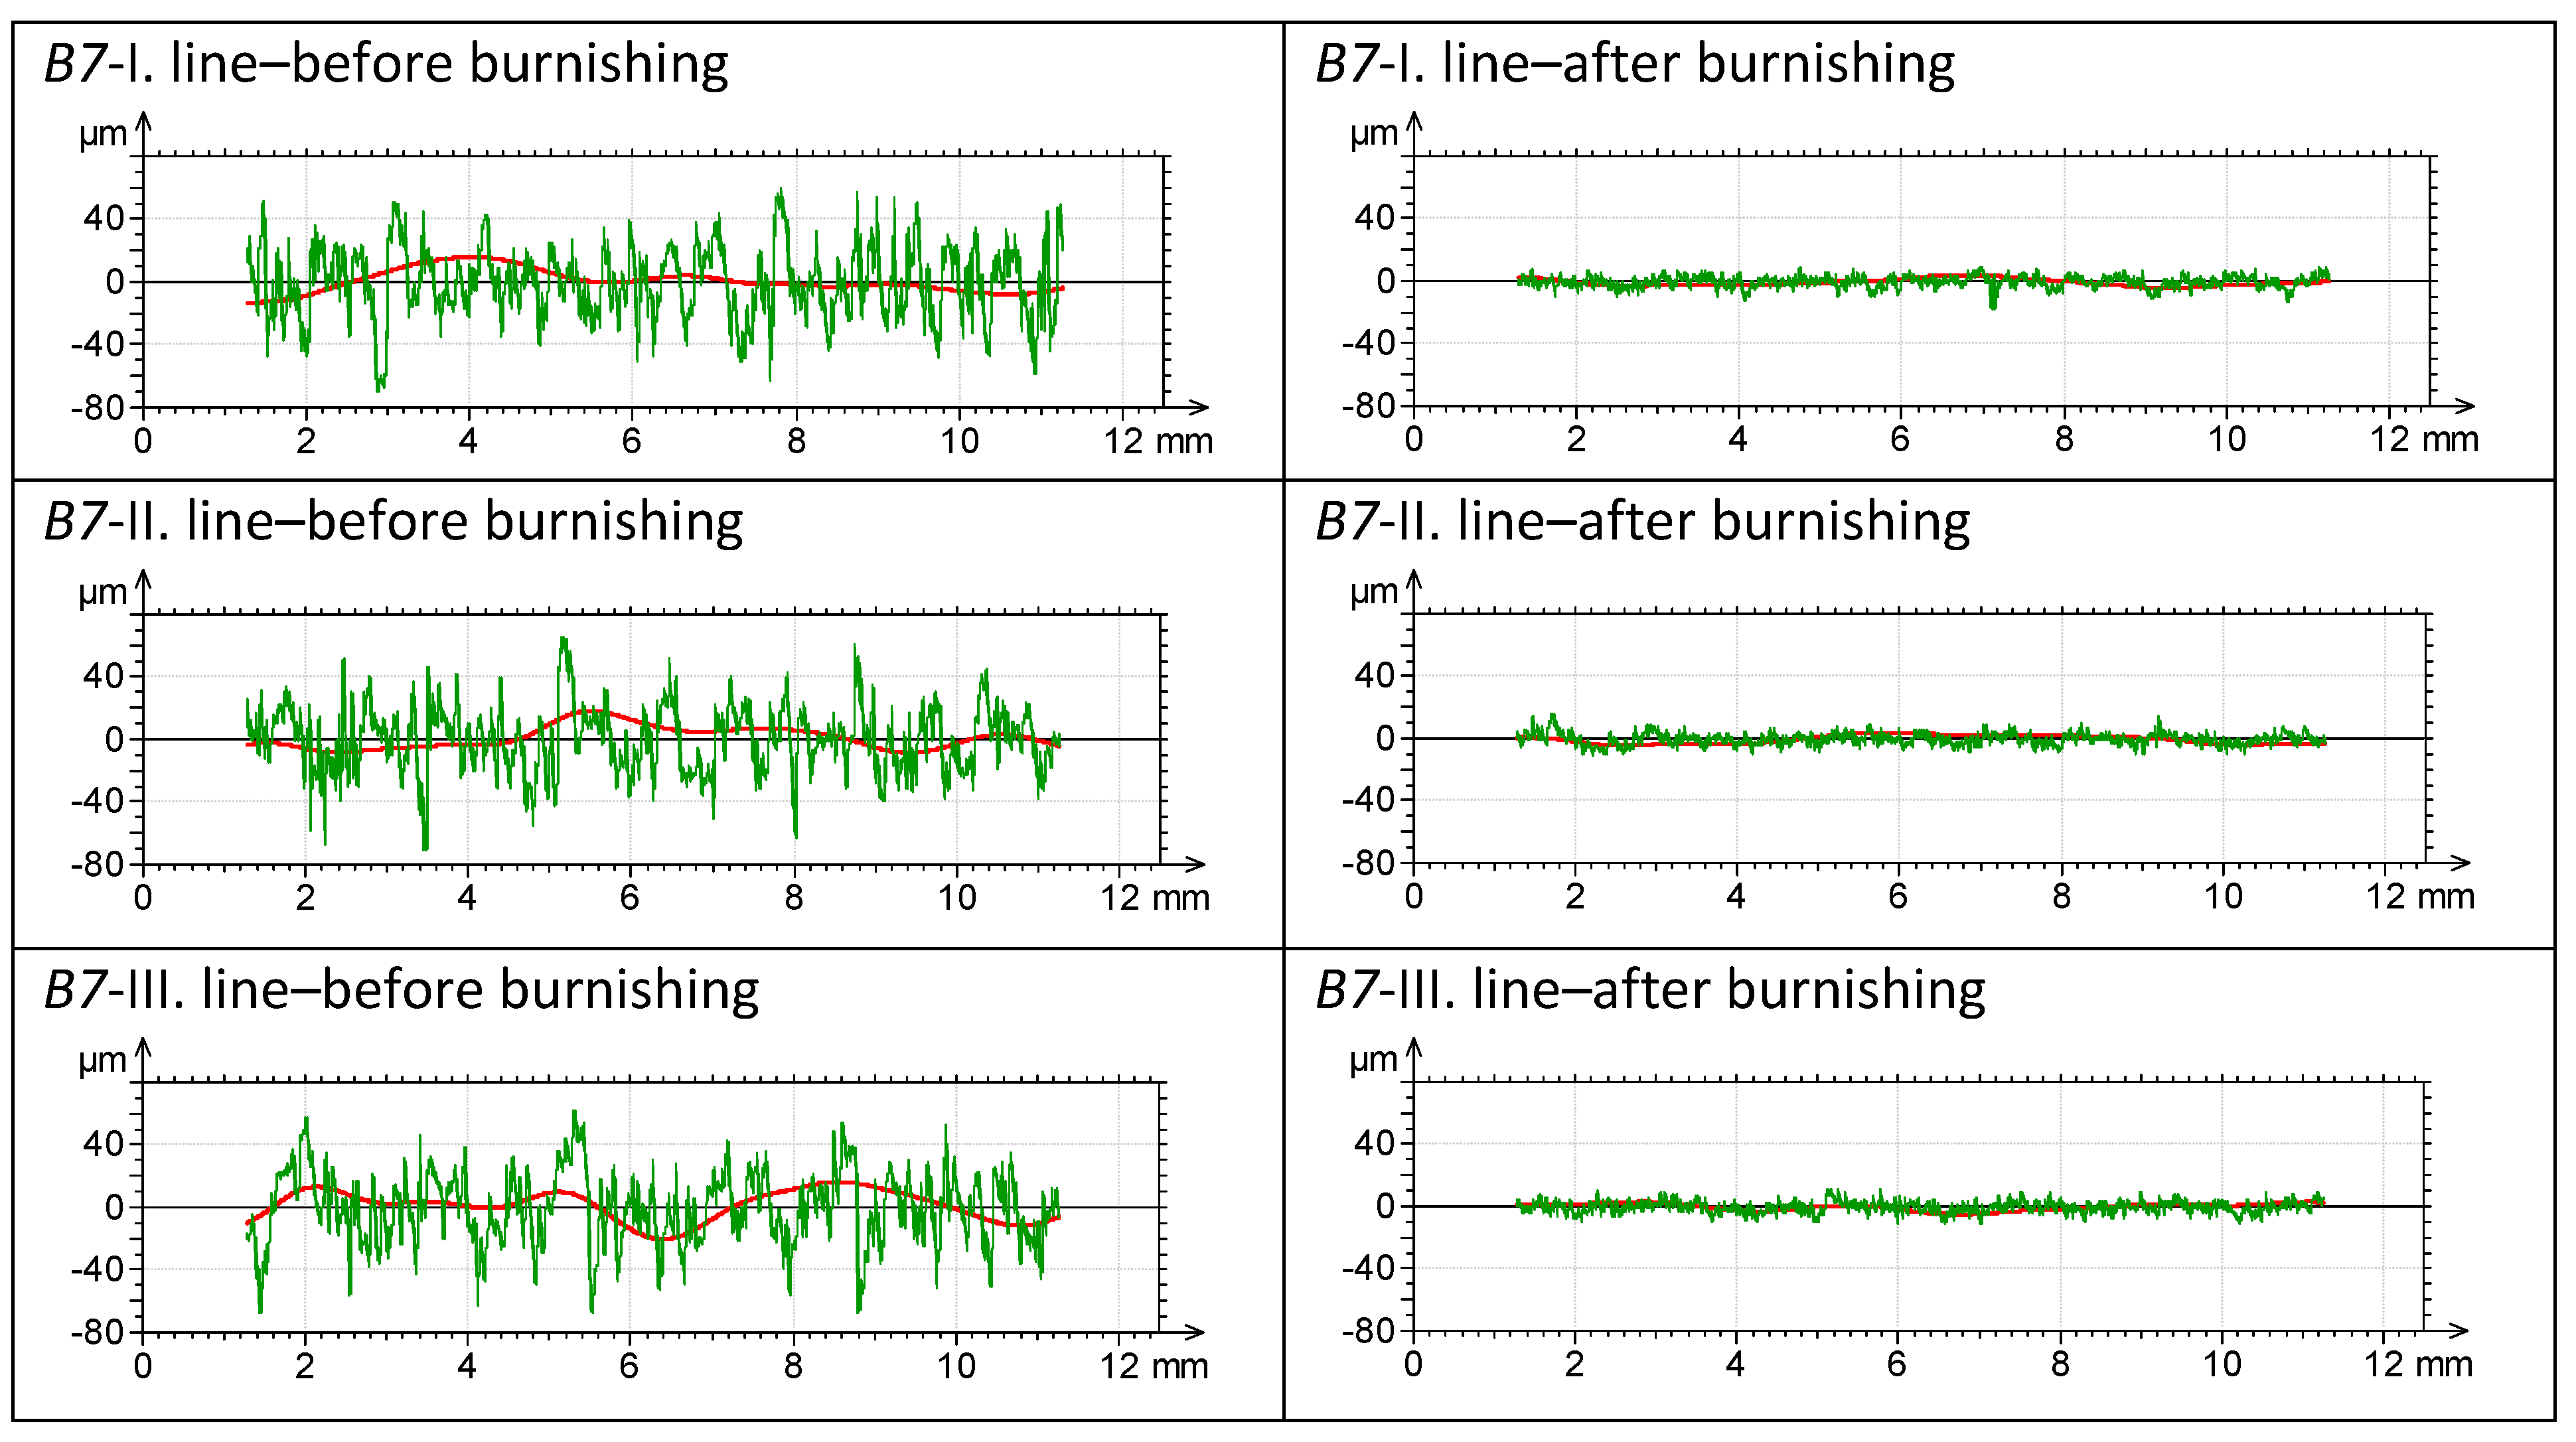
Figure 10.
The change in roughness profiles before and after burnishing on specimen B7 on cylinder generatrices, 120° apart.
Figure 10.
The change in roughness profiles before and after burnishing on specimen B7 on cylinder generatrices, 120° apart.
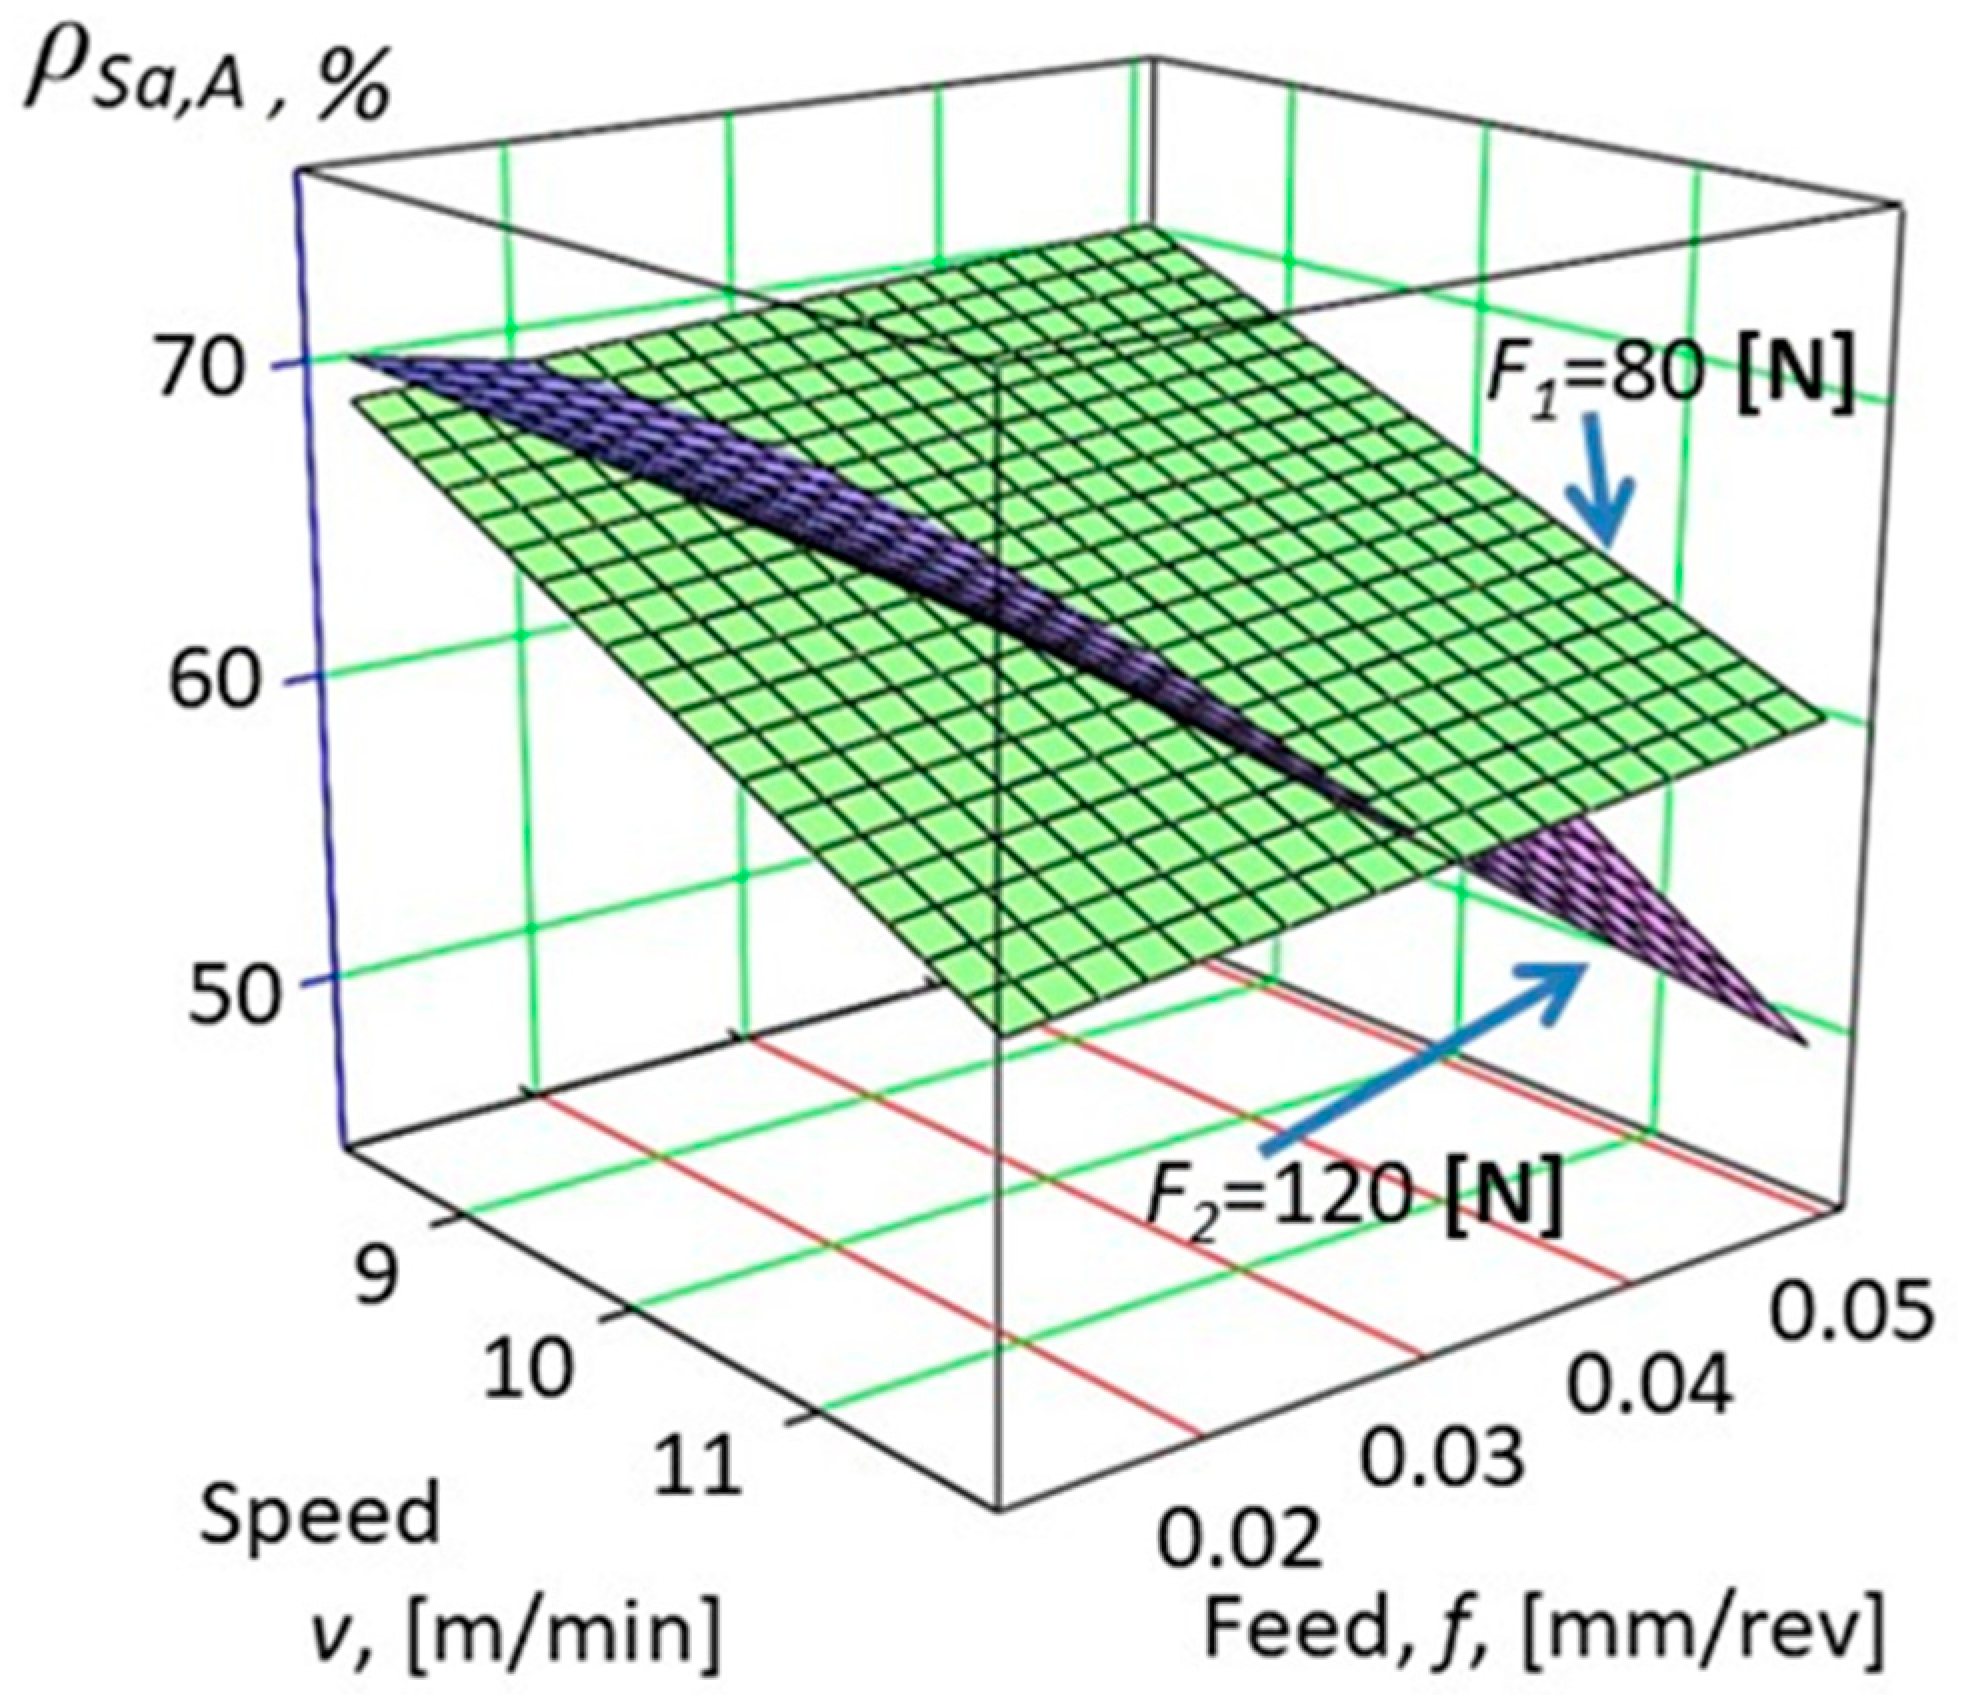
Figure 11.
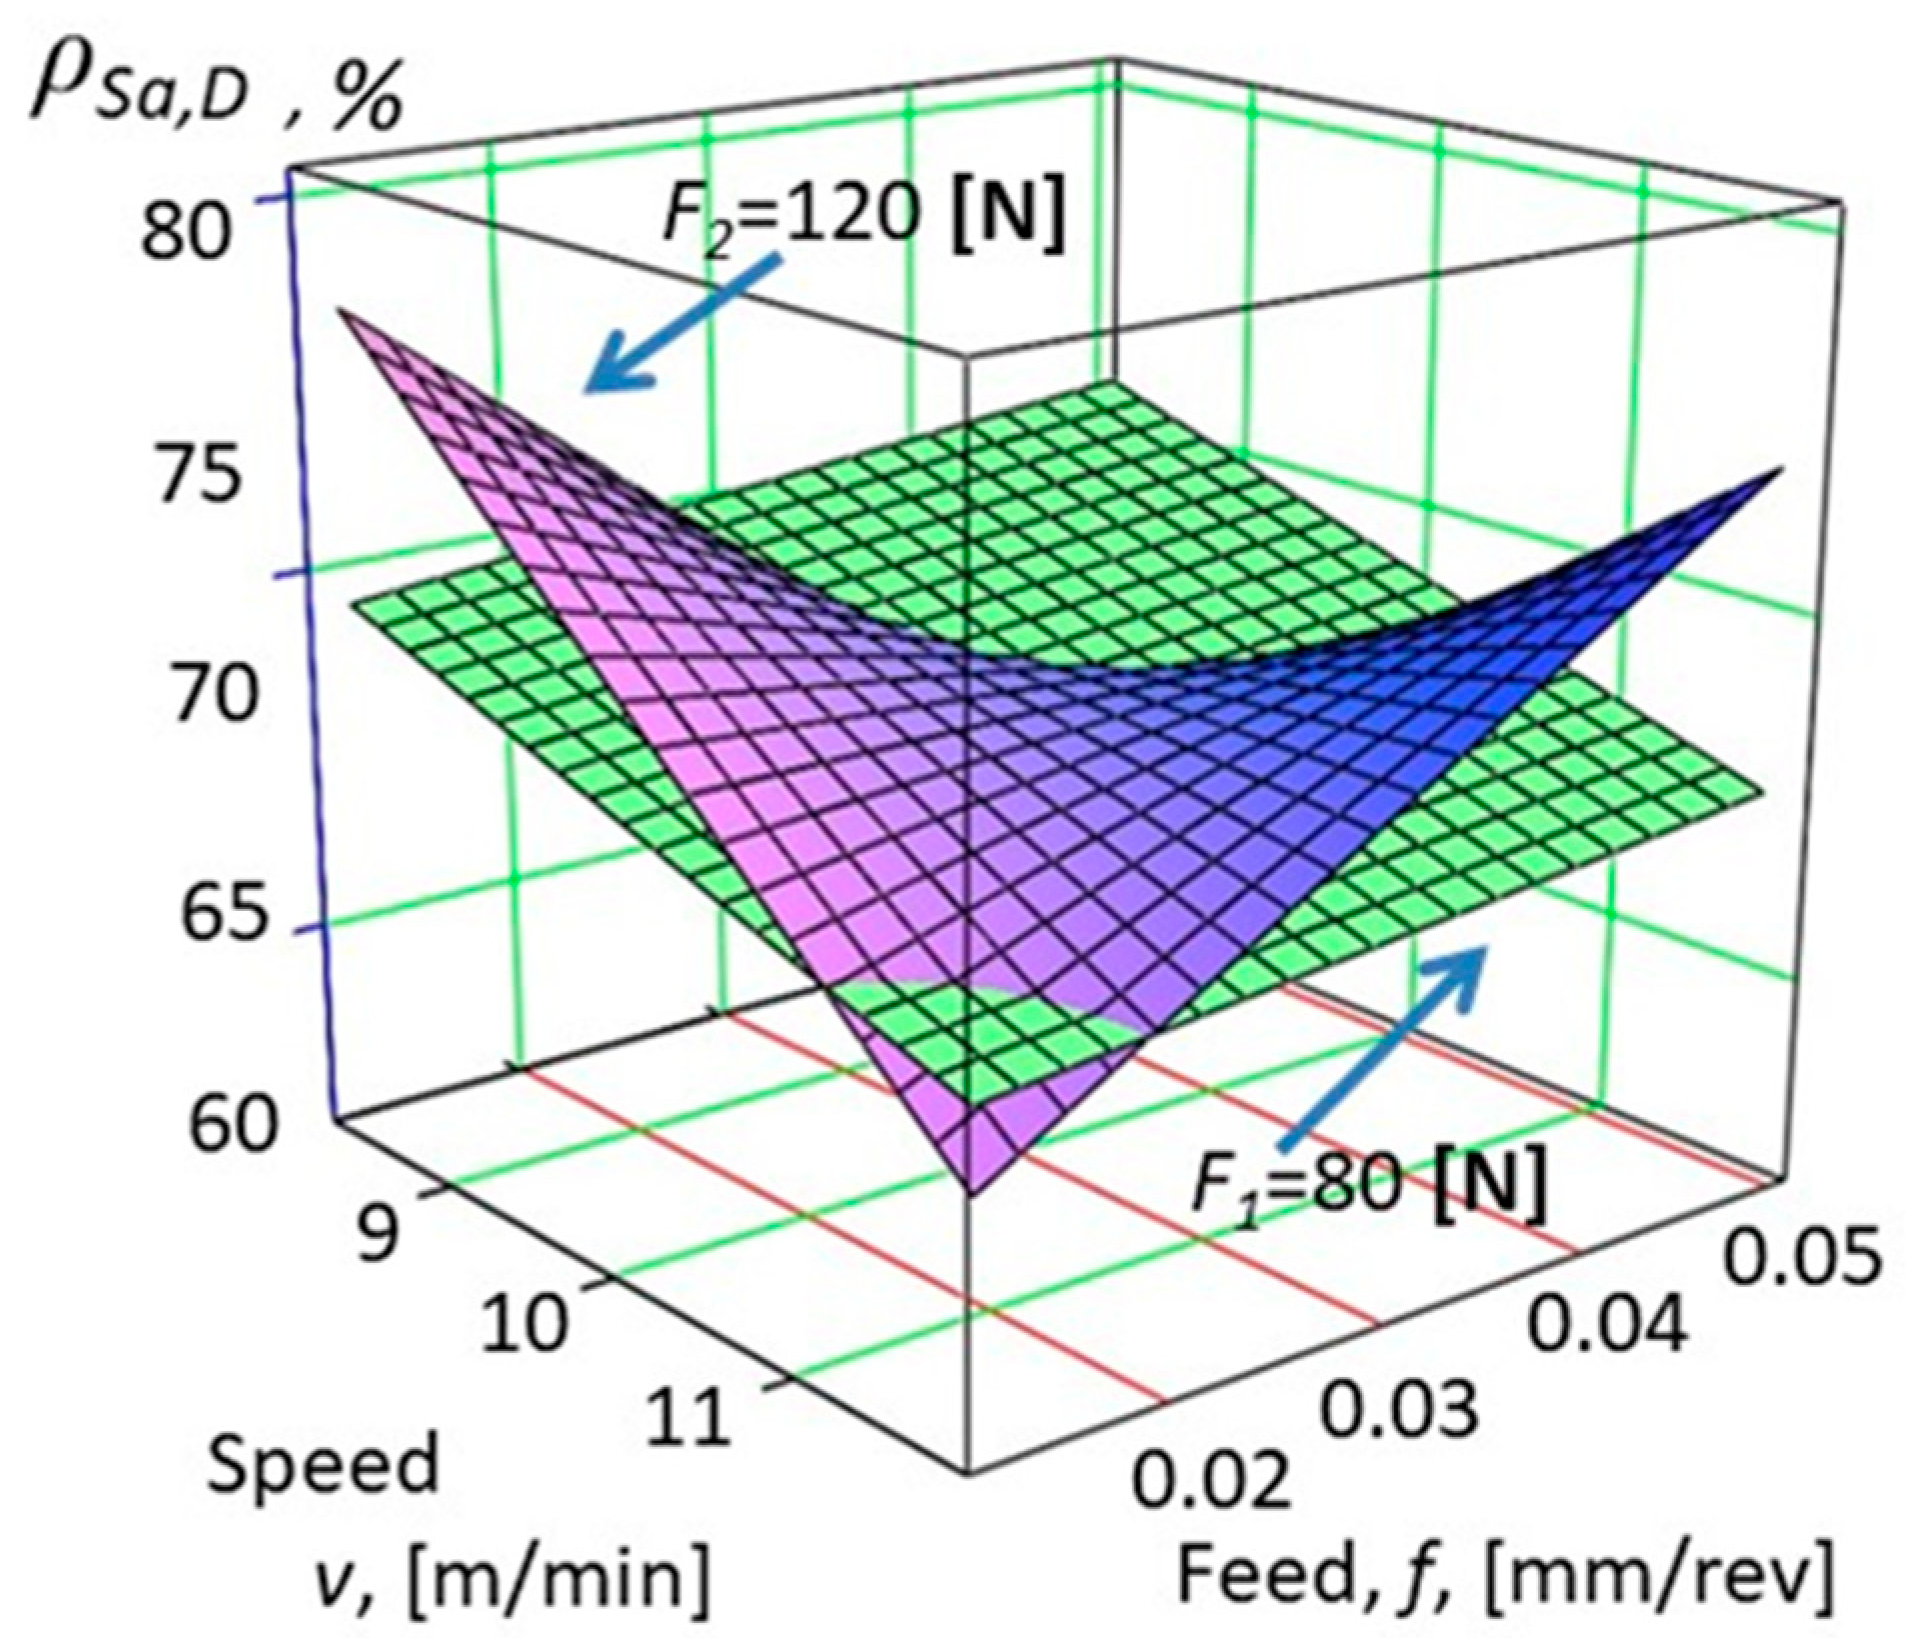
Improvement of the change of surface roughness on specimens marked A (see Equation (9)).
Figure 11.
Improvement of the change of surface roughness on specimens marked A (see Equation (9)).
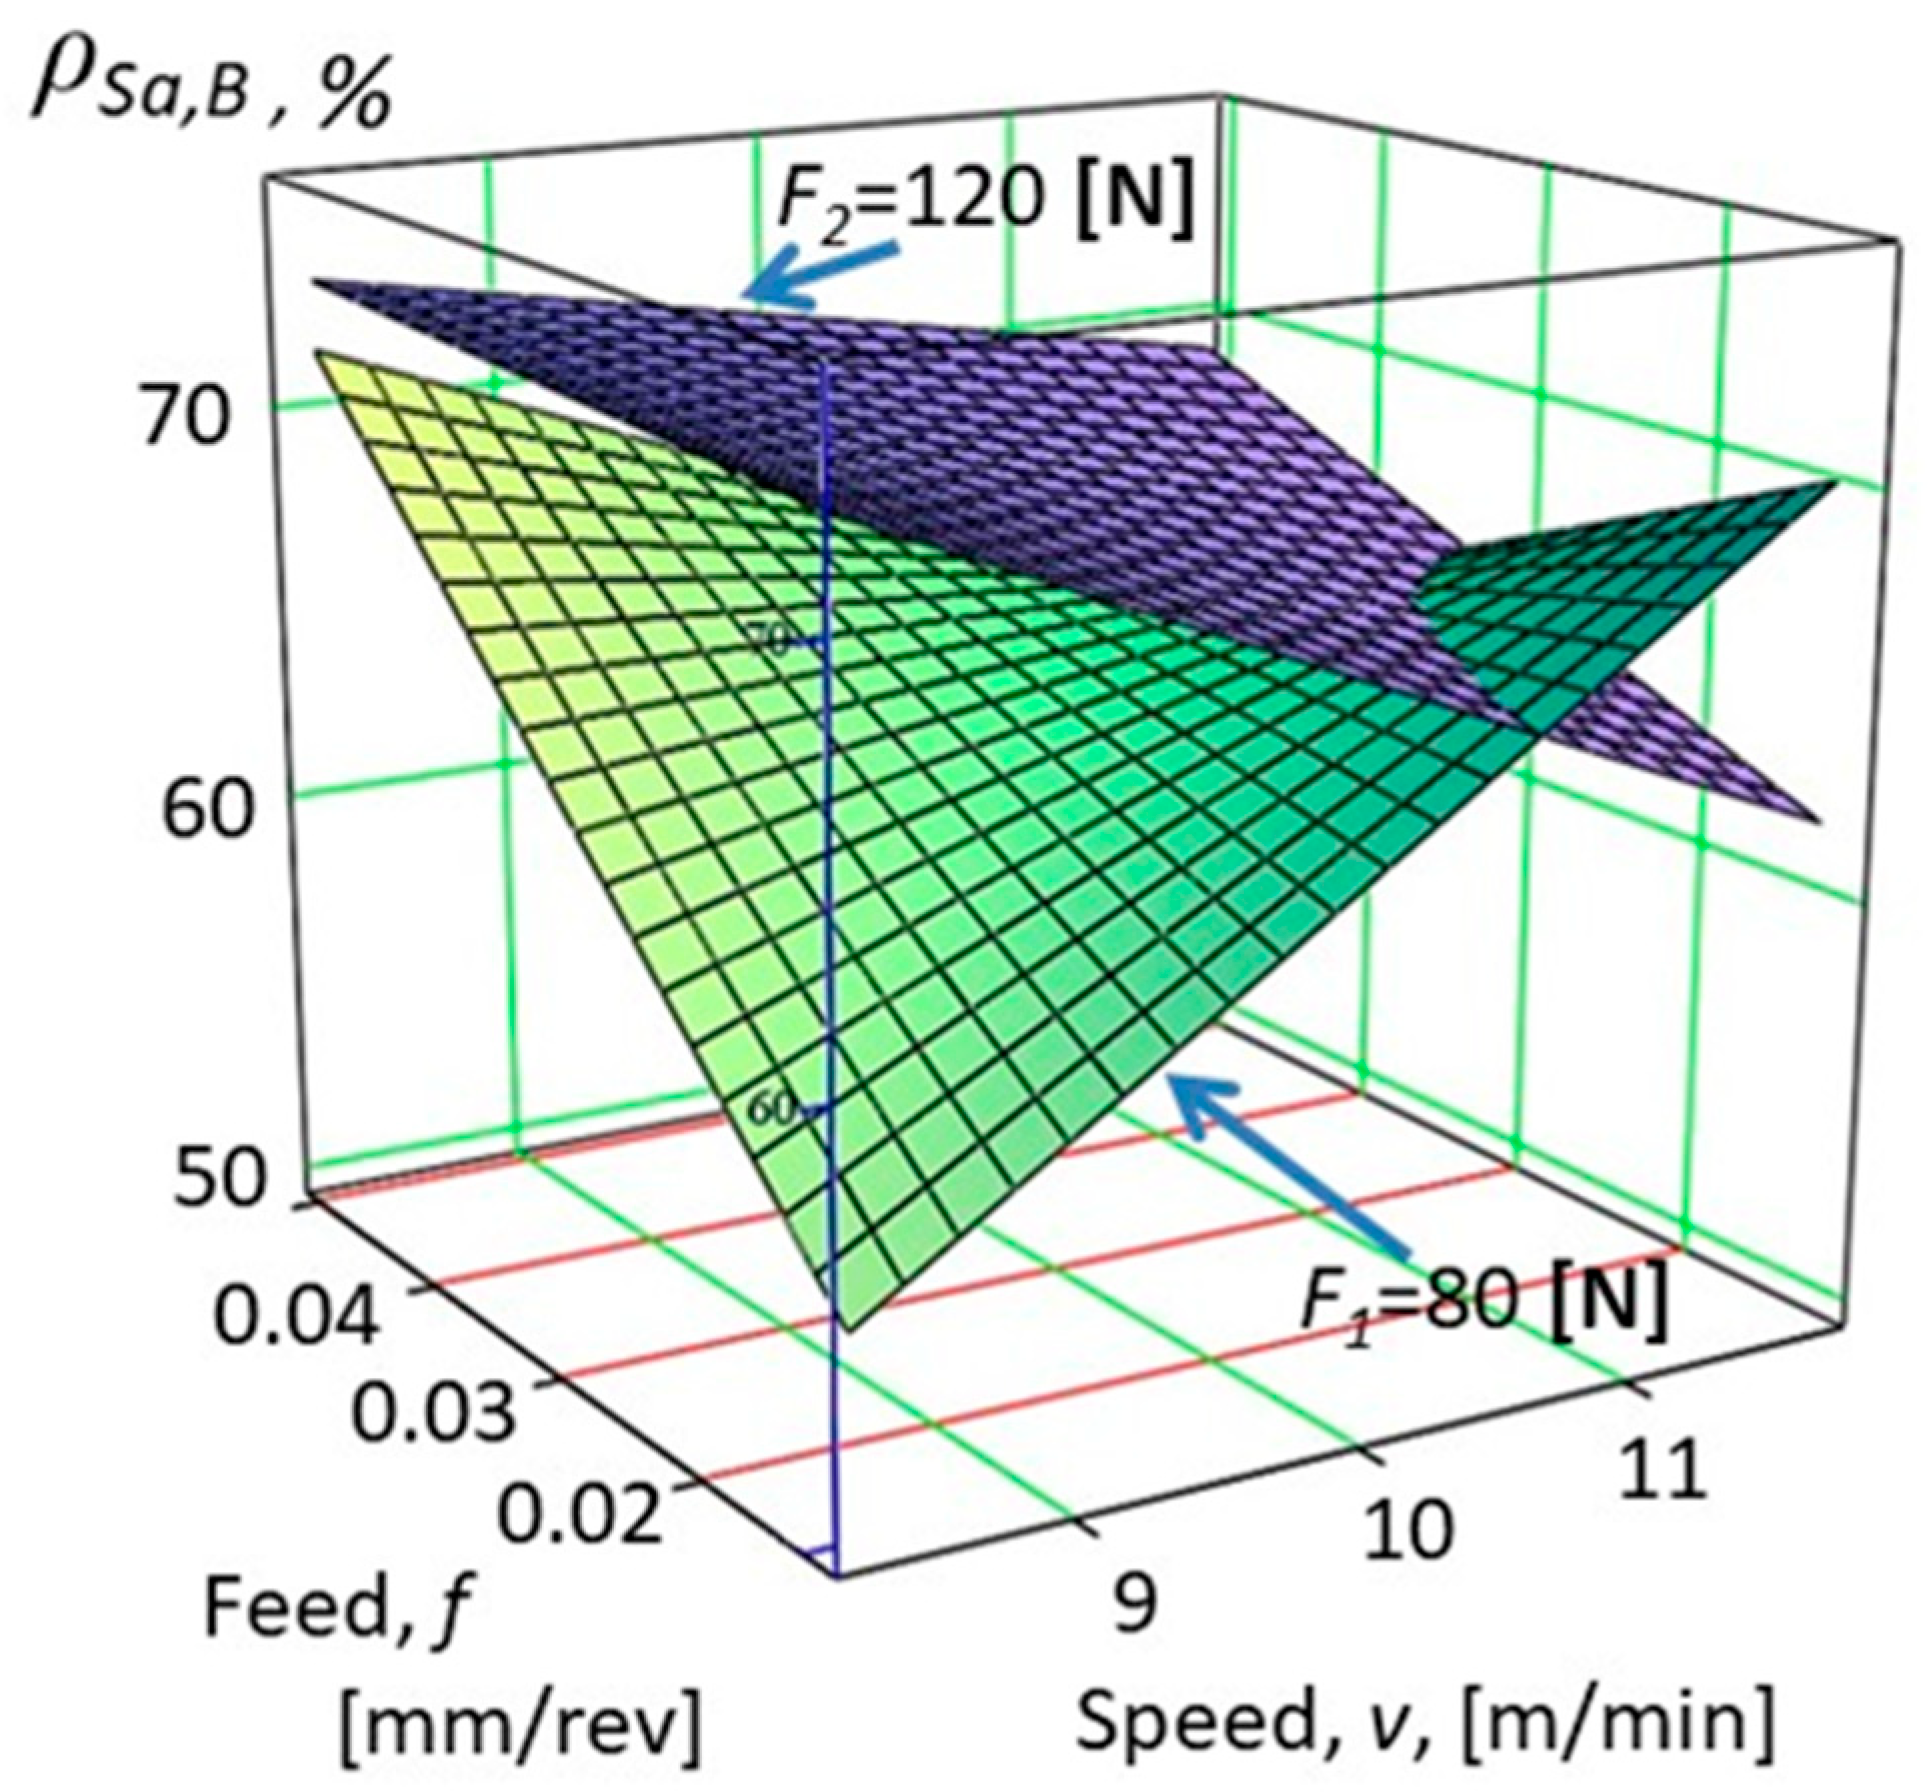
Figure 12.
Improvement of the change of surface roughness on specimens marked B (see Equation (10)).
Figure 12.
Improvement of the change of surface roughness on specimens marked B (see Equation (10)).
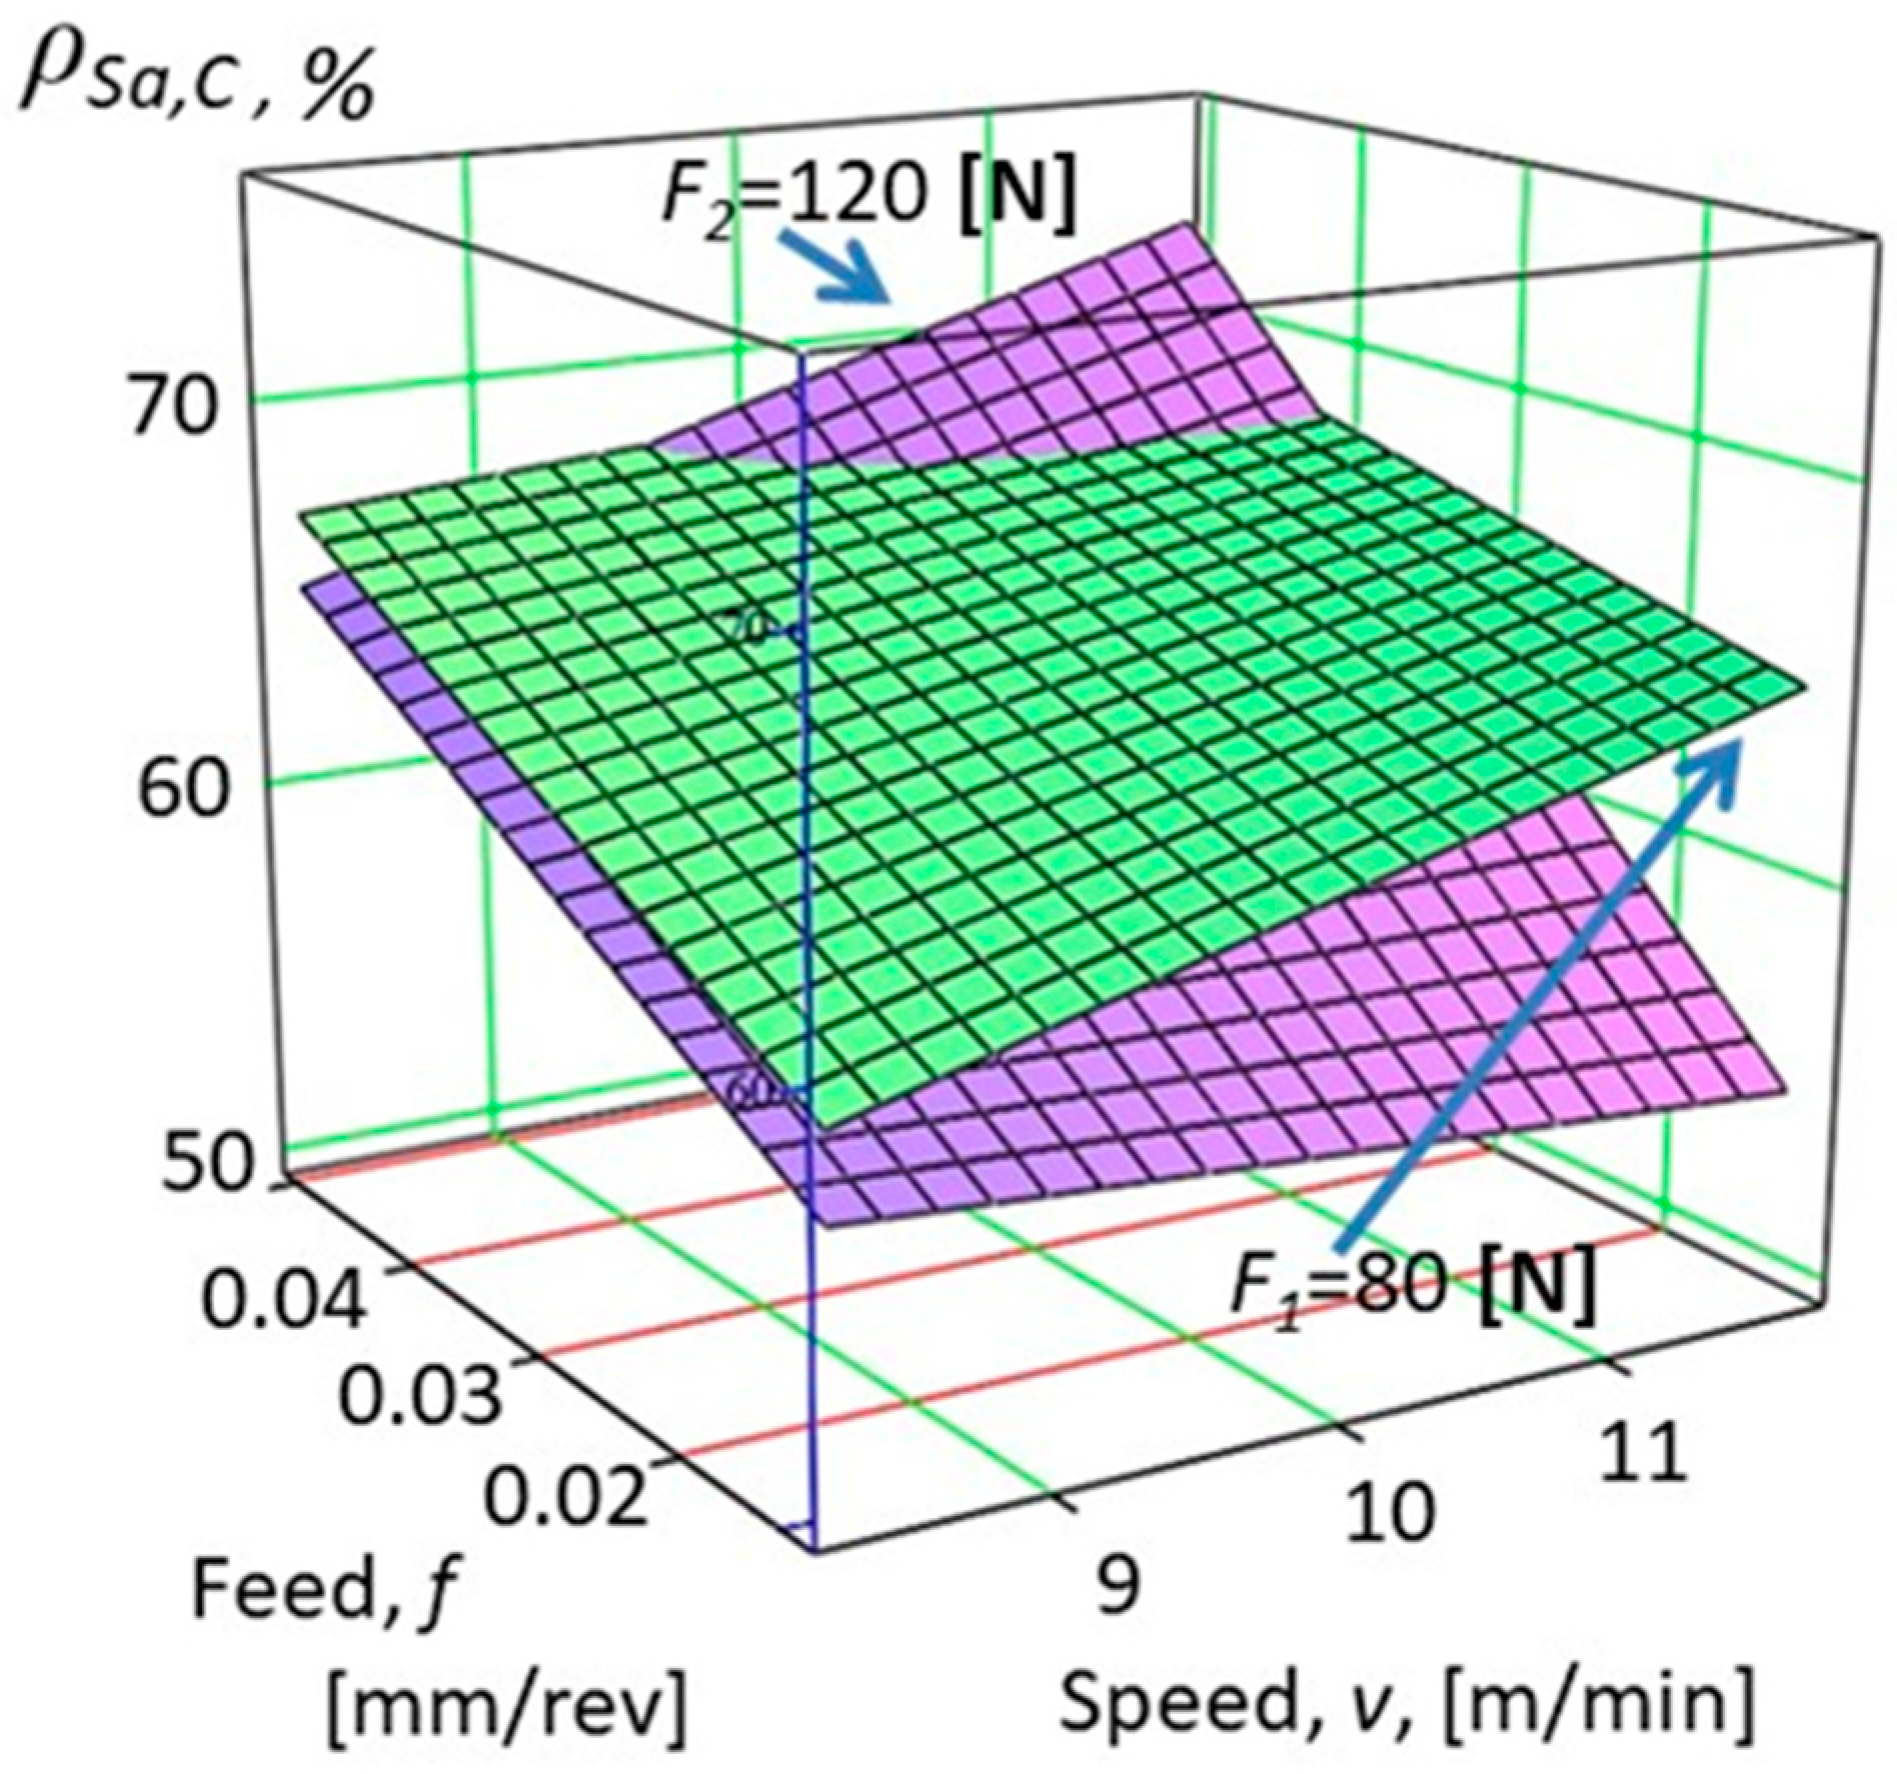
Figure 13.
Improvement of the change of surface roughness on specimens marked C (see Equation (11)).
Figure 13.
Improvement of the change of surface roughness on specimens marked C (see Equation (11)).
Figure 14.
Improvement of the change of surface roughness on specimens marked D (see Equation (12)).
Figure 14.
Improvement of the change of surface roughness on specimens marked D (see Equation (12)).
Figure 15.
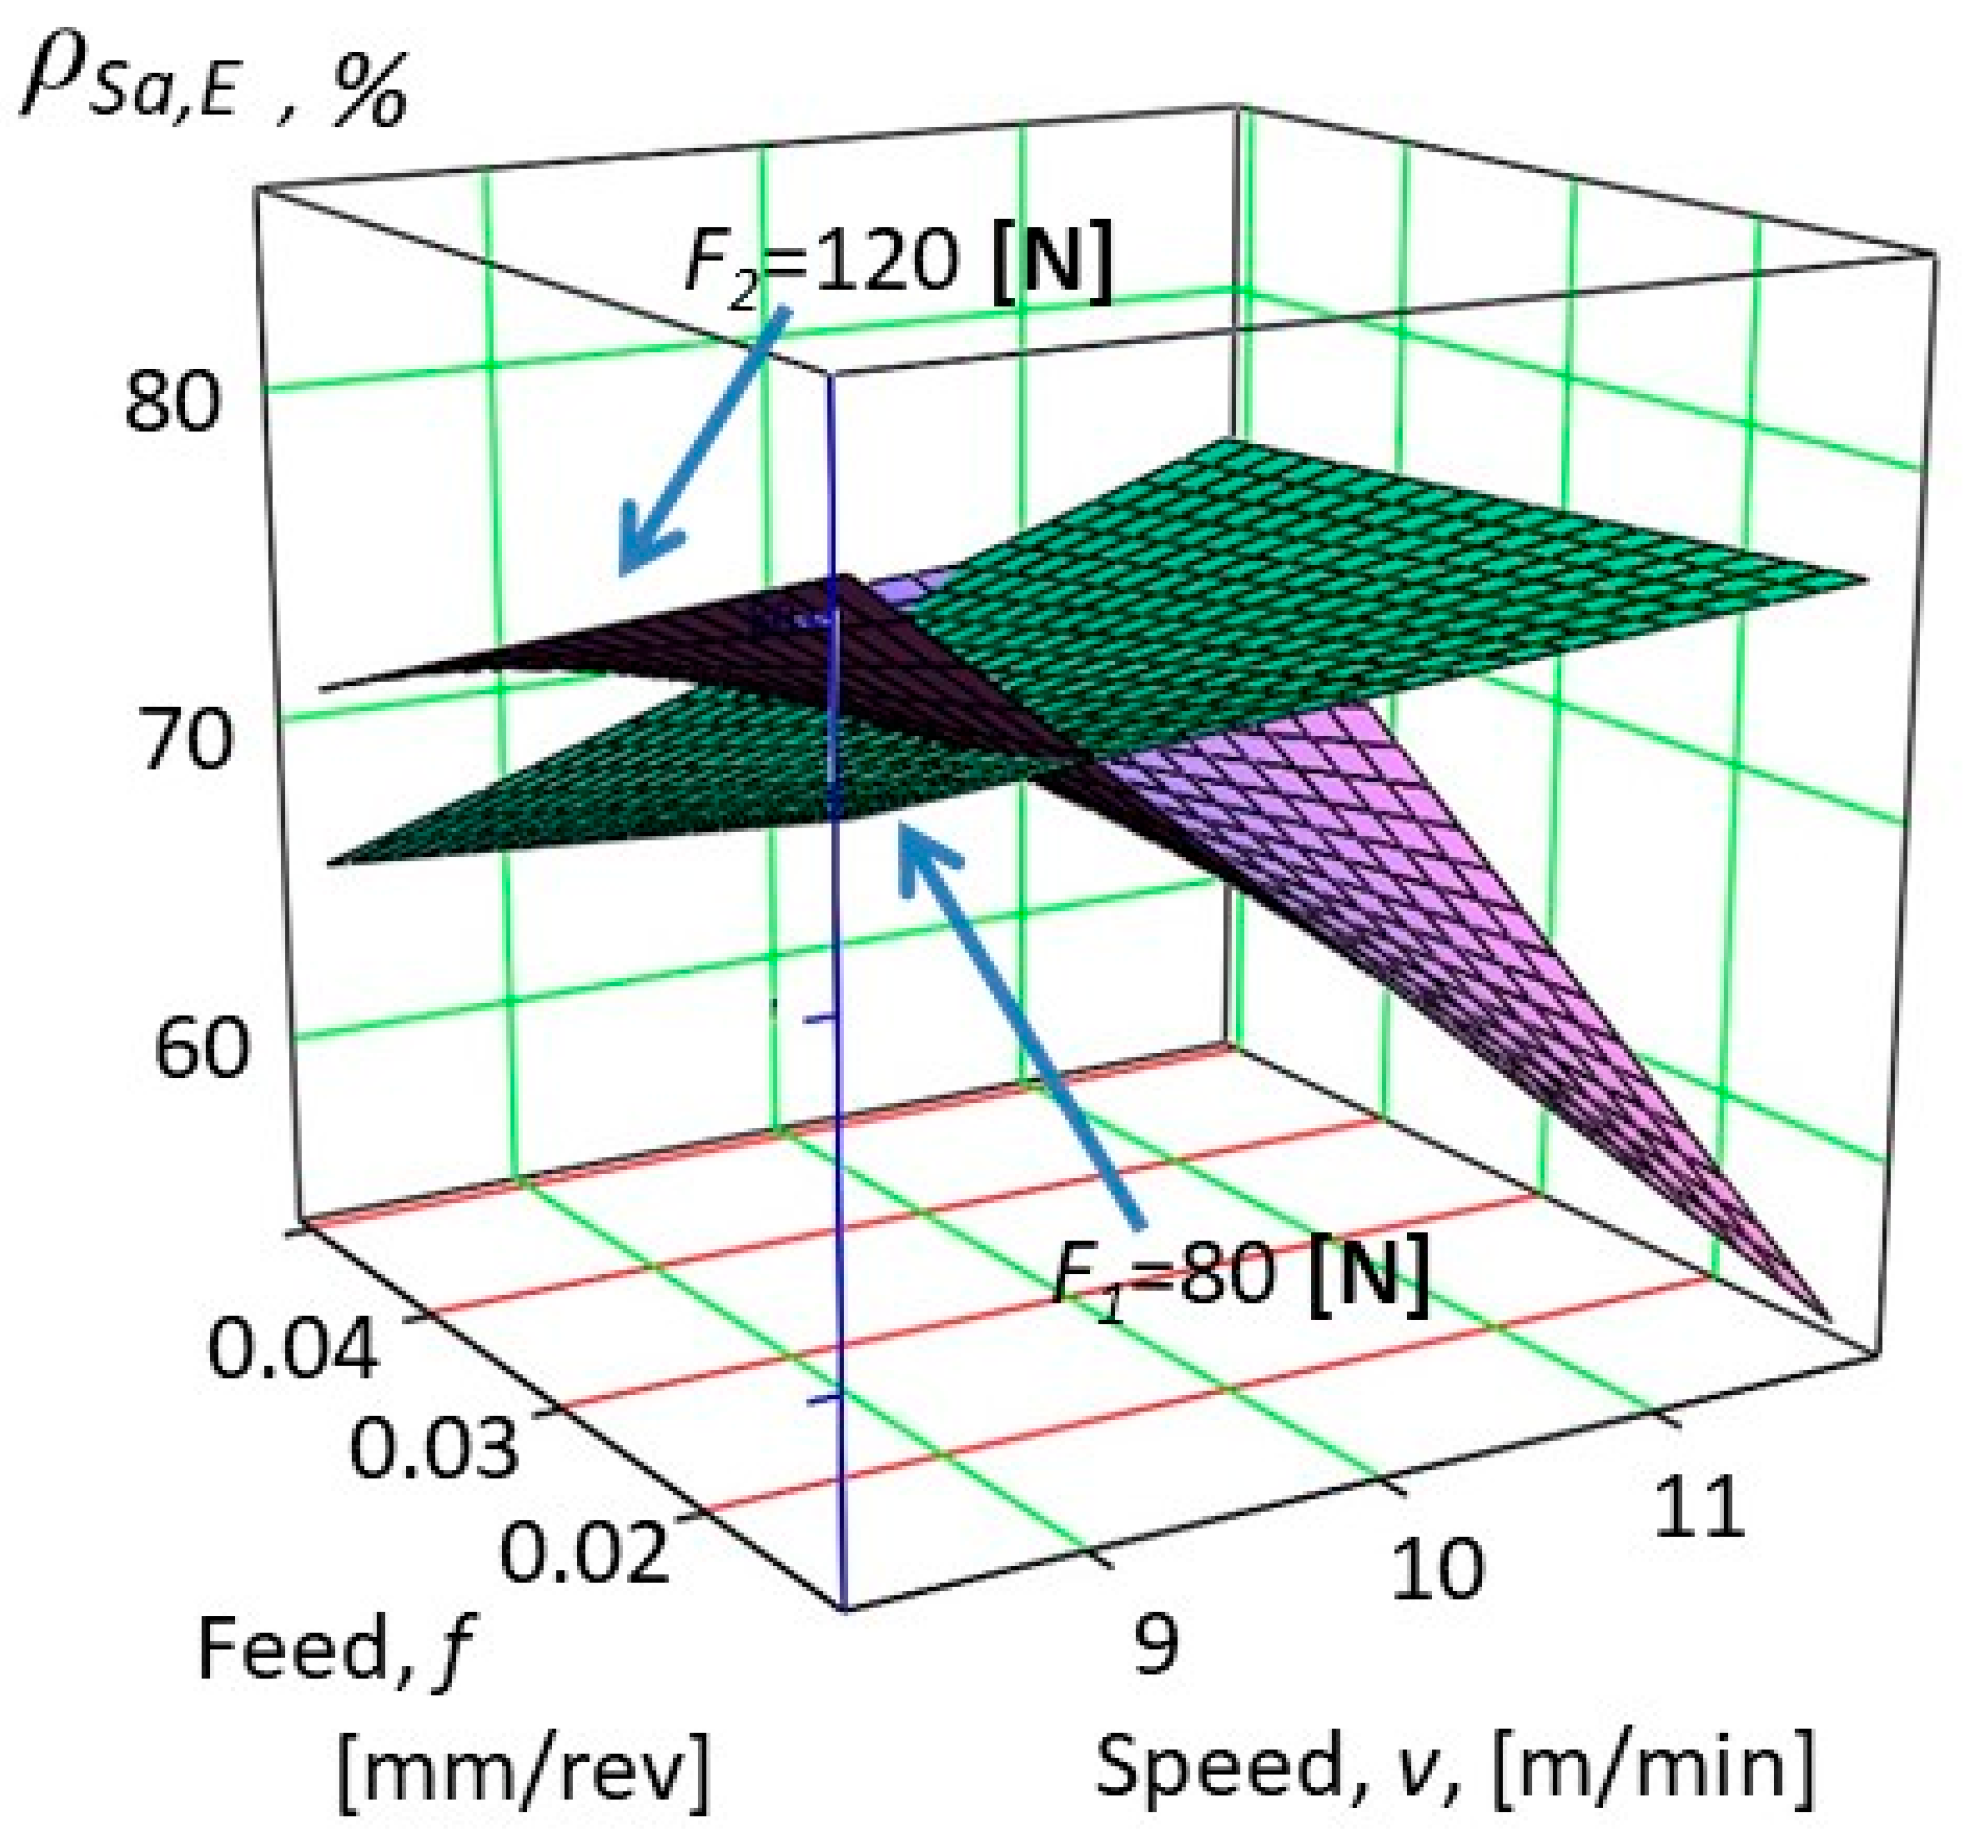
Improvement of the change of surface roughness on specimens marked E (see Equation (13)).
Figure 15.
Improvement of the change of surface roughness on specimens marked E (see Equation (13)).
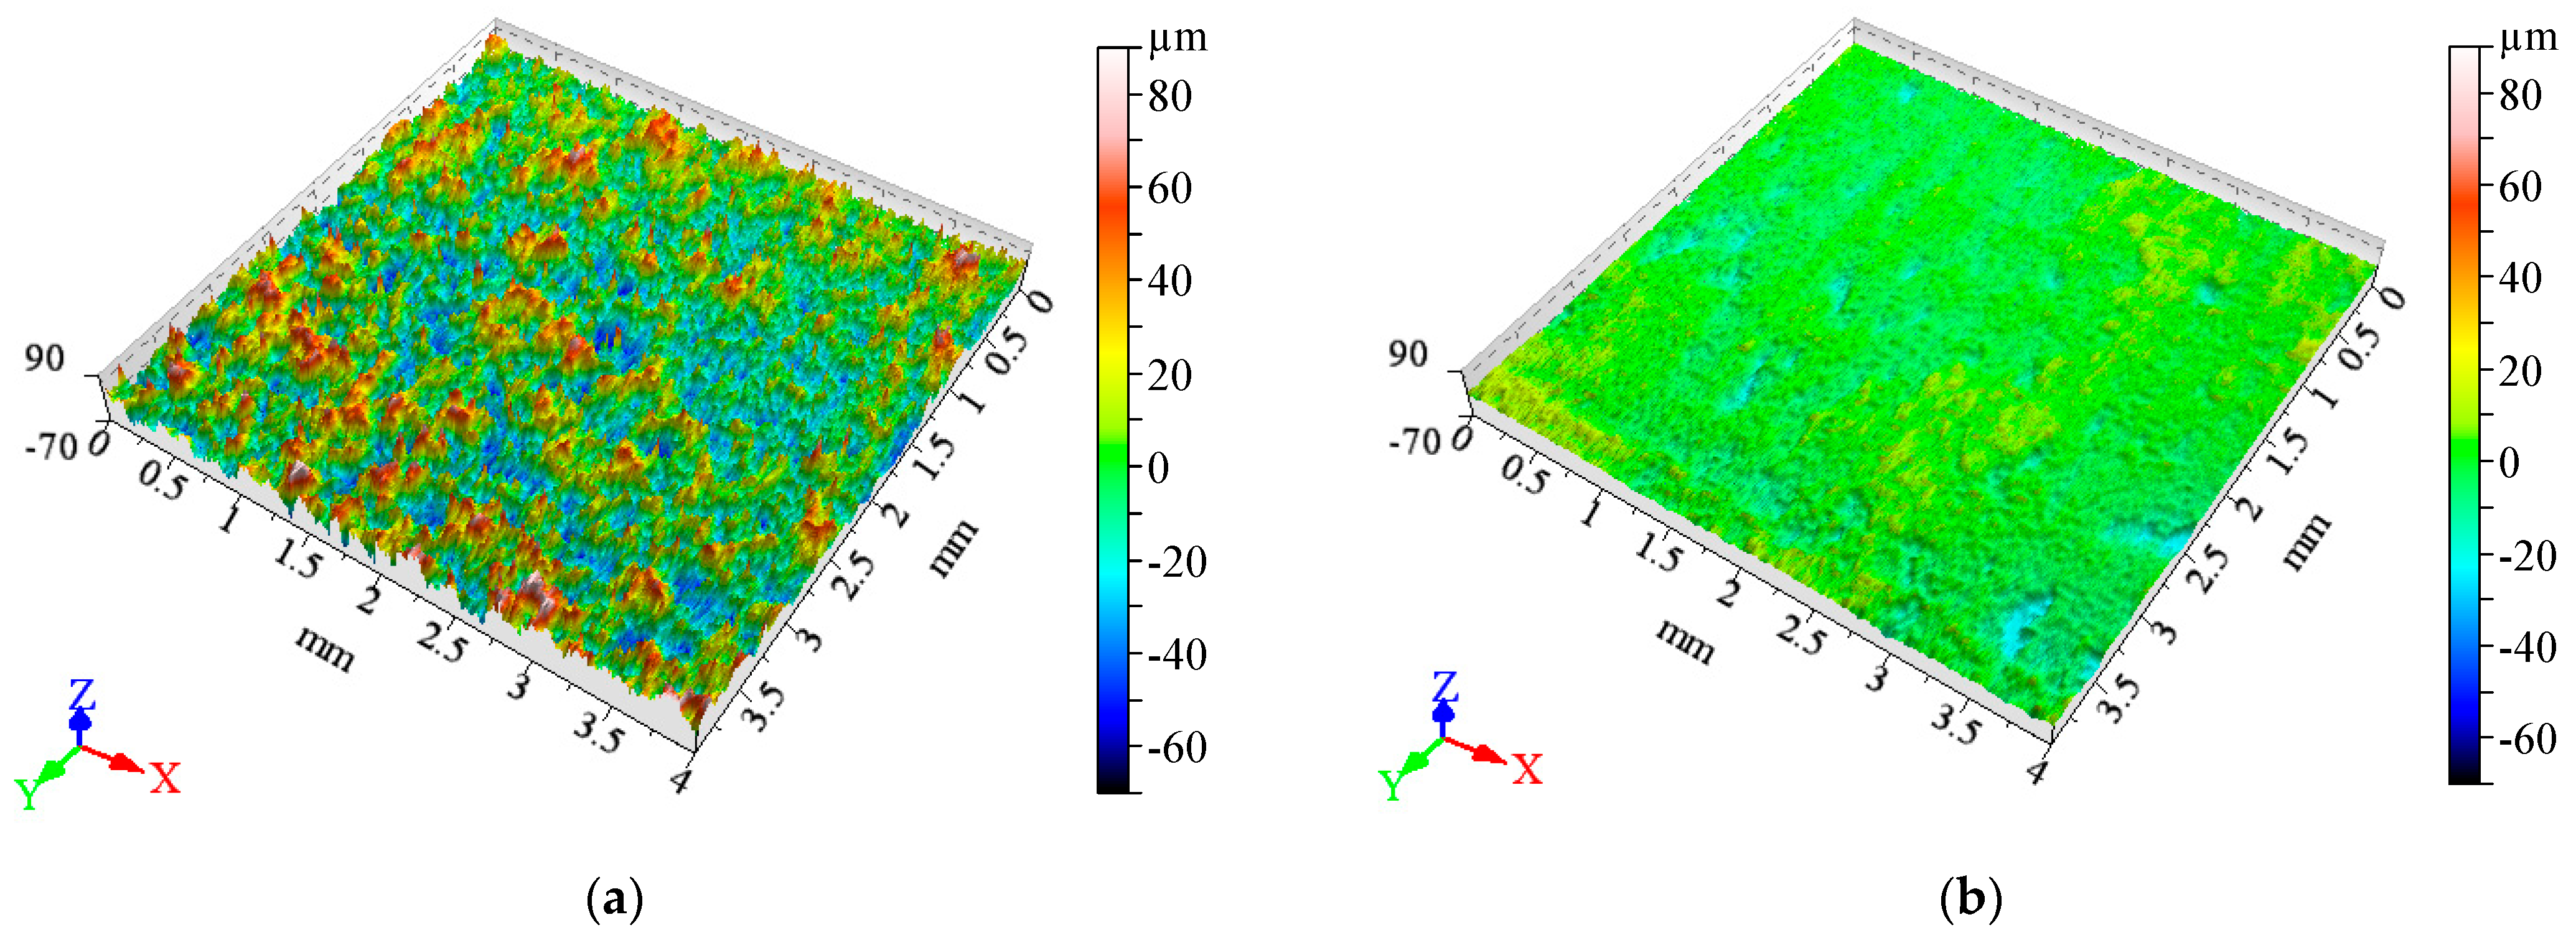
Figure 16.
3D roughness images: (a) before burnishing and (b) after burnishing on the specimen E5−1A.
Figure 16.
3D roughness images: (a) before burnishing and (b) after burnishing on the specimen E5−1A.
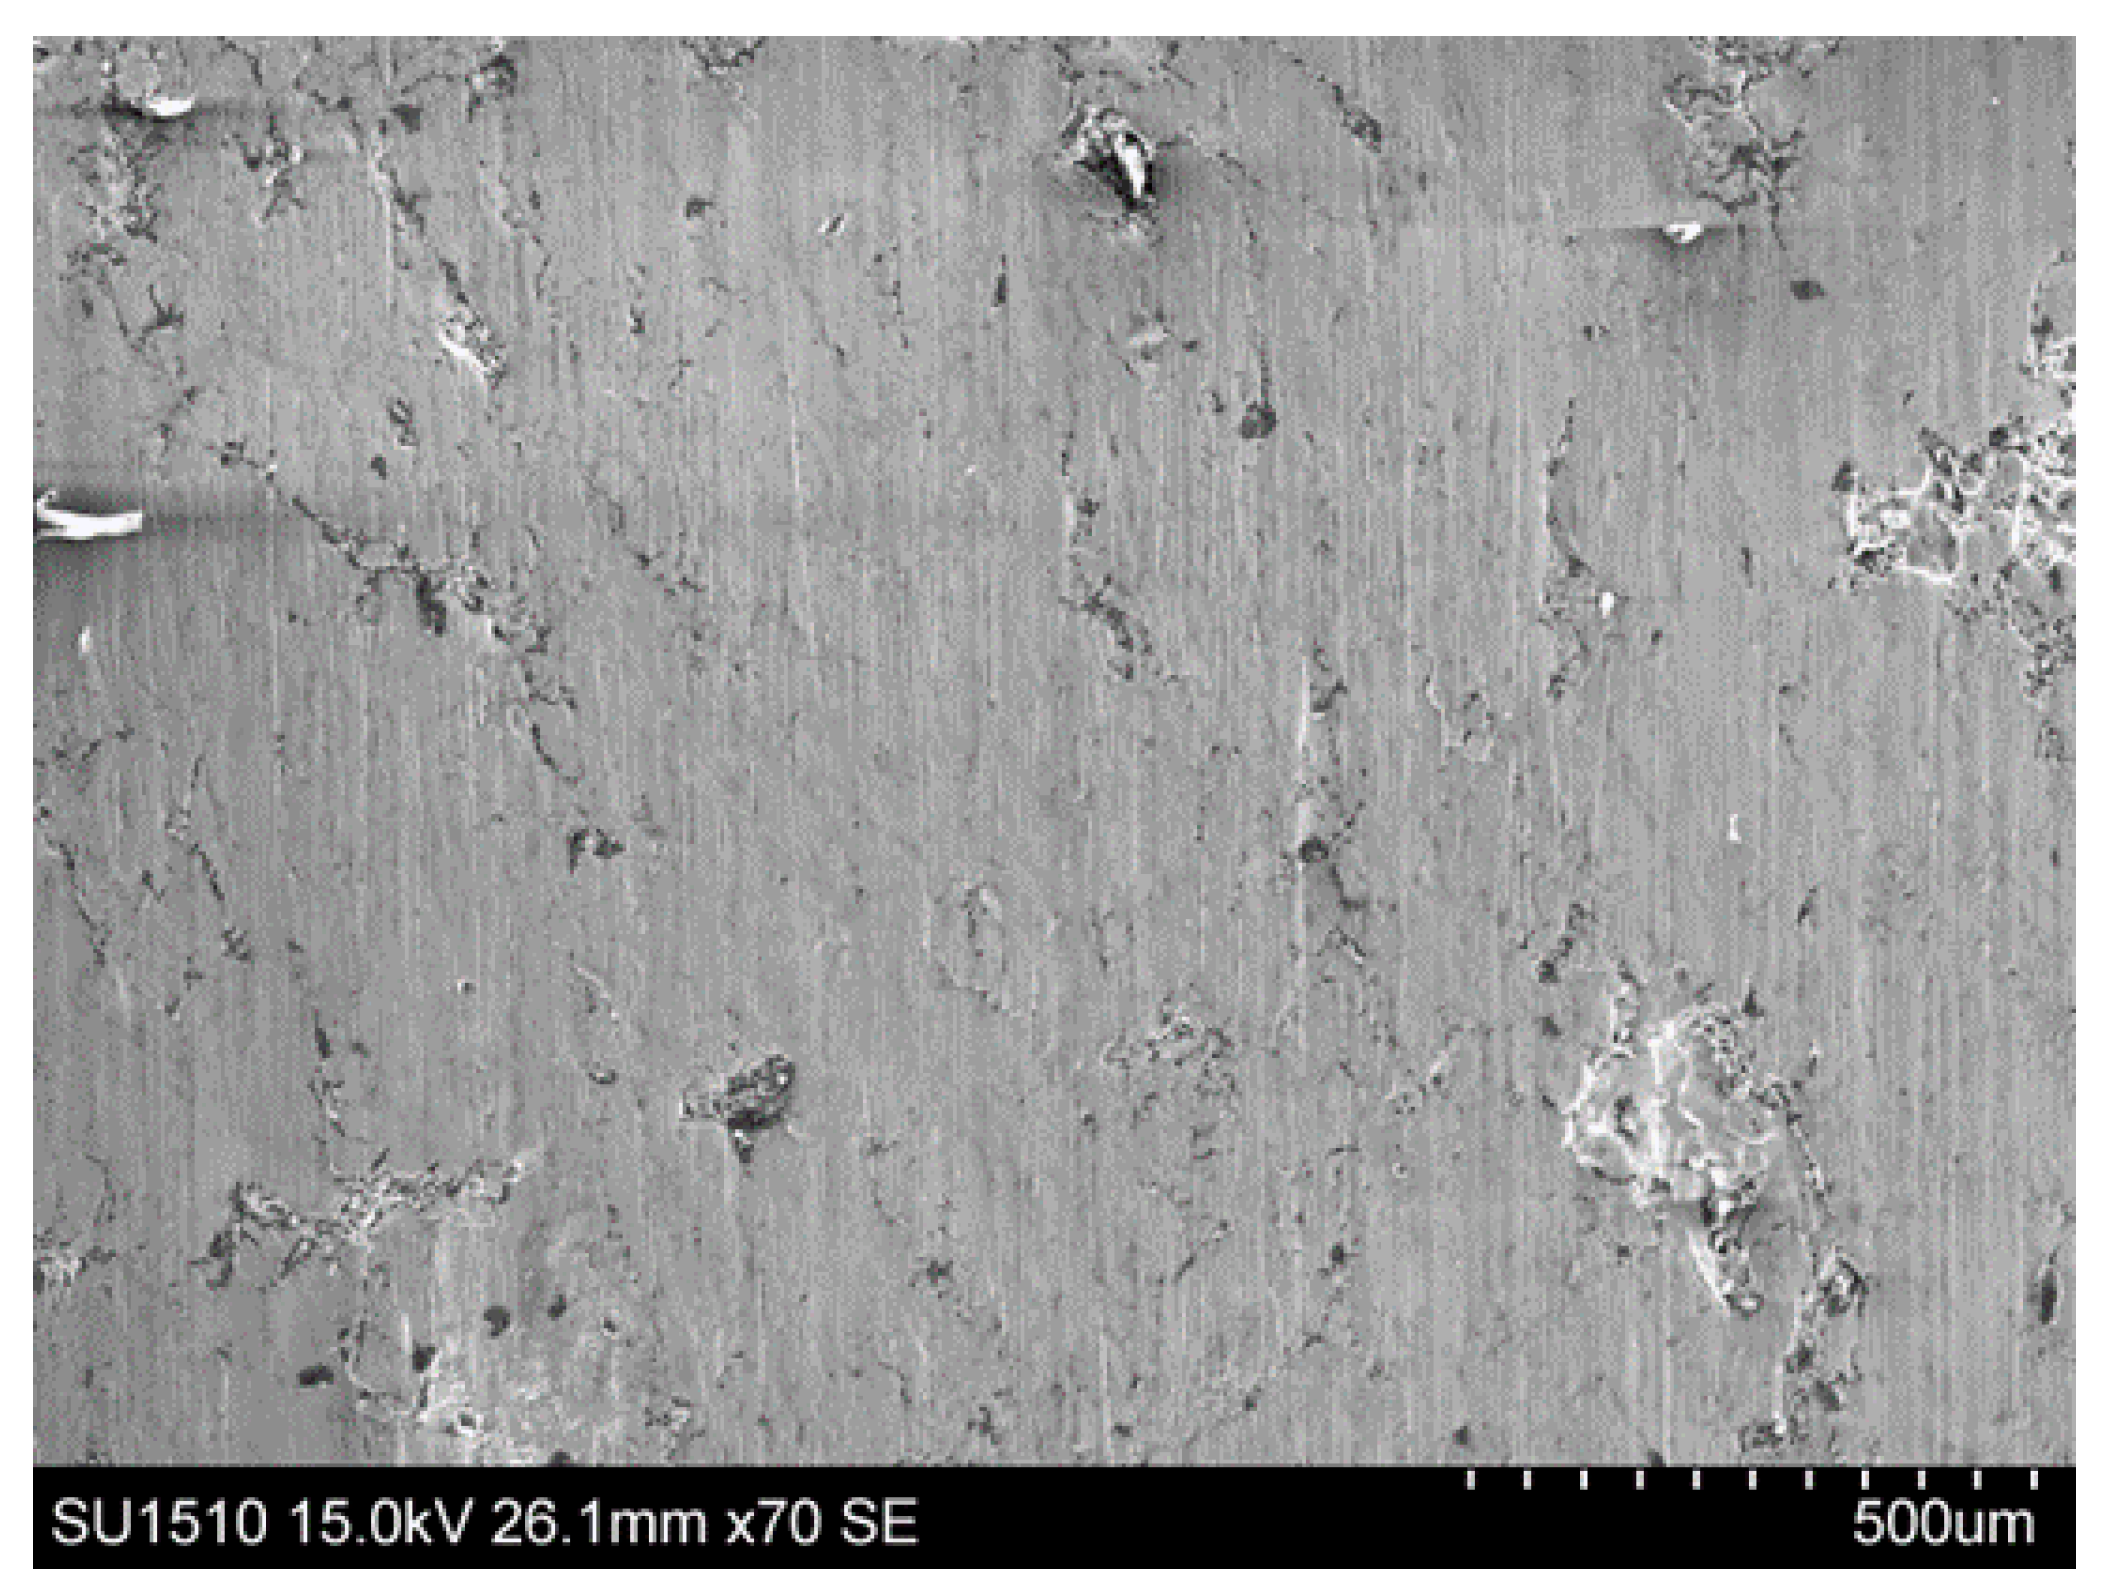
Figure 17.
An electron microscopic image of the top view of sample A1, after burnishing.
Figure 17.
An electron microscopic image of the top view of sample A1, after burnishing.
Figure 18.
An electron microscopic cross-cut image of sample A1, after diamond burnishing.
Figure 18.
An electron microscopic cross-cut image of sample A1, after diamond burnishing.
Table 1.
The manufacturing parameters of the specimens.
Table 1.
The manufacturing parameters of the specimens.
| Code of Parameter Setup | Infill Laser Power, P, [W] | Infill Laser Speed, u, [mm/s] | Energy Input [W/mm3] |
|---|
| A | 233.33 | 1200 | 46.300 |
| B | 280.00 | 1000 | 66.667 |
| C | 336.00 | 1440 | 55.556 |
| D | 233.33 | 1000 | 55.556 |
| E | 280.00 | 1200 | 55.556 |
Table 2.
The parameters of burnishing in SI system.
Table 2.
The parameters of burnishing in SI system.
| No. | Burnishing Parameters |
|---|
| Speed, v [m/min] | Feed, f [mm/rev] | Force, F [N] |
|---|
| 1 | 8.321 | 0.0125 | 80 |
| 2 | 11.775 | 0.0125 | 80 |
| 3 | 8.321 | 0.0500 | 80 |
| 4 | 11.775 | 0.0500 | 80 |
| 5 | 8.321 | 0.0125 | 120 |
| 6 | 11.775 | 0.0125 | 120 |
| 7 | 8.321 | 0.0500 | 120 |
| 8 | 11.775 | 0.0500 | 120 |
Table 3.
The measured values and the calculated improvement ratios for Ra [µm].
Table 3.
The measured values and the calculated improvement ratios for Ra [µm].
| | A | | B | | C | | D | | E |
|---|
| Rabb,A | Raab,A | | Rabb,B | Raab,B | | Rabb,C | Raab,C | | Rabb,D | Raab,D | | Rabb,E | Raab,E | |
|---|
| A1 | 15.69 | 3.41 | 78.29 | B1 | 9.77 | 3.20 | 67.28 | C1 | 11.53 | 3.28 | 71.52 | D1 | 14.04 | 3.00 | 78.64 | E1 | 15.88 | 3.55 | 77.62 |
| A2 | 10.96 | 2.77 | 74.68 | B2 | 10.82 | 3.01 | 72.20 | C2 | 10.32 | 3.70 | 64.19 | D2 | 10.84 | 3.58 | 66.97 | E2 | 15.09 | 3.01 | 80.06 |
| A3 | 16.14 | 3.86 | 76.06 | B3 | 11.66 | 2.91 | 75.03 | C3 | 11.09 | 3.04 | 72.58 | D3 | 13.15 | 3.50 | 73.38 | E3 | 13.90 | 4.05 | 70.85 |
| A4 | 12.36 | 3.10 | 74.81 | B4 | 14.19 | 4.54 | 68.02 | C4 | 10.36 | 3.19 | 69.24 | D4 | 14.18 | 3.36 | 76.29 | E4 | 16.26 | 4.17 | 74.33 |
| A5 | 12.11 | 2.89 | 76.15 | B5 | 11.56 | 2.73 | 76.39 | C5 | 11.36 | 3.56 | 68.65 | D5 | 16.67 | 2.99 | 82.06 | E5 | 18.90 | 3.15 | 83.33 |
| A6 | 12.39 | 2.78 | 77.54 | B6 | 10.75 | 2.90 | 72.97 | C6 | 11.11 | 3.14 | 71.70 | D6 | 10.33 | 3.46 | 66.49 | E6 | 12.27 | 3.58 | 70.81 |
| A7 | 11.64 | 3.20 | 72.49 | B7 | 17.81 | 2.93 | 83.58 | C7 | 12.03 | 3.13 | 73.96 | D7 | 12.74 | 2.90 | 77.20 | E7 | 16.01 | 2.93 | 81.70 |
| A8 | 10.18 | 3.18 | 68.78 | B8 | 11.96 | 2.92 | 75.58 | C8 | 11.32 | 2.60 | 77.03 | D8 | 16.31 | 3.00 | 81.61 | E8 | 14.11 | 3.47 | 75.40 |
Table 4.
The constants for regression improvement equations for Rz and Rq.
Table 4.
The constants for regression improvement equations for Rz and Rq.
| | Constants | Constants |
|---|
| | | | | | | | | | | |
|---|
| 134.21 | | 200.324 | 133.716 | 27.24 | 127.1 | 26.918 | 156.018 | 96.87 | 8.243 |
| 6.781 | 7.482 | | 6.507 | 11.996 | 5.477 | 8.617 | 9.127 | 2.35 | 9.856 |
| 1123.0 | 1686.0 | 1651.0 | 2214.0 | 194.5 | 1066.0 | 1961.0 | 933.27 | 913.56 | 290.76 |
| 0.686 | 0.835 | 1.371 | 0.071 | 1.237 | 0.501 | 0.883 | 0.814 | 0.332 | 1.046 |
| 135.155 | 182.61 | 142.073 | 189.353 | 55.565 | 129.172 | 210.07 | 86.146 | 66.103 | 45.003 |
| 0.074 | | 0.135 | 0.01 | 0.138 | 0.055 | 0.077 | 0.084 | 0.035 | 0.116 |
| 12.674 | 10.644 | 17.643 | 9.195 | 1.191 | 10.645 | 12.573 | 9.108 | 3.862 | 0.518 |
| | 1.251 | 1.418 | 0.057 | 0.706 | 1.379 | 1.484 | 0.724 | 0.721 | 0.694 |
Table 5.
The sequence formation based on improvement ratios for Ra, Rz, and Rq.
Table 5.
The sequence formation based on improvement ratios for Ra, Rz, and Rq.
| | | | | | | | | | | | | | | |
|---|
| 1 | B7 | 83.58 | 9 | E1 | 77.62 | 17 | B8 | 75.58 | 25 | B6 | 72.97 | 33 | C4 | 69.24 |
| 2 | E5 | 83.33 | 10 | A6 | 77.54 | 18 | E8 | 75.40 | 26 | C3 | 72.58 | 34 | A8 | 68.78 |
| 3 | D5 | 82.06 | 11 | D7 | 77.20 | 19 | B3 | 75.03 | 27 | A7 | 72.49 | 35 | C5 | 68.65 |
| 4 | E7 | 81.70 | 12 | C8 | 77.03 | 20 | A4 | 74.81 | 28 | B2 | 72.20 | 36 | B4 | 68.02 |
| 5 | D8 | 81.61 | 13 | B5 | 76.39 | 21 | A2 | 74.68 | 29 | C6 | 71.70 | 37 | B1 | 67.28 |
| 6 | E2 | 80.06 | 14 | D4 | 76.29 | 22 | E4 | 74.33 | 30 | C1 | 71.52 | 38 | D2 | 66.97 |
| 7 | D1 | 78.64 | 15 | A5 | 76.15 | 23 | C7 | 73.96 | 31 | E3 | 70.85 | 39 | D6 | 66.49 |
| 8 | A1 | 78.29 | 16 | A3 | 76.06 | 24 | D3 | 73.38 | 32 | E6 | 70.81 | 40 | C2 | 64.19 |
| | | | | | | | | | | | | | | |
| 1 | E5 | 81.74 | 9 | B5 | 76.05 | 17 | D4 | 71.68 | 25 | A5 | 69.35 | 33 | D3 | 66.53 |
| 2 | B7 | 81.25 | 10 | D7 | 75.97 | 18 | B3 | 71.65 | 26 | B2 | 69.02 | 34 | C4 | 66.27 |
| 3 | D5 | 79.88 | 11 | E1 | 74.95 | 19 | C7 | 71.63 | 27 | E4 | 68.74 | 35 | B1 | 66.11 |
| 4 | E2 | 79.20 | 12 | A6 | 74.53 | 20 | B6 | 71.44 | 28 | A7 | 68.64 | 36 | E3 | 65.37 |
| 5 | D8 | 78.58 | 13 | B8 | 72.43 | 21 | A4 | 70.82 | 29 | A8 | 67.33 | 37 | B4 | 63.87 |
| 6 | E7 | 78.19 | 14 | A1 | 72.17 | 22 | C1 | 69.98 | 30 | E8 | 67.33 | 38 | D2 | 63.65 |
| 7 | D1 | 77.12 | 15 | C6 | 71.75 | 23 | C3 | 69.92 | 31 | E6 | 67.09 | 39 | C5 | 62.93 |
| 8 | C8 | 76.81 | 16 | A3 | 71.72 | 24 | A2 | 69.76 | 32 | D6 | 66.83 | 40 | C2 | 62.63 |
| | | | | | | | | | | | | | | |
| 1 | B7 | 83.19 | 9 | D7 | 77.13 | 17 | B8 | 74.54 | 25 | A7 | 71.52 | 33 | C4 | 68.85 |
| 2 | E5 | 82.63 | 10 | A6 | 77.11 | 18 | A4 | 74.47 | 26 | E4 | 71.42 | 34 | C5 | 68.07 |
| 3 | E7 | 81.34 | 11 | C8 | 76.98 | 19 | A2 | 74.17 | 27 | C6 | 71.29 | 35 | E3 | 67.73 |
| 4 | D5 | 81.17 | 12 | E1 | 76.91 | 20 | B3 | 73.94 | 28 | B2 | 71.19 | 36 | B4 | 66.67 |
| 5 | D8 | 80.96 | 13 | B5 | 76.22 | 21 | C7 | 73.83 | 29 | C1 | 71.17 | 37 | B1 | 66.63 |
| 6 | E2 | 79.23 | 14 | A3 | 75.01 | 22 | E8 | 73.74 | 30 | D3 | 71.13 | 38 | D2 | 65.99 |
| 7 | D1 | 78.37 | 15 | A5 | 74.91 | 23 | B6 | 72.71 | 31 | E6 | 70.07 | 39 | D6 | 65.23 |
| 8 | A1 | 77.16 | 16 | D4 | 74.79 | 24 | C3 | 72.31 | 32 | A8 | 69.01 | 40 | C2 | 64.05 |
Table 6.
Improvement ratio indices on cylinders manufactured with different technologies for Ra.
Table 6.
Improvement ratio indices on cylinders manufactured with different technologies for Ra.
| | Point | | Point | | Point | | Point | | Point |
|---|
| A1 | 78.29 | 8 | B1 | 67.28 | 37 | C1 | 71.52 | 30 | D1 | 78.64 | 7 | E1 | 77.62 | 9 |
| A2 | 74.68 | 21 | B2 | 72.20 | 28 | C2 | 64.19 | 40 | D2 | 66.97 | 38 | E2 | 80.06 | 6 |
| A3 | 76.06 | 16 | B3 | 75.03 | 19 | C3 | 72.58 | 26 | D3 | 73.38 | 24 | E3 | 70.85 | 31 |
| A4 | 74.81 | 20 | B4 | 68.02 | 36 | C4 | 69.24 | 33 | D4 | 76.29 | 14 | E4 | 74.33 | 22 |
| A5 | 76.15 | 15 | B5 | 76.39 | 13 | C5 | 68.65 | 35 | D5 | 82.06 | 3 | E5 | 83.33 | 2 |
| A6 | 77.54 | 10 | B6 | 72.97 | 25 | C6 | 71.70 | 29 | D6 | 66.49 | 39 | E6 | 70.81 | 32 |
| A7 | 72.49 | 27 | B7 | 83.58 | 1 | C7 | 73.96 | 23 | D7 | 77.20 | 11 | E7 | 81.70 | 4 |
| A8 | 68.78 | 34 | B8 | 75.58 | 17 | C8 | 77.03 | 12 | D8 | 81.61 | 5 | E8 | 75.40 | 18 |
| Average 18.9 | Average 22.0 | Average 28.5 | Average 17.6 | Average 15.5 |
Table 7.
Improvement ratio indices on cylinders manufactured with different technologies for Rz.
Table 7.
Improvement ratio indices on cylinders manufactured with different technologies for Rz.
| | Point | | Point | | Point | | Point | | Point |
|---|
| A1 | 72.17 | 14 | B1 | 66.11 | 35 | C1 | 69.98 | 22 | D1 | 77.12 | 7 | E1 | 74.95 | 11 |
| A2 | 69.76 | 24 | B2 | 69.02 | 26 | C2 | 62.63 | 40 | D2 | 63.65 | 38 | E2 | 79.20 | 4 |
| A3 | 71.72 | 16 | B3 | 71.65 | 18 | C3 | 69.92 | 23 | D3 | 66.53 | 33 | E3 | 65.37 | 36 |
| A4 | 70.82 | 21 | B4 | 63.87 | 37 | C4 | 66.27 | 34 | D4 | 71.68 | 17 | E4 | 68.74 | 27 |
| A5 | 69.35 | 25 | B5 | 76.05 | 9 | C5 | 62.93 | 39 | D5 | 79.88 | 3 | E5 | 81.74 | 1 |
| A6 | 74.53 | 12 | B6 | 71.44 | 20 | C6 | 71.75 | 15 | D6 | 66.83 | 32 | E6 | 67.09 | 31 |
| A7 | 68.64 | 28 | B7 | 81.25 | 2 | C7 | 71.63 | 19 | D7 | 75.97 | 10 | E7 | 78.19 | 6 |
| A8 | 67.33 | 29 | B8 | 72.43 | 13 | C8 | 76.81 | 8 | D8 | 78.58 | 5 | E8 | 67.33 | 30 |
| Average 21.1 | Average 20.0 | Average 25.4 | Average 18.1 | Average 18.2 |
Table 8.
Improvement ratio indices on cylinders manufactured with different technologies for Rq.
Table 8.
Improvement ratio indices on cylinders manufactured with different technologies for Rq.
| | Point | | Point | | Point | | Point | | Point |
|---|
| A1 | 78.29 | 8 | B1 | 67.28 | 37 | C1 | 71.52 | 30 | D1 | 78.64 | 7 | E1 | 77.62 | 9 |
| A2 | 74.68 | 21 | B2 | 72.20 | 28 | C2 | 64.19 | 40 | D2 | 66.97 | 38 | E2 | 80.06 | 6 |
| A3 | 76.06 | 16 | B3 | 75.03 | 19 | C3 | 72.58 | 26 | D3 | 73.38 | 24 | E3 | 70.85 | 31 |
| A4 | 74.81 | 20 | B4 | 68.02 | 36 | C4 | 69.24 | 33 | D4 | 76.29 | 14 | E4 | 74.33 | 22 |
| A5 | 76.15 | 15 | B5 | 76.39 | 13 | C5 | 68.65 | 35 | D5 | 82.06 | 3 | E5 | 83.33 | 2 |
| A6 | 77.54 | 10 | B6 | 72.97 | 25 | C6 | 71.70 | 29 | D6 | 66.49 | 39 | E6 | 70.81 | 32 |
| A7 | 72.49 | 27 | B7 | 83.58 | 1 | C7 | 73.96 | 23 | D7 | 77.20 | 11 | E7 | 81.70 | 4 |
| A8 | 68.78 | 34 | B8 | 75.58 | 17 | C8 | 77.03 | 12 | D8 | 81.61 | 5 | E8 | 75.40 | 18 |
| Average 17.6 | Average 21.9 | Average 25.4 | Average 18.5 | Average 17.1 |
Table 9.
Improvement ratio index order for Ra, Rz, and Rq.
Table 9.
Improvement ratio index order for Ra, Rz, and Rq.
| Code | Applied Laser Power [W] | Applied Laser Speed [mm/s] |
|---|
| E (15.5 + 18.2 + 17.1)/3 = 16.9 | 233.33 | 1000 |
| D (17.6 + 18.1 + 18.5)/3 = 18.1 | 280.00 | 1200 |
| A (18.9 + 21.1 + 17.6)/3 = 19.2 | 233.33 | 1200 |
| B (22.0 + 20.0 + 21.9)/3 = 21.3 | 280.00 | 1000 |
| C (28.5 + 25.4 + 25.4)/3 = 26.4 | 336.00 | 1440 |
Table 10.
The measured values and the calculated ratios for Sa.
Table 10.
The measured values and the calculated ratios for Sa.
| | A | | B | | C | | D | | E |
|---|
| Sabb,A | Saab,A | | Sabb,B | Saab,B | | Sabb,C | Saab,C | | Sabb,J | Saab,J | | Sabb,K | Saab,K | |
|---|
| A1 | 18.29 | 5.70 | 68.81 | B1 | 11.94 | 5.44 | 54.46 | C1 | 13.77 | 5.69 | 58.65 | D1 | 16.34 | 5.05 | 69.08 | E1 | 19.04 | 4.83 | 74.65 |
| A2 | 13.60 | 5.80 | 57.36 | B2 | 13.39 | 4.00 | 70.13 | C2 | 14.29 | 5.01 | 64.94 | D2 | 13.89 | 5.14 | 63.02 | E2 | 18.36 | 4.25 | 76.86 |
| A3 | 19.56 | 5.80 | 70.35 | B3 | 14.21 | 4.05 | 71.47 | C3 | 12.77 | 4.20 | 67.11 | D3 | 16.00 | 4.59 | 71.33 | E3 | 14.91 | 5.13 | 65.58 |
| A4 | 14.75 | 5.88 | 60.12 | B4 | 17,02 | 6.46 | 62.03 | C4 | 13.62 | 4.21 | 69.12 | D4 | 15.65 | 5.45 | 65.16 | E4 | 21.74 | 5.38 | 75.24 |
| A5 | 13.33 | 3.98 | 70.17 | B5 | 13.91 | 3.86 | 72.29 | C5 | 12.70 | 5.54 | 56.43 | D5 | 20.51 | 4.70 | 77.09 | E5 | 20.74 | 3.99 | 80.77 |
| A6 | 13.16 | 4.12 | 68.67 | B6 | 14.00 | 5.33 | 61.91 | C6 | 11.73 | 5.31 | 54.75 | D6 | 12.69 | 4.98 | 60.78 | E6 | 15.82 | 7.11 | 55.03 |
| A7 | 12,97 | 4.55 | 64.93 | B7 | 20.09 | 5.39 | 73.19 | C7 | 12.22 | 4.25 | 65.21 | D7 | 15.80 | 6.46 | 59.14 | E7 | 18.22 | 5.28 | 71.00 |
| A8 | 13.05 | 6.59 | 49.53 | B8 | 14.19 | 4.40 | 68.98 | C8 | 14.23 | 3.93 | 72.36 | D8 | 20.36 | 5.32 | 73.88 | E8 | 16.04 | 4.37 | 72.76 |
Table 11.
The constants for regression improvement equations for Sz and Sq.
Table 11.
The constants for regression improvement equations for Sz and Sq.
| | | |
|---|
| | | | | | | | | | | |
|---|
| 64.448 | 200.381 | 93.575 | 12.992 | 78.83 | 143.615 | 235.25 | 17.406 | 36.448 | 94.384 |
| 2.669 | 243.0 | 13.189 | 7.61 | 16.29 | 10.293 | 28.293 | 8.916 | 9.349 | 19.016 |
| 326.37 | 6562.0 | 3539.0 | 2255.0 | 1288.0 | 1295.0 | 7125.0 | 2110.0 | 4508.0 | 1690.0 |
| 0.083 | 2.405 | 1.33 | 1207.0 | 1.738 | 0.644 | 2.792 | 0.667 | 1.507 | 2.118 |
| 119.784 | 641.5 | 298.85 | 226.95 | 182.0 | 208.292 | 694.16 | 221.12 | 427.32 | 233.55 |
| 0.021 | 0.222 | 0.118 | 0.115 | 0.186 | 0.091 | 0.264 | 0.083 | 0.14 | 0.235 |
| 6.236 | 56.67 | 31.165 | 33.358 | 20.537 | 16.132 | 62.182 | 19.713 | 56.908 | 29.579 |
| 1.552 | 5.591 | 2.989 | 3.322 | 2.506 | 2.516 | 6.144 | 2.337 | 5.444 | 3.56 |
Table 12.
The sequence formation based on improvement ratios for Sa.
Table 12.
The sequence formation based on improvement ratios for Sa.
| | | | | | | | | | | | | | | |
|---|
| 1 | E5 | 77.72 | 9 | D3 | 71.33 | 17 | C4 | 69.12 | 25 | C2 | 64.94 | 33 | A4 | 60.12 |
| 2 | D5 | 77.09 | 10 | E7 | 70.65 | 18 | D1 | 69.08 | 26 | A7 | 64.93 | 34 | D7 | 59.14 |
| 3 | E2 | 75.58 | 11 | E8 | 70.53 | 19 | B8 | 68.98 | 27 | D2 | 63.02 | 35 | C1 | 58.65 |
| 4 | D8 | 73.88 | 12 | E4 | 70.42 | 20 | A1 | 68.81 | 28 | E3 | 62.67 | 36 | A2 | 57.36 |
| 5 | B7 | 73.19 | 13 | A3 | 70.35 | 21 | A6 | 68.67 | 29 | E6 | 62.22 | 37 | C5 | 56.43 |
| 6 | C8 | 72.36 | 14 | A5 | 70.17 | 22 | C3 | 67.11 | 30 | B4 | 62.03 | 38 | C6 | 54.75 |
| 7 | B5 | 72.29 | 15 | B2 | 70.13 | 23 | C7 | 65.21 | 31 | B6 | 61.91 | 39 | B1 | 54.46 |
| 8 | B3 | 71.47 | 16 | E1 | 69.78 | 24 | D4 | 65.16 | 32 | D6 | 60.78 | 40 | A8 | 49.53 |
Table 13.
Improvement ratio indices on cylinders manufactured with different technologies for Sa.
Table 13.
Improvement ratio indices on cylinders manufactured with different technologies for Sa.
| | Point | | Point | | Point | | Point | | Point |
|---|
| A1 | 68.81 | 20 | B1 | 54.46 | 39 | C1 | 58.65 | 35 | D1 | 69.08 | 18 | E1 | 69.78 | 16 |
| A2 | 57.36 | 36 | B2 | 70.13 | 15 | C2 | 64.94 | 25 | D2 | 63.02 | 27 | E2 | 75.58 | 3 |
| A3 | 70.35 | 13 | B3 | 71.47 | 8 | C3 | 67.11 | 22 | D3 | 71.33 | 9 | E3 | 62.67 | 28 |
| A4 | 60.12 | 33 | B4 | 62.03 | 30 | C4 | 69.12 | 17 | D4 | 65.16 | 24 | E4 | 70.42 | 12 |
| A5 | 70.17 | 14 | B5 | 72.29 | 7 | C5 | 56.43 | 37 | D5 | 77.09 | 2 | E5 | 77.72 | 1 |
| A6 | 68.67 | 21 | B6 | 61.91 | 31 | C6 | 54.75 | 38 | D6 | 60.78 | 32 | E6 | 62.22 | 29 |
| A7 | 64.93 | 26 | B7 | 73.19 | 5 | C7 | 65.21 | 23 | D7 | 59.14 | 34 | E7 | 70.65 | 10 |
| A8 | 49.53 | 40 | B8 | 68.98 | 19 | C8 | 72.36 | 6 | D8 | 73.88 | 4 | E8 | 70.53 | 11 |
| Average 25.4 | Average 19.2 | Average 25.4 | Average 15.8 | Average 13.8 |
Table 14.
Improvement ratio indices on cylinders manufactured with different rapid prototyping technologies for Sa, Sz and Sq.
Table 14.
Improvement ratio indices on cylinders manufactured with different rapid prototyping technologies for Sa, Sz and Sq.
| | Applied Laser Power [W] | Applied Laser Speed [mm/s] |
|---|
| E (13.8 + 12.2 + 12)/3 = 12.7 | 280.00 | 1200 |
| D (15.8 + 19 + 20)/3 = 18.3 | 233.33 | 1000 |
| B (19.2 + 24.5 + 20)/3 = 21.2 | 280.00 | 1000 |
| A (25.4 + 22.6 + 24.6)/3 = 24.2 | 233.33 | 1200 |
| C (25.4 + 24.1 + 25.9)/3 = 25.1 | 336.00 | 1440 |
Table 15.
Improvement ratio indices for cylinders manufactured with different technologies (parameter setup, referring to
Table 1) for R
a, R
z, and R
q; furthermore, S
a, S
z, and S
q.
Table 15.
Improvement ratio indices for cylinders manufactured with different technologies (parameter setup, referring to
Table 1) for R
a, R
z, and R
q; furthermore, S
a, S
z, and S
q.
| Code of Parameter Setup | Order | Average | Ranking |
|---|
| Based on Ra, Rz and Rq Improvement | Based on Sa, Sz and Sq Improvement |
|---|
| A | 3 | 4 | 3.5 | 3 |
| B | 4 | 3 | 3.5 | 3 |
| C | 5 | 4 | 4.5 | 5 |
| D | 2 | 2 | 2 | 2 |
| E | 1 | 1 | 1 | 1 |
