Article

Fracture Mechanism Analysis and Design Optimization of a Wheelset Lifting Mechanism Based on Experiments and Simulations

1
School of Mechanical and Electrical Engineering, University of Electronic Science and Technology of China, Chengdu 611731, China
2
Institute of Electronic and Information Engineering in Guangdong, University of Electronic Science and Technology of China, Dongguan 523808, China
3
School of Locomotive and Rolling Stock Engineering, Dalian Jiaotong University, Dalian 116028, China
4
Aircraft Repair & Overhaul Plant, Civil Aviation Flight University of China, Guanghan 618307, China
5
Naval Architecture and Ocean Engineering College, Dalian Maritime University, Dalian 116026, China
*
Author to whom correspondence should be addressed.
Machines 2022, 10(5), 397; https://doi.org/10.3390/machines10050397
Submission received: 22 April 2022 / Revised: 12 May 2022 / Accepted: 16 May 2022 / Published: 19 May 2022
(This article belongs to the Special Issue Reliability Evaluation for Industrial Systems: State of the Art)

Abstract

:
In this study, material and dynamic stress experiments are combined with finite element (FE) simulations to reveal the fracture mechanism of the wheelset lifting apparatus, and a structural design optimization scheme based on the double-layer Kriging surrogate model is proposed. The fracture mechanism of the wheelset lifting apparatus is first clarified through the material analysis of macro/micro and dynamic stress tests. Static strength and modal analyses are then performed to perfect the mechanism analysis in terms of structural performance. An efficient, robust, fatigue design optimization method based on the double-layer Kriging surrogate model and improved non-dominated sorting genetic algorithm II (NSGA-II) is finally proposed to improve the original design scheme. For the wheelset lifting mechanism’s fracture, the crack source is found on the transition fillet surface of the lifting lug and lifting ring, where the fracture has the characteristics of two-way, multisource, high-cycle, low-stress fatigue. It is further revealed that the vibration fatigue occurring at the point of maximum stress is the main cause of the fracture. The effectiveness of the proposed design optimization method is validated via comparative analysis.

1. Introduction

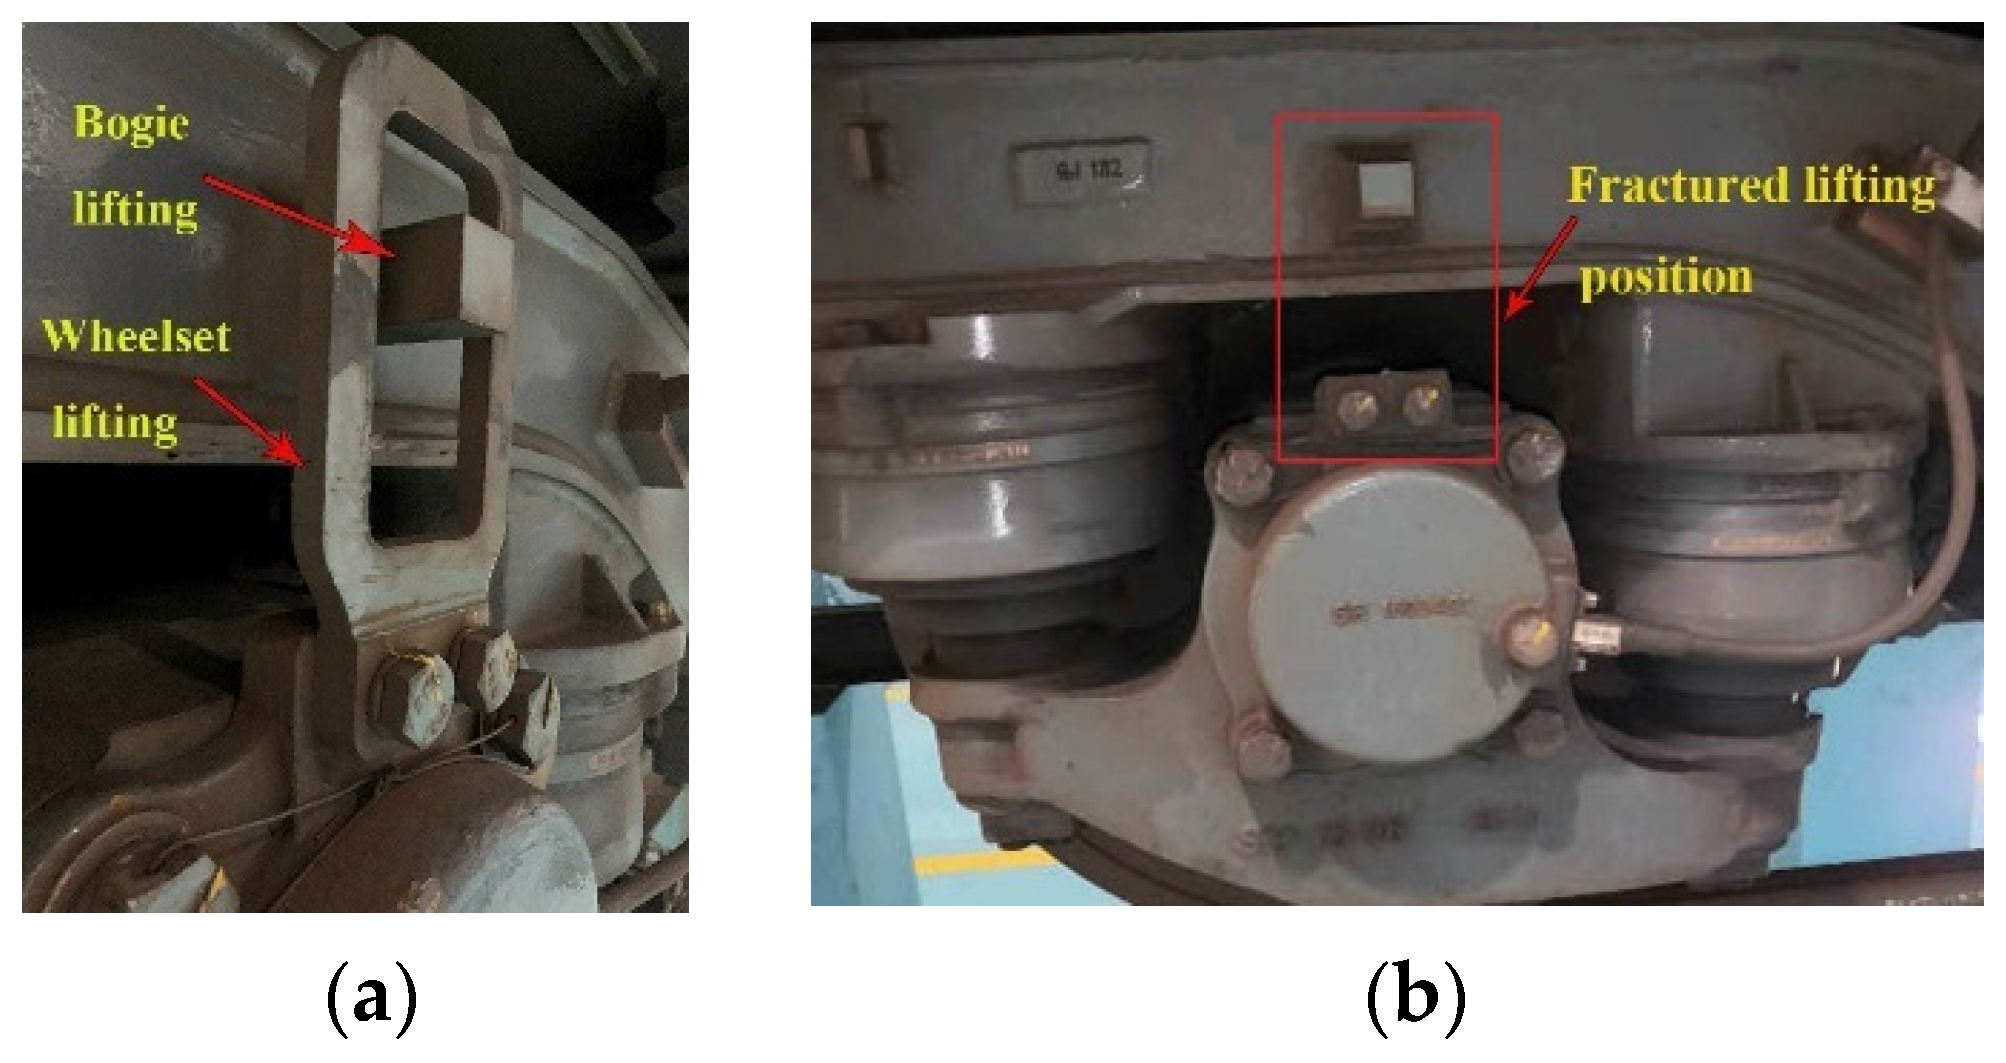
As the main component of a railway vehicle, a wheelset lifting mechanism is installed on the axle-box end cover and used to lift the wheelset by the frame during lifting to facilitate the overall movement of the bogie. However, high-dimensional time-dependent harmonic load, random load, and the complexity and uncertainty of the environment during the service and operation of vehicles can lead to cracks or fractures of the wheelset lifting mechanism, seriously affecting the operational quality and reliability [1,2,3]. Therefore, it is necessary to comprehensively analyze the crack-generation mechanism to reduce the vehicle fault caused by cracks and fractures of the wheelset lifting mechanism, which can provide a reference for structural optimization and performance improvement.
For the structure of railway vehicles, stress concentration, fatigue, corrosion, and metallurgical problems are the main causes of crack or fracture initiation. It has been reported that about 90% of all mechanical failures are caused by fatigue [4,5]. To date, considerable efforts have been made to investigate the crack initiation or fracture behaviors of fatigue through analytical, numerical, and experimental methods. Among those, FE and numerical simulation methods have attracted the most attention. Lu et al. [6] studied the effects of vibration modes on fatigue damage in a high-speed train bogie frame under random loading conditions by combining modal analysis and dynamic simulation. Liu et al. [7] proposed a new and improved version of the Corten-Dolan model, where the fatigue behavior of engineering materials and structures under variable amplitude load was well described by numerical simulation. Yang et al. [8] investigated the life prediction and durability assessment of brake unit brackets by combining FE and numerical simulations. Zuo et al. [9] reported a Bayesian analytical model to quantify the main uncertainty factors that affect the bogie failure. Liao et al. [10] conducted a rigid–flexible coupling dynamic simulation to predict the fatigue life of motor suspension seat structures. Some researchers have attempted to analyze the causes of fatigue cracks and fractures from the perspective of material properties and experiments. For instance, Lucanin et al. [11] performed stress and acceleration tests on the bogie frame of a diesel multiple unit (DMU) to clarify the reasons for fatigue cracking. Wang et al. [12] presented a new fatigue reliability evaluation method by combining the in-service measurement of dynamic stress with the probability method. Han et al. [13] designed a fatigue test on a full-scale test rig to evaluate the fatigue strength of the bogie frame for an urban maglev train. Wang et al. [14] determined the fatigue reliability of a bogie frame by using the load-spectrum-improving technology of the on-track test. In addition, some material characterization methods have been used to analyze the micro-phenomena of fatigue. Hu et al. [15] analyzed the metallographic and scanning electron microscope (SEM) results of bolts after tensile tests and combined them with dynamic stress tests to find out the cause of failure. Shen [16] and Xu [17] determined the main causes of bogie frame cracks via fracture morphology, chemical composition, tensile properties, metallography, and SEM. The aforementioned studies have mainly employed single methods to analyze the cause of cracks or fractures; thus, their results lack comparison and verification. Therefore, Seo et al. [18] combined the FE fatigue strength simulation of the bogie frame with a full-scale fatigue test to estimate the structural integrity. Lu et al. [19] employed accelerated life and numerical test to predict the fatigue life reliability. Fu et al. [20] determined the main cause of fatigue crack initiation based on modal analysis, actual stress, and acceleration time history. Chen et al. [21] predicted the fatigue reliability based on FE fatigue strength simulation and static fatigue experiments. Li et al. [22] proved the causes of abnormal elastic vibration of an electric multiple unit (EMU) car body through dynamic simulation and dynamic stress tests. Despite much research related to analytical, numerical, and experimental methods for determining the structure of railway vehicles, the comprehensive analysis of the mechanism of cracks or fractures during railway operation and structural optimization has rarely been investigated. Unlike the special cases in the experiments, the analysis of crack or fracture mechanisms during the service period includes various uncertain factors, such as track irregularity, wheel irregularity, etc., which can be used to better investigate the real causes of structural failure and further facilitate structural improvement. Therefore, it is necessary to carry out failure mechanism analysis and design optimization based on crack or fracture phenomena during the service period.
Design optimization has been widely studied over the last several decades, and extensive work has been done in the area of railway vehicles. Most of these studies pay more attention to weight and stress minimization due to strict design requirements for light weight and static strength [23,24,25,26]. However, the anti-fatigue properties of structural design optimization based on weight and stress minimization are particularly poor. In addition, to achieve light weight, railway vehicle structures require additional fatigue optimization and robustness optimization to ensure the anti-fatigue properties of the design [27]. Consequently, this improves the structural scheme via fatigue optimization to achieve better performance compared with conventional methods. At present, although numerous optimization approaches have been proposed to improve the performance of these structures, few scholars have conducted a comprehensive analysis and proposed a mechanism-based optimization process and algorithm for railway vehicles.
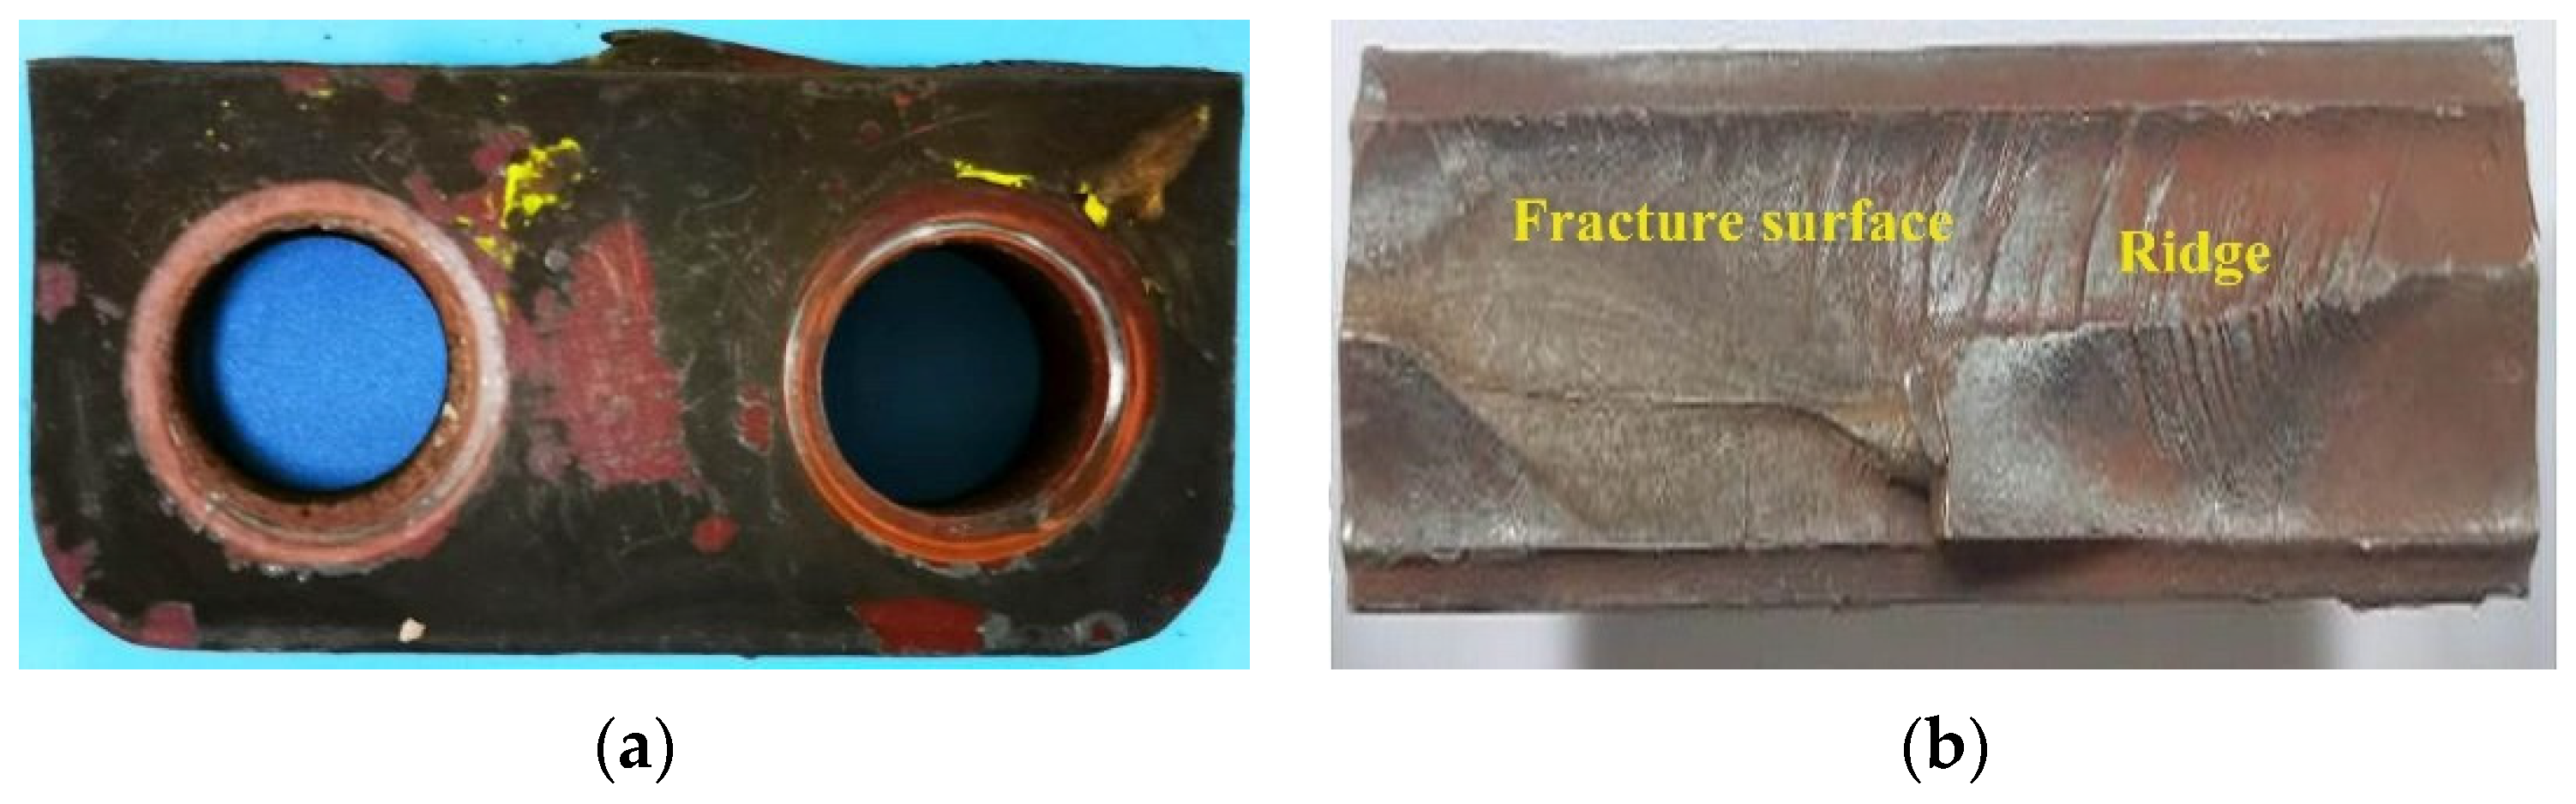
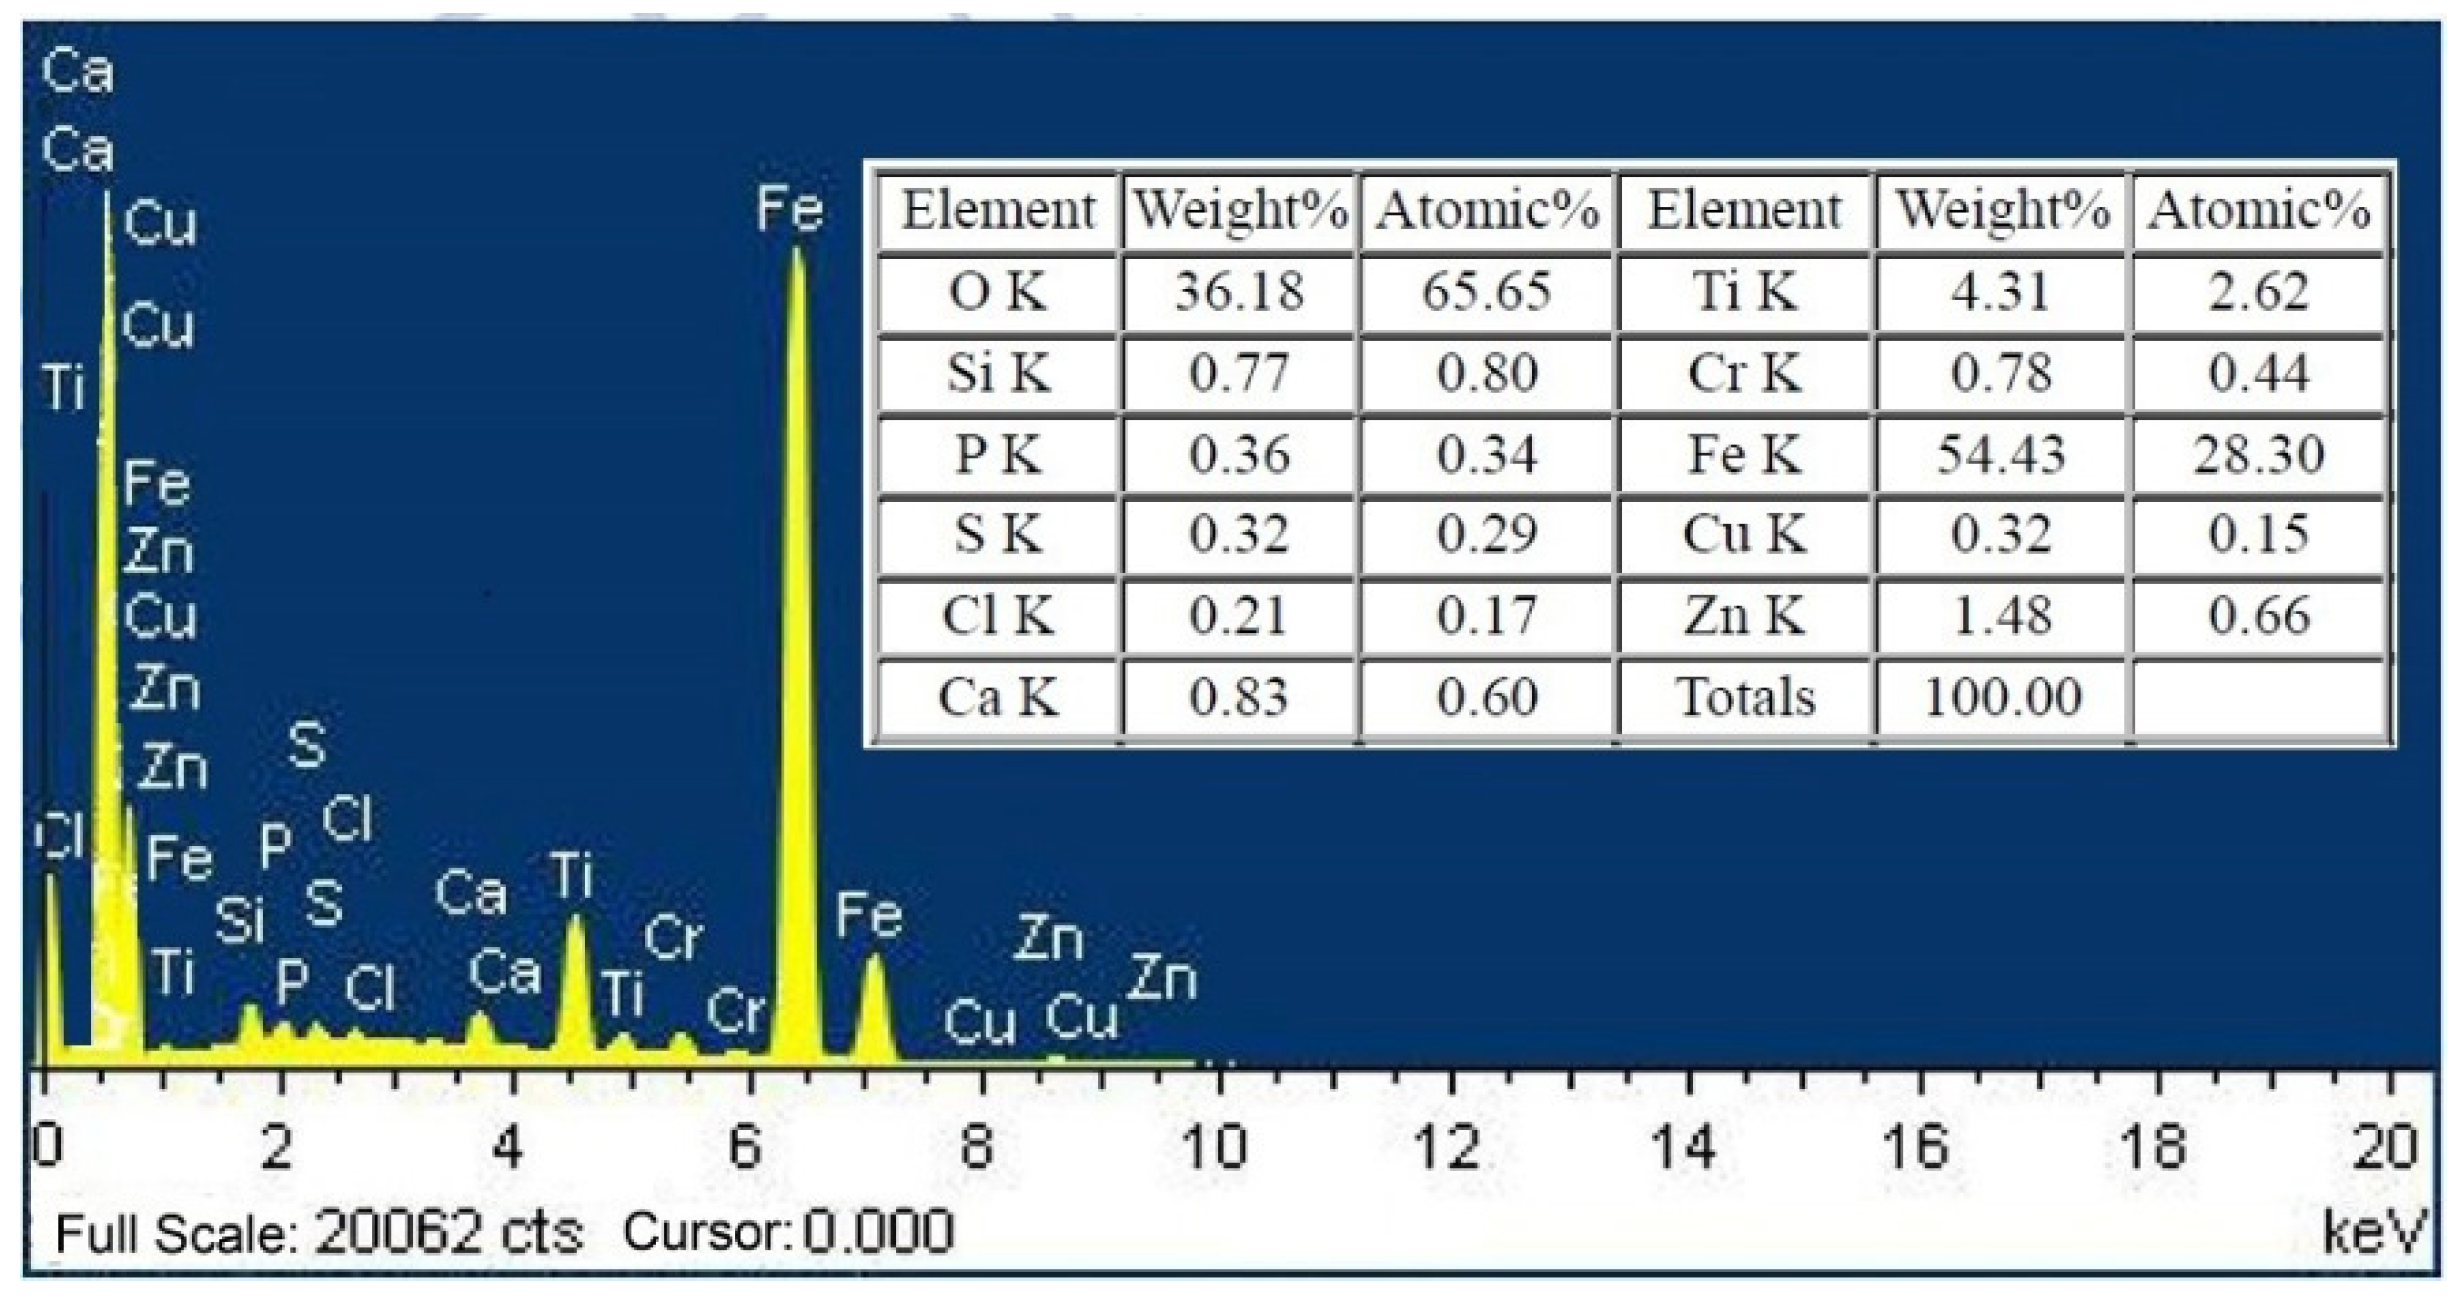
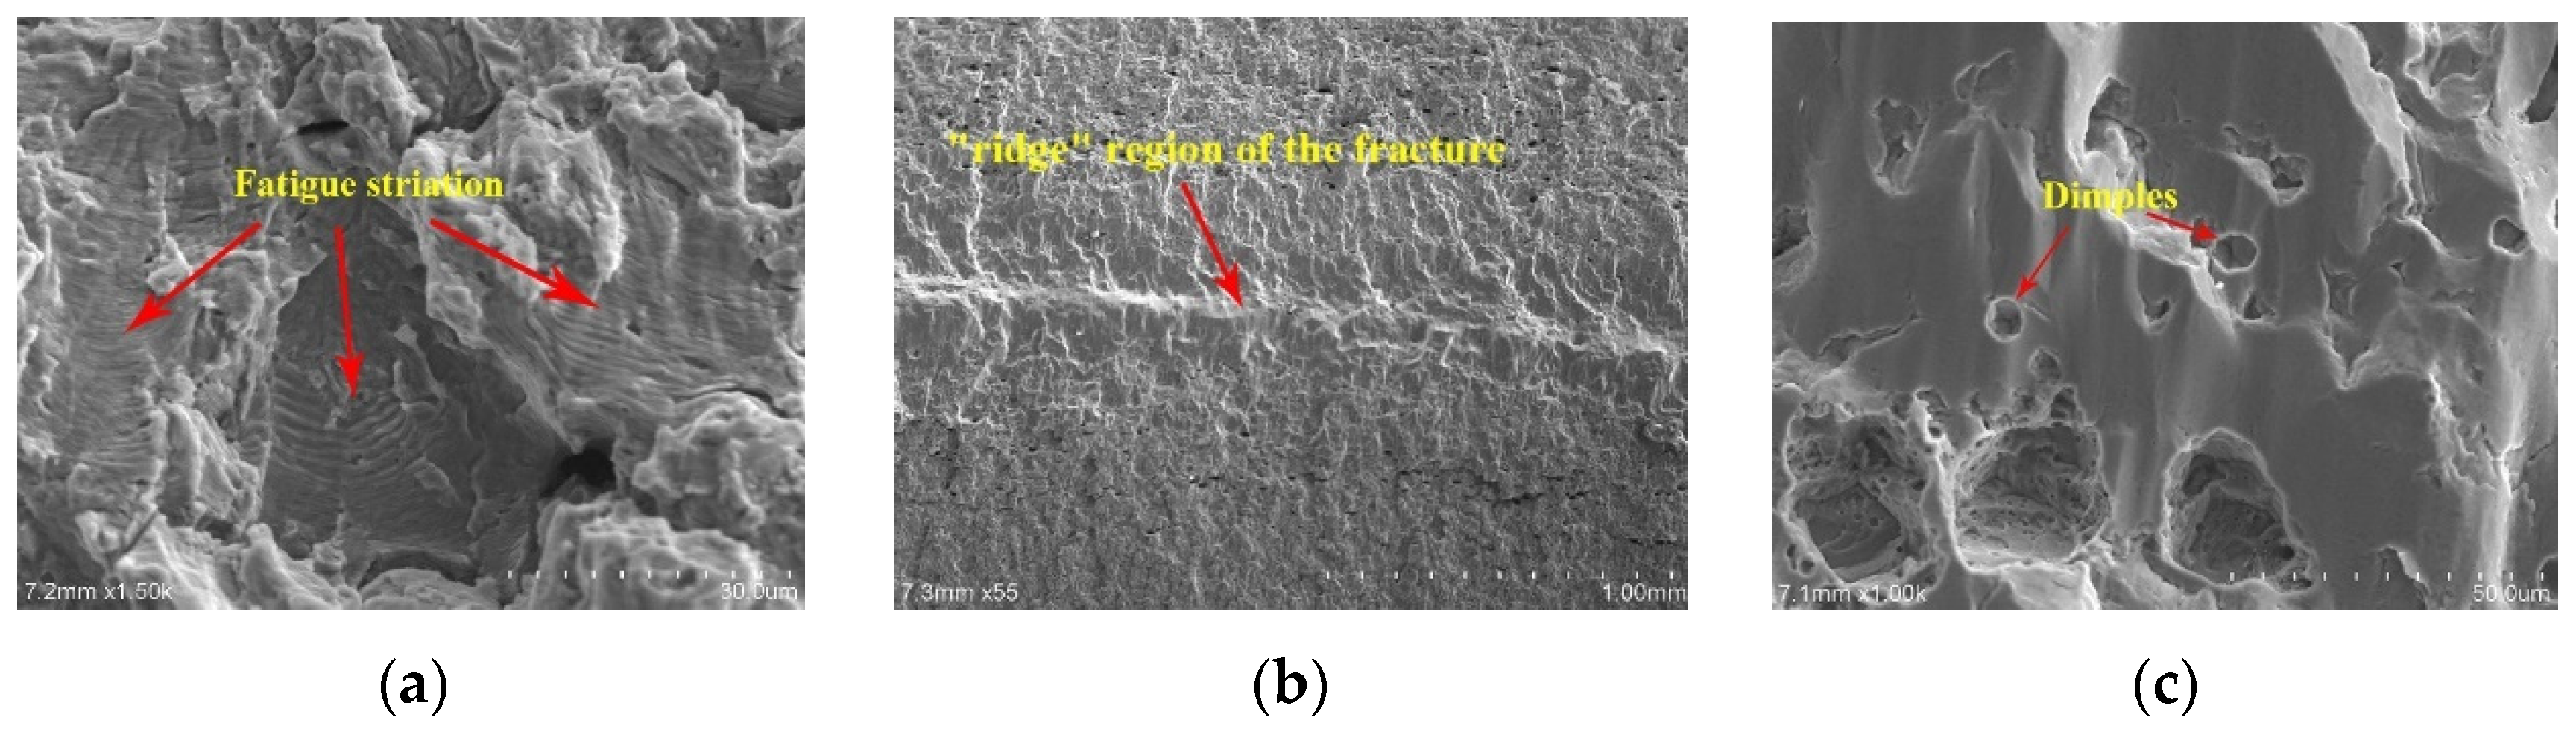
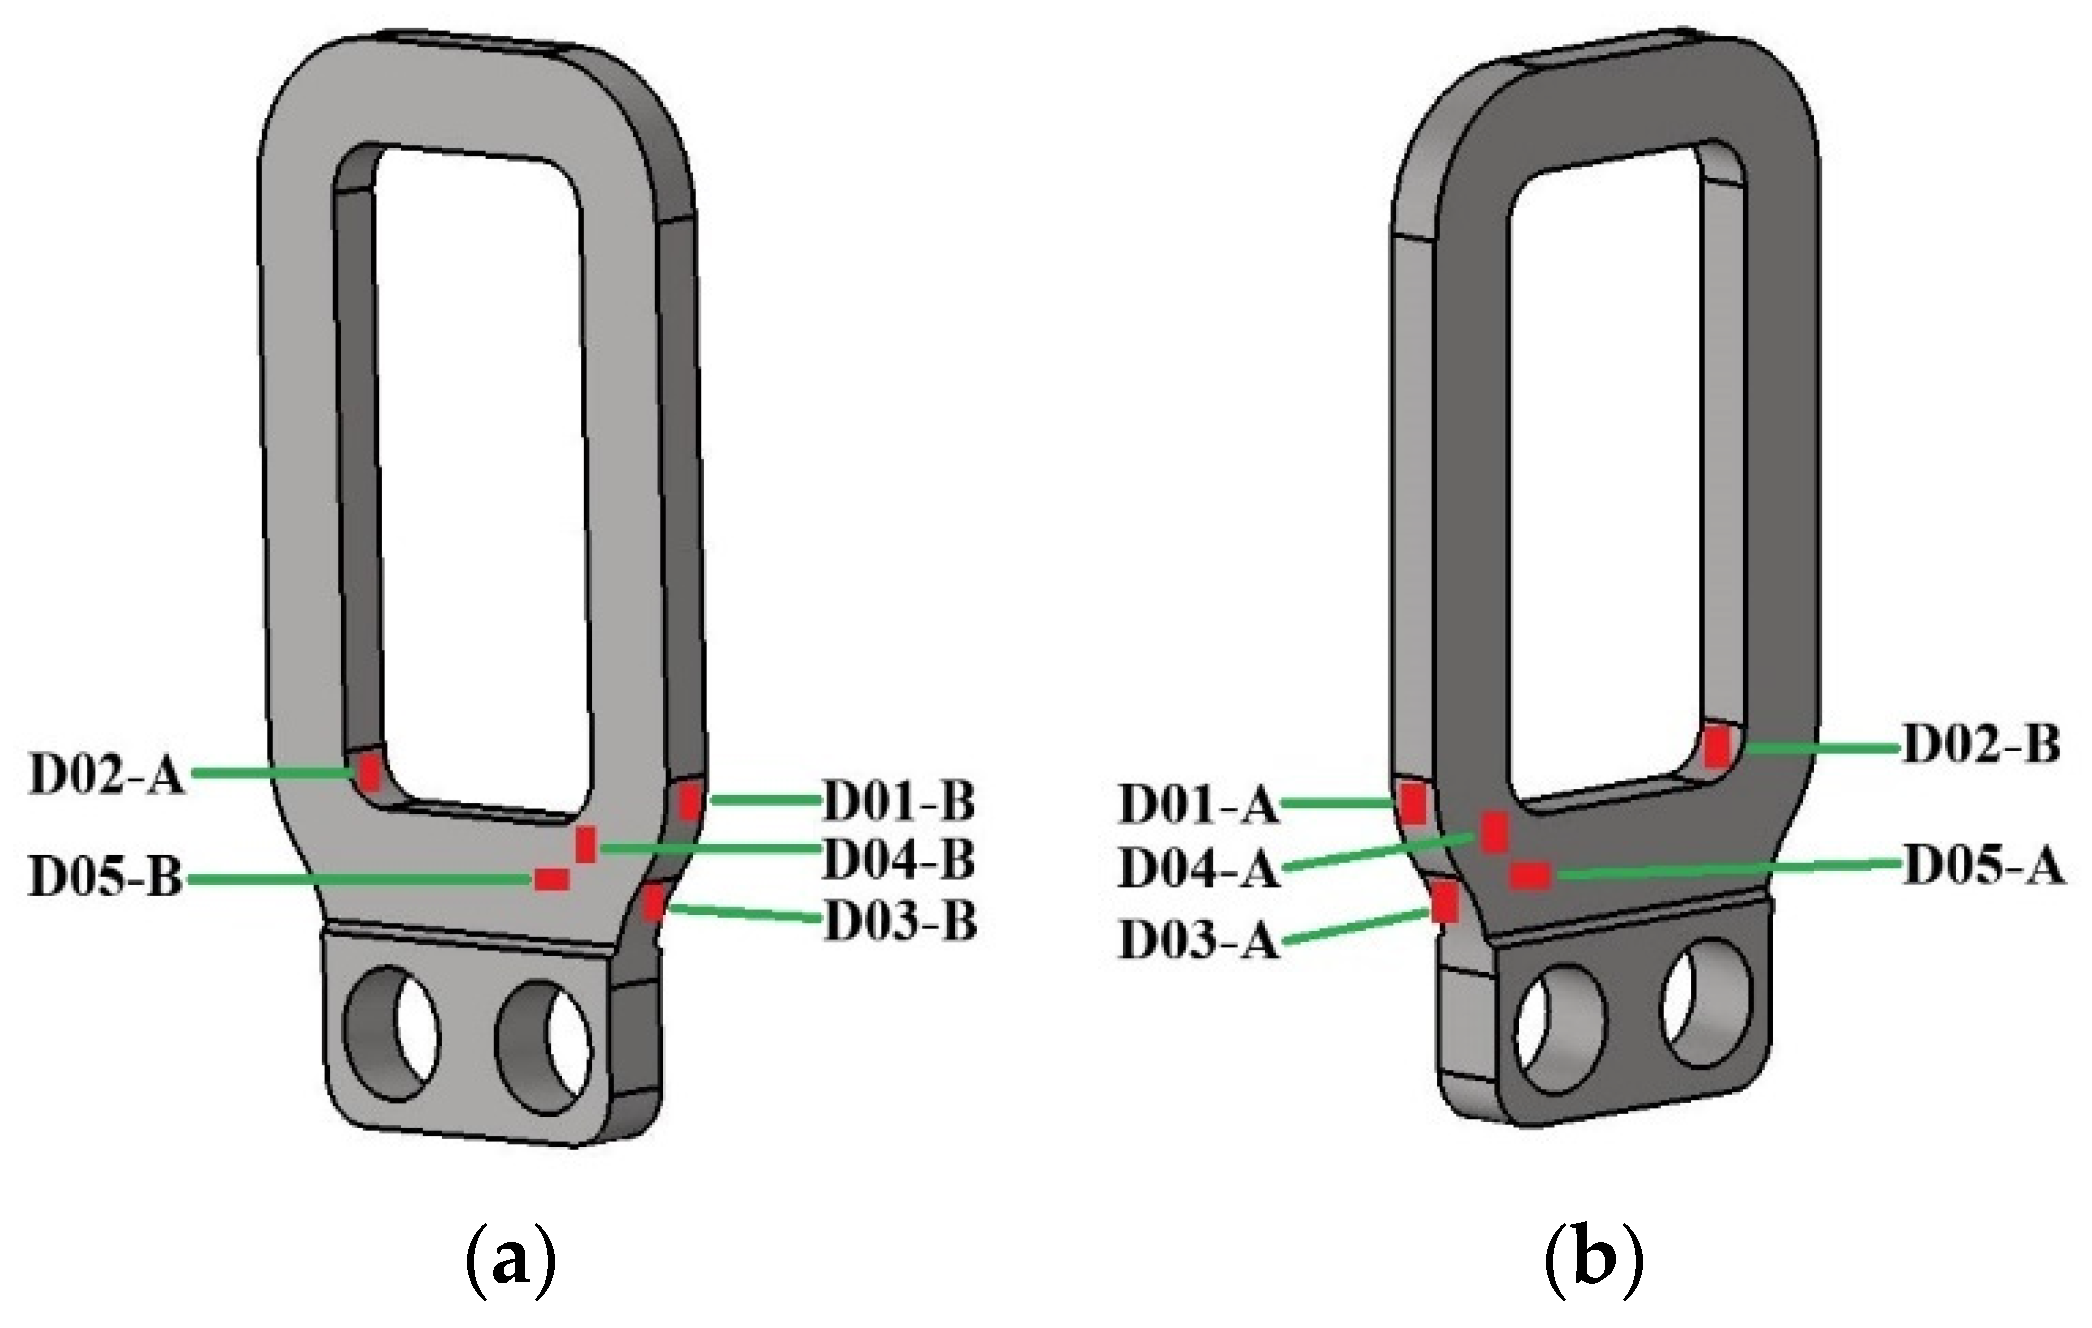
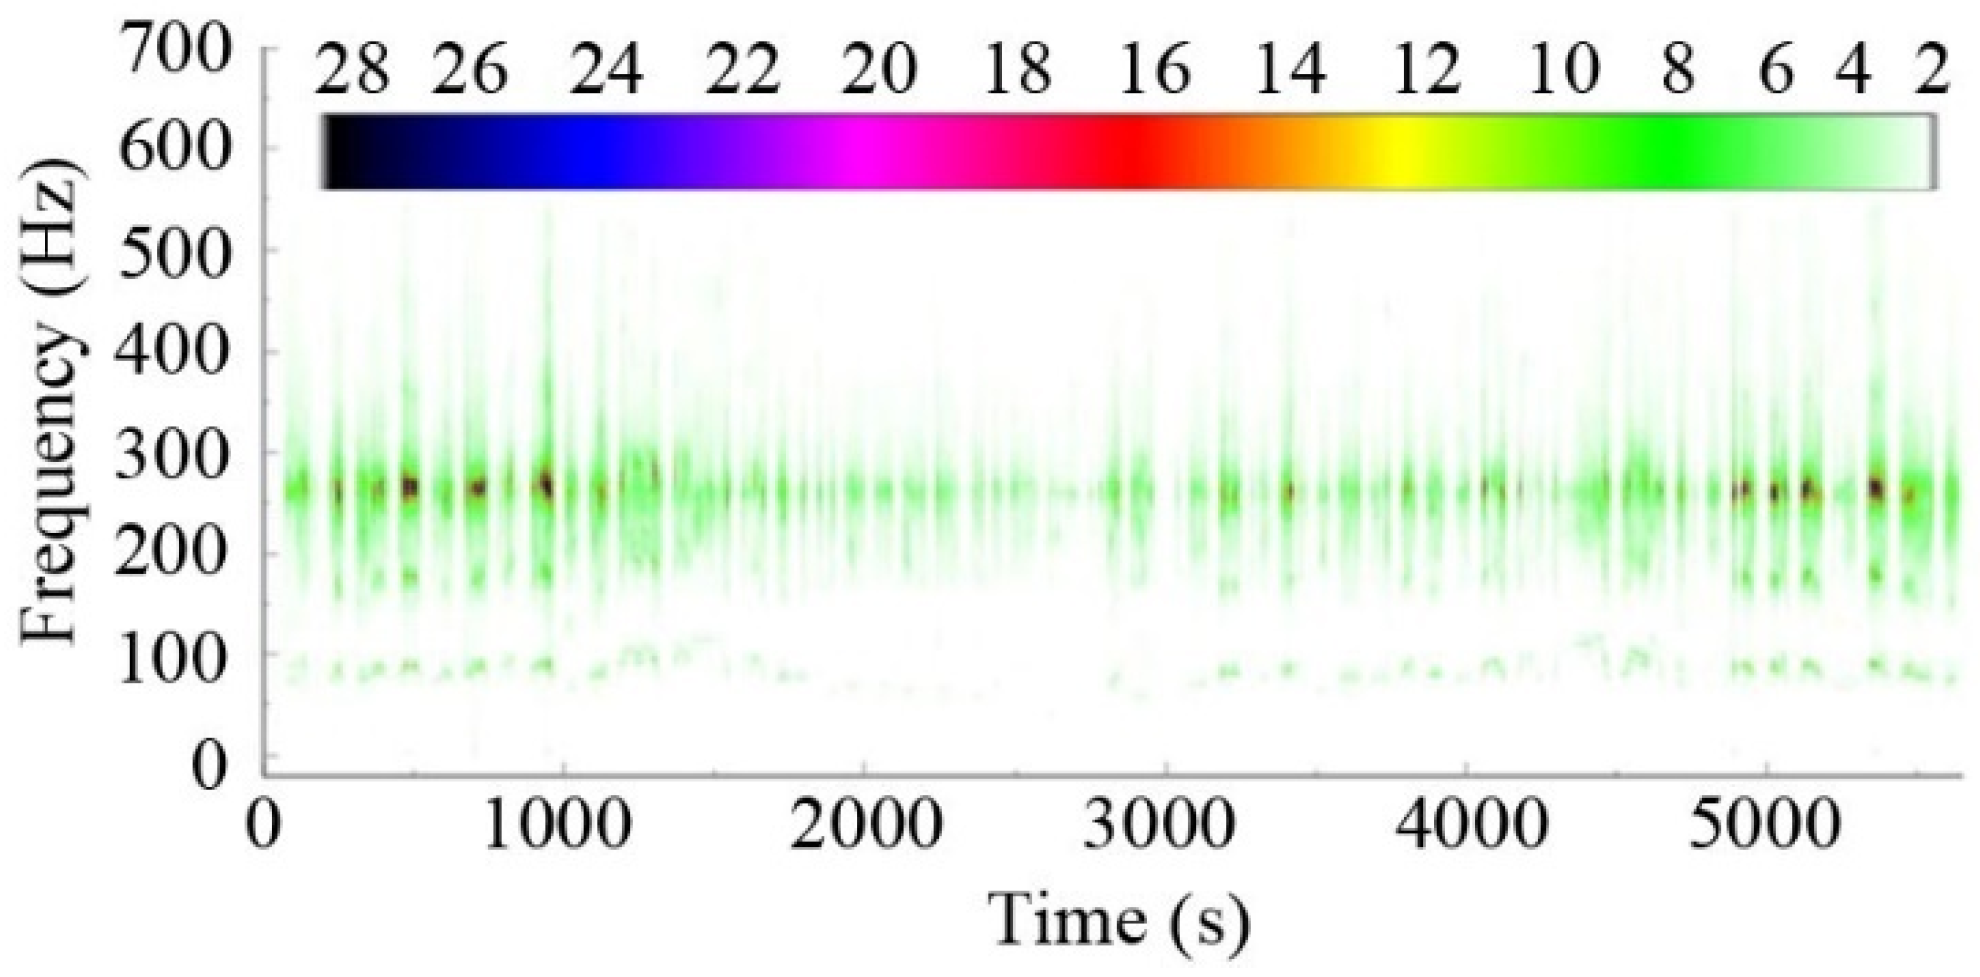
This paper focuses on the fracture mechanism and design optimization of the wheelset lifting mechanism based on experiments and simulations. Macro-examination, fracture SEM analysis, and metallographic examination of fractured lifting mechanisms are carried out to analyze the failure mechanism from a material perspective. A dynamic stress test of the wheelset lifting mechanism is conducted to further explore its fracture mechanism and verify the correctness of the material-based analysis. As a supplement to the macrostructure performance analysis, static strength analysis and modal analysis are performed to perfect the rationality of fracture mechanism analysis, and the weak parts of the structural optimization are identified. An improved NSGA-II is first proposed and combined with a robust fatigue optimization model and double-layer Kriging surrogate model, and an efficient design optimization process of the wheelset lifting mechanism is presented. Finally, the performance of the optimized structure is compared and verified.
The remainder of this paper is organized as follows: Physical tests and chemical analyses of the fractured lifting are conducted in Section 2. The dynamic stress testing of the wheelset lifting mechanism is described in detail in Section 3. Section 4 presents some FE simulations as a supplement to the structural performance of the fracture mechanism. Section 5 proposes a robust fatigue design optimization based on the double-layer Kriging surrogate model. Finally, Section 6 summarizes and concludes the study.

2. Physical Tests and Chemical Analyses

The purpose of physical tests and chemical analyses is to analyze the fracture cause of the wheelset lifting mechanism from the perspective of materials science, and then develop a test scheme and simulation method matching the fracture cause to further verify the fracture mechanism in terms of structural performance. Therefore, it is necessary to first analyze the material fracture mechanism of the wheelset lifting apparatus from the aspects of the macro-examination, fracture SEM analysis, and metallographic examination.

2.1. Macro Examination

Some of the wheelset lifting mechanisms of the vehicle were found with large cracks during daily maintenance, and fractures occurred due to slight hammering, as shown in Figure 1. As an important structure of a conical rubber spring-positioning bogie, wheelset lifting mechanisms can lift the wheelset during lifting and transportation of the to prevent abnormal tension of the primary rubber spring. The wheelset lifting structure achieves the function of lifting the wheelset through the lifting pin welded on the side beam of the frame and the wheelset lifting ring bolted on the boss of the front cover of the axle box. The complicated operating environment—due to the small curve radius, large traction/braking acceleration, out-of-round wheels, and other reasons—can cause abnormal vibration during normal operation of the vehicle. Especially when directly bearing the vibration from the ground, the wheelset lifting mechanism is susceptible to fatigue fracture of the fixed end due to alternating load. Therefore, it is necessary to comprehensively explore its fracture mechanism from the perspective of materials, dynamic stress, and FE simulation, and to put a corresponding design optimization scheme to improve its structural performance.
Figure 2a shows the macro-morphology of the fractured lifting mechanism, with the fracture extending along the transition fillet between the lifting lug and the lifting ring. After a slight hammering, it was completely fractured. Figure 2b displays the macro-morphology of the fracture, where we can see that there are obvious corrosion traces on the fracture surface, and the characteristic of the “spindle” fatigue shell line can be observed locally. There are multiple step-like stripes in the transition fillet area on both sides of the cross-section near the transition fillet area between the lifting lugs and the ring. The step-like stripes on both sides develop towards the center of the fracture and intersect to form a “ridge” region parallel to the axis. Therefore, it can be inferred that the crack originates from the transition fillet of the lifting lugs and rings on both sides, and fracture occurs when the “ridge” region of the propagation center is formed.

2.2. Fracture SEM Analysis

Figure 3a shows an SEM image of the lifting mechanism’s fracture surface at low magnification, and there are many step-like stripes at the source of the fracture, with microfracture characteristics of dimples, as shown in Figure 3b. There are many abnormal coverings on the surface of the fracture’s source, but no loose or slag-inclusion defects are observed.
Figure 4 reveals the energy-dispersive X-ray spectroscopy (EDS) of the fracture. It can be seen that the contents of O, Ti, Fe, and Zn in the abnormal covering are higher, where the total atomic percentage of O and Fe is 90.61%, mainly composed of iron oxidation products. Therefore, it can be inferred that the loose coverings and pits on the fracture surface are caused by corrosion. This phenomenon not only demonstrates that the fracture of the wheelset lifting is a slow process, but also accelerates the eventual fatigue fracture. Figure 5 shows the micro-morphology of the “ridge” region in the middle of the fracture, where fatigue striation and dimple morphology can be observed in the local area, which is the final fracture region.

2.3. Metallographic Examination

Figure 6 shows the optical microscopic morphology of the section cutting along the central axis of the fractured wheelset lifting mechanism. Nonmetallic inclusions near the source of the lifting mechanism’s fracture can be observed in Figure 6a; its evaluation is A1.5, A1.0e, B1.0, and D1.0 according to GB/T 10561-2005 “Steel—Determination of Content of Nonmetallic Inclusions”. The metallographic structure of the fracture source section of the fillets on both sides, as shown in Figure 6b, is composed of pearlite and ferrite, where the pearlite is slightly banded. There are several small and smooth cross-crystalline cracks on the surface of the fillet at the source of the fracture, the coupling on both sides of the crack is good, and the lifting mechanism’s fillet surface is not smooth, but there is no oxidation decarburization. Figure 6c shows a metallographic image of the fracture’s center, with microfracture characteristics similar to those shown in Figure 6b.
According to the macro- and micro-characteristics of the fractured wheelset lifting mechanism, it can be concluded that the fracture has the characteristics of bidirectional, multisource, high-cycle, low-stress fatigue, and that the crack source is located on the transition fillet surface of the lifting lugs and lifting rings on both sides. Obvious fatigue striations can be observed in the crack propagation area, and dimple morphology can be found in the “ridge” region in the middle of the fracture, which is the final fracture area. In general, the fracture of the wheelset lifting mechanism occurred as a result of bidirectional, multisource, high-cycle, low-stress fatigue, which was mainly because of abnormal vibration during service, and belongs to the category of vibration fatigue. For this purpose, dynamic stress tests and FE simulations were further employed to comprehensively analyze the fracture mechanism of the wheelset lifting apparatus from the perspective of vibration fatigue.

3. Dynamic Stress Test

Section 2 reveals that the fracture of the wheelset lifting mechanism was related to bidirectional, multisource, high-cycle, low-stress fatigue caused by vibration. Therefore, on-track testing of the existing structure was carried out to further determine the conclusion. The test line operated at the speed limit according to the curve and the actual situation of the stations and stops, without opening the door. The load was AW0 (i.e., the condition when the train is unloaded), and the maximum speed was 80 km/h. In this test, a Somat eDAQ dynamic data acquisition device was used to test the dynamic stress of the wheelset lifting mechanism via the quasi-static method of strain response. We randomly selected a wheelset lifting mechanism for measuring point layout, with a total of five measuring points. Given that stress perpendicular to the base metal was the principal fatigue fracture cause of the lifting mechanism, the strain gauges were all unidirectional. Figure 7 and Table 1 show the linear strain gauge layouts and lists, respectively, in which the red lines represent the strain gauges.
Taking the high-stress-amplitude regions on the lifting mechanism as the fatigue control locations can comprehensively reflect the stress state caused by external load, structural deformation, stress concentration, and other factors. The stress–time history measured at the fatigue control locations shows the real-time stress state of the lifting mechanism under the actual operating conditions, which represents the fatigue damage to the lifting mechanism under various loads [28]. For instance, the partial stress–time history of the outer variable section transition arc of the wheelset lifting mechanism is shown in Figure 8. Through zero-drift processing, rainflow counting, and compilation of the stress spectrum data, the peak and trough values of the stress at each measuring point were obtained, as shown in Figure 9. It can be seen from the figure that the stress variation amplitudes of measuring points D04-A and D04-B are large, and the maximum variation range is 209.1 MPa, indicating that there is a large alternating load and obvious vibration at this location.
Figure 10 presents the spectral analysis diagram of the wheelset lifting mechanism. It can be seen that the vibrational energy of the lifting mechanism is mainly concentrated at about 270 Hz during vehicle operation, which may be the main cause of fatigue fracture. To reasonably consider the damage caused by various stress levels, Miner’s linear cumulative damage rule and the S–N curve recommended by IIW-1823-07 ex XIII-215r4-07/XV-1254r4-07 “Recommendations for fatigue design of welded joints and components” were employed for damage calculation, and the 64 stress levels were taken to evaluate the structural damage [29]. The fatigue cumulative damage model is as follows:
D = L L 1 i = 1 64 n i N i = L L 1 i = 1 64 n i σ 1 a i m C
where L 1 is the on-track test distance (km), L is the total distance for complete service life (3.6 million km), m and C are material constants—the material parameters of steel and aluminum are m = 5, and the material parameters of steel are C = 2.12 × 10¹⁷, n i is the cycle of each stress amplitude, N i is the total stress cycle, and σ 1 a i m is each stress amplitude.
According to the dynamic stress test values of each measuring point on the wheelset lifting mechanism, the cumulative fatigue damage caused by the vehicle running for 3.6 million km under the existing wheel–rail relationship was calculated, as shown in Table 2. When the cumulative damage to the structure is less than 0.5, it is considered to be in a safe state. However, the damage values of the measuring points D04-A, D04-B, and D05-B in Table 2 exceed the damage limit by 0.5, indicating that the wheelset lifting mechanism under the existing wheel–rail relationship cannot meet the operational demand of 3.6 million km. The locations of measuring points D04-A, D04-B, and D05-B are consistent with the crack initiation locations. It can be seen that the vibration fatigue caused by track irregularities or wheel irregularities is the main reason for the damage and even fracture of the lifting structure, which is consistent with the analysis in Section 2.

4. FE Simulations

Both material and dynamic stress experiments show that the fracture mechanism of the wheelset lifting apparatus is fatigue caused by vibration, which indicates that there are some deficiencies in the original structural design. Therefore, static strength and modal analyses were carried out using FE simulations to verify the rationality of the original structure. Since the dynamic stress test verified the fatigue performance of the original structure, the fatigue simulation analysis was ignored. To ensure the calculation accuracy of a variable cross-section area with a small chamfer, the FE model of the wheelset lifting mechanism was modeled using 10-node tetrahedral solid elements. The axle-box end cover was also modeled using 10-node tetrahedral solid elements to simulate the installation environment. Considering the connection form of the wheelset lifting mechanism and the axle-box end cover, beams and rigid elements were employed to simulate the connecting bolt. The X/Y/Z/XOY/YOZ/ZOX displacement constraint and X/Y/Z displacement constraints were applied to the bolt holes and the surface of the axle-box end cover, respectively. The FE model is shown in Figure 11.
Due to the complexity of excitation during the actual operation of the line, combined load cases in all directions were applied to the wheelset lifting mechanism according to the relevant provisions of BS EN 13749: 2011 “Railway applications–Wheelsets and bogies–Method of specifying the structural requirements of bogie frames”. The specific information is given in Table 3 (g = 9.81 m/s2), based on which the FE analysis of the wheelset lifting mechanism was conducted. Figure 12 displays the static strength stress contour plot for load cases 01–08.
It should be noted that the material of the wheelset lifting mechanism is Q235B, which has isotropic properties, and the plasticity or elasticity–plasticity of the material was not considered in the FE simulation. Thus, the analysis results are not affected by the loading path [30]. As shown in Figure 12, the stress value of the wheelset lifting mechanism under static strength load cases is less than 225 Mpa of the material yield limit, which meets the standard requirements. However, it can be seen from the stress contour plot that the stress at the root of the excessive arc of the variable section is large, which is consistent with the fracture location, indicating that there is a certain risk in the design. By comparing the stresses under various load cases, it was found that the longitudinal and vertical acceleration can cause large stress during lifting, and the lateral acceleration has little effect on the stress. This illustrates that the fatigue fracture of the lifting mechanism is mainly related to the longitudinal and vertical vibration. For this reason, Figure 13 shows a modal contour plot of the wheelset lifting mechanism to observe the deformation state of the structure at a certain frequency.
As can be seen in Figure 13, the vibrational frequency has a significant effect on the deformation amplitude of the wheelset lifting mechanism. It should be noted that the 1st, 2nd, and 3rd modals of vibration cause the maximum stress to appear at the root of the transition arc of the variable section, while the locations of the maximum stress of the 4th, 5th, and 6th modals change, indicating that low-frequency vibration is the main reason for the fracture of the wheelset lifting mechanism. In addition, by comparing the 1st modal predicted by FE analysis with Figure 10, it can be seen that the vibrational frequency during wheelset lifting operation is close to its natural frequency, which is about 270 Hz. It can be seen that the wheelset lifting mechanism produces resonance during operation, which causes the strain amplitude to increase, and the fracture occurs from the location where the stress is the greatest.

5. Robust Fatigue Design Optimization Based on the Double-Layer Kriging Surrogate Model

The mechanism analysis shows that the main fracture cause of the wheelset lifting apparatus is the fatigue damage caused by vibration, which intensifies the initiation and propagation of fatigue cracks until the final fracture. Therefore, a robust fatigue design optimization method is proposed to improve the anti-fatigue properties and stability of the original structure. In this regard, a double-layer Kriging surrogate model was studied to address the efficiency problem of repeated FE computation calls, and an improved NSGA-II algorithm was used to enhance the global search ability of the design optimization.

5.1. Determination of Optimization Variables and Objectives

According to the experiments and FE analysis results of the wheelset lifting mechanism, it can be seen that the inner and outer arcs under the lifting hole are the main locations of fatigue damage. Therefore, these regions should be paid more attention when the structure is optimized. The five side lengths, inner and outer radian, and thickness of the lifting hole are the main parameters affecting its structural performance. However, the improvement of the transition fillet surface of the lifting lugs and lifting rings involves changes in L 1 , L 2 , L 4 , L 5 , and T 1 ; thus, these are identified as the optimization variables with the greatest impact on the lifting fatigue performance. Figure 14 provides the location of the main parameters of the wheelset lifting mechanism, in which the optimization variables are marked in red.
In addition, fatigue strength and robustness were taken as the optimization objective and constraint, respectively, which can improve the anti-fatigue properties of structural optimization without being affected by manufacturing errors. However, railway vehicles are subjected to vertical, lateral, longitudinal, and oblique symmetrical loads during their operation, which means the the load borne by the wheelset lifting mechanism presents a typical multiaxial load state. For this purpose, the multiaxial–uniaxial stress state transition method provided by the railway vehicle standard ORE B12/RP17 was used to calculate the stress and amplitude, as shown in Figure 15.
As shown in Figure 15, the maximum principal stress of the structure under all load cases is regarded as the basic stress distribution direction, denoted as σ m a x ; the principal stresses under other load cases are projected to the determined maximum principal stress direction, where the smallest projection value is determined as the minimum principal stress, denoted as σ m i n . The mean stress and stress amplitude are calculated using Equation (2), and then the transformation from a multiaxial stress state to a uniaxial stress state is completed.
σ m = σ m a x + σ m i n 2 σ a = σ m a x σ m i n 2
where σ m is the mean stress, and σ a is the stress amplitude.

5.2. Parameter Optimization of the Kriging Surrogate Model

According to the relevant theories of the Kriging surrogate model, the selection of correlation kernel function has a significant effect on its fitting ability [31,32]. Compared with the linear kernel function, the Gaussian-based Kriging surrogate model can fit the model surface with more smoothness. Therefore, an improved differential evolution (IDE) algorithm with fast global search ability is proposed to determine the optimal Gaussian kernel function θ, and then a high-accuracy optimized Kriging surrogate model is built, which can be obtained from Equation (3):
m i n θ > 0 φ θ = R θ 1 m σ 2
where m is the number of design variables, σ 2 is the variance, and R θ is the kernel function with parameters.
Given that different mutation strategies have a great impact on the searchability of the differential evolution (DE) algorithm, an IDE algorithm with a hybrid mutation strategy is proposed to enhance its comprehensive searchability. The expression of the hybrid mutation strategy is provided as follows:
H i = X best + J × ( X r 1 X r 2 ) B < ζ < 0.5 X r 1 + J × ( X r 2 X r 3 ) others
B = f ( x i ) x m i n x m a x x m i n
where H i is any individual variation set in a mutation operation, J is the scaling factor, J 0 , 1 , X best is the best individual in the current generation, X r 1 , X r 2 , and X r 3 are the randomly selected individuals in the current generation, B and ζ are uniform random numbers in 0 , 0.5 , f ( x i ) is the fitness of the first particle, and x m i n and x m a x are the minimum and maximum values in the particles, respectively.

5.3. Improved NSGA-II Algorithm

In the fatigue limit diagram, the mean stress and stress amplitude determine the fatigue performance of wheelset lifting mechanism; the lower the mean stress and stress amplitude, the better it can fit the fatigue limit diagram [21]. Therefore, the fatigue optimization of the wheelset lifting mechanism is a multi-objective optimization problem that minimizes the mean stress and stress amplitude so that it can meet the requirements of fatigue performance. As one of the most popular multi-objective genetic algorithms, NSGA-Ⅱ reduces the complexity of the non-inferior sorting genetic algorithm. It has the advantages of fast running speed and good convergence of the solution set, and can be taken as the benchmark for the performance of other multi-objective optimization algorithms. Thus, the NSGA-Ⅱ algorithm was used to deal with the multi-objective optimization problem of the wheelset lifting mechanism in this study. However, there are also many shortcomings to the NSGA-Ⅱ, such as the optimization more easily converging to a locally optimal solution prematurely, slow convergence, and the inability to properly balance global search and local search [33,34]. Therefore, this paper puts forward the following improvement strategies for NSGA-II:
(1)
Initialization population of sine chaotic mapping
Based on the characteristics of the irregular random movement of the sine chaotic mapping, the dispersion and uniformity of the generated population are enhanced compared with a randomly generated population, which makes the convergence speed of the algorithm faster. The expression is provided as follows:
w k + 1 = a 4 sin π w k ,   a 0 , 4
where w k is the random number in [ 0 , 1 ] , and a represents the chaotic parameters.
(2)
Adaptive dynamic crossover probability
To balance the global and local optimization performance of the algorithm, a nonlinear increasing function is employed to make the algorithm quickly jump out of the local optimal solution and then turn to the global optimization process. The expression is provided as follows:
p c = 0.5 × 1 0.8 × cos 3 t T
where pc is the adaptive dynamic crossover probability, t is the current number of iterations, and T is the total number of iterations.
(3)
Adaptive dynamic mutation probability
A nonlinear decreasing function is adopted to obtain the variation value of global optimization under the condition of high variation probability, and to achieve the requirement of rapid convergence under the condition of low mutation probability. The expression is provided as follows:
p m = 0.3 × 0.8 × cos 3 t T + 1
where pm is the adaptive dynamic mutation probability.
(4)
Crossover operator based on Cauchy distribution
A Cauchy distribution operator is proposed to solve the problem of high subjectivity of cross-behavior in the original NSGA-II algorithm. The expression is provided as follows:
x 1 , i = p 1 , i t + p 2 , i t / 2 + 1.481 p 1 , i t p 2 , i t C 0 , 2 π / 2 x 2 , i = p 1 , i t + p 2 , i t / 2 1.481 p 1 , i t p 2 , i t C 0 , 2 π / 2 ,   t 0 , 0.5
x 1 , i = p 1 , i t + p 2 , i t / 2 1.481 p 1 , i t p 2 , i t C 0 , 2 π / 2 x 2 , i = p 1 , i t + p 2 , i t / 2 + 1.481 p 1 , i t p 2 , i t C 0 , 2 π / 2 ,   t 0.5 , 1
where x 1 , i and x 2 , i are the offspring of the variable i, p 1 , i t and p 2 , i t are the parents of the variable i, and C 0 , 2 π is a random number following a Cauchy random distribution with a position parameter of 0 and a scale parameter of 2 π .
(5)
Mutation operator based on Cauchy distribution
The original NSGA-II algorithm uses a polynomial mutation operator, which has subjective parameters, resulting in a slow convergence speed. For this purpose, a Cauchy distribution mutation operator without subjective parameters is proposed to improve the robustness of the calculation results. The expression is provided as follows:
x 1 , i = x 1 , i + Δ j
Δ j = F 1 r a n d ; 0 , π / 2 r a n d 0 , 1 F 1 r a n d ; 0 , π / 2 others
where x 1 , i is the mutated offspring, Δ j is the mutation disturbance, F is the cumulative distribution function of the Cauchy mutation, and rand is a random number.
In summary, the procedure of the improved NSGA-II is elaborated in Table 4.

5.4. Robust Fatigue Optimization Based on the Double-Layer Kriging Surrogate Model

In the optimization process of the wheelset lifting mechanism, the FE model needs to be repeatedly used for analysis, which leads to low calculation efficiency. Thus, it is necessary to digitally characterize the functional relationship between optimization variables and objectives with the help of the optimized Kriging surrogate model established in Section 5.2, and to solve it with the improved NSGA-II method proposed in Section 5.3. In addition, considering the robustness of fatigue optimization, the objective functions of expectation and variance, including mean stress and stress amplitude, are established. The basic fatigue robustness optimization model is given as follows:
min f 1 x = ω 1 × μ σ m + ω 2 × 6 × σ σ m min f 2 x = ω 1 × μ σ a + ω 2 × 6 × σ σ a s . t . l b 1 < x 1 < u b 1 ;   l b 2 < x 2 < u b 2 ; l b 3 < x 3 < u b 3 ; l b 4 < x 4 < u b 4 ; l b 5 < x 5 < u b 5
where f 1 x is the function of the mean value and standard deviation of mean stress, f 2 x is the function of the mean value and standard deviation of stress amplitude, ω 1 is the weight of the mean fatigue strength, ω 2 is the weight of the variance in fatigue strength, μ σ m is the mean value of mean stress, σ σ m is the standard deviation of mean stress, μ σ a is the mean value of stress amplitude, σ σ a is the standard deviation of stress amplitude, l b 1 is the lower limit of x 1 , l b 2 is the lower limit of x 2 , l b 3 is the lower limit of x 3 , l b 4 is the lower limit of x 4 , l b 5 is the lower limit of x 5 , u b 1 is the upper limit of x 1 , u b 2 is the upper limit of x 2 , u b 3 is the upper limit of x 3 , u b 4 is the upper limit of x 4 , and u b 5 is the upper limit of x 5 .
The process of the robust fatigue optimization method based on the double-layer Kriging surrogate model is shown in Figure 16, and the calculation steps are summarized as follows:
Step 1: The optimization variables and objectives are determined according to the mechanism analysis.
Step 2: ANSYS Workbench software is employed to parameterize the wheelset lifting mechanism, and the design of experiments (DoE) is carried out. The true response values of stress amplitude and mean stress are calculated by using the conversion method provided in Section 5.1.
Step 3: Using the IDE–Kriging model to fit the DoE data, the first-layer surrogate model is established.
Step 4: The average relative error is used as the accuracy evaluation index to test the accuracy of the surrogate model. If the accuracy does not meet the requirements, the Kriging surrogate model needs to be optimized, or the samples need to be increased.
Step 5: Latin hypercube and Monte Carlo sampling are carried out to establish the Kriging surrogate model of the mean and standard deviation of mean stress and stress amplitude.
Step 6: The method in Step 4 is adopted to test the accuracy of the second-layer surrogate model.
Step 7: The robust optimization model is solved based on the improved NSGA-II.

5.5. Design Optimization of the Wheelset Lifting Mechanism

The SolidWorks software was employed to establish the geometric model of the wheelset lifting mechanism, and it was parameterized according to the optimization variables. Then, ANSYS Workbench was used for FE analysis, where a central composite design was adopted for the DoE. Table 5 and Table 6 present the numerical characteristics of the optimization variables and the DoE calculation process, respectively.
The IDE–Kriging surrogate model was employed to fit the data in Table 6, and then the first-layer Kriging surrogate model of optimization variables and objectives was built. Eight experimental samples were selected to verify the fitting accuracy of the surrogate model, a comparative analysis was carried out with the IDE–Kriging and original Kriging surrogate models, and the calculation results are shown in Figure 17. It can be seen that the fitting accuracy of the IDE–Kriging surrogate model for the mean and variance of fatigue strength is higher than that of the original surrogate model. The RMSE values of σ a are 0.0167 and 0.0378, and the RMSE values of σ m are 0.029 and 0.0555, respectively.
Latin hypercube sampling was used for the first-layer Kriging surrogate model to obtain 200 initial sample points, and 10,000 Monte Carlo simulations were then performed to obtain the expectation and standard deviation of each sample, and the second-layer Kriging surrogate model was finally built. The sample data are shown in Table 7.
Using the method provided in Figure 17 to verify the accuracy of the second-layer Kriging surrogate model, the calculation results are shown in Figure 18. It can be seen that the fitting result of the IDE–Kriging surrogate model is almost consistent with the real value, which can be used for subsequent robust optimization.
A robust fatigue design optimization model for wheelset lifting mechanisms was constructed based on the surrogate models provided in Figure 18 and Equation (13). The optimization objectives were solved as the fitness function, and the improved NSGA-II algorithm was adopted to improve the optimization accuracy and efficiency. The optimization results are described in Figure 19. It can be seen that the improved NSGA-II-based optimal solution set is better than the original NSGA-II under the same constraints, and the obtained optimal solution set is relatively small, which verifies the effectiveness of the improved NSGA-II optimization algorithm.
The degree of dominance can better deal with the relationship between two objectives in the Pareto optimal solution set; the higher the degree of dominance, the better the performance of the solution. Therefore, fuzzy theory was employed to calculate the dominance of each solution in the Pareto optimal solution set, and the solution with the highest dominance was selected as the optimal solution of the Pareto set. The distribution diagram of the degree of dominance of the solution in the Pareto optimal solution set was obtained through analysis, as plotted in Figure 20, which shows that the highest degree of dominance for the optimized design is 0.01125, which can be used as the optimal solution.
Table 8 provides the optimal design variables for the wheelset lifting mechanism. Considering the influence of manufacturing and other factors, engineering regression was carried out on the design optimization results to obtain the final design optimization scheme, as shown in Figure 21.
On the premise of ensuring the robustness of structural fatigue strength, preventing the resonance between the lifting mechanism and the car body is the main index by which to judge the rationality of structural optimization. Thus, modal analysis of the optimized structure was carried out and compared with the results in Figure 13. As shown in Figure 22, in terms of numerical analysis, the frequencies of the first six orders are lower than the original structure except for the third; in particular, the first modal frequency is 254 Hz. This represents a certain gap from the car body’s mode frequency (270 Hz), which can effectively prevent resonance. Judging from the modal contour plot, each vibration modal will not produce a large stress-concentration phenomenon, especially at low-order frequencies. The maximum stress generated by the vibration is at the bolt joint surface, which will not affect the fracture of the lifting mechanism. In general, the optimized lifting structure not only ensures the robustness of fatigue strength, but also effectively avoids resonance with the car body and reduces stress concentration.

6. Conclusions

This study comprehensively evaluated the fracture mechanism of a fractured wheelset lifting apparatus, including material characteristics analysis of fractures, on-track dynamic stress tests, and FE analysis; a robust fatigue design optimization process based on a double-layer Kriging surrogate model and an improved NSGA-II algorithm was presented, aiming to provide an efficient design optimization method. The main conclusions can be summarized as follows:
(1)
The cracks in the wheelset lifting mechanism originate at the transition fillet on both sides of the lifting lug and lifting ring, and there are multiple crack intersection steps. Obvious fatigue striations can be observed in the expansion area; the final fracture region presents a “ridge” shape, and some dimples can be observed. The overall fracture of the wheelset lifting mechanism has the characteristics of bidirectional, multisource, high-cycle, low-stress fatigue, and it can be preliminarily concluded that the reason for this is the abnormal vibration during service.
(2)
Dynamic stress testing reflects that the tested wheelset lifting mechanism does not meet the operational requirements of 3.6 million km under the existing wheel–rail relationship; the minimum remaining life is about 80,000 km, and the damage location is consistent with the fracture location. The reason for this is that the track irregularity or wheel irregularity leads to the high-frequency vibration of the wheel and axle, and worsens the stress state of the lifting mechanism; thus, this fracture can be characterized as being caused by vibration fatigue.
(3)
The first natural bending frequency of the wheelset lifting mechanism is 272 Hz, which is consistent with the spectral results of on-track operation. This demonstrates that the fracture of the lifting mechanism at the maximum stress is caused by resonance during train operation. The mechanism-based comprehensive analysis shows that the main cause of fracture of the lifting mechanism is fatigue damage caused by resonance, and a fracture with bidirectional, multisource, high-cycle, low-stress fatigue fracture characteristics is finally formed.
(4)
The proposed double-layer Kriging surrogate model and improved NSGA-II algorithm improve the efficiency and accuracy of the robust fatigue optimization of the wheelset lifting mechanism. The first natural bending frequency of the optimized wheelset lifting is 254 Hz, which can effectively avoid stress concentration and fatigue damage caused by resonance.

Author Contributions

Conceptualization, P.Z. and Z.W.; methodology, P.Z.; software, Z.T.; validation, P.Z. and J.L.; formal analysis, J.W.; investigation, P.Z.; resources, Z.L.; data curation, Z.L.; writing—original draft preparation, P.Z.; writing—review and editing, Z.W. and X.G.; visualization, Z.W.; supervision, Z.W.; project administration, Z.T.; funding acquisition, P.Z. All authors have read and agreed to the published version of the manuscript.

Funding

This research was funded by the Sichuan Science and Technology Program, grant number 2020JDJQ0036, and the Guangdong Basic and Applied Basic Research Foundation, grant number 2021A1515110308.

Institutional Review Board Statement

Not applicable.

Informed Consent Statement

Not applicable.

Data Availability Statement

Not applicable.

Conflicts of Interest

The authors declare that they have no known competing financial interests or personal relationships that could have appeared to influence the work reported in this paper.

References

  1. Hu, D.X.; He, B.B.; Xu, B.Z.; Wang, M.; Jia, X.P. Analysis and improvement of abnormal vibration based on wheelst lift. Railw. Locomot. Car. 2019, 39, 103–108. [Google Scholar]
  2. Zhi, P.P.; Li, Y.H.; Chen, B.Z.; Shi, S.S. Bounds-based structure reliability analysis of bogie frame under. Eng. Fail. Anal. 2020, 114, 104541. [Google Scholar] [CrossRef]
  3. Li, Y.H.; Zhi, P.P.; Zhang, Y.; Chen, B.Z.; Wang, Y.D. Fatigue reliability analysis of motor hanger for high-speed train based on Bayesian updating and subset simulation. Adv. Mater. Sci. Eng. 2020, 2020, 3012471. [Google Scholar] [CrossRef] [Green Version]
  4. Zhi, P.P.; Xu, Y.; Chen, B.Z. Time-dependent reliability analysis of the motor hanger for EMU based on stochastic process. Int. J. Struct. Integr. 2020, 11, 453–469. [Google Scholar] [CrossRef]
  5. Hou, J.; Wicks, B.H.; Antoniou, R.A. An investigation of fatigue failures of turbine blades in a gas turbine engine by mechanical analysis. Eng. Fail. Anal. 2002, 9, 201–211. [Google Scholar] [CrossRef]
  6. Lu, Y.H.; Xiang, P.L.; Dong, P.; Zhang, X.; Zeng, J. Analysis of the effects of vibration modes on fatigue damage in high-speed train bogie frames. Eng. Fail. Anal. 2018, 89, 222–241. [Google Scholar] [CrossRef]
  7. Liu, Q.P.; Gao, Y.H.; Li, Y.H.; Xue, Q.W. Fatigue life prediction based on a novel improved version of the Corten-Dolan model considering load interaction effect. Eng. Struct. 2020, 221, 111036. [Google Scholar] [CrossRef]
  8. Yang, B.; Duan, H.; Wu, S.C.; Kang, G. Damage tolerance assessment of a brake unit bracket for high-speed railway welded bogie frames. Chin. J. Mech. Eng. 2019, 32, 58. [Google Scholar] [CrossRef] [Green Version]
  9. Zuo, F.J.; Li, Y.F.; Huang, H.Z. Reliability analysis for fatigue damage of railway welded bogies using Bayesian update based inspection. Smart Struct. Syst. 2018, 22, 193–200. [Google Scholar] [CrossRef]
  10. Liao, A.H.; Huang, X.; Fang, Y. Fatigue analysis for bogie frame based on rigid-flexible coupling simulation. J. Vib. Meas. Diagn. 2017, 37, 392–397. [Google Scholar] [CrossRef]
  11. Lucanin, V.J.; Simic, G.; Milkovic, D.D.; Cupric, N.U.; Golubovic, S.D. Calculated and experimental analysis of cause of the appearance of cracks in the running bogie frame of diesel multiple units of Serbian railways. Eng. Fail. Anal. 2010, 17, 236–248. [Google Scholar] [CrossRef]
  12. Wang, B.J.; Sun, S.G.; Ma, S.; Wang, X. Fatigue damage and reliability assessment of subway train bogie frames under operating conditions. Adv. Mech. Eng. 2020, 12, 1687814020903590. [Google Scholar] [CrossRef] [Green Version]
  13. Han, J.W.; Kim, J.D.; Song, S.Y. Fatigue strength evaluation of a bogie frame for urban maglev train with fatigue test on full-scale test rig. Eng. Fail. Anal. 2013, 31, 412–420. [Google Scholar] [CrossRef]
  14. Wang, B.J.; Li, Q.; Ren, Z.S.; Sun, S.G. Improving the fatigue reliability of metro vehicle bogie frame based on load spectrum. Int. J. Fatigue 2020, 132, 105389. [Google Scholar] [CrossRef]
  15. Hu, Y.X.; Andy, A.C.; Chen, L.; Li, Y.P. Failure analysis of fractured motor bolts in high-speed train due to cardan shaft misalignment. Eng. Fail. Anal. 2021, 122, 105246. [Google Scholar] [CrossRef]
  16. Shen, H. Failure analysis on fracture of subway train bogie frame. Mater. Mech. Eng. 2013, 37, 103–106. [Google Scholar]
  17. Xu, G.B. Analysis and preventive measures of fatigue cracking of suspension beam for metro motor. Foundry 2019, 68, 1411–1416. [Google Scholar] [CrossRef]
  18. Seo, J.W.; Hur, H.M.; Jun, H.K.; Kwon, S.J.; Lee, D.H. Fatigue design evaluation of railway bogie with full-scale fatigue test. Adv. Mater. Sci. Eng. 2017, 2017, 5656497. [Google Scholar] [CrossRef] [Green Version]
  19. Lu, Y.H.; Zheng, H.Y.; Zeng, J.; Chen, T.L.; Wu, P.B. Fatigue life reliability evaluation in a high-speed train bogie frame using accelerated life and numerical test. Reliab. Eng. Syst. Saf. 2019, 188, 412–432. [Google Scholar] [CrossRef]
  20. Fu, D.L.; Wang, W.J.; Dong, L. Analysis on the fatigue cracks in the bogie frame. Eng. Fail. Anal. 2015, 58, 307–319. [Google Scholar] [CrossRef]
  21. Chen, B.Z.; Zhi, P.P.; Li, Y.H. Fatigue strength analysis of bogie frame in consideration of parameter uncertainty. Frattura Int. Struct. 2019, 48, 385–399. [Google Scholar] [CrossRef]
  22. Li, F.S.; Wang, J.B.; Shi, H.L.; Wu, P.B. Research on causes and countermeasures of abnormal flexible vibration of car body for electric multiple units. J. Mech. Eng. 2019, 55, 178–188. [Google Scholar] [CrossRef]
  23. Ali, N.B.H.; Rhode-Barbarigos, L.; Albi, A.A.P.; Smith, I.F.C. Design optimization and dynamic analysis of a tensegrity-based footbridge. Eng. Struct. 2010, 32, 3650–3659. [Google Scholar] [CrossRef]
  24. Zhi, P.P.; Li, Y.H.; Chen, B.Z.; Li, M.; Liu, G.N. Fuzzy optimization design-based multi-level response surface of bogie frame. Int. J. Struct. Integr. 2019, 10, 134–148. [Google Scholar] [CrossRef]
  25. Zhu, S.P.; Keshtegar, B.; Trung, N.T.; Yaseen, Z.M.; Bui, D.T. Reliability-based structural design optimization: Hybridized conjugate mean value approach. Eng. Comput. Ger. 2021, 37, 381–394. [Google Scholar] [CrossRef]
  26. Zhu, S.P.; Keshtegar, B.; Tian, K.; Trung, N.T. Optimization of load-carrying hierarchical stiffened shells: Comparative survey and applications of six hybrid heuristic models. Arch. Comput. Method. Eng. 2021, 28, 4153–4166. [Google Scholar] [CrossRef]
  27. Gao, Y.H.; Liu, Q.P.; Wang, Y.d.; Zhao, W.Z. Lightweight design with weld fatigue constraints for a three-axle bogie frame using sequential approximation optimization method. Int. J. Veh. Des. 2017, 73, 3–19. [Google Scholar] [CrossRef]
  28. Szolc, T. Simulation of dynamic interaction between the railway bogie and the track in the medium frequency range. Multibody Syst. Dyn. 2001, 6, 99–122. [Google Scholar] [CrossRef]
  29. Yang, G.X.; Wang, M.; Li, Q.; Ding, R. Methodology to evaluate fatigue damage of high-speed train welded bogie frames based on on-track dynamic stress test data. Chin. J. Mech. Eng. 2019, 32, 193–200. [Google Scholar] [CrossRef] [Green Version]
  30. Hoh, H.J.; Xiao, Z.M.; Luo, J. On the plastic zone size and crack tip opening displacement of a Dugdale crack interacting with a circular inclusion. Acta Mech. 2010, 210, 305–314. [Google Scholar] [CrossRef]
  31. Echard, B.; Gayton, N.; Lemaire, M.; Relun, N. A combined importance sampling and Kriging reliability method for small failure probabilities with time-demanding numerical models. Reliab Eng. Syst. Saf. 2013, 111, 232–240. [Google Scholar] [CrossRef]
  32. Cadini, F.; Santos, F.; Zio, E. Passive systems failure probability estimation by the meta-AK-IS 2 algorithm. Nucl. Eng. Des. 2014, 277, 203–211. [Google Scholar] [CrossRef]
  33. Tran, D.T. An improved non-dominated sorting genetic algorithm-II (ANSGA-II) with adaptable parameters. Int. J. Intell. Syst. Technol. Appl. 2009, 7, 347–369. [Google Scholar] [CrossRef]
  34. Huang, Y.K.; Xue, X.S.; Jiang, C. Optimizing ontology alignment through improved NSGA-II. Discrete Dyn. Nat. Soc. 2020, 2020, 8586058. [Google Scholar] [CrossRef]
Figure 1. Wheelset lifting fracture: (a) full view of the lifting mechanism; (b) fractured lifting position.
Machines 10 00397 g001
Figure 2. Macro-morphology of the fractured lifting mechanism: (a) macro-morphology of the lifting mechanism; (b) macro-morphology of the fracture.
Machines 10 00397 g002
Figure 3. SEM morphologies of the fractured lifting mechanism: (a) micro-morphology of the fracture at 11× magnification; (b) micro-morphology of the fracture at 300× magnification.
Machines 10 00397 g003
Figure 4. EDS coating analysis of the fracture.
Machines 10 00397 g004
Figure 5. Micro-morphology of the “ridge” region of the fractured lifting mechanism: (a) micro-morphology of a stepped stripe at 1500× magnification; (b) micro-morphology of the “ridge” region at 55× magnification; (c) micro-morphology of the “ridge” region at 1000× magnification.
Machines 10 00397 g005
Figure 6. Microstructure of the fractured wheelset lifting mechanism: (a) nonmetallic inclusions of the fractured lifting mechanism at 100× magnification; (b) micro-morphology of the fracture source at 500× magnification; (c) micro-morphology of the fracture’s center at 500× magnification.
Machines 10 00397 g006
Figure 7. Measuring point locations: (a) one side view; (b) another side view.
Machines 10 00397 g007
Figure 8. Stress–time history of a measuring point on outer variable section transition arc.
Machines 10 00397 g008
Figure 9. Measured stress amplitude.
Machines 10 00397 g009
Figure 10. Spectral diagram of the wheelset lifting mechanism.
Machines 10 00397 g010
Figure 11. FE model of the wheelset lifting mechanism.
Machines 10 00397 g011
Figure 12. Stress contour plots of the wheelset lifting mechanism: (a) LC01; (b) LC02; (c) LC03; (d) LC04; (e) LC05; (f) LC06; (g) LC07; (h) LC08.
Machines 10 00397 g012
Figure 13. Modal contour plots of the wheelset lifting mechanism: (a) 1st modal; (b) 2nd modal; (c) 3rd modal; (d) 4th modal; (e) 5th modal; (f) 6th modal.
Machines 10 00397 g013
Figure 14. Schematic of the design variables’ location.
Machines 10 00397 g014
Figure 15. Determination of maximum and minimum principal stresses: (a) maximum principal stress; (b) minimum principal stress.
Machines 10 00397 g015
Figure 16. Robust fatigue optimization process based on the double-layer Kriging surrogate model.
Machines 10 00397 g016
Figure 17. Comparison of prediction results of the first-layer Kriging surrogate model: (a) surrogate model of σ a ; (b) surrogate model of σ m .
Machines 10 00397 g017
Figure 18. Comparison of prediction results of the second-layer Kriging surrogate model: (a) surrogate model of σ σ a ; (b) surrogate model of σ σ m ; (c) surrogate model of μ σ a ; (d) surrogate model of μ σ m .
Machines 10 00397 g018
Figure 19. Comparison of the Pareto optimal solution set.
Machines 10 00397 g019
Figure 20. Dominance degree distribution of the Pareto optimal solution set.
Machines 10 00397 g020
Figure 21. Optimized structure of the wheelset lifting mechanism.
Machines 10 00397 g021
Figure 22. Modal comparison of the wheelset lifting mechanism before and after optimization.
Machines 10 00397 g022
Table 1. List of measuring points.
AreaDescriptionMeasuring Points
AOuter variable section transition arcD01
BInner variable section transition arcD02
COuter variable section excessive arc rootD03
DVariable section at the upper part of the circular holeD04–D05
Table 2. Cumulative fatigue damage and residual life.
Measuring
Points
Cumulative Fatigue DamageResidual LifeMeasuring PointsCumulative Fatigue DamageResidual Life
D01-A1.05 × 10−4Meets requirementsD03-B2.48 × 10−4Meets requirements
D01-B2.11 × 10−4Meets requirementsD04-A4.12 × 1018.74 × 104
D02-A1.69 × 10−2Meets requirementsD04-B4.45 × 1018.09 × 104
D02-B4.49 × 10−1Meets requirementsD05-A1.24 × 10−1Meets requirements
D03-A7.38 × 10−4Meets requirementsD05-B1.123.23 × 106
Table 3. Combined load cases of static strength.
Load CaseLongitudinal AccelerationLateral AccelerationVertical Acceleration
LC0110 × g10 × g71 × g
LC0210 × g−10 × g71 × g
LC03−10 × g10 × g71 × g
LC04−10 × g−10 × g71 × g
LC0510 × g10 × g−69 × g
LC0610 × g−10 × g−69 × g
LC07−10 × g10 × g−69 × g
LC08−10 × g−10 × g−69 × g
Table 4. The procedure of using the improved NSGA-II for design optimization.
Improved NSGA-II Algorithm
1 :   P 0 = sine - chaotic - map x 1 , x 2 , , x n
2 :   t = 0 ,   P t = fast - nondominated - sort P 0
3 :   while     t < g e n
4 :    P t = binary - tournament - selection P t
5 :    Q t =
6 :    for   each   p P t do
7 :    P c = adaptive - dynamic - crossover - probability t , g e n
8 :     if   r a n d 1 P c then
9 :     q = cauchy - distribution - crossover p
10 :      Q t = Q t q
11 :      end if
12 :      P m = adaptive - dynamic - mutation - probability t , g e n
13 :      if   r a n d 2 P m then
14 :      q = cauchy - distribution - mutation p
15 :      Q t = Q t q
16 :      end if
17 :    end for
18 :    R t = P t Q t
19 :    F = fast - nondominated - sort R t
20 :    P t + 1 =   and   i = 1
21 :    until   P t + 1 + F i N
22 :     F i = crowding - distance - assignment F i
23 :     P t + 1 = P t + 1 F i
24 :     i = i + 1
25 :    end until
26 :    Sort F i , < n
27 :    P t + 1 = P t + 1 F i 1 : N P t + 1
28 :    t = t + 1
29 :   end while
Table 5. Numerical characteristics of the optimization variables.
Optimization VariablesSignUnitLower LimitMean ValueUpper Limit
Lifting hole width L 1 mm586062
Lifting hole length L 2 mm100106112
Lifting root width L 4 mm9198105
Lifting outline width L 5 mm125128130
Lifting thickness T 1 mm151820
Table 6. DoE design and response values of the first-layer Kriging surrogate model.
Run NumberOptimization VariablesResponses
L 1 L 2 L 4 L 5 T 1 σ a σ m
160.00106.0098.00127.5017.500.432.33
260.00106.0098.00127.5015.000.382.03
360.00106.0098.00127.5020.000.472.63
460.00100.0098.00127.5017.500.462.30
2460.57104.3099.98128.2116.790.382.15
2560.57104.3096.02128.2118.210.512.36
2660.57107.7096.02128.2116.790.302.10
2760.57107.7099.98128.2118.210.402.28
Table 7. DoE design and response values of the second-layer Kriging surrogate model.
Run NumberOptimization VariablesResponse
L 1 L 2 L 4 L 5 T 1 σ σ a σ σ m μ σ a μ σ m
161.58102.25103.83125.2718.362.2270.08140.41400.00354
260.40107.3891.42125.9816.942.1220.08040.41200.01110
361.22109.5291.28128.3216.042.2780.08370.41500.00502
2458.82101.9998.89129.4216.7616.7602.18600.09190.411
2558.24100.17104.39127.3818.1318.1302.25300.08350.414
2661.42105.3693.827125.3216.3416.3402.07900.04620.410
Table 8. Comparison of optimization results.
Optimization Method L 1 L 2 L 4 L 5 T 1
Original NSGA-II62.00103.00105.00126.0018.00
Improved NSGA-II60.00110.00103.00124.0017.50
Publisher’s Note: MDPI stays neutral with regard to jurisdictional claims in published maps and institutional affiliations.

