Abstract
With the increasing speed of aviation gear, windage loss has been the main component of power loss. Reducing windage is of great significance to improving the transmission efficiency of aviation spiral bevel gear. Firstly, the calculation model of enclosed spiral bevel gear was established, and the basic physical mechanism of windage power loss was illustrated by numerical simulation, so as to obtain the mechanical and energy characteristics of windage loss. Then, the influence of the geometry and clearance parameters of the shroud on the windage loss was studied by orthogonal test, variance analysis and optimization design. The mechanism of the shroud to reduce the windage loss under the multi-factors was also studied, and their interaction was obtained. The results show that the tooth surface clearance, heel clearance and meshing opening are significant factors, and the most significant factor is the heel clearance. The non-significant factor is the interaction of each factor. The least significant factor is the toe clearance. In other words, the windage power loss can be reduced to the greatest extent by simultaneously reducing the meshing opening of the shroud and the clearance value between shroud and the surface of the gear. Finally, based on the mechanism of reducing windage loss of shroud, the optimization design principle affecting the structural performance of shroud is put forward, which provides theoretical guidance for the practical application of shroud in windage reduction engineering.
1. Introduction
Spiral bevel gears are used for transmission between two intersecting shafts. They have the advantages of high bearing capacity, light weight, stable transmission, high efficiency, low noise, good lubricity, etc., and are widely used in high-speed gear transmission systems such as aviation systems, automobiles, and ships [1]. When the gear linear speed exceeds 50 m/s, the teeth of the high-speed rotating gear will form a strong forced vortex, high-velocity field and centrifugal force field in the fluid domain of the gear box and then generate pressure and viscous force on the gear surface, resulting in huge windage power loss, which is the main component of the power loss of high-speed gear transmission [2,3]. In order to achieve energy conservation and emission reduction targets, windage reduction is increasingly required for gear transmission efficiency. Therefore, for the high-speed aviation spiral bevel gear, the influence of windage loss on transmission efficiency must be considered.
Lord [4] attributed 40% of the typical failure of gearbox power loss to meshing loss, 50% to bearing loss and 10% to windage and lubricating-oil-churning loss. However, a large number of experiments show that with the increase in gear linear velocity, the loss of windage and lubricating oil churning becomes significant. Handschuh [5] pointed out that when the gear linear speed reaches 125 m/s, the windage loss of the gearbox accounts for approximately half of the total power loss and can dominate other loss mechanisms.
Windage loss refers to the loss of aerodynamic resistance (including inertial resistance and viscous resistance) caused by the rotation of gears in the air or oil–gas mixture [6]. Scholars [7,8] have proposed methods for predicting windage losses and provided potential strategies to reduce them. Diab and Ville [9,10] experimentally studied the windage loss of rotating spur gears in the air and obtained the analytic formula of the dimensionless torque coefficient of windage loss by dimensional analysis and quasi-analytical method, respectively. Anderson and Loewenthal [11,12] proposed an approximate method to estimate the gear windage loss, which considered gear structure, working conditions, fluid properties, etc., and determined gear radius and rotational speed as key parameters to determine the windage loss. However, the linear velocity of the experimental gear was limited to 40 m/s. Eastwick [13] studied the parameters affecting the windage loss through experiment and theoretical technology, including gear size, geometry, structural form and pitch speed. He believed that the windage loss could be reduced mainly from three aspects: radial pumping effect, axial pumping effect and leakage flow related to the front tooth wake. Ruzek [14] measured the windage power loss of a disc, spur gear pair and helical gear pair by setting up a simple experimental platform. In order to avoid the interference of gear mesh mechanical power loss, only the influence of air pressure and viscous force on the windage of gear tooth surface and end face were considered. Lord [4] designed a test facility for measuring the windage power loss of spur gears. The diameter range of spur gears he tested was 90~200 mm, and the speed was 25,000 rpm. The conclusion indicates that when the clearance is 1 mm, the windage power loss will be reduced to the lowest level. Compared to the spur gear without shroud, the windage loss would be reduced by 75%. Dawson [15] pointed out that for spur gears that rotate freely in air, air enters the teeth from both sides. However, for bevel gears, the air enters the teeth from the toe end and the tooth surface and is gradually thrown out along the direction of the tooth length. If the shrouds were arranged on the toe and heel faces, tooth surfaces and axial directions, the fluid mass flow rate through the shrouds into the gear would be reduced, so that the efficiency of the shroud to pump fluid would be reduced, thereby reducing the windage power loss. Johnson [16] experimentally studied the windage loss of a single spiral bevel gear under different working conditions in air single-phase flow, indicating that the shroud can reduce the windage power consumption by about 70%. He pointed out that the characteristics of a spiral bevel gear are similar to those of a centrifugal fan in many aspects. Winfree [17] obtained the windage loss data of a spiral bevel gear through a large number of experiments. The results show that if a baffle is installed at the toe of the tooth, the windage power loss will be reduced by 70%. If a shroud is installed, the windage power loss will be reduced by 79%. If the linear speed of the gear exceeds 50.8 m/s, it is necessary to install the shroud. He carried out experiments on the windage loss of a single spiral bevel gear to determine the measures to reduce the windage loss and then applied these theoretical methods to the meshed spiral bevel gear. The results show that the optimized shroud has an obvious effect on reducing the windage loss [18].
The detailed flow mechanism of the fluid around the gear will help with designing an efficient shroud configuration to reduce air power loss. With the development of computer technology, the computational fluid dynamics methods have been used to predict the flow field characteristics in the gearbox [19,20,21]. Hill [22] specifically described the important physical characteristics of the three-dimensional flow field near the tooth region, and the influence of the shroud geometry structure on a single spur gear was studied by CFD. Comparing to the experimental data from NASA, it was found that the gear windage power loss is mainly due to the pressure on the involute gear surface rather than the shear force, with or without a shroud. Massini [23] first measured the related parameters of the windage loss of a single spur gear under free lubrication by experiment and then measured the velocity and vector diagram of flow fluid by using Particle Image Velocimetry (PIV) technique. The results verified that CFD numerical simulation is an effective tool for predicting windage power loss. This was one of the first experiments to realize the visualization of flow field near high-speed gear by PIV technology. Simmons [24] studied the windage power loss of a single spiral bevel gear (with or without shroud) and meshing gear pairs by experimental and numerical simulation analysis. The results showed that the Cm-Re characteristics of bevel gears with shroud were similar to those of cones with shroud. Rapley [25] conducted parametric research on the clearance of spiral bevel gear at the inlet, outlet and end face of shroud by CFD. The torque coefficient and static pressure obtained by simulation analysis were close to the experimental results.
It is worth noting that the current research on gear windage loss is mainly focused on macro-fluid mechanisms and geometric parameters. There are few comprehensive studies on the effects of various shroud combinations on the flow characteristics and aerodynamic resistance loss characteristics of spiral bevel gears. The research on the windage loss characteristics of spiral bevel gears and the windage reduction mechanism of shroud is not deep enough, and a feasible structural optimization design method of shroud in practical engineering application has not been put forward. In this paper, aiming at the input-stage spiral bevel gear transmission in the main reducer of a helicopter, the mechanism of reducing the windage loss of the shroud is studied by CFD based on the mechanical and energy characteristics of the windage loss of the spiral bevel gear. Based on that, the structural optimization design principle of the shroud is proposed.
2. Computational Fluid Dynamics Analysis Method
2.1. Fluid Governing Equations
The spiral bevel gears involved in this calculation are placed in a given gearbox. The fluid domain is the sum of the region between the gear pair and the shroud and the region between the shroud and the gearbox. Transient analysis is used to solve the flow field. The governing equations of fluid domain are as follows [26]:
(1) Mass conservation equation
(2) Momentum conservation equation
where i, j = 1, 2,3 for three-dimensional flows; ui is the velocity of i th coordinate axis; ρ is the fluid density; t is time; p is the fluid pressure; Smi represents external forces; τij is the stress tensor.
The energy conservation equation is not considered, as it is assumed that thermal influences can be neglected in no-load operating conditions [27].
2.2. Turbulent Model Equation
Two important dimensionless numbers (Reynolds number and Mach number) in the flow field are the main parameters affecting fluid motion.
(1) The Reynolds number is:
where ρ, v, l and μ are the density, flow velocity, characteristic length and dynamic viscosity coefficient of the fluid, respectively.
The speed of spiral bevel gear in the input stage of a helicopter main reducer can go up to tens of thousands of revolutions per minute, and the Reynolds number can go up to 106, so it is easy to achieve a strong turbulent flow pattern.
(2) The Mach number is:
where v and a are the velocity of the fluid and local sound velocity, respectively.
Due to the characteristics of high-speed rotation of the aerospace gear, the SST (Shear Stress Transfer) k-ω turbulence model of the two-equation model based on the vortex viscosity hypothesis is selected. The SST k-ω model has good application characteristics in the inverse pressure gradient and separation flow, so it is used to describe accurately the gear tooth surface’s resistance to and separation effect on the airflow [28].
According to [28], the turbulent kinetic energy equation (k equation) and turbulent dissipation rate equation (ω Equation) are:
where:
where k is turbulent kinetic energy; ω is dissipation rate; σk and σω are Prandtl numbers corresponding to turbulent kinetic energy k and dissipation rate ω, respectively; β, β3, α3, a1 are the model correlation constants; xi and xj are the cartesian coordinate displacement component; ui is the velocity component; Pk is the turbulence generation term caused by viscous forces; F1 and F2 are mixed functions; S is the strain rate tensor value; Sk and Sω are user-defined generalized source items.
2.3. The Dynamic Mesh Model
Because of the complex shape change of the flow field in the process of gear motion, in order to be able to more accurately describe the movement of the flow field, dynamic mesh technology is used to simulate the flow field movement. The dynamic mesh can automatically adjust the distribution of the internal grid nodes according to the motion and deformation of the boundary. The flow field around the gear changes with time when the gear rotates at high speed.
For the unsteady flow problem, the solution domain can be divided into i interconnected grids, and the volume of each grid is Δ(vol)i. If each grid has j surfaces, the surface area of the grid is represented by Si,j. For each grid control body, the mass conservation equation in integral form is [29]:
where Si is the perimeter of the i-th grid; is the circumferential boundary with direction; is the flow velocity vector; is the velocity vector of the solution domain perimeter.
During the solution, the result of the grid boundary movement causes the mesh volume changes. For each grid, there is a geometric conservation equation of the integral form:
When solving the flow field density, on the common boundary of adjacent grids is the same, and each time step Δt is advanced:
The average mesh density (ρi) of this time step is:
3. Calculation Model of Flow Field in Gearbox
3.1. CFD Model
The basic parameters of aviation spiral bevel gear in the helicopter main reducer are shown in Table 1.

Table 1.
Basic parameters of spiral bevel gear.
Due to the complex structure of the helicopter main reducer, in order to avoid the interference of other parts in the reducer, the windage loss of spiral bevel gear in the closed gearbox and the windage reduction mechanism of shroud are studied. In order to reduce the complexity of numerical simulation and improve the simulation efficiency, the gearbox structure is subjected to a simplification (ignoring web plate hole, bearings, flange structure, fixings, etc.). The top-down parametric modeling method is adopted in UG. According to Litvin local synthesis method [30], several tooth surface coordinate points can be obtained from the tooth surface equation of the gear pairs, and then the tooth surface shape can be obtained by fitting these coordinate points, so as to establish the model of spiral bevel gear. The final three-dimensional model of the gearbox and the coordinate system is shown in Figure 1.
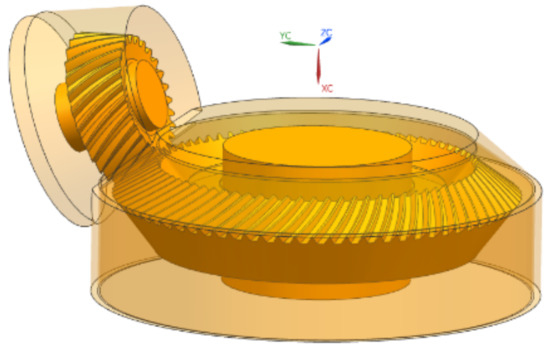
Figure 1.
Three-dimensional model of spiral bevel gears.
The shroud is installed between the gear and the gearbox to completely cover the gear. Regardless of the influence of the tiny structure of the gearbox, the flow field model of the computational fluid domain can be obtained through the Boolean operation between the gearbox and the gear pair, as shown in Figure 2. As can be seen from Figure 2, when installing the shroud, the fluid domain is composed of two parts: inner and outer fluid domains.
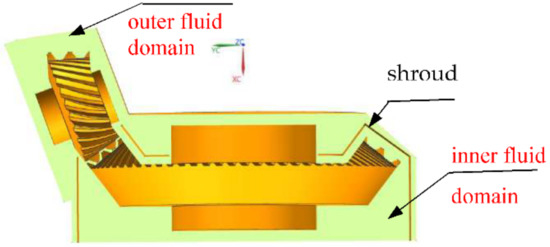
Figure 2.
Computational flow domain model with shroud.
3.2. Meshing
Due to the complex tooth shape of spiral bevel gear, the fluid deformation at the tooth surface is large. In order to facilitate the reconstruction of the flow field mesh and make the mesh better adapt to the geometry, the unstructured tetrahedral element mesh of the initial model is discretized based on the finite volume method. In this case, mesh was divided in ANSYS-ICEM CFD software. To improve the precision and reliability of the simulation results, verification of the mesh dependency has been undertaken to ensure that discretization errors are quantified and minimized. This was done by comparing the windage moment at a rotating speed of 10,000 rpm. The number of these meshes and the windage moment values measured are shown in Figure 3.
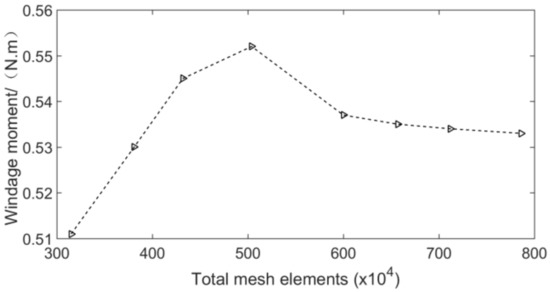
Figure 3.
Windage moment against total mesh elements.
As shown in Figure 3, in order to prevent the mesh from being too dense and increasing the computation amount, and to avoid the mesh being too sparse and decreasing precision, the local encryption optimization was carried out for the mesh near the tooth surface, the heel and toe faces and the gear shaft surface. There are at least 2~3 layers of mesh elements at the minimum gap of the gear meshing area. At the same time, in order to obtain high-quality mesh, it is necessary to smooth the mesh. The maximum mesh size of the fluid domain is 5 mm, and the boundary layer size is 0.5 mm at tooth surface and end face. The thickness of boundary layer is 5 layers. Finally, the number of mesh elements in the entire fluid domain of the calculation model is about 7.12 million, and there are about 0.89 million nodes.
3.3. Boundary Conditions and Solution Settings
When the gear rotates at a high speed, oil injection is generally used to lubricate and cool the gear teeth. At this time, the internal flow field of the gearbox is composed of two-phase flow of lubricating oil and air. This paper mainly studies the formation mechanism of windage and the windage reduction characteristics of the shroud. In order to reduce the computing time and computer resources, consider using a single medium (air) under average conditions instead of oil–gas two-phase flow.
The CFD dynamic mesh technology is used to solve the model, and the mesh file is imported into FLUENT for solution. Assuming that air is incompressible fluid, the pressure-based coupling algorithm solver under transient analysis is used. The surface of the gear and gearbox are set as the fixed wall condition without sliding, and the near wall area is treated by the wall function method. The tooth profile of the gear pair is set as the motion boundary through the user-defined function. The speed of pinion and gear are 20,900 rpm and 7626 rpm, respectively. The rotation direction is shown in Figure 1. The dynamic mesh item is activated, and the Remeshing and Smoothing items are turned on. All the settings are left on Smoothing as default. In Remeshing, the size function is turned on, and the minimum reconstruction size is set to the minimum mesh cell size of the gearbox. Considering the mesh on the deformed boundary interface, Local Face is turned on, and the other items are left as default. In order to improve the calculation speed and accuracy, the momentum equation adopts the second-order upwind discrete scheme, while the turbulent kinetic energy and turbulent dissipation use the first-order upwind discrete scheme. At the same time, in order to improve the convergence, the relaxation factor is adjusted appropriately. The time step of transient analysis is set as 2 × 10⁻⁶ s, and the number of steps is 10,000. After initialization, the iterative solution is carried out.
4. Windage Loss Characteristics of Spiral Bevel Gears
All the analytical results in this section are obtained when the gears are unshrouded.
4.1. Windage Formation Mechanism of Gears
When the gear is rotating at high speed, the gear pushes and drags the fluid of the surface to form a strong air vortex. Figure 4 shows the velocity vector of the air flow field around the gear. It can be seen from Figure 4 that the flow direction of the fluid is opposite to the rotation direction of the gear.
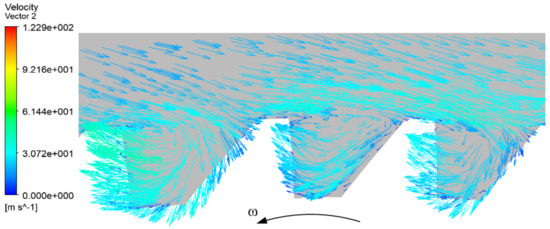
Figure 4.
Velocity vector of fluid around gear.
As can be seen from Figure 4, the gear drives the fluid around it to flow at a high speed. The fluid far from the tooth tip continues to flow in the original direction, while the fluid near the tooth tip is sucked into the gap between the teeth and forms a vortex in the tooth space. The vortex moves in reverse in the tooth space and collides with one side tooth profile, resulting in different pressure distribution on both sides of a tooth. One tooth surface is shown as pressure surface (as shown in Figure 5a), and the other tooth surface appears as suction surface (as shown in Figure 5b).
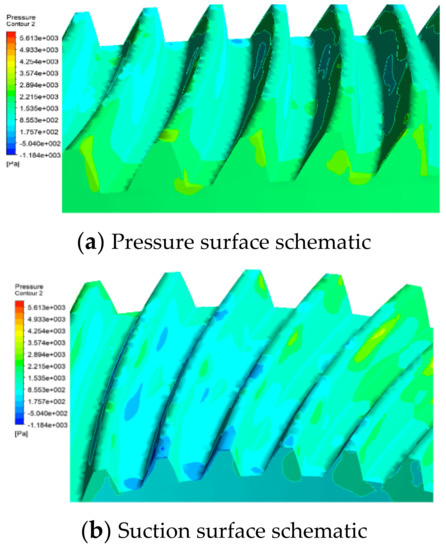
Figure 5.
Pressure distribution of fluid on teeth.
Figure 5 shows that fluid exerts different pressure on the two opposite tooth surfaces of each tooth, that is, there is differential pressure force. This differential pressure force introduces a torque opposite to the rotation direction of the gear. In order to keep the gear rotating at a constant speed, the corresponding power needs to be consumed, which is expressed as the windage power loss during the gear rotation.
4.2. Mechanical Characteristics of Gear Windage Loss
The gear windage power loss is caused by the interaction force between the fluid and the gear, which can be divided into two parts: the pressure of the fluid on the surface of the gear and the friction force (or viscous force). When the gear rotates at a high speed in the flow field, the pressure distribution of the fluid on the gear tooth surface is as shown in Figure 6.
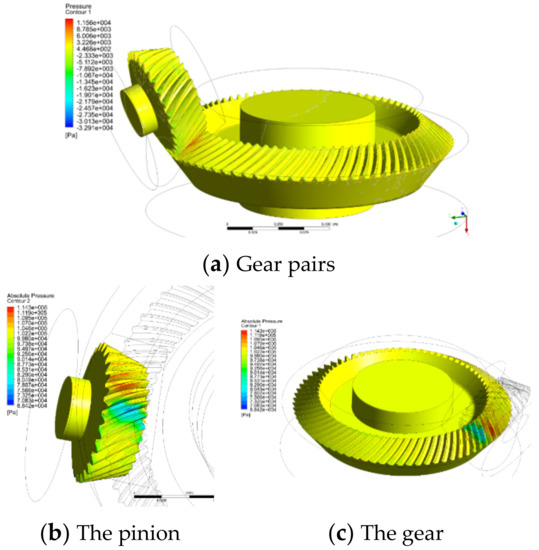
Figure 6.
Pressure distribution of fluid on gears.
During the meshing movement of the gear pair, the maximum pressure appears on the teeth in the meshing area. Since the meshing zone of the spiral bevel gear is point meshing, a possible reason for this situation is that the air in the tooth space is squeezed while the tooth is gradually entering into the meshing area, resulting in a large pressure value here. The pressure on the surface of the gear teeth in the out-of-meshing area is small and negative. That is because the air around the teeth to be separated has been removed or squeezed out. The space between the gear teeth increases rapidly, resulting in a smaller pressure value here.
At the same time, due to the viscosity of the fluid, when the gear rotates in the flow field, it will also be affected by the resistance force (i.e., frictional and/or viscous) of the fluid, as shown in Figure 7. This viscous force, like the differential pressure force, will also cause reverse torque, thus consuming the system power.
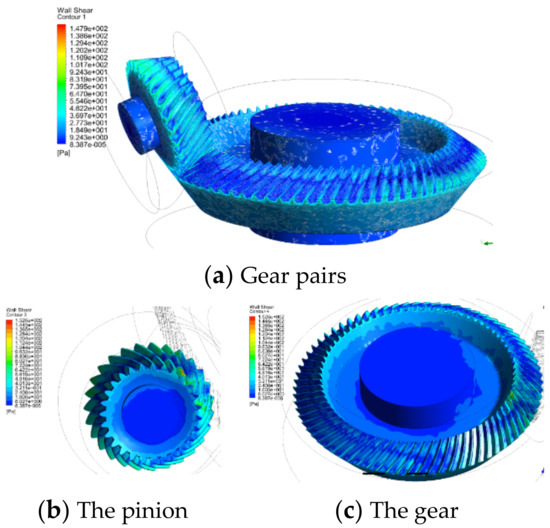
Figure 7.
Viscous force distribution of fluid on gears.
Comparing Figure 6 and Figure 7, it can be seen that the pressure of fluid on gear is 2~3 orders of magnitude higher than that of viscous force, whereby the gear windage loss is mainly caused by the pressure of fluid on gear, while the power consumed by viscous force accounts for only a small part. The windage torque of the gear in CFD post-processing module is extracted, and the variation trend of differential pressure moment and viscosity moment with the rotational speed are plotted on the same diagram, as shown in Figure 8.
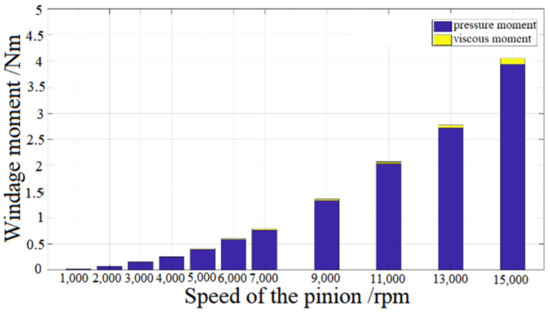
Figure 8.
Moment compared against different speeds of the pinion.
When the gear rotation drives the surrounding air to flow, the effects of fluid inertia and viscosity on the total power loss are differential pressure torque and viscous torque, respectively. Figure 8 shows that the differential pressure effect is the main contributor to the power loss of the entire windage. With the increase in the rotational speed, the flow field velocity increases, the Reynolds number increases, and the turbulence becomes more intense. The more intense the fluid action on the gear, the greater the differential pressure torque and viscous torque.
The windage power loss of spiral bevel gear is mainly composed of the windage loss of tooth surface and heel and toe faces. In the CFD post-processing module, the fluid differential pressure moment and viscous moment on each surface of the gear and its rotating shaft are obtained. The composition and calculated values of the windage moment on each surface of the gear are shown in Table 2.

Table 2.
Composition of total windage moment of gear.
It can be seen from Table 2 that the pressure torque and viscous torque on the tooth surface work together, while only viscous torque is on the end face. The torque values of the heel and toe faces of the gear are one order of magnitude smaller than that of the tooth surface. Therefore, the tooth surface torque is the main source of the windage torque of the gear, accounting for more than 95% of the total windage loss.
4.3. Energy Characteristics of the Gear Windage Loss
From the mechanical point of view, the power loss of the gear windage loss is caused by viscous force and differential pressure force. From the perspective of energetics, the energy loss of gear windage power is partially converted into thermal energy in the fluid and gear tooth surface, heel and toe surface and gearbox wall surface. The other part is dissipated into the turbulent movement of fluid in the gearbox. The flow field distribution in the gearbox is shown in Figure 9.
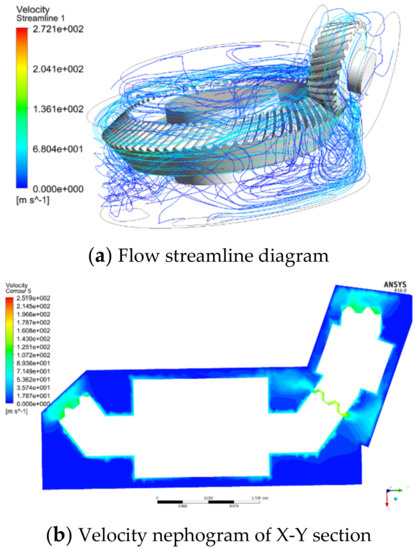
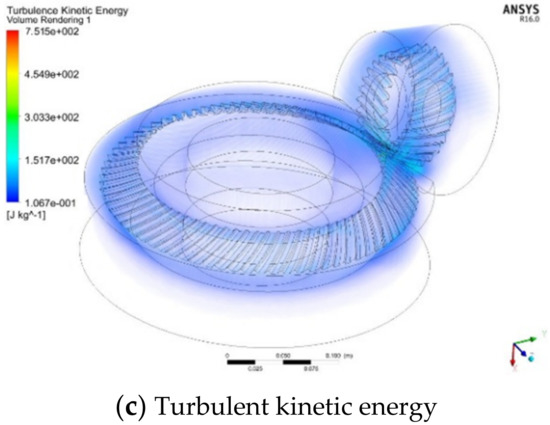
Figure 9.
Flow field distribution inside gearbox.
The air flow in the chamber where the gear is located is relatively stable, and the turbulent movement is relatively mild, generally presenting a motion state of slow flow with the rotation of the gear. The turbulent motion of the air in the chamber where the pinion is located is more intense and mainly concentrates on the side along the tangential direction of the pinion at the meshing point of the gear pair. It can be seen from the velocity streamline that the fluid rotates along with gears in the direction of gear rotation and converges at the top of the gearbox, after which most of the fluid enters the mainstream of the pinion. There is no steady area in the entire gearbox due to the turbulent state of the fluid.
The gear windage power loss is characterized by the kinetic energy loss caused by the windage moment during the high-speed rotation. When the gearbox is closed, the kinetic energy lost is converted into heat energy mainly through the friction between the fluid and the solid wall surface and the viscous force between the fluid particles. Since the friction between fluid and solid wall is very low, most of the energy is converted into heat energy through the viscous force between fluid particles, resulting in the increase in fluid turbulent kinetic energy.
5. Mechanism of Reducing the Windage Loss of Shroud and Structural Design Principle
5.1. Calculation of Gear Windage Power Loss
The windage torque exerted by the fluid on all surfaces of the gear can be obtained using CFD-POST. According to the mechanism of gear windage power loss, the viscous force and pressure on the surface of each cell are different. Therefore, the windage torque on a certain wall can be obtained by calculating the vector sum of the torque of the pressure and viscous force on the specified axis on all elements of the wall. The calculation formula is:
where T is the windage moment of the gear (N·m); Fp is the pressure vector on the element surface (N); Fν is the viscous force vector on the element surface (N); r is the setting axis vector; n is the number of cells on the selected surface.
The formula of the windage power loss of gear pair is:
where Twf, Twt, Twh and Tws are the windage torque of the tooth surface, the toe surface, the heel surface and the gear shaft surface, respectively; Ω is the rotation speed (r/min); i takes value 1 to indicate the pinion and 2 to indicate the gear.
5.2. Orthogonal Test Design
The shroud divides the fluid computing domain inside the gear box into two fluid domains, as shown in Figure 2. During the simulation, fluid can connect the two fluid domains through the meshing opening of the shroud and the gap between the shroud and the gear shaft for material and energy exchange.
The orthogonal test can use the less representative data to analyze the influence of various factors on the test results. In orthogonal test: windage moment is the test index; the clearance between shroud and gear surface, namely tooth surface clearance (A), heel clearance (B), toe clearance (C) and meshing opening (D), are the test factors. The physical significance is shown in Figure 10.
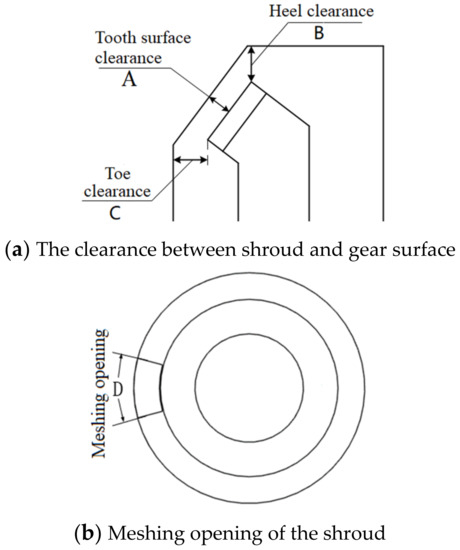
Figure 10.
Schematic diagram of test factors.
Variance analysis method is adopted to determine the influence of each factor. First, the fluctuation range of each factor is determined, as shown in Table 3. Since the three clearance values are adjacent to each other in spatial structure, that is, the values of factors B and C are restricted by factor A, the correlation relationship between factors should be considered. The interaction between factor A and B is denoted as A × B, and the interaction between factor A and C is recorded as A × C, as shown in Table 4.

Table 3.
Factor levels.

Table 4.
Basic parameters of the header.
The standard orthogonal table is established, and the numerical simulation analysis of the combination of 8 groups’ factors is carried out to obtain the corresponding calculated values of windage moment, as shown in Table 5.

Table 5.
Orthogonal table of simulation analysis results.
Then, the windage moment values of each factor at each level are added, denoted as Si. Then its average value is calculated and recorded as . Finally, the range of each factor is calculated and recorded as Rj. The influence of each factor on the test results can be obtained by arranging the range values of each factor at each level in order, as shown in Table 6.

Table 6.
Analysis of variance.
As shown in Table 6, the primary and secondary order of the influence of various factors on the windage power loss of gear is B > D > A > A × B > A × C > C. The significant factors are B, D and A, that is, the heel clearance, meshing opening and the tooth surface clearance. The most significant factor is B, the interaction factors of A × B and A × C are not significant factors, and C is the least significant factor. The optimal level of each factor is 2. In other words, the smaller the clearance between the shroud and the gear and the smaller the meshing opening of the shroud, the smaller the windage loss.
5.3. Optimization Design of the Shroud Geometry Structure
By comparing Table 2 and Table 5, it can be seen that the minimum windage moment of the gear is reduced by about 57% after adding the shroud. The existing research data show that for a single gear, the shroud with the best effect can reduce windage power loss by 70~75% [19]. Therefore, it is necessary to study the optimal structural parameters of the shroud by analyzing the mechanism of reducing the windage loss of the shroud.
The meshing opening size of the shroud is mainly affected by the geometrical structure parameters of the two meshing gears, and the minimum opening value is the minimum space value that meets the normal meshing of the gear pair. The optimum clearance value between the shroud and a gear can be obtained by optimization design. In order to make the calculation results comparable, the windage moment obtained from the orthogonal test is dimensionless, and the dimensionless coefficient Cm of the moment is obtained by the following formula [10]:
where T, Ω and r have the same meaning as in Equations (12) and (13); ρ is the fluid density.
The least-square method is used to fit the functional relationship between the dimensionless coefficient of windage moment and the clearance between the shroud and a gear. It is assumed that the variables of the tooth surface clearance value, the heel clearance value and the toe clearance value are x1, x2 and x3, respectively. The polynomial function is fitted by the nonlinear regression method of MATLAB, and the expression of Cm is obtained as follows:
In order to display the change in function values with variables more intuitively, Matlab slice graph is used to describe the four-dimensional graph of the fitting function, as shown in Figure 11.
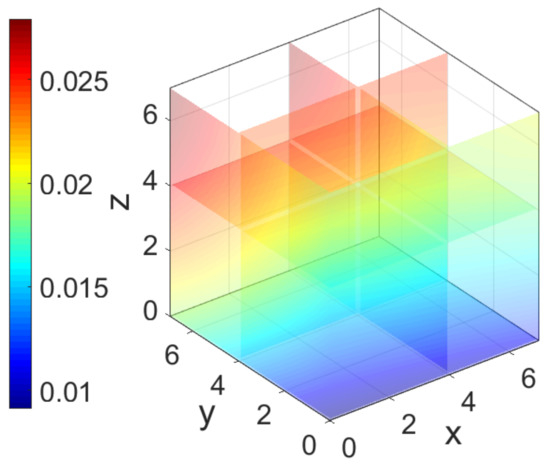
Figure 11.
Slice graph of Cm fitted function.
The fitted polynomial function is optimized. According to the actual size of the gearbox space, this paper sets the maximum value of the clearance value (x1, x2, x3) to 7 mm. The optimization problem of this test is converted to the following mathematical problems:
Optimization variables: X = [x1, x2, x3]
The objective function is:
The constraints are:
Solving the above optimization mathematical problems, the optimization result of the objective function is obtained as follows:
When x1 = 3.74 × 10⁻⁴, x2 = 5.18 × 10−5 and x3 = 3.55 × 10⁻⁵, the minimum value of objective function is:
In summary, when the clearance values x1, x2 and x3 are close to 0 mm, the dimensionless moment coefficient is the smallest, that is, the windage power loss is the smallest. In other words, the smaller the clearance between the shroud and the gear, the smaller the windage power loss and the better the effect of reducing the windage power loss.
Therefore, it can be seen that the geometry structure of the shroud makes the spatial volume around the rotating gear smaller, the clearance between the shroud and a gear is smaller, the air flow between the teeth is lower, the turbulent kinetic energy of the fluid is lower, and the energy dissipation caused by the energy dissipation is lower, that is, the windage power loss of gear is the lowest. However, if the clearances between the shroud and the gear are too small, when the gear speed is very high, even if the stiffness of the shroud itself is very great, the gear will also absorb the shroud to the bottom of the gear. Consideration should be given to the influence of axial displacement caused by vibration during the gear rotation, errors in manufacturing and installation of shroud, deformation of shroud and the amount of lubricating oil required for gear cooling and lubrication. Combined with the actual working conditions, the stiffness of the support parts, the transmission power of the gear, the material properties and the existing manufacturing technology and according to practical experience, the minimum value is about 1 mm and the meshing opening is 30°. This is more in line with the engineering application than the references [4,16,18].
5.4. Windage Reduction Mechanism of Shroud
Eight groups of simulation analysis results of orthogonal test are taken as examples to study the windage reduction mechanism of the shroud. The fluid velocity field distribution inside the gearbox is shown in Figure 12.
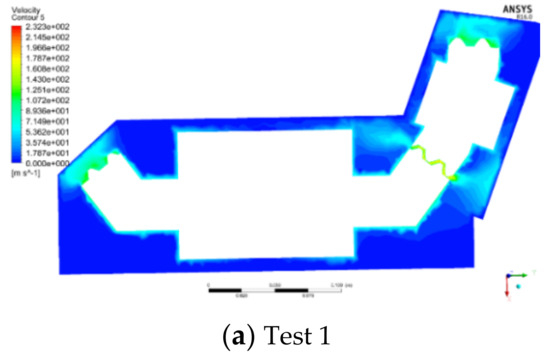

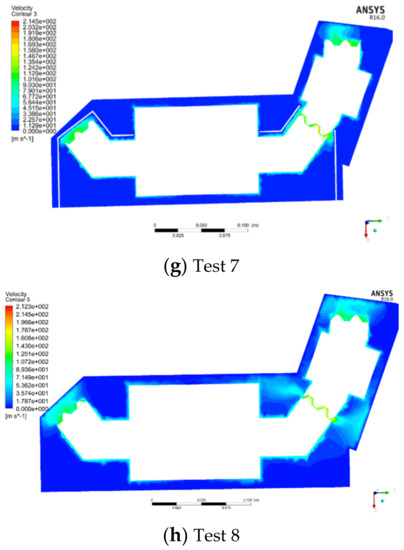
Figure 12.
X-Y section velocity cloud map.
Compared to Section 3.3, it can be seen that after installing the shroud, the air velocity in the fluid domain between the shroud and a gearbox decreases significantly. The air in the outer fluid domain enters into the inner fluid domain through the meshing opening of the shroud and the clearance between the shroud and the gear shaft surface, and then the air rotates with the gear and moves continuously towards the heel of the gear along the contour. At this time, part of the air re-enters the outer fluid domain from the meshing area of the gear pair. Therefore, there must be continuous exchange of material and energy between the internal and external fluid regions.
The turbulent kinetic energy is estimated by turbulence intensity and average velocity. According to [31], the calculation method is:
where k is the turbulent kinetic energy, I is the turbulence intensity, U is the average velocity and Re is the Reynolds number.
According to [31], the calculation method of turbulent dissipation rate is:
where ε is the turbulent dissipation rate, l is the turbulent scale, Cμ is the empirical constant and L is the characteristic length, which in this case is the radius of the gear.
The turbulent kinetic energy and turbulent dissipation rate of the fluid domain can be obtained by the calculation of fluent post-processing. The volume, turbulent kinetic energy and turbulent dissipation rate of the fluid domain in the orthogonal test are shown in Table 7.

Table 7.
Volume, turbulent kinetic energy and turbulent dissipation rate of the inner fluid domain (N) and external fluid domain (E) (mass-weighted integral (MWI) and mass-weighted average (MWA)).
The turbulent kinetic energy represents the intensity of the turbulent motion inside the gear box. The turbulent dissipation rate represents the amount of the fluid kinetic energy lost due to the turbulent motion of the oil–air mixture. As shown in Table 7, the turbulent dissipation rate of the outer fluid domain is more than twice that of the inner fluid domain under the same test number. The turbulent kinetic energy of the outer fluid domain is much greater than that in the inner fluid domain. The turbulent motion of the outer flow domain is more intense than that of the inner fluid domain, but the fluid velocity in the inner fluid domain is higher, and it is the source of kinetic energy of the outer flow domain. Therefore, reducing the volume of the inner fluid domain means reducing the kinetic energy source of the fluid of the outer flow domain, so as to reduce the velocity of the fluid in the outer flow domain. In the simulation results of orthogonal testing, the turbulent flow energy distribution in the gearbox is shown in Figure 13.
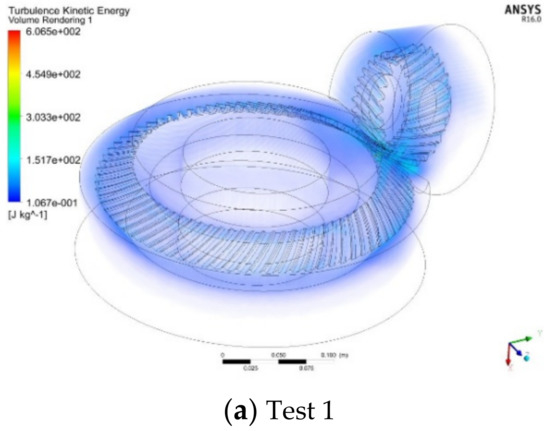

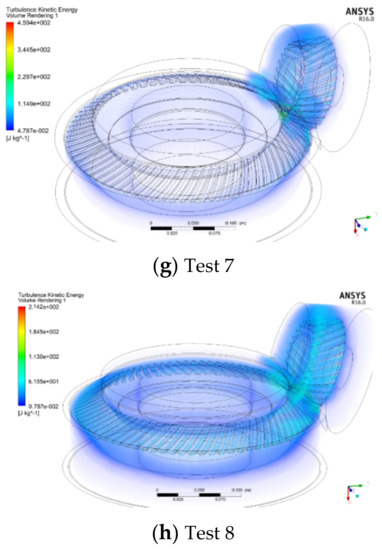
Figure 13.
Turbulent kinetic energy inside gearbox.
With the continuous reduction of the clearance between the shroud and the gear, the average turbulent kinetic energy of the flow field near the gear surface decreases accordingly, as shown in Figure 13. This is because when the air in the inner fluid domain obtains kinetic energy from the gear, the shroud reduces the turbulent kinetic energy of the air in the inner fluid domain, reduces the pressure and viscous force acting on each surface of the gear and finally reduces the windage loss of the gear. At the same time, it can be seen that in all the tests, the turbulent kinetic energy near the meshing region is the greatest in the whole flow field, which is caused by the complex boundary movement and energy exchange in the meshing region.
In summary, when the volume of the inner fluid domain is constant, the larger the meshing opening of the shroud, the greater the gear windage loss. The turbulent kinetic energy and turbulent dissipation rate of the inner and outer fluid domains decrease with the decrease in the volume of the inner fluid domains when the meshing openings of the shroud are the same. This means that with the reduction in the volume of the inner fluid domain, the sum of the turbulent motion of the inner and outer fluid domain becomes less intense, which reduces the kinetic energy of the fluid loss in the turbulent motion, so as to reduce the windage loss.
The energetic mechanism of the shroud reducing the windage loss can well explain the variance analysis results of the data in References [7,8,17]: the heel clearance is the most significant factor affecting the gear windage loss, because compared to other parameters, reducing the unit heel clearance can reduce the volume of the internal fluid domain most. The toe clearance is not a significant factor, because when the unit toe clearance is reduced, the volume of the internal fluid domain decreases the least.
5.5. Structural Optimization Design Principle of Shroud
According to the windage reduction mechanism of the shroud, the following structural optimization design principles of the shroud are obtained:
(1) Shroud should minimize the effect of axial and radial pumping fluid by gears, that is, minimize the distance between the shroud and gear profiles, so that the volume of fluid domain directly affected by gear rotation can be reduced. The specific measures that can be taken include reducing the tooth surface clearance, heel clearance and toe clearance. If the manufacturing process and installation conditions allow, the clearance between the shroud and the gear shaft surface, heel side and toe side can also be reduced. The significance of the clearance is in Figure 14, which shows a sectional view of a gear with shroud.
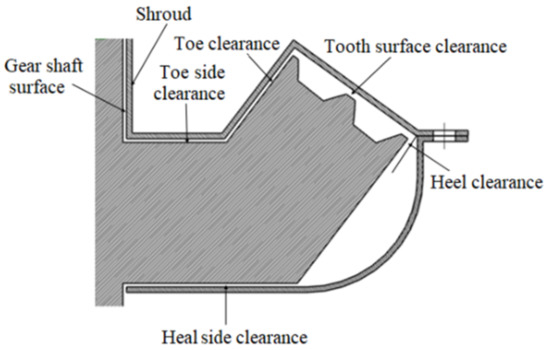
Figure 14.
Sectional view of gear with shroud.
(2) The mass and energy exchange between the inner and outer fluid domains separated by the shroud should be reduced as much as possible. Specific measures can be taken to reduce the area of the connecting surface between the two fluid domains, such as reducing the size of the meshing opening of the shroud and the clearance between the shroud and the upper shaft surface and so on.
6. Conclusions
(1) This paper has presented a methodology for evaluating windage for a pair of shrouded spiral bevel gears using a parametric solid 3-D model. The distribution trend of velocity field and pressure field around the gear obtained by simulation in this paper is consistent with the experimental results of references [1,5,10].
(2) The goals of this work have been to validate the numerical and modeling approaches used for these applications and to develop physical understanding of the aerodynamics of gear windage loss.
(3) The essence of gear windage loss is that the differential pressure torque and friction torque of the fluid, acting on each surface of the gear, make the gear lose part of its dynamic energy, which will be transformed into the kinetic energy and heat energy of the fluid around the gear.
(4) For all configurations of gears studied, the dominant physical mechanism contributing to windage losses is the pressure field associated with diversion and impingement of the high speed relative flow on the leading tooth surface.
(5) Based on the windage reduction mechanism of the shroud, this paper studied the optimization design principle of the shroud through orthogonal test and variance analysis, which revealed that the windage of the gear pair was the smallest when the gap of the windshield was 1 mm and the meshing opening was 30°.
Author Contributions
L.L.: conceptualization, investigation, writing and editing; S.W.: conceptualization, methodology; H.Z.: supervision, reviewing and funding acquisition; P.C.: supervision and reviewing. All authors have read and agreed to the published version of the manuscript.
Funding
This work was supported by the Special Fund for Civil Machinery of China under Grant [MJ-2016-D-28].
Institutional Review Board Statement
The work contains no libelous or unlawful statements, and it does not infringe on the rights of others or contain material or instructions that might cause harm or injury.
Informed Consent Statement
The authors consent to participate.
Data Availability Statement
Not applicable.
Conflicts of Interest
The authors declare no conflict of interest.
Code Availability
Not applicable.
References
- Zhu, X.; Dai, Y.; Ma, F. Development of a quasi-analytical model to predict the windage power losses of a spiral bevel gear. Tribol. Int. 2020, 146, 106258. [Google Scholar] [CrossRef]
- Krantz, T.L. Experimental and Analytical Evaluation of Efficiency of Helicopter Planetary Stage. NASA Tech. Pap. 1990, 11, 325–347. [Google Scholar]
- Handschuh, R.; Kilmain, C.; Ehinger, K. Gear design effects on the performance of high speed helical gear trains as used in aerospace drive systems. In Proceedings of the AHS International 69th Annual Forum and Technology Display, Phoenix, AZ, USA, 21–23 May 2013; pp. 668–677. [Google Scholar]
- Lord, A.A. An Experimental Investigation of Geometric and Oil Flow Effects on Gear Windage and Meshing Losses. Ph.D. Thesis, University of Wales Swansea, Swansea, Wales, 1998. [Google Scholar]
- Handschuh, R.F.; Hurrell, M.J. Initial experiments of high-speed drive system windage losses. In Proceedings of the International Conference on Gears. 2011; p. E-17421-1. Available online: https://ntrs.nasa.gov/api/citations/20110023749/downloads/20110023749.pdf (accessed on 20 April 2022).
- Pallas, S.; Marchesse, Y.; Changenet, C.; Ville, F.; Velex, P. A windage power loss model based on CFD study about the volumetric flow rate expelled by spur gears. Mech. Ind. 2012, 13, 317–323. [Google Scholar] [CrossRef]
- Chen, S. “Windage” for high gear systems in aviation. J. Aerosp. Power 1993, 8, 303–304. [Google Scholar]
- Li, S.; Li, L. Computational investigation of baffle influence on windage loss in helical geared transmissions. Tribol. Int. 2021, 156, 106852. [Google Scholar] [CrossRef]
- Diab, Y.; Ville, F.; Velex, P. Investigations on power losses in high-speed gears. Proc. Inst. Mech. Eng. Part J J. Eng. Tribol. 2006, 220, 191–198. [Google Scholar] [CrossRef]
- Diab, Y.; Ville, F.; Velex, P. Windage losses in high speed gears-preliminary experimental and theoretical results. J. Mech. Des. 2004, 126, 903–908. [Google Scholar] [CrossRef]
- Anderson, N.; Loewenthal, S. Spur-Gear-System Efficiency at Part and Full Load; Technical Report; NASA Lewis Research Center: Cleveland, OH, USA, 1980. [Google Scholar]
- Anderson, N.; Loewenthal, S. Effect of geometry and operating conditions on spur gear system power loss. J. Mech. Des. 1981, 103, 151–159. [Google Scholar] [CrossRef] [Green Version]
- Eastwick, C.N.; Johnson, G. Gear windage: A review. J. Mech. Des. Trans. ASME 2008, 130, 034001. [Google Scholar] [CrossRef]
- Ruzek, M.; Ville, F.; Velex, P. On windage losses in high-speed pinion-gear pairs. Mech. Mach. Theory 2019, 132, 123–132. [Google Scholar] [CrossRef]
- Dawson, P.H. Windage Loss in Larger High-Speed Gears. Proc. Inst. Mech. Eng. Part A J. Power Energy 1984, 10, 51–59. [Google Scholar] [CrossRef]
- Johnson, G.; Simmons, K.; Foord, C. Experimental investigation into windage power loss from a shrouded spiral bevel gear. In Proceedings of the ASME Turbo Expo: Power for Land, Sea, and Air, Montreal, QC, Canada, 14–17 May 2007; pp. 57–66. [Google Scholar]
- Winfree, D.D. Reducing Gear Windage Losses from High Speed Gears. In Proceedings of the DETC’00, ASME Power Transmission and Gearing Conference, Baltimore, MD, USA, 10–13 September 2000; Volume 5, pp. 747–756. [Google Scholar]
- Winfree, D.D. Reducing gear windage losses from high speed gears and applying these principles to actual running hardware. In Proceedings of the ASME 2013 International Design Engineering Technical Conferences and Computers and Information in Engineering Conference, Portland, OR, USA, 4–7 August 2013; pp. 13024–13039. [Google Scholar]
- Zhu, X.; Dai, Y.; Ma, F. On the estimation of the windage power losses of spiral bevel gears: An analytical model and CFD investigation. Simul. Model. Pract. Theory 2021, 110, 102334. [Google Scholar] [CrossRef]
- Webb, T.; Eastwick, C.; Morvan, H. Parametric modelling of a spiral bevel gear using CFD. In Proceedings of the ASME 2010 Turbo Expo Power Land Sea Air, Glasgow, UK, 14–18 June 2010; pp. 229–238. [Google Scholar]
- Guo, Y.N.; Yang, Y.; Yu, J.X.; Ding, D.; Wang, Y.L. A computational fluid dynamic-based method for analyzing the nonlinear relationship between windage loss and pressure in a geotechnical centrifuge. SN Appl. Sci. 2021, 3, 1–16. [Google Scholar] [CrossRef]
- Hill, M.J.; Kunz, R.F.; Medvitz, R.B. CFD analysis of gear windage losses: Validation and parametric aerodynamic studies. J. Fluid Eng. 2011, 12, 123–135. [Google Scholar] [CrossRef] [Green Version]
- Massini, D.; Fondelli, T.; Andreini, A.; Facchini, B.; Tarchi, L.; Leonardi, F. Experimental and numerical investigation on windage power losses in high speed gears. In Proceedings of the ASME 2017 Turbo Expo Power Land Sea Air, Charlotte, NC, USA, 26–30 June 2017; pp. 76–83. [Google Scholar]
- Simmons, K.; Guymer, D.; Turner, A. CFD Investigation Into Oil/Air Behaviour Near A Shrouded Spiral Bevel Gear. In Proceedings of the ASME 2014 Turbo Expo Power Land Sea Air, Düsseldorf, Germany, 16–20 June 2014. [Google Scholar]
- Rapley, S.; Eastwick, C.; Simmons, K. Effect of variations in shroud geometry on single phase flow over a shrouded single spiral gear. In Proceedings of the ASME 2008 Turbo Expo Power Land Sea Air, Berlin, Germany, 9–13 June 2008; pp. 50624–50633. [Google Scholar]
- Ren, Y.; Chen, H. Fundamentals of Computational Fluid Mechanics; Tsinghua University Press: Beijing, China, 2006; pp. 124–129. [Google Scholar]
- Wang, F. Analysis Method of Flow in Pumps and Pumping Stations; China Water Conservancy Hydropower Press: Beijing, China, 2020; pp. 45–60. [Google Scholar]
- Concli, F.; Gorla, C. Numerical modeling of the churning power losses in planetary gearboxes: An innovative partitioning-based meshing methodology for the application of a computational effort reduction strategy to complex gearbox configurations. Lubric Sci. 2017, 29, 455–474. [Google Scholar] [CrossRef]
- Long, C.A.; Miles, A.L.; Coren, D.D. Windage measurements in a rotor stator cavity with rotor mounted protrusions and bolts. In Proceedings of the ASME 2012 Turbo Expo: Power for Land, Sea, and Air, Copenhagen, Denmark, 11–15 June 2012; pp. 2241–2250. [Google Scholar]
- Litvin, F.L.; Zhang, Y. Local Synthesis and Tooth Contact Analysis of Face-Milled Spiral Bevel Gears; NASA Lewis Research Center: Chicago, FL, USA, 1991. [Google Scholar]
- Lai, J.; Chakraborty, N. A priori direct numerical simulation modeling of scalar dissipation rate transport in head-on quenching of turbulent premixed flames. Combust. Sci. Technol. 2016, 188, 1440–1471. [Google Scholar] [CrossRef] [Green Version]
Publisher’s Note: MDPI stays neutral with regard to jurisdictional claims in published maps and institutional affiliations. |
© 2022 by the authors. Licensee MDPI, Basel, Switzerland. This article is an open access article distributed under the terms and conditions of the Creative Commons Attribution (CC BY) license (https://creativecommons.org/licenses/by/4.0/).