Article

Digital Twins-Based Production Line Design and Simulation Optimization of Large-Scale Mobile Phone Assembly Workshop

1
State Key Laboratory of Precision Electronic Manufacturing Technology and Equipment, Guangdong University of Technology, Guangzhou 510006, China
2
School of Electromechanical Engineering, Guangdong University of Technology, Guangzhou 510006, China
*
Author to whom correspondence should be addressed.
Machines 2022, 10(5), 367; https://doi.org/10.3390/machines10050367
Submission received: 11 April 2022 / Revised: 9 May 2022 / Accepted: 9 May 2022 / Published: 11 May 2022
(This article belongs to the Special Issue Digital Twin Applications in Smart Manufacturing)

Abstract

:
The mobile phone is a typical 3C electronic product characterized by frequent replacement, multiple product specifications, high flexibility, high-frequency production line switching, and urgent delivery time during production. Therefore, the optimized design of the mobile phone production workshop is crucial. This paper takes the assembly process of a specific type of mobile phone assembly as the research object and adopts the heuristic balance method to combine the production procedures. Moreover, it considers the automation degree of the process and the demand for production line rhythm to carry out station division and working hours design for the assembly process. The advantages and disadvantages of the plug-and-play production line and unit production line architecture are integrated, aiming at the production line’s construction cost and unit area capacity. A hybrid workshop with a mixed combination of two types of production lines is designed and an optimization model of hybrid workshop design is established. The semi-physical simulation technology of digital twins is utilized to verify the proposed design scheme to achieve the balance optimization of the production line, improve production efficiency, and reduce production costs. This work provides a technical scheme for designing and optimizing large-scale mobile phone assembly workshops with multi-batch and high-frequency production changes.

1. Introduction

The mobile phone consumer market has witnessed rapid development, and diversified and personalized consumer demands for mobile phones have been increasing. Mobile phones are a typical 3C (Computer and Communication and Consumer) electronic product. 3C manufacturing is a labor-intensive industry, facing crises such as labor cost surges and industrial transfer. In addition, mobile phones are frequently updated and have many product specifications. Its production has the typical characteristics of high-frequency production change, high flexibility, and fast delivery [1]. To meet the demands of high-frequency production change and automatic upgrading, the optimization design of workshop production lines has become an important technical support for manufacturers to realize transformation, upgrading, and intelligent manufacturing. The research and development cycle of an automated mobile phone assembly line is about 5 months, and mobile phone products’ life cycle is only about half a year. The high-frequency mobile phone update requirements production line is in a very short time in which to carry out the design and optimization. At the same time, it is necessary to meet the customer’s different demands for a site, capacity, cost control, process route, and legacy equipment. The workshop production line quickly forms a customized design and implementation scheme.
At present, the mainstream operation mode of 3C assembly lines includes the following two types: multi-line mixing with cross-line sharing of equipment and workers and man-machine duplexing. There are more than 50 assembly and testing processes for mobile phones. Most of them are precise assembly and processing, only one-third of the processes can be fully automated, and the rest still rely on skilled technical workers.
With the rise of industry 4.0, the new concept of digital twins has attracted more and more attention [2]. Digital twins can achieve semi-physical simulations to reduce the extended time and cost of physical commissioning/reconfiguration by detecting design errors/flaws [3]. Digital twins is the simulation process that makes full use of the historical data of physical entities and integrates multi-disciplines, multi-physical quantities, multi-scales, and multi-probabilities to complete virtual and real mapping in virtual space thus reflecting the whole life cycle process of corresponding physical equipment. Digital twins technology can provide support and guidance for various stages of product development and design, manufacturing, motion monitoring and maintenance, and logistics support. In the design stage of the product, the product can be verified by digital twin simulation technology [4], and then the product can be optimized and improved. The application of semi-physical simulation technology of digital twins to physical workshop design, with its intuitive and fast characteristics to evaluate the customer demand on the design of various aspects of the program to optimize the program while verifying the feasibility of the optimization program, can significantly shorten the design cycle, save the design cost and avoid design mistakes.
In this paper, the leading research object is a large-scale mobile phone assembly production line of the workshop. Based on the plug-and-play production line, unit production line, and hybrid assembly workshop, the design and simulation optimization of the mobile phone assembly workshop production line with customer demand was studied, and the primary process of mobile phone assembly was analyzed. The heuristic balance method was used to divide the working stations and assess the automation degree of the process. With the aim of the two types of basic production line architecture, the assembly scheme of the mobile phone line was designed and optimized based on customer demand. Two kinds of production line evaluation indexes were obtained. The workshop with their combination was designed considering the advantages and disadvantages of the two kinds of production lines. With the aim of the construction cost and production capacity per unit area of a production line, the workshop’s design optimization model was established by combining two kinds of production lines. Based on digital twins technology, the dynamic change of the workshop is genuinely simulated, and the proposed scheme is optimized through simulation analysis to verify its feasibility of the scheme. The research in this paper provides ideas and technical solutions for the design and optimization of large-scale mobile phone assembly workshops with multi-batch and high-frequency production. This study mainly focuses on two research questions: the quantity allocation of two types of production lines in hybrid workshop design and how to optimize the design scheme.
The rest of this paper is organized as follows: Section 2 briefly reviews the research status of workshop layout design, assembly line design, and the application of digital twin technology to the production line and workshop design; Section 3 introduces the assembly process of mobile phone assembly, and its automatic analysis; Section 4 introduces plug-and-play, the unit production line and the design of two types of production line of the mobile phone assembly line. Section 5 introduces the hybrid workshop’s design, uses digital twin physical simulation technology to simulate and optimize the assembly line of the hybrid workshop, and evaluates the scheme before and after optimization. Section 6 concludes the paper and puts forward the limitations and future research directions.

2. Related Studies

Facility layout design is one of the leading research objectives of workshop design, which is considered to be the key to improving workshop productivity. Its aims are to obtain adequate facility arrangements and minimize production costs [5]. The layout design has a significant impact on the performance of the manufacturing system. The methods of facility layout design can be divided into three categories: exact methods, heuristic algorithms and metaheuristic algorithms [6]. Exact methods include mathematical optimization modeling, branch and bound and dynamic programming. Heuristic algorithms include construction algorithms, improvement algorithms, the computerized relative allocation of facilities technique (CRAFT), and an automated layout design program (ALDEP) [7]. Metaheuristic algorithms include genetic algorithms (GAs), tabu search, simulated annealing, ant colony optimization [8], and particle swarm optimization [9]. In a recent study, Turanoğlu et al. [10] proposed a new hybrid algorithm based on bacterial foraging optimization (BFO), and Khajemahalle et al. [11] proposed a hybrid algorithm based on a nested partition and a simulated annealing algorithm. Tayal et al. [12] proposed a novel integrated framework to solve multi-objective random dynamic facility layout problems by combining extensive data analysis and hybrid meta-heuristic. Derakhshan et al. [13] and Zha et al. [14] used particle swarm optimization to solve the dynamic facility layout problem of unequal areas. With the continuous development of science and technology, many scholars use simulation software to study layout problems. Dong et al. [15] applied the simulation engine to establish the three-dimensional model of the equipment and the layout of the workshop to realize the combination of virtual and reality. Pinto et al. [16] studied the layout of the workshop with ReBORN Workbench and a genetic algorithm. Liao et al. [17] established the three-dimensional model on Visual Components and designed the layout of the workshop with the systematic layout planning (SLP) method. Naranje et al. [18] used Technomatrix to verify the proposed layout design solution by simulating the layout of the workshop.
Assembly line balance design is another leading research objective of workshop design. An assembly line balancing problem involves assigning tasks among stations in such a way that each station takes equal time [19] for the study of assembly line balancing. Tonge et al. [20] studied the assembly line balance based on the idea of a heuristic algorithm. Kim et al. [21] carried out a related application of the genetic algorithm in mixed-flow assembly line scheduling and proved that the search speed of the algorithm is better than the target tracking method. Bukchin et al. [22] researched the application of a heuristic idea to the design and balance optimization of mixed-flow assembly lines for order-oriented production. For the balance problem of U-line, Mukund et al. [23] applied the particle swarm optimization algorithm, Alavidoost et al. [24] proposed an improved genetic algorithm with a one-fifth success rule in the selection operator, and Kazemi et al. [25] proposed a new two-stage genetic algorithm. Delice et al. [26] proposed a new improved particle swarm optimization algorithm to solve the two-sided assembly line balancing problem of the hybrid model. Becker et al. [27] and Boysen et al. [19] gave a comprehensive introduction to the modeling and algorithm of generalized assembly line balancing problems. For the balance problem of multi-objective optimization, Moreira et al. [28] presented a multi-objective optimization method for the second type of assembly line balance problem. Lee et al. [29] constructed a fuzzy multi-objective model and proposed a genetic algorithm to solve the problem. However, most manufacturing systems are incredibly complex, and it is extremely tough to find the best decision variables by analysis [30]. With the gradual maturity of computer simulation technology, computer simulation has been applied in various fields, among which the manufacturing system has become the most crucial field using simulation technology. Therefore, simulation-based optimization techniques are widely used to evaluate the optimization problems of complex manufacturing systems. Bongomin et al. [31] applied Arena software to develop the discrete event simulation of the assembly line, and both local and global optimization methods have significantly improved the production efficiency of the assembly line.
Workshop layout problems and assembly line balance problems are both NP-hard problems. Many related studies describe workshop layout problems with mathematical optimization models, but the exact solutions are still unavailable. The abstract mathematical model is difficult to adjust dynamically according to the dynamic change of the workshop. The application of physical simulation technology of digital twins to the early design stage of the workshop can force engineers to carry out a more detailed design of the production line layout, cache settings, worker shifts, and so on. Later, it can verify and dynamically adjust the design scheme through the digital twins model. Zhang et al. [32] proposed a digital twins-based approach for rapid individualized designing of the hollow glass production line by integrating simulation modeling and distributed real-time process data, which generated a reliable digital design scheme in the early stage of production and filled the gap between design and actual operation. Zhang et al. [33] proposed a framework based on the simulation method to guide the design optimization process of factory workshop layout and production process, and combined various mathematical algorithms and heuristic methods to balance production line operating performance and planning cost. Guo et al. [34] applied digital twins to factory design and proposed a modular approach to help build the digital twins model for a flexible factory in the design stage, enabling engineers to quickly evaluate the results to avoid defects and thus improve the feasibility of the design. Damiani et al. [35] built the virtual simulation models using AnyLogic software and simulation technology, which provided an application of digital twins for the optimization design of the production line. Leng et al. [36] verified the implementation effect of the design scheme of a large-scale automated high-rise warehouse with the help of the data analysis module of the simulation engine and the optimization algorithm of the digital twins system. Wang et al. [37] used the genetic algorithm to plan the workshop layout by analyzing the bottleneck rate, efficiency, and other indicators of the production line. Based on 3D modeling and visualization technology, they designed a digital twins system of the hardware production line using Demo3D software to verify the feasibility of the workshop layout scheme. Leng et al. [38] proposed a digital twins-based remote semi-physical commissioning (DT-RSPC) approach for open architecture flow-type smart manufacturing systems, which was verified by a case study of digital twins-based remote semi-physical commissioning of a smartphone assembly line.

3. Analysis of Mobile Phone Assembly Line Process and Automation Demand

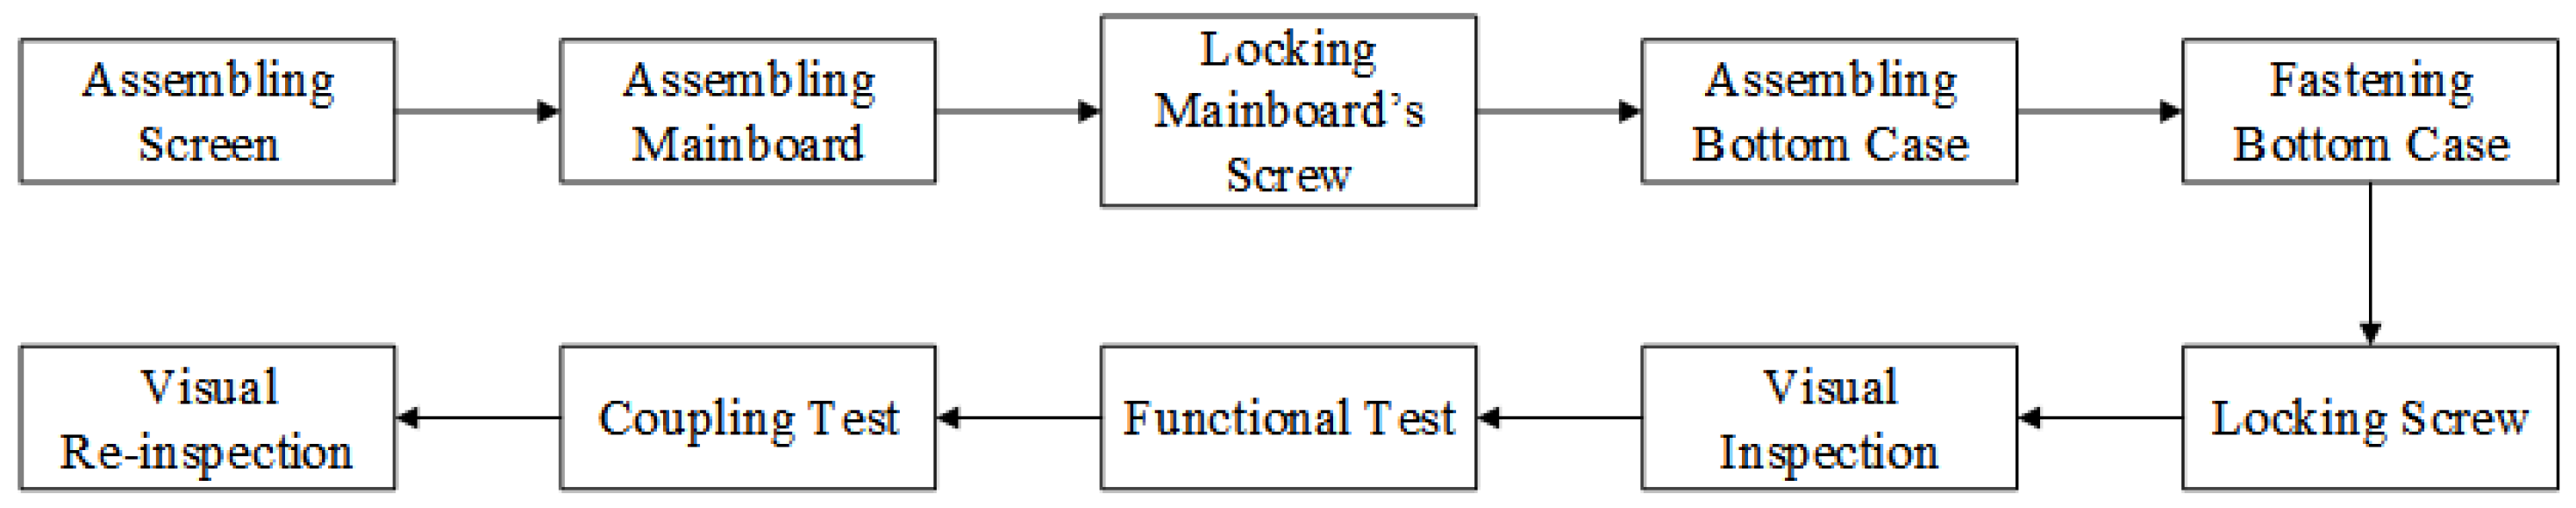
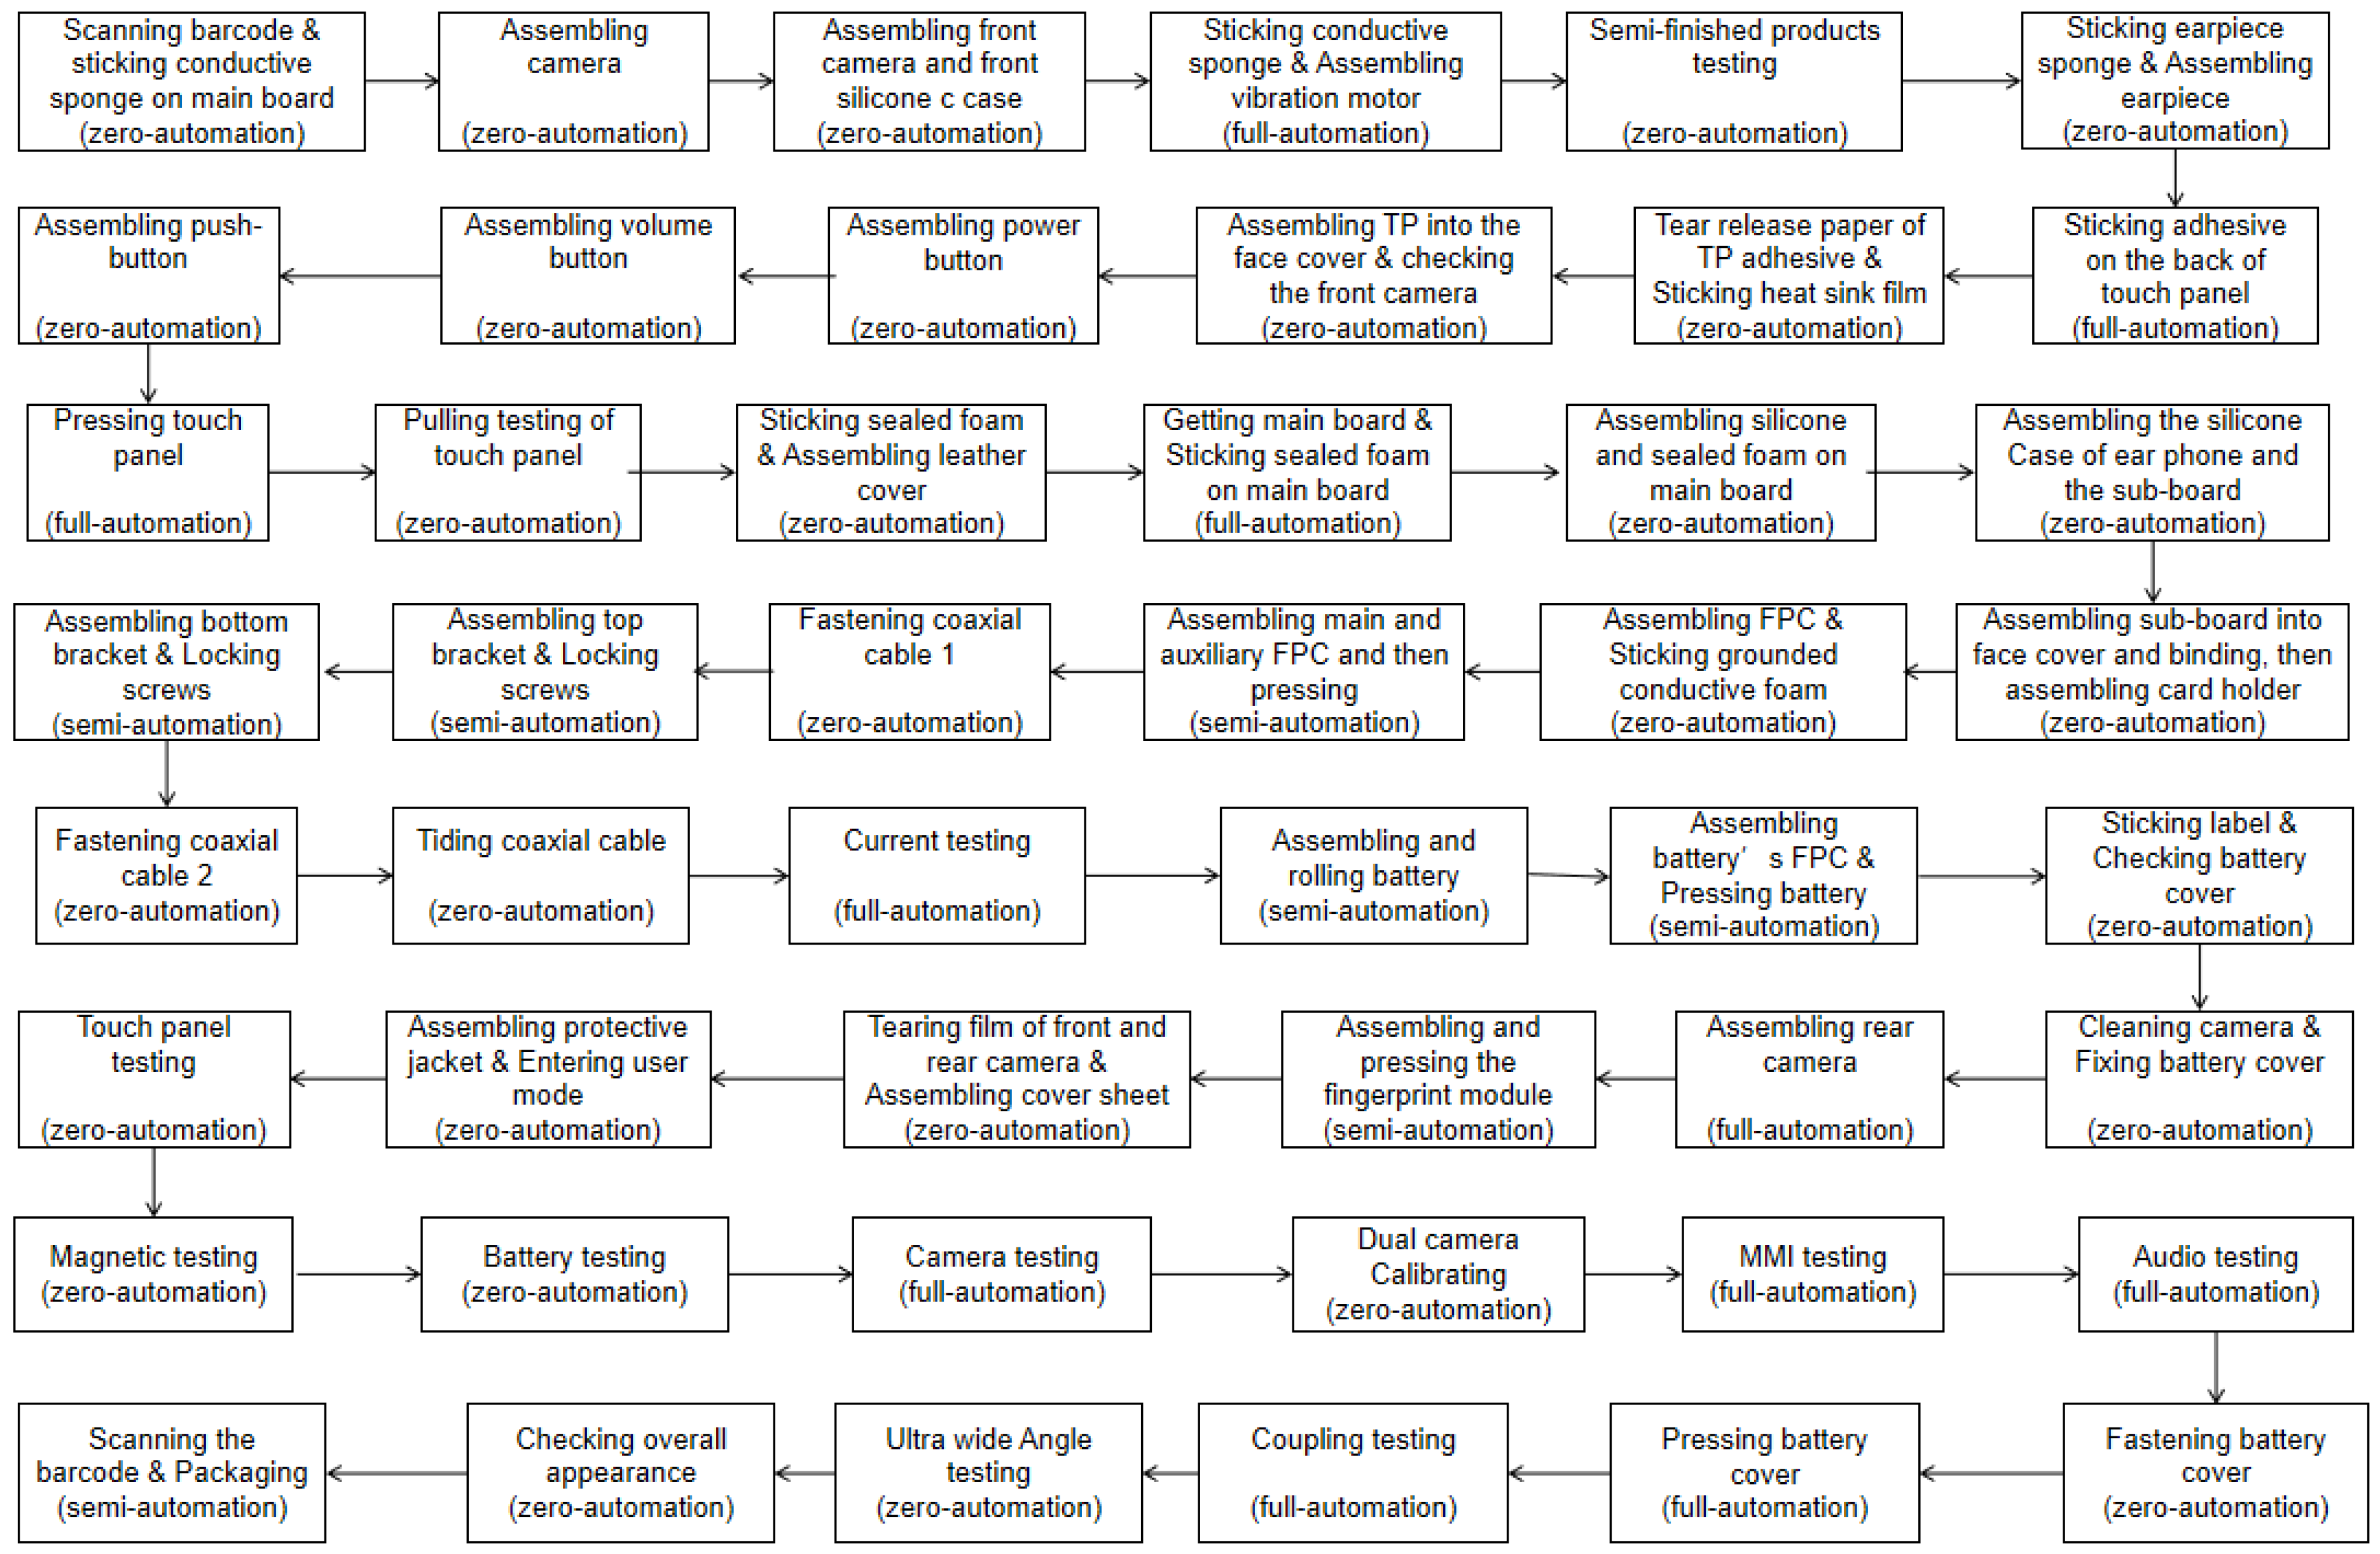
3.1. The Mobile Phone Assembly Process

Mobile phone products have similar assembly processes due to their similar basic structures. Among them, the process that can meet the basic assembly demand for general mobile phone products can be called a common process. The process that can only meet the personalized demand for specific mobile phone products is called the individual process. The assembly processes are an essential basis for assembly line design. For general mobile phone products, the assembly process is shown in Figure 1.

3.2. Mobile Phone Assembly Process Analysis

Although the consumer market of mobile phone products and the production batches of each type is large, to avoid the risk of production capacity and negotiation price caused by excessive concentration of production orders, mobile phone brand enterprises usually disperse orders to many Original Equipment Manufacturers (OEMs). As a result, OEMs receive different batches of orders in different sizes and for different delivery dates. High-frequency production and line changing have become their typical manufacturing characteristics, which poses new challenges to the flexibility of their assembly lines. The assembly processes are an essential basis for assembly line design. Designers should consider flexible space when designing flexible assembly lines so that common processes can be quickly extracted, individual processes can be determined, the assembly process can be planned reasonably, assembly quality and efficiency can be guaranteed, and the conversion time can be shortened.
Mobile phone assembly is the back-end link of mobile phone production. The assembly process is various, and the assembly parts are complex and nuanced. Only about one-third of the process can be achieved through automation, while most of them still use manual assembly with a relatively low degree of automation. With the development of technology and process innovation, many processes have gradually embarked on standardization and automation. It can be seen that the automatic analysis of the process is of great significance to the design of the assembly line. The basic process of the mobile phone assembly line can be subdivided into more than 50 processes. This paper proceeds from a certain type of mobile phone assembly process that defines the assembly logic sequence of mobile phone components that sorts and combines them. The heuristic balance method was used to arrange the working procedure. The idea for a heuristic balance method is detailed as follows:
According to the demand of production takt, starting from the first process being assigned to the first station, if it has any free time it is made up from the following working procedure. In addition, it needs to consider the whole assembly process of mobile phones and the associated constraint relationship between procedures. In this way, the station’s procedure content can be determined. Subsequent stations also adopt the above principles. The station division for the working procedure is shown in Figure 2.

4. Production Line Design of Large-Scale Mobile Phone Assembly Workshop

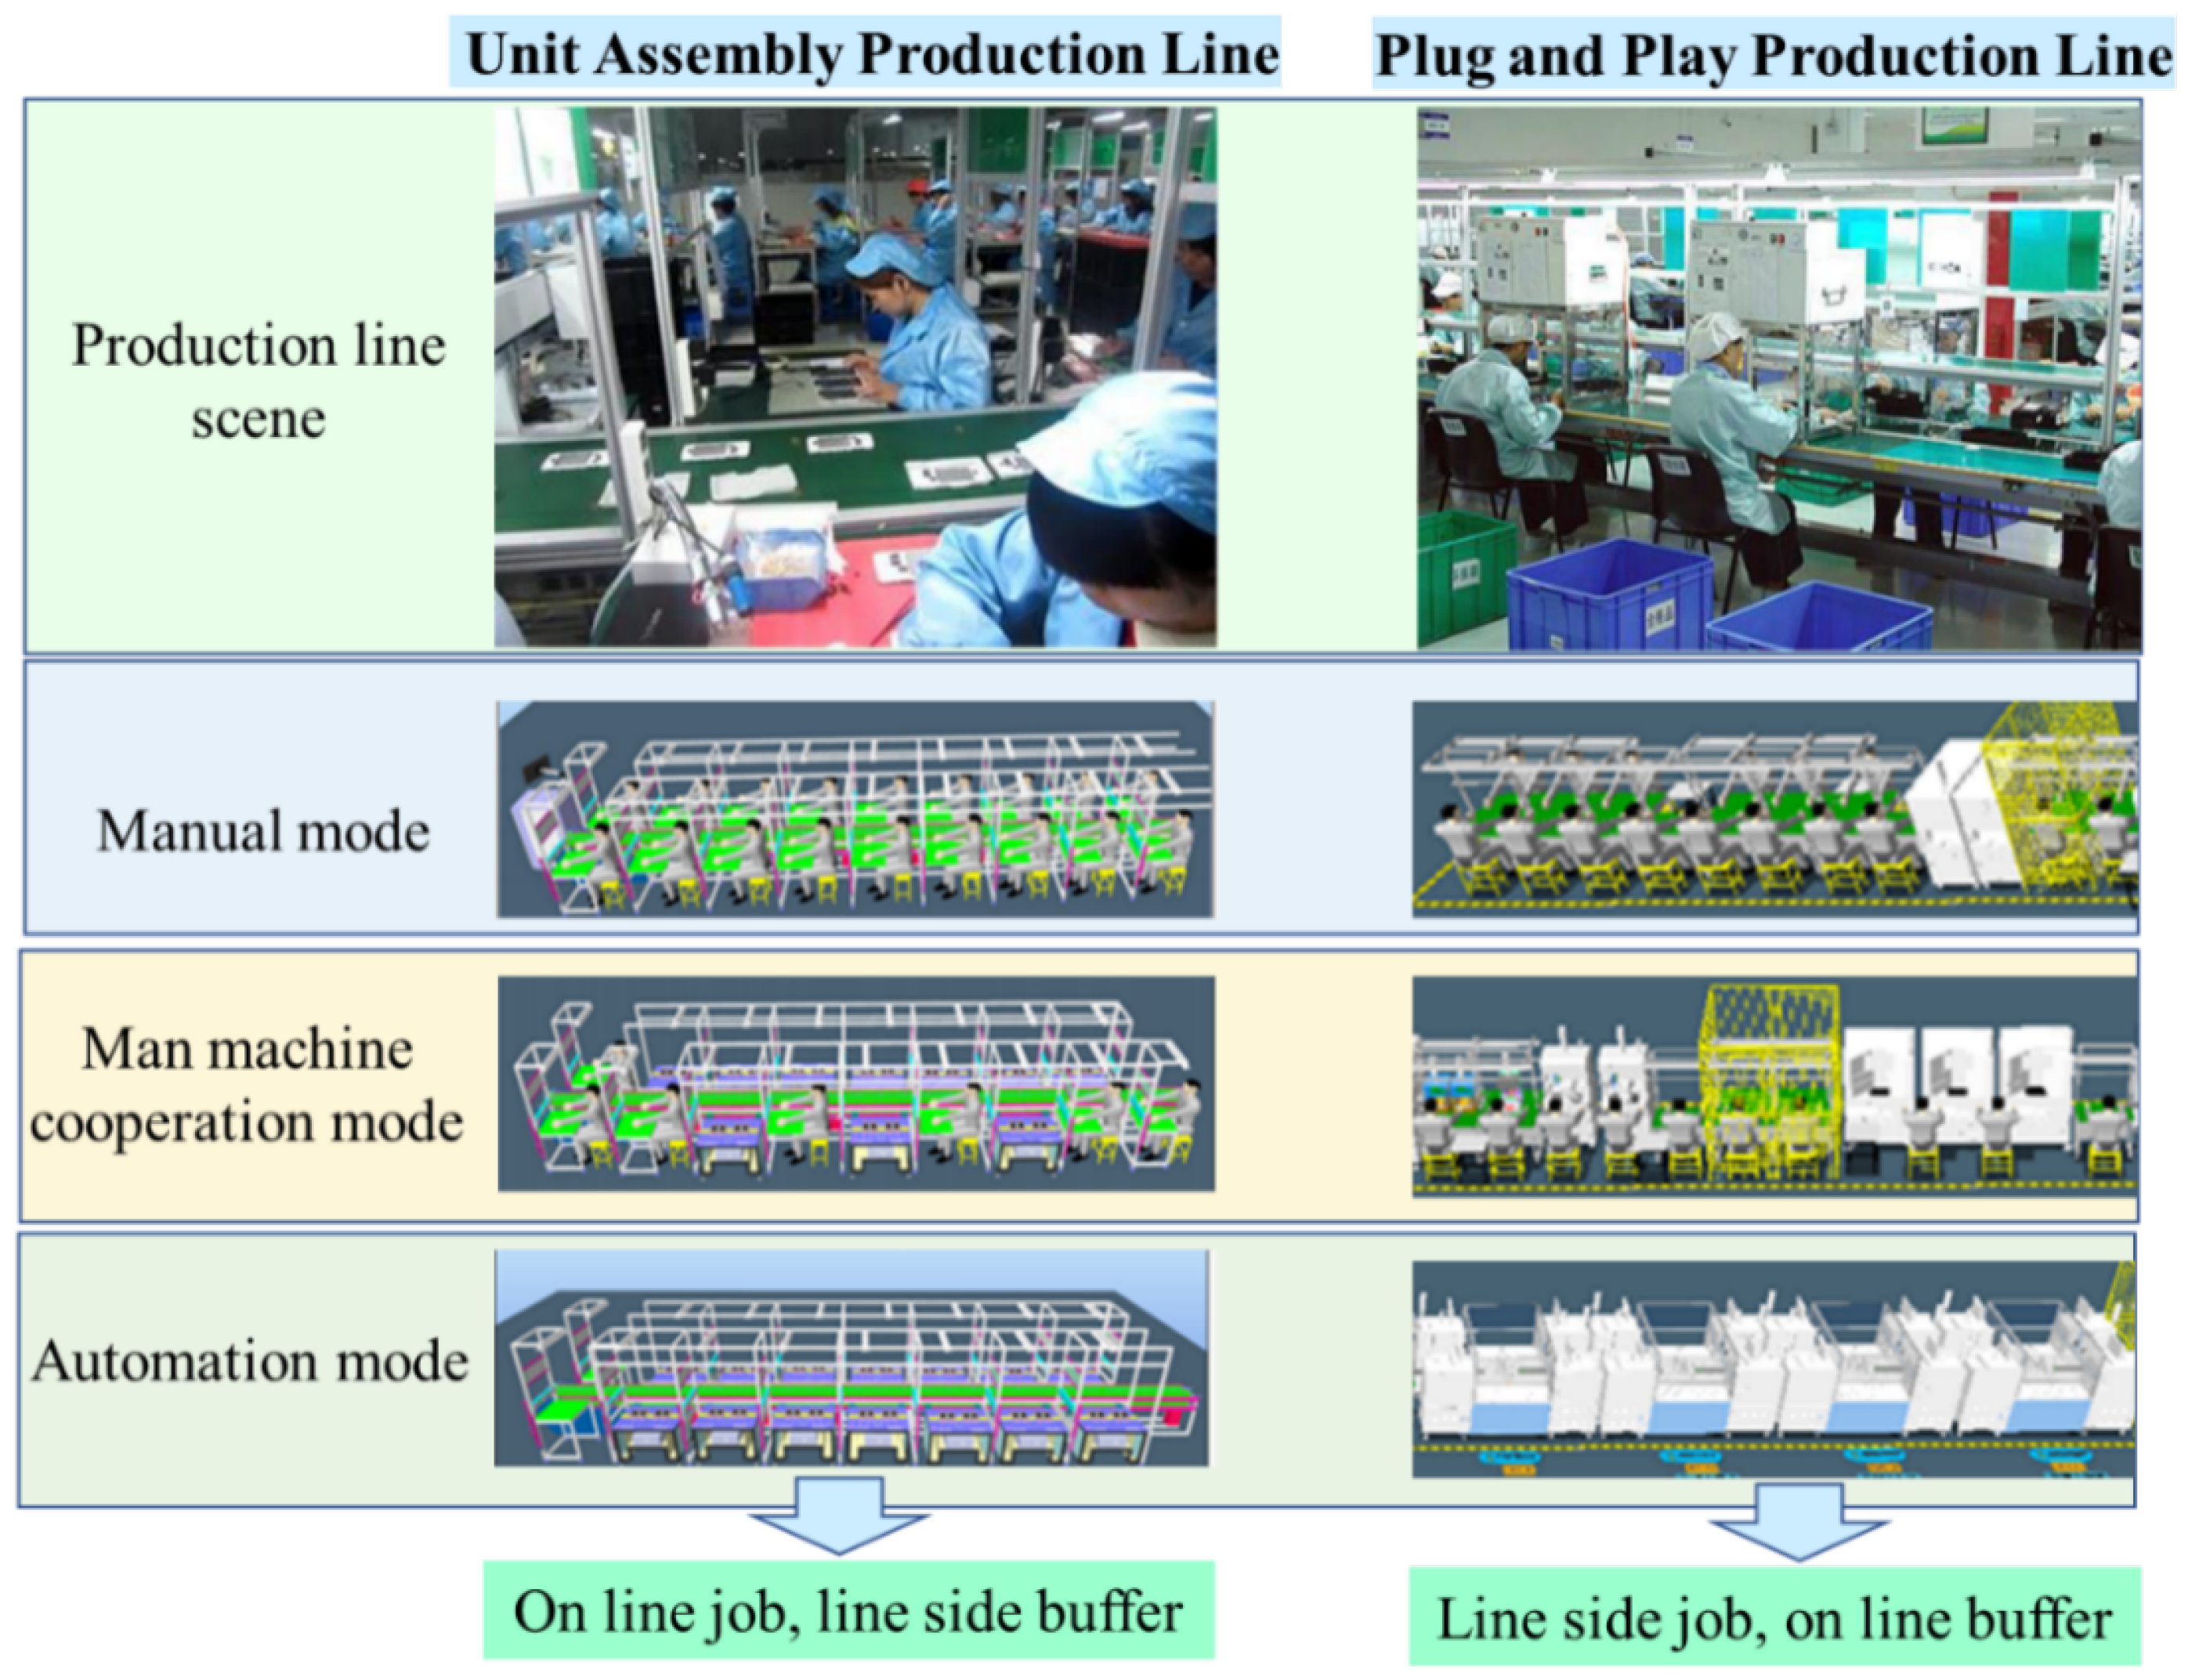
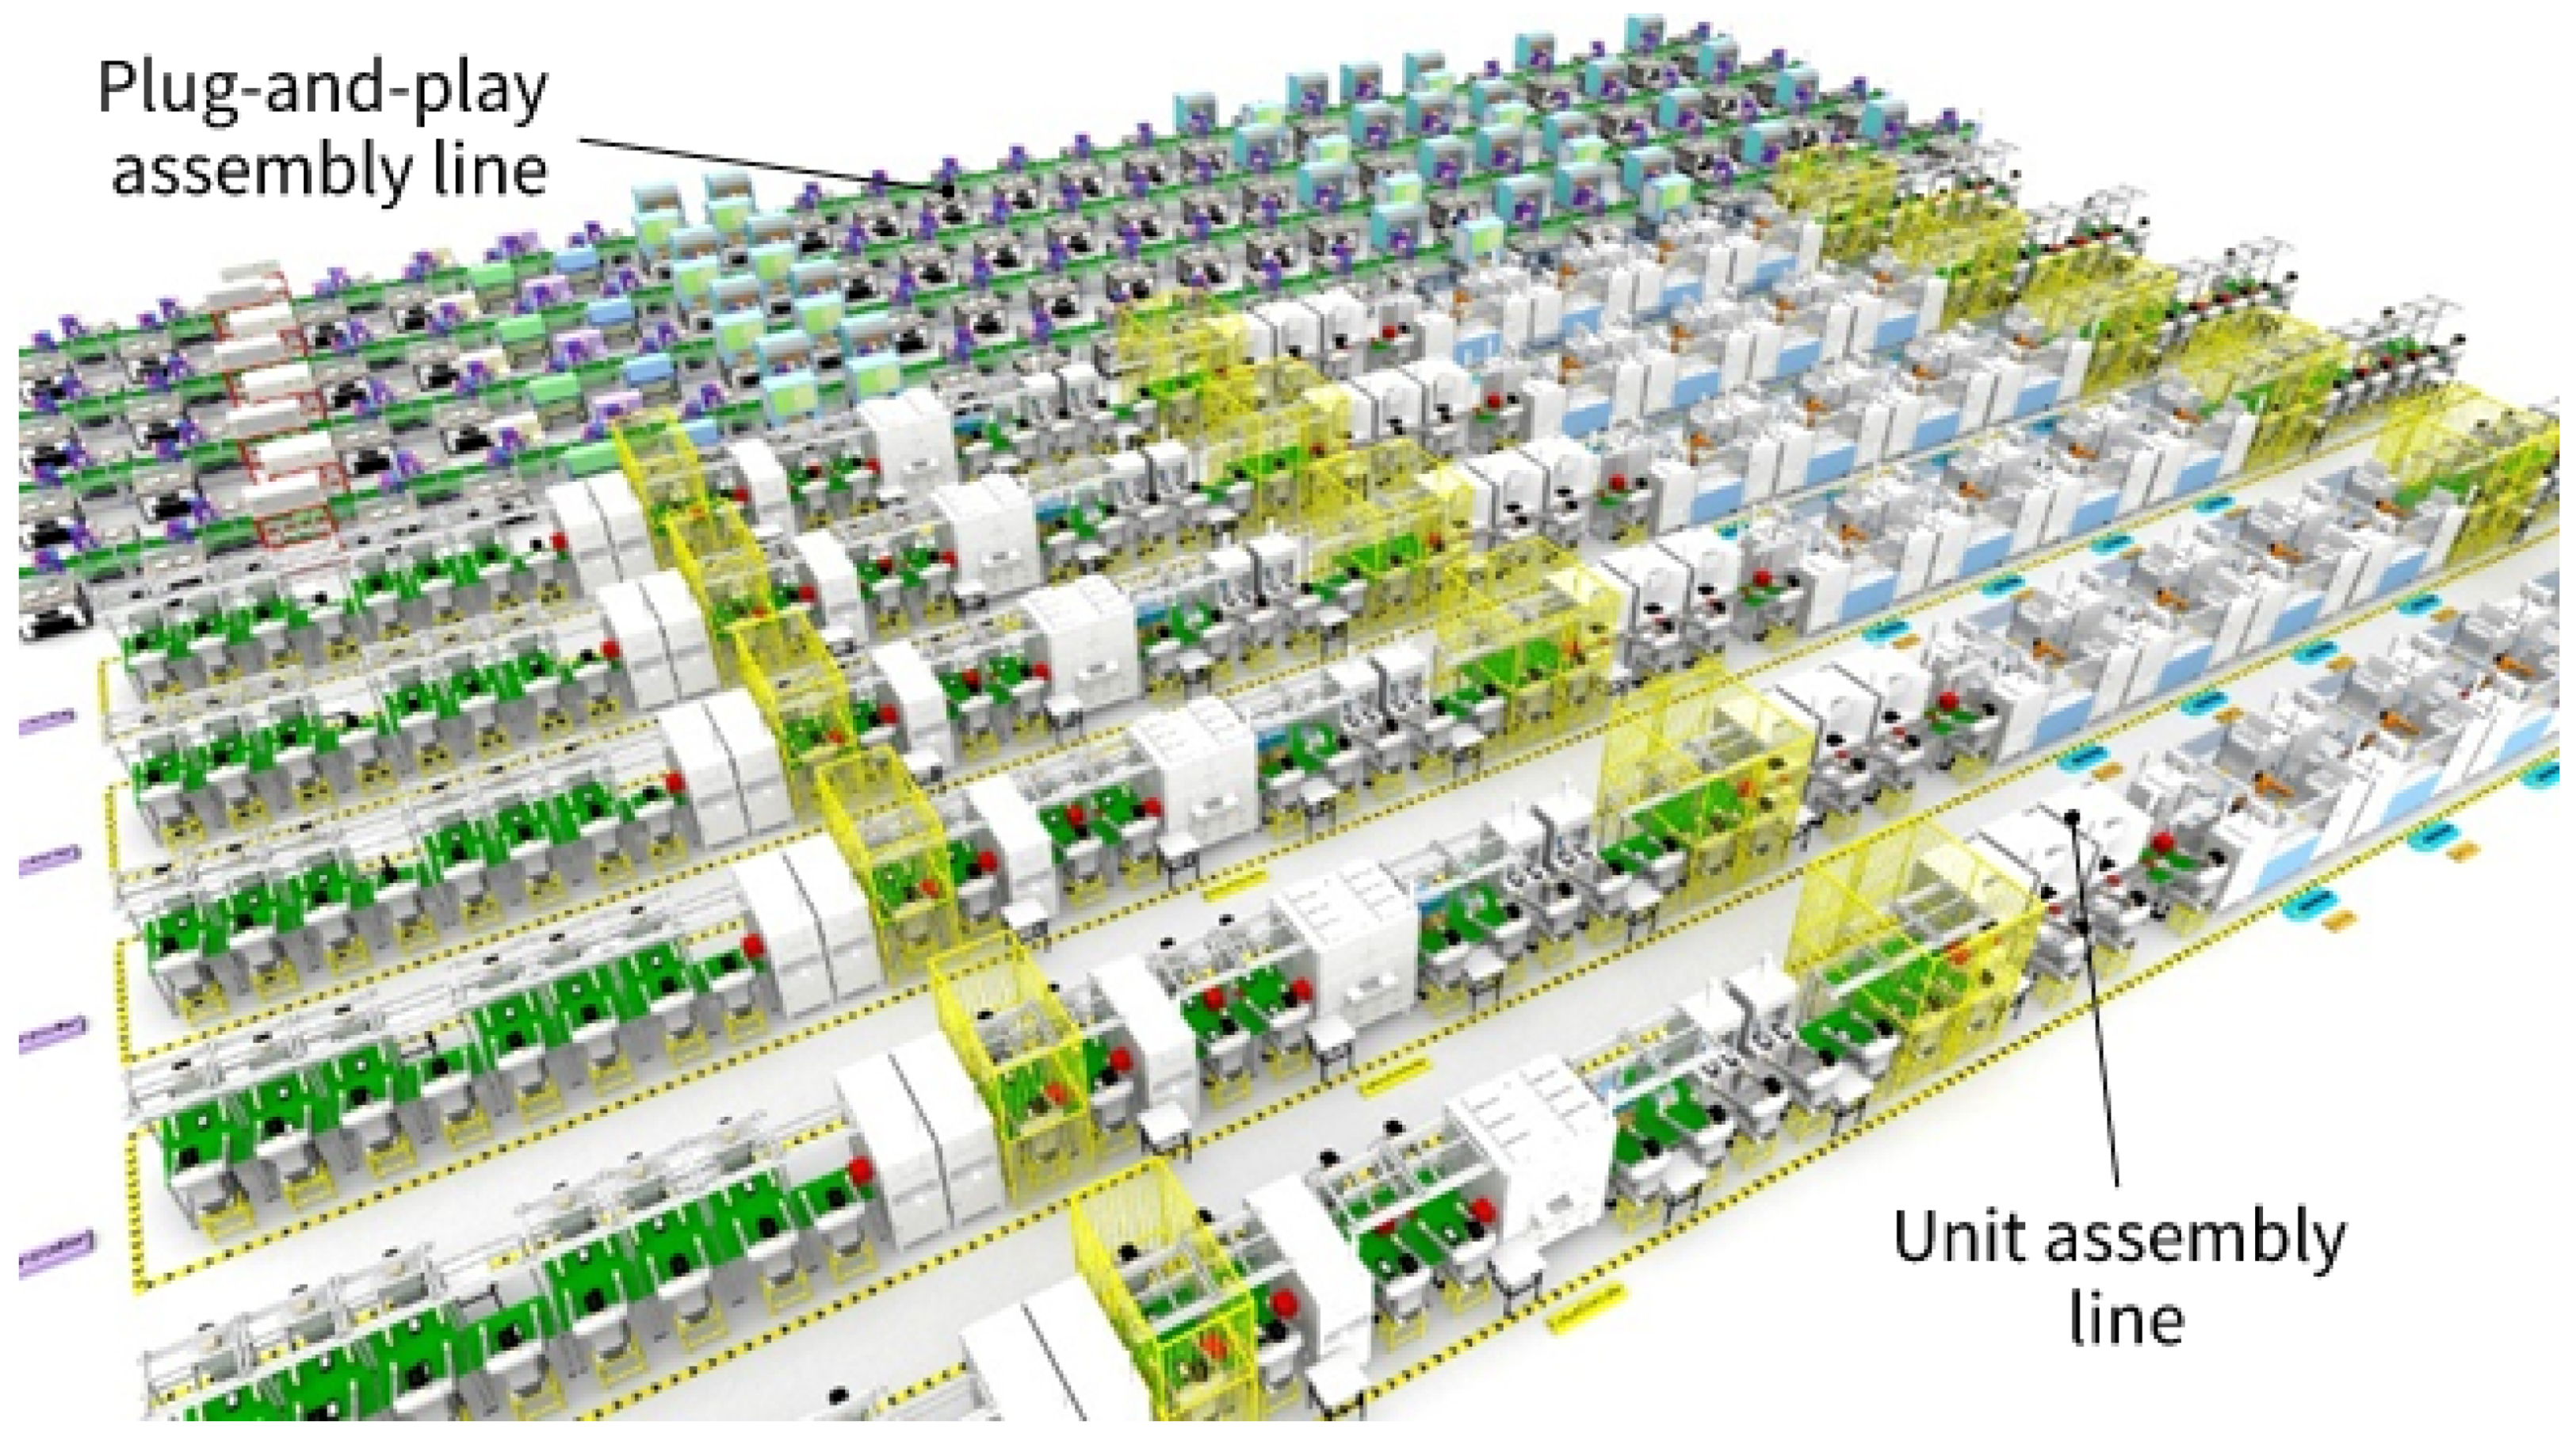
4.1. Plug-And-Play and Unit Production Line Architecture

Figure 3 shows two production line architectures that are commonly used by mobile phone manufacturers: plug-and-play and unit. The two types of production line architectures are compared in terms of the following aspects as follows:
The basic architecture of the production line. The plug-and-play production line is based on the open design concept; each production station and processing equipment can be used as a flexible, independent component, and the production line takes the conveyor as the center, the stations are arranged on both sides, with a specific interval, and the site occupies a large area. The unit production line is composed of several independent units connected in order, and the site occupation area is small.
Production line operation mode. The plug-and-play production line is characterized by line-side job and on-line buffering. The total processing time of the station includes the processing time of the station process and the time for the loading and unloading mechanism to grab and place the work in progress back and forth. The production takt is low; the unit production line is characterized by on-line job and line-side buffering. After processing the products in each unit, they are directly transferred to the next station or line side cache area for waiting. The time for manual transfer and placement of products in the process is short, and the production takt is high.
Automation equipment. The plug-and-play production line adopts equipment, has a set of standardized interface systems, and the actuator can be customized according to the demand. The general platform can be mass-produced, and the price is relatively low. The processing equipment of the unit production line varies in size and manufacturers and is not purchased in batch production, so the cost of the equipment is relatively high.
Line change mode. The general platform used by plug-and-play production lines has a standardized and modular interface. The base adopts a concave design, which can realize automatic handling and disassembly of AGV equipment and rapid line replacement in production line construction [1]. Each independent unit of the unit production line depends on workers’ handling and splicing, so the production line construction takes a long time to change lines.

4.2. Indices of Technical Evaluation

The common evaluation essential parameters for the advantages and disadvantages of the production line design scheme include production takt, cost, balance rate, and balance loss rate.
  • Production takt
    Takt time refers to the average time required to assemble a product determined by the assembly line’s output. The calculation formula is as shown in Equation (1), where C T is the production takt, T is the effective working time and Q is the product output during the effective working time.
    C T = T Q
  • Cost
    Production line costs include construction costs and operating costs. This paper takes the construction cost of production line design into a consideration object, including the equipment and workers’ configuration costs. It is expressed as Equation (2), where C is the construction cost of the production line, C 1 is the equipment cost and C 2 is the wage cost of workers.
    C = C 1 + C 2
  • Balance rate
    The production line balance rate, also known as process synchronization, is the average of all production and manufacturing processes. Reduce idle or blocking caused by the imbalances of processes by adjusting the workload. The formula for calculating the balance rate of the production line is shown in Equation (3), where B R is the balance rate, T s is the sum of the standard working hours of each process, T b is bottleneck time after balance and n is the number of processes.
    B R = T s n T b × 100 %
  • Balance loss rate
    Balance loss rate refers to the production loss of the production line caused by the imbalance of the production line. It is calculated by Equation (4), where L R is balance loss rate and B R is the balance rate.
    L R = 1 B R

4.3. Design of Production Line

The production task of the existing mobile phone assembly workshop requires an annual output of 10 million units, and the workshop work system is shown in Table 1.
Table 1 shows that the annual working time of the workshop is 312 days. By considering all kinds of holidays, the actual working time is about 300 days and the actual effective working hours of the workshop are 13 h per day. The daily production capacity needs to reach 33,334 units to meet the design demand. The target capacity is 200 units per hour for the plug-and-play assembly line and 300 units per hour for the unit assembly line. If the plug-and-play assembly lines alone were used to configure the workshop, it would require 13 assembly lines with a capacity of about 2600 units per day. Equation (1) shows that the target production takt of the assembly line is 18 s. If only the unit assembly lines were used, it would require nine assembly lines with a capacity of about 3900 units per day and the target production takt of the assembly line is 13 s.

4.3.1. Large-Scale Mobile Phone Assembly Line Equipment

The plug-and-play equipment adopts a standard and unified structure, and the equipment’s size is unified. The equipment manufacturer can customize the production of different motion mechanisms and produce the general platform in batches, and the unit price of the equipment is mostly the same. The unit assembly line uses non-standardized design equipment, which can be purchased from different manufacturers according to the demand. The dimensions and various interface modules of the equipment are different. The rated working hours of most equipment on unit assembly lines are the same as those of plug-and-play devices and the working hours of some equipment also need to be set according to the products. The equipment required for a large-scale mobile phone assembly workshop is shown in Table 2.

4.3.2. Design of Production Line Working Hours

The working time of each station is designed by analyzing the automation degree of the process in the large-scale mobile phone assembly workshop. The mobile phone assembly station is divided as shown in Table 1. Equipment selection and working hours design is carried out for the four undetermined automation procedures in Table 2. The plug-and-play and unit automation procedures working hours are obtained as shown in Table 3.
In the actual production of the workshop, the workers do not work continuously or be completed within the specified time due to various factors, including physiological needs, prolonged working fatigue, lack of technical proficiency, etc. Therefore, it is necessary to add a certain amount of extra time based on the working hours to give it relief. In this paper, the comprehensive release rate is 5%. Skilled workers were selected for five simulated operations and then measured the working hours and took the average. It is known that the total working time of taking and putting a mobile phone is 6 s, the main and auxiliary FPC are pressed for 5 s, the upper and lower bracket screws are locked for 5 s, and the battery is rolled for 19 s, the battery is pressed for 5 s, and the fingerprint module is pressed for 3 s. The plug-and-play production line needs to correct the working hours by combining the relaxation coefficient and the time for taking and putting the mobile phone. Different from the type of plug-and-play, the unit assembly line only needs to consider workers’ and special equipment’s working time. Therefore, the working hours of semi-automated procedures of the two production lines are designed, as shown in Table 4.
The design of the working hours of the zero-automated procedure stations adopts the worker simulation experiment and measurement method and the release rate and semi-automated procedure stations. The design of the zero-automated procedures and working hours of the two production lines is shown in Table 5.

4.3.3. Configuration of the Assembly Line Equipment and Worker

The target production takt of the plug-and-play assembly line is 18 s. The numbers of equipment and workers required are calculated according to Table 3 and Table 4. In this paper, the equipment operation rate r is 90% and the failure rate is 5%. Based on the workshop working rule in Table 1, the assembly line equipment and operating personnel are configured. The formula for the annual working time of the equipment T is shown in Equation (5), where h is the effective working hours per year. The actual effective working time t of the equipment is calculated in Equation (6), where c is the working hours of the station, k is the production capacity demand, and f is the product pass rate. The number of equipment N is calculated in Equation (7).
T = h × 3600 × r
t = c k f
N = t T .
According to production tasks and working hours, the number of equipment and workers required for the assembly line is calculated. The plug-and-play assembly line picks and places the product with a mechanical arm, and its automated procedure stations do not need to configure workers with the actual working hours including equipment processing time and mechanical arm working time. The equipment required for the automated procedures in Table 4 is one set. Except for the battery rolling equipment that requires two sets, the rest of the semi-automated procedures in Table 5 require one set. According to the zero-automated procedures in Table 6, current detection device and MMI detection equipment require four sets each, audio inspection equipment and coupling detection equipment requires three sets each, ultra-wide-angle detection equipment and pasting and assembling equipment require two sets each, camera detection equipment and rear camera assembling equipment require one set each. The number of workers for each procedure requires two to fasten the battery cover, and only one worker is required for the other semi-automated and zero-automated procedures.
By using the same calculation method, it can be obtained that the amount of equipment required for the automated procedures in Table 4 is one set. Except for the battery rolling equipment that requires three sets, the rest of the semi-automated procedures in Table 5 require one set. According to the zero-automated procedures in Table 6, current detection devices require six sets, MMI detection equipment, and coupling detection equipment requires five sets each, audio detection equipment requires four sets, ultra-wide-angle detection equipment, and camera detection equipment requires two sets each, rear camera assembling equipment requires one set. The number of workers for each procedure required is as follows: two workers are required for battery cover fastening equipment, camera detection equipment, ultra-wide Angle testing equipment, and locking screw equipment, and three workers are required for detecting current, assembling, and rolling battery,;only one worker is required for other semi-automated and zero-automated procedures.

5. Design and Simulation Optimization of Large Mobile Phone Assembly Hybrid Workshop

5.1. Design of Hybrid Workshop

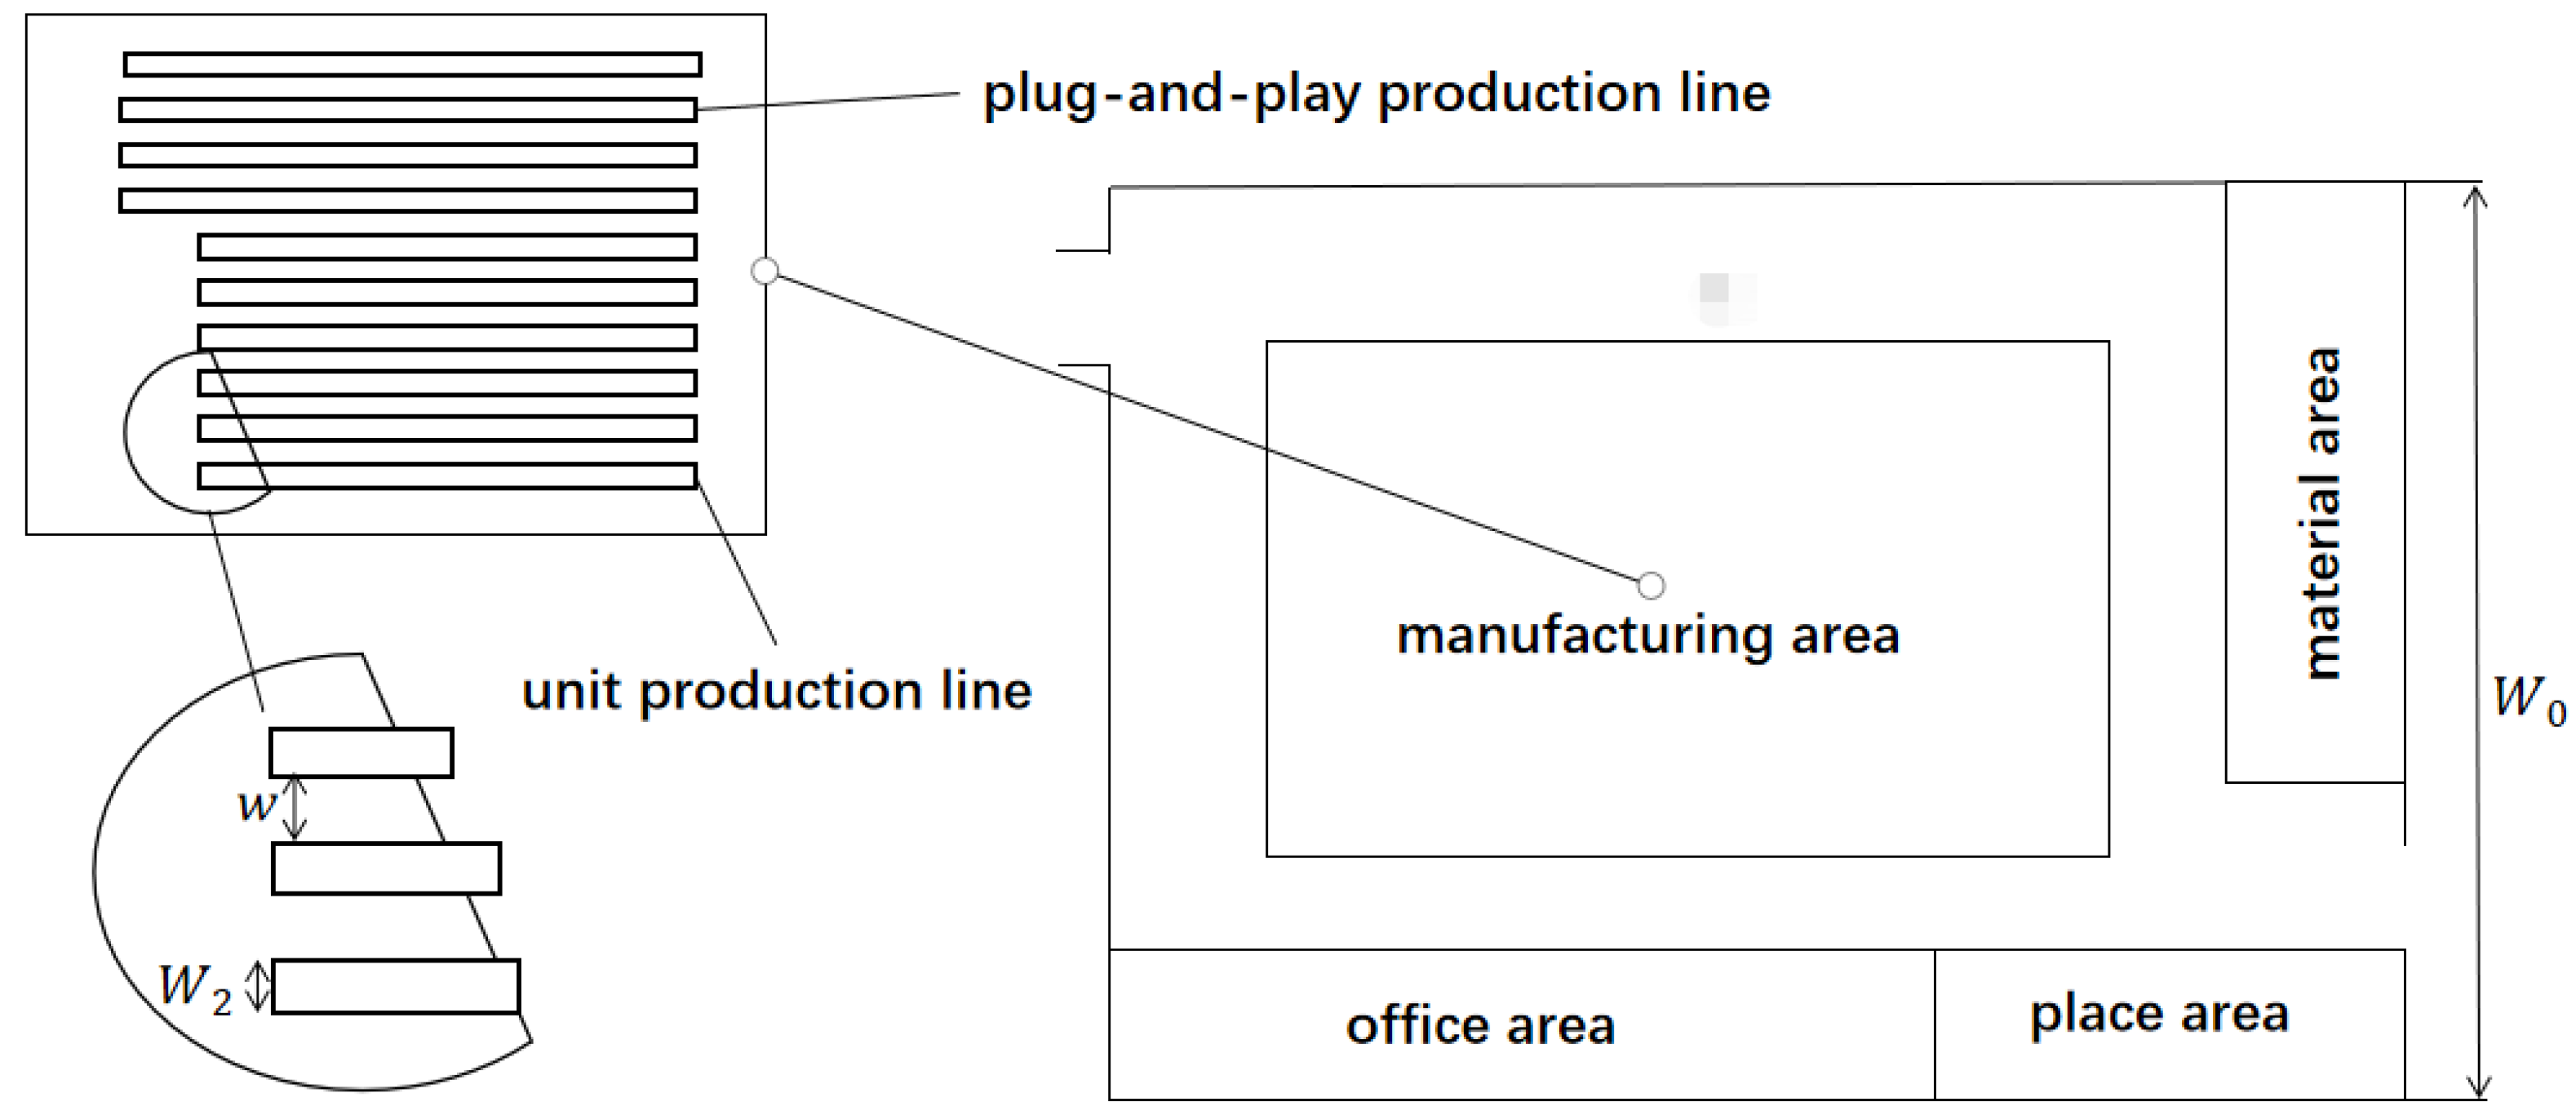
5.1.1. The Layout of the Hybrid Assembly Workshop

The hybrid assembly workshop refers to the type of assembly line configured in the mobile phone assembly workshop, including plug-and-play assembly lines and unit assembly lines. This paper designs and optimizes the hybrid workshop according to the existing two types of assembly line design schemes. Because the configuration schemes meeting the workshop production task objectives are not unique, it is necessary to design an appropriate scheme following the actual demands of the mobile phone manufacturer. Based on the construction cost and production capacity per unit area of the workshop assembly line, this paper designs the configuration quantity of two types of assembly lines in the hybrid workshop.
In response to the above problems, this paper adopts the layout design for the assembly line in the hybrid workshop as shown in Figure 4, and its workshop is 80 m long and 68 m wide:
  • The geometric layout of the assembly line. The flow direction of the mobile phone is designed in a one-way form, and both types of production line adopt the linear type.
  • The method of placing the assembly line. Each assembly line will be placed horizontally to reduce the cost of waste and assembly line capacity loss caused by logistics factors by considering the location relationship between the manufacturing area and the material finished product area.

5.1.2. Quantity Design of Assembly Line in the Hybrid Workshop

According to the relevant parameters of the two types of assembly lines, this paper comprehensively considers construction cost and workshop area utilization rate for the workshop production line, establishes the workshop design optimization model of hybrid production lines, and calculates the number of plug-and-play assembly lines and unit assembly lines. Considering construction cost and workshop area utilization rate, we can get:
  • The construction cost of a production line
It can be seen from Equation (2) that the production line construction cost includes the cost of equipment purchase and workers’ wages. The workshop assembly line construction cost is the sum of all types of assembly-line construction costs in the workshop. So we can define Equation (8), where C C is the construction cost of the workshop assembly line, D C i is the equipment purchase cost of the i-th kind assembly line, H C i is the cost of workers’ wages on the assembly line, N i is the number of the i-th kind assembly line, and n is the number of types of the assembly line in the workshop.
C C = i = 1 n ( D C i + H C i ) N i .
  • The production capacity per unit area of the production line:
Rational use of the site area and scientific arrangement of the production line can meet the production demands and reduce the floor area of the production line to maximize the production capacity per unit area of the assembly line. It can vacate more logistics channels, storage areas, and other spaces for the workshop to improve the plasticity of the workshop. As shown in Equation (9), where U R is the unit area production capacity of of the assembly line, S i is the floor area of the i-th kind assembly line, P C i is the production capacity of the i-th kind assembly line and S is the additional area required to scientifically layout the production line.
U R = i = 1 n P C i N i S + i = 1 n S i N i .
Define different weight values for the objective function and convert it into a single objective function; then, the objective function for the quantity design of hybrid mobile phone assembly lines can be defined as Equation (10).
min F = u 1 C C + u 2 ( U R ) = u 1 i = 1 n ( D C i + H C i ) N i u 2 i = 1 n P C i N i S + i = 1 n S i N i .
The number of various production lines in the workshop should be designed to meet the specific demands of customers for production capacity. It can be expressed as Equation (11), where P C T is the target production capacity of the workshop.
i = 1 n P C i N i P C T .
From the perspective of workshop operation, workshop safety and material handling need to be guaranteed, so there should be at least a 2 m wide interval channel between assembly lines. Because the assembly lines in the hybrid workshop adopt a linear layout, we can define Equation (12), where N is the number of assembly lines, W 0 is the width of the workshop manufacturing area, W i is the width of the i-th kind assembly lines and w is the interval channel width of assembly lines.
N = i = 1 n N i W 0 + 2 i = 1 n W i w .
The configuration and operation of the workshop are very complex, especially the workshop with diversified manufacturing units. When comprehensively considering how to design a workshop, the solution of the designed relevant model needs to be optimized in combination with intelligent algorithms such as genetic algorithms and simulated annealing algorithms. In this paper, we only consider the construction cost and production capacity per unit area of the production line and ignore the capacity loss caused by the actual logistics of the workshop, the material relationship between the production lines and the scalability of the workshop, etc. Therefore, the quantity configuration of the hybrid workshop assembly line can be solved based on the existing relevant data.
It is known that the hybrid workshop includes two types of assembly lines, and the value of n is taken as 2. The weight value should be set according to the demand. This paper adopts the same weight for the two indices; so we set both u 1 and u 2 to 0.5. According to the assembly line design and the size of the equipment in Section 4.3, the dimensions of the line of the production line can be obtained. The width W 1 and the length L 1 of plug-and-play assembly lines are 3.5 m and 51 m, the width W 2 and length L 2 of unit assembly lines are 2 m and 49.5 m, and the interval channel width of assembly lines w is set to 2 m. Combined with the relevant design and configuration parameters of the two types of assembly lines in Section 4.3, the solution result shows that the number of plug-and-play assembly lines is 3.77, and the number of unit assembly lines is 5.86. By rounding upward to an integer, the design demand of the workshop hybrid production line is shown in Table 6. The layout of the whole hybrid workshop is shown in Figure 5.

5.2. Simulation and Optimization Analysis of Assembly Line in Hybrid Workshop Based on Semi-Physical Simulation Technology of Digital Twins

In this paper, Emulate3D simulation software is selected to simulate the design scheme. By completing the parameter configuration and simulation modeling of the production line, the digital twin model of the workshop is generated. The physical simulation technology of digital twin is used to predict the operation status of the design scheme, analyze the simulation results and optimize the design scheme.

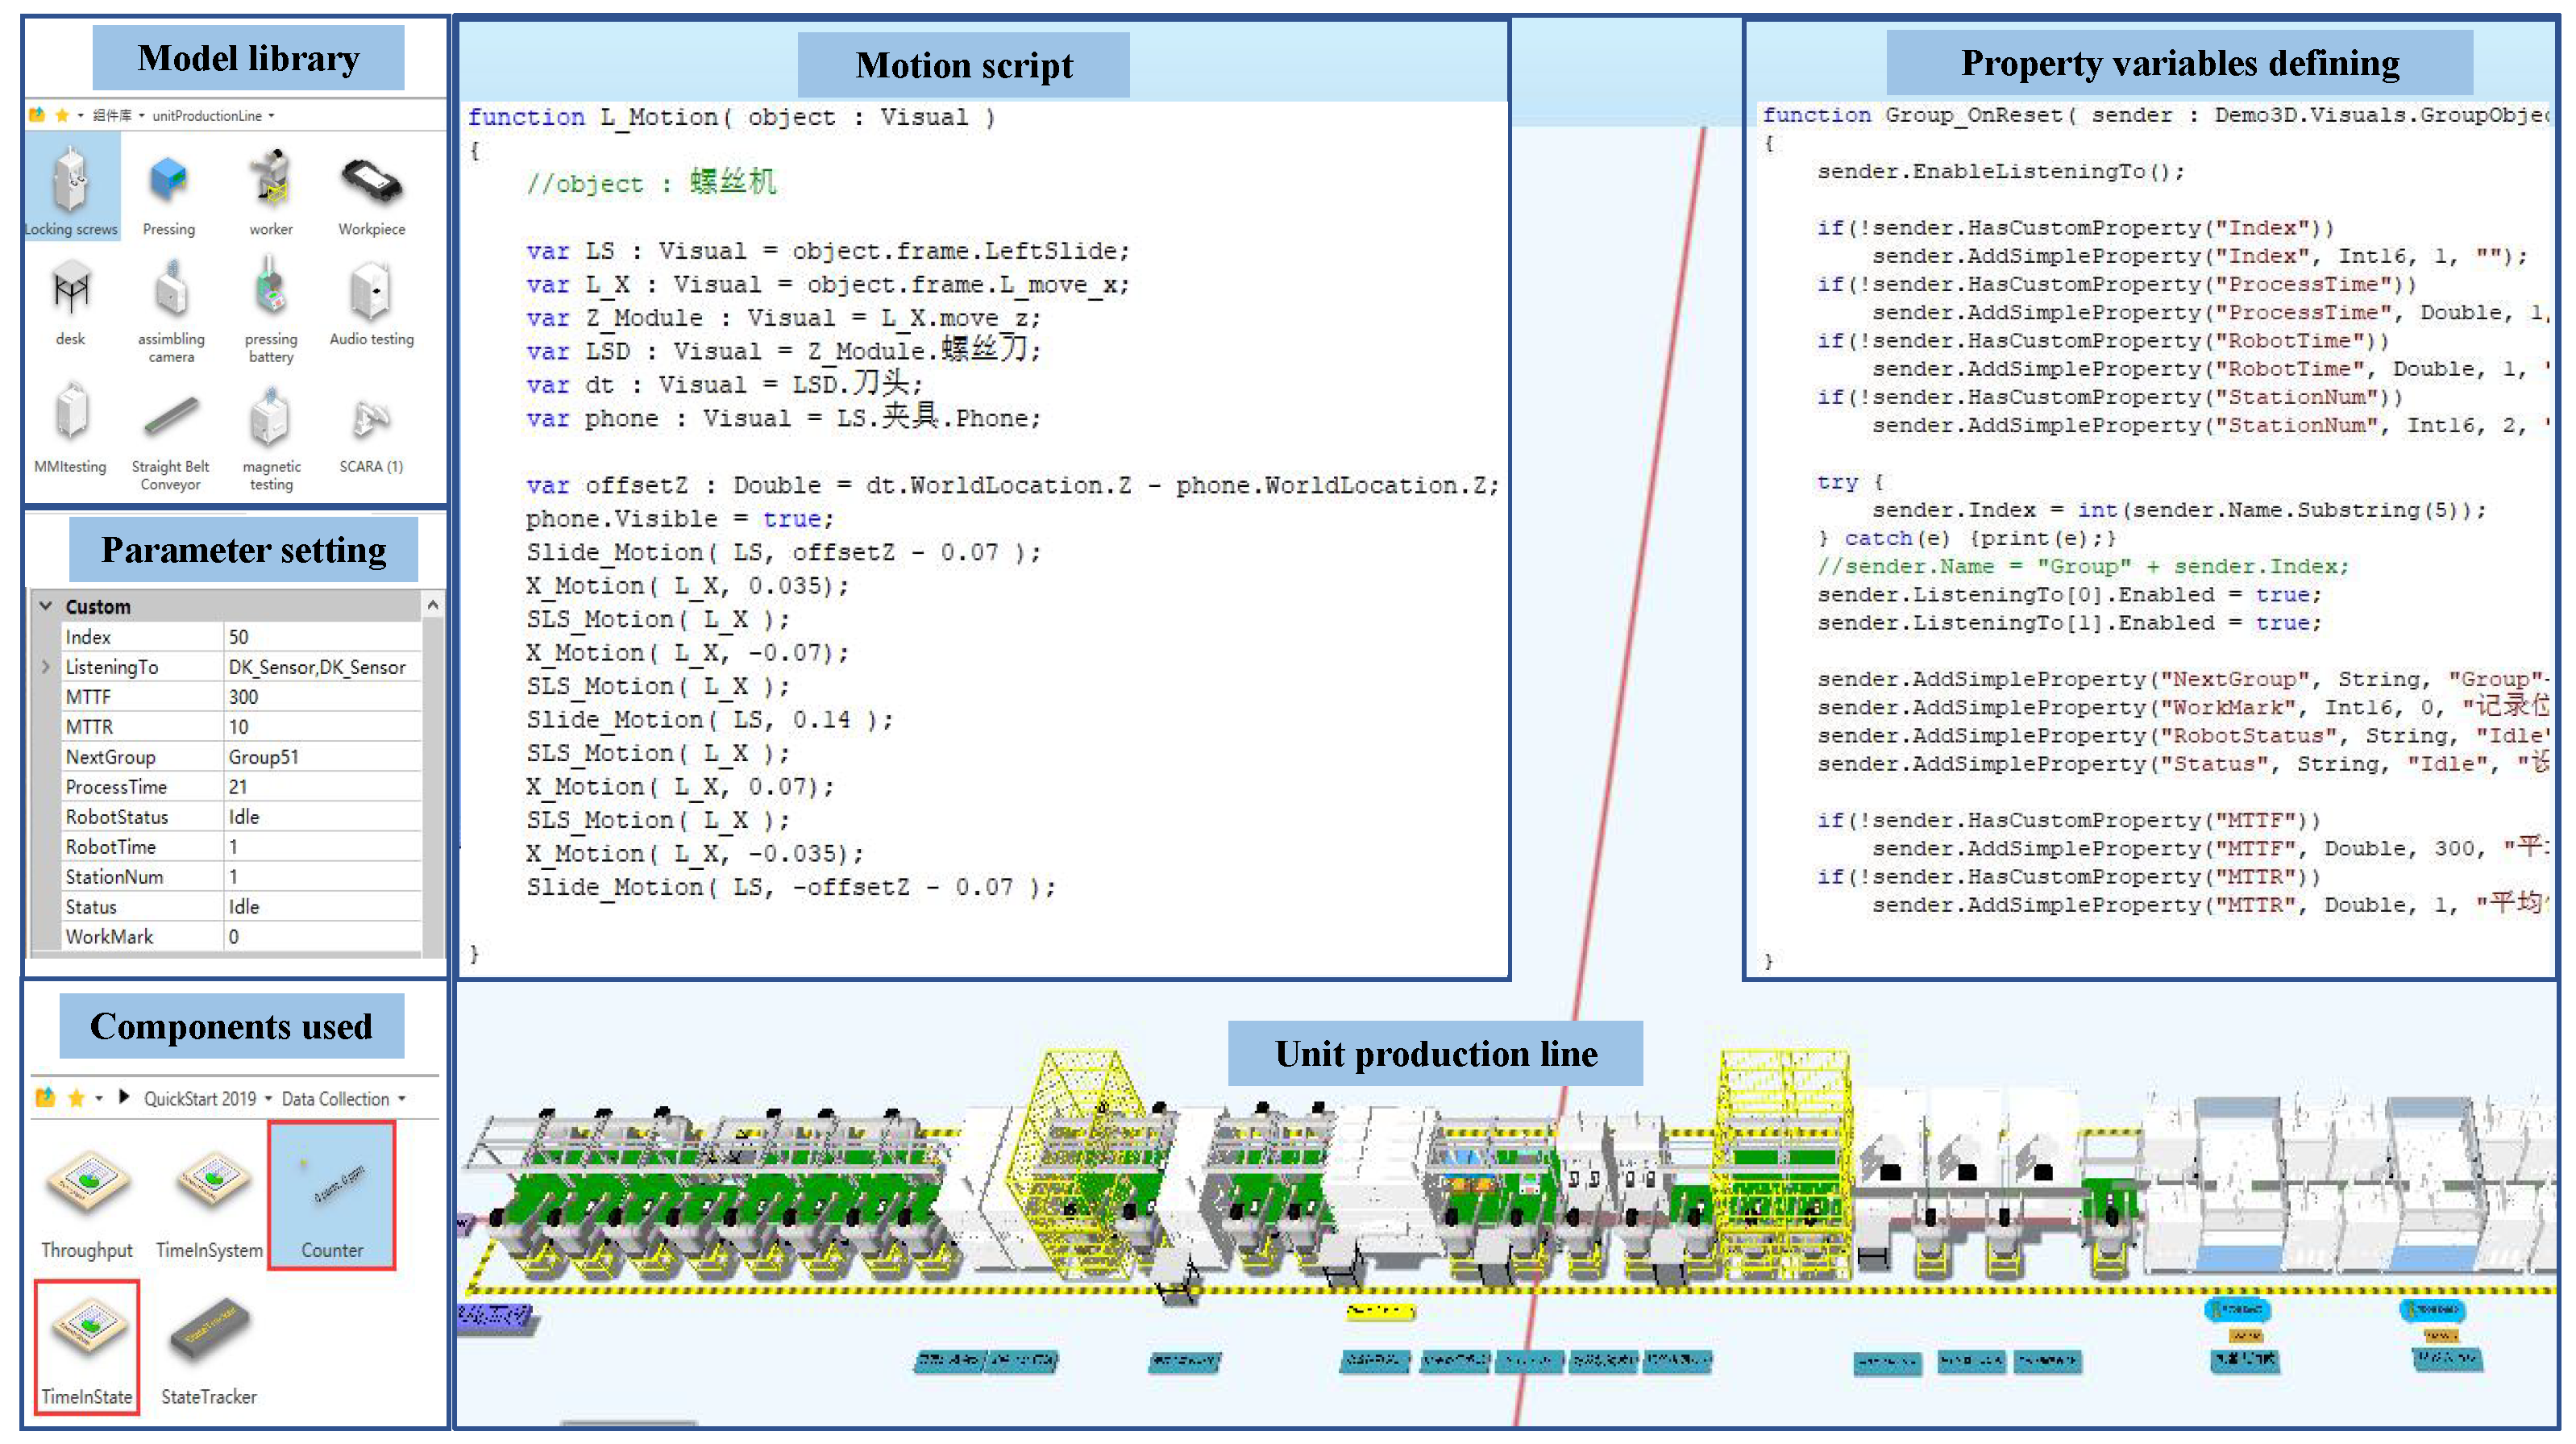
5.2.1. The Construction of Semi-Physical Simulation Model

Based on the hybrid workshop assembly line design detailed in Section 5.1, a simulation model of the workshop was established, and the unit production line was used to illustrate the model building process. The steps are shown in Figure 6 and are as follows:
Step 1. Establish a simulation model library. SOLIDWORKS and other3D modeling tools are used to build relevant models, and the assembly line model library is established after the model is lightweight. It is known that the assembly line adopts a linear type. According to the division of stations, each station is connected in a logical order. The static simulation model of the assembly line is established.
Step 2. Motion script writing. The static model can only reflect the appearance, structure, shape, and position relationship of the assembly line but can not reflect the actual production operation of the assembly line, which lacks authenticity. Corresponding action and motion scripts can be written to drive the dynamic operation of the three-dimensional physical simulation model and realize simulation visualization.
Step 3. Define relevant property variables and parameter settings. Various variables related to the production line need to be defined and recorded. Define the working status of the station, including working, idle, blocked, and equipment maintenance, and define the working time, idle time, mean time to failures MTTF, and mean time to repair MTTR. Based on the previous station design, initialize the status of each station. The Counter component in the software Data Collection library is used as the mobile phone quantity counter. The Timeinstance component is used to calculate the work, idle, blocking, fault, and maintenance time of the station.

5.2.2. Simulation and Optimization Analysis
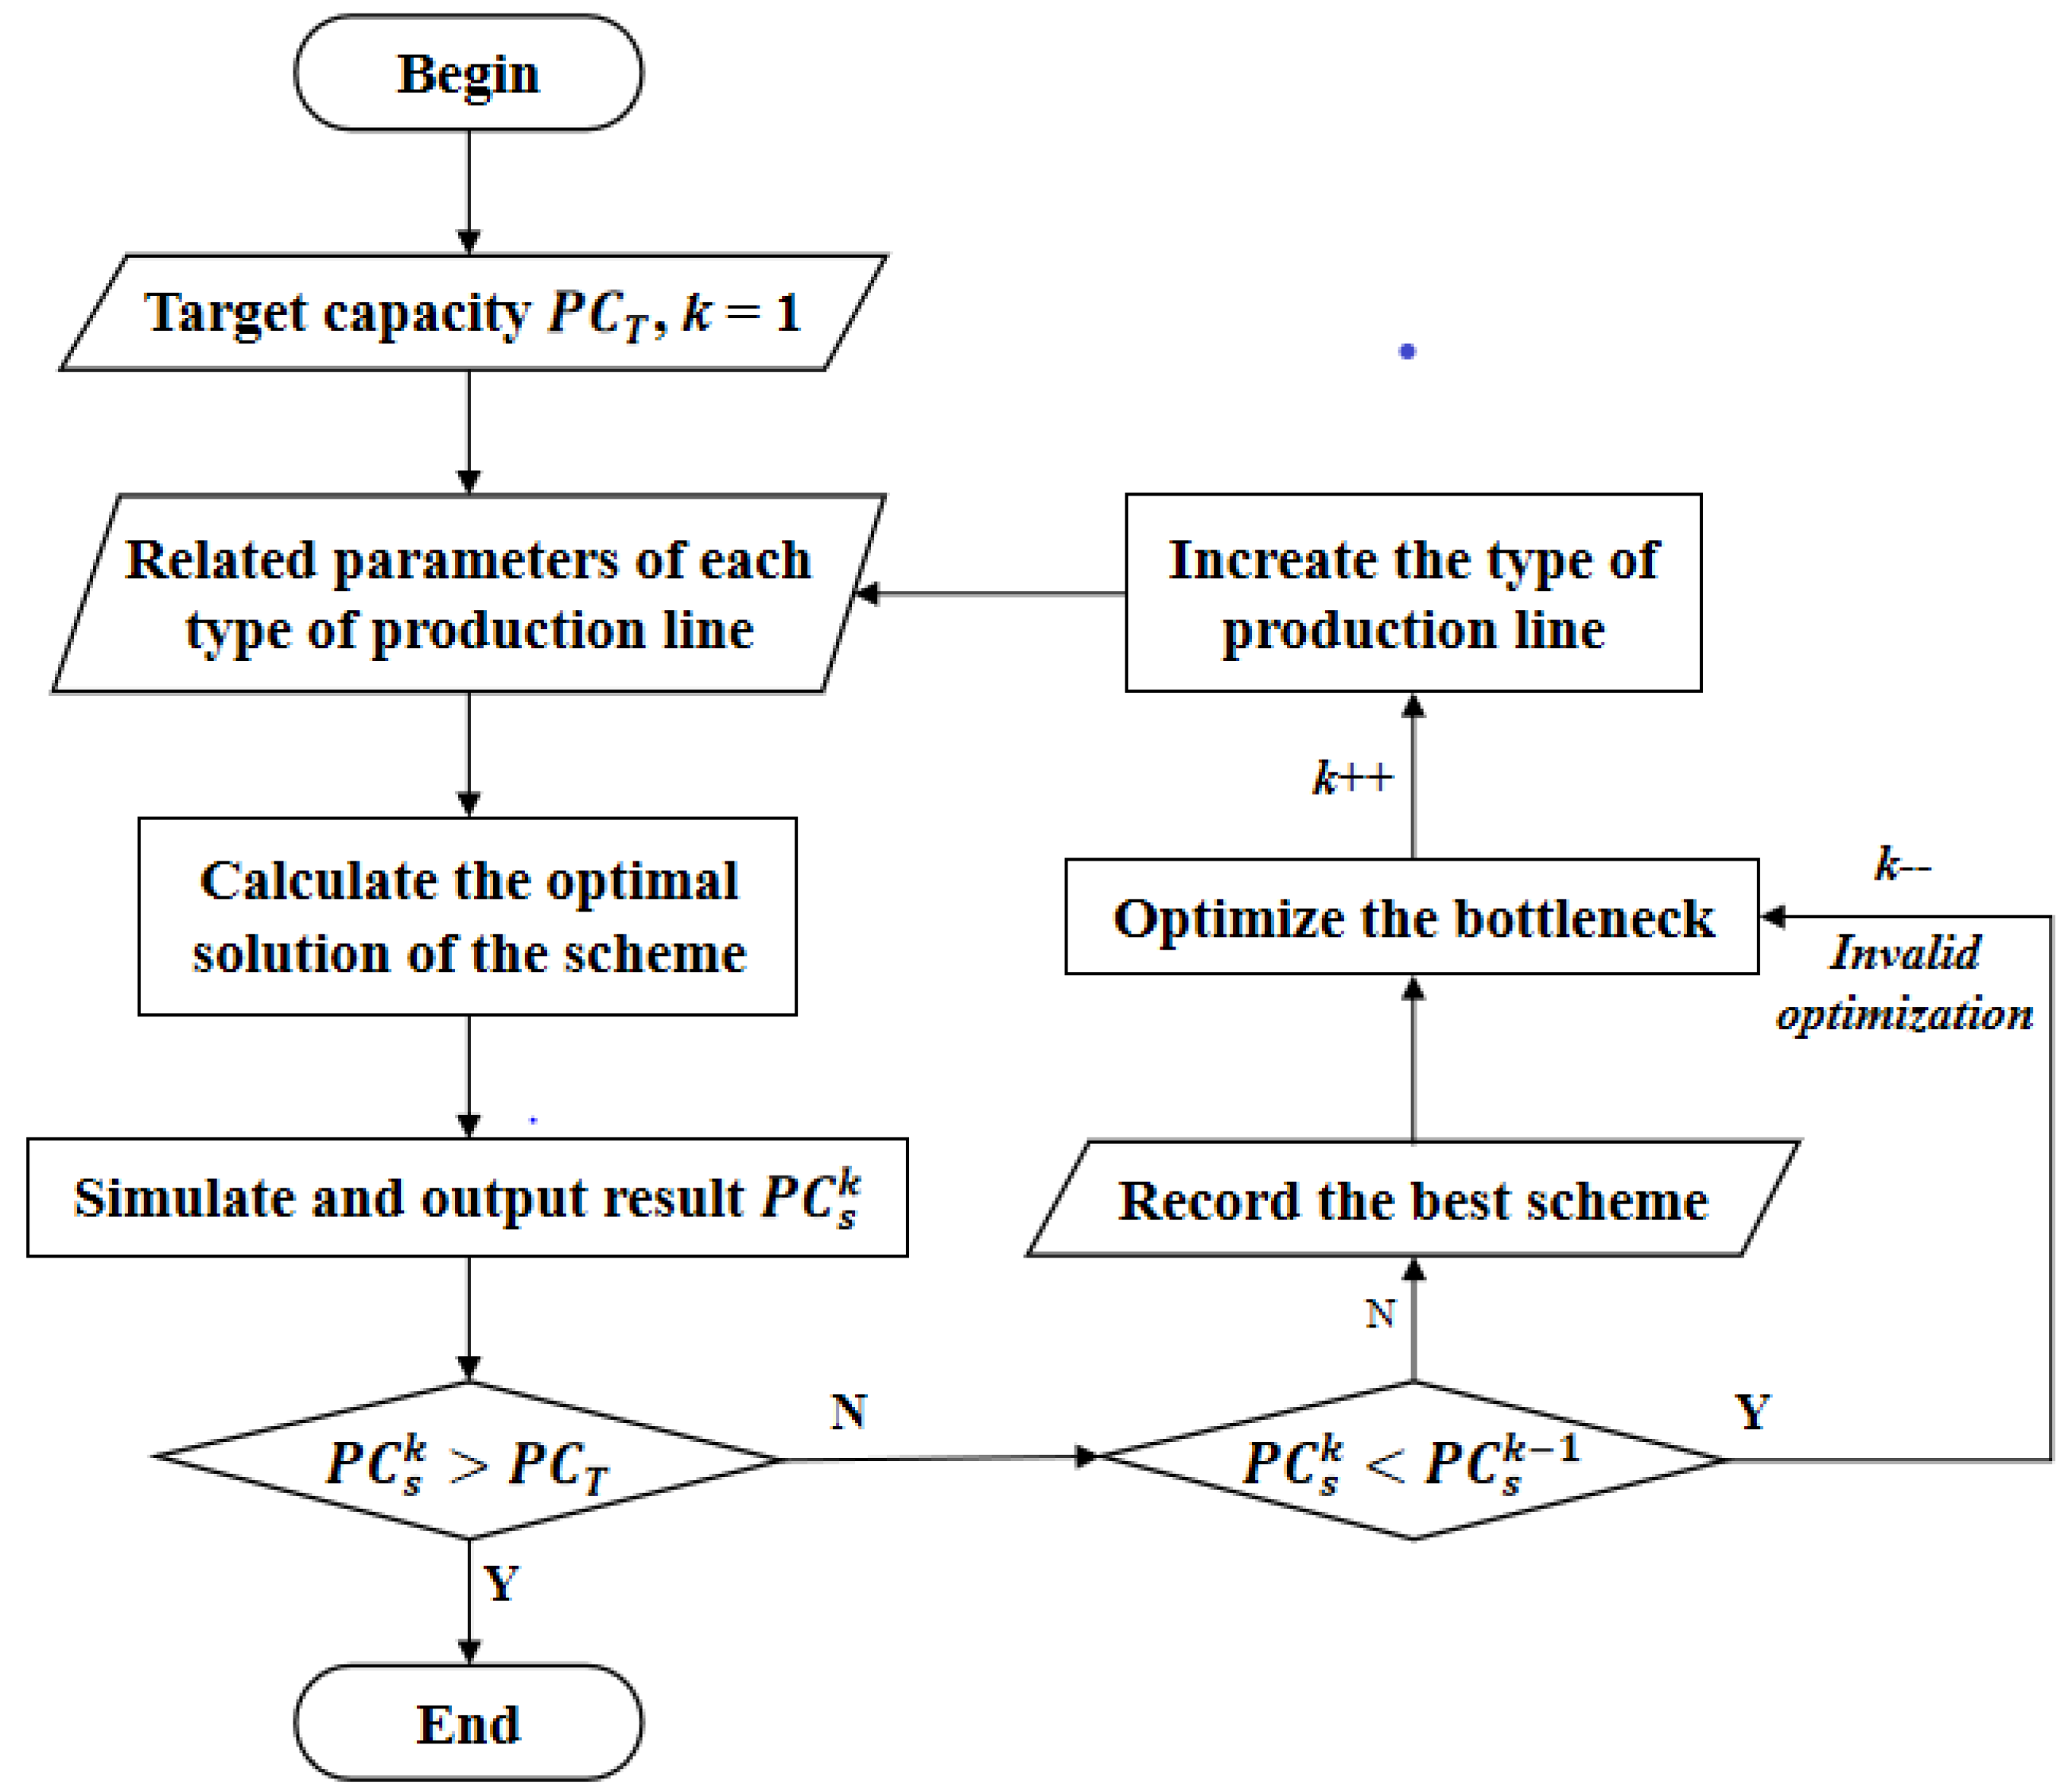
Although the actual historical data of the workshop is unavailable as a reference in the design stage of the hybrid assembly workshop, there is the operation data of each unit of equipment. Besides process parameters, some historical operation data can be counted, such as failure rate, mean time between failures (MTBF), and mean time to repair (MTTR). To make the simulation result as close as possible to the actual workshop situation, the fluctuation amplitude A of all kinds of data is calculated in Equation (13), where V x represents the value of production takt, MTBF, MTTR, and other data at a certain time. The time-dependent random disturbance function F d i s t r u b ( t ) that follow normal distribution are introduced. These run-time statistical data are injected into workshop digital twins model after random disturbance processing by Equation (14), which can realize a semi-physical simulation based on distributed historical data [38]. The design scheme and decision can be verified and fine-tuned with the help of computer-aided design tools while the scheme can be iterated and optimized in a controllable way [39].
A = a v g ( ( V x a v g ( V x ) ) 2 ) , x { T A K T , M T B F , M T T R , . . . }
V x ( t ) = A · F d i s t r u b ( t ) + V x .
Based on the parameter configuration of the two types of assembly lines described in Table 6 and Section 4.3, a hybrid mobile phone assembly workshop model is built and simulated. The simulation analysis shows that the workshop capacity is 9,385,647 units, which do not meet the workshop production demand. The analysis report of each assembly line takes the month as the unit. According to the analysis of 12 data reports of these two types of assembly lines, it can be seen that the bottleneck station of the plug-and-play assembly line is the “Checking Overall Appearance” station and the unit assembly line is the “Pressing Battery Cover” station.
For bottleneck stations, optimization can be achieved by increasing workers’ input, improving equipment or regrouping procedure groups. The bottleneck optimization is to minimize the optimization cost and balance the production line as much as possible. The balance rate of the production line can effectively reflect the load balance of the production line, but it cannot measure the load fluctuation between the stations. The average deviation between each station’s takt time and the bottleneck’s takt time is an index to describe the degree of load fluctuation between stations [40]. As shown in Equation (15), K is the number of stations in the production line, t t i is the takt time of the i-th station, and B T is the takt time of the bottleneck. Compared with the balance rate, this index can better reference for procedure grouping to ensure that the processing time between stations is as equal as possible.
L F = i = 1 K ( t t i B T ) 2 K .
Various factors and constraints limit workshop operation optimization, and the improvement and optimization direction of hybrid production line workshops is not unique. Considering the construction cost of the workshop production line, the bottleneck links of each type of production line should be optimized respectively. The plug-and-play bottleneck station is the “Checking Overall Appearance” station. According to the analysis results in Table 1, this process is zero-automated. Workers can check the product by observation, so an additional worker is adopted to improve the station. The bottleneck station of the unit assembly line is the “Pressing Battery Cover” station. It can be seen from Table 1 that this process is automated, so it can be improved by adding pressing equipment.
The optimized simulation results are shown in Figure 7a. It can be seen that improving each type of assembly line in the workshop cannot achieve the production task goal. Therefore, the two types of production lines need to be improved cooperatively. There are many optimization methods to improve, but this paper only shows two optimization methods. The first optimization method is to simultaneously improve the performance of all plug-and-play assembly lines and unit assembly lines. It means that a worker is added to the “Checking Overall Appearance” station of all plug-and-play assembly lines, and the pressing equipment is added to the “Pressing Battery Cover” station of all unit assembly lines. The experimental results are shown in Figure 7b. It can be known from the experimental results that the production capacity is 12,689,771 units. Although it has far achieved the workshop production goal, it will cause excess production resources in the assembly line workshop and cost waste at the same time. Therefore, the scheme is feasible but not reasonable.
To summarize, moderate comprehensive optimization should be carried out for the two assembly lines based on the constraints of bottleneck optimization. Due to the constraints, several iterations may be needed to obtain the solution that meets the conditions. The execution process of iterative optimization is shown in Figure 8 and Figure 9, the notations in the iterative calculation are identified in Table 7, and a detailed description is as follows:
1.
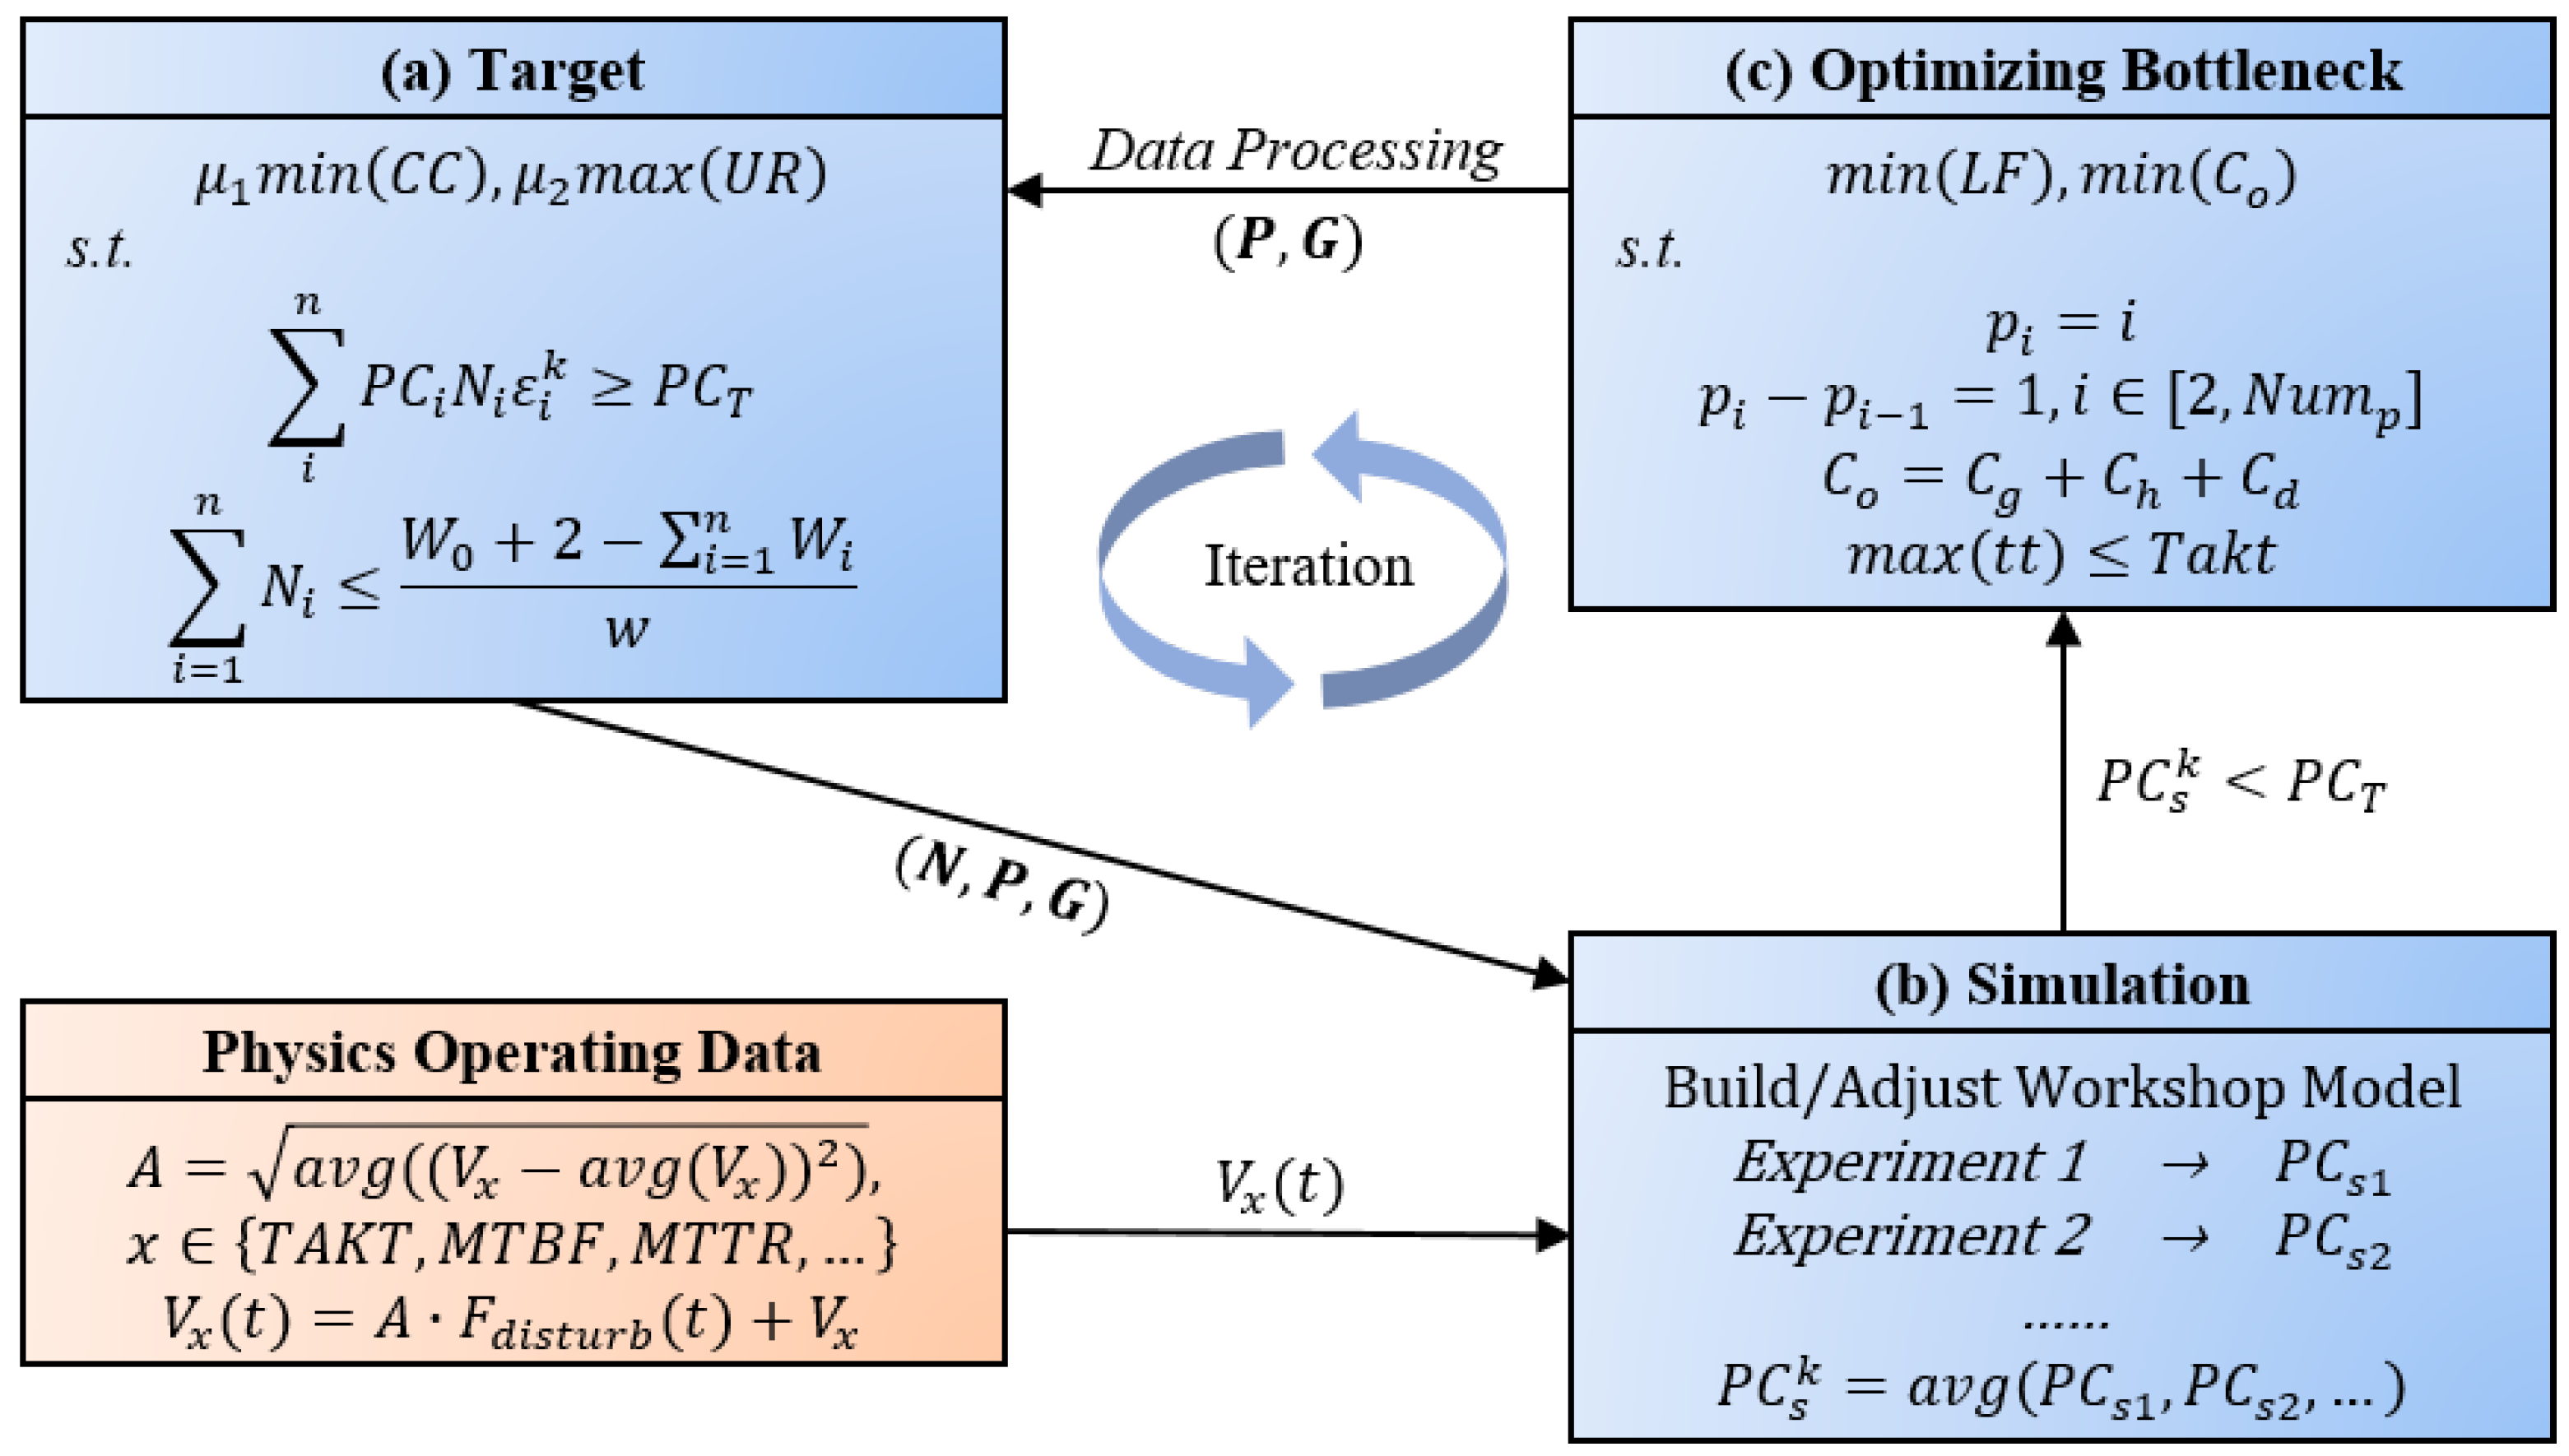
Figure 9a shows that the iterative optimization objective of minimizing the construction cost C C and maximizing the capacity U R is defined according to Equation (10). The value of variables is limited by Equations (12) and (16) to obtain the quantity of production lines configuration N of various types of production lines based on the current process grouping G and process takt time sequence P.
2.
Input the quantity of production lines solution N value calculated in the previous step, together with the grouping of procedures solution G and takt time of process solution P values, into the Emulate3d digital twin simulation software to establish a specific virtual workshop model, then introduce the historical data of physical workshop runtime statistics. Use the event simulation module built in the software to conduct multiple simulation simulations and statistics. Finally, obtain the simulation capacity result P C s k of the design scheme to verify the feasibility of the scheme obtained by the mathematical model, as shown in Figure 9b. In particular, to simulate the abnormal conditions in the actual workshop operation as realistically as possible, the time-dependent random disturbance function F d i s t r u b ( t ) is introduced to determine the relevant data of the production process.
3.
If the average production capacity P C s k is more minor than the target production capacity P C T , it indicates that the current scheme can meet the design requirements, the iteration ends, and the results are output; Otherwise, proceed to the next iteration. If P C s k is less than the capacity result P C s k 1 of the previous iteration, the scheme has not been improved. Bottleneck optimization should be carried out for the results of the previous iteration. Otherwise, bottleneck optimization is carried out for this scheme.
4.
As shown in Figure 9c, lowering costs as much as possible to reduce the bottleneck location affects the production line’s performance, minimizing the station load fluctuations L F and optimizing cost as the goal. This optimizes and adjusts the bottleneck station or sub-bottleneck station. Then the optimized process grouping G and process takt time sequence P are input to the mathematical model in Figure 9a, and a new Cycle iteration starts until the simulation scheme meets the design requirements.
After the bottleneck optimization for a certain type of production line, the construction cost, floor area, and production capacity of the production line will change. It can be considered that the optimized production line is not the same type as the original production line. In other words, there are four types of production line after bottleneck optimizing for two types of production lines at the same time. By inputting the relevant parameters of these four types of production lines into the constraint equation in Section 5.1.2 for solving, the not optimized number of plug-and-play and unit production line and the optimized number of production line can be obtained. However, compared with the original production line, the related parameters of the optimized production line will increase, especially the production capacity. If the original equation is not modified, the solution of the minimum objective function will achieve the same result as that without optimization. Therefore, the optimization of iterative calculation should be constrained according to the simulation results of the scheme without optimization to ensure that a better value can be obtained after iteration.
Theoretically, under the constraint of inequality (11), the results obtained by the equation can meet the capacity requirements. However, the production capacity obtained by the simulation with disturbance is smaller than the theoretical value. It indicates that the capacity of the production line cannot reach the ideal value under the influence of some factors. Therefore, the capacity of the original production line without optimization should be modified in each iteration, as shown in Equation (16). The correction coefficient ε i k of i-th iteration of the i-th kind production line is calculated in Equation (17), where P C s k is the simulation result after the k-th iteration. In particular, n k represents the total number of production line types in the k-th iteration. Moreover, i > n k 1 means that the i-th kind production line is the new type of production line at the k-th iteration. This production line is based on the original type of production line optimization.
i = 1 n P C i N i ε i k P C T , k N +
ε i k = P C s k 1 P C T , k > 1 i n k 1 1 , k = 1 i > n k 1 .
After the above iterative process calculation, the optimized experimental results are shown in Figure 7c, which can meet the production demands with 10,106,781 units. The optimization scheme is optimized for all six unit assembly lines and only two plug-and-play assembly lines. The assembly line balance optimization scheme satisfying the hybrid workshop is not unique. We can select more appropriate optimization schemes for the two types of production lines according to the actual demands, such as the scheme of bottleneck improvement for all plug-and-play production lines and improvement for some unit production lines, the improvement scheme of all unit types and partial plug-and-play types, and the scheme of selecting some two types of assembly lines for collaborative improvement, etc. It can also improve all types of assembly lines at the same time. However, since the simulation results are far greater than the workshop target production task, from the perspective of cost, causing the waste of resources and high cost of the assembly line. There is one thing that could be certain no matter what improvement method is adopted, the specific choice should depend on the actual demand and situation to achieve the production goal of the workshop.

5.3. Evaluation of Production Line Scheme of Hybrid Workshop

This paper optimizes the design scheme of the workshop by adding equipment or workers to the bottleneck stations, which will inevitably lead to an increase in the construction cost of the workshop. However, we judge the adequate utilization degree of the workshop site area from the capacity per unit area. At the same time, the assembly cost of a mobile phone is obtained from the construction cost and unit area capacity, and the overall benefit of the workshop is judged from the assembly cost of the mobile phone. The design scheme of a hybrid workshop was evaluated based on the production line construction cost and unit area capacity. Integrating the original construction cost of the two types of production lines and the improvement cost of the scheme, before optimization, the construction cost of a unit production line is 9,347,550 y u a n , and the construction cost of a plug-and-play production line is 8,784,600 y u a n , and the total assembly line construction cost of the workshop is 91,223,700 y u a n . Based on the above optimization scheme, the workshop increased six sets of pressing equipment and two workers after optimization, and the total assembly line construction cost of the workshop was 92,998,400 y u a n . According to the relevant parameters of the assembly line in Section 5.1.2, it can be known that the floor area of the hybrid mobile phone assembly line workshop is 1308 m 2 . Before optimization, the annual output of the assembly workshop was 9,385,647 units, the annual capacity per unit area was about 7208 pcs/m 2 , and the average production line hourly capacity per unit area was 1.85 units. After optimization, the annual output of the assembly workshop is increased to 10,106,781 units, the annual capacity per unit area reaches 7763 pcs/m 2 , and the average hourly capacity per unit area of each production line is optimized to two units. According to the annual output of mobile phones in the workshop and the construction cost of the production line compared between before and after optimization, the assembly and processing cost of each mobile phone is about 0.12 y u a n and 0.102 y u a n respectively. The results before and after optimization are shown in Table 8 as follows. Although the construction cost of the hybrid workshop is increased, the capacity per unit area of a production line is increased and the workshop site is effectively utilized. At the same time, assembly cost has also been reduced, and the overall benefit of the production line has been improved.

6. Conclusions

With the sustained growth of consumers’ demand for personalized and diversified mobile phone products, the mobile phone life cycle keeps shortening, and the product iteration frequency gradually increases. The mobile phone production line must be customized and optimized in a short time to respond to the characteristics of high-frequency production change, high flexibility, and tight delivery time. In this paper, the assembly process of a specific type of mobile phone is taken as the research object, and the primary assembly process of the general mobile phone is introduced. The flexible space of the process and the automation degree of the specific process are analyzed in detail, and the workstations are divided by the heuristic balance method. This paper describes two main types of mobile phone assembly line architecture and puts forward the production line design scheme’s key parameters and evaluation indexes. A mobile phone assembly hybrid workshop was designed to integrate the advantages and disadvantages of plug-and-play and unit production line architecture. Furthermore, the hybrid workshop design optimization model was established based on the production line’s construction cost and production capacity per unit area. The simulation was conducted to verify the proposed scheme by using the semi-physical simulation technology of digital twins. The above research provides a solution and technical scheme for designing and optimizing large-scale mobile phone assembly workshops with multi-batch and high-frequency production changes. It can also be a reference for the production workshop design of similar products.
Currently, there are a few limitations to the study: first, a single type of production line is taken as the mixed object to carry out the design and simulation optimization of the mixed workshop, which leads to the low adaptability of the production line. Second, this study ignores many situations in the actual workshop operation. When designing the hybrid workshop, we only consider the construction cost of the production line and the area utilization rate of the workshop, which leads to the lack of practicability of the designed workshop.
In future research, we can also take the station as the object to carry out the hybrid design of a single production line; that is, a variety of production line architectures can be mixed into one production line to improve the adaptability of the production line further. Moreover, it can integrate the workshop logistics relationship, logistics cost, and production line reconstruction cost, build a mathematical model more in line with the actual needs and use intelligent algorithms such as the genetic algorithm and the simulated annealing algorithm to obtain a better workshop production line scheme.

Author Contributions

Conceptualization, R.Z. and Q.S.; Methodology, R.Z. and G.Z.; Software, G.Z.; Validation, R.Z. and W.D.; Formal analysis, W.D.; Investigation, H.Z.; Resources, H.Z. and A.Y.; Data curation, G.Z. and S.Z.; Project administration, A.Y.; Supervision, R.Z. and A.Y.; Visualization, G.Z. and S.Z.; Writing (original draft), R.Z. and Q.S.; Writing (review & editing), G.Z., Q.S.; S.Z. and W.D. Funding acquisition, A.Y. All authors have read and agreed to the published version of the manuscript.

Funding

This research was funded by the Science and Technology Planning Project of Guangdong Province of China OF FUNDER grant number No. 2019B090916002.

Institutional Review Board Statement

Not applicable.

Informed Consent Statement

Not applicable.

Data Availability Statement

Not applicable.

Conflicts of Interest

The authors declare no conflict of interest.

References

  1. Leng, J.; Liu, Q.; Ye, S.; Jing, J.; Wang, Y.; Zhang, C.; Zhang, D.; Chen, X. Digital twin-driven rapid reconfiguration of the automated manufacturing system via an open architecture model. Robot. Comput. Integr. Manuf. 2020, 63, 101895. [Google Scholar] [CrossRef]
  2. Tao, F.; Zhang, H.; Liu, A.; Nee, A.Y. Digital twin in industry: State-of-the-art. IEEE Trans. Ind. Inform. 2018, 15, 2405–2415. [Google Scholar] [CrossRef]
  3. Leng, J.; Wang, D.; Shen, W.; Li, X.; Liu, Q.; Chen, X. Digital twins-based smart manufacturing system design in Industry 4.0: A review. J. Manuf. Syst. 2021, 30, 119–137. [Google Scholar] [CrossRef]
  4. He, B.; Bai, K. Digital twin-based sustainable intelligent manufacturing: A review. Adv. Manuf. 2021, 9, 1–21. [Google Scholar] [CrossRef]
  5. Tarkesh, H.; Atighehchian, A.; Nookabadi, A.S. Facility layout design using virtual multi-agent system. J. Intell. Manuf. 2009, 20, 347–357. [Google Scholar] [CrossRef]
  6. Zúñiga, E.R.; Moris, M.U.; Syberfeldt, A.; Fathi, M.; Rubio-Romero, J.C. A simulation-based optimization methodology for facility layout design in manufacturing. IEEE Access 2020, 8, 163818–163828. [Google Scholar] [CrossRef]
  7. Deshpande, V.; Patil, N.D.; Baviskar, V.; Gandhi, J. Plant layout optimization using CRAFT and ALDEP methodology. Product. J. Natl. Product. Counc. 2016, 57, 32–42. [Google Scholar]
  8. Liu, J.; Liu, J. Applying multi-objective ant colony optimization algorithm for solving the unequal area facility layout problems. Appl. Soft Comput. 2019, 74, 167–189. [Google Scholar] [CrossRef]
  9. Xu, J.; Li, Z. Multi-Objective Dynamic Construction Site Layout Planning in Fuzzy Random Environment. Autom. Constr. 2012, 27, 155–169. [Google Scholar] [CrossRef]
  10. Turanoğlu, B.; Akkaya, G. A new hybrid heuristic algorithm based on bacterial foraging optimization for the dynamic facility layout problem. Expert Syst. Appl. 2018, 98, 93–104. [Google Scholar] [CrossRef]
  11. Khajemahalle, L.; Emami, S.; Keshteli, R.N. A hybrid nested partitions and simulated annealing algorithm for dynamic facility layout problem: A robust optimization approach. INFOR Inf. Syst. Oper. Res. 2021, 59, 74–101. [Google Scholar] [CrossRef]
  12. Tayal, A.; Singh, S.P. Integrating big data analytic and hybrid firefly-chaotic simulated annealing approach for facility layout problem. Ann. Oper. Res. 2018, 270, 489–514. [Google Scholar] [CrossRef]
  13. Derakhshan Asl, A.; Wong, K.Y. Solving unequal-area static and dynamic facility layout problems using modified particle swarm optimization. J. Intell. Manuf. 2017, 28, 1317–1336. [Google Scholar] [CrossRef]
  14. Zha, S.; Guo, Y.; Huang, S.; Wu, Q.; Tang, P. A hybrid optimization approach for unequal-sized dynamic facility layout problems under fuzzy random demands. Proc. Inst. Mech. Eng. Part B J. Eng. Manuf. 2020, 234, 382–399. [Google Scholar] [CrossRef]
  15. Dong, L.; Wang, Z. Plant Layout and Simulation Roaming System based on Virtual Reality Technology. MATEC Web Conf. 2018, 214, 4001. [Google Scholar] [CrossRef] [Green Version]
  16. Pinto, R.; Goncalves, J.; Lopes Cardoso, H.; Oliveira, E.; Goncalves, G.; Carvalho, B. A Facility Layout Planner tool based on Genetic Algorithms. In Proceedings of the 2016 IEEE Symposium Series on Computational Intelligence, Athens, Greece, 6–9 December 2019. [Google Scholar]
  17. Liao, Z.; Cong, M.; Liu, D.; Meng, F. Using simulation in layout verification of solar module assembly workshop. Int. J. Model. Simul. Sci. Comput. 2018, 09, 1850017. [Google Scholar] [CrossRef]
  18. Naranje, V.; Reddy, P.V.; Sharma, B.K. Optimization of Factory Layout Design Using Simulation Tool. In Proceedings of the 2019 IEEE 6th International Conference on Industrial Engineering and Applications (ICIEA), Tokyo, Japan, 12–15 April 2019. [Google Scholar]
  19. Boysen, N.; Fliedner, M.; Scholl, A. A classification of assembly line balancing problems. Eur. J. Oper. Res. 2007, 183, 674–693. [Google Scholar] [CrossRef]
  20. Tonge, F.M. Summary of a heuristic line balancing procedure. Manag. Sci. 1960, 7, 21–42. [Google Scholar] [CrossRef]
  21. Kim, Y.K.; Hyun, C.J.; Kim, Y. Sequencing in mixed model assembly lines: A genetic algorithm approach. Comput. Oper. Res. 1996, 23, 1131–1145. [Google Scholar] [CrossRef]
  22. Bukchin, J.; Dar-El, E.M.; Rubinovitz, J. Mixed model assembly line design in a make-to-order environment. Comput. Ind. Eng. 2002, 41, 405–421. [Google Scholar] [CrossRef]
  23. Mukund Nilakantan, J.; Ponnambalam, S.G. Robotic U-shaped assembly line balancing using particle swarm optimization. Eng. Optim. 2016, 48, 231–252. [Google Scholar] [CrossRef]
  24. Alavidoost, M.H.; Zarandi, M.H.F.; Tarimoradi, M.; Nemati, Y. Modified genetic algorithm for simple straight and U-shaped assembly line balancing with fuzzy processing times. J. Intell. Manuf. 2017, 28, 313–336. [Google Scholar] [CrossRef]
  25. Kazemi, S.M.; Ghodsi, R.; Rabbani, M.; Tavakkoli-Moghaddam, R. A novel two-stage genetic algorithm for a mixed-model U-line balancing problem with duplicated tasks. Int. J. Adv. Manuf. Technol. 2011, 55, 1111–1122. [Google Scholar] [CrossRef]
  26. Delice, Y.; Kızılkaya Aydoğan, E.; Özcan, U.; İlkay, M.S. A modified particle swarm optimization algorithm to mixed-model two-sided assembly line balancing. J. Intell. Manuf. 2017, 28, 23–36. [Google Scholar] [CrossRef]
  27. Becker, C.; Scholl, A. A survey on problems and methods in generalized assembly line balancing. Eur. J. Oper. Res. 2006, 168, 674–715. [Google Scholar] [CrossRef]
  28. Moreira, M.C.O.; Pastor, R.; Costa, A.M.; Miralles, C. The multi-objective assembly line worker integration and balancing problem of type-2. Comput. Oper. Res. 2017, 82, 114–125. [Google Scholar] [CrossRef]
  29. Lee, A.H.I.; Kang, H.; Chen, C. Multi-Objective Assembly Line Balancing Problem with Setup Times Using Fuzzy Goal Programming and Genetic Algorithm. Symmetry 2021, 13, 333. [Google Scholar] [CrossRef]
  30. Liu, R.; Xie, X.; Yu, K.; Hu, Q. A survey on simulation optimization for the manufacturing system operation. Int. J. Model. Simul. 2018, 38, 116–127. [Google Scholar] [CrossRef] [Green Version]
  31. Bongomin, O.; Mwasiagi, J.I.; Nganyi, E.O.; Nibikora, I. A complex garment assembly line balancing using simulation-based optimization. Eng. Rep. 2020, 2, e12258. [Google Scholar] [CrossRef]
  32. Zhang, H.; Liu, Q.; Chen, X.; Zhang, D.; Leng, J. A Digital Twin-Based Approach for Designing and Multi-Objective Optimization of Hollow Glass Production Line. IEEE Access 2017, 5, 26901–26911. [Google Scholar] [CrossRef]
  33. Zhang, Z.; Wang, X.; Wang, X.; Cui, F.; Cheng, H. A simulation-based approach for plant layout design and production planning. J. Ambient. Intell. Humaniz. Comput. 2019, 10, 1217–1230. [Google Scholar] [CrossRef]
  34. Guo, J.; Zhao, N.; Sun, L.; Zhang, S. Modular based flexible digital twin for factory design. J. Ambient. Intell. Humaniz. Comput. 2019, 10, 1189–1200. [Google Scholar] [CrossRef]
  35. Damiani, L.; Demartini, M.; Giribone, P.; Maggiani, M.; Revetria, R.; Tonelli, F. Simulation and Digital Twin Based Design of a Production Line: A Case Study. In Proceedings of the International MultiConference of Engineers and Computer Scientists (IMECS), Hong Kong, China, 14–16 March 2018. [Google Scholar]
  36. Leng, J.; Yan, D.; Liu, Q.; Zhang, H.; Zhao, G.; Wei, L.; Zhang, D.; Yu, A.; Chen, X. Digital twin-driven joint optimisation of packing and storage assignment in large-scale automated high-rise warehouse product-service system. Int. J. Comput. Integr. Manuf. 2021, 34, 783–800. [Google Scholar] [CrossRef]
  37. Wang, B.; Yuan, L.; Yu, X.; Ou, L. Construction and Optimization of Digital Twin Model for Hardware Production Line. In Proceedings of the IEEE IECON 2020—46th Annual Conference of the IEEE Industrial Electronics Society, Singapore, 18–21 October 2020. [Google Scholar]
  38. Leng, J.; Zhou, M.; Xiao, Y.; Zhang, H.; Liu, Q.; Shen, W.; Su, Q.; Li, L. Digital twins-based remote semi-physical commissioning of flow-type smart manufacturing systems. J. Clean. Prod. 2021, 306, 127278. [Google Scholar]
  39. Liu, Q.; Leng, J.; Yan, D.; Zhang, D.; Wei, L.; Yu, A.; Zhao, R.; Zhang, H.; Chen, X. Digital twin-based designing of the configuration, motion, control, and optimization model of a flow-type smart manufacturing system. J. Manuf. Syst. 2021, 58, 52–64. [Google Scholar] [CrossRef]
  40. Guo, H.; Chen, M.; Mohamed, K.; Qu, T.; Wang, S.; Li, J. A digital twin-based flexible cellular manufacturing for optimization of air conditioner line. J. Manuf. Syst. 2021, 58, 65–78. [Google Scholar] [CrossRef]
Figure 1. Assembly Process of Mobile Phone.
Machines 10 00367 g001
Figure 2. Station division and automatic analysis of a certain type of mobile phone.
Machines 10 00367 g002
Figure 3. Comparison of two production line architecture forms.
Machines 10 00367 g003
Figure 4. The layout of the Hybrid Assembly Line.
Machines 10 00367 g004
Figure 5. The layout of the whole hybrid workshop.
Machines 10 00367 g005
Figure 6. The construction steps of the semi-physical simulation model.
Machines 10 00367 g006
Figure 7. Simulation and optimization of workshop. (a) The results of optimization of all unit assembly lines in the workshop. (b) The result of optimization of all plug and play assembly lines and unit assembly lines simultaneously. (c) The result of iterative optimization.
Machines 10 00367 g007
Figure 8. The iterative optimization process.
Machines 10 00367 g008
Figure 9. The iterative calculation process. (a) The calculation process of related parameters of each type of production line. (b) The process of simulating multiple times. (c) The calculation process of bottleneck optimization.
Machines 10 00367 g009
Table 1. Working Rule of Workshop.
ContentRelevant Data
Monthly working hours26 days/month
Shift2 shifts/day
Time of each shift7 h
The average frequency of production change4 days/time
Daily maintenance of the equipment10 min/day
Material preparation for the shift10 min
Break time for a shift15 min
Change line time18 min
Table 2. List of Equipment.
Equipment NameEquipment Working Hours (s)Plug-And-Play Equipment Size (m)Unit Equipment Size (m)
Sticking adhesive equipmentDesign working hours1.1 × 1.00.9 × 1.0
Pressing equipmentDesign working hours1.1 × 1.01.0 × 1.0
Current detection fixture801.1 × 1.01.4 × 1.1
Camera detection equipment1601.1 × 1.01.5 × 1.05
Audio detection equipment501.1 × 1.00.75 × 0.55
Coupling detection equipment601.1 × 1.00.75 × 0.55
Ultra-wide-angle testing equipment301.1 × 1.00.8 × 1.3
Locking screw equipmentDesign working hours1.1 × 1.00.85 × 0.68
MMI detection equipment701.1 × 1.00.75 × 0.55
Sticking equipmentDesign working hours1.1 × 1.01.1 × 1.0
Rear camera assembling equipment17.61.1 × 1.00.65 × 1.6
Sticking and assembling equipment361.1 × 1.00.65 × 1.6
Double-layer conveyor belt351 × 3-
Pallet turning and circulating equipment150.7 × 0.5-
Table 3. Working Hours Design of Automation Process.
Procedure ContentsEquipment NamePlug-And-Play Equipment Working HoursUnit Equipment Working Hours
Sticking adhesive on the back of the touch panelGluing equipment1610
Pressing touch panelPressing equipment17.512.5
Sticking sealed foam on the mainboardPasting and assembling equipment1812
Pressing battery coverPressing equipment2413
Table 4. Working Hours of Semi-automated Procedures.
StationPlug-And-Play AveragePlug-And-Play CorrectionUnit AverageUnit Correct
Assembling main and auxiliary FPC and then pressing12.3317.9512.3312.94
Assembling top bracket & Locking screws11.3416.9111.3411.91
Assembling and rolling battery37.4044.2737.4039.27
Assembling battery’s FPC & Pressing battery19.0024.9519.0019.95
Assembling bottom bracket & Locking screws10.6916.2210.6911.23
Assembling and pressing the fingerprint module9.4414.919.449.92
Table 5. Working Hours Design of Zero Automation Process.
StationPlug-And-Play AveragePlug-And-Play CorrectionUnit AverageUnit Correction
Scanning barcode & sticking conductive sponge on mainboard11.9617.5611.9312.53
Assembling camera11.9317.5311.9312.53
Assembling front camera and front silicone ccase11.1816.7411.1811.73
Semi-finished products testing10.8916.4310.8911.44
Sticking earpiece sponge & Assembling earpiece11.6617.2411.6612.25
Tear release paper of TP adhesive & Sticking heat sink film9.6415.129.6410.12
Assembling TP into the face cover & checking the front camera11.5717.1511.5712.14
Assembling power button11.9717.5711.9712.57
Assembling volume button11.7017.2911.7012.29
Assembling push-buttons11.7517.3411.7512.34
Pulling testing of a touch panel11.7917.3811.7912.39
Sticking sealed foam & Assembling leather cover12.3417.9612.3412.96
Assembling silicone and sealed foam on the main board11.6517.2311.6512.23
Assembling the silicone Case of ear phone and the sub-board12.3317.9512.3312.94
Assembling sub board into face cover and binding, then assembling card holder12.1617.7712.1612.77
Assembling FPC & Sticking grounded conductive foam10.9116.4610.9111.46
Fastening coaxial cable 111.4917.0611.4912.07
Fastening coaxial cable 211.3216.8911.3211.89
Tiding coaxial cable12.2117.8212.2112.82
Sticking label & Checking battery cover11.3916.9611.3911.97
Cleaning camera & Fixing battery cover12.3217.9412.3212.94
Tearing film of front and rear camera & Assembling cover sheet12.2317.8412.2312.84
Assembling protective jacket & Entering user mode11.9217.5211.9212.52
Touch panel testing10.7316.2710.7311.26
Magnetic testing11.1716.7311.1711.73
Battery testing12.2517.8612.2512.86
Dual camera Calibrating12.3217.9412.3212.93
Fastening battery cover24.9631.2124.9626.21
Checking overall appearance12.4917.3112.4912.31
Scanning the barcode & Packaging12.6617.9312.6612.40
Table 6. Design Demand of Workshop Hybrid Production Line.
Production Line TypeThe Capacity of Production Line (Set/Hour)Production Line Takt (Seconds)The Number of Production Line
Plug-And-Play200184
Unit300136
Table 7. The notations in the formulation of iterative calculation.
NatationsRemarks
NThe quantity of production lines solution
PThe quantity of production lines solution
GThe grouping of procedures solution
P C s i The production capacity of i-th simulation experiment
P C s k The average production capacity of k-th iteration simulation
P C T The target production capacity of the workshop
U R The unit area capacity of production line
C C The construction cost of the workshop
L F The load fluctuation between the stations
C o The rebalancing adjustment cost of optimizing bottleneck
C g The cost of other measures and grouping procedures
C h The cost of increasing workers
C d The cost of improving equipment
p i The i-th procedures
N u m p The total number of procedures
m a x ( t t ) The maximum takt time of production line
T a k t The threshold value of production takt
F d i s t r u b ( t ) The time-dependent random disturbance function
Table 8. Optimization Comparison.
EquipmentAverage Construction
Cost of Production
Line ( Yuan )
Average Production
Capacity per Unit Area of
Production Line
(pcs/m 2 /h)
Assembly Cost
( Yuan / Units )
Before optimization9,122,3701.850.120
After optimization9,299,8402.000.102
Publisher’s Note: MDPI stays neutral with regard to jurisdictional claims in published maps and institutional affiliations.

