1. Introduction
Due to its vast range of applications and recent technological developments, object detection has sparked a lot of attention in recent years. It has been used in the fields of robotic vision, security monitoring, drone scene analysis, autonomous driving, and transit surveillance. The rapid advancement of object detection systems can be linked to numerous factors and projects, including the improvement of deep convolutional neural networks, and GPU computing capability. Deep learning methods are now widely used in computer vision, including object detection in both generic and domain-specific contexts.
Object detection is a computer program that looks for semantic things of a given class in digital images and videos (such as people, buildings, cars, etc.) It deals with computer vision and images to be processed. Object detection is employed in a wide range of industries, including security, military, transportation, health, and life sciences. Object detection benchmarks, such as Caltech, KITTI, ImageNet [
1], PASCAL VOC, MS COCO, and Open Images V5 [
2] have also been utilized in the past.
We will primarily focus on the problem of object localization and detection in this project, which has a wide range of applications in our daily lives [
3]. Among the most well-known network interpretation methods, Grad-CAM++ [
4] is known to be a particularly good algorithm for object localization. Among the newly examined state-of-the-art approaches for sanity check-based tasks, Grad-CAM++ [
4] produces faultless results. Hence, our research work used Grad-CAM++ for localization. The main purpose of object detection is to recognize objects in an image, not only to return the class confidence for each object, but also to forecast the bounding boxes. Among the efforts in object detection, Regional Convolutional Neural Network (RCNN) [
5] stands out as the most notable, combining selective search [
6], and bounding box regression to achieve high object detection performance. Because our main core of this research work is based upon RCNN and not related with You Only Look Once (YOLO) we provide an alternate methodology for object detection which utilizes the proposed model, GradCAM-MLRCNN, which lowers the complexity of RCNN and increases the system’s overall performance.
This research work is organized as follows. In
Section 2, we discuss related work for our research work. In
Section 3, we explain the research gap and its contributions. Further, we briefed about our proposed method (GradCAM-MLRCNN) in
Section 4. In
Section 5, we demonstrated our research experiments by comparing state-of-the-art machine learning algorithms, such as decision tree, Gaussian algorithm,
k-means clustering,
k-nearest neighbor, and logistic regression with other pre-trained models. Finally, the conclusions and future works of this article are given in
Section 6.
2. Related Works
Deep learning techniques have recently reached state-of-the-art results on conventional benchmarks for object detection, and current deep learning algorithms have demonstrated efficiency in feature representation tasks in various computer vision applications. Furthermore, deep learning has demonstrated its enormous potential in detecting complex objects in images despite a variety of obstacles, such as a lack of training datasets, multi-sensor data, complex background, and changing weather conditions. Mask R-CNN can combine object detection with segmentation. The pixel-level categorization task is known as instance segmentation. The bounding box contained some pixels from the background and the rest from the foreground. Semantic segmentation determines if a pixel in a scene belongs to a specific class, whereas instance segmentation is an extension of semantic segmentation that further differentiates each object in the image.
Zhou et al. [
7] proposed the Class Activation Map (CAM) approach for differentiating localities used by a specific type of image characterization. In contrast, it made existing best-in-class profound models interpretable without changing their engineering, thereby avoiding the interpretability versus exactness trade-off. The methodology is based on CAM and is applicable to a much broader range of CNN model families along with discriminative locales used by a certain type of image classification with the help of global average pooling (GAP). Selvaraju, R.R. et al. [
8] proposed a Grad-CAM-based class discriminative localization technique as well as visual explanations to make CNN-based models more comprehensible. Grad-CAM is also integrated with present high-resolution visualizations to achieve better high-resolution visualization. CAM interpretability of a network with an updated loss function was presented by Alfred Schöttl et al. [
9]. In addition, (Grad)CAM entropy is used to evaluate interpretability measures using the Grad–CAM method. They demonstrated some results which used ResNet-50 and PASCAL VOC for their data.
Ennadifi, E. et al. [
10] demonstrated wheat disease detection using CNN. The training and testing dataset comes from CRA-W (Walloon Agricultural Research Center, Gembloux, Belgium), which contains 1163 images divided into two categories that are either impacted or healthy. The illness is then found using the Grad-CAM approach, which highlights the appropriate region from the CNN model and wheat spikes are segmented using Mask R-CNN from the image background.
The above papers [
7,
8,
9,
10] discuss Class Activation Map (CAM). Our research work based on CAM and Grad-CAM is an extension of CAM. Hence, we used those papers for research work especially for object localization.
R. Liu et al. [
11] discusses remote sensing object detection using the Faster-RCNN algorithm. To improve the performance of Faster-RCNN in object recognition in remote sensing images, they used some mining processes, such as RoI-Align methodology, Soft-NMS methodology, and feature pyramid structure. X. Yin et al. [
12] improved the detection accuracy of the existing Faster R-CNN model. To improve the performance of the Faster R-CNN model, they introduced multi-scale feature fusion. Hence, that proposed strategy improved the accuracy on mAP by 1.06 percent when compared to the classic Faster R-CNN model. M. Songhui et al. [
13] increased the speed of the robot by introducing object identification and localization using the Mask R-CNN algorithm, which worked on stereo vision to identify the target in 3D spatial location to improve its accuracy. They utilized the centroid with the target contour ORB descriptor, which aimed at the problem of the neural network’s detection accuracy being low and the object contour centroid estimation being inaccurate. X. Song et al. [
14] provided a real-time object detection system for unmanned surface vehicles (USVs) on sea surfaces. The SSD and Faster-RCNN models were fused using Kalman filtering in that research.
The papers [
11,
12,
14] were discussed and used in our proposed method for object detection methodologies. Those papers explained that Faster-RCNN is better than previous versions of RCNN used to detect the objects in an image. Moreover, for better image segmentation and accuracy, we used Mask R-CNN, an upgraded version of Faster R-CNN in the proposed method.
F. Z. Ouadiay et al. [
15] provide an end-to-end technique for object recognition and pose estimation by providing bounding boxes that include the targeted object and its pose. The main contribution of the paper is that generating bounding boxes on training images create pose coordinates for each object in the scene, and simultaneously detect and localize each object in the image during the testing stage. Two datasets are used to assess contribution performance: the Washington RGB scene dataset and the LIMIARF dataset. S. Gupta et al. [
16] provide a novel method for the understanding of how the middle layers of neural networks and classifier operations work. The suggested method may analyze a wide range of models that have been trained for applications such as object identification and recognition. For the goal of object localization, a probabilistic technique and a gradient-based approach were used in this study. Q. Lin et al. [
17] dealt with the multi-scale challenge in the object detection task for UAV images, which created an enhanced object detection network called ECascade-RCNN. They introduced a novel Trident-FPN backbone for extracting features and a new attention method to improve the detector’s performance. Furthermore, the
k-means method was modified to generate anchors, which improved the detection model’s regression accuracy. N. Yao et al. [
18] proposed the methodology which combined the Faster-RCNN model with the Wasserstein GAN (W-GAN) model to enhance the RCNN model that is especially beneficial for low-resolution item detection in substations. They used a discriminator in GAN to identify the abstract feature difference between the high-resolution and low-resolution objects after augmenting the feature. Generators were used to enhance the overall detection result by supplementing the abstract feature for low-resolution items, which ensured their feature distribution matched with high-resolution objects.
A. Pramanik et al. [
19] presented two new models to track and detect objects from videos. These methods were known as granulated RCNN (G-RCNN) and multi-class deep SORT (MCD-SORT). Object localization and categorization is done by combining the unique notion of granulation in a deep convolutional neural network and G-RCNN.
N. M. Krishna et al. [
20] focused on deep learning and how it will be used to detect and track things. Deep learning employs algorithms that are impacted by the brain’s structure and functions. The benefit of using such algorithms is that their performance improves as the amount of data grows, whereas classical learning algorithms’ performance stabilizes as the amount of data grows. In addition, other object detection approaches were also examined for our research work especially object tracking [
14,
18,
20]. (i.e., YOLO, YOLOV3, SSD). Moreover, combining two methodologies was analyzed in these papers [
10,
11,
13,
14,
18,
19]. Our research work combined two methodologies Grad-CAM++ for object localization and Mask R-CNN for object detection with machine learning algorithms. Some papers utilized some pre-trained models [
7,
8,
10,
15,
19] for better results; in our proposed method we used some pre-trained models, such as VGG 16,VGG 19, ResNet 101, and ResNet 152.
Subhayan Mukherjee et al. [
21] proposed a new method for image quality assessment (IQA) to predict the quality score for a pristine or distorted input image. The main contribution of this paper is that they used convolutional neural network (CNN) for feature extraction instead of traditional hand-crafted extraction, unsupervised learning approach instead of supervised, and non parametric methodology instead of the parametric approach to fit distribution of pristine image features to enhance the image quality. To extract the features, they proposed two blocks: analysis transform and synthesis transform for down-sampling and up-sampling the images, respectively. Further they proved that proposed method was better than state-of-the-art methods (hand-crafted features) by comparing metrics like Pearson score, Kendall score and Spearman score for three types of blurring, noise, and compression artefacts. This provides the potential to study the relation between image quality and object detection performance for future work. Some research papers [
10,
12,
15,
16] used the transfer learning approach; our research work considered those papers also. Hence, for object localization, we analyzed and discussed some papers [
7,
8,
9,
10] and for object detection methodologies, we examined some papers [
11,
12,
13,
14,
17,
18,
19,
20,
21].
The following
Table 1 shows the summary of related works for the proposed method (GradCAM-MLRCNN).
Our proposed method (GradCAM-MLRCNN) combined two methodologies Grad-CAM++ for object localization and Mask R-CNN for object detection with machine learning algorithms. Furthermore, it used other pre-trained models as feature extractors. Hence, we showed in
Table 1 that none of the above methodologies did not use and perform with any machine learning algorithms except reference [
17]. However, we compared it with other machine learning algorithms and finally proved that logistics regression is better with ResNet 152 and VGG 19 in
Section 5.
3. Research Gap and Contributions
Deep learning approaches have already achieved state-of-the-art outcomes using traditional object detection criteria. Mask R-CNN won the COCO object detection competition in 2016 by outperforming the other detection models. Mask R-CNN’s activities in object detection are scarcely comparable due to the complex nature of the problem, the enormous number of annotated samples, and the wide range of object scales. However, missing better visualization and accuracy are leading to a research gap. To avoid such issues, combining both methodologies, such as Grad-CAM++ for localizing objects and Mask R-CNN for detecting objects along with some machine learning algorithms, will provide enhanced image presentation and better accuracy of predicted objects in an image to fill the research gap perfectly.
The key contribution of this paper is the use of Grad-CAM++ combined with the Mask R-CNN framework to recognize multi-scale objects with the help of the COCO dataset with other pre-trained models, such as VGG 16, VGG 19, ResNet 101, and ResNet 152 as one of the backbone networks along with state-of-the-art machine learning algorithms, such as logistics regression, decision tree, Gaussian classifier, k-means clustering, and k-nearest neighbor (KNN). While boosting detection accuracy, our proposed method (Grad-CAM-MLRCNN) efficiently eliminates detector box redundancy. The efficiency of the proposed method is demonstrated by comparing pre-trained models with state-of-the-art machine learning algorithms.
We are using Grad-CAM++ for object localization by producing a heat map and Mask R-CNN for object detection along with machine learning algorithms for better class accuracy. Even though Mask R-CNN is losing to detect objects in an image, with the help of the Grad-CAM++ cum machine learning algorithm, we can detect the objects in an image perfectly and accurately. That is an important feature of the proposed method.
4. Proposed Method
In this section, we provide a brief description of the mathematical derivation for the proposed method, which uses partial derivatives of the last convolutional layer feature maps concerning a specific class score as weights in terms of object localization. Then we analyzed object detection by Mask R-CNN through ResNet 152.
The Grad-CAM++ model, which was originally used to locate an object and generate a visual explanation for the GradCAM-MLRCNN network without affecting its structure, is described in the proposed methodology. Gradient-weighted Class Activation Mapping (Grad-CAM++) employs the gradients of any target concept to build a coarse localization map that highlights relevant places in the image for predicting objects. The approach presented in this research is primarily influenced by two commonly used algorithms, CAM [
7] and Grad-CAM [
8]. Both CAM and Grad-CAM work on the premise that the final score
for a given class
may be expressed as a linear combination of the class’s global average pooled last convolutional layer feature mappings
by Equations (1) and (2).
where
is the feature map activation,
is the neural network output before performing softmax, and
is the number of pixels in the feature map.
directly correlates with the importance of a particular spatial location
for a particular class c, and thus functions as a visual explanation of the class predicted by the network. The weights
of Grad-CAM++ is formulated by Equation (3)
Hence, represents a partial linearization of the deep network downstream from , which evaluates the ‘importance’ for feature map with class .
ReLU is one of the transfer functions that is a rectified linear unit.
indicates the relevance of a given activation map
according to this formulation. As established in prior research in pixel-space visualization, such as deconvolution [
22] and guided backpropagation [
23], positive gradients are significant in constructing saliency maps for a given convolutional layer. Increases in the intensity of pixels
have a positive impact on the class score
, as indicated by a positive gradient for an activation map
at location
. For a given class
and activation map
, we now formalize a method for determining the gradient weights
. Let
be the score of a certain class
. When Equations (1) and (3) are added together, we obtain the following Equation (4),
Here,
and
are iterators over the same activation map
. Without loss of generality, we drop the ReLU as it only functions as a threshold for allowing the gradients to flow back. Taking partial derivative w.r.t.
on both sides
Hence, we get the following Equation (6)
Substitute Equation (6) in Equation (3)
Now we will compare the Equations (3) and (7). Hence Grad-CAM++ is reformulated by =
Let be the global average pooled output,
Then the computational score as follows, according to Grad-CAM
where
indicates the relevance of a given activation map
.Then we need to do gradients on both sides with respect to
,
Taking the partial derivates of Equation (8),
Then substitute in the Equation (10),
From Equation (9) derives that,
if an object is present in a visual pattern otherwise 0.
Hence, it computes all weighted sum of for final required output. In this equation, we are using ReLU activation function. Therefore, negative values will be considered as zero. Hence, if objects are present in an image they will be masked and predicted by our proposed method even though those objects are small in scale. According to , a heat map calculates the weighted combination of feature map activation with weights by Grad-CAM++.
4.1. Mask R-CNN
Mask R-CNN is one of the new powerful, simple, and flexible paradigms for instance segmentation frameworks (i.e., assigning distinct labels to various classes). Mask R-CNN has the advantage of providing both bounding box and semantic segmentation, allowing for a multi-stage semantic segmentation technique utilizing the same architecture [
24]. In this paper, we adapted and assessed the Mask R-CNN for object detection, which is made up of two main phases that have been extended from the Faster R-CNN. The first phase is extracting features using ResNet 152 and then utilizing the region proposal network (RPN) to generate a potential bounding box [
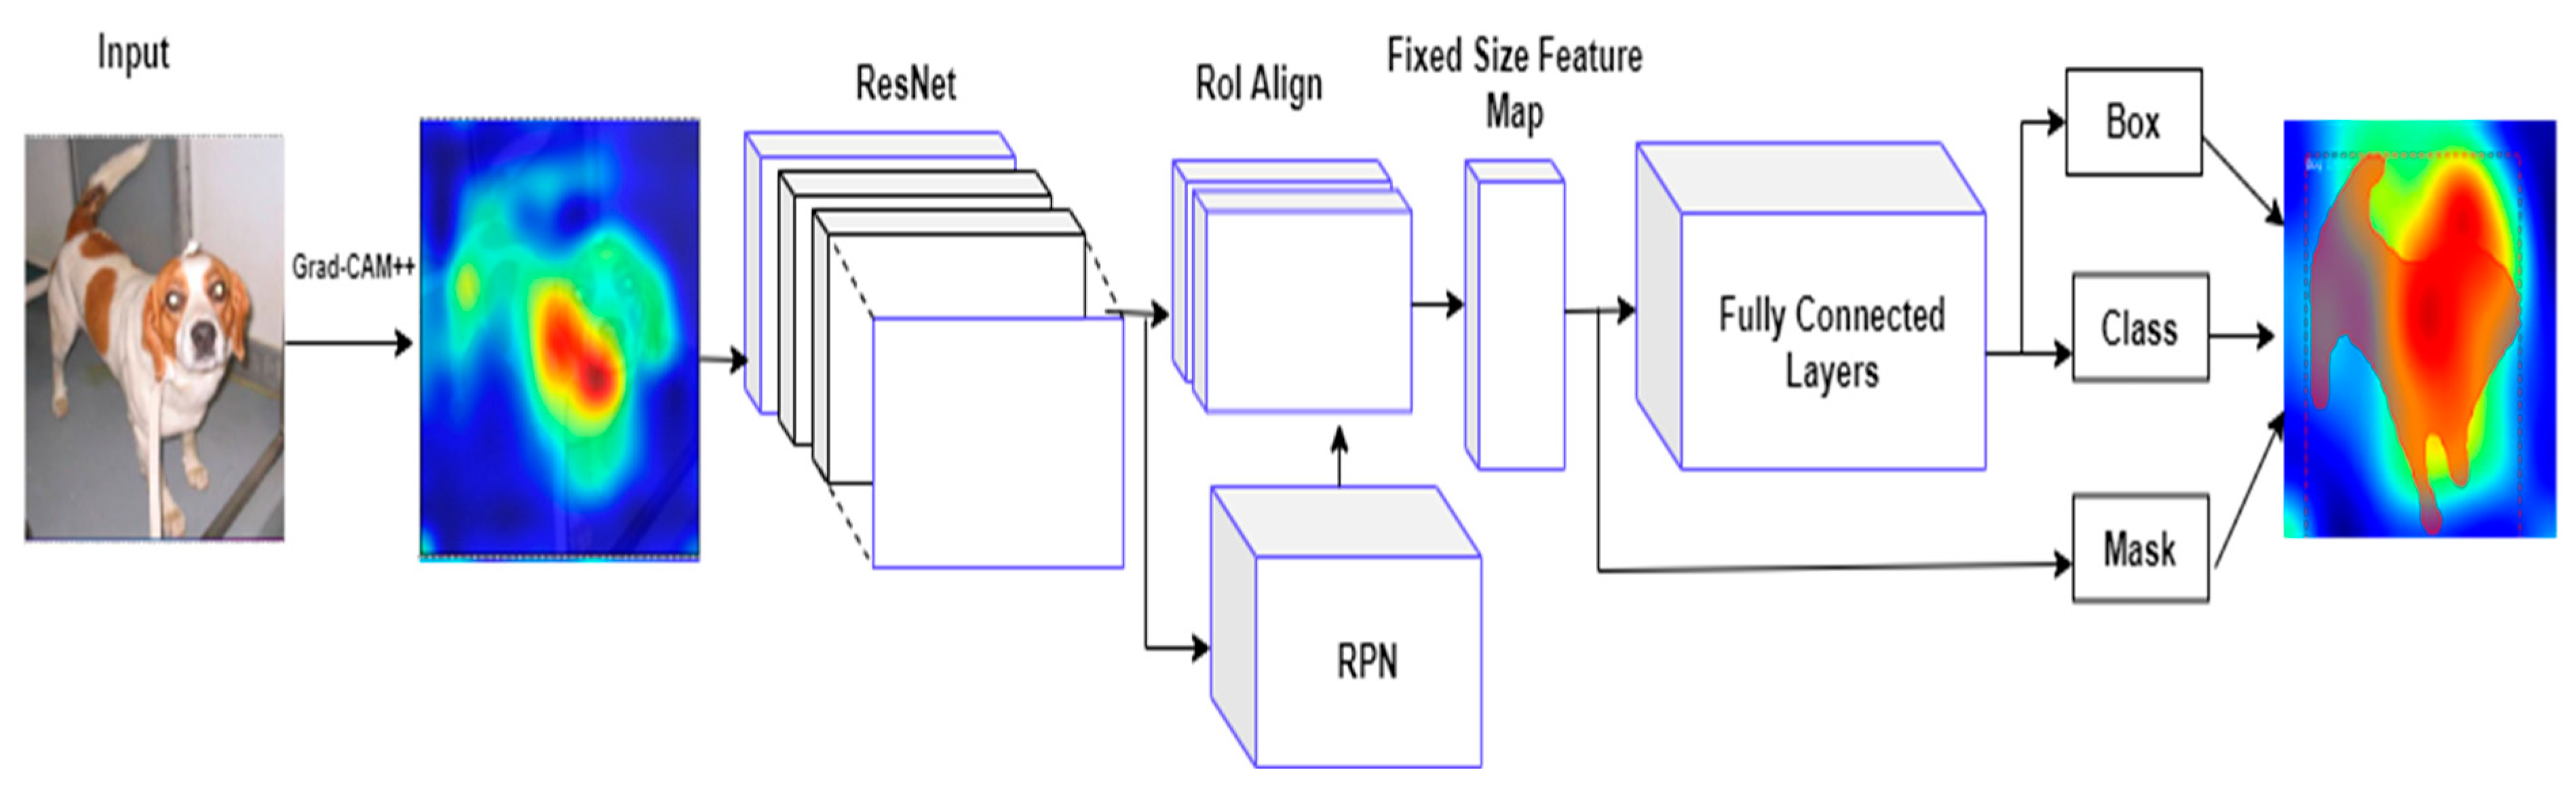
25]. The extracted characteristics are shared in the second phase, which is used to categorize the objects and generate class labels, bounding box offsets, and binary mask images for each instance in each Region of Interest (RoI). The proposed framework for recognizing and finding objects at the pixel level is depicted in
Figure 1. To extract features, the ResNet 152 model is first applied to the input frame. The proposed approach uses ResNet 152 as a convolutional backbone [
26] for feature extraction, bounding box classification, and regression. The collected feature maps are then submitted to a region proposal network (RPN), which constructs multiple bounding boxes based on the objectness of the feature maps (i.e., the existence or absence of the object in candidate regions). Positive ROIs containing objects, including shadows, are submitted to the RoI Align phase to ensure that each RoI has appropriate spatial adjustment.
4.2. Object Detection Based on RPN
The region proposal network (RPN) [
25] applies a light binary classifier to multiple sets of predetermined anchors (bounding boxes) over the entire feature map by CNN, then calculates the objectness score, which determines the foreground object on the candidate bounding box. Moving a sliding window across the extracted feature maps initializes RPN. A collection of anchors with predetermined scales and aspect ratios are centered for each sliding window. These candidate anchors are examined to see if an object is present or not. If the candidate bounding box is present on the foreground object, then the objectness score will be calculated as high by intersection-over-union (IoU), which is the intersection area between the predicted RoI and its ground truth RoI divided by the union area of the two regions. If the probability of IoU is greater than 0.7, it is considered a positive region Of interest (RoI). When the probability of IoU is less than 0.3, it is considered as a negative bounding box as none of the object is present in an image (which does not cover any foreground objects and is deemed background region).
RPN uses the non-maximum suppression (NMS) [
25] technique to reject redundant and overlapping RoI suggestions based on their IoU score, with the low-scoring bounding box being deleted and the high-scoring bounding box (i.e., positive bounding box) progressing to the classification stage. Each candidate bounding box is then transformed into a low-dimensional vector before being supplied to fully connected layers and fully convolutional network (FCN). The regression layer is the first layer, and it generates 4N, which represents the coordinates of N anchor boxes. The classification layer is the second layer, which generates 2N probability scores to determine whether the foreground item is present or absent at each proposition. As a result, the RPN regressor enhances the surrounding bounding box by shifting and resizing it to the closest accurate object boundaries. The generated positive RoIs are sent into the following stage, which includes bounding box regression and foreground object label classification. The proposed framework is divided into three categories: class of object, heat map, and background class for bounding box.
4.3. Loss Function
Mask R-CNN applies a multi-loss function during the learning to evaluate the model and ensure its fitting to unseen data. This loss function is computed as a weighted total sum of various losses during the training at every phase of the model on each proposal RoI [
27], which is shown by Equation (16). This weighted loss defined as,
where
(the loss of classification) shows the convergence of the predictions to the true class.
combines the classification loss during the training of RPN and Mask R-CNN heads.
(the loss of bounding box) shows how well the model localizes objects and it combines the bounding box localization loss during the training of RPN and Mask R-CNN heads.
and
losses are computed by Equations (17) and (18)
where
is predicted probability of ground truth class
for each positive bounding box.
where
is predicted bounding box for class
and ground truth bounding box
for each input
.
Our proposed method is combining Grad-CAM++ for object localization and mask regional convolutional neural network (Mask R-CNN) for object detection along with machine learning algorithms, such as decision tree, Gaussian algorithm, k-means clustering, and k-nearest neighbor to improve the classifier’s accuracy by utilizing the major voting concept. That means Mask R-CNN’s predicated labels and any one of the machine learning algorithms’ predicted labels for that object in an image should be matched with the ground truth labels. Even though Mask R-CNN does not predict the class label for that object in an image, the machine learning algorithm cum Grad-CAM++ will help to predict the class label for that object in the image. That is an important feature of the proposed method.
Hence, we are using the loss function and the following sigmoid function as referred to in Equation (19). For a given set of features (or inputs) x, the target variable (or output) y, can only take discrete values in a classification problem.
The sigmoid function is used in logistic regression as follows,
where value is
.
The logistic regression Equation (20) is defined by
where,
y is final output of prediction,
b0 is bias,
b1 is coefficient of input x,
The coefficient b1 must be used to train each of the input data.
4.4. Summary
The important feature of this research work is that it is utilizing the heat map obtained from Grad-CAM++ to detect the object along with Mask R-CNN, which worked with machine learning algorithms to boost the accuracy of object detection using our proposed GradCAM-MLRCNN method.
Another feature of this research work is that it detects the object efficiently if the object behind the heat map is produced by Grad-CAM++.
Our proposed method is efficiently reducing the redundancy of detector boxes and allows the multi-scale targets under complex background images.
Furthermore, this research work studies the behavior of the Mask R-CNN when it is combined with various machine learning algorithms, such as decision tree, Gaussian algorithm, k-means clustering, and k-nearest neighbor.
After producing the heat map of the image that will be given to Mask R-CNN to classify the objects and once the class of the object is detected, logistic regression is trained with the same set of images using the regression equation, then the prediction is made using testing images. Furthermore, the correct labels will be stored into the new file by checking both classes of Mask R-CNN and logistic regression. The final decision will be made based on the correct predicted labels with ground truth labels.
5. Results and Discussion
This section contains the description of the main findings of our study, which are the results of comparing some machine learning algorithms (decision tree, Gaussian algorithm, k-means clustering, k-nearest neighbor, and logistic regression) with pre-trained models, such as VGG 16, VGG 19, ResNet 101, and ResNet 152.
This research work has been carried out using Python programming language and its version is 3.7. We used a few pre-trained models as feature extractors, including VGG 16, VGG 19, ResNet 101, and ResNet 152 to employ our proposed (GradCAM-MLRCNN) method on the MS-COCO dataset. Before the beginning of the training, we resized the images to 224 × 224 pixels. To ease the training of the Mask R-CNN, we set up the learning rate as 0.00001. In this proposed method, feature maps will be updated by Grad-CAM++ according to a few epochs, then Mask R-CNN will start training to predict objects in an image by gradually producing a bounding box along with segmentation. It is important to note that Grad-CAM++ is mainly used to distinguish the class label on an object in the image by producing a heat map, then Mask R-CNN will examine this by applying a bounding box and segmentation using the NMS technique, which is based upon the IoU. The proposed method demonstrated using pre-trained models (VGG 16, VGG 19, ResNet 101, and ResNet 152) as a backbone network concerning each machine learning algorithm, such as logistics regression, decision tree, Gaussian classifier,
k-means clustering, and
k-nearest neighbor (KNN). Hence, proving that logistic regression performs well, with an accuracy rate of 98.4%, recall rate of 99.6%, and precision rate of 97.3% by ResNet 152 and VGG 19 among other models.
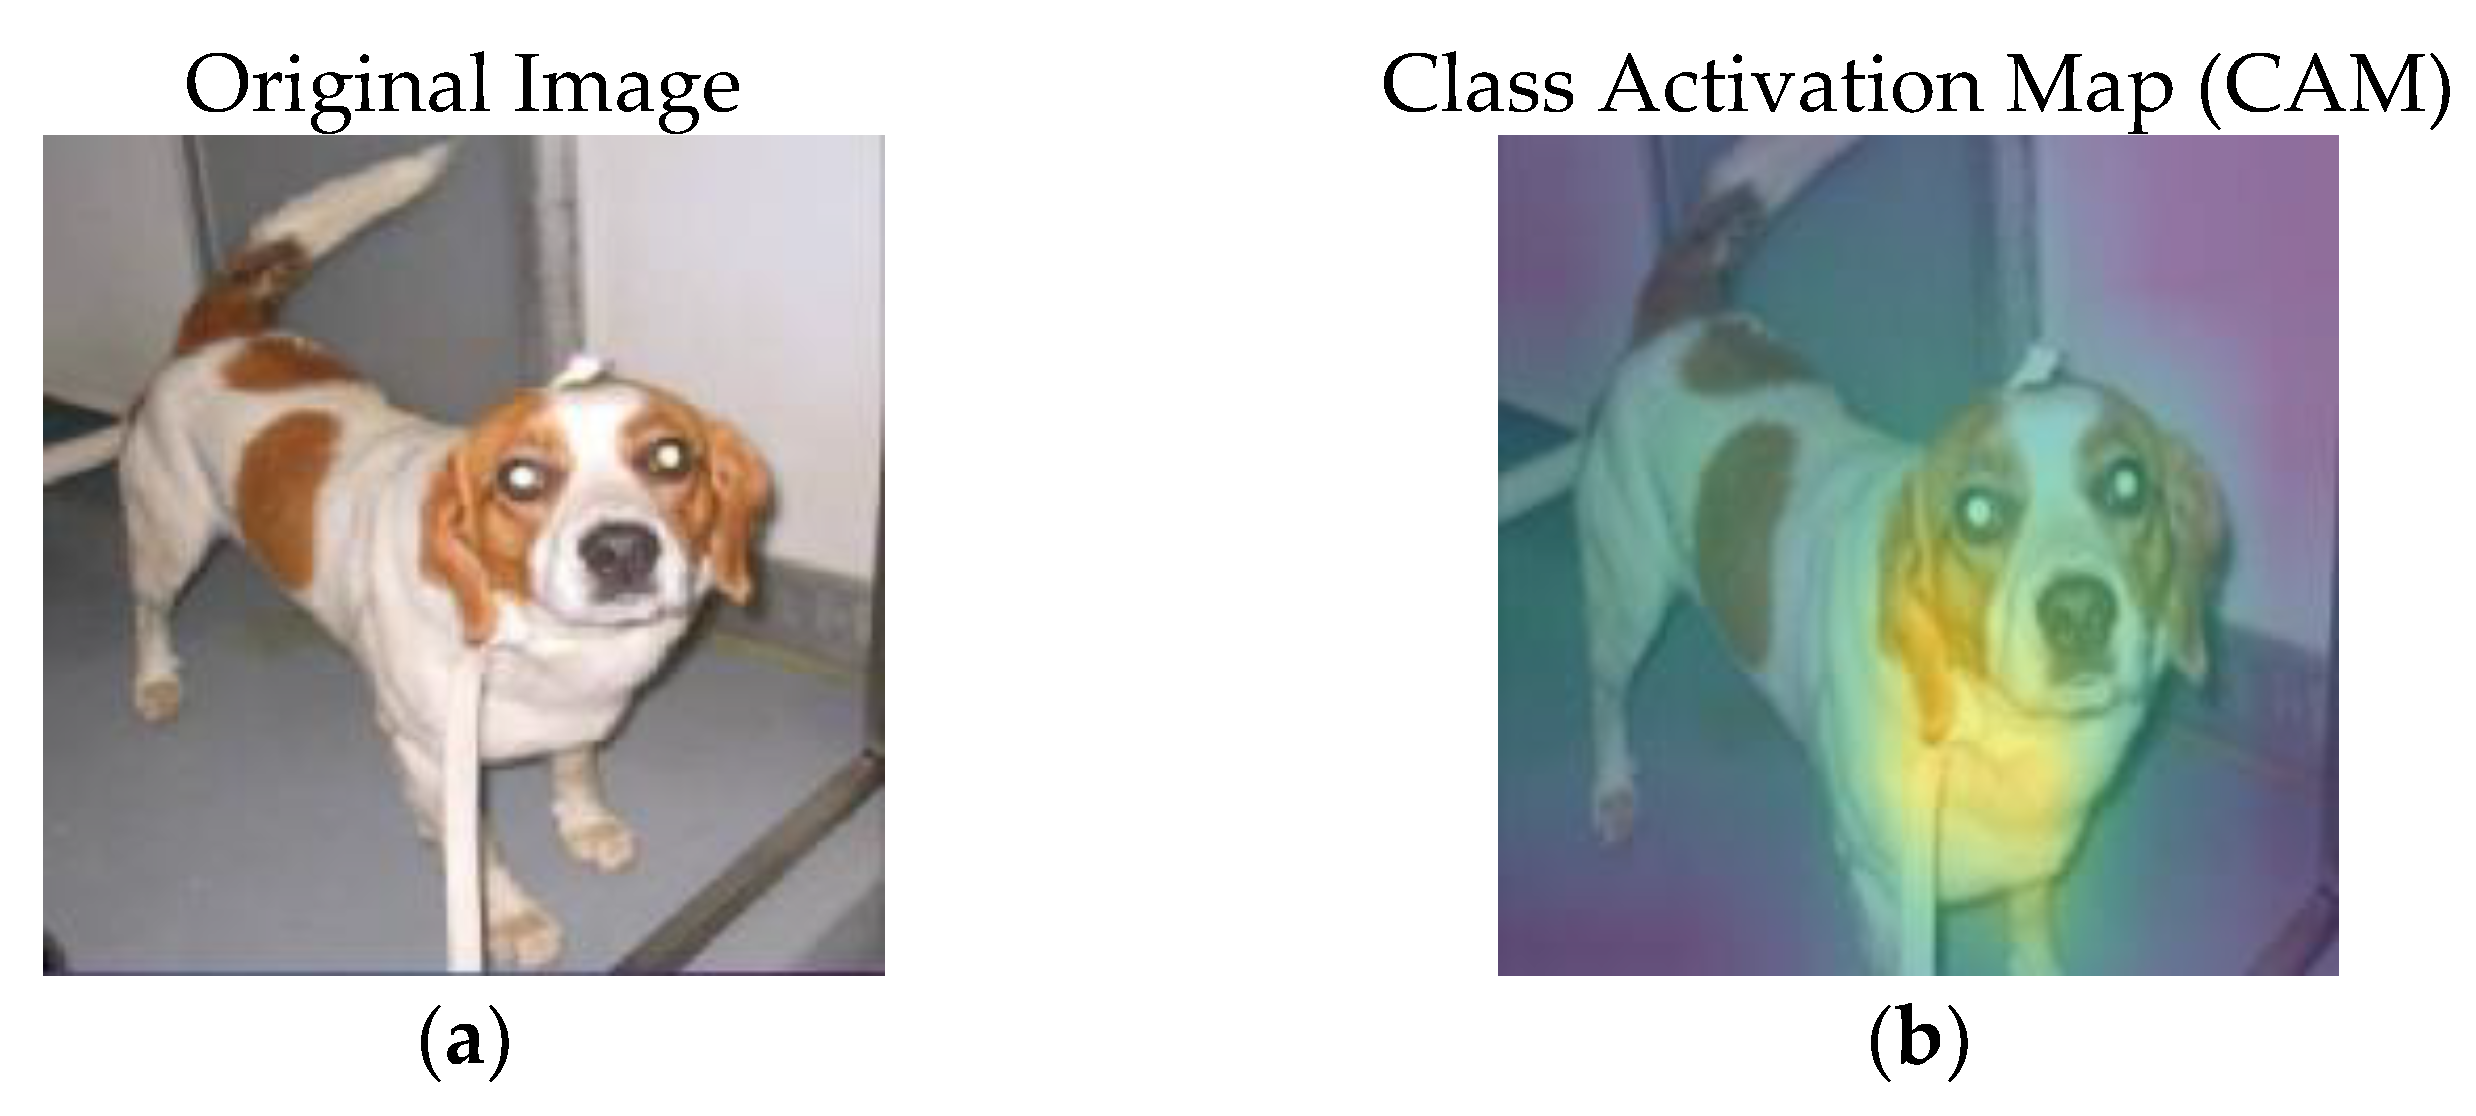
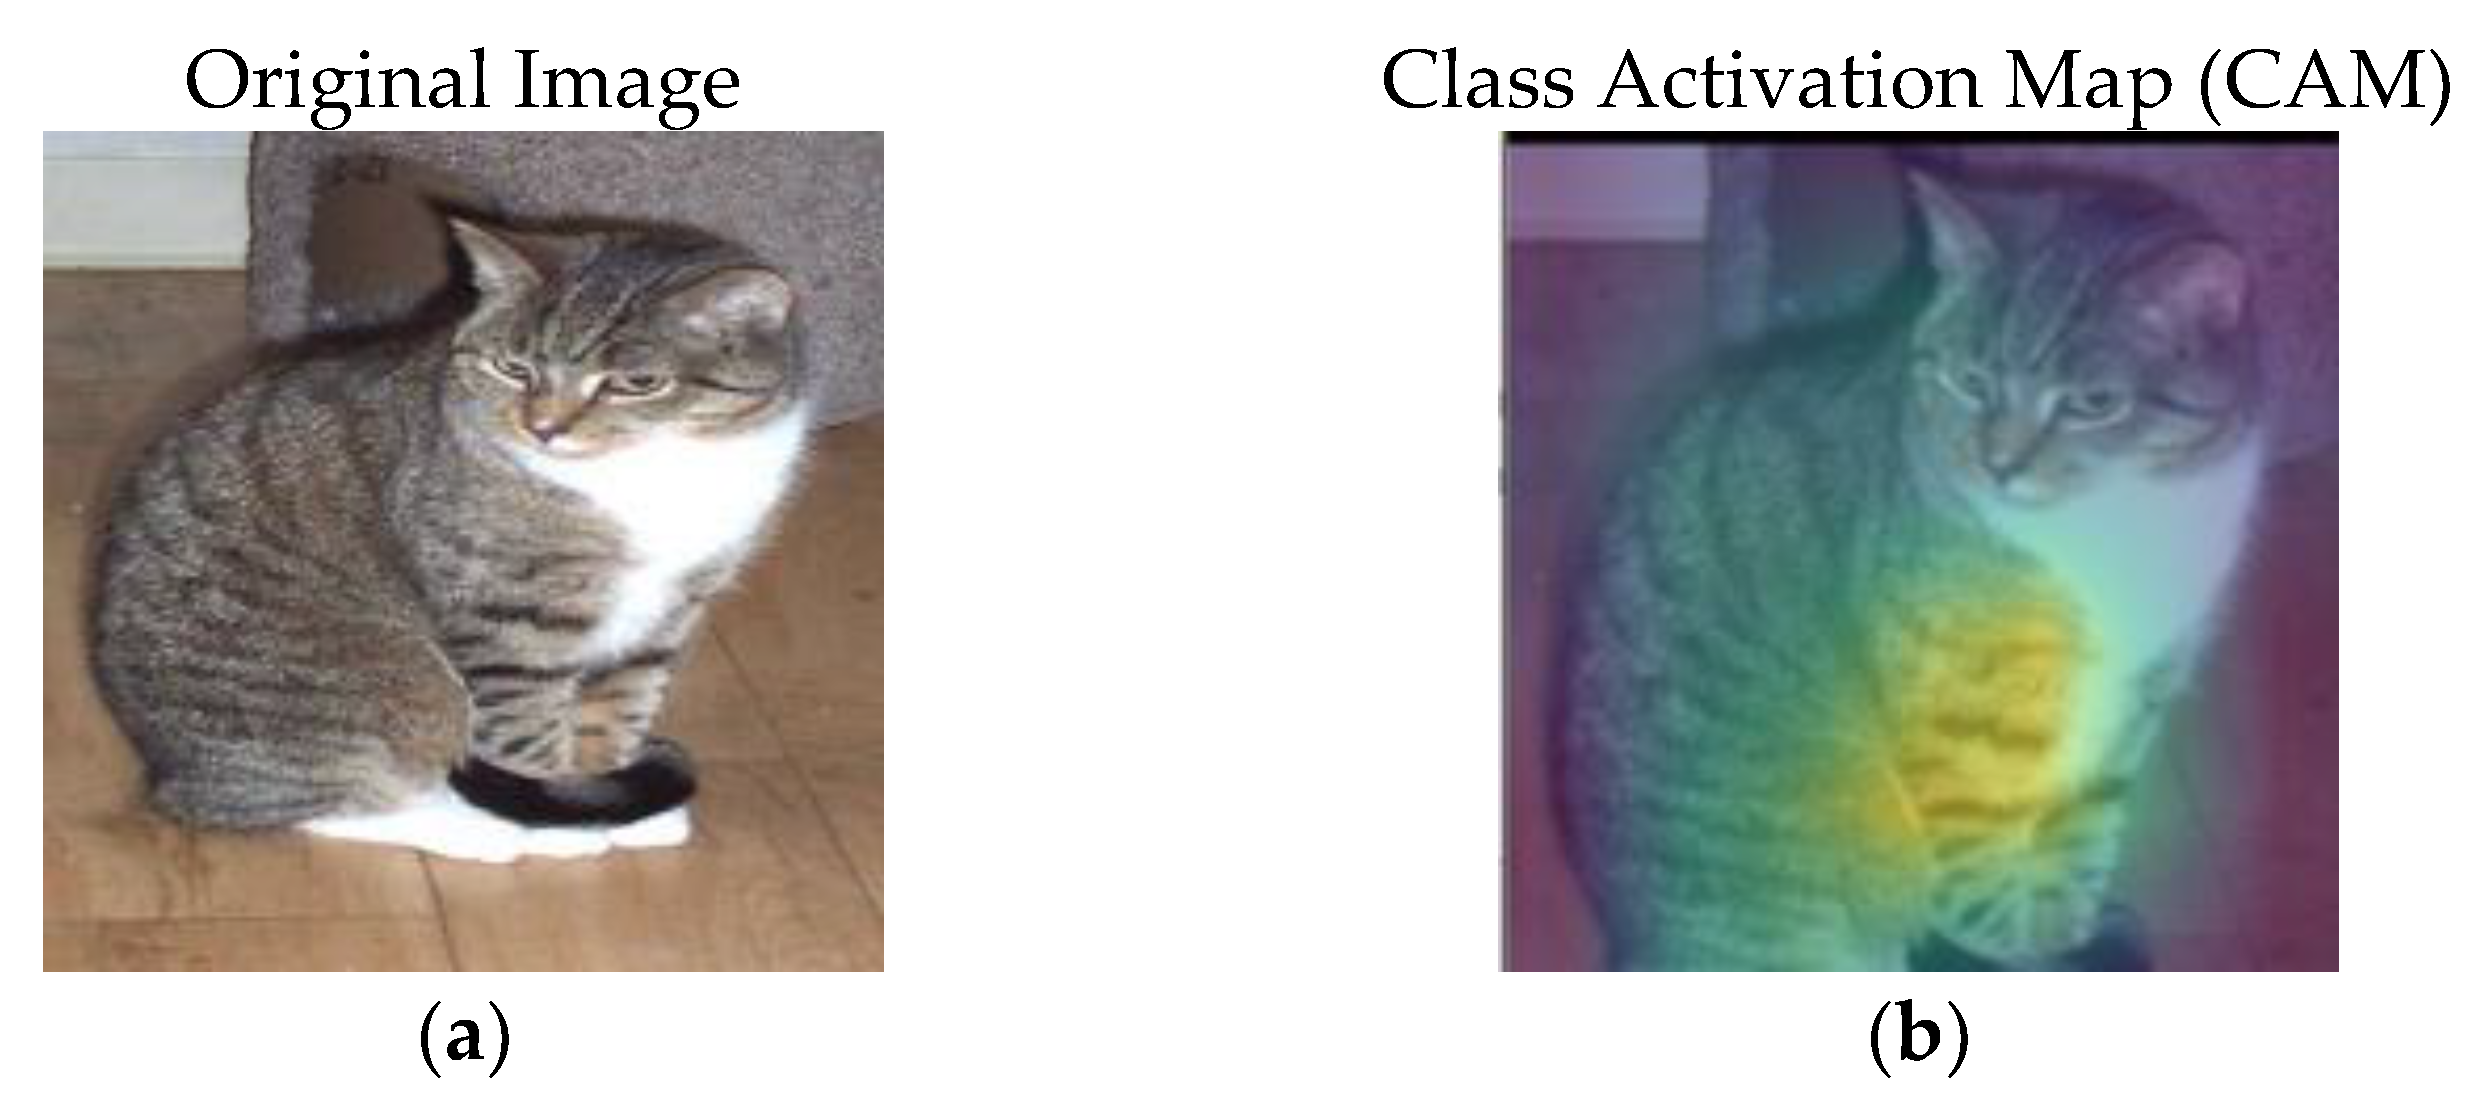
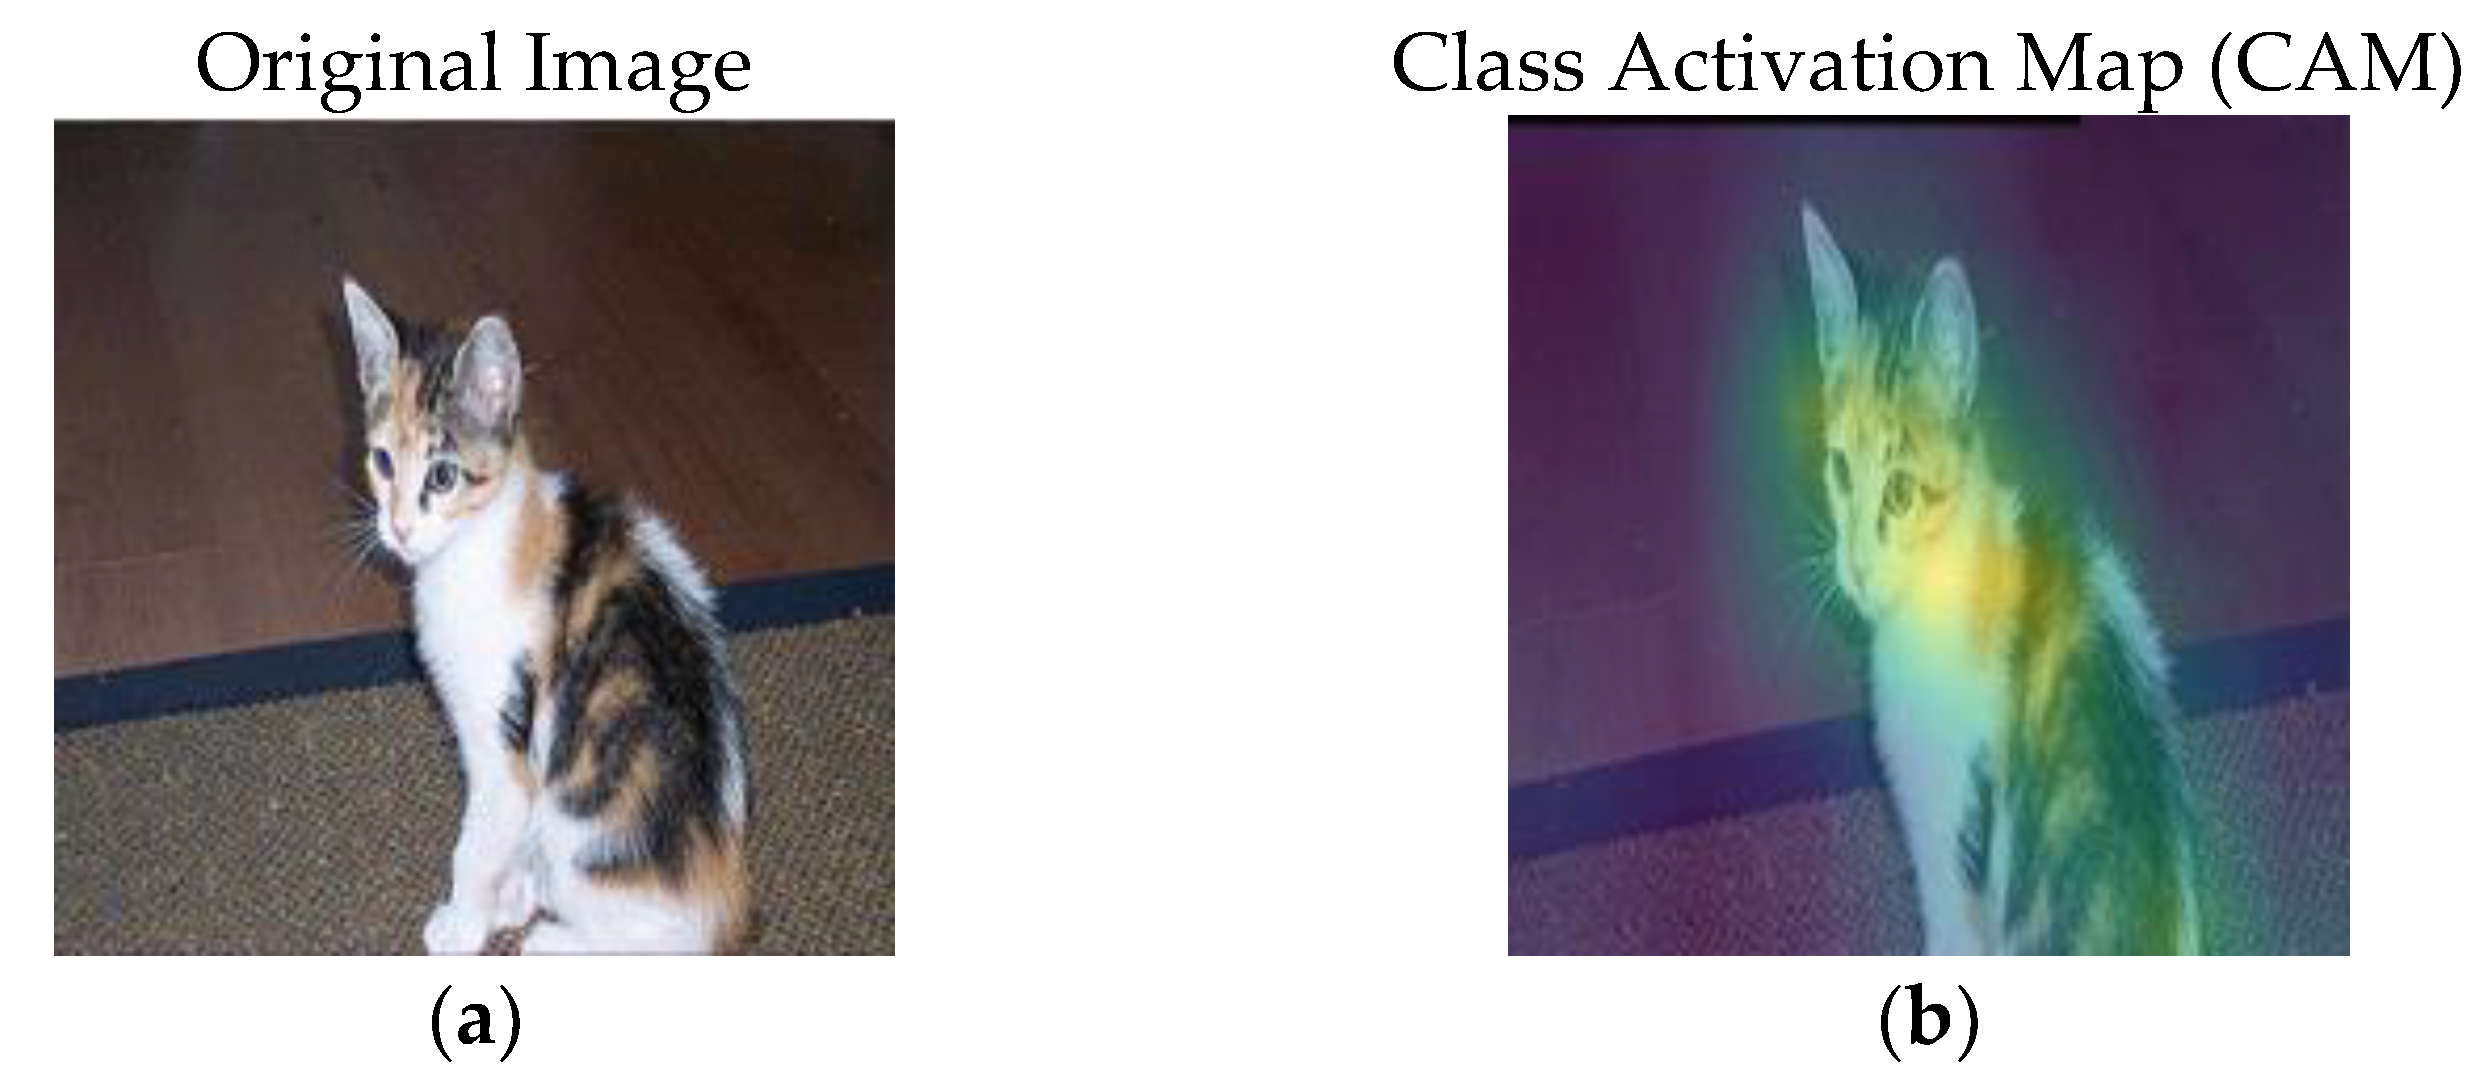
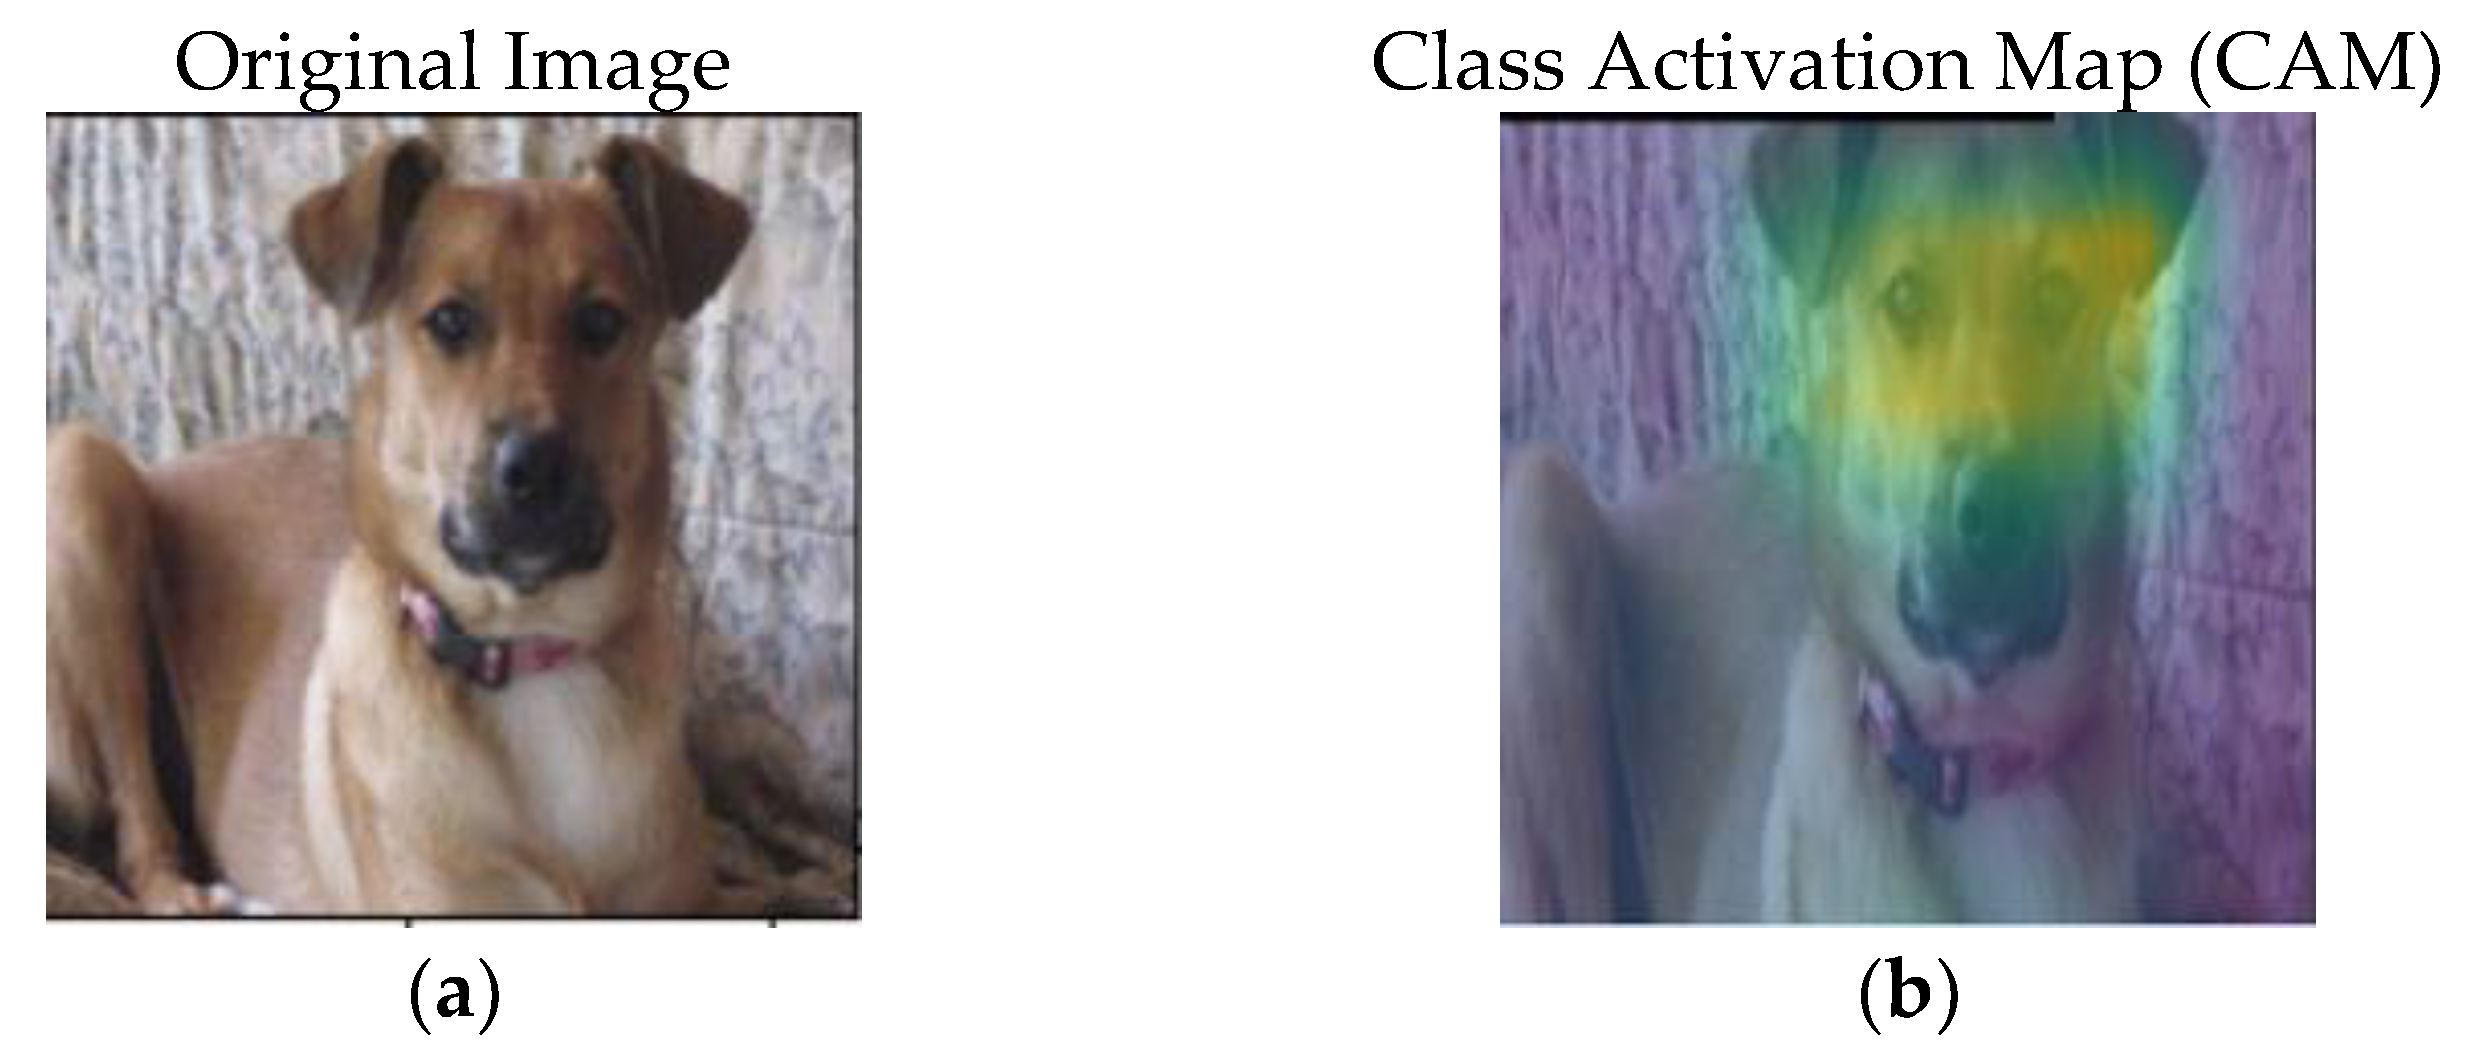
Figure 2 shows the original image and its corresponding class activation map (CAM).
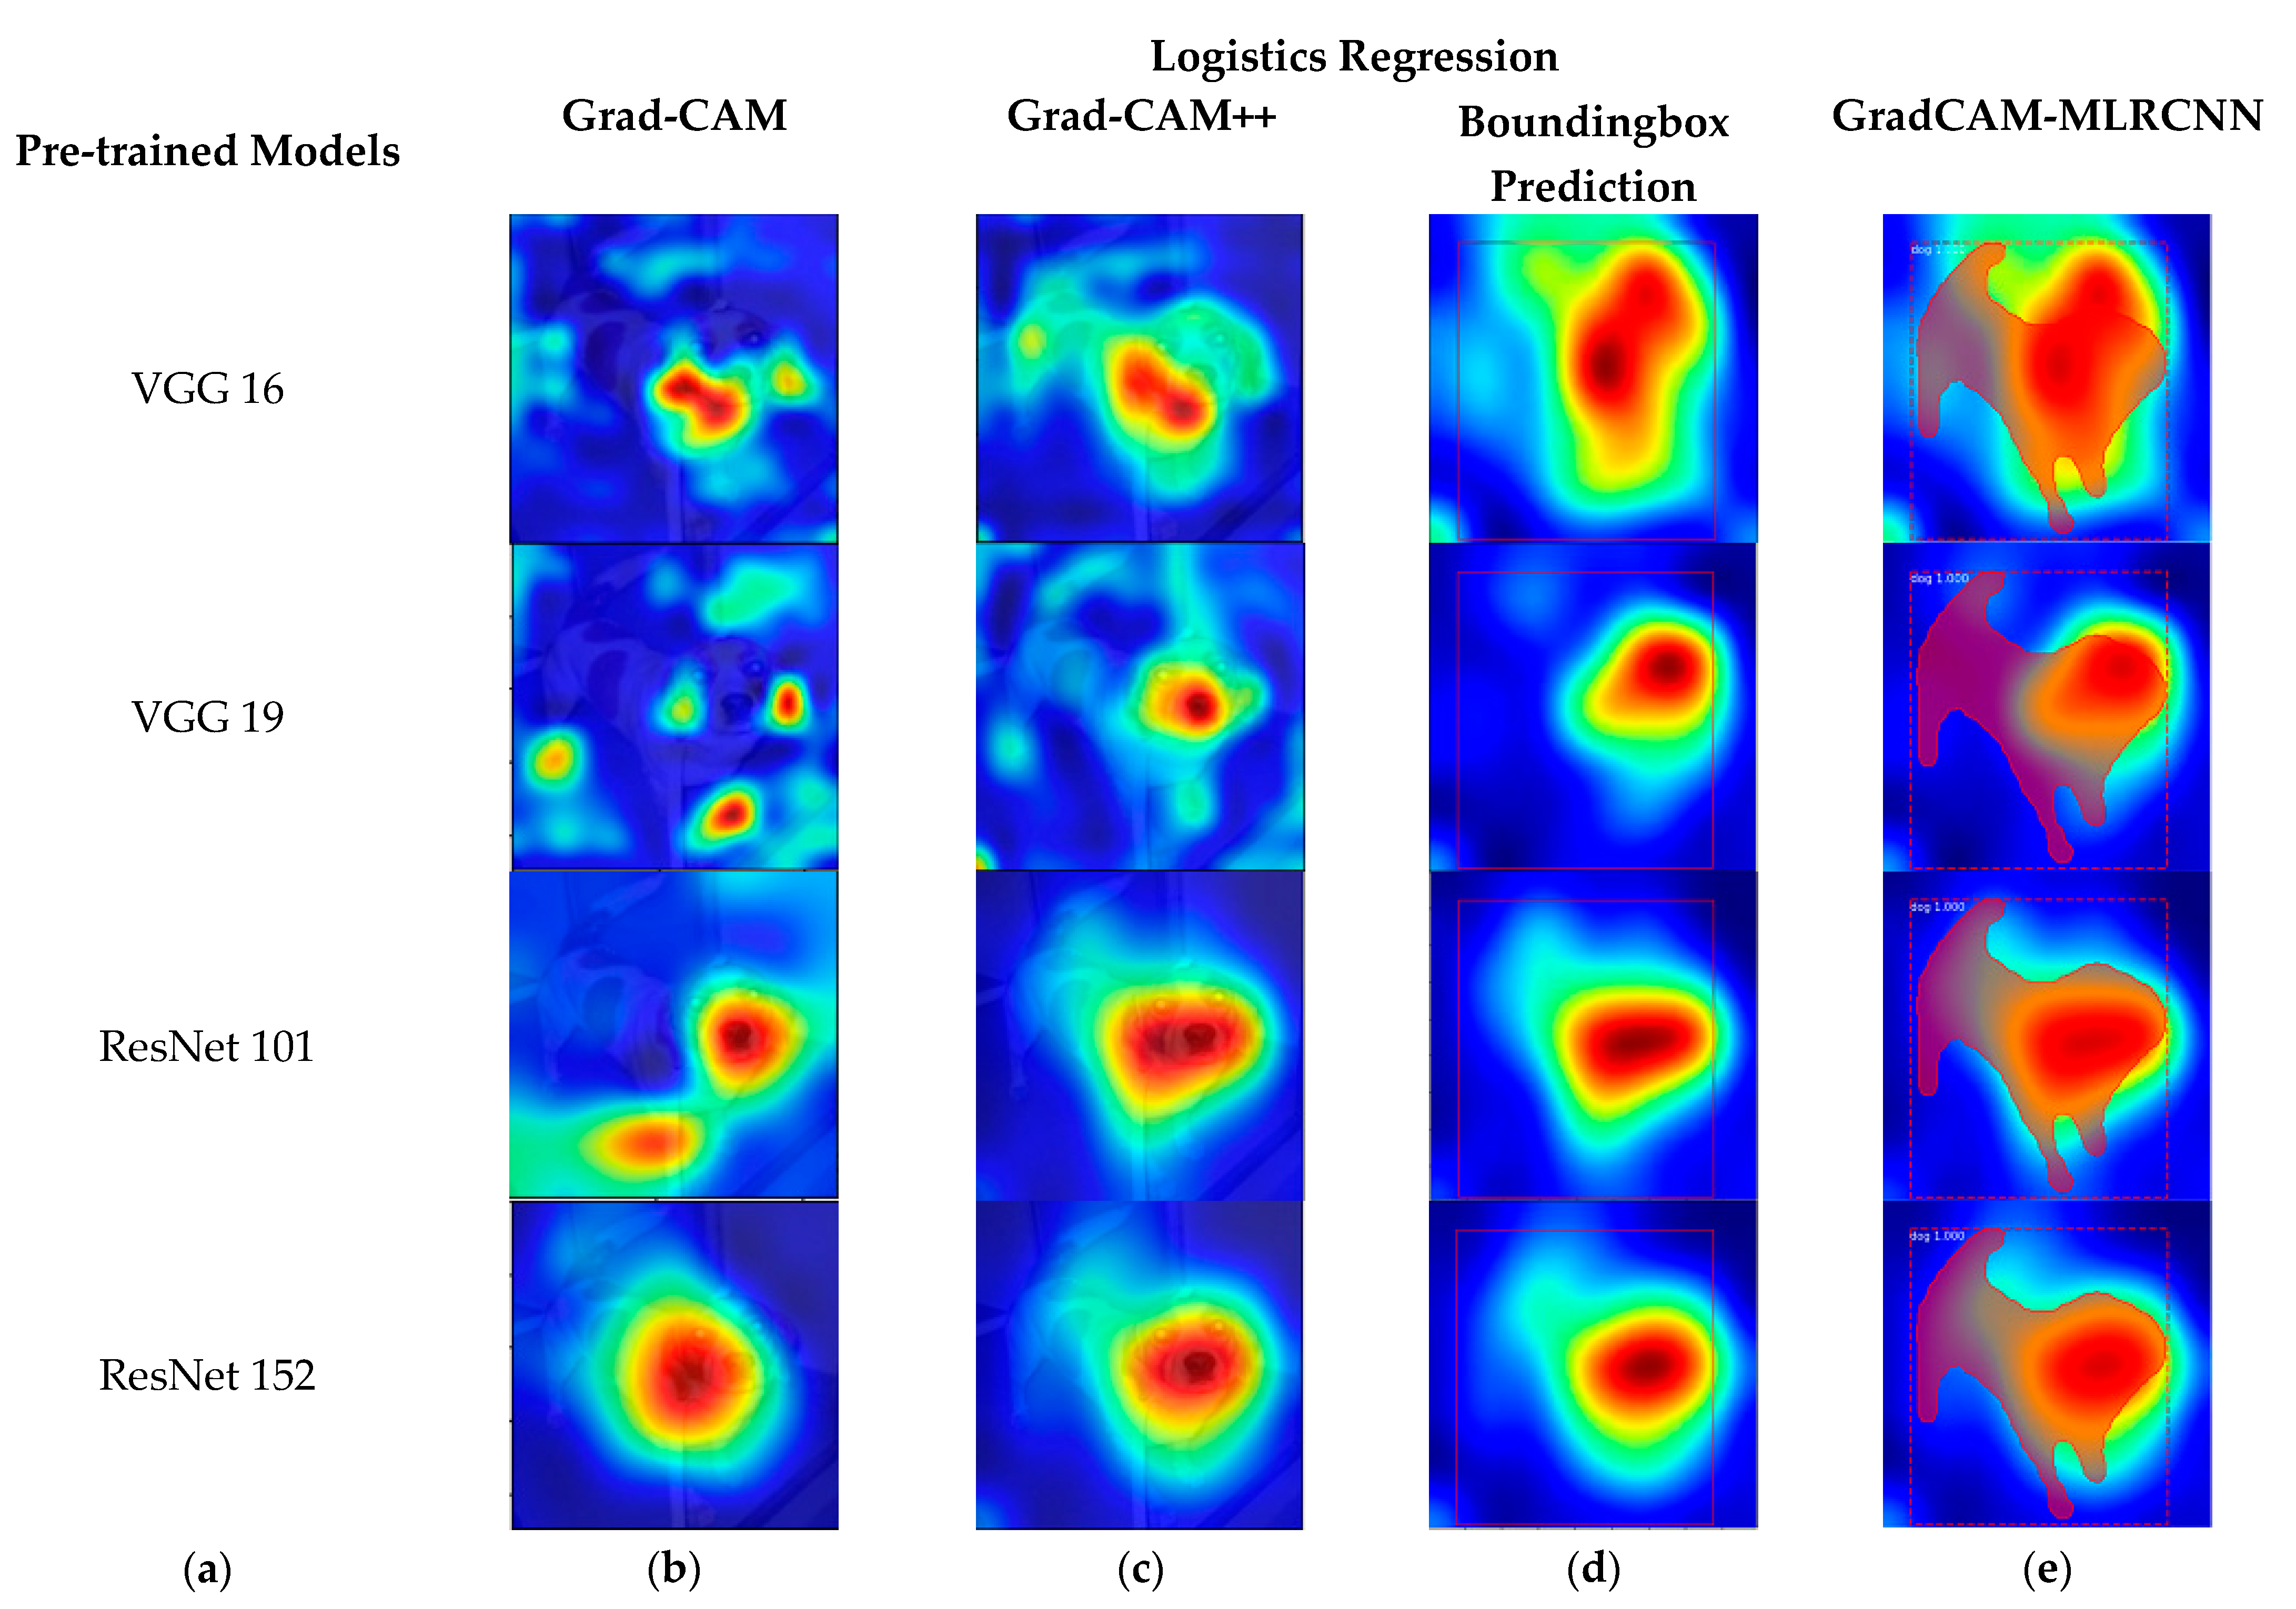
Figure 3 shows the results of various pre-trained models, such as VGG 16, VGG 19, ResNet 101, and ResNet 152 with the corresponding results of Grad-CAM, Grad-CAM++, bounding box prediction, and proposed method (GradCAM-MLRCNN), which contains the bounding box with mask prediction with respect to
logistics regression:
(a) various pre-trained models;
(b) results of Grad-CAM;
(c) results of Grad-CAM++;
(d) bounding box prediction on Grad-CAM++; and (
e) GradCAM-MLRCNN.
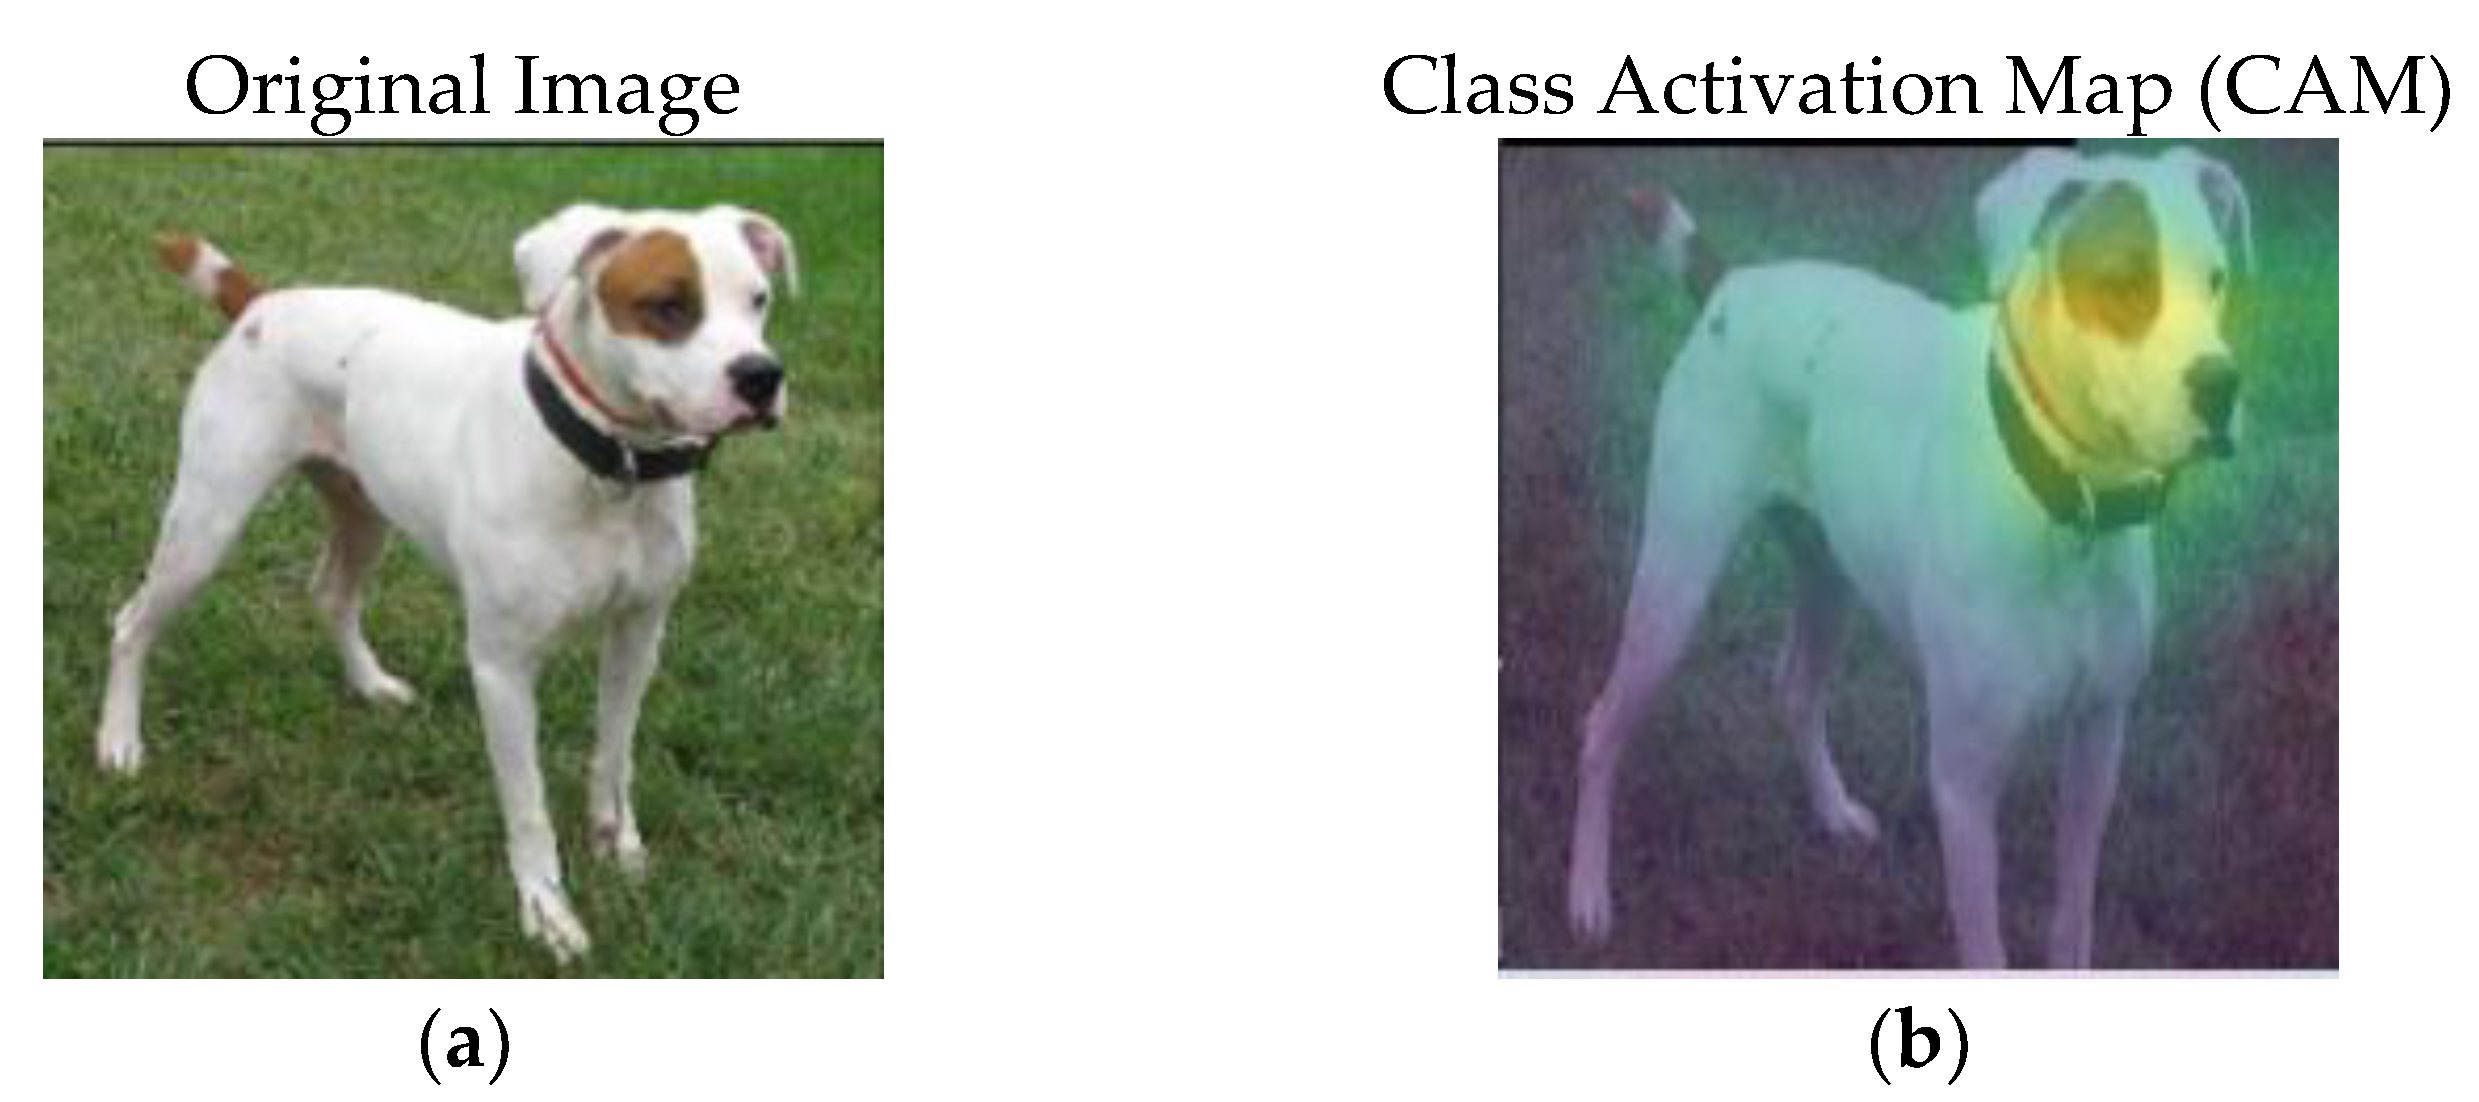
Figure 4 shows the original image and its corresponding class activation map (CAM).
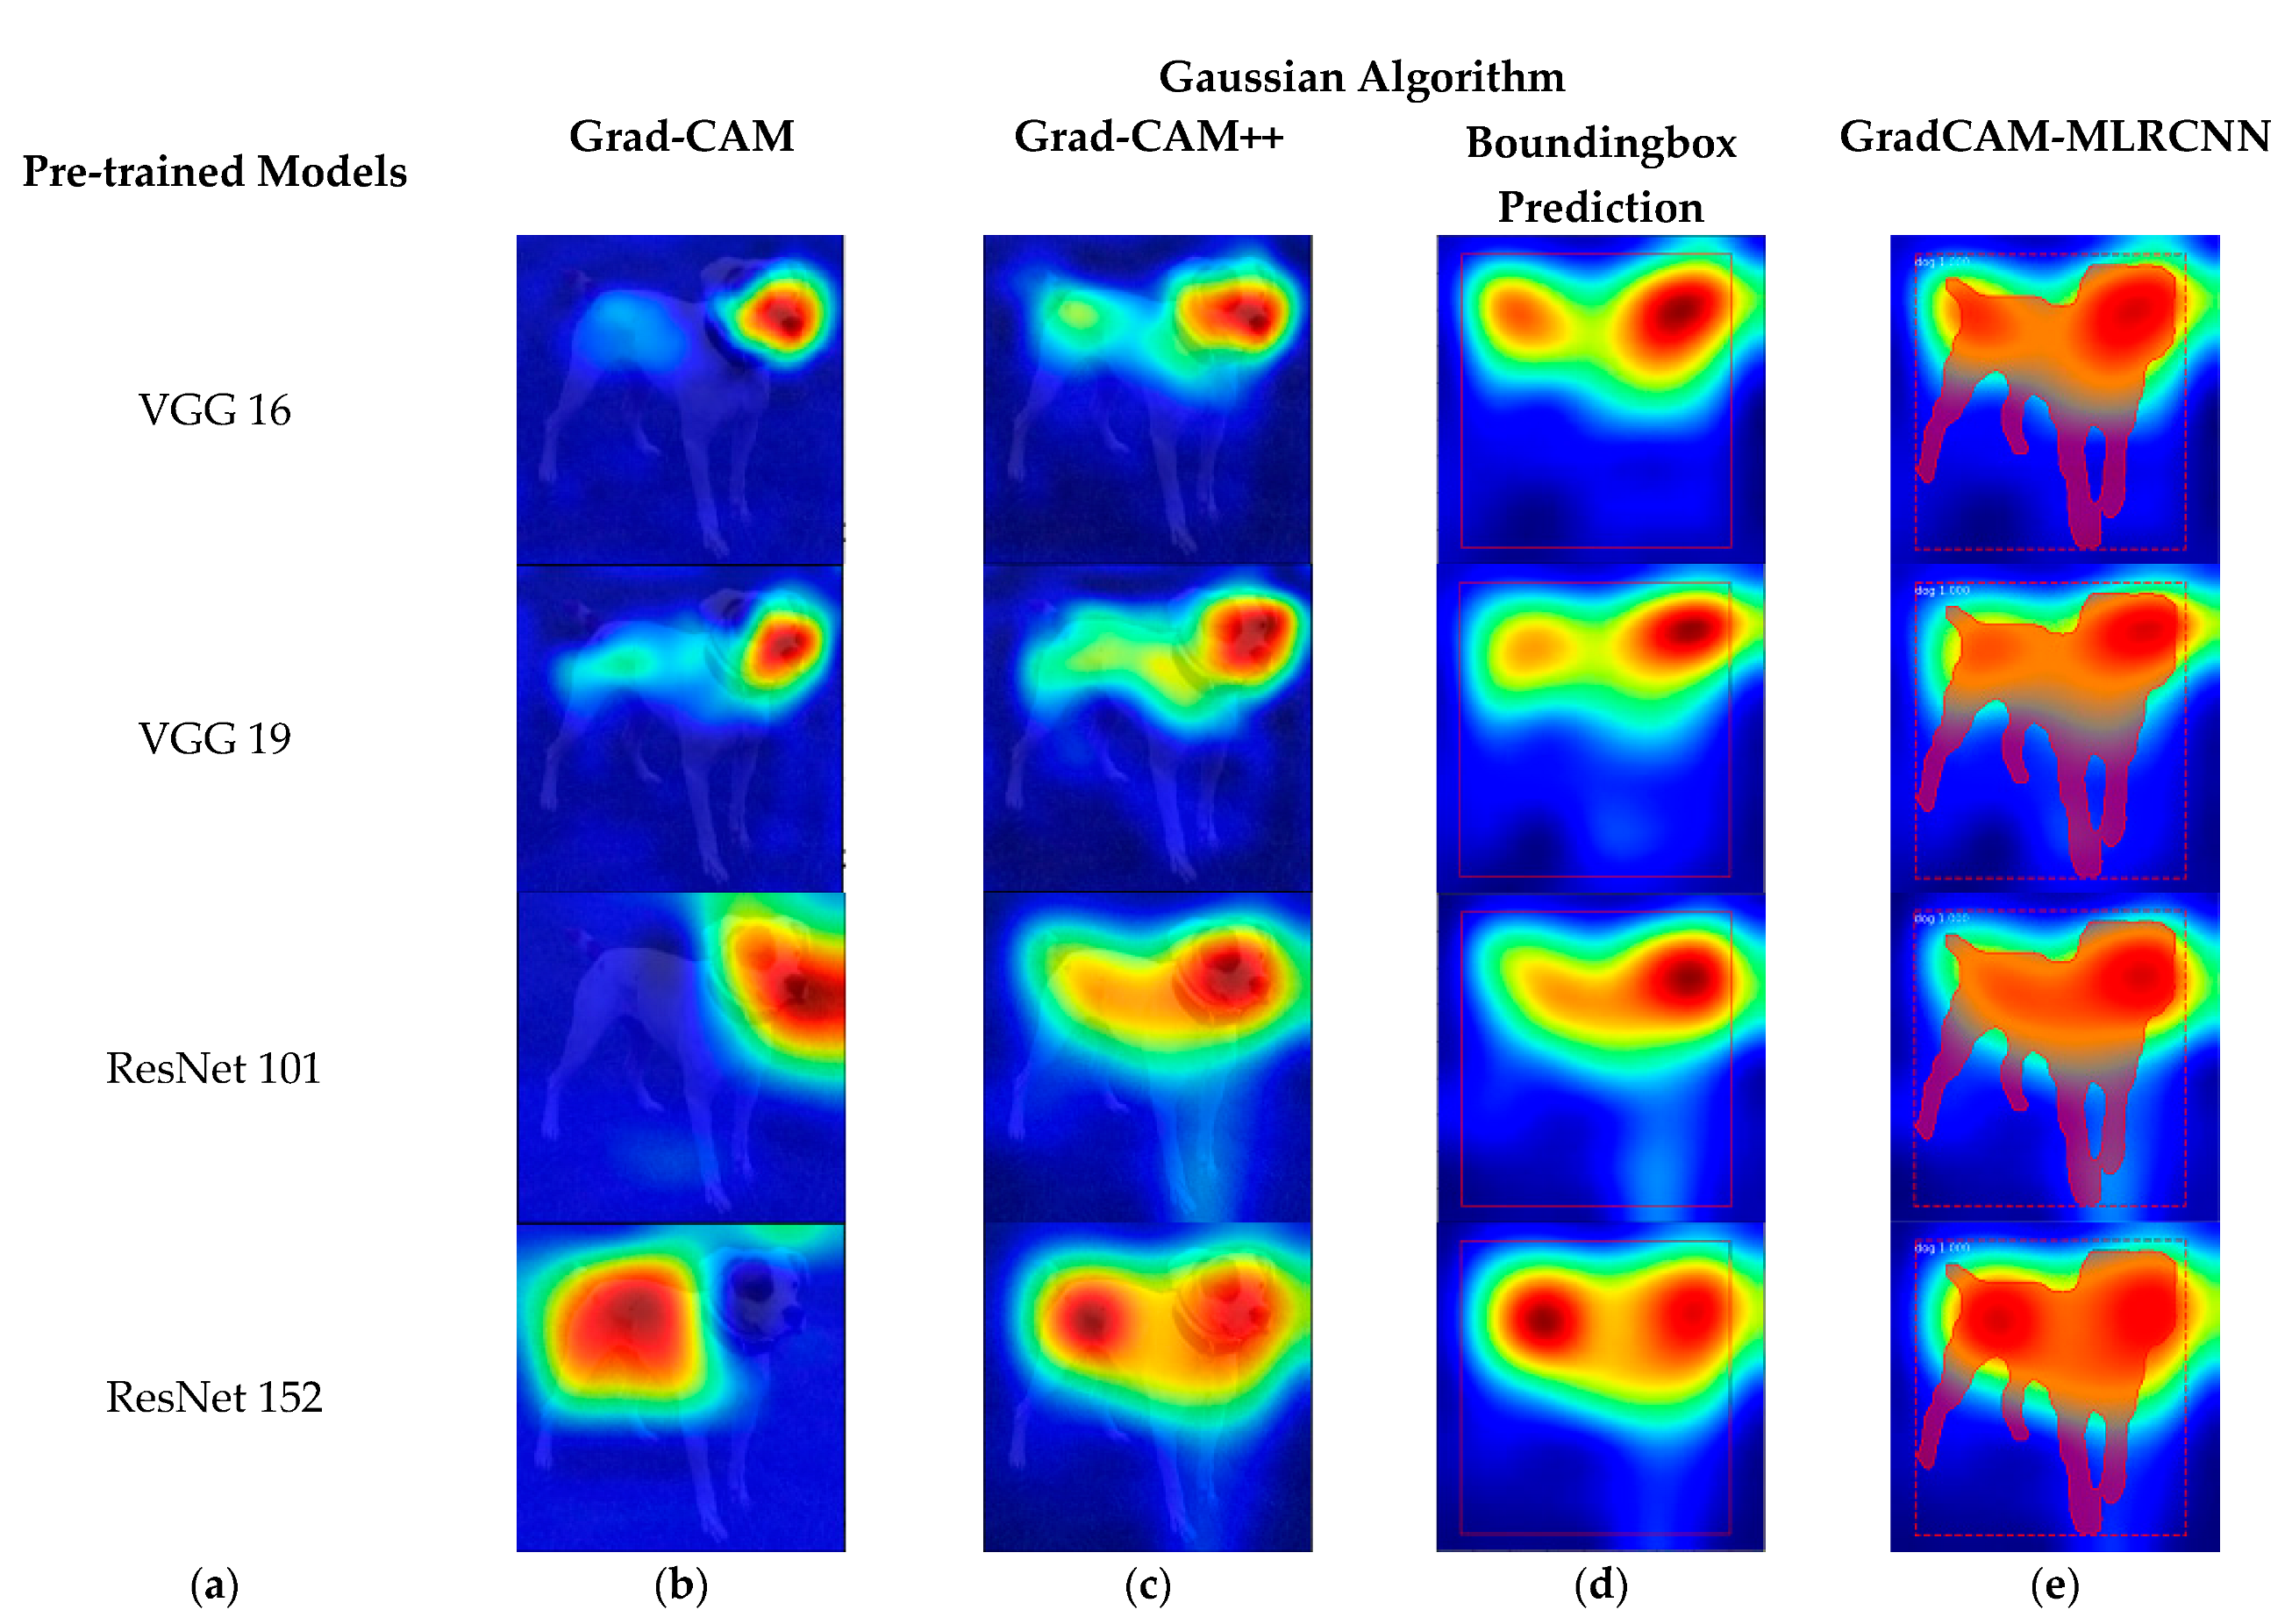
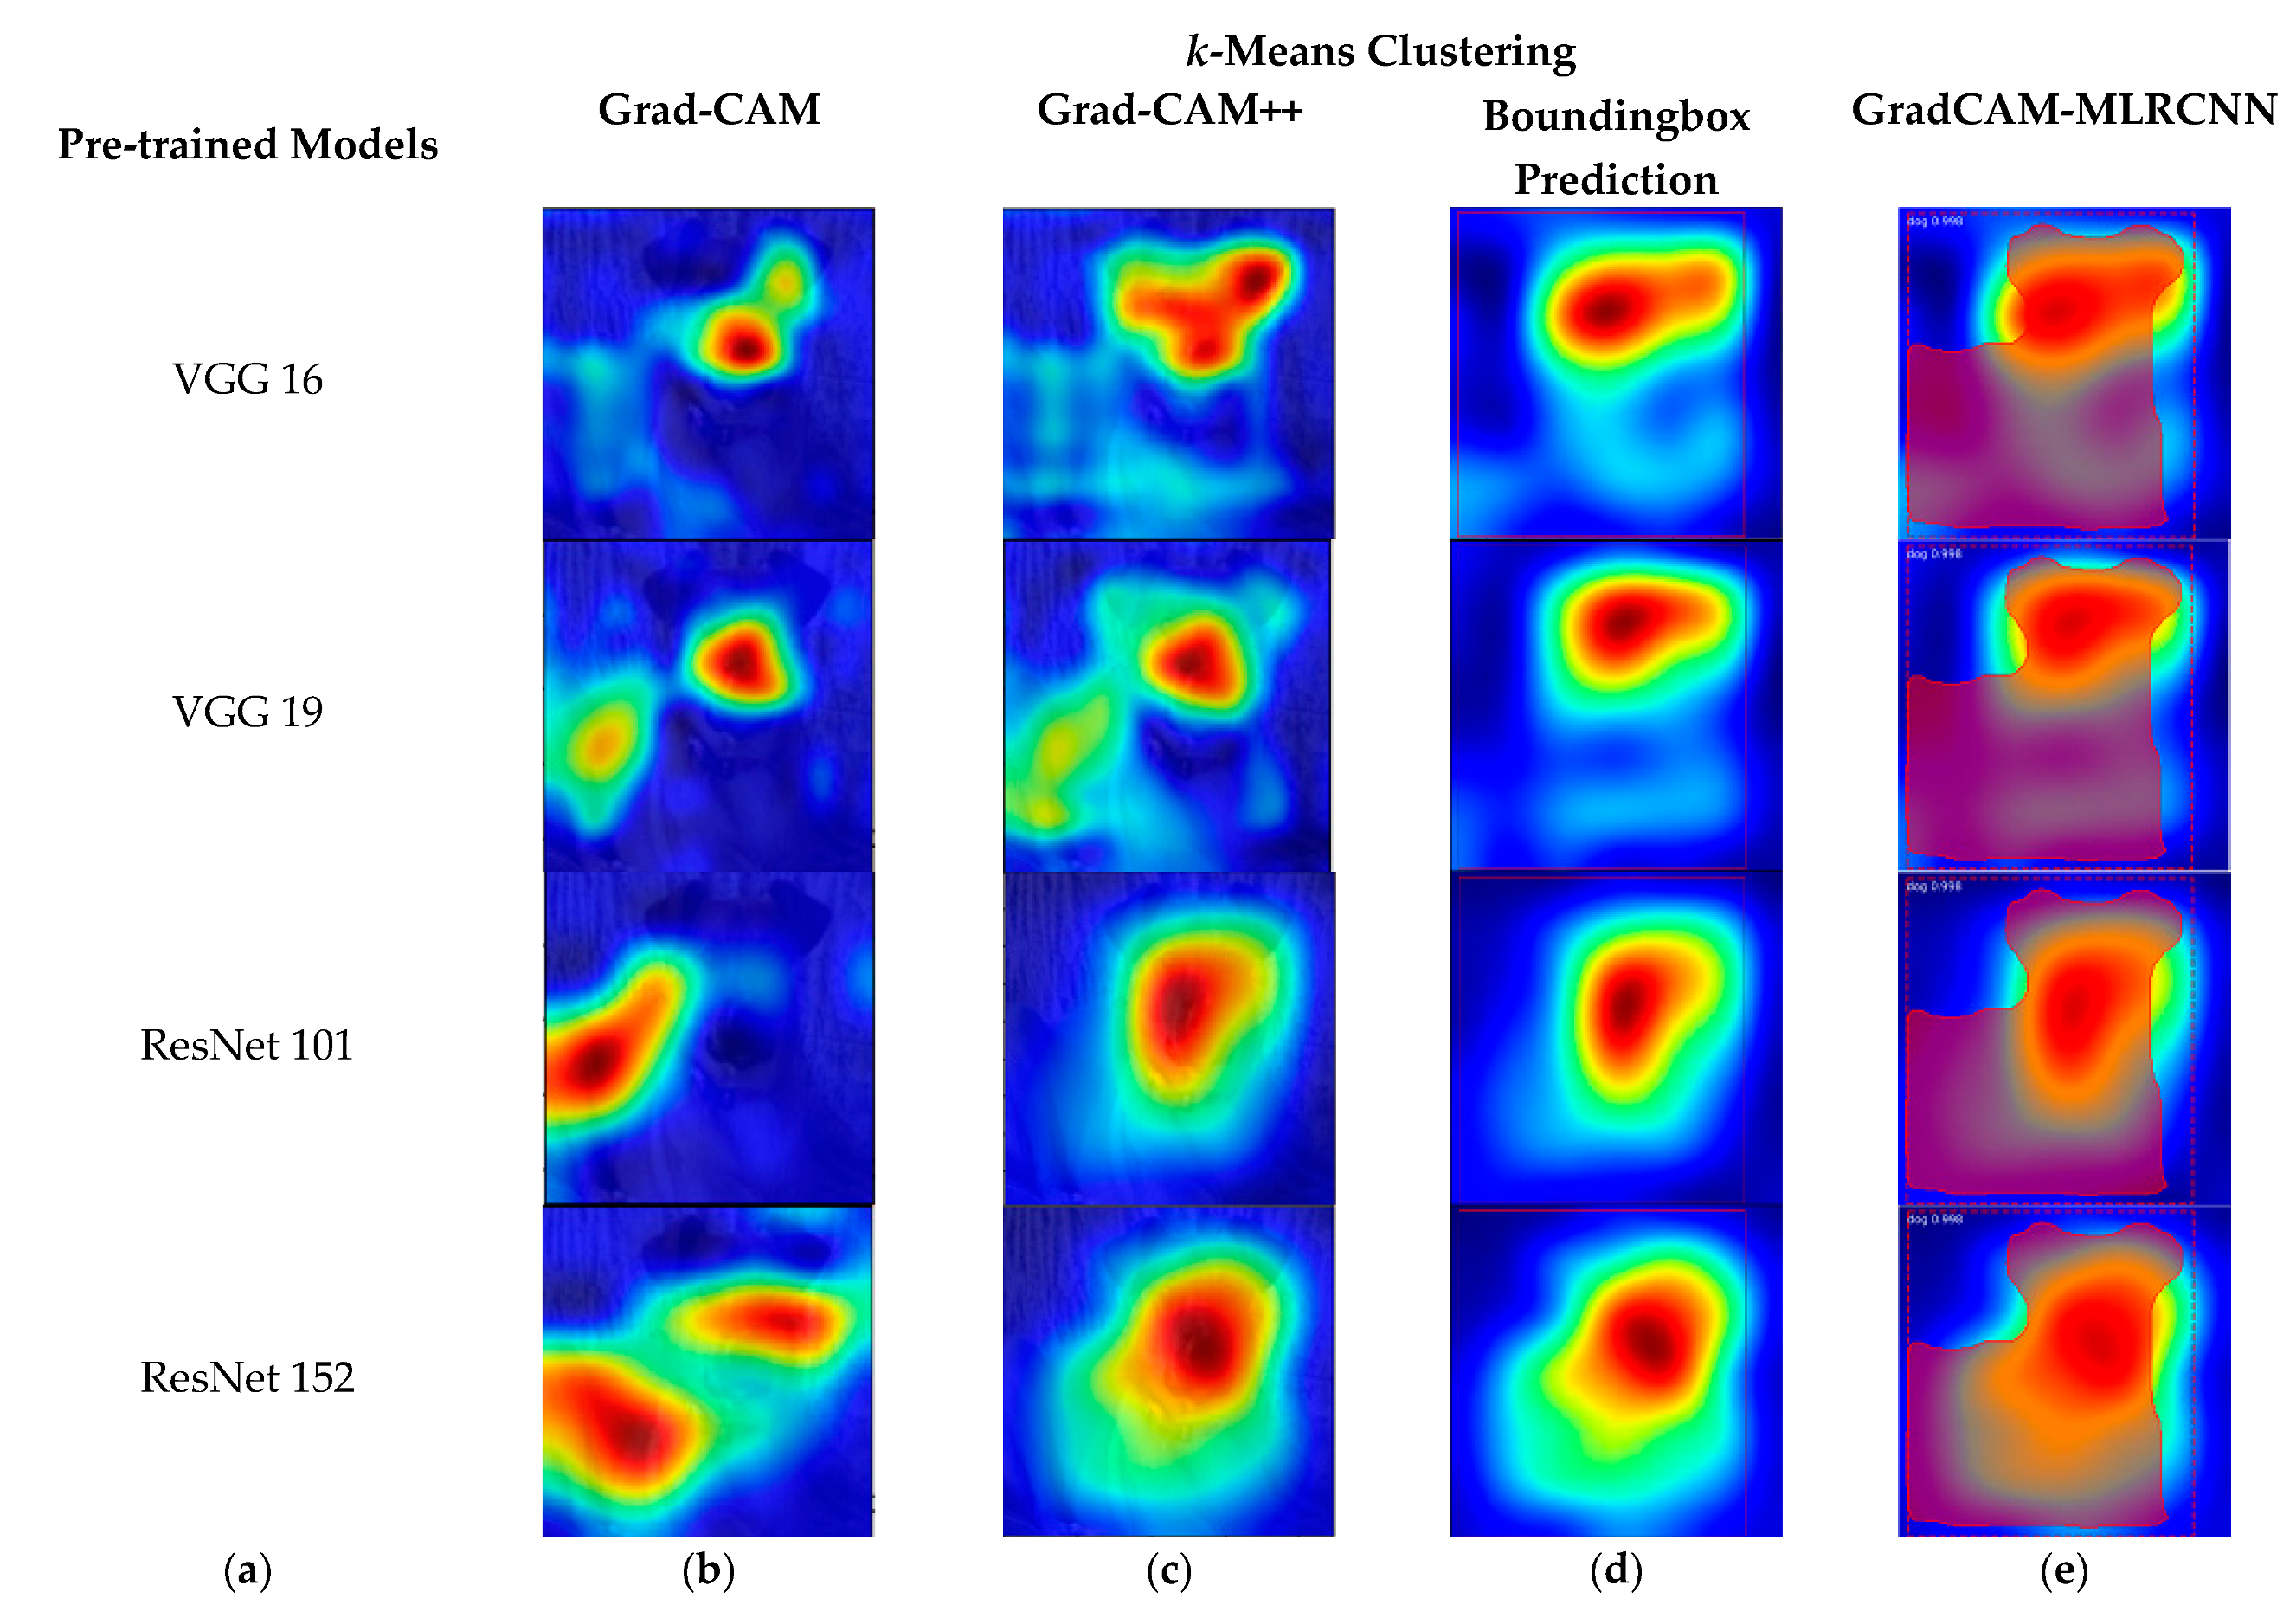
Figure 5 shows the results of various pre-trained models, such as VGG 16, VGG 19, ResNet 101, and ResNet 152 with the corresponding results of Grad-CAM, Grad-CAM++, bounding box prediction, and proposed method (GradCAM-MLRCNN) that contains the bounding box with mask prediction for the
Gaussian algorithm:
(a) various pre-trained models;
(b) results of Grad-CAM;
(c) results of Grad-CAM++;
(d) bounding box prediction on Grad-CAM++; and (
e) GradCAM-MLRCNN.
Figure 6 shows the original image and its corresponding class activation map (CAM).
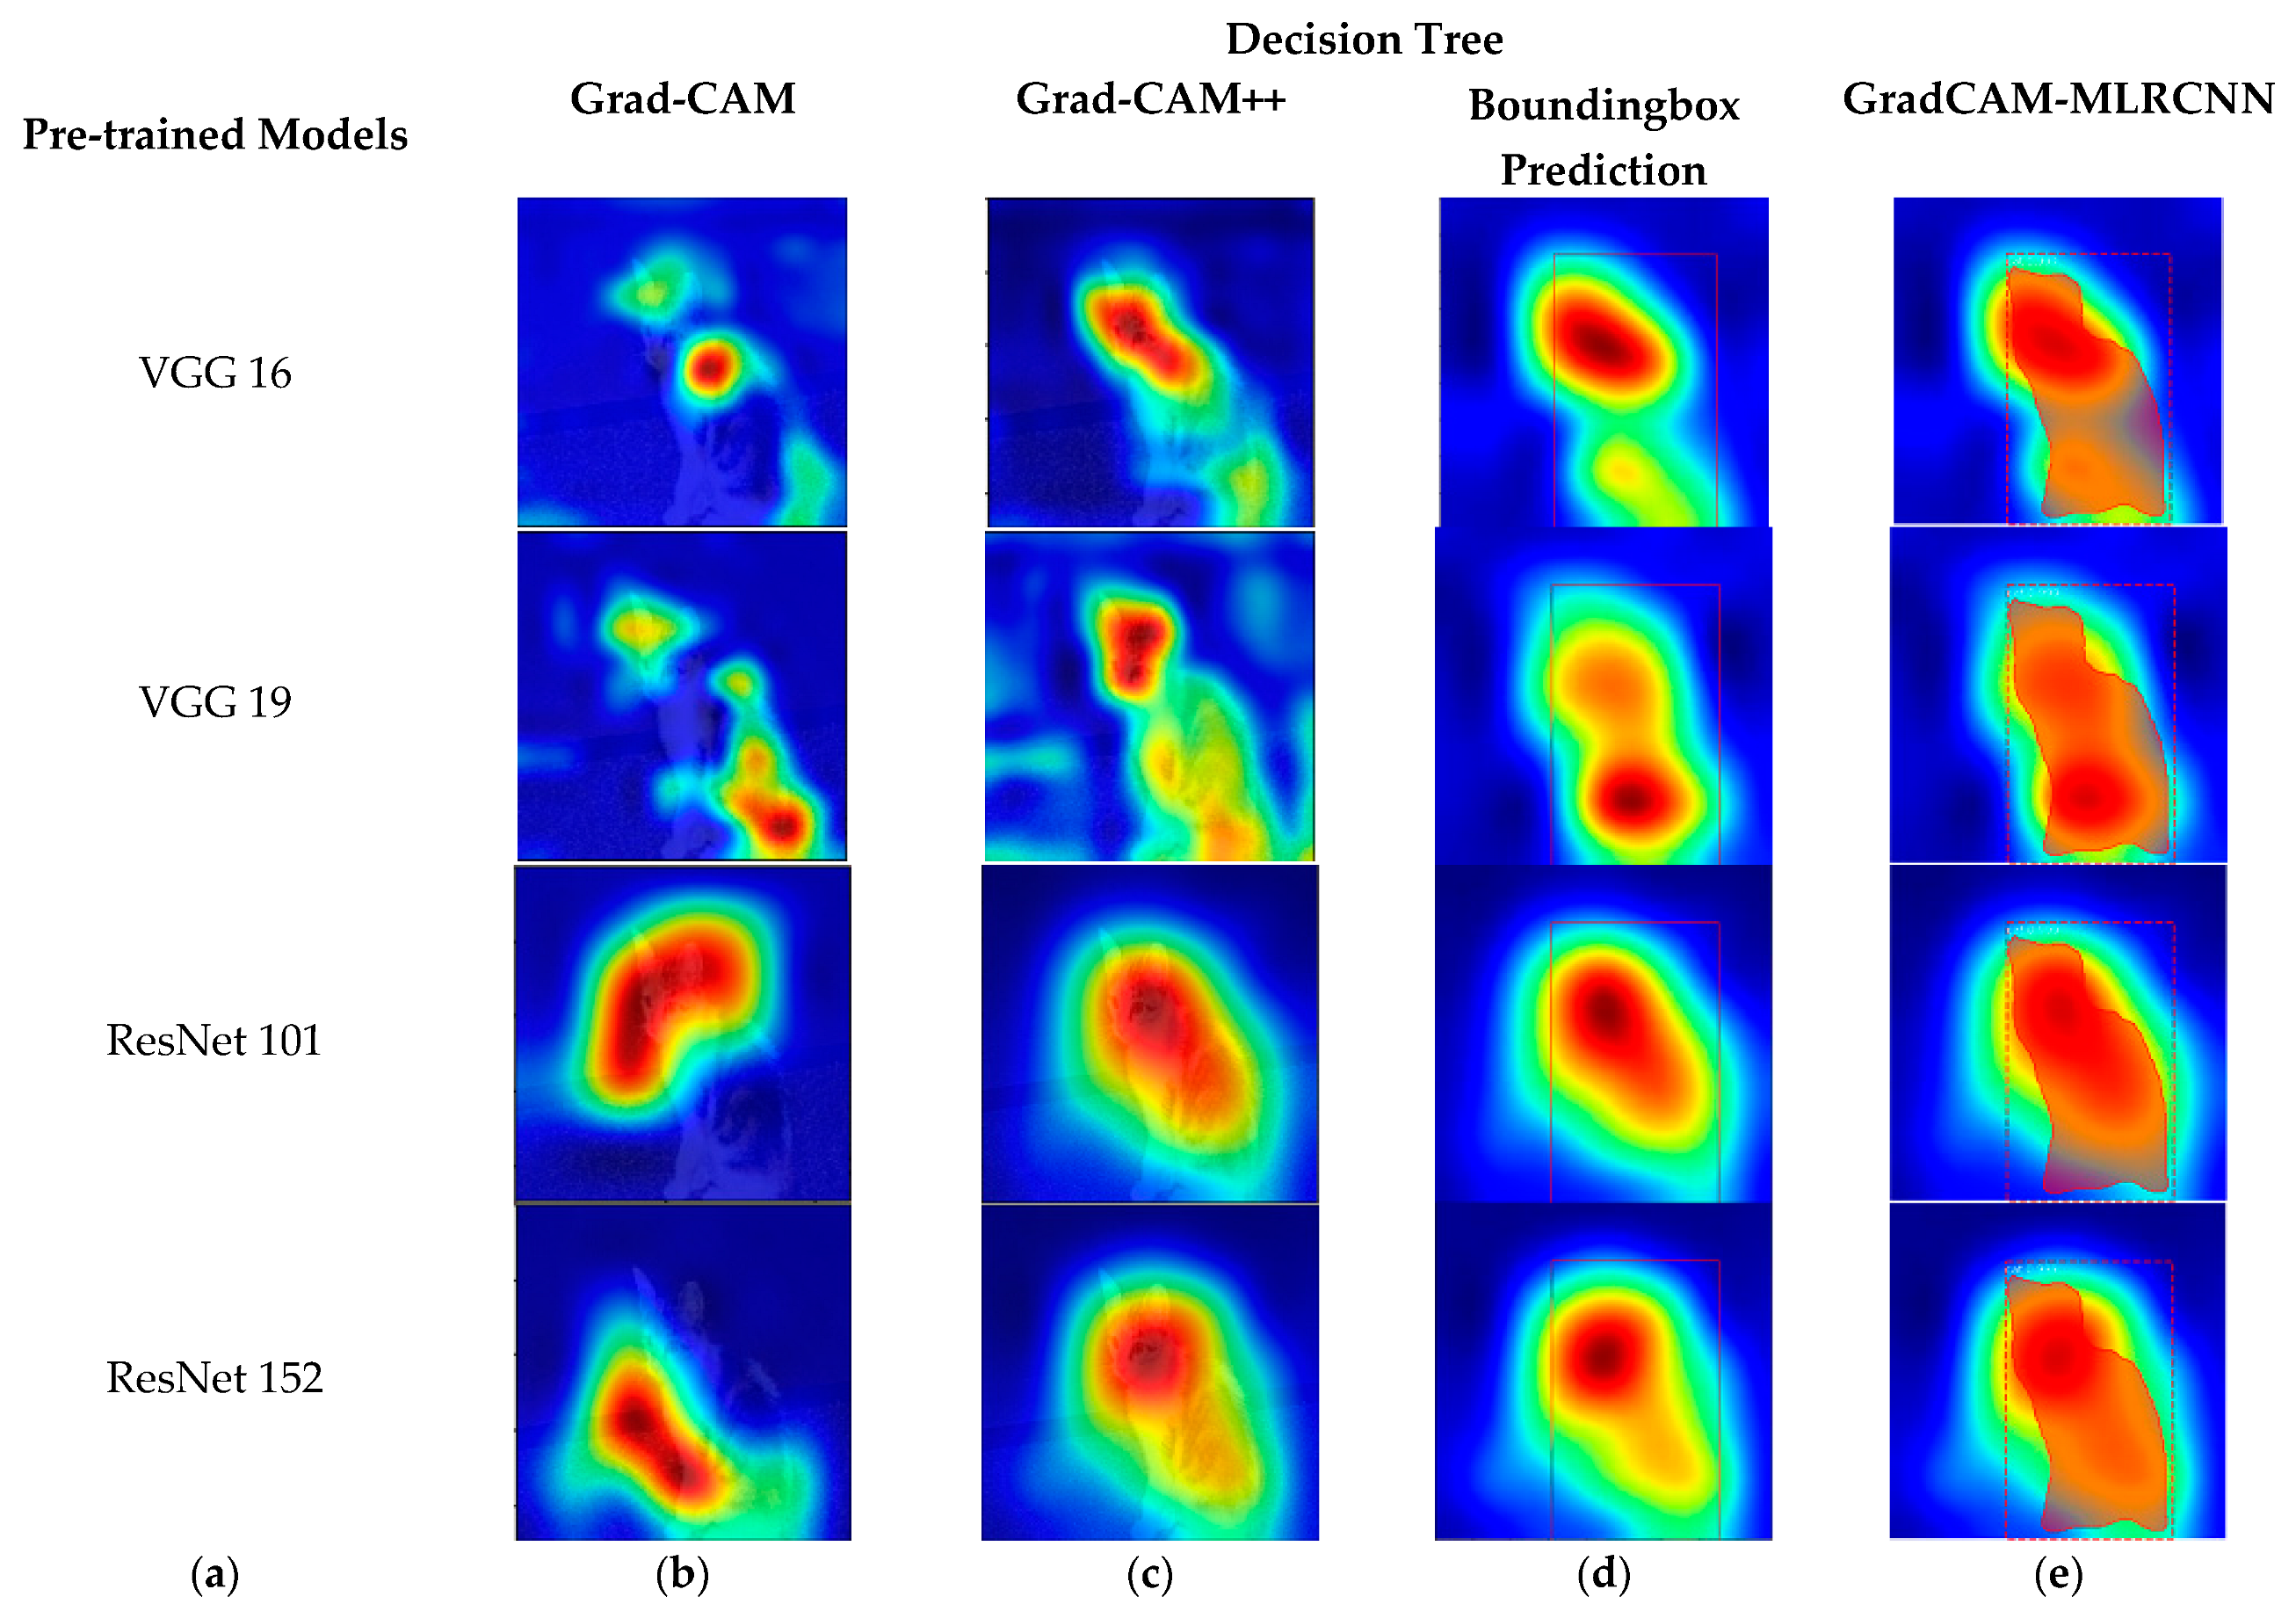
Figure 7 demonstrates the results of various pre-trained models, such as VGG 16, VGG 19, ResNet 101, and ResNet 152 with the corresponding results of Grad-CAM, Grad-CAM++, bounding box prediction, and proposed method (GradCAM-MLRCNN), which contains the bounding box with mask prediction with respect to
k-nearest neighbor:
(a) various pre-trained models;
(b) results of Grad-CAM;
(c) results of Grad-CAM++;
(d) bounding box prediction on Grad-CAM++; and
(e) GradCAM-MLRCNN.
Figure 8 shows the original image and its corresponding class activation map (CAM).
Figure 9 shows the results of various pre-trained models, such as VGG 16, VGG 19, ResNet 101, and ResNet 152 with the corresponding results of Grad-CAM, Grad-CAM++, bounding box prediction, and proposed method (GradCAM-MLRCNN) that contains the bounding box with mask prediction concerning the
decision tree:
(a) various pre-trained models;
(b) results of Grad-CAM;
(c) results of Grad-CAM++;
(d) bounding box prediction on Grad-CAM++; and
(e) GradCAM-MLRCNN.
Figure 10 shows the original image and its corresponding class activation map (CAM).
Figure 11 shows the results of various pre-trained models, such as VGG 16, VGG 19, ResNet 101, and ResNet 152 with the corresponding results of Grad-CAM, Grad-CAM++, bounding box prediction, and proposed method (GradCAM-MLRCNN), which is the bounding box with mask prediction for
k-means clustering:
(a) various pre-trained models;
(b) results of Grad-CAM;
(c) results of Grad-CAM++;
(d) bounding box prediction on Grad-CAM++; and
(e) GradCAM-MLRCNN.
As demonstrated in
Figure 3,
Figure 5,
Figure 7,
Figure 9 and
Figure 11, the framework generated the bounding boxes with segmented masks for each class in an image. To avoid overfitting the model and improve its performance, the transfer learning from the pre-trained model (VGG 16, VGG 19, ResNet 101, and ResNet 152) on the MS-COCO dataset was used. Initially, we used ResNet 152 as a feature extractor. This research work used Mask R-CNN and fine-tuned the parameters to match the pre-trained model to the Grad-CAM++.The input frames were scaled to 224 × 224 and have three channels (R, G, and B). The model is optimized using the stochastic gradient descent (SGD) technique with an initial learning rate of 0.00001 to discover the best weights to reduce the error between the expected and desired output. Momentum is a technique for reducing weight variation swings in continuous iterations that work on weighting after the weight has been changed. The proposed model run with 50 epochs to train and validate the data and then the loss is computed for every epoch while the learning processes.
The confusion matrix on the testing dataset is provided in Table 7 to analyze the efficacy of the proposed method to prove the goodness of fit by chi-square statistical test. As displayed in the confusion matrix, the values in the first row, from left to right, reflect the True-Positive (TP) percent of properly identifying shadow and False-Positive (FP) percent of misclassifying shadow as object. The second row shows the False-Negative percentage (FN) of misclassifying an object as a shadow and the True-Negative percentage (TN) of accurately detecting an object. Three additional measures, namely precision, recall, and accuracy, are determined based on the confusion matrix results to quantitatively evaluate the proposed framework. The findings are tabulated using state-of-the-art machine learning algorithms, such as logistic regression, Gaussian algorithm, k-nearest neighbor, decision tree, and k-means clustering among all of the pre-trained models. Finally, the proposed method proved that logistic regression performed well among other machine learning algorithms with an accuracy rate of 98.4%, recall rate of 99.6%, and precision rate of 97.3% by ResNet 152 and VGG 19.
5.1. Evaluation Metrics-1
In this section, some performance metrics, such as accuracy, recall, and precision, are discussed, analyzed, and compared with other pre-trained models, such as VGG 16, VGG 19, ResNet 101, and ResNet 152, concerning each machine learning algorithms, such as logistic regression, Gaussian algorithm,
k-nearest neighbor, decision tree, and
k-means clustering. These performance metrics were expressed in Equations (21)–(23) as below,
where
TP,
TN,
FN, and
FP are True-Positive, True-Negative, False-Negative, and False-Positive, respectively.
In
Table 2, the accuracy, recall, and precision are displayed concerning the logistics regression classifier among various pre-trained models, such as VGG 16, VGG 19, ResNet 101, and ResNet 152. Compared with other pre-trained models, VGG 19 and ResNet 152 perform better according to logistics regression.
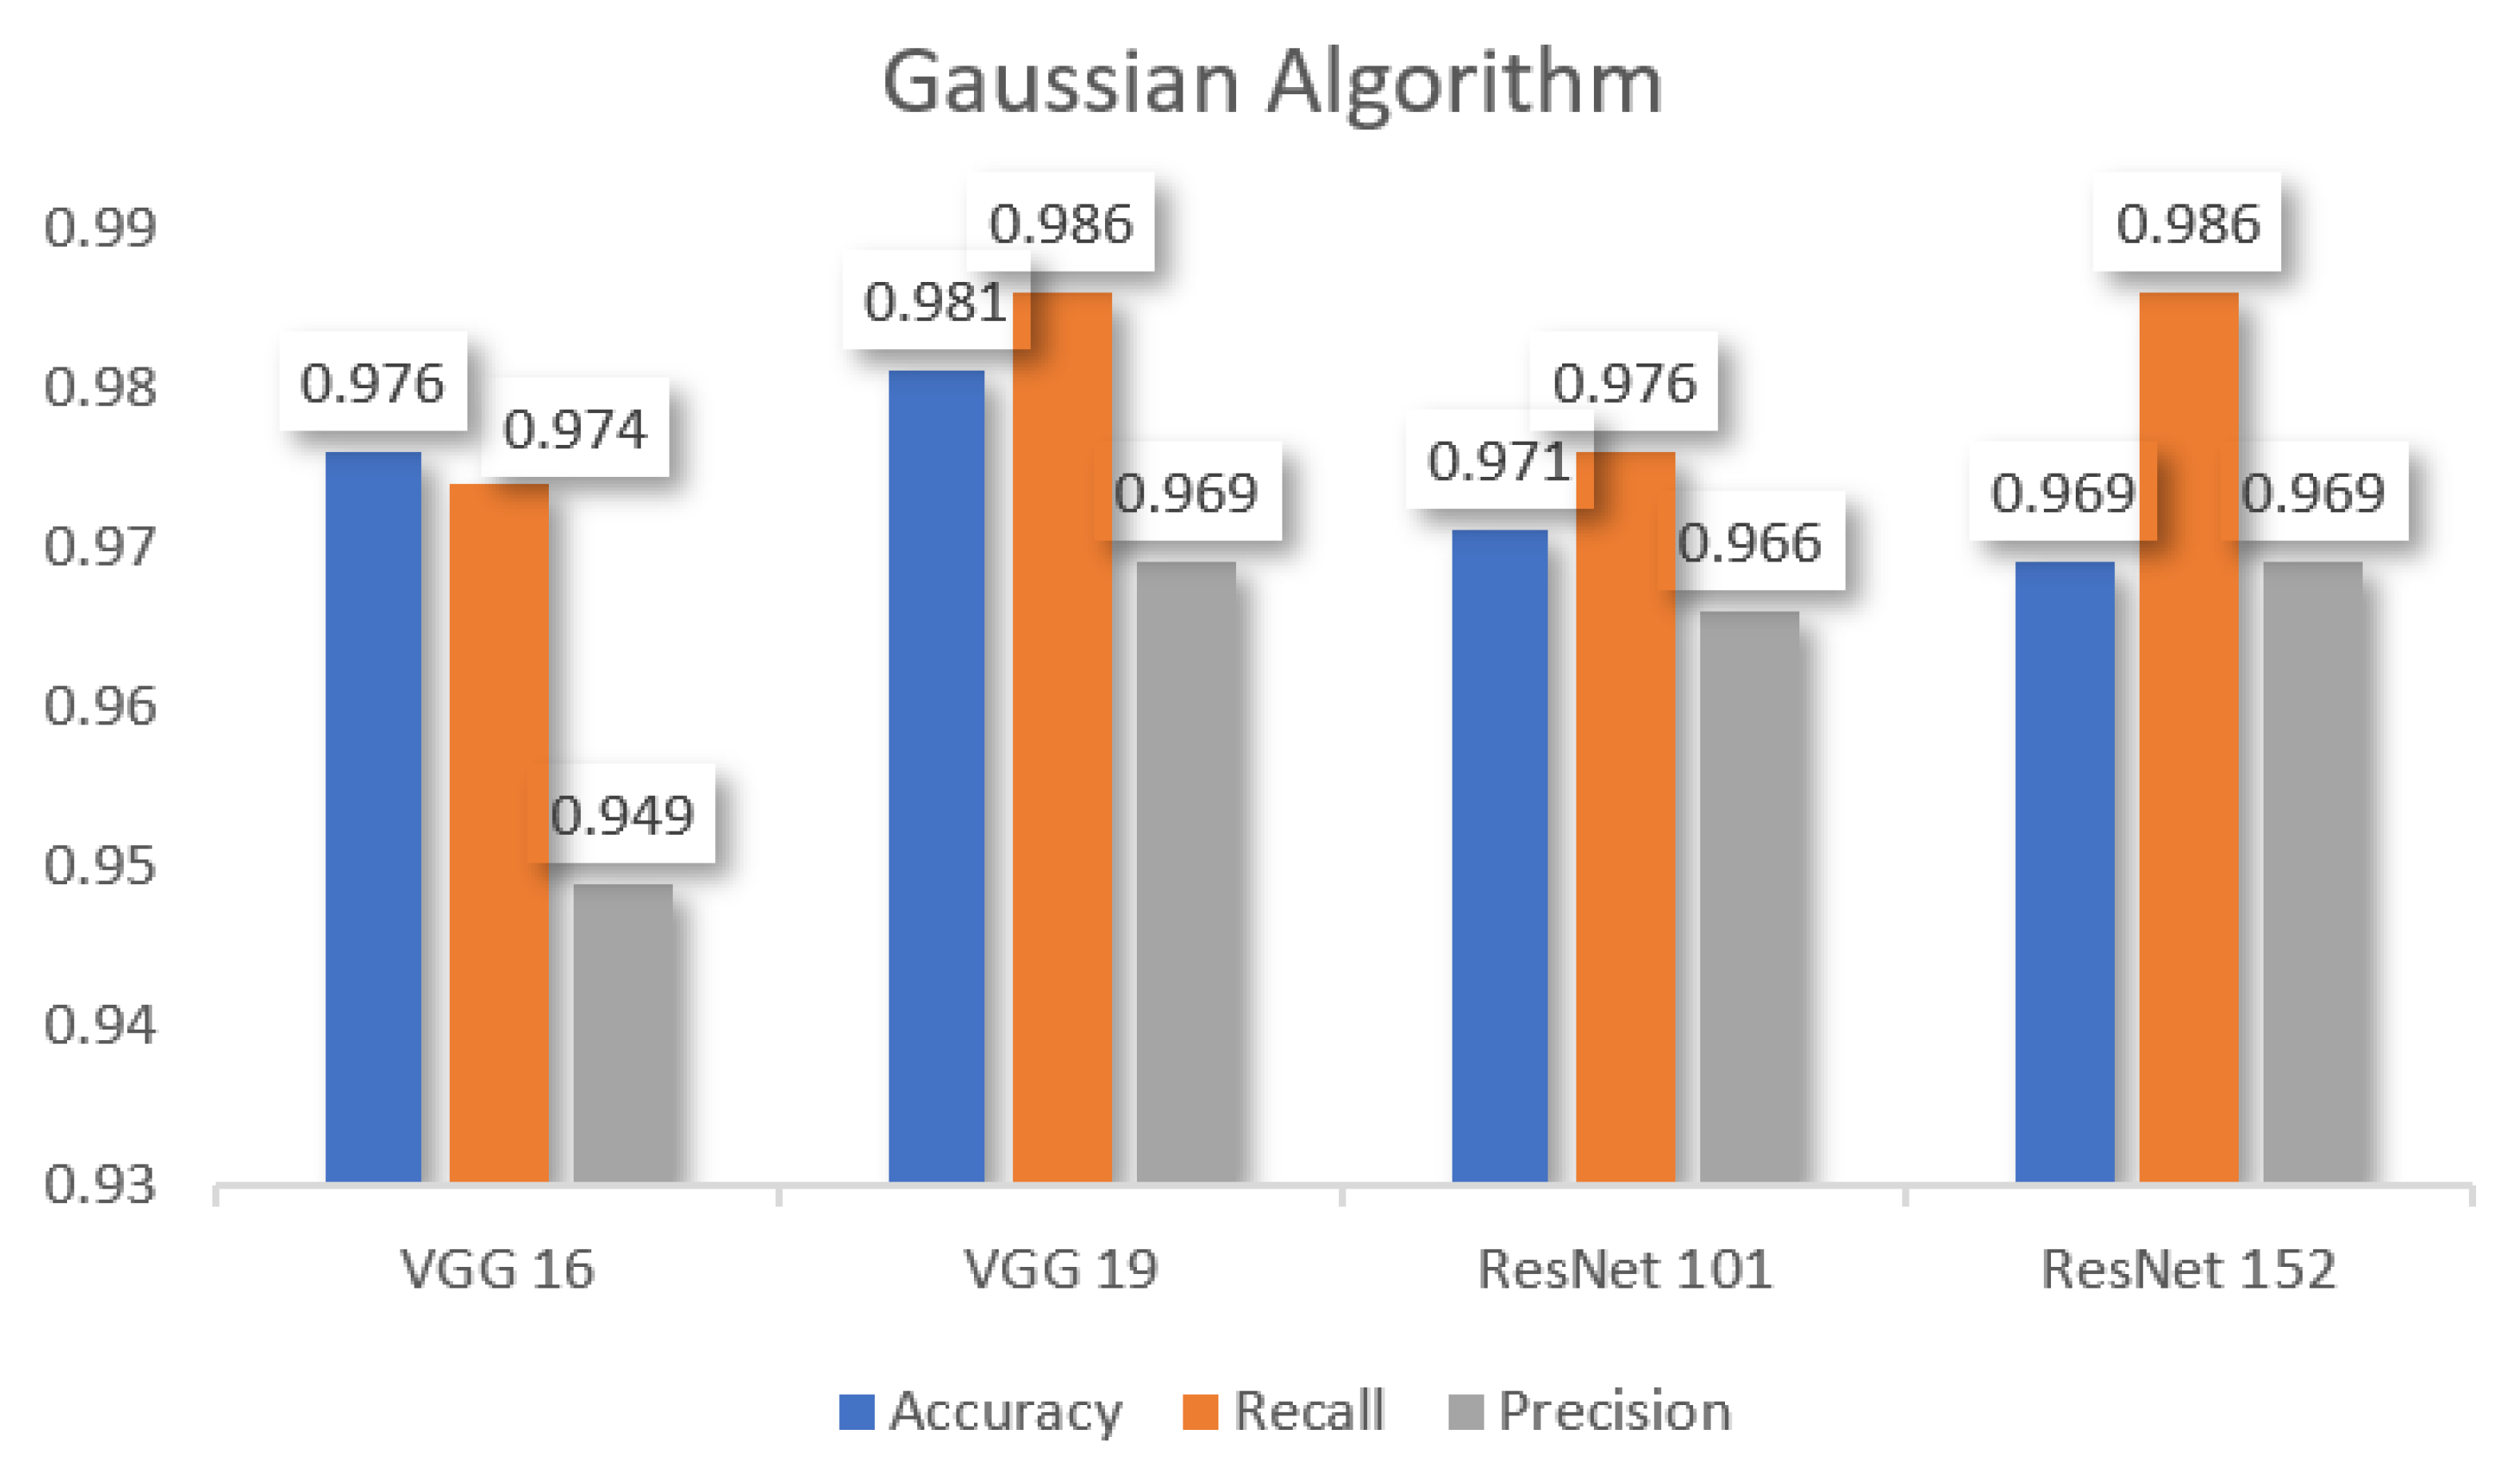
Table 3 shows the performance metrics which are used to compare other pre-trained models, such as VGG 16, VGG 19, ResNet 101, and ResNet 152 for the
Gaussian algorithm. According to the Gaussian algorithm,
VGG 19 performs better in
accuracy, recall, and precision.
Resnet 152 also performs better
recall and precision than others.
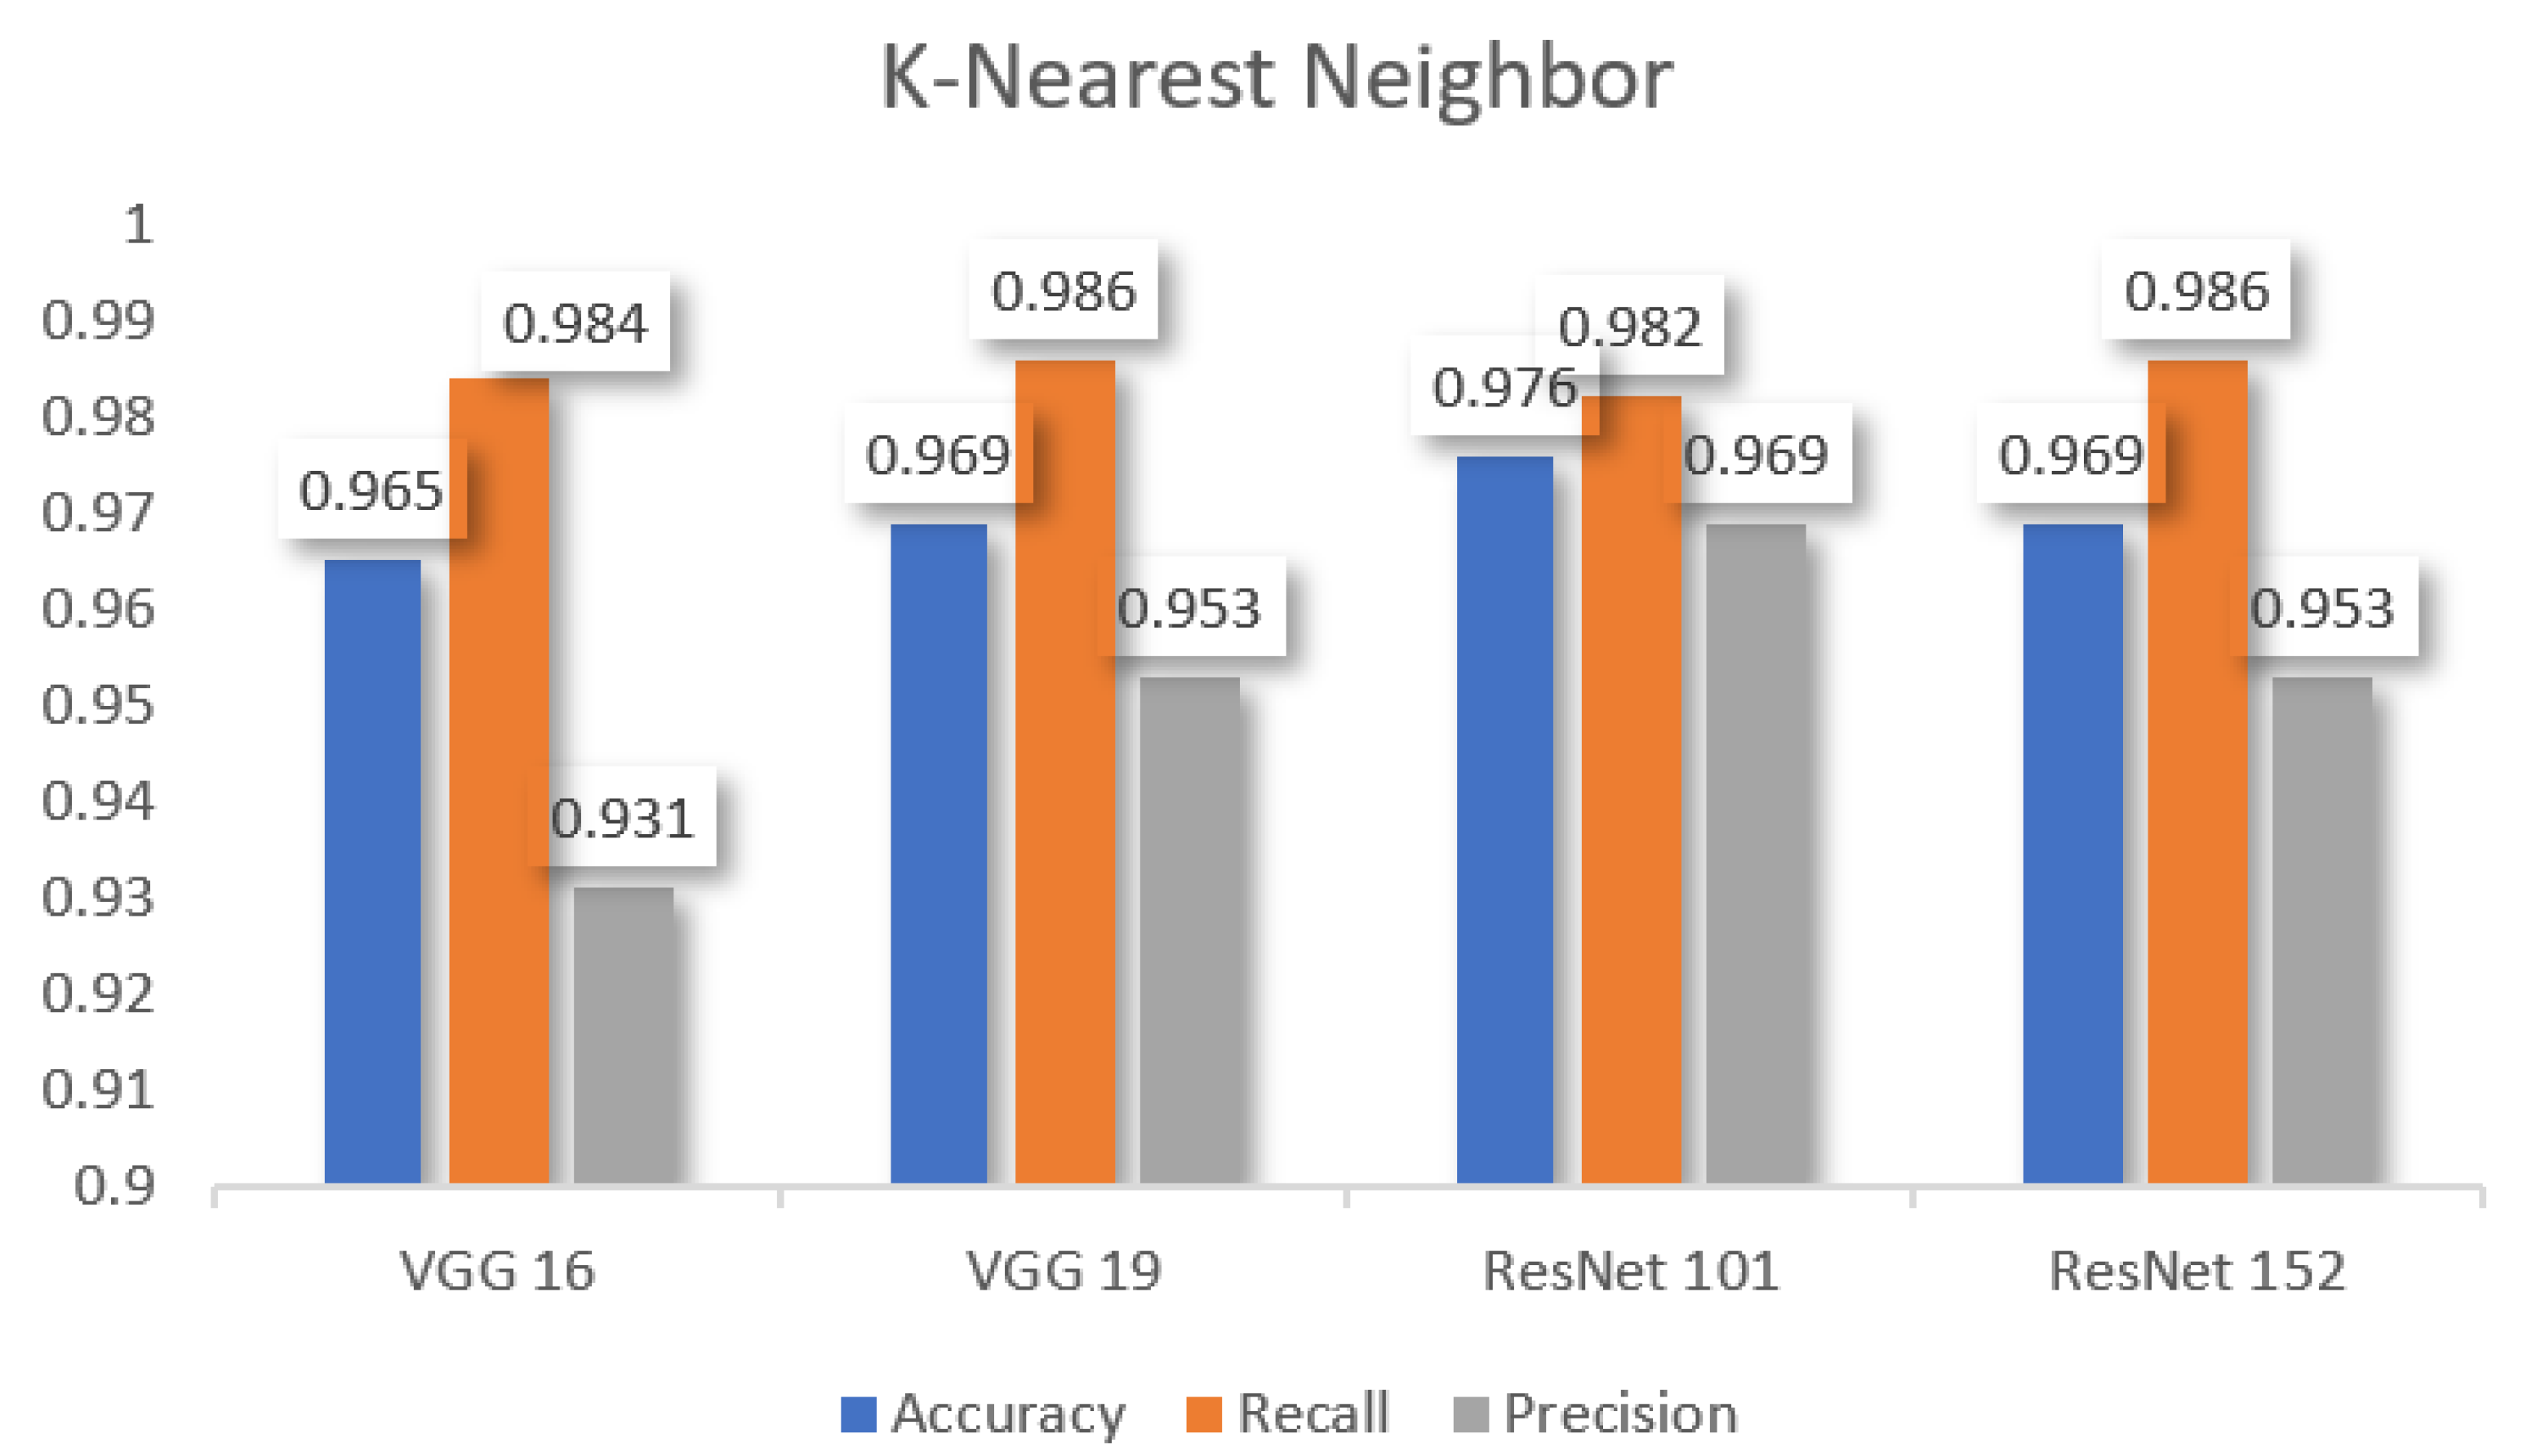
Table 4 demonstrates the performance metrics which are used to compare other pre-trained models, such as VGG 16, VGG 19, ResNet 101, and ResNet 152 to
k-nearest neighbor. As per the observation, ResNet 101 has better accuracy. Furthermore, ResNet 152 and VGG 19 performed better recall and ResNet 101 demonstrates better precision.
In
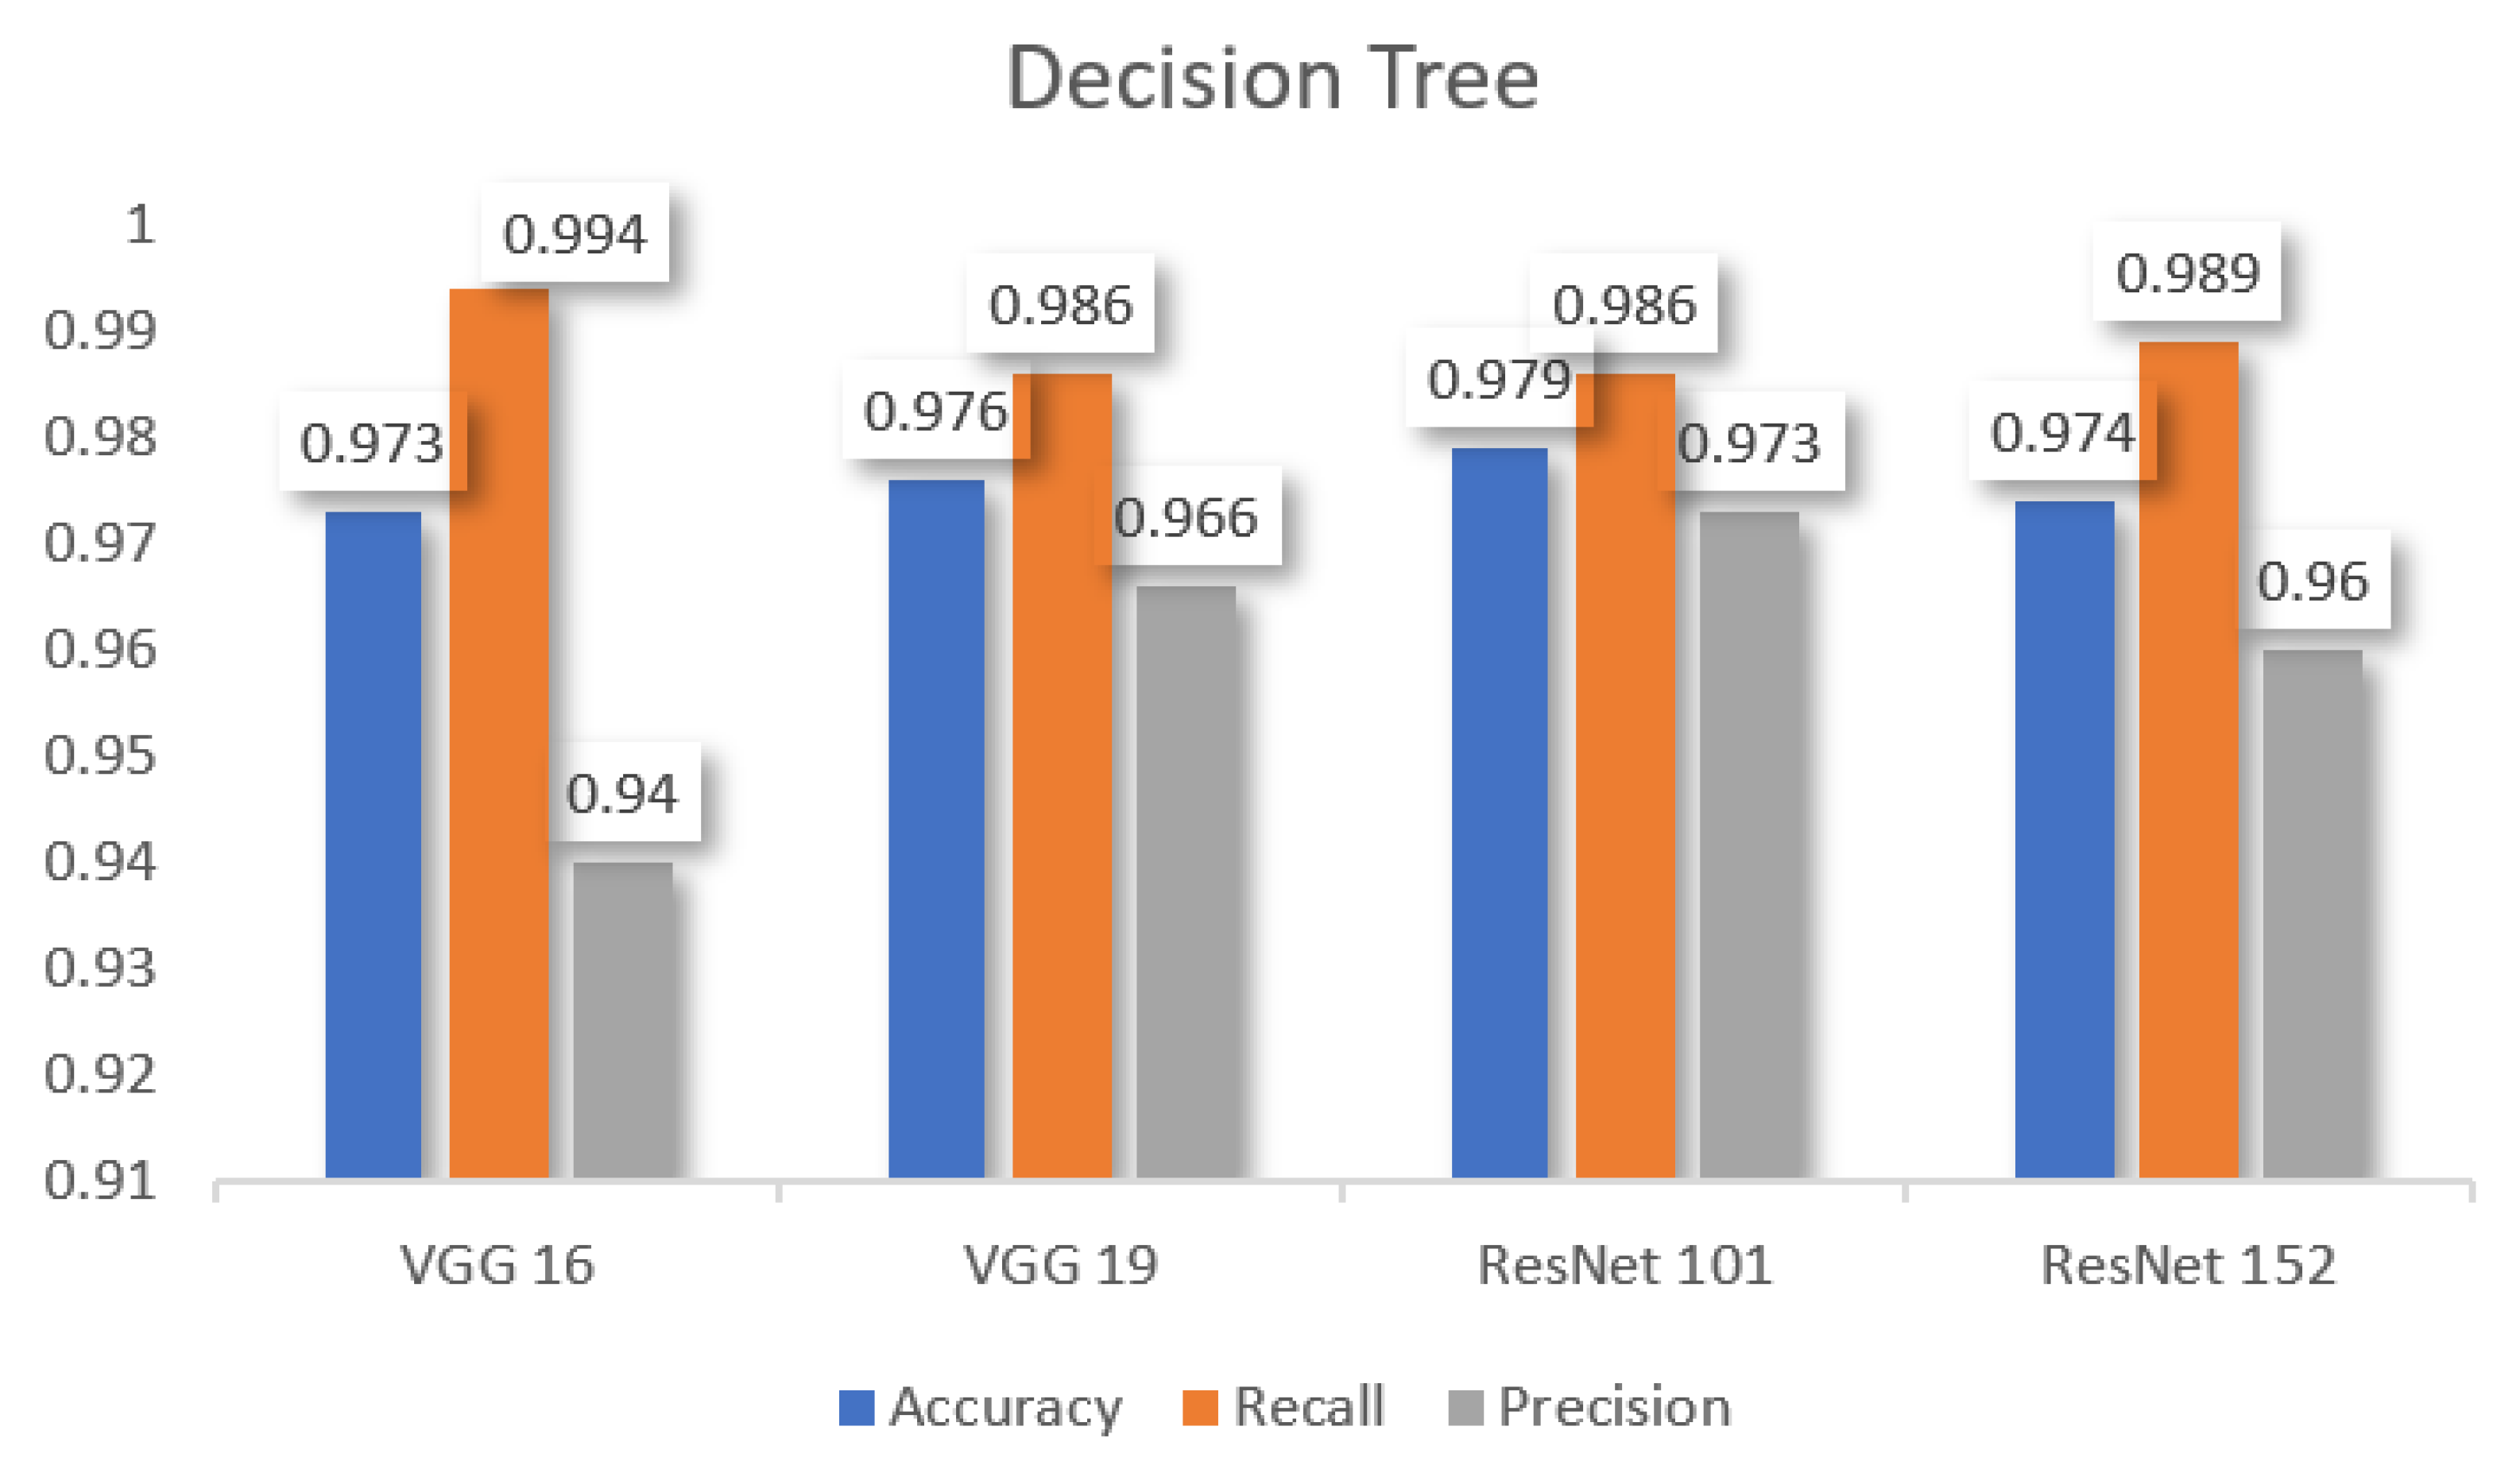
Table 5, we can observe that the decision tree has better accuracy in ResNet 101, better recall in VGG 16, and better precision in ResNet 101 among other pre-trained models.
In
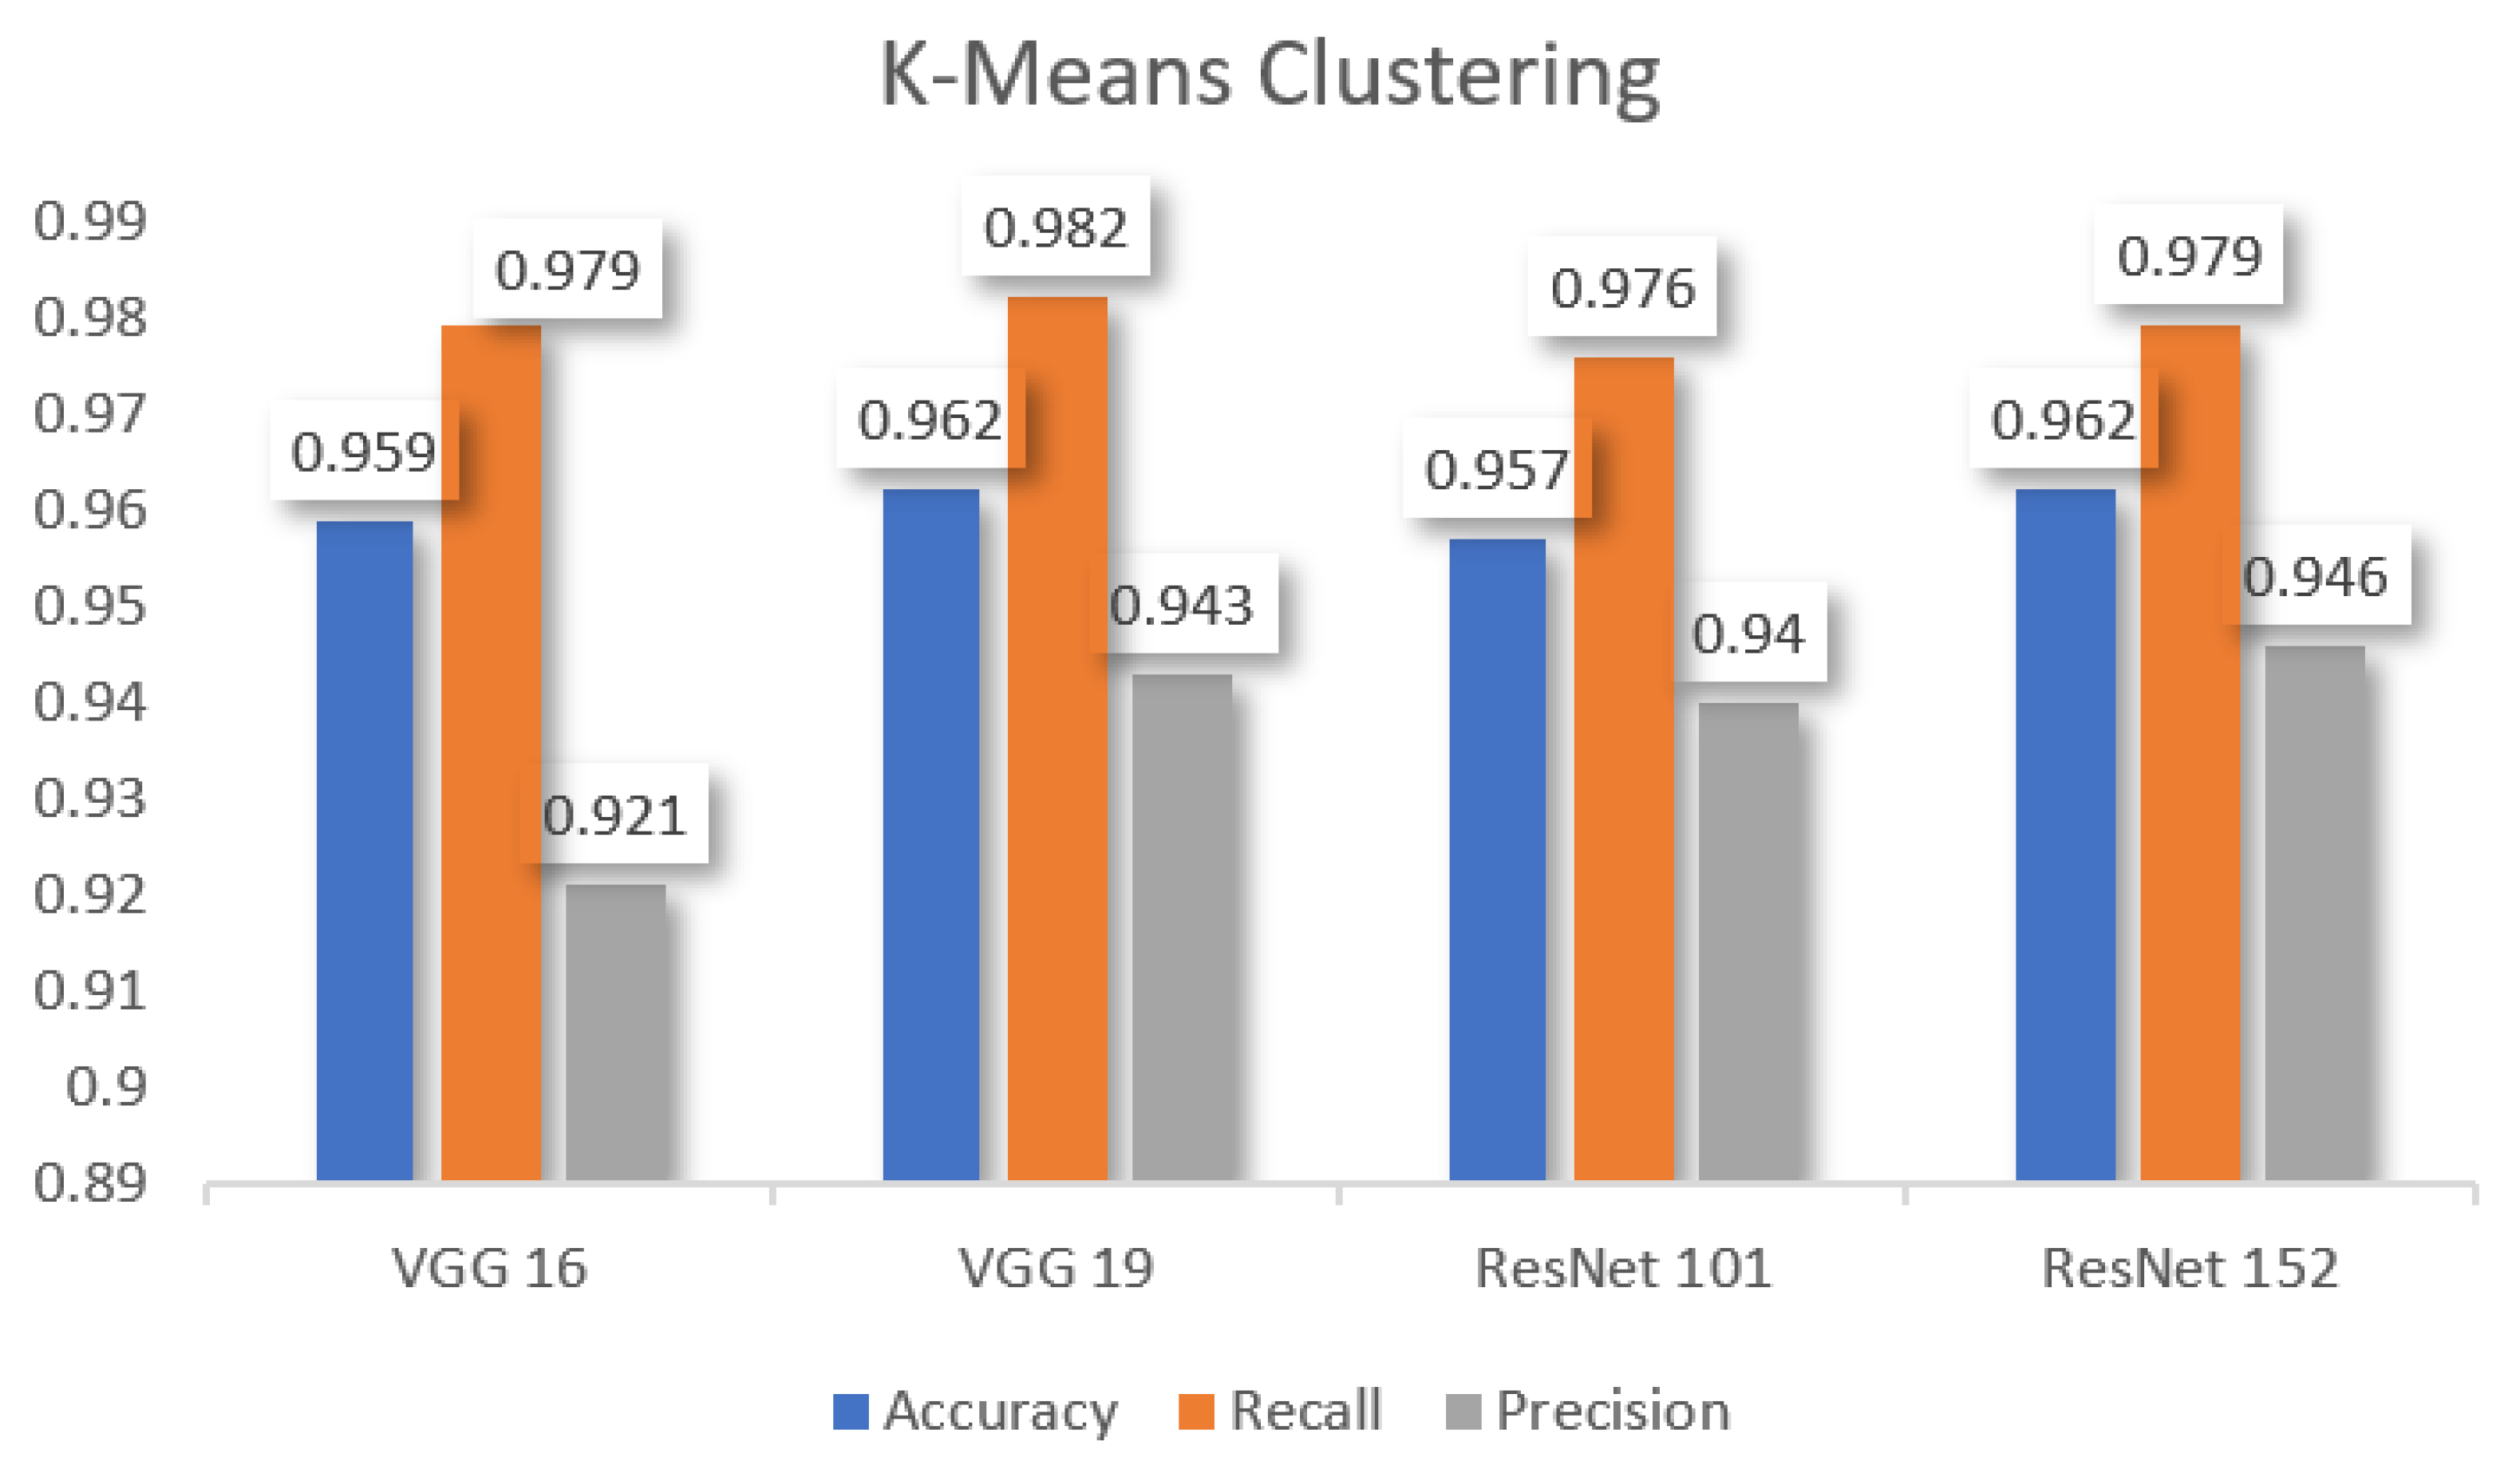
Table 6, the performance metrics among other pre-trained models were analyzed by comparing various pre-trained models concerning
k-means clustering. It showed that VGG 19 and ResNet 152 have better accuracy, VGG 19 has better recall, and Resnet 152 has better precision than other models.
5.2. Evaluation Metrics-2: Goodness of Fit Using (Chi-Square Test)
The evaluation indexes for the performance of the models were evaluated based on goodness of fit using the chi-square test. With 20% images as the testing set, the validation results of the proposed method are determined as follows:
The chi-square distributions are the group of distributions that take positive values alone and that are skewed to the right. The degrees of freedom (df) are used to specify the chi-square distribution. The chi-square table was used to evaluate the chi-square test by n rows and m columns with (n-1) (m-1) degrees of freedom (df). Then the p value will be calculated by area under the density curve of the chi-square distribution. The following Equation (24) is used to find out the chi-square value with the help of
Table 7.
H0. There is no significant relationship between the correctly predicted and wrongly predicted objects for accuracy improvement.
H1. There is a significant relationship between the correctly predicted and wrongly predicted objects for accuracy improvement.
The chi-square value is calculated by using Equation (24); chi-square = 555.86; p = 0.00001. From the result it could be observed that the significant level (p)value is less than 0.05; therefore a significant relationship is available between correctly predicted and wrongly predicted objects. Hence, the null hypothesis (H0) was rejected, and the alternative hypothesis (H1) was accepted.
Figure 12,
Figure 13,
Figure 14,
Figure 15 and
Figure 16 show the visual representation of the comparative analysis of the performance metrics among pre-trained models concerning various machine learning algorithms, such as logistic regression, Gaussian algorithm, k-nearest neighbor, decision tree, and k-means clustering.
From the above
Figure 12,
Figure 13,
Figure 14,
Figure 15 and
Figure 16, we can understand that various machine learning algorithms compare with pre-trained models by the proposed method. Finally, we found that logistics regression performs better with ResNet 152 and VGG 19 than other machine learning algorithms, compared with other pre-trained models.
6. Conclusions
The research work proposed GradCAM-MLRCNN to localize and detect the objects accurately by using some pre-trained models (VGG 16, VGG 19, ResNet 101, and ResNet 152) as backbone networks along with machine learning algorithms, such as decision tree, Gaussian algorithm, k-means clustering, k-nearest neighbor, and logistic regression, and it combined two methodologies, namely Grad-CM++ for localizing the objects by producing the heat map and Mask R-CNN for detecting objects. The main contribution of this method is that even though Mask R-CNN failed to predict objects in an image, the machine learning algorithm cum Grad-CAM++ will help to predict objects in an image perfectly and accurately.
The experimental results showed that logistics regression for ResNet 152 and VGG 19 proved to have a good performance with an accuracy rate of 98.4%, recall rate of 99.6%, and precision rate of 97.3%. This work can be extended by including decision-based rules using deep networks in fields such as video applications, reinforcement learning, and natural language processing.


 ,
, 


