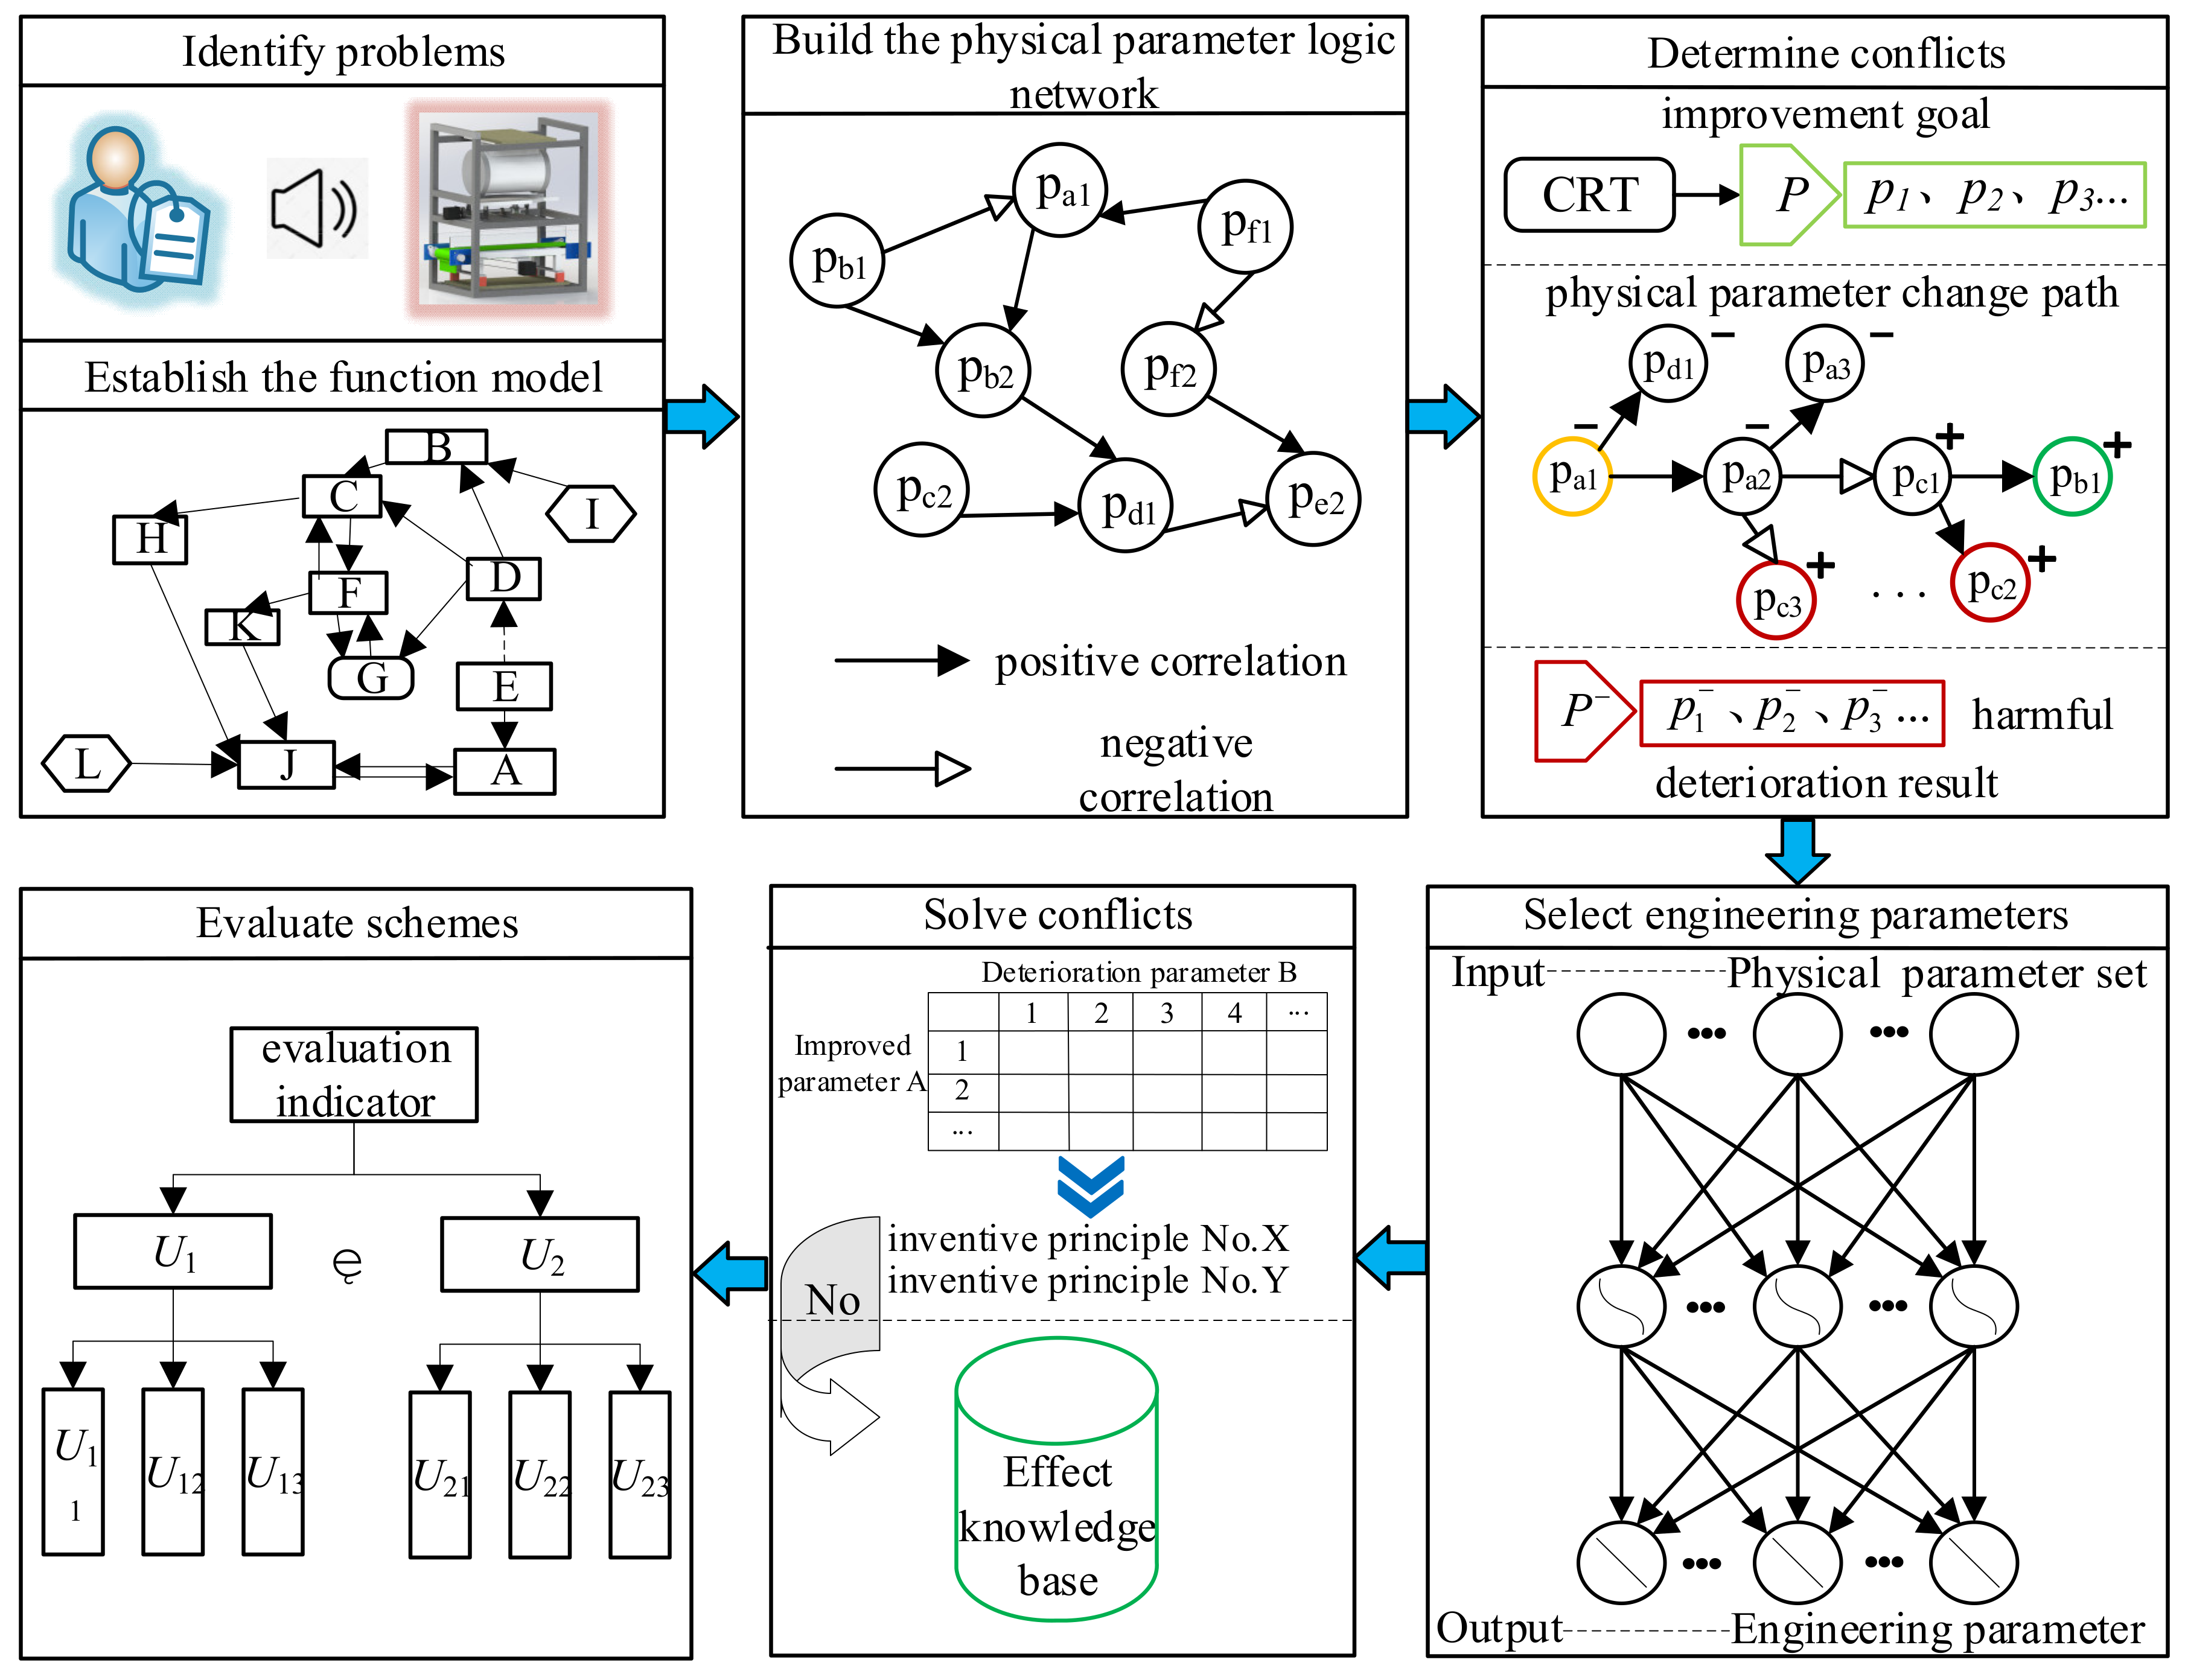
4.2. Case Design Process
Taking the existing bulk TCM dispenser as an example, according to the process shown in
Figure 8, this paper explains how to apply the proposed conflict solving process from the following six steps.
Step 1: Determining the problem of the bulk TCM dispenser and building its function model.
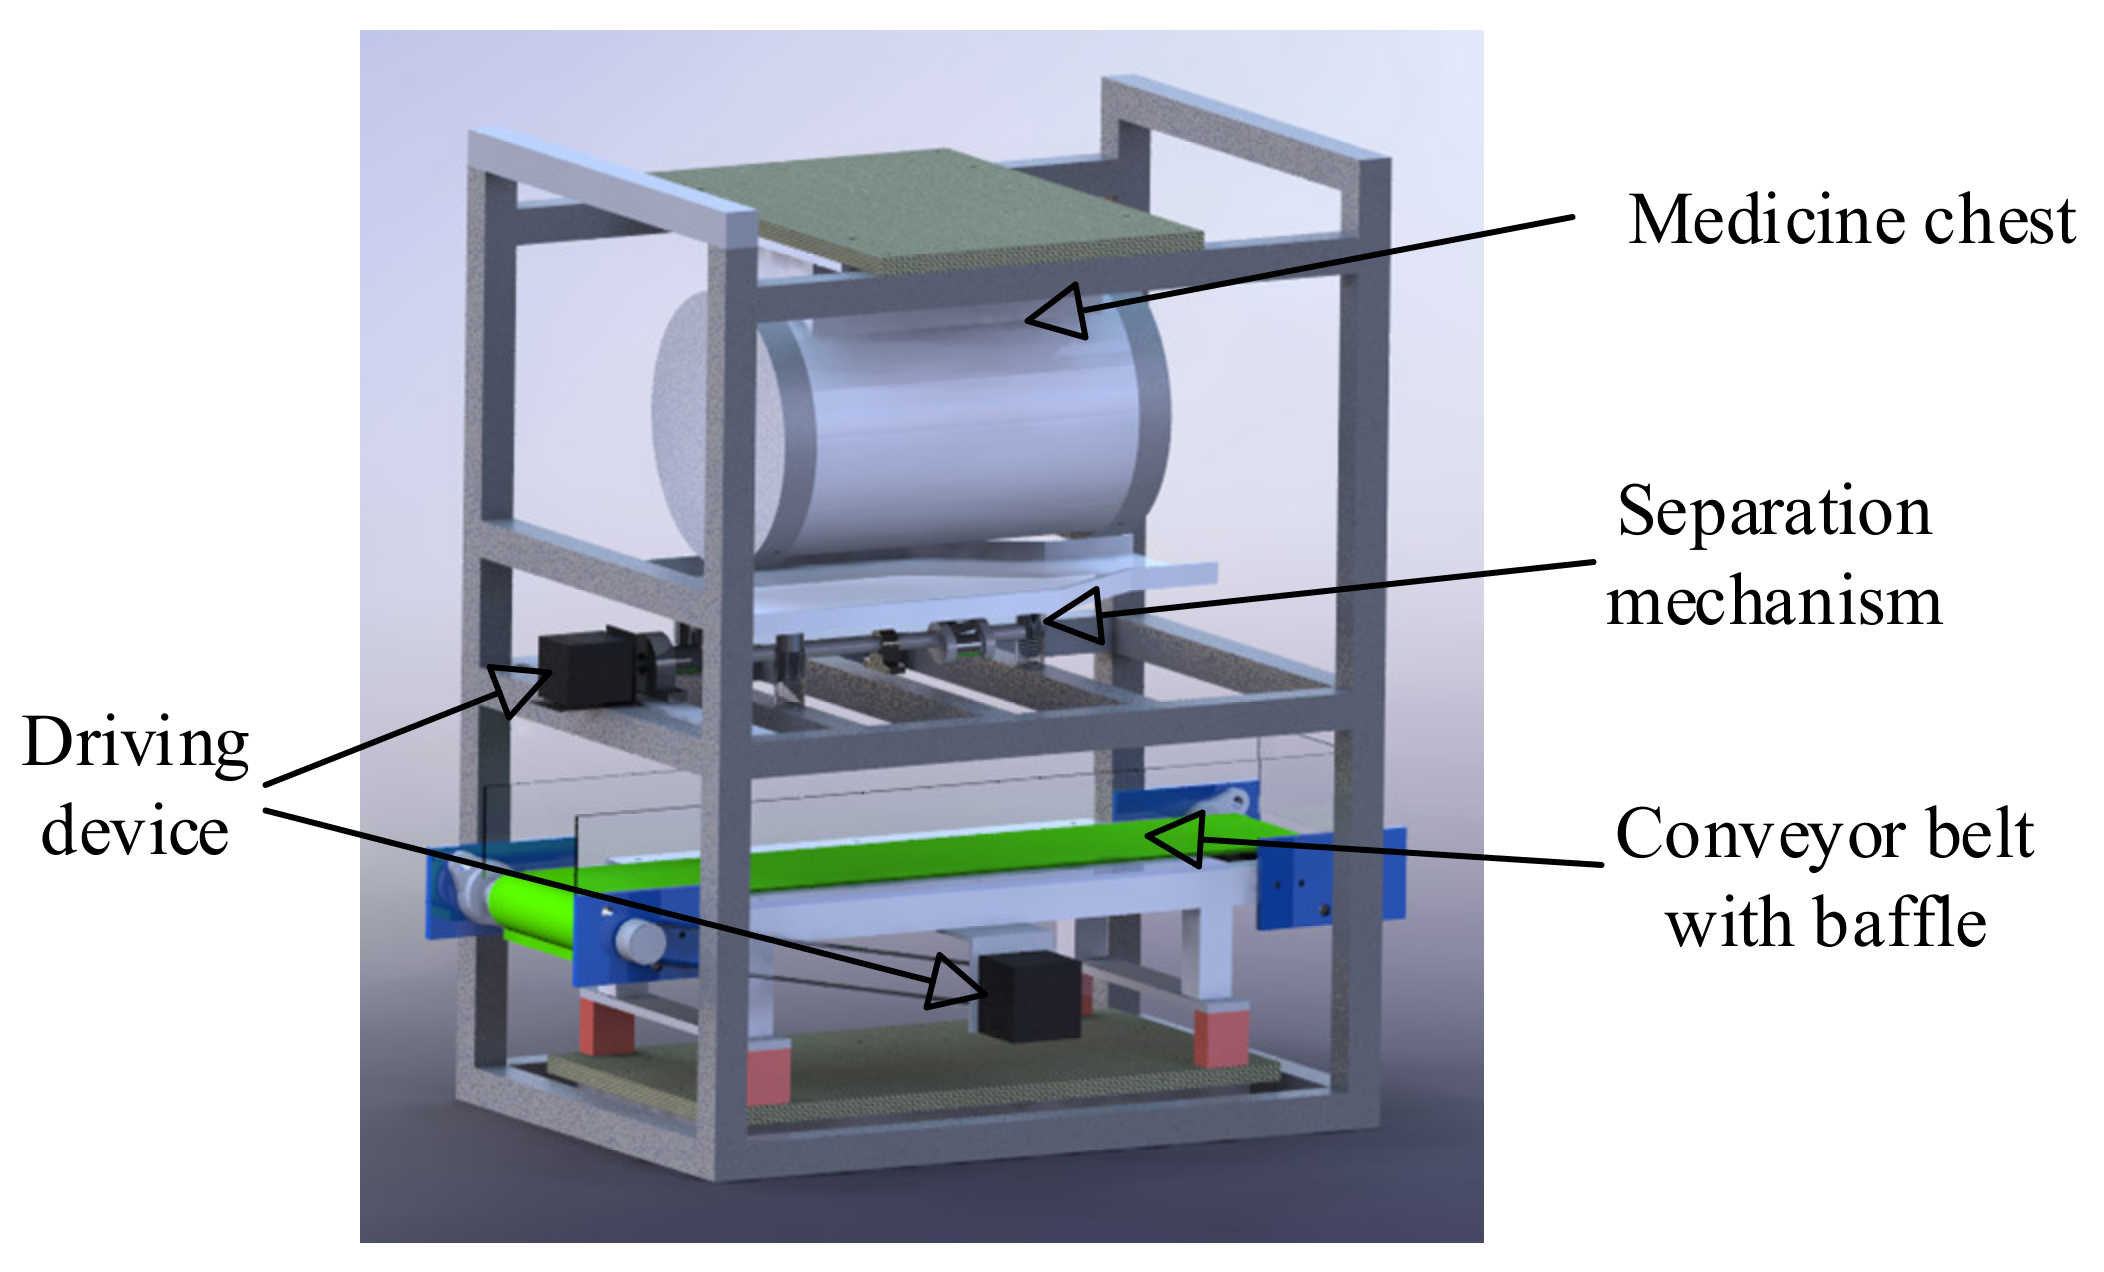
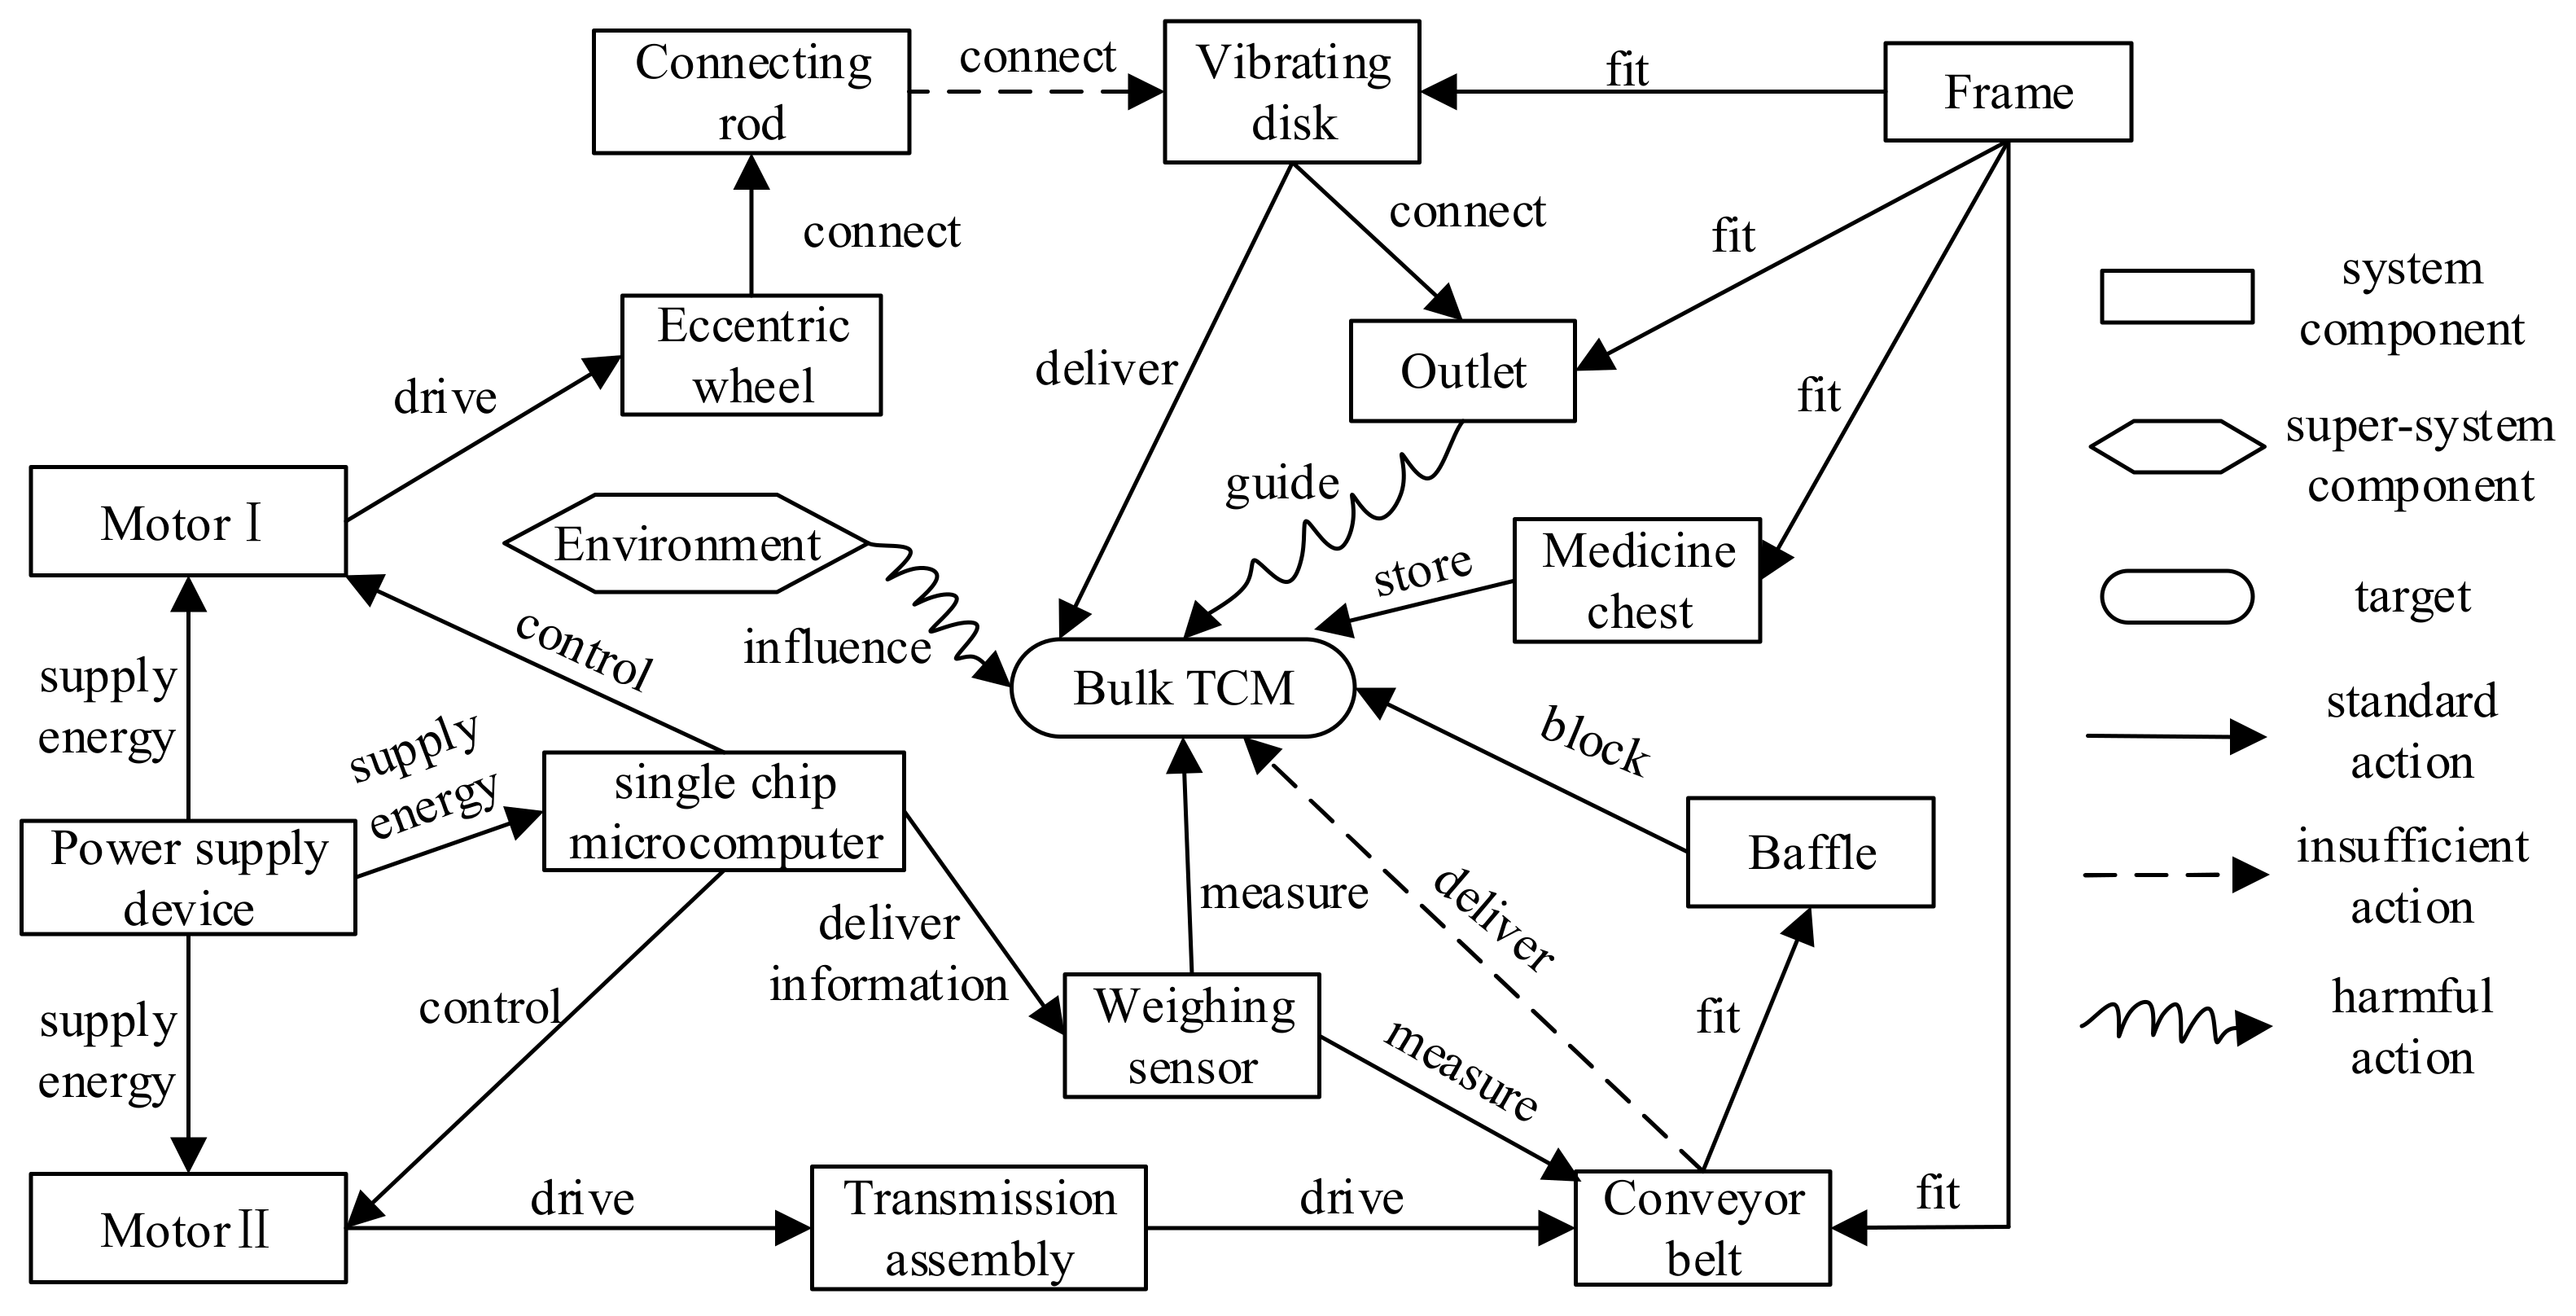
After market research and user feedback, it is found that the existing bulk TCM dispenser has the following problems: “Unable to dispense TCM continuously” and “TCM accumulation at outlet”. Through the function analysis of the bulk TCM dispenser, its function model is established, as shown in
Figure 14.
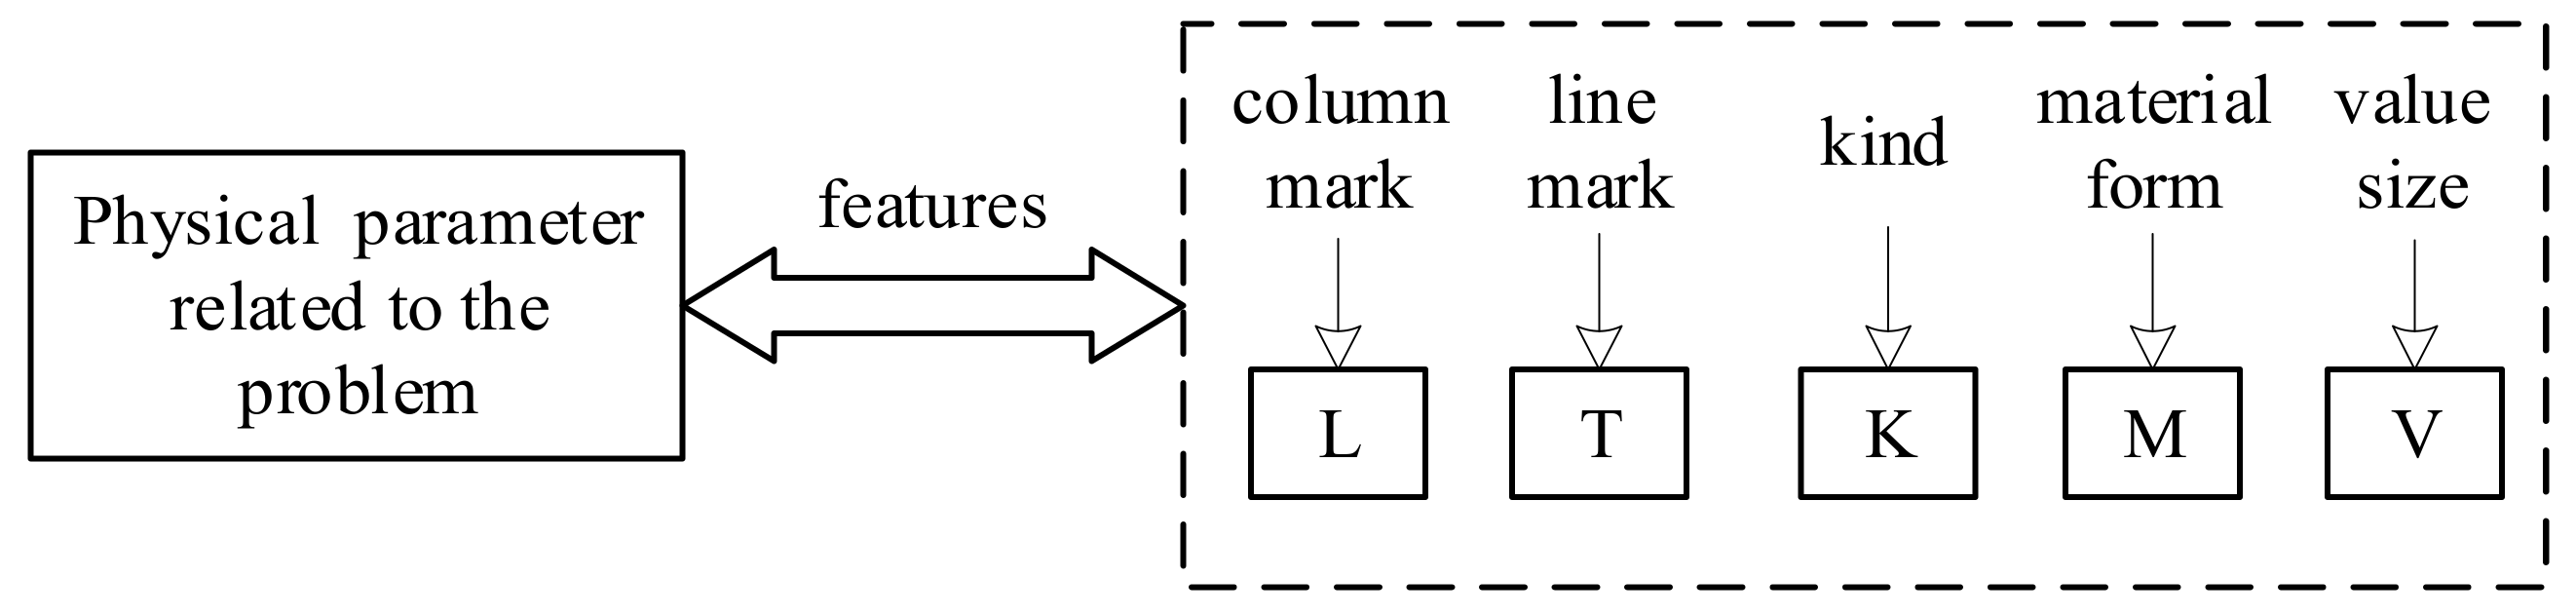
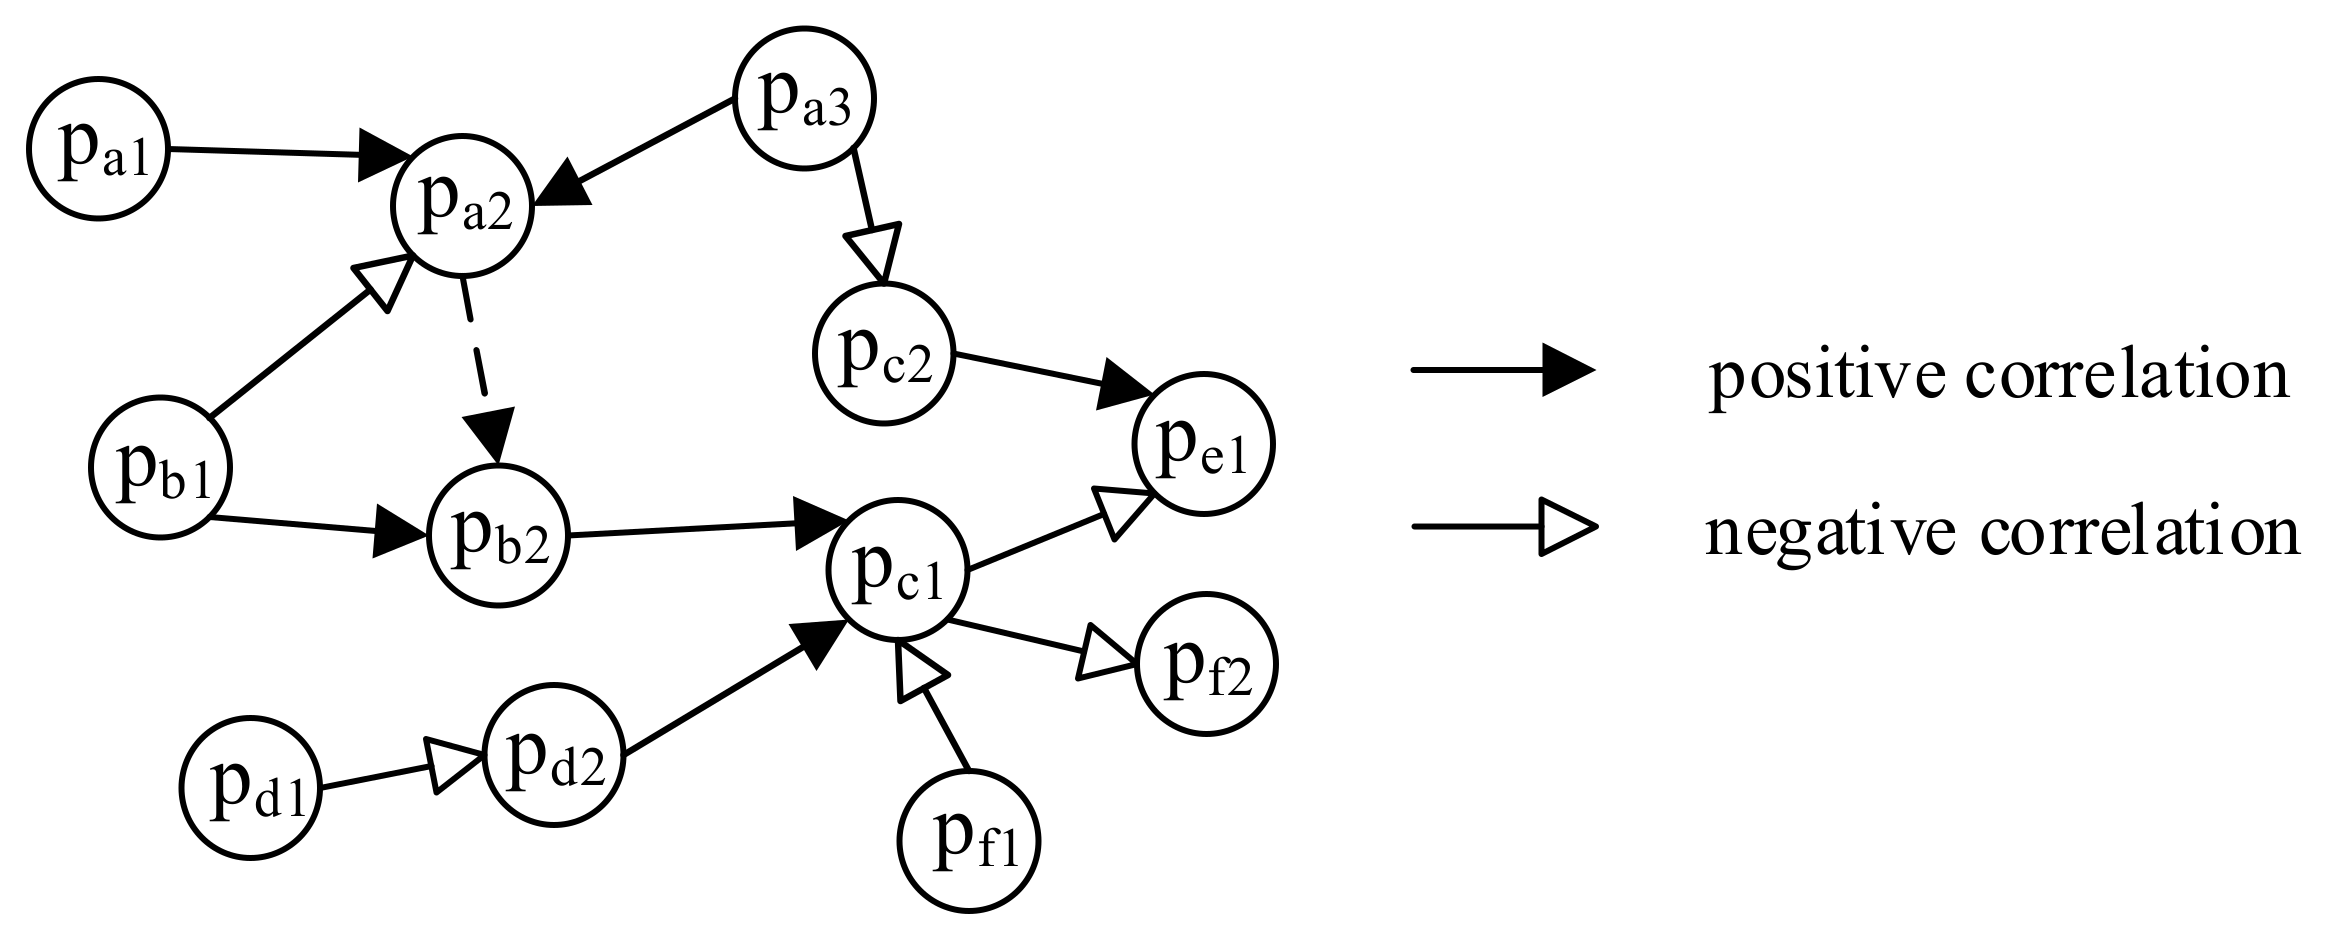
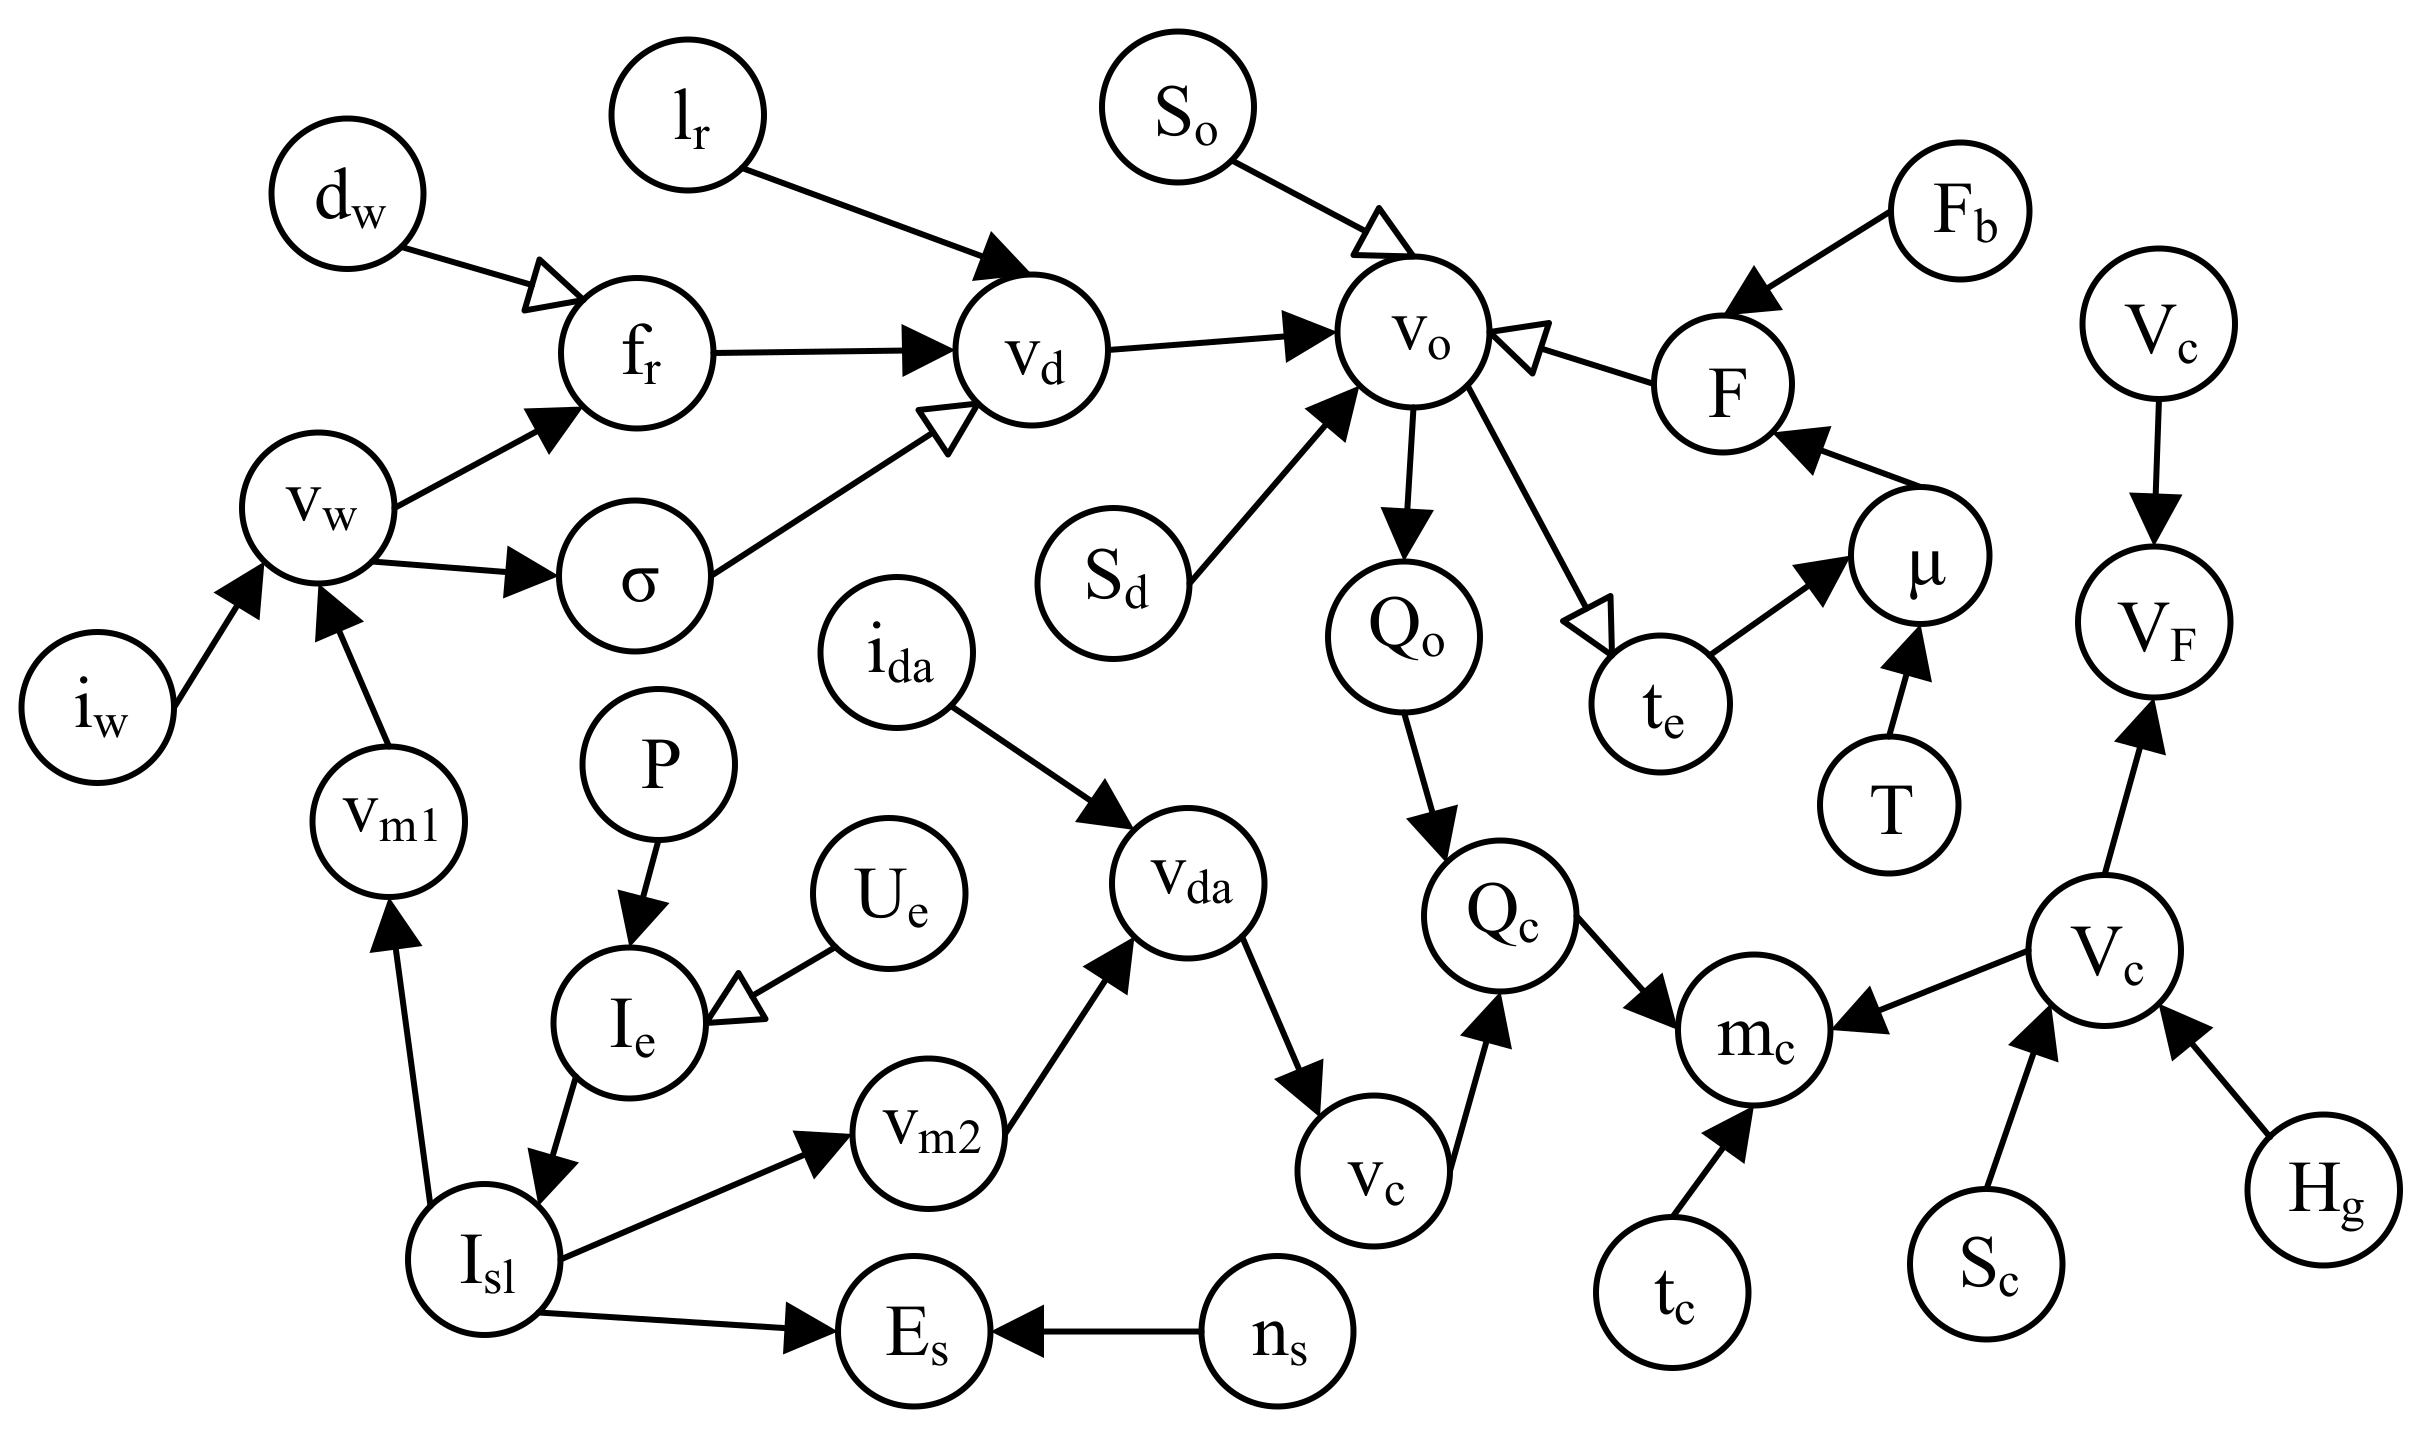
Step 2: Constructing the physical parameter logic network of the bulk TCM dispenser.
Firstly, the components in the function model are divided according to the integrity law, and the corresponding physical parameters, which are represented by symbols, are extracted according to the different types of components, as shown in
Table 6. Then, the extracted parameters are analyzed by dimensional analysis, and the dimensionless expressions
of relevant physical parameters are obtained, as shown in
Table 7. Some relatively simple dimensionless expressions are not listed in the table. Finally, according to the mathematical model displayed by the
expressions and the action relationship between components, the physical parameters are connected to generate a physical parameter logic network of the bulk TCM dispenser, as shown in
Figure 15.
Step 3: Determining the conflict of the bulk TCM dispenser.
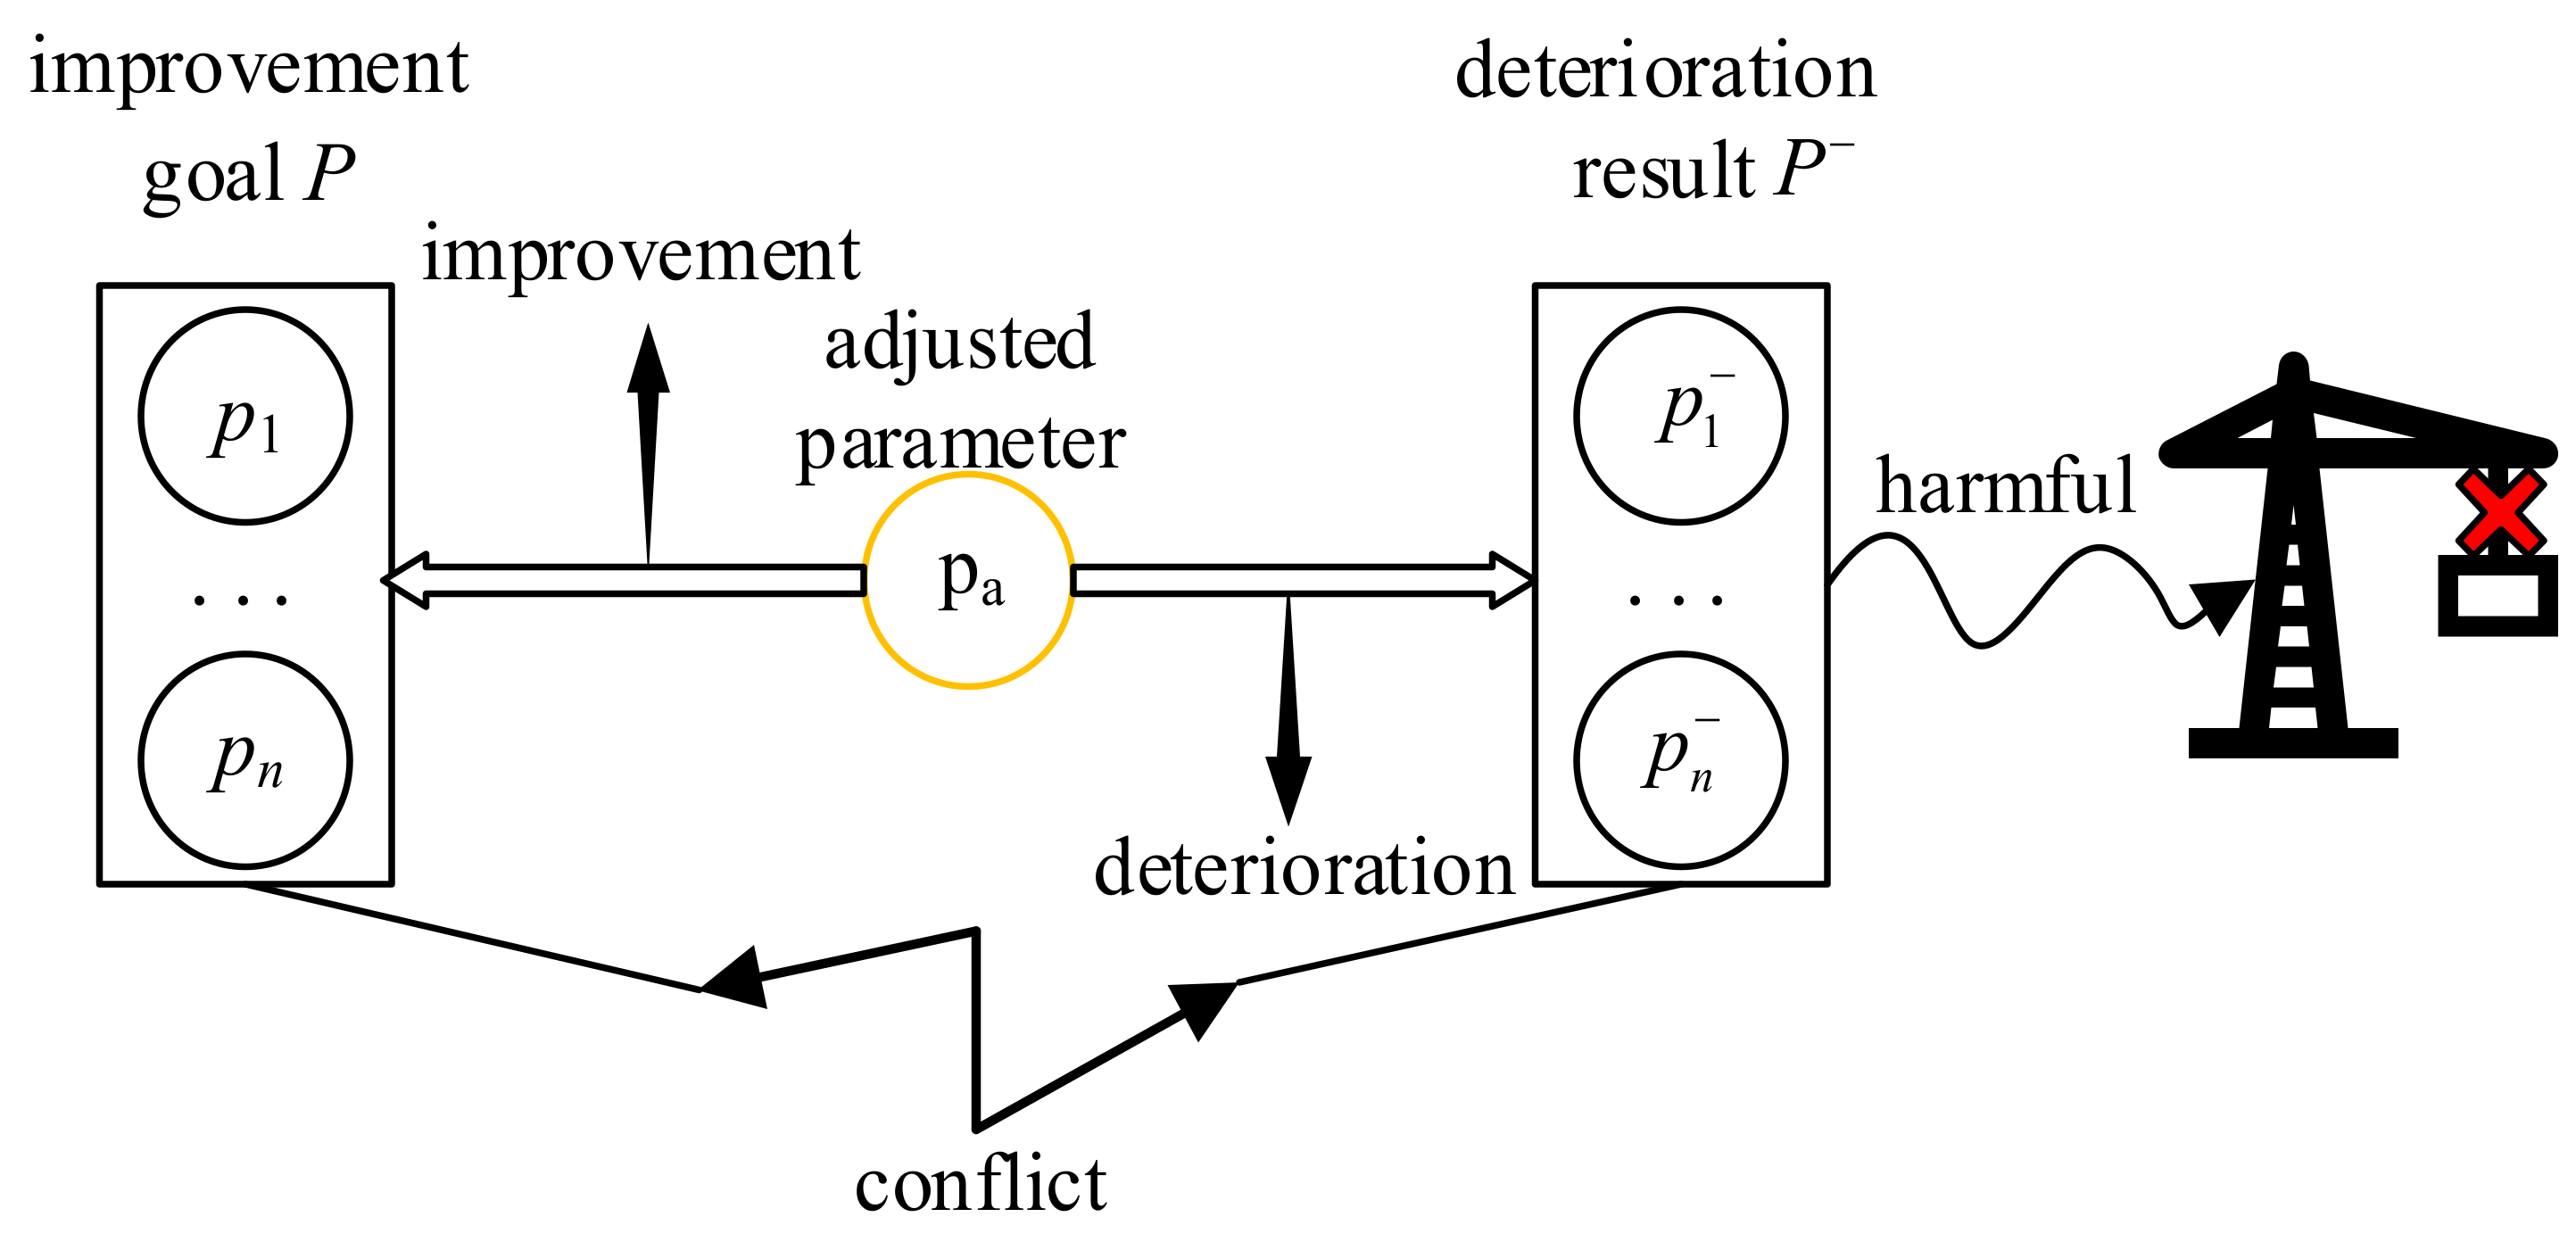
After constructing the physical parameter logic network of the bulk TCM dispenser, the corresponding conflicts are determined from the problems (“Unable to dispense TCM continuously” and “TCM accumulation at outlet”).
- (1)
Conflict determination process of “Unable to dispense TCM continuously”.
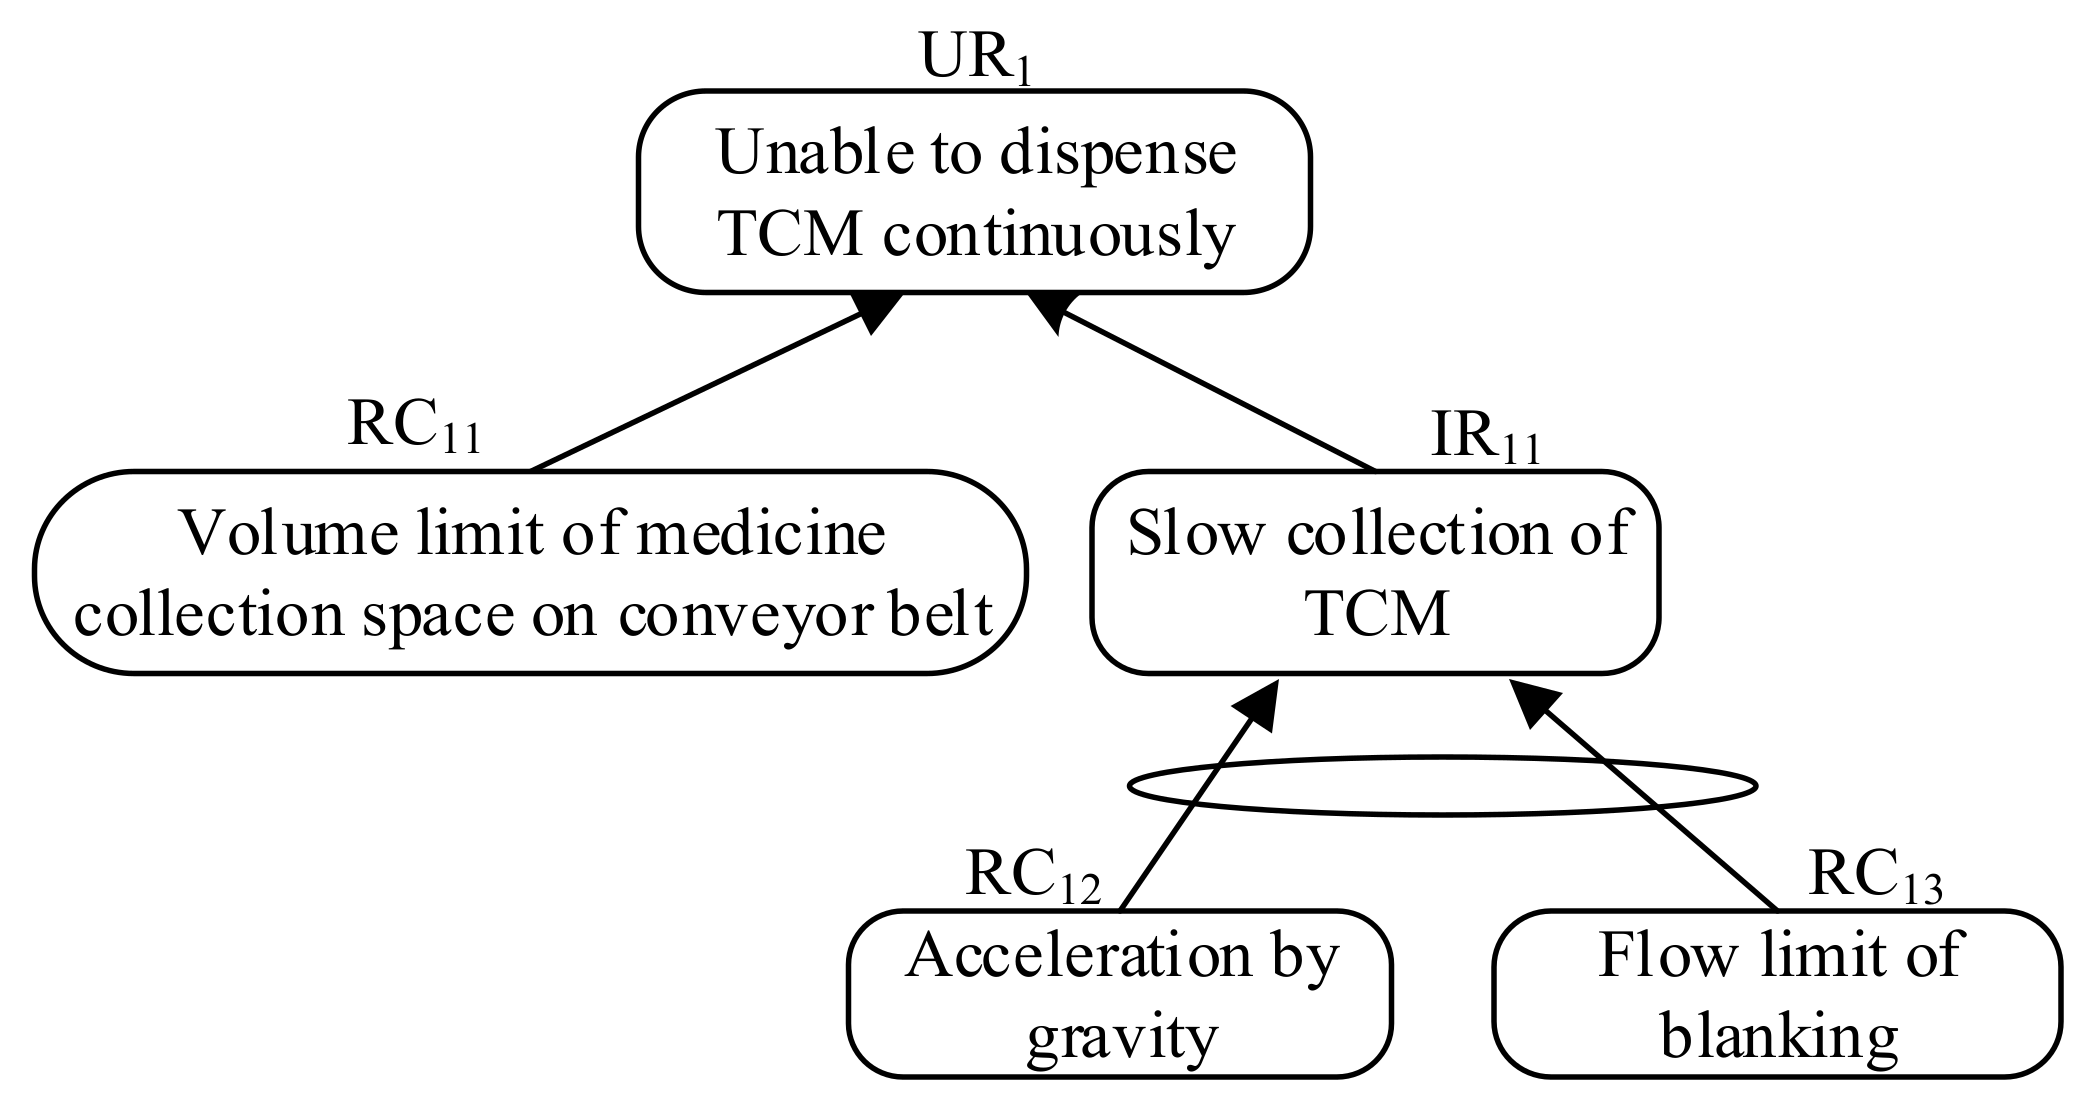
First, the CRT model of “Unable to dispense TCM continuously” is constructed, as shown in
Figure 16.
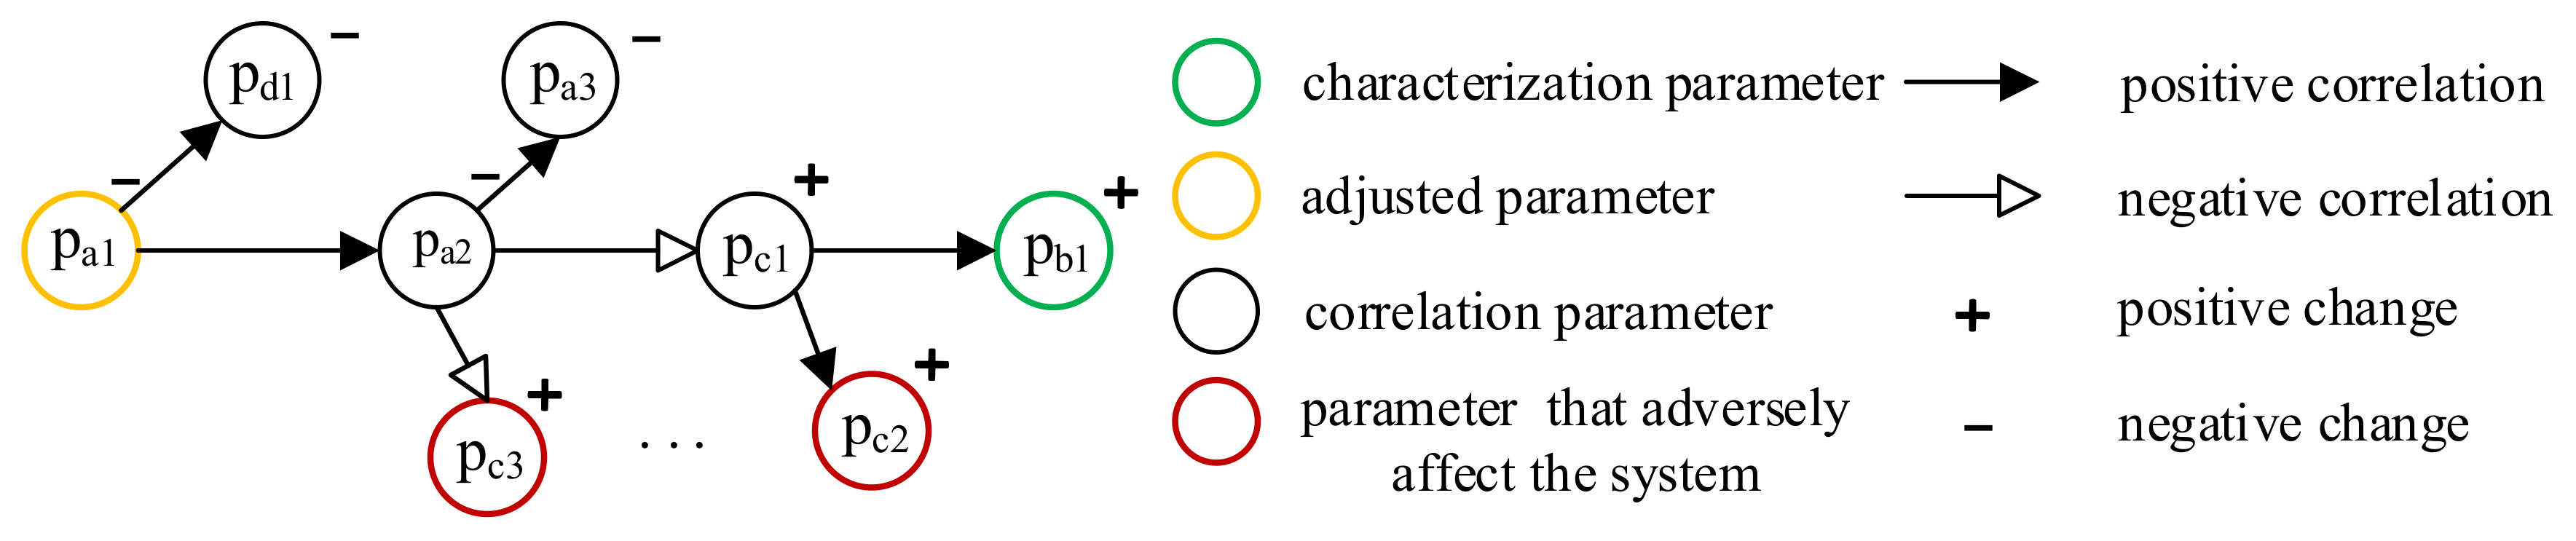
According to the logic “and” relationship, the extracted root causes related to the problem are {RC11} and {RC12, RC13}, which correspond to “Volume limit of medicine collection space on conveyor belt” and “Acceleration by gravity, Flow limit of blanking”, respectively, where the medicine collecting space is the space formed by the conveyor belt and baffle for collecting TCM.
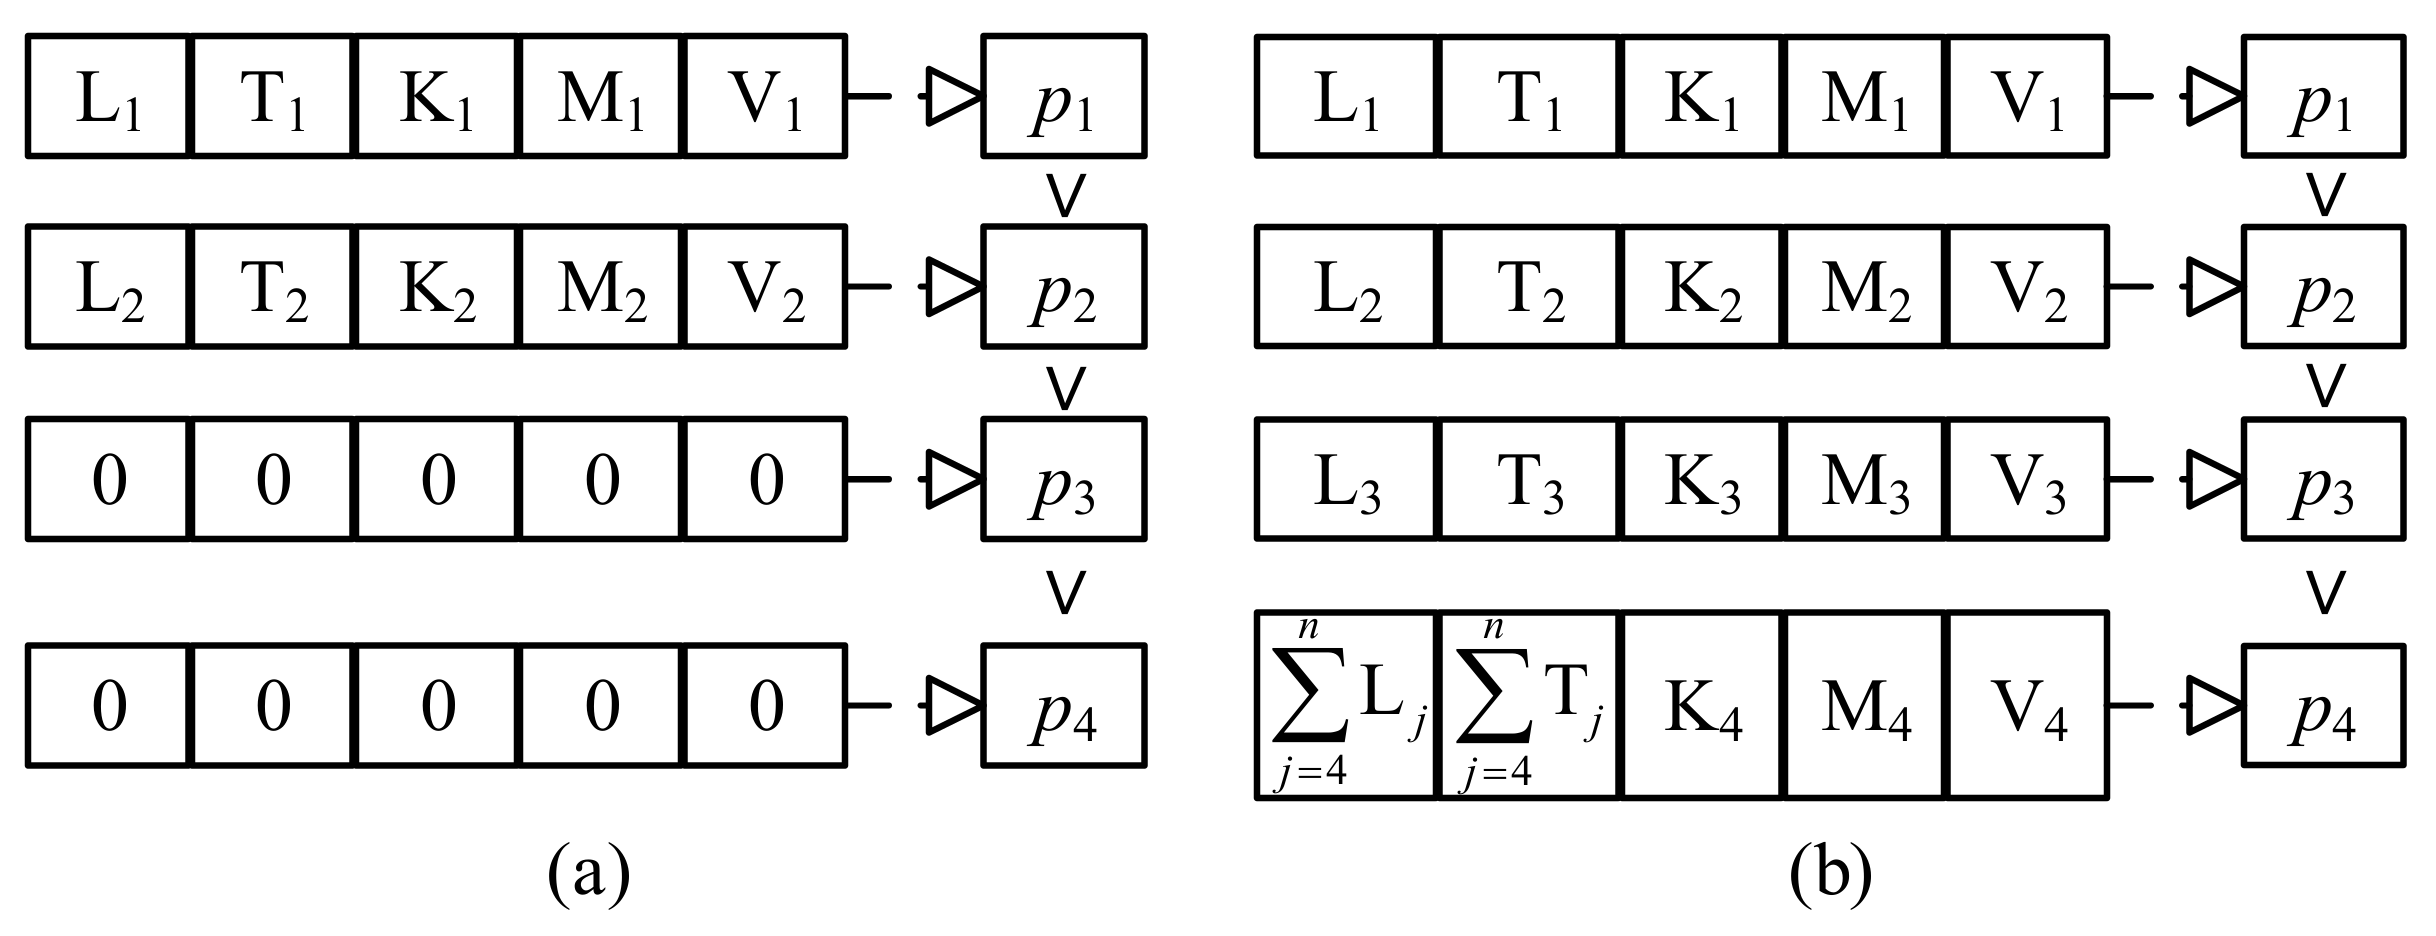
Then, Python is used to extract the physical parameters corresponding to {RC
11} and {RC
12, RC
13}, which are “Volume” and “Gravity, Acceleration, Mass flow”, respectively, as shown in
Table 8. By sorting the physical parameters of each group in
Table 8 according to the influence degree on the problem, it can be obtained that the physical parameter sets related to “Unable to dispense TCM continuously” are
and
.
and
are the problem’s improvement goals.
To achieve the purpose of continuous dispensing, on the one hand, is to improve the dispensing speed, but the accuracy of the TCM weight cannot be guaranteed. Decreased accuracy will make TCM review time longer, which is detrimental to continuous dispensing. At the same time, if the speed is too fast, it will inevitably lead to the splashing of granular TCM, resulting in waste. On the other hand, making multiple copies of TCM temporarily stored on the conveyor belt increases the volume of the medicine collection space, which can improve “Unable to dispense TCM continuously” caused by
and
; hence, it is used as the characteristic parameter of the problem. Its improvement direction is to become larger. Then, the related physical parameter change path in the physical parameter logical network is determined, as shown in
Figure 17.
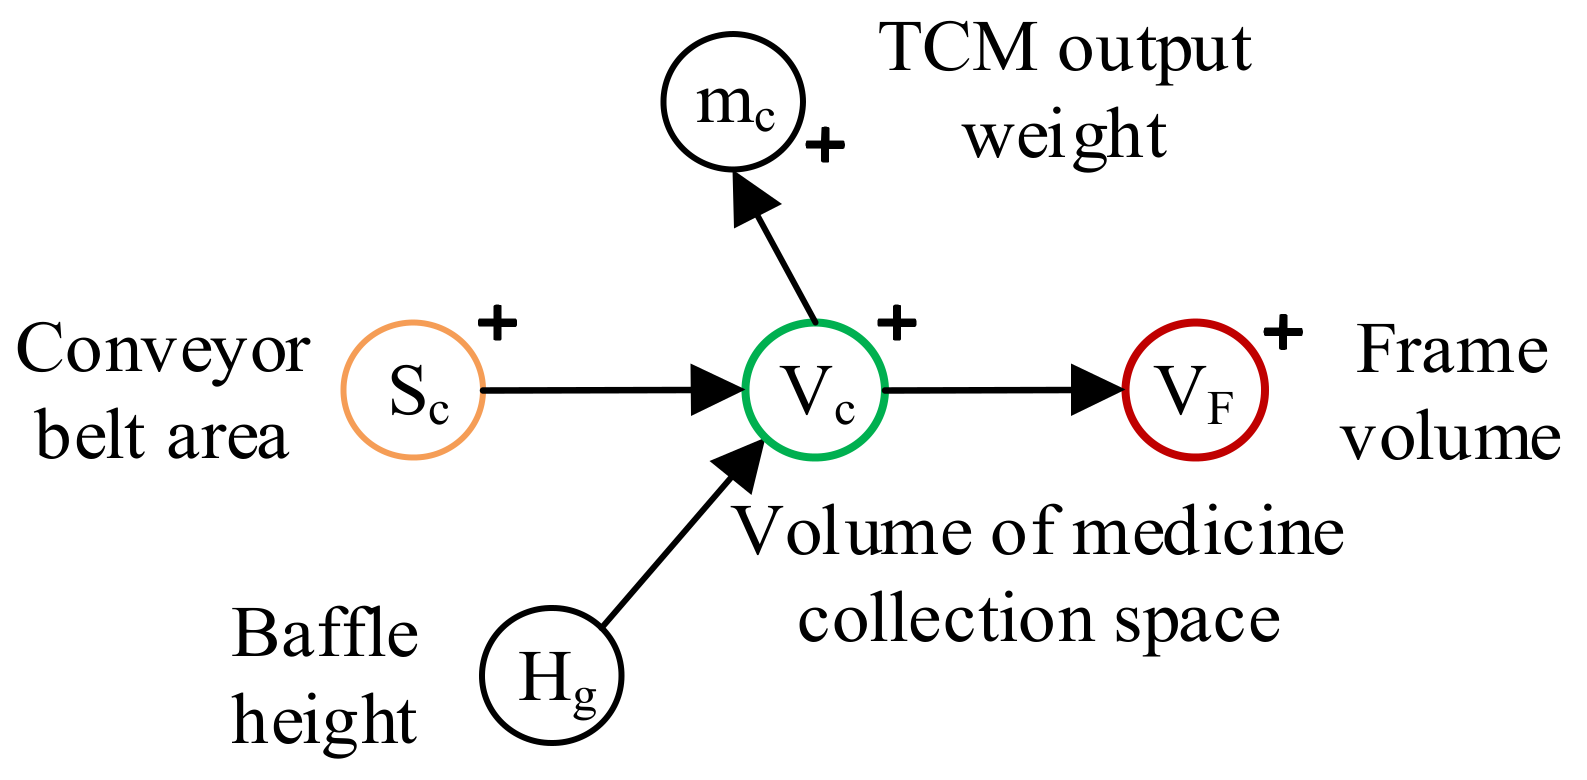
Increasing the conveyor belt area can increase the volume of the medicine collection space, but it will lead to an increase in the frame volume, which is contrary to the potential demand for the reduction of it, thus creating a conflict. Therefore, the deterioration result in the improvement process of the problem is represented by . The conflict is specifically described as improving “Unable to dispense TCM continuously” caused by and through increasing the conveyor belt area, but it will increase the frame volume, which is the deterioration result .
- (2)
Conflict determination process of “TCM accumulation at outlet”.
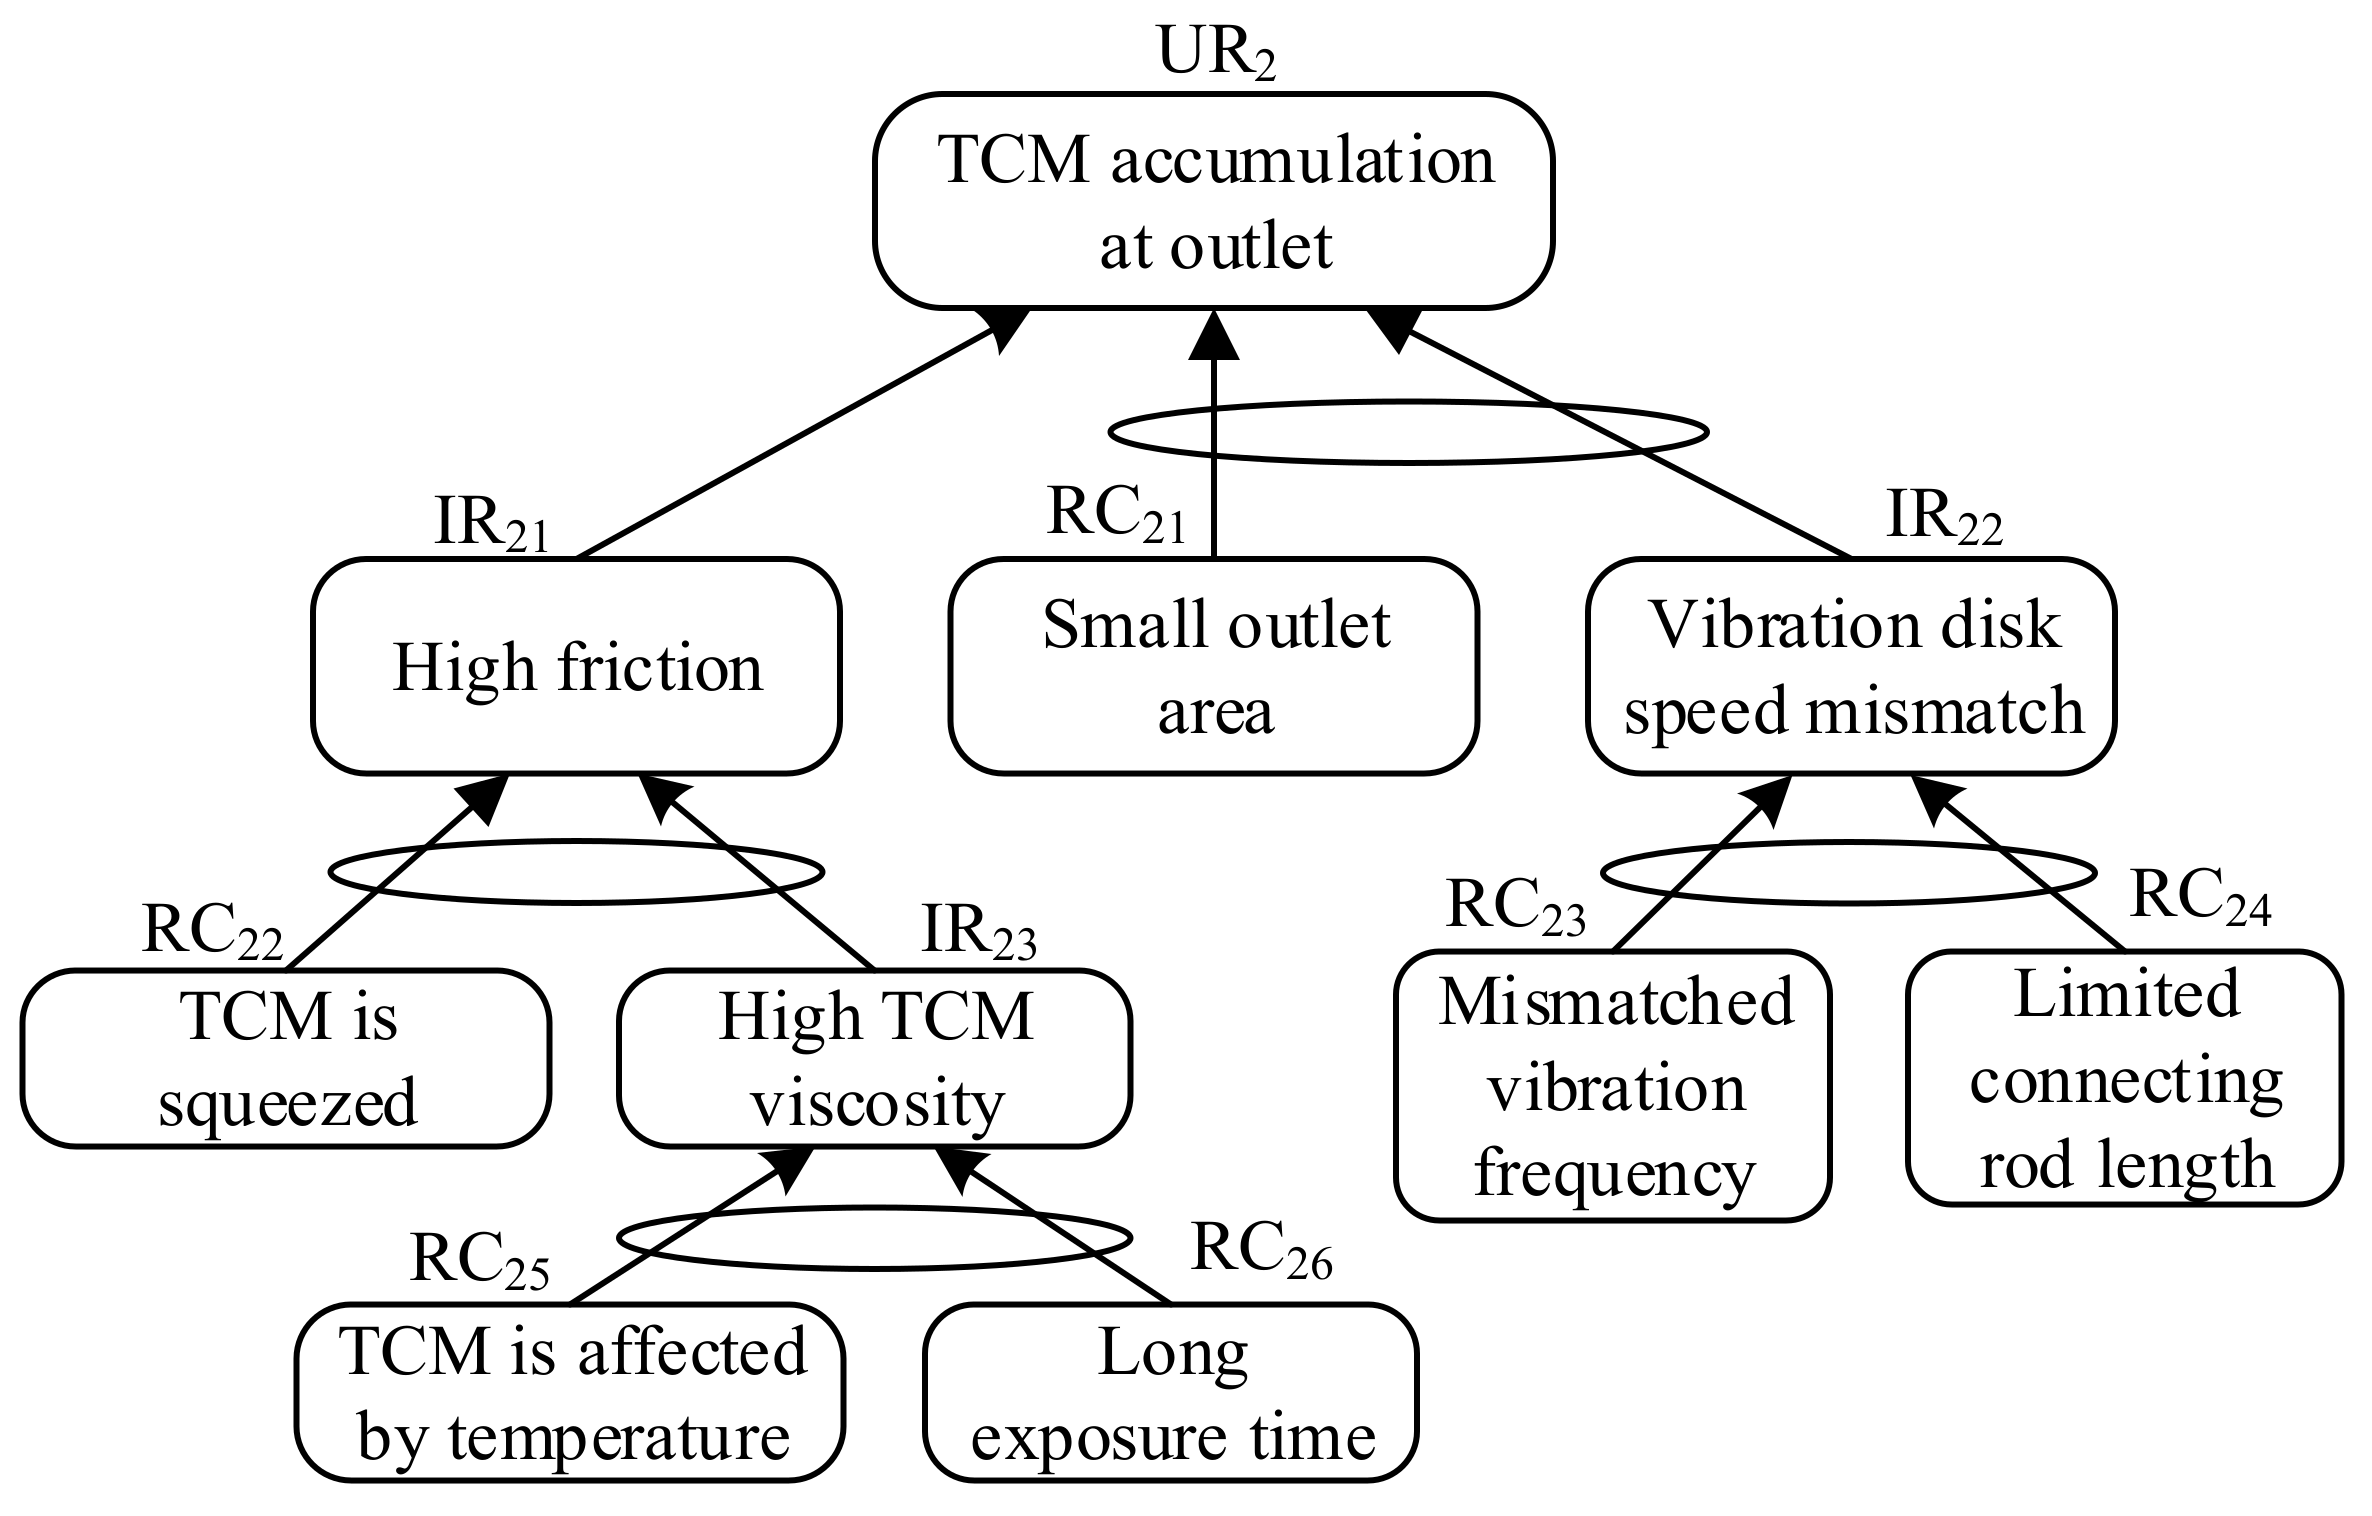
Firstly, the CRT model of “TCM accumulation at outlet” is constructed, as shown in
Figure 18. According to the logic “and” relationship, the extracted root causes related to the problem are {RC22, RC25, RC26} and {RC21, RC23, RC24}, which correspond to “TCM is squeezed, TCM is affected by temperature, Long exposure time” and “Small outlet area, Mismatched vibration frequency, Limited connecting rod length”, respectively.
Then, Python is used to extract the physical parameters corresponding to {RC22, RC25, RC26} and {RC21, RC23, RC24}, which are “Force, Temperature, Time” and “Area, Frequency, Length”, respectively, as shown in
Table 9. By sorting the physical parameters of each group in
Table 9 according to the influence degree on the problem, it can be obtained that the physical parameter sets related to “TCM accumulation at outlet” are
and
.
and
are the problem’s improvement goals.
According to the problem analysis, it can be seen that increasing the outlet speed can improve “TCM accumulation at outlet”, caused by
and
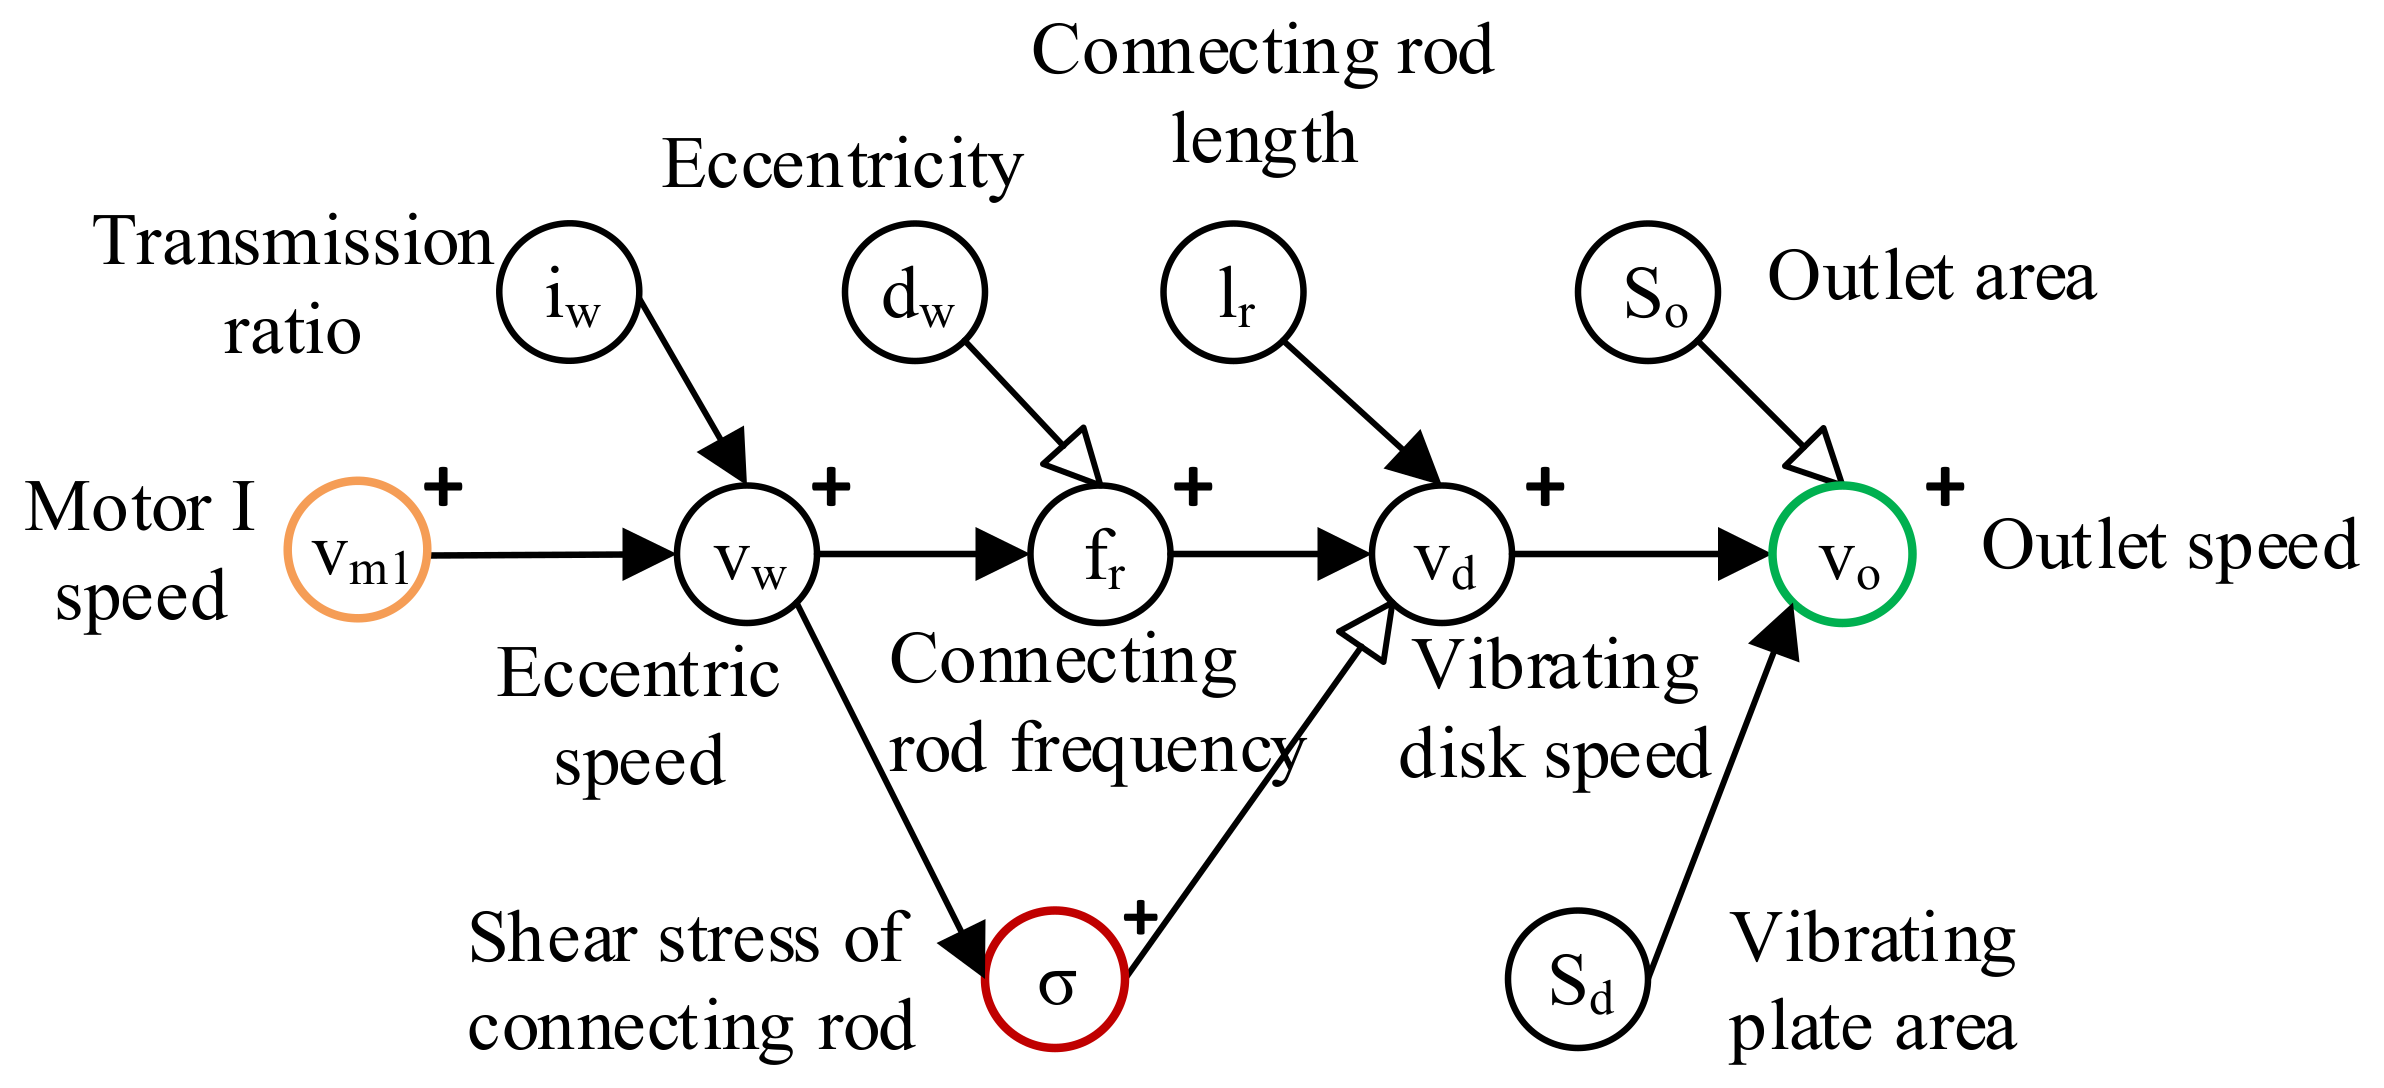
. On the one hand, increasing the outlet speed can reduce the exposure time of TCM during the separation process, thereby reducing the influence of temperature on TCM; but on the other hand, the TCM can quickly pass through the outlet and fall. Therefore, the outlet speed is used as the characteristic parameter of the problem, and its improvement direction is to become larger. Then, the related physical parameter change path in the physical parameter logical network is determined, as shown in
Figure 19.
Increasing the motor I speed can achieve the purpose of increasing the outlet speed. However, in the process of increasing it, the shear stress of the connecting rod will increase, which will affect the connection strength, resulting in conflict. Therefore, the deterioration result in the improvement process of the problem is represented by . The conflict is specifically described as improving “TCM accumulation at outlet” caused by and through increasing the motor I speed; however, this will increase the shear stress of the connecting rod, which is the deterioration result .
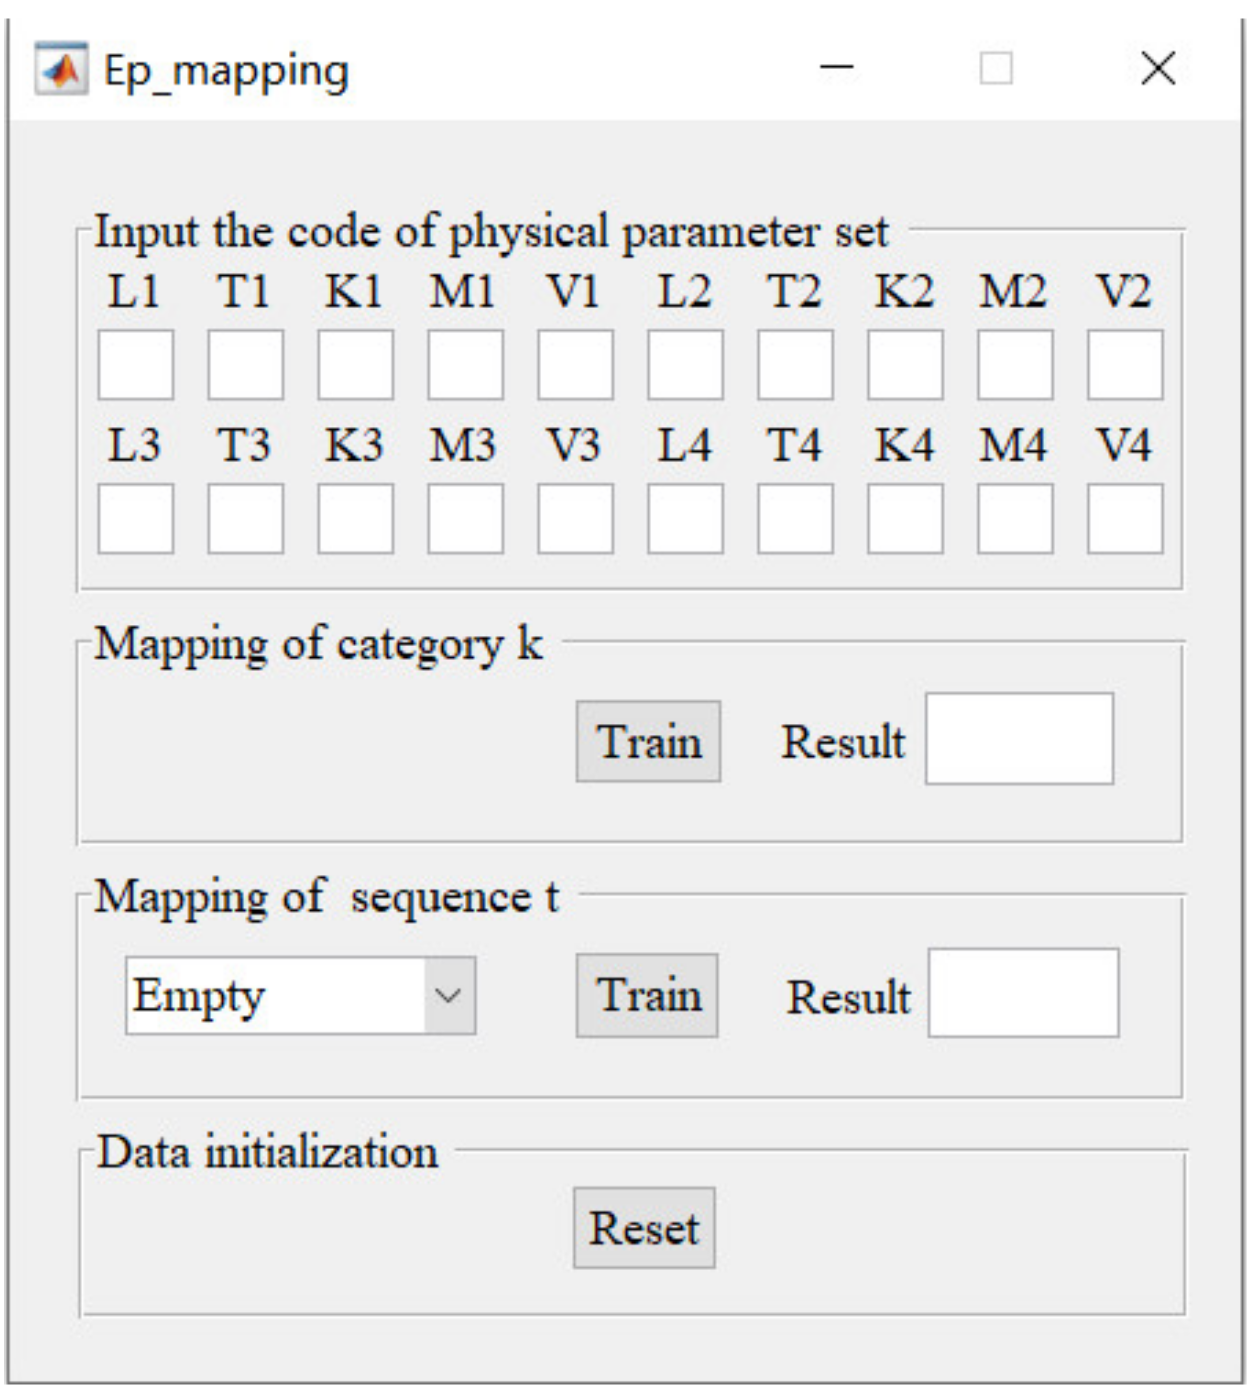
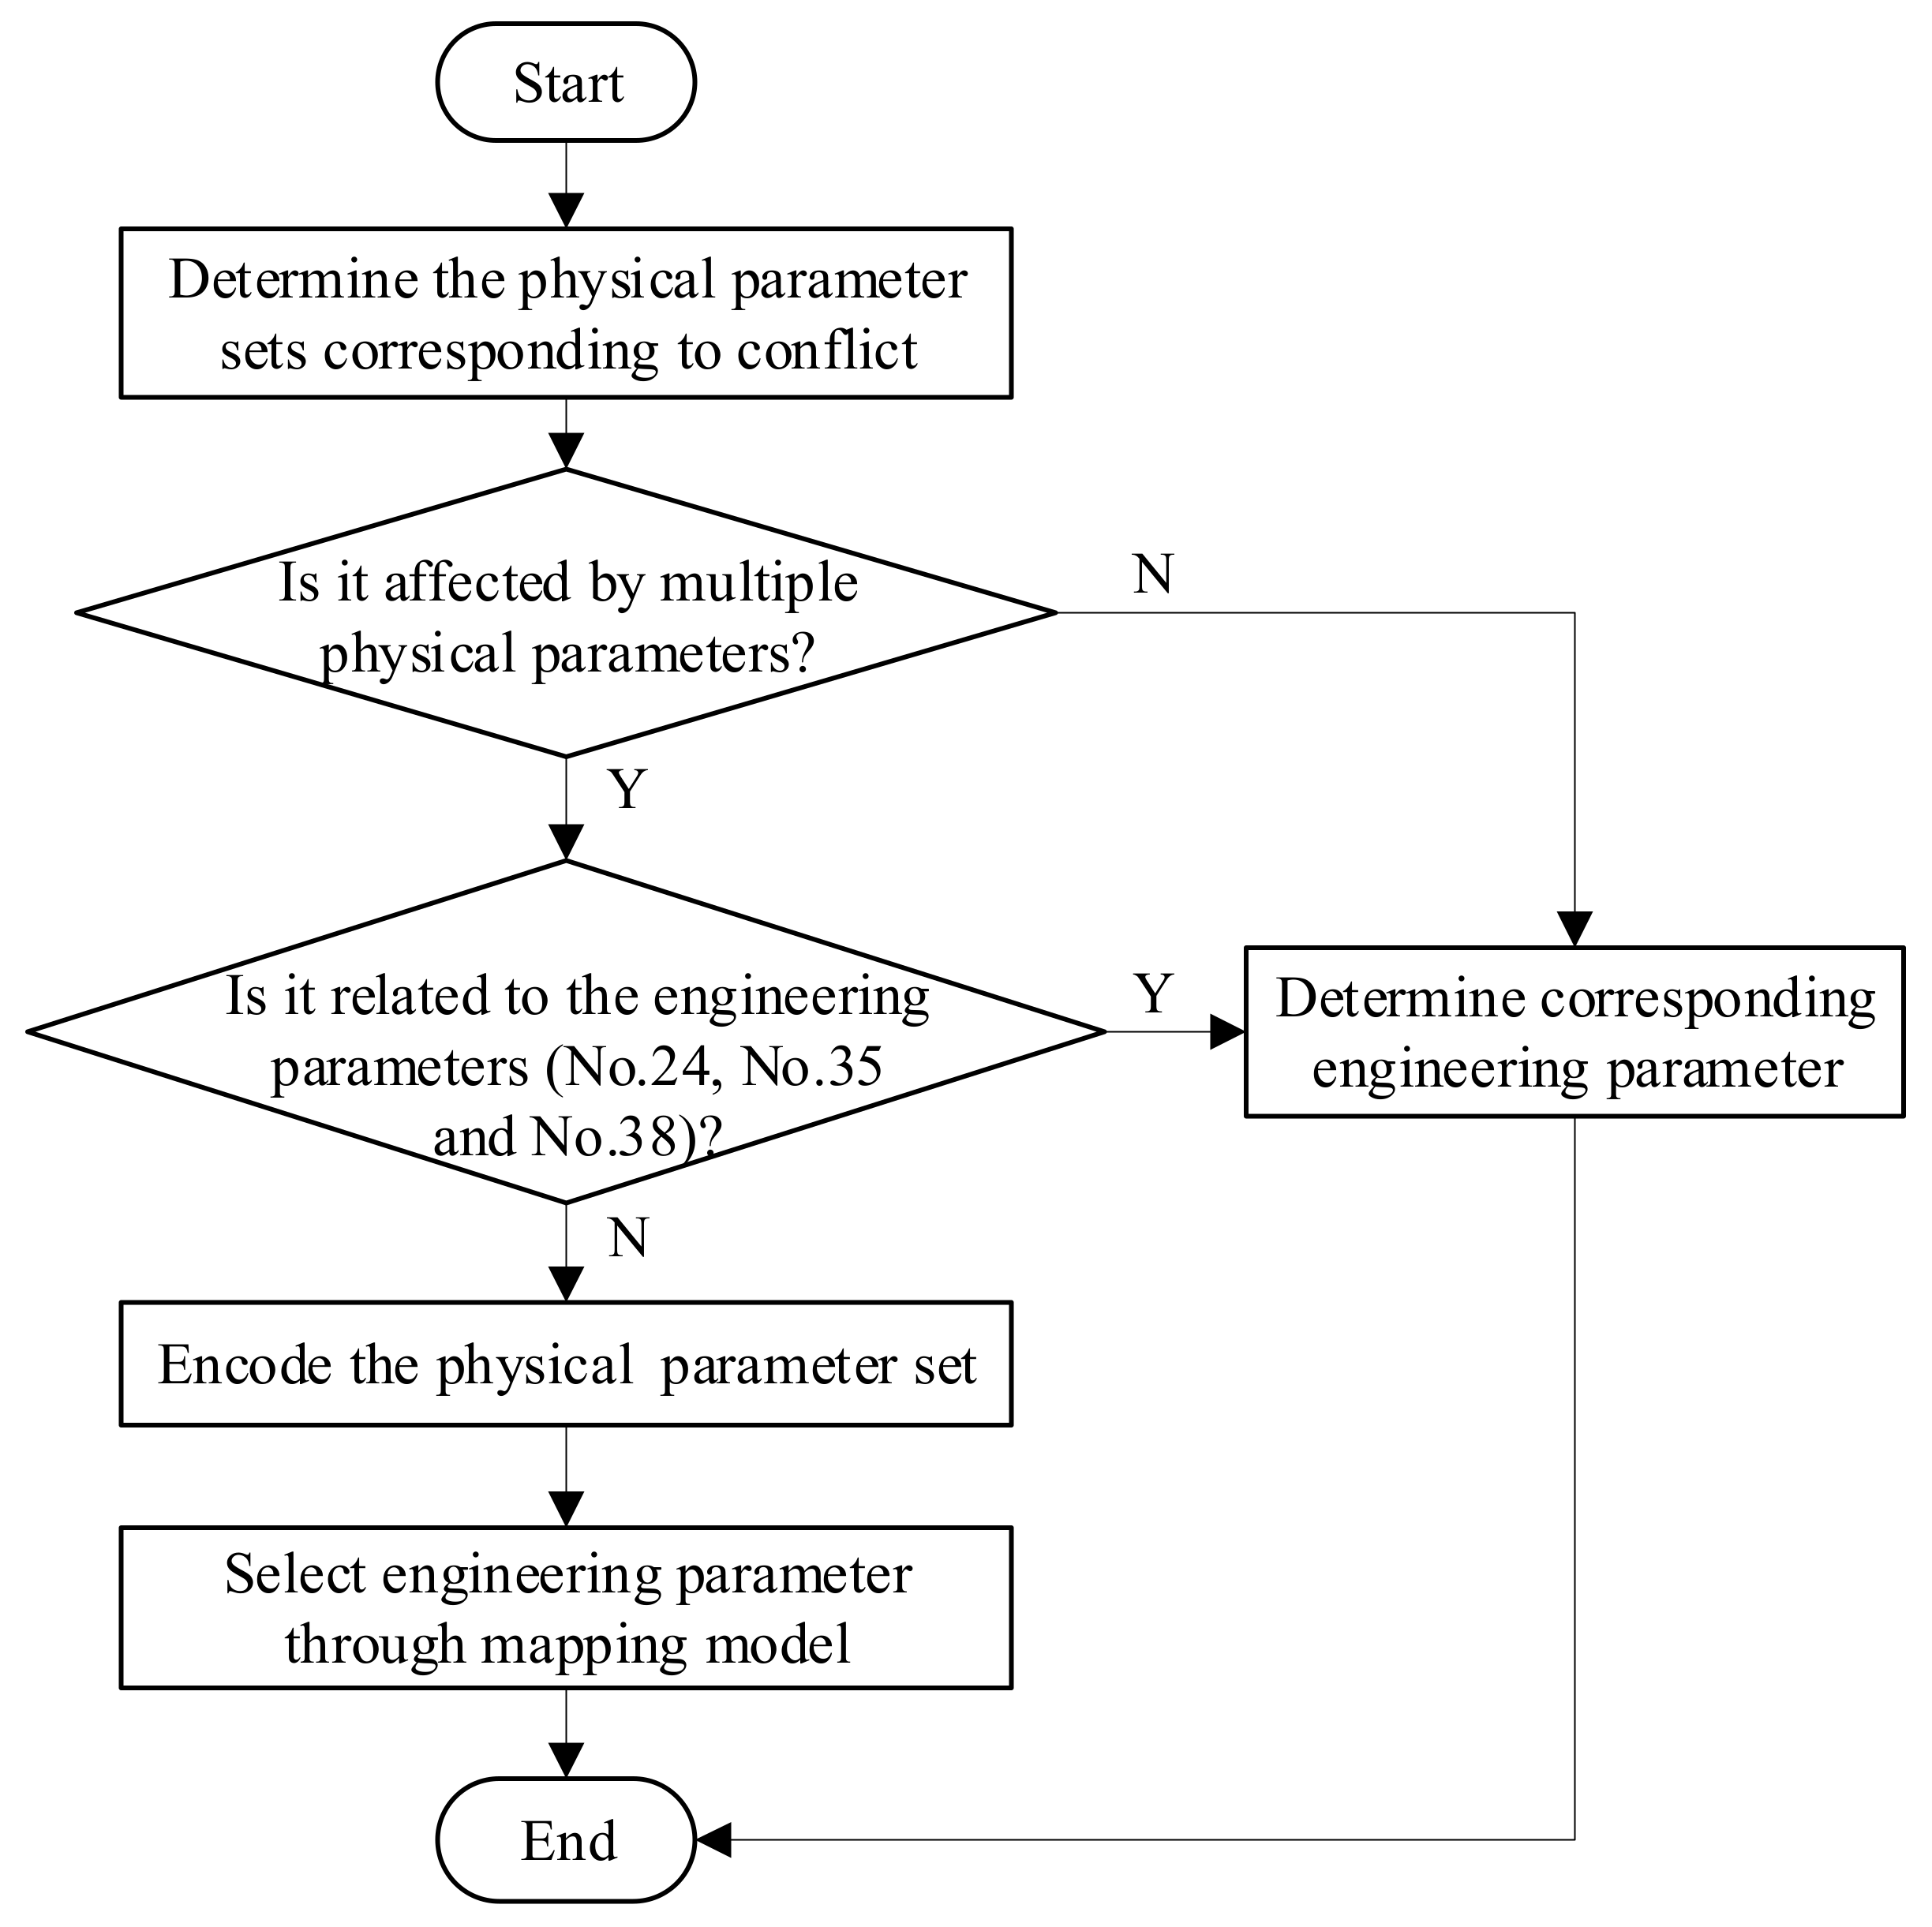
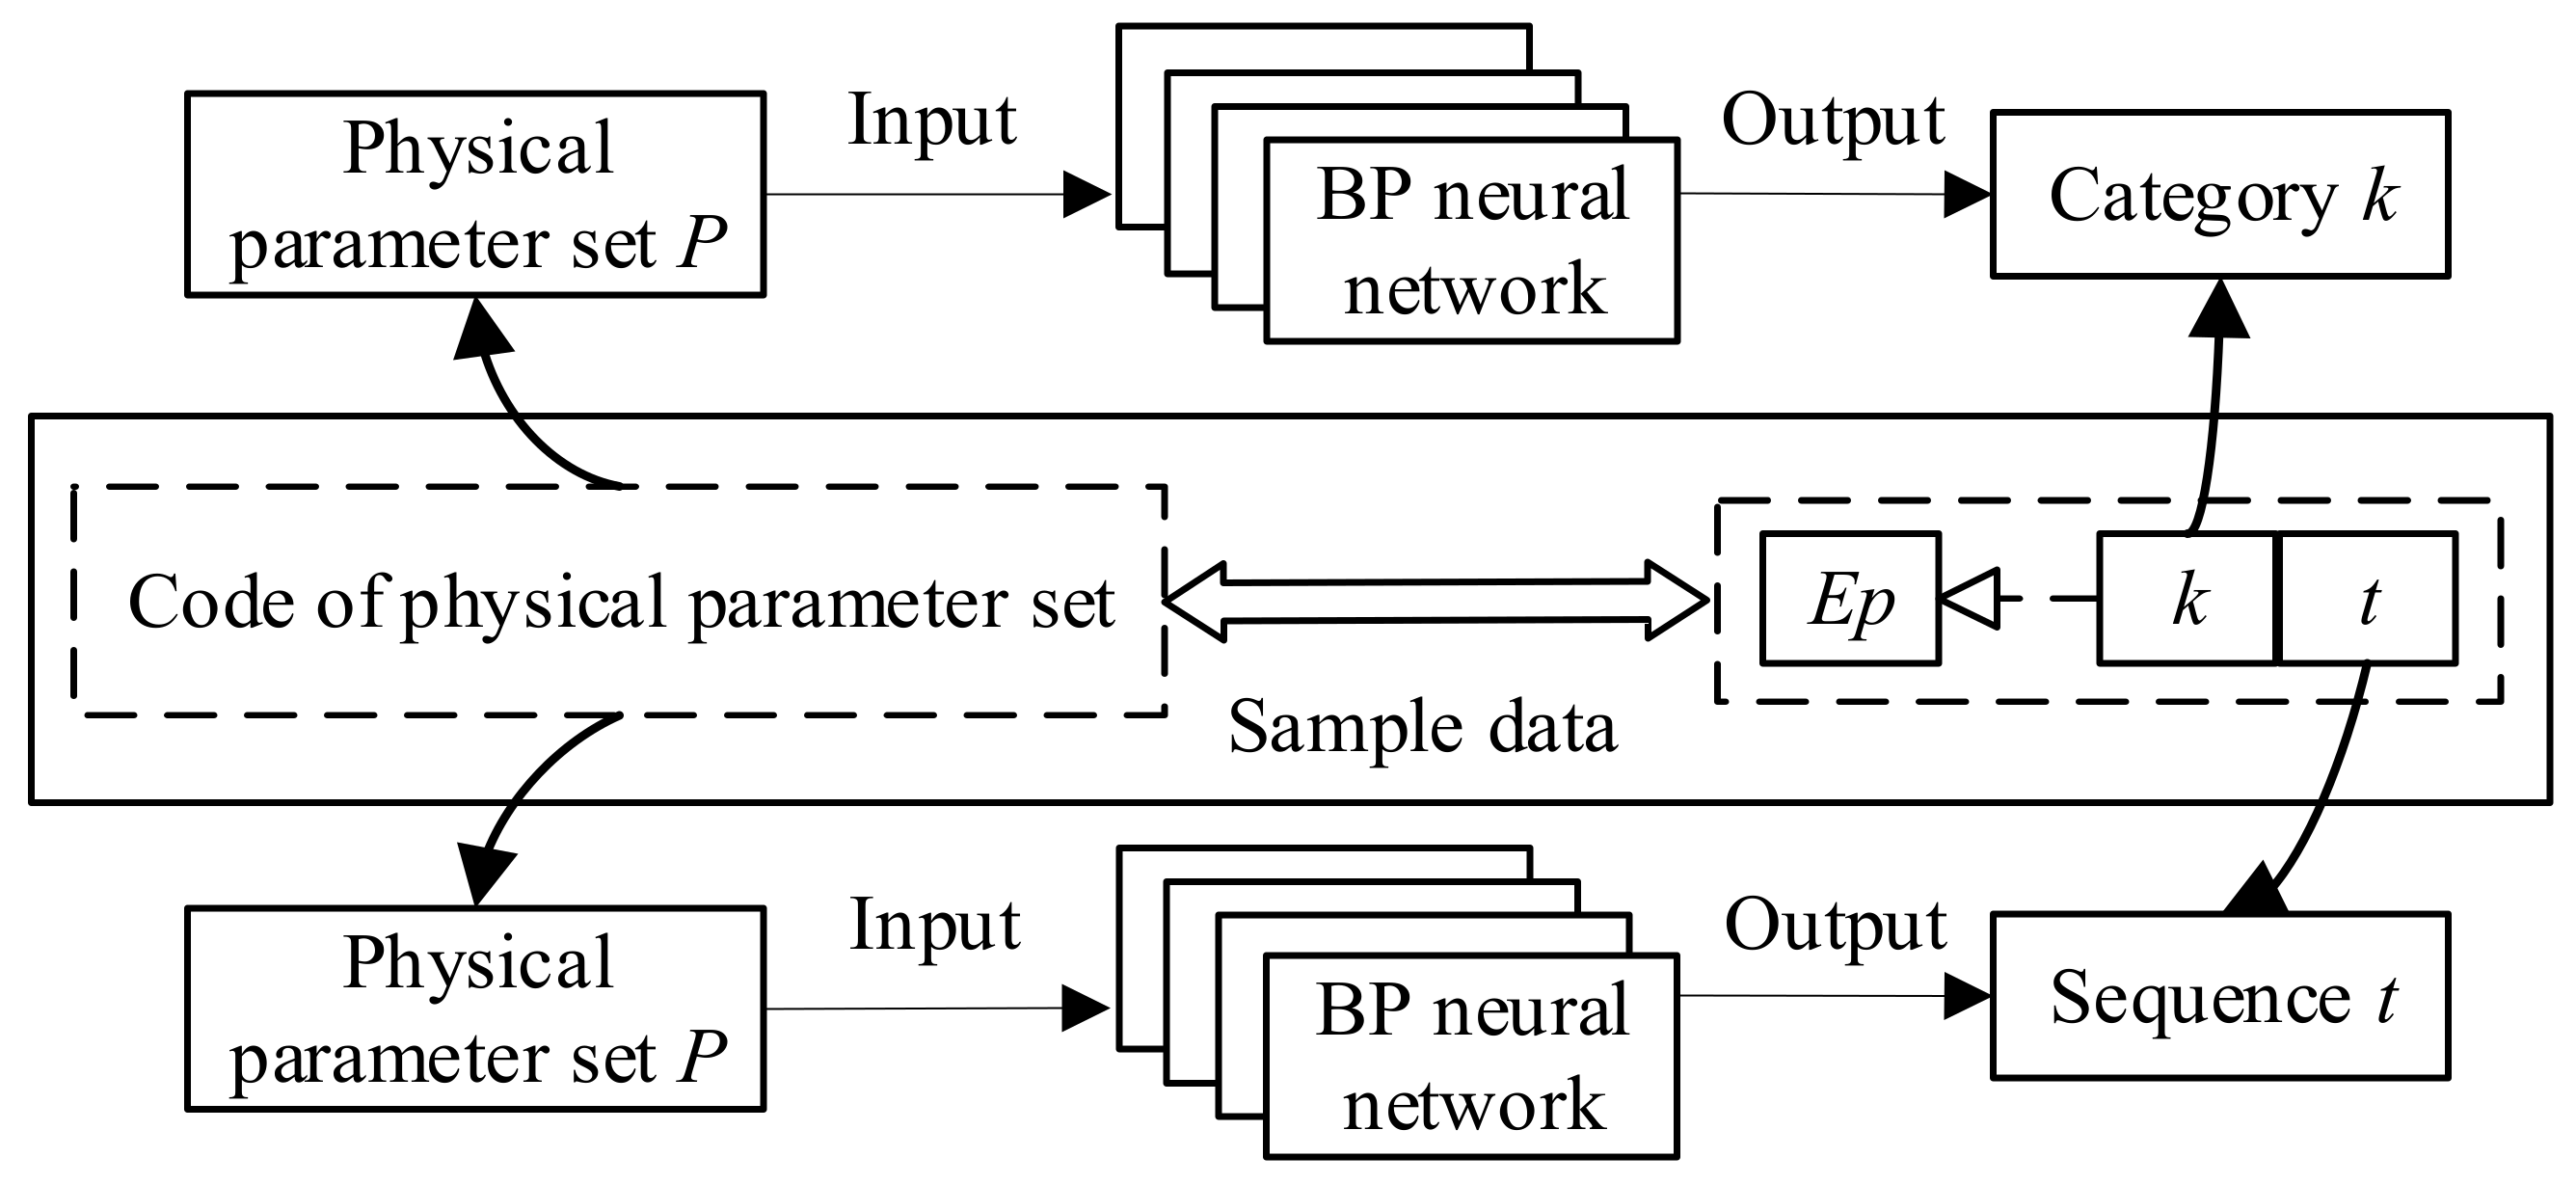
Step 4: Selecting engineering parameters through the mapping model.
According to the physical parameter sets obtained in the previous step, the mapping model between physical parameters and engineering parameters is used to select engineering parameters.
- (1)
, and are only related to one parameter. It can be seen directly that the engineering parameters corresponding to and are No.8 Volume of stationary object, the engineering parameter corresponding to is No.11 Stress or pressure.
- (2)
, and are related to the actions of multiple parameters respectively. Direct correspondence with engineering parameters is difficult. They have no relation to the engineering parameters (No.24, No.35 and No.38).
- (3)
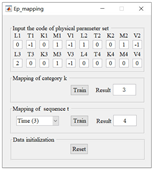
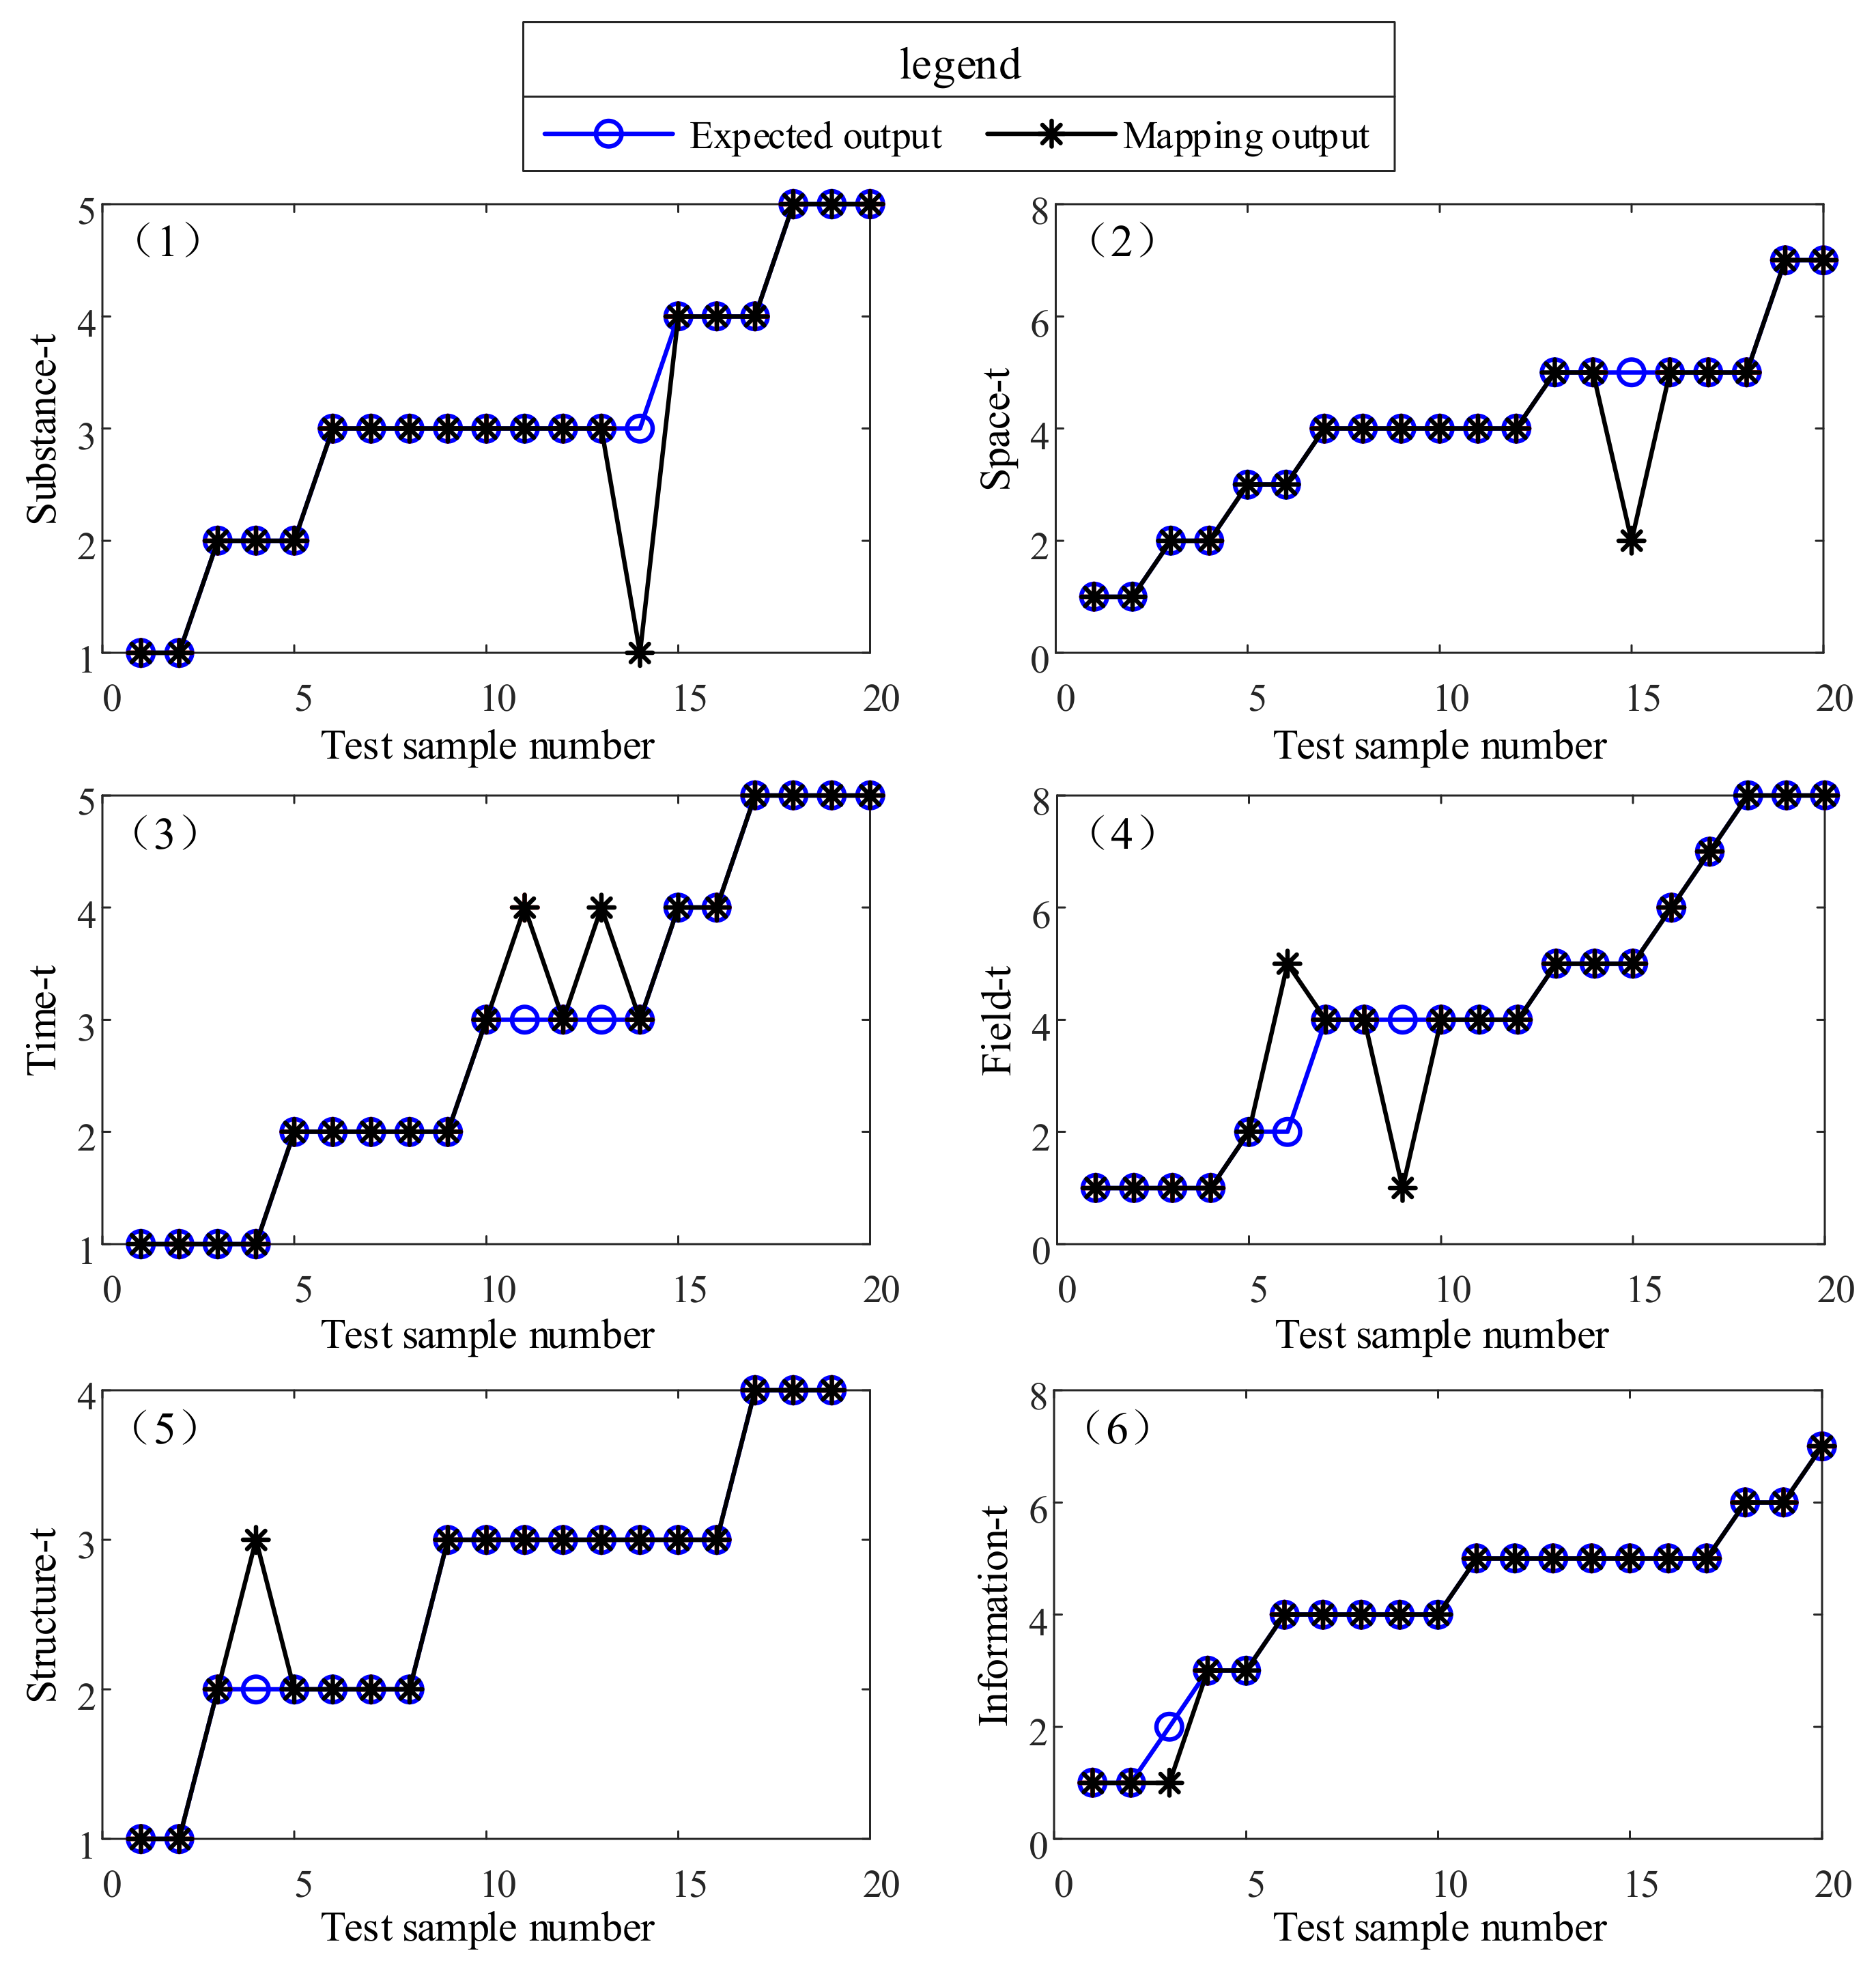
,
and
are encoded according to the code rules of the physical parameter set, and then inputted into the mapping model, respectively. The obtained engineering parameter mapping results are shown in
Table 10. According to the mapping results, the engineering parameters corresponding to
,
and
are selected as No.39 Productivity, No.30 Object-affected harmful and No.25 Loss of time, respectively.
Step 5: Solving the conflicts of the bulk TCM dispenser.
Through the invention principle or effect, the conflict existing in the bulk TCM dispenser is solved.
- (1)
Conflict solving process of “Unable to dispense TCM continuously”.
The invention principles queried according to the relevant conflicts
and
,
and
determined in “Unable to dispense TCM continuously” are shown in
Table 11.
It can be seen from
Table 11 that
and
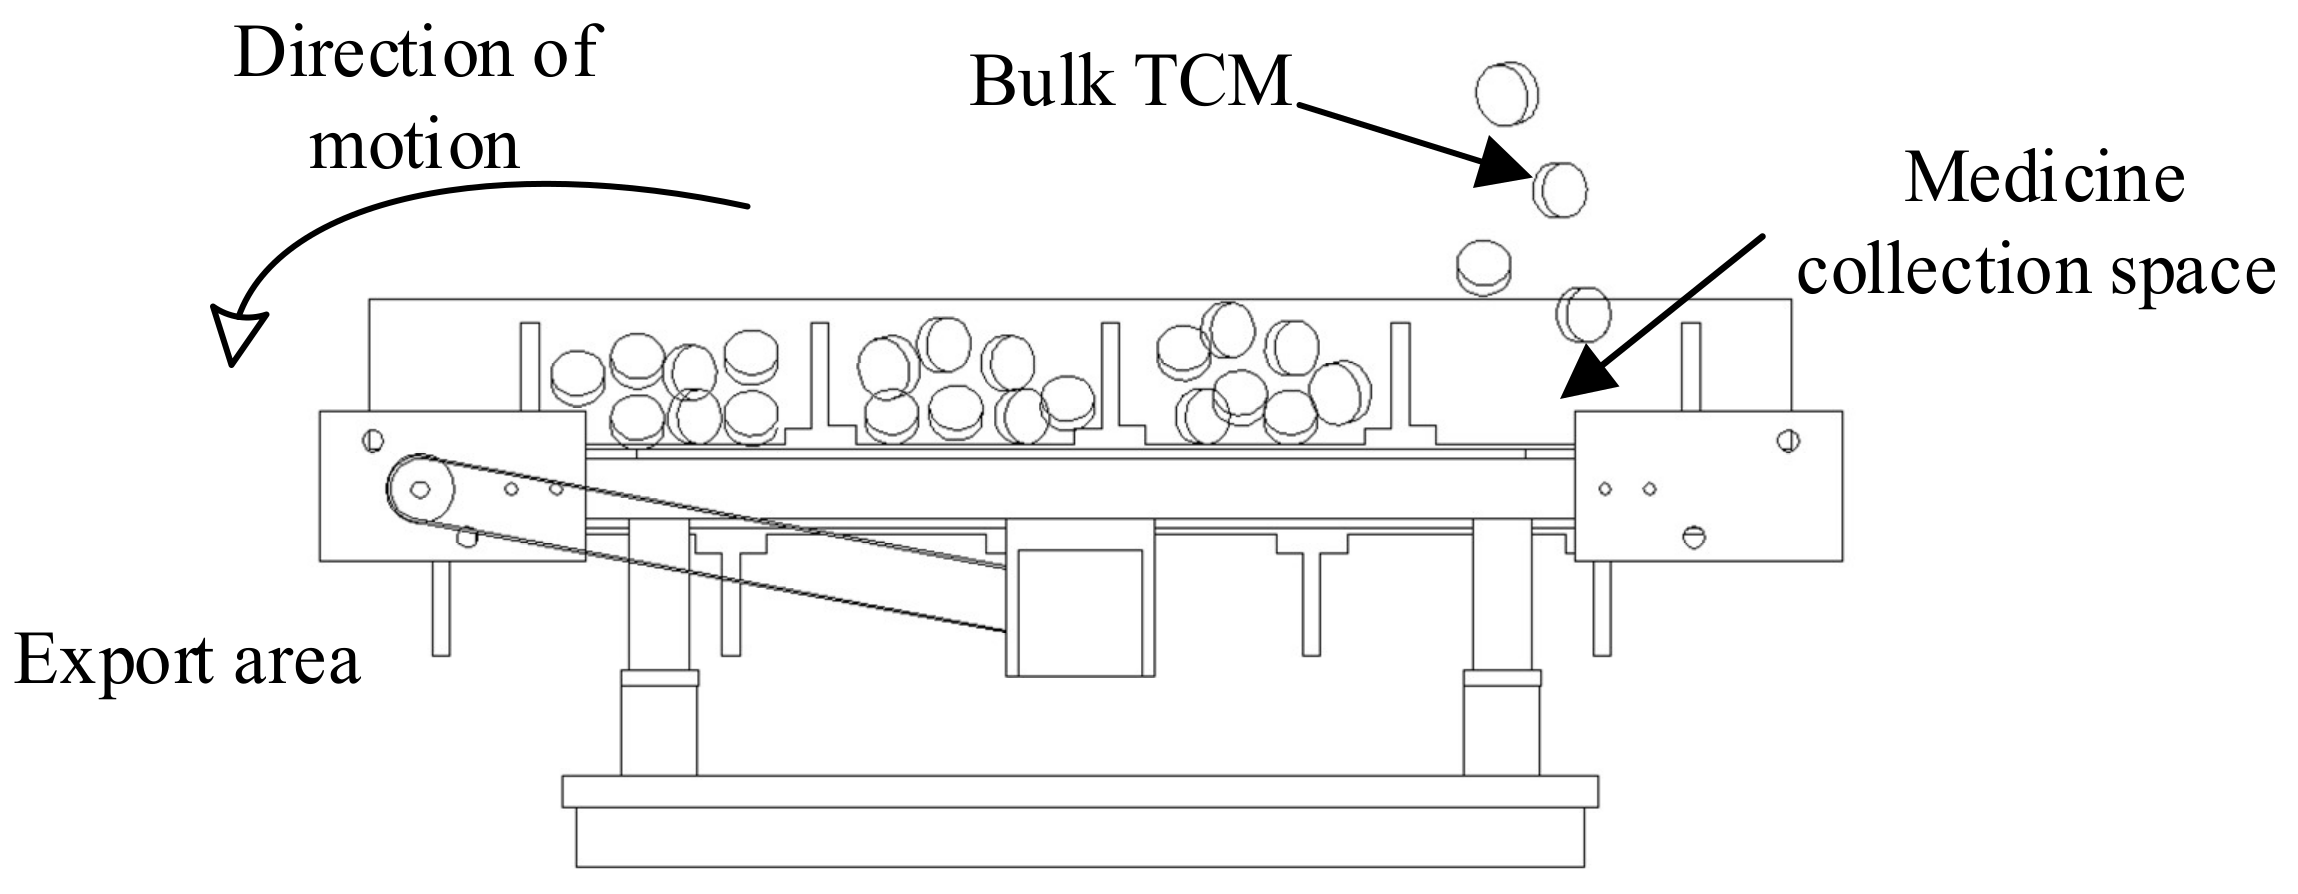
correspond to No.8 Volume of stationary object, which can be regarded as the volume of medicine collection space with opposite requirements, which belongs to physical conflict, and shall be solved by applying the space separation principle. By adding partitions, the conveyor belt is divided into a plurality of medicine collection spaces for collecting TCM, and each space area contains the fixed dose of TCM, as shown in
Figure 20.
The engineering parameters corresponding to
and
are No.39 Productivity and No.8 Volume of stationary object, respectively. The corresponding invention principles in the conflict matrix are No.35 Parameter changes, No.37 Thermal expansion, No.10 Preliminary action and No.2 Taking out. The solution is obtained according to No.10 Preliminary action. After receiving the prescription information, the conveyor belt rotates counterclockwise in advance to make the next medicine collection space reach the blanking position, which is convenient for collection of the corresponding number of TCM on the conveyor belt in advance, so that when the medicine taking device reaches the export area, it can continuously take multiple copies of medicine, and ensure the accuracy of each TCM, as shown in
Figure 21.
- (2)
Conflict solving process of “TCM accumulation at outlet”.
The invention principles queried according to the relevant conflicts
and
,
and
determined in “TCM accumulation at outlet”, are shown in
Table 12.
It can be seen from
Table 12 that the invention principles queried through engineering parameters corresponding to
and
are No.22 ‘Blessing in disguise’ or ‘Turn Lemons into Lemonade’, No.2 Taking out and No.37 Thermal expansion. According to No.2 Taking out, materials with thermal insulation performance should be used to make a relatively closed environment.
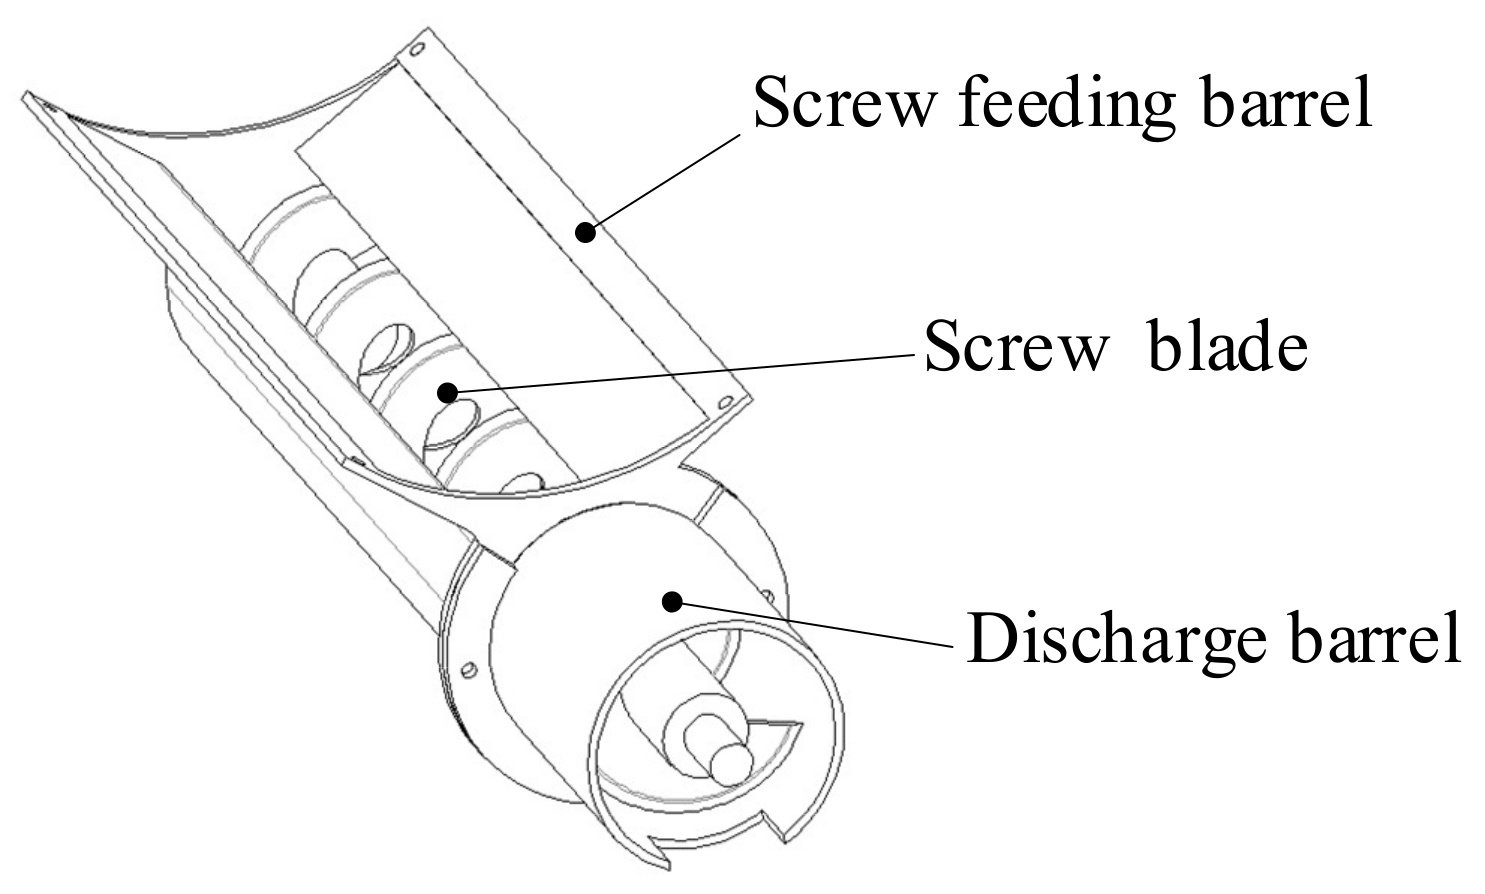
The invention principles queried through engineering parameters corresponding to and are No.37 Thermal expansion, No.36 Phase transitions and No.4 Asymmetry. According to the invention principles, there is no solution to the conflict, so the effect is used for further solution.
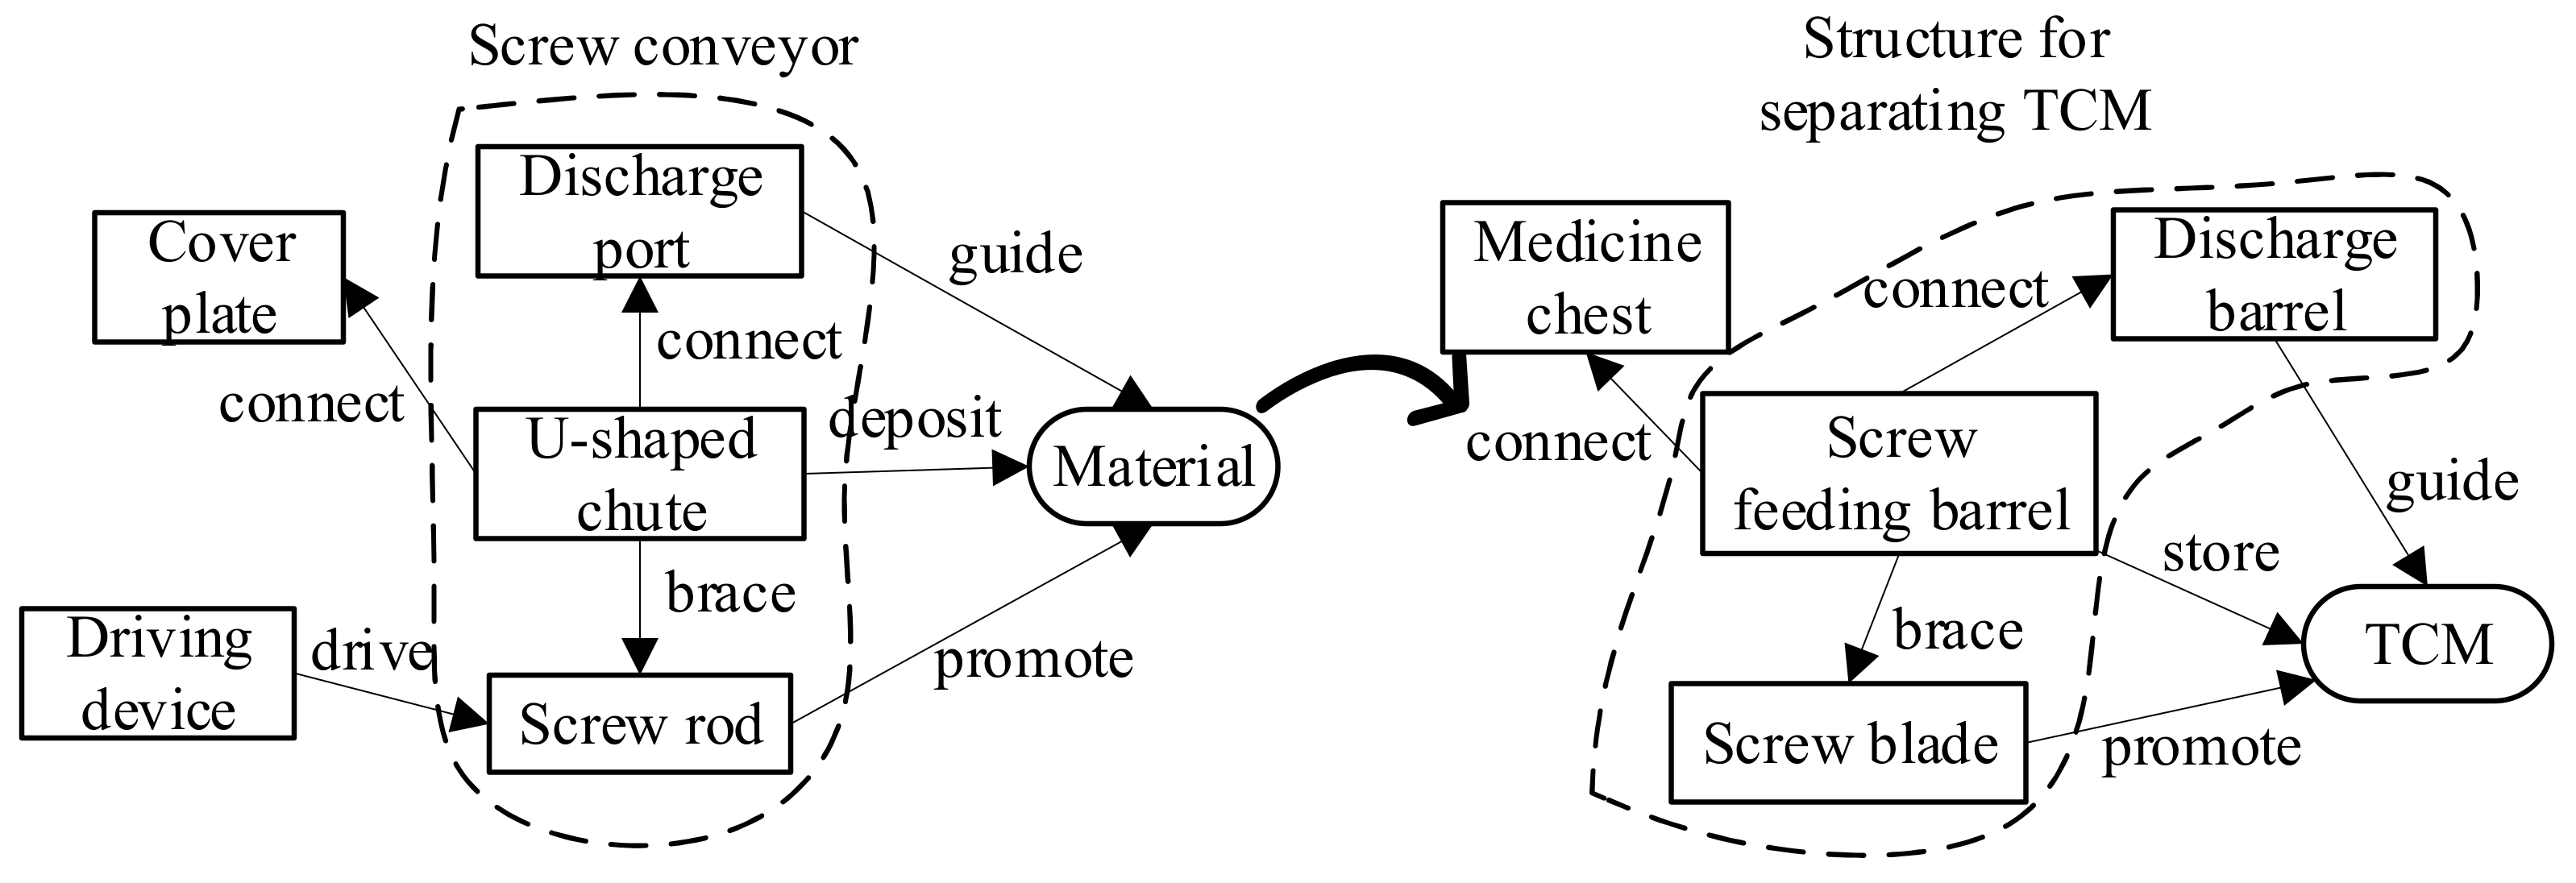
The above conflict can be abstracted as changing speed. Then, the available effects, such as roller, screw, rack and pinion, pulley, etc. are obtained by using the effect knowledge base [
45]. The screw effect is selected according to the difficulty of realization, and the scheme is obtained by analogy between the case corresponding to the effect (screw conveyor) and the regional structure of “TCM accumulation at outlet” (TCM separation area), as shown in
Figure 22 and
Figure 23. The scheme analogy process refers to the existing research [
26,
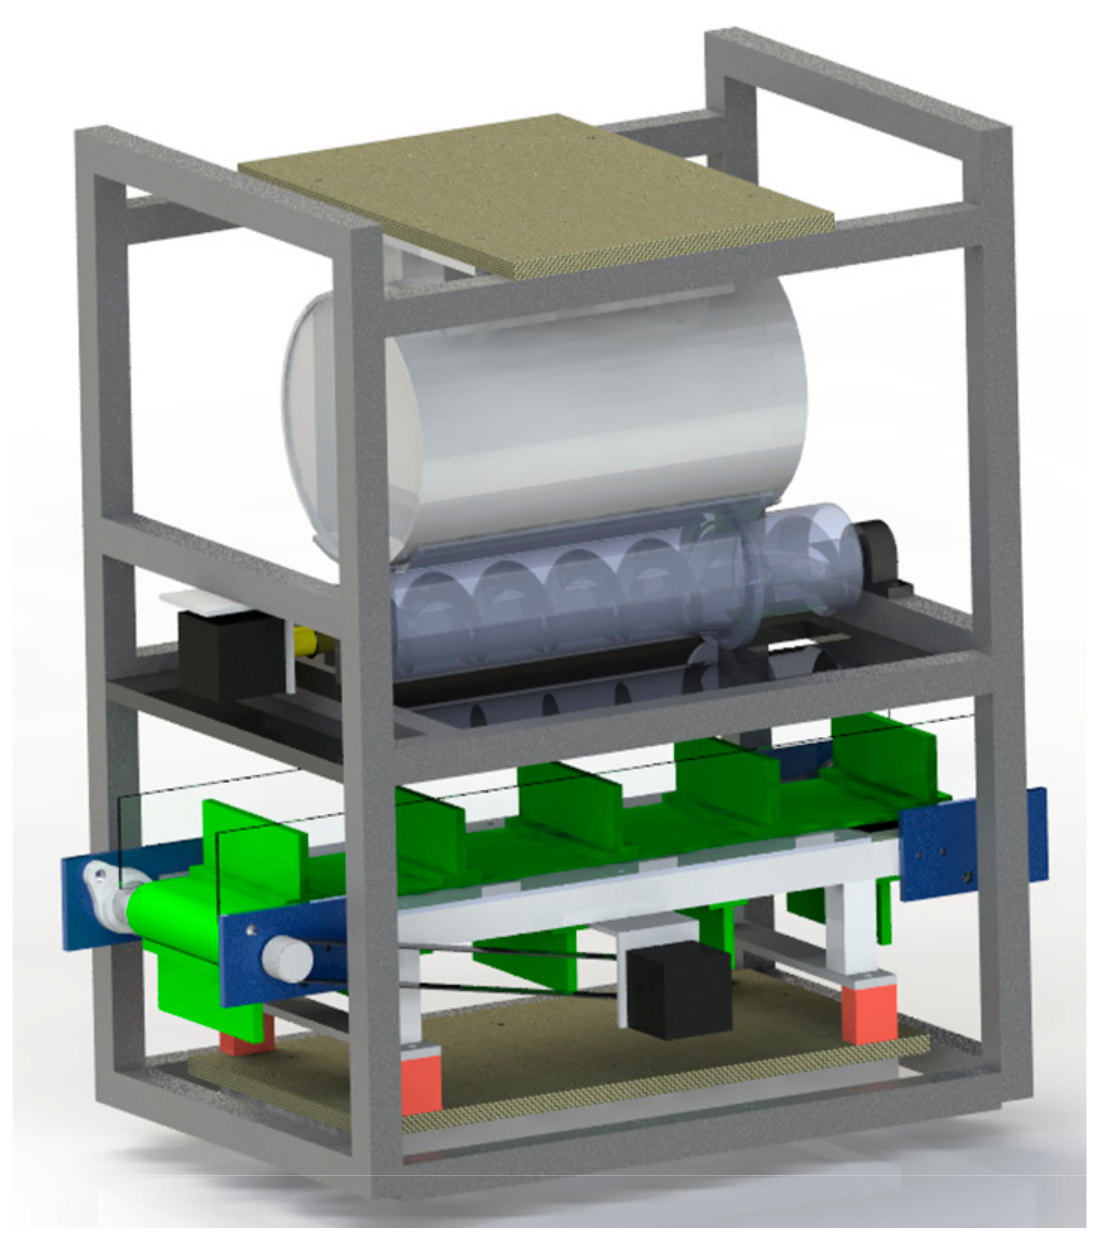
34]. The scheme comprises a screw feeding barrel, a screw blade and a discharge barrel. The screw feeding barrel is eccentrically arranged and connected with the cylindrical medicine chest to make TCM fall into one side. The screw blade is used to push the TCM and make it drop at the discharge barrel.
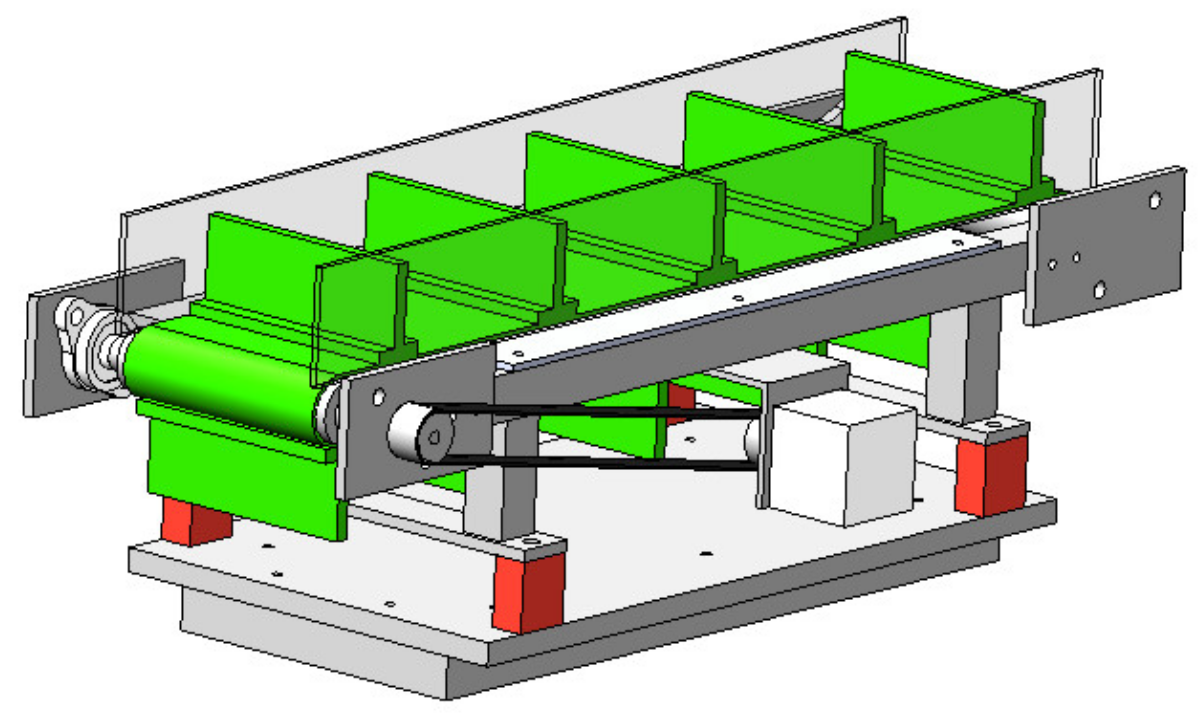
By combining the schemes obtained in the above solution process, a new scheme of the bulk TCM dispenser is formed and its 3D model is established, as shown in
Figure 24.
Step 6:Evaluating schemes.
The mechanical system performance is the sum of the service performance, economic performance and green performance that the mechanical system must have to complete its specific function [
46]. After analyzing the requirements of the dispensing machine, its key technical characteristics are “dispensing efficiency”, “automatic control” and “dispensing error”. Therefore, the service performance, economic performance and green performance are taken as three comprehensive indicators and subdivided to establish the evaluation indicator system of the bulk TCM dispenser, as shown in
Table 13.
The relative importance of evaluation indicators is divided into five levels: “unimportant”, “slightly important”, “important”, “relatively important” and “very important”, corresponding to values 1, 3, 5, 7, and 9 respectively, and values 2, 4, 6, and 8, respectively, representing values between the two levels. As shown in Equations (4)–(7), the indicators in the comprehensive indicator layer and the project indicator layer are compared according to the relative importance standard to obtain the judgment matrices
,
,
,
.
The above matrix meets the consistency test, and its eigenvector is obtained by the normalization algorithm [
47], which are
,
,
and
respectively. Thus, the weight value of each indicator is obtained, as shown in
Table 13.
In this paper, relevant experts, engineering technicians, manufacturing and maintenance personnel, etc., are invited to form a five-person evaluation team (E1–E5) to score each project indicator of the prototype dispenser (S1) and the newly designed bulk TCM dispenser (S2) using a ten-point system. The detailed scoring results are shown in
Appendix B.
The scoring results are brought into Equations (8) and (9) for calculation, where
is the final score of the scheme,
refers to the number of evaluators,
is the weighted score of the comprehensive indicator,
is the number of comprehensive indicators,
is the weight value of the comprehensive indicator,
is the number of project indicators,
is the weight value of the project indicator, and
is the score of the project indicator. The final score results of the scheme’s mechanical properties are obtained, as shown in
Table 14. According to the results, the new scheme is obviously better than the prototype.


