Communication

Low-Cost AR-Based Dimensional Metrology for Assembly

Center for Precision Metrology, University of North Carolina at Charlotte, Charlotte, NC 28262, USA
*
Author to whom correspondence should be addressed.
Machines 2022, 10(4), 243; https://doi.org/10.3390/machines10040243
Submission received: 25 January 2022 / Revised: 21 February 2022 / Accepted: 25 February 2022 / Published: 30 March 2022
(This article belongs to the Special Issue Precision Measurement and Machines)

Abstract

:
The goal of this study was to create and demonstrate a system to perform fast and inexpensive quality dimensional inspection for industrial assembly line applications with submillimeter uncertainty. Our focus is on the positional errors of the assembled pieces on a larger part as it is assembled. This is achieved by using an open-source photogrammetry architecture to gather a point cloud data of an assembled part and then comparing this to a computer-aided design (CAD) model. The point cloud comparison to the CAD model is used to quantify errors in position using the iterative closest point (ICP) algorithm. Augmented reality is utilized to view the errors in a live-video feed and effectively display said errors. The initial demonstration showed an assembled position error of 9 mm ± 0.4 mm for a 40-mm high post.

1. Introduction

Quality inspection in manufacturing is the process of studying how well a product’s characteristics agree with its original or intended design. This requires measuring, assessing, and testing the part. This is a crucial step in manufacturing as it eliminates distributing faulty parts to customers, saving overhead costs, and potentially helping address faults in the manufacturing process itself.
Traditionally quality inspection relies on human vision, where the part is compared with a sketch or a CAD model and then approved or discarded. According to a recent study [1], human errors accounted for 23% of the measurements being done incorrectly while performing visual quality inspection. This calls for an automated and machine reliant instrument to perform the task.
These days, with technological advances, more complex and efficient systems have been invented to perform quality inspection. Ideally the process of acquiring the dimensional data of the object of interest on the industry floor is fast and economical. Typically this dimensional information is acquired with vision-based techniques such as laser scanners, photogrammetry, structured light, and/or laser triangulation [2].
Laser techniques are often used for scanning but are expensive and come with safety considerations. The geometric information acquired using these laser scanners is accurate with low measurement uncertainty, but costly because of expensive scanning equipment and the need for skilled manpower to obtain even basic data [3]. In addition, time and money is needed for data analysis and processing using specialized software.
Structured light techniques are less expensive but have their own challenges. Projected light visibility can be a problem under certain ambient light conditions. Surface colors must be considered and can directly impact the projected light pattern visibility.
Several studies have been done comparing laser scanners with photogrammetry. One such study compared terrestrial laser scanners with data captured for photogrammetry using a 20-megapixel camera [4]. The most promising advantage of photogrammetry is reduced set up and data acquisition times and the reduced equipment expense compared to laser scanning approaches. The cost of laser-based systems is high, and the number or availability of such devices is limited.
On the other hand, image-based quality inspection systems are among the most popular quality control systems since they can be easily implemented at a lower cost. Especially for small companies and startups, buying high quality, industrial grade cameras do not call for a huge investment. The cameras can also be controlled remotely, thereby decreasing on site personal time.
Photogrammetry also requires minimal manpower. Photogrammetry can be divided into two main categories: one method obtains 3-D point cloud with prior knowledge of camera positions and angles and the second method uses a ‘structure from motion’ (SfM) pipeline which simultaneously calculates camera pose and the 3-D shape using feature detection in images and feature matching. The latter technique is well suited to our project.
Analysis of 3D image data acquisition methods in an industrial environment shows that when selecting a particular method, the conditions of the work environment, i.e., changing illumination levels and shifting geometrical surfaces need to be considered. It has been observed that methods of active illumination are preferrable because inspection systems become less sensitive to changes in the illumination conditions of the industrial environment [5].
There is sufficient lighting during inspection on a factory floor, combined with the availability of high processing graphics processing units (GPUs), that makes photogrammetry-based inspection a good fit. Close range photogrammetry in industry is a relatively new concept providing highly accurate 3-D measurements that became popular in the 1980s. Especially for large objects greater than 10 m, photogrammetry offers precision of 1:500,000 [6].
The coordinate measuring machines (CMMs) is another traditional instrument for dimensional inspection. The contact CMM, though very accurate and extensively used in industry, has limitations for monitoring parts assembly. In addition to the expense, the contact force may damage the surface as can happen with polymer parts and these machines are also slow because of the serial nature of the measurements [6]. Also, many applications do not call for CMM-quality measurements, meaning the assembly tolerances are often relaxed compared to individual component dimensional tolerances. Our goal is to develop a fast and inexpensive dimensional measurement method for assembly applications with submillimeter positioning tolerances. We propose a photogrammetry-based approach to deliver high density 3D point cloud data over extensive areas in terms of object volume and accuracy at low cost [7].
Furthermore, while contact measurement methods like the CMM and non-contact methods like laser trackers offer low uncertainty measurements, they come at a hefty price. A study done on geometrical measurements in car testing laboratories studied the suitability of laser scanners and photogrammetry techniques to perform these measurements [8]. The study points out that the geometrical parameters in these laboratories, are set by ISO 612:1978 and the tolerances mentioned are high enough to compensate for the relative lower uncertainty offered by photogrammetry and laser scanners.
Geodetic (Melbourne, FL, USA) offers commercial photogrammetry software and devices such as V-STARS [9] to demonstrate measurement of aircraft engines, boxes, and large ship parts, among others. The package includes specialized cameras, scale bars, and coded targets. The use of coded targets adds manual labor and time.
Industrial assembly features often consist of highly textured surfaces, with contrasting colors and features, making it an ideal application of feature-based detection using photogrammetry without the need of coded or non-coded targets. The use of coded targets reduces measurement uncertainty, but for assembly-line positioning error detection on the sub-millimeter scale, feature detection alone is likely sufficient. Feature detection algorithms in photogrammetry use edge-finding and other feature-specific strategies based on difference of Gaussians or using a Hessian matrix-based blob detection in popular algorithms like scale-invariant feature transform (SIFT) and speeded-up robust features (SURF). These algorithms rely on visual properties of the surface and show significantly less noise for these types of surfaces than would result from light detection and ranging (LIDAR)-based sensors [10]. We use algorithms available in the open source, feature-based photogrammetry library OpenMVG, which is flexible and economical.
For metrology applications, point cloud data needs to be visualized and processed for quality inspection. Numerous platforms have been developed for point cloud visualization and processing. They include commercial software packages developed by manufacturers of point cloud measuring devices and independent commercial software packages. GOM Inspect, FARO scene, Polyworks, and PointCab are such examples [7]. These software packages offer advanced point cloud processing and error measurement capabilities but come at a high price. We propose a simple technique that utilizes the popular point cloud fine registration algorithm, iterative closest point (ICP) and MATLAB, to compare our point cloud with its CAD model.
Assembly inspection commonly involves a visual comparison of a screen-displayed 3-D CAD model of the assembled part that is displayed on a screen to allow the user to cross-check the real assembly with the CAD model and look for errors. Once assembly errors are quantified with the feature-based photogrammetry step, we use augmented reality (AR) for the visualization step by conveniently overlaying the CAD model of the relevant components onto the live video feed of the assembled part with labels and notation displaying the quantitatively identified assembly errors. This overcomes possible limitations in viewing or changing the CAD view on the screen and does not require the entire real world to be modeled with a high computational cost of creating an immersive virtual reality environment [11].
Most current AR applications in industry focus on manual assembly processes and AR is used to overlay instructions to the user onto the assembly scene. Quality inspection, training activities, and machining setups are other application examples, where AR assists the user in visualizing and detecting defects more efficiently, thus reducing time delays [12]. In our application, AR is used to overlay the quantitative position errors of assembled components onto the live video-feed of the assembled system.
Developing these applications is both hardware and software intensive and there are different hardware devices that can be used. Head-mounted display (HMD) devices are the most popular, accounting for 40% of all visualization devices in industrial AR applications [12]. Wearing these can however be uncomfortable and can cause dizziness. Handheld devices, smartphones, in particular provide a good alternative because they are cost effective and easily accessible. Fraunhofer IGD [13] and FARO Visual Inspect [14] both have developed commercial devices that offer quality inspection for industry similar to what is described here. The inspection in these systems is qualitative, however, and does not report quantitative errors with uncertainty which is the goal of this project.
In this paper we describe the combination of feature-based photogrammetry with a CAD model comparison to provide quantitative quality inspection for assembly with visualization using AR.

2. Method

2.1. Photogrammetry

To present the proposed pipeline, we demonstrate the process using an assembly artifact, representative of steel-based assembled system with welded components on a steel plate. The process we describe could be applied to a wide range of assembly applications involving different materials and scales. A CAD model of the artifact used here was made in Creo parametric [15] and a real-life model constructed, whereby the individual features were welded onto a base steel plate. Figure 1 shows the CAD model. The steel system is 30 mm by 30 mm and contains assembled blocks and posts which will serve as our features of interest with heights as large as 40 mm. Angle brackets are also shown in the CAD to facilitate mounting on an optical bench.
Photogrammetry was used to gather dimensional information about the artifact in question. Images from a simple smart phone camera (iPhone 6s) were taken with the focal length fixed using the inbuilt camera function. Normal indoor room lightning conditions were used. The images were taken from varying angles, according to a study [16], the closer the range of angles between the images is to 90 degrees the more accurate the 3-D reconstruction. The shooting distance was set to approximately 1 m.
Since we don’t know the exact intrinsic camera parameters, some estimates were provided to the pipeline. The following equation [17] was used to estimate the focal length in pixels:
f o c a l p i x = max ( w p i x ,   h p i x ) × f o c a l m m c c d w m m ,
where, f o c a l p i x is the camera focal length in pixels, f o c a l m m is the focal length in m m , w p i x ,   h p i x is the image’s width and height in pixels and c c d w m m is the camera sensor width size in m m . Keeping the focal ratio, i.e., ( f o c a l _ m m ) / ( c c d w _ m m ) equal to 1.2 gives a good starting estimate by setting the FOV of the camera equal to 45 degrees. This is just a starting point provided for the self-calibration step that is part of the bundle adjustment step.
In order to keep the proposed procedure cost-effective, open-source libraries were explored to perform photogrammetry, such as OpenMVG [18]. A structure from motion pipeline was used to obtain a sparse point cloud, which is a 3D reconstruction pipeline that has different processing steps that allows reconstruction to happen from a series of images [19]. Photogrammetry can be performed using targets, which can be patterns or a simple dot on a paper with contrasting color. Although, this improves the accuracy, placing targets on the scene in an industrial environment is cumbersome. We avoid this step and use only feature based photogrammetry.
After the images are taken, they are used for the first step in the structure from motion pipeline, i.e., feature extraction. In this step, we used a scale invariant feature transform (SIFT) which locates key points of features in the images and assigns a descriptor to them, labeling the feature as a high dimensional vector. The algorithm is scale invariant according to Lowe [20]. This is achieved using various octave or scale levels, convolved with a blurring function. The difference of Gaussians (DOG) is then calculated to extract prominent key points in the images [20]. Once the locations of the key points are calculated, their orientations are also estimated to make it rotation invariant. Gradient magnitudes and directions are calculated using the neighboring pixels around the key points. Once the key point locations and orientations are established, feature matching takes place.
To match similar features across images, the fast cascade hashing method is used as the next step in the SfM pipeline. This is an approximate nearest neighbor (ANN) method based on hashing, which uses a three-step process to map an image into its binary code [21].
Once image matching is done, a global bundle adjustment method [22] is utilized, and a sparse point cloud obtained. The sparse point cloud then undergoes a depth map merging method using the opensource library OpenMVS [23] mentioned earlier.

2.2. Point Cloud Analysis and Registration

Position errors in the assembly line are estimated by comparing the point cloud obtained from photogrammetry with the CAD model of the assembled part. The CAD model is sampled into a point cloud data set and registered with our photogrammetry data. This registration is a two-step process, involving coarse and fine registration.

2.2.1. Coarse Registration

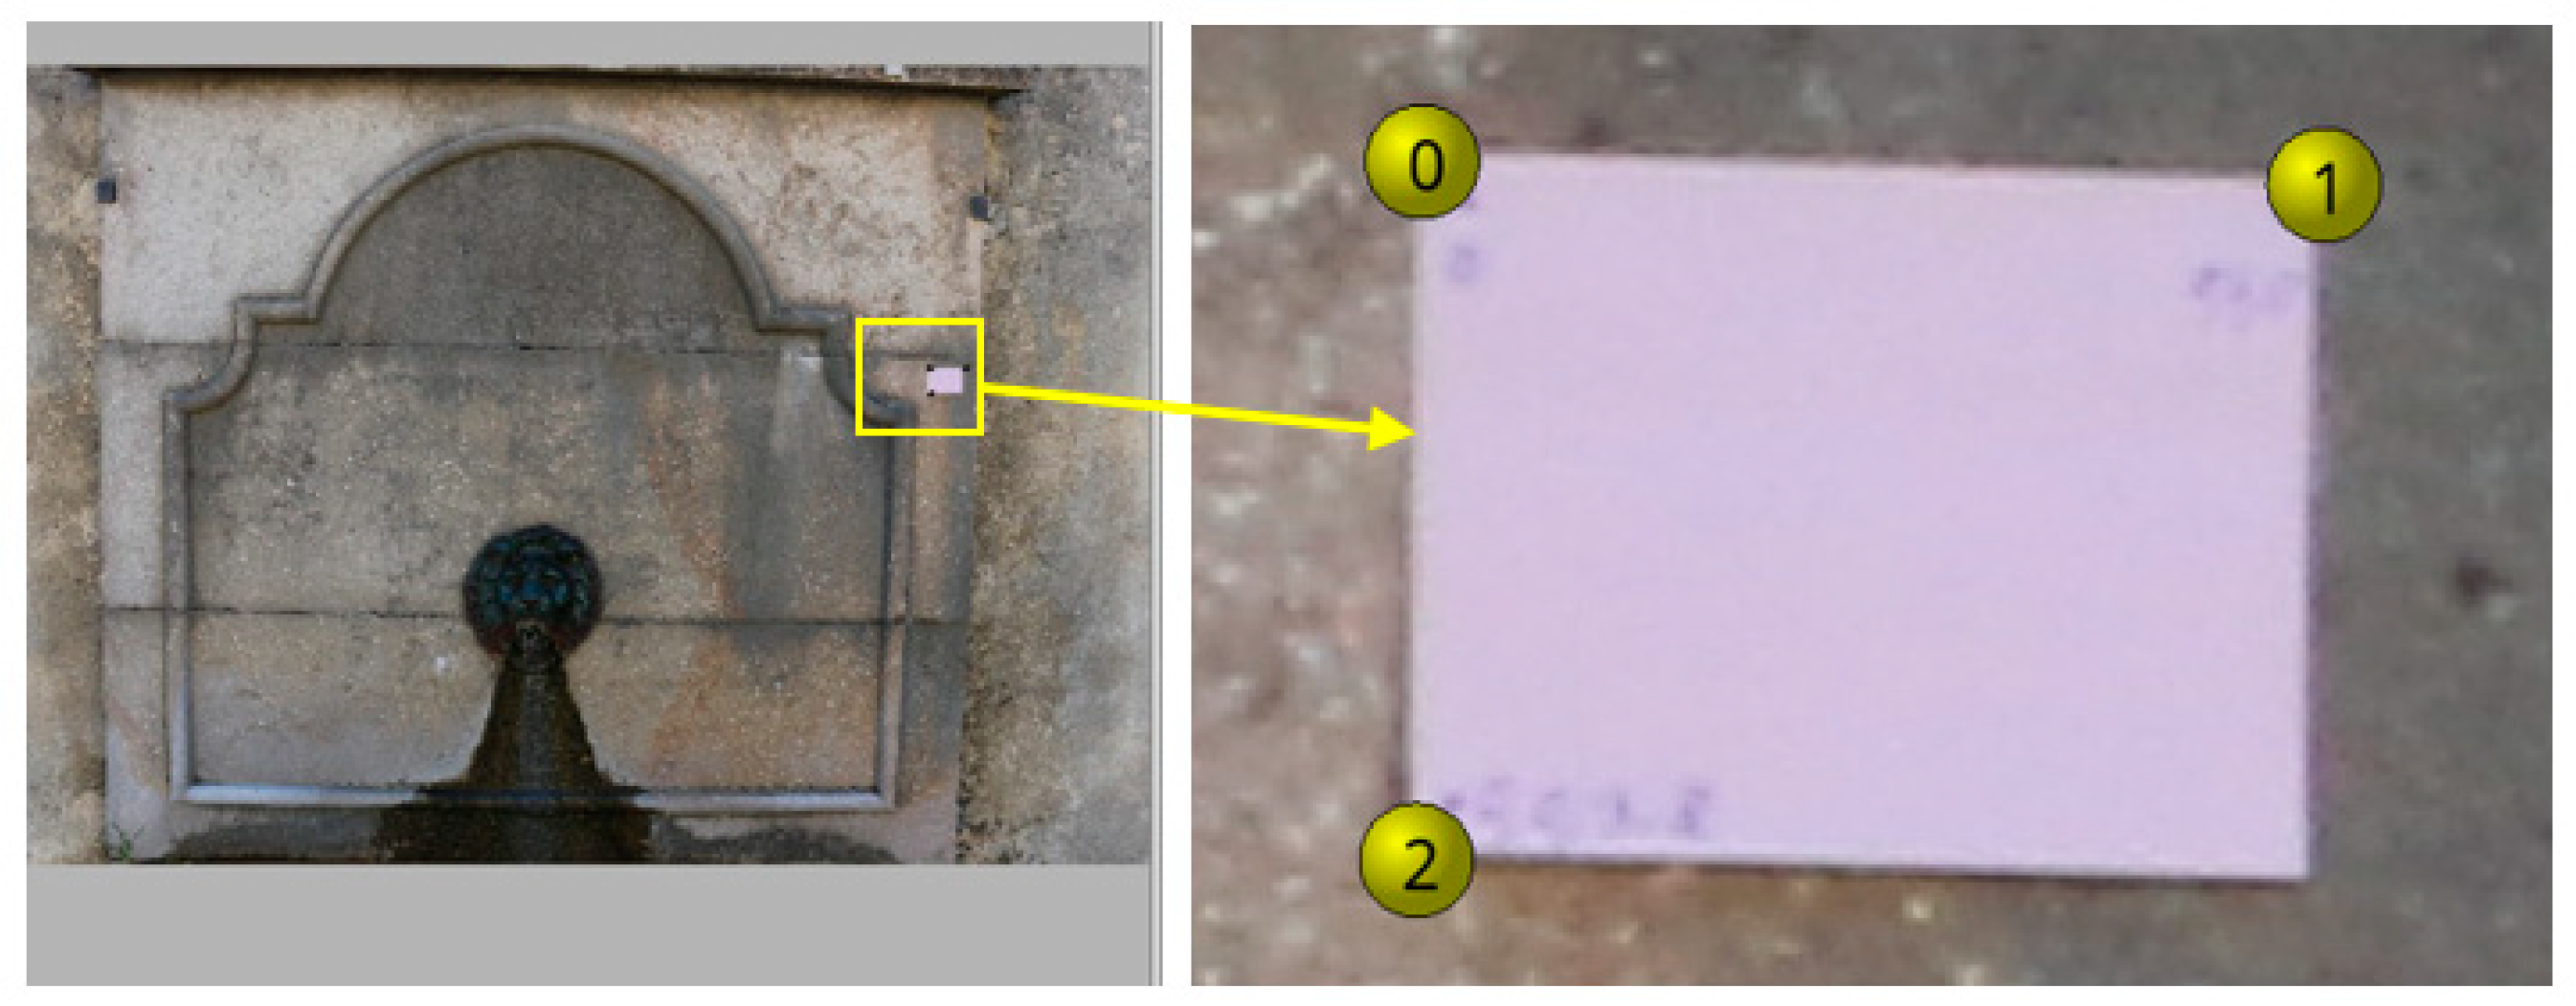
In this step the global coordinate axes of the two sources, i.e., the reference (CAD) model and data point cloud are aligned. This is not a major challenge nor the focus of this paper. Traditionally in photogrammetry, some targets are placed in the scene and used to define the scene-based coordinate system as shown in Figure 2 [24]. The small paper is placed in the scene to define the origin and the x-y axis. This position can then be matched to the coordinate system in the CAD model to align the two coordinate systems.
Another method is to use the geometry of the product itself to perform a similar alignment. In our case we used a combination of plane fitting and ICP to perform this alignment which is explained in detail in Section 3.3.

2.2.2. Fine Registration and Positional Error Estimation

Once the coordinate systems are aligned, the CAD is now superimposed with the point cloud data. The feature of interest whose position needs to be evaluated is isolated. Since we know the nominal position of the feature of interest from the CAD model, the same position ±   t   mm is used to define a volume in the point cloud data where the feature is likely to be, where t is a chosen tolerance that reflects a maximum possible position error. This volume is cropped from the point cloud data. A CAD model of only the feature of interest is then used to locate the position of the feature in the point cloud data using iterative closest point (ICP) registration [25]. This process allows position errors to be assessed for arbitrary-shaped features like bosses or links, as opposed to using algorithms designed for well-defined simple geometries like cylinders or blocks.
ICP is a point cloud registration algorithm that performs a rigid transformation by searching point-to-point correspondence between two point-cloud datasets and aligns these two datasets through iteration. The rigid transformation matrix obtained is used to transform the source data set into the new (aligned) dataset. After every iteration, a RMS (root mean square) error between the two points (target and source) is calculated, if the RMS is above a certain threshold, the above steps are continued until convergence conditions are met [26].
The CAD feature point cloud is kept as a source (moving) dataset and the photogrammetry data set is kept as the target point cloud to perform this registration. Prior to registration, the photogrammetry data set is down sampled using grid average down- sampling by setting the grid size equal to 0.5 mm [27]. This down-sampling averages the noise and improves the signal to noise of the point cloud data. The grid size is chosen to have enough points for the point cloud to adequately represent the feature of interest (a post in our example), while averaging to reduce noise as much as possible. The resulting transformation matrix captures the six degrees of freedom of the position and orientation misalignment of the feature of interest and therefore contains the position error information. Around 20,000 points were kept for the target data set and 8000 for the moving point cloud.

2.3. Augmented Reality

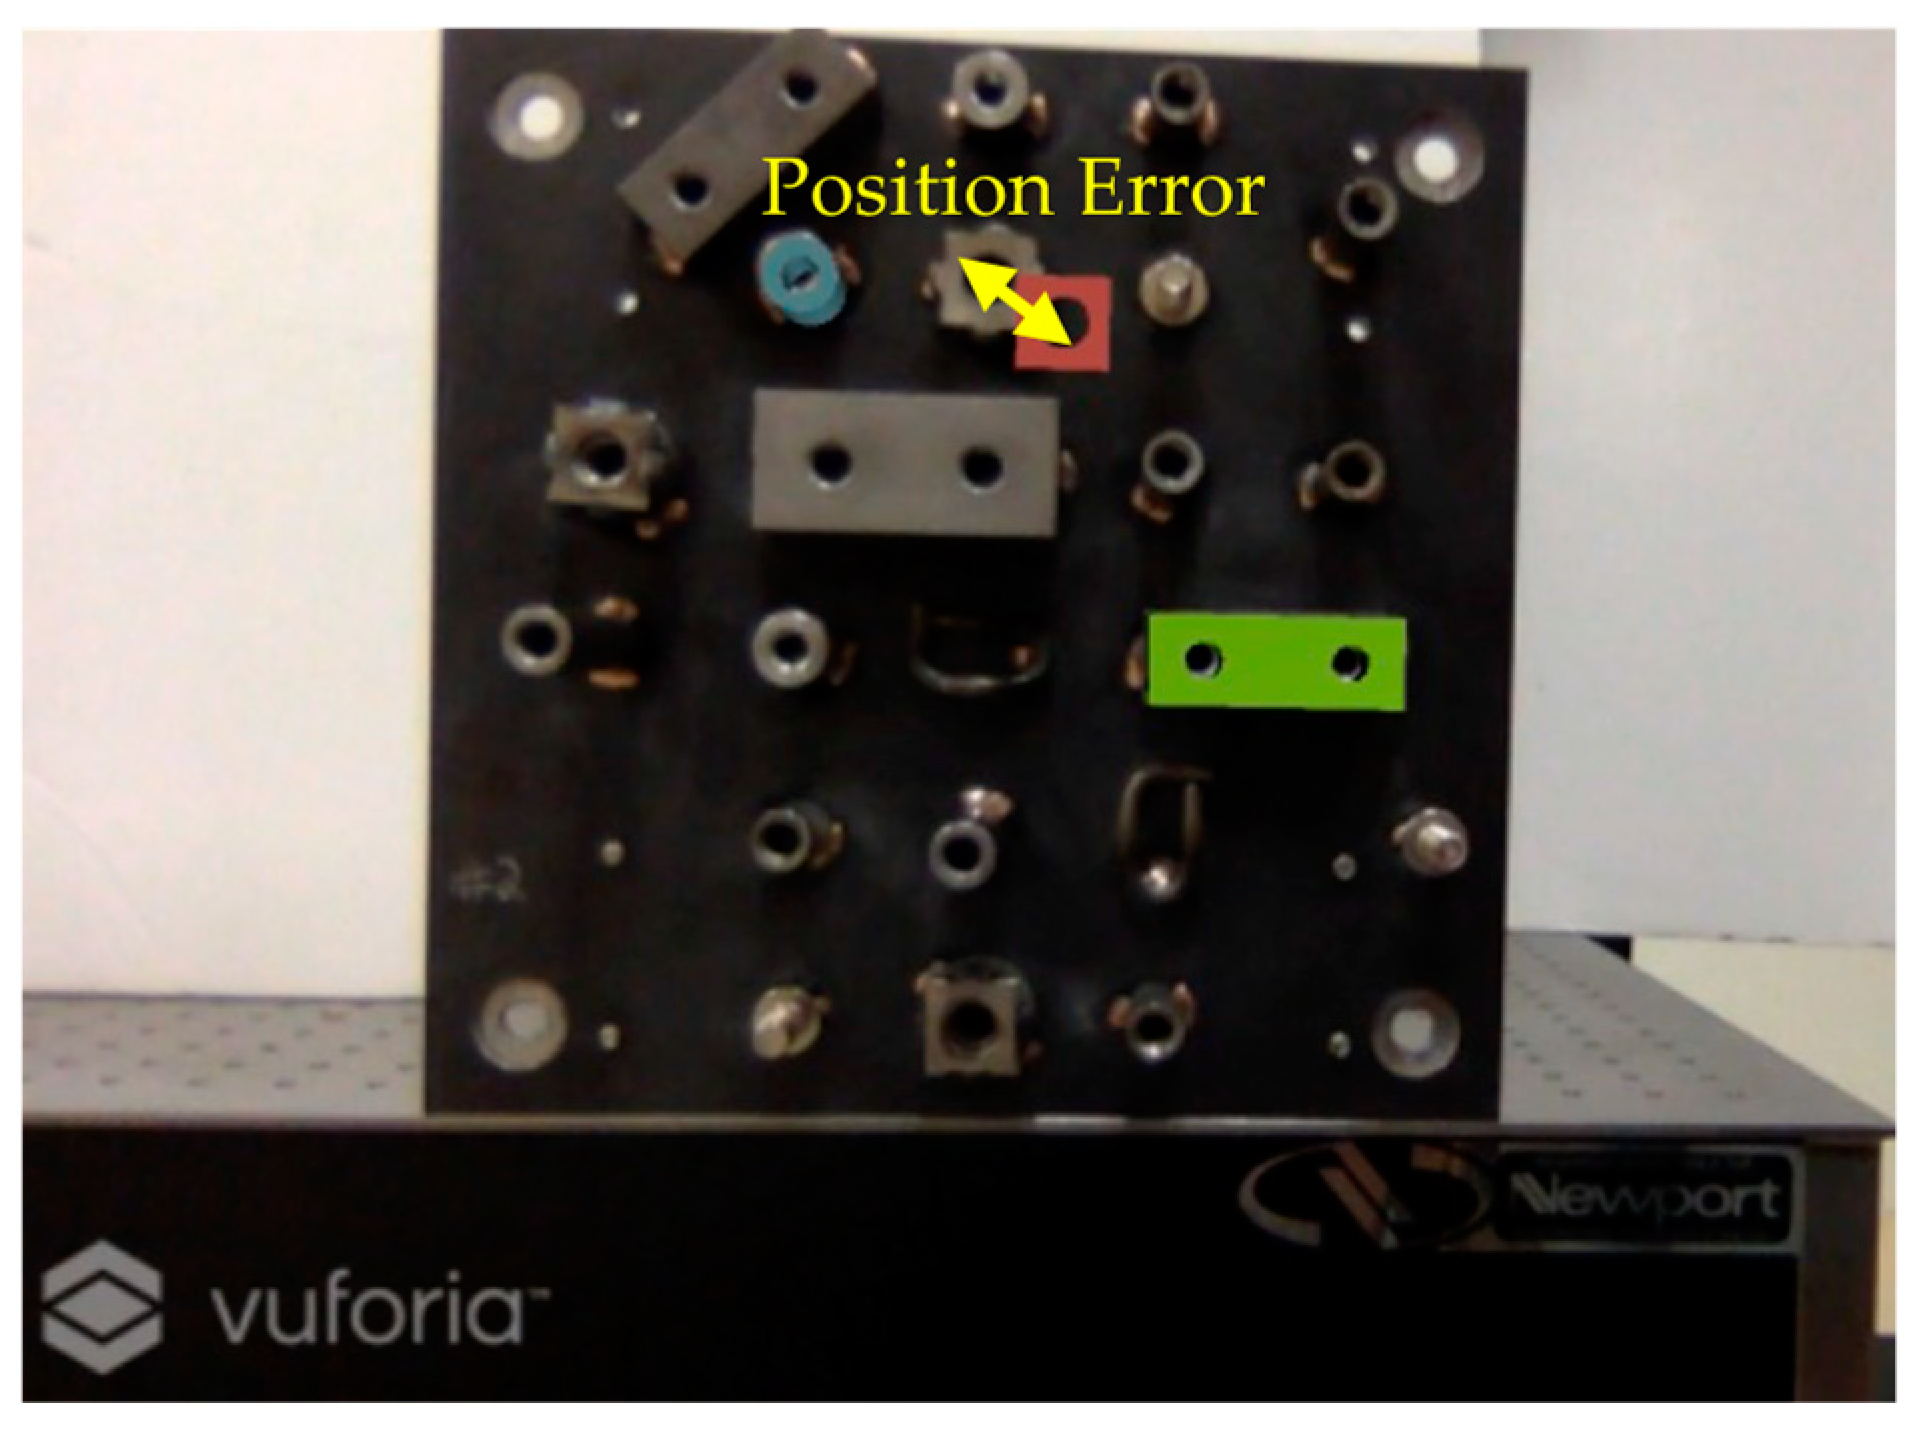
Once the positional error estimates are in hand, an augmented reality application is used to overlay the errors in real time on a live video-feed of the part. We utilized Vuforia [28], in conjunction with Unity [29] to create this application. Guide views are created using the CAD model. The guide views are used to search the live video feed for the part in the real world. Once the guide is identified in the live video feed, the CAD model of the component(s) (features of interest) for which the position error has been measured (e.g., a post) is placed in the live feed of the scene beside the real-world post in the scene and a label is added to the live feed to display the measured positioning error. Figure 3 shows the proposed pipeline to perform quality inspection.

3. Experiment and Results

3.1. Artifact Design

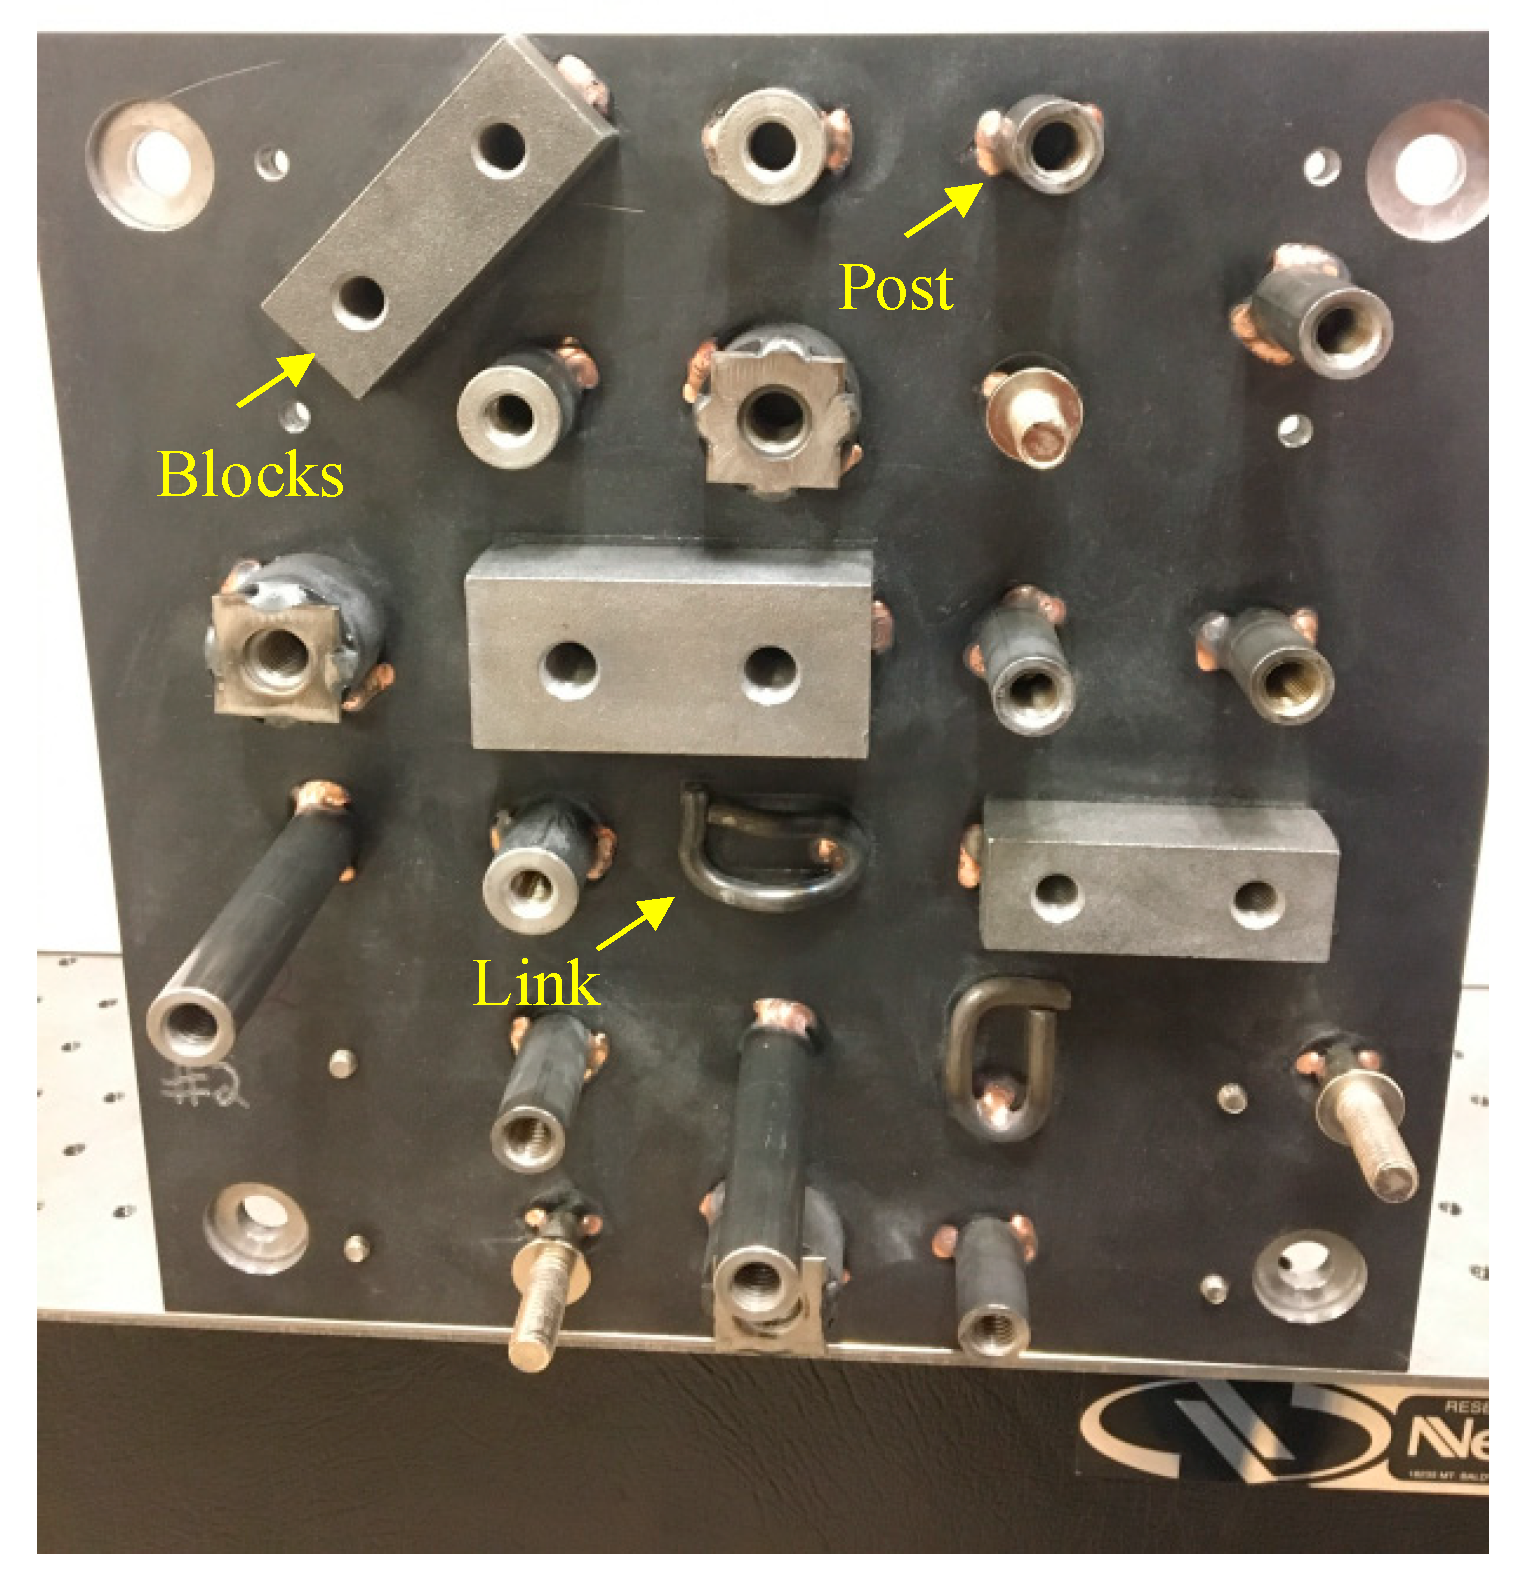
To demonstrate the process, we take an assembly application that involves welded components on a steel plate, and we fabricated a representative version with blocks, links, bosses, posts, etc., that were welded on the plate at specific locations.
Figure 4 shows the plate that was constructed. It is bolted to an optical bench representing a fixed location in an assembly line. The plate measures 30 mm by 30 mm, is made of steel, and has a rough surface texture, representative of a steel assembly in various automotive or aerospace applications. A steel plate was used simply to be consistent with a common automotive/aerospace assembly application.

3.2. Photogrammetry and Point Cloud Generation

For data acquisition, in keeping with our goal of an inexpensive and accessible system, we used a smartphone camera as described earlier in Section 2.1, to collect a sequence of images. The focal length is fixed, and 60 images of the artifact are taken from different angles with an approximate shooting distance of 1   m . As mentioned earlier, having multiple images with around 90 degrees spread and around 50% image overlap improves the reconstruction accuracy [16]. Exact knowledge of the positions of the camera for each image is not needed because this is determined through the bundle adjustment of the photogrammetry process (called camera extrinsic parameters, i.e., rotation and translation of the image plane away from the camera). For intrinsic camera parameters, the photogrammetry pipeline from OpenMVG self-calibrates the camera, using an estimated focal length mentioned in Equation (1).
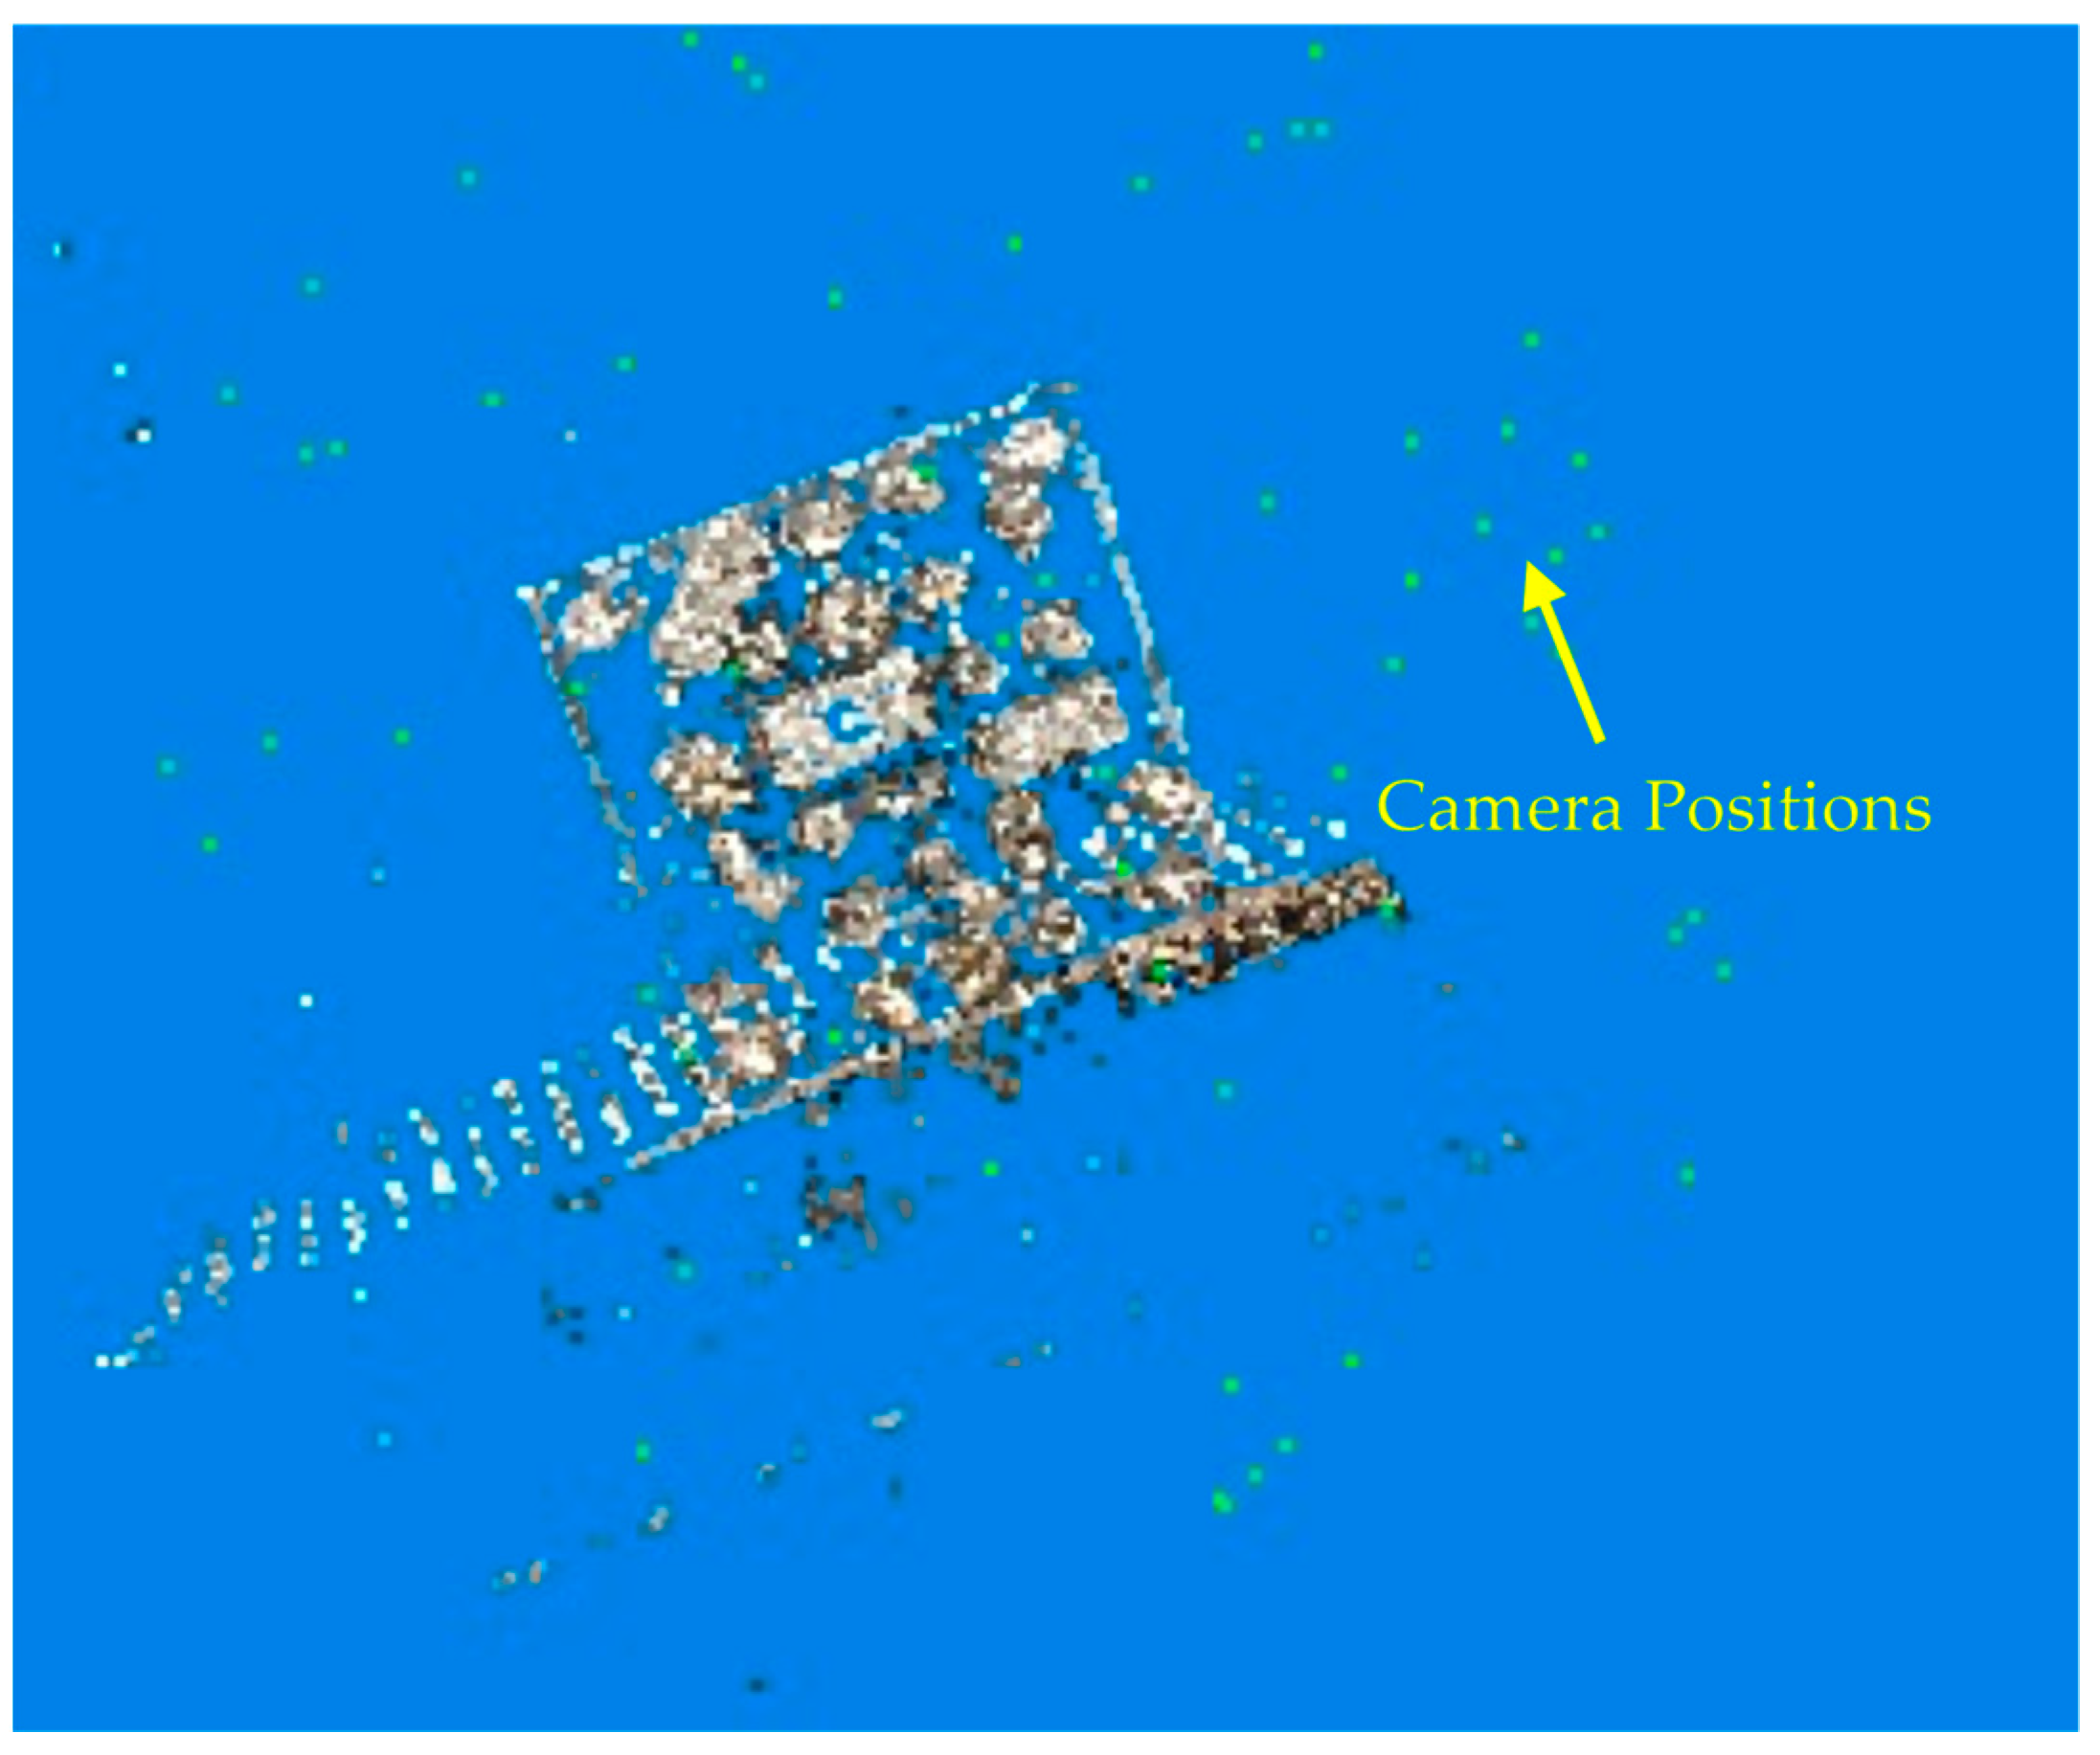
A 3-D point cloud is obtained from the 2-D images using the open source library, OpenMVG [18]. The library allows us to follow the SfM pipeline. Instead of using coded or non-coded targets that are commonly used in industry, we use the SIFT algorithm to detect features in the images. Features extracted using SIFT have shown to be robust with images with noise, changes in illumination, and across a range of affine distortion [20]. The sparse point cloud obtained using an incremental SfM pipeline is shown in Figure 5. The yellow dots in the figure show the camera positions around the artifact where the images were captured. The images must have overlapping regions to triangulate the same point in at least two images for 3D reconstruction of the point.
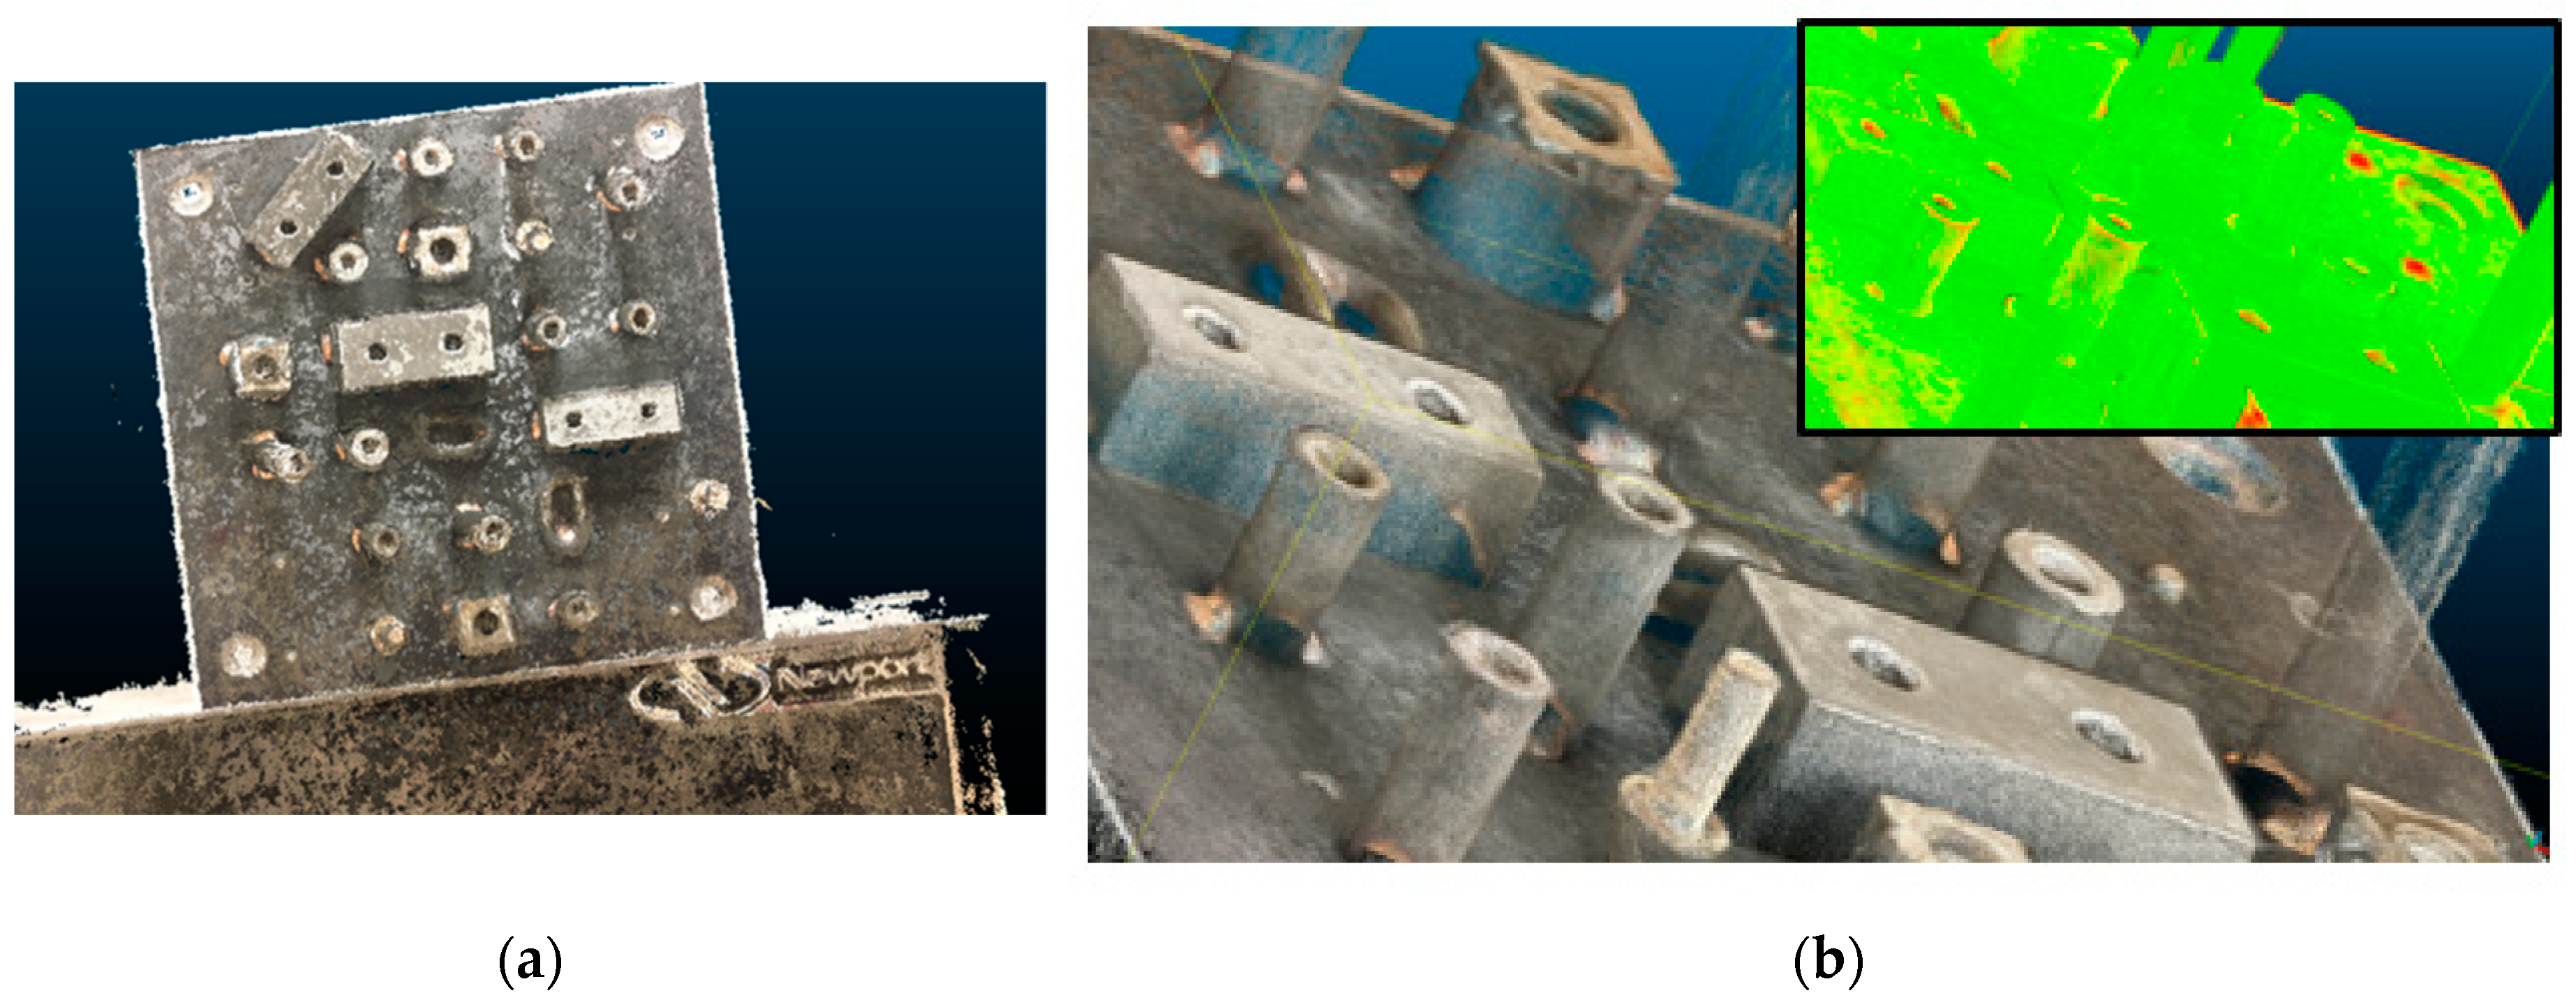
To obtain a dense point cloud, we use another library called OpenMVS [23]. A depth map merging method was performed here. This method is shown to work well on large scale objects [30]. Figure 6a shows the resulting dense point cloud. Figure 6b shows the point cloud with a distance map relative to the CAD shown in the insert. These deviations are found to lie within −0.75 mm to 0.75 mm [31].

3.3. CAD Global Coordinate System Registration

Before fine registration can take place and position errors determined, a global coordinate system must be defined, and the CAD model and the 3D photogrammetry data needs to be registered/aligned (axes and origin). This provides an aligned starting point from which the position error of features over the assembly can be evaluated. This step starts with using the plane of the steel plate to lock two degrees of freedom of the coordinate systems. The plane is extracted from the 3D point cloud data set using a least-squares best fit to the plane equation:
a x + b y + c z = d ,
where the plane normal is n = (a, b, c) and d is the distance from the origin to the plane.
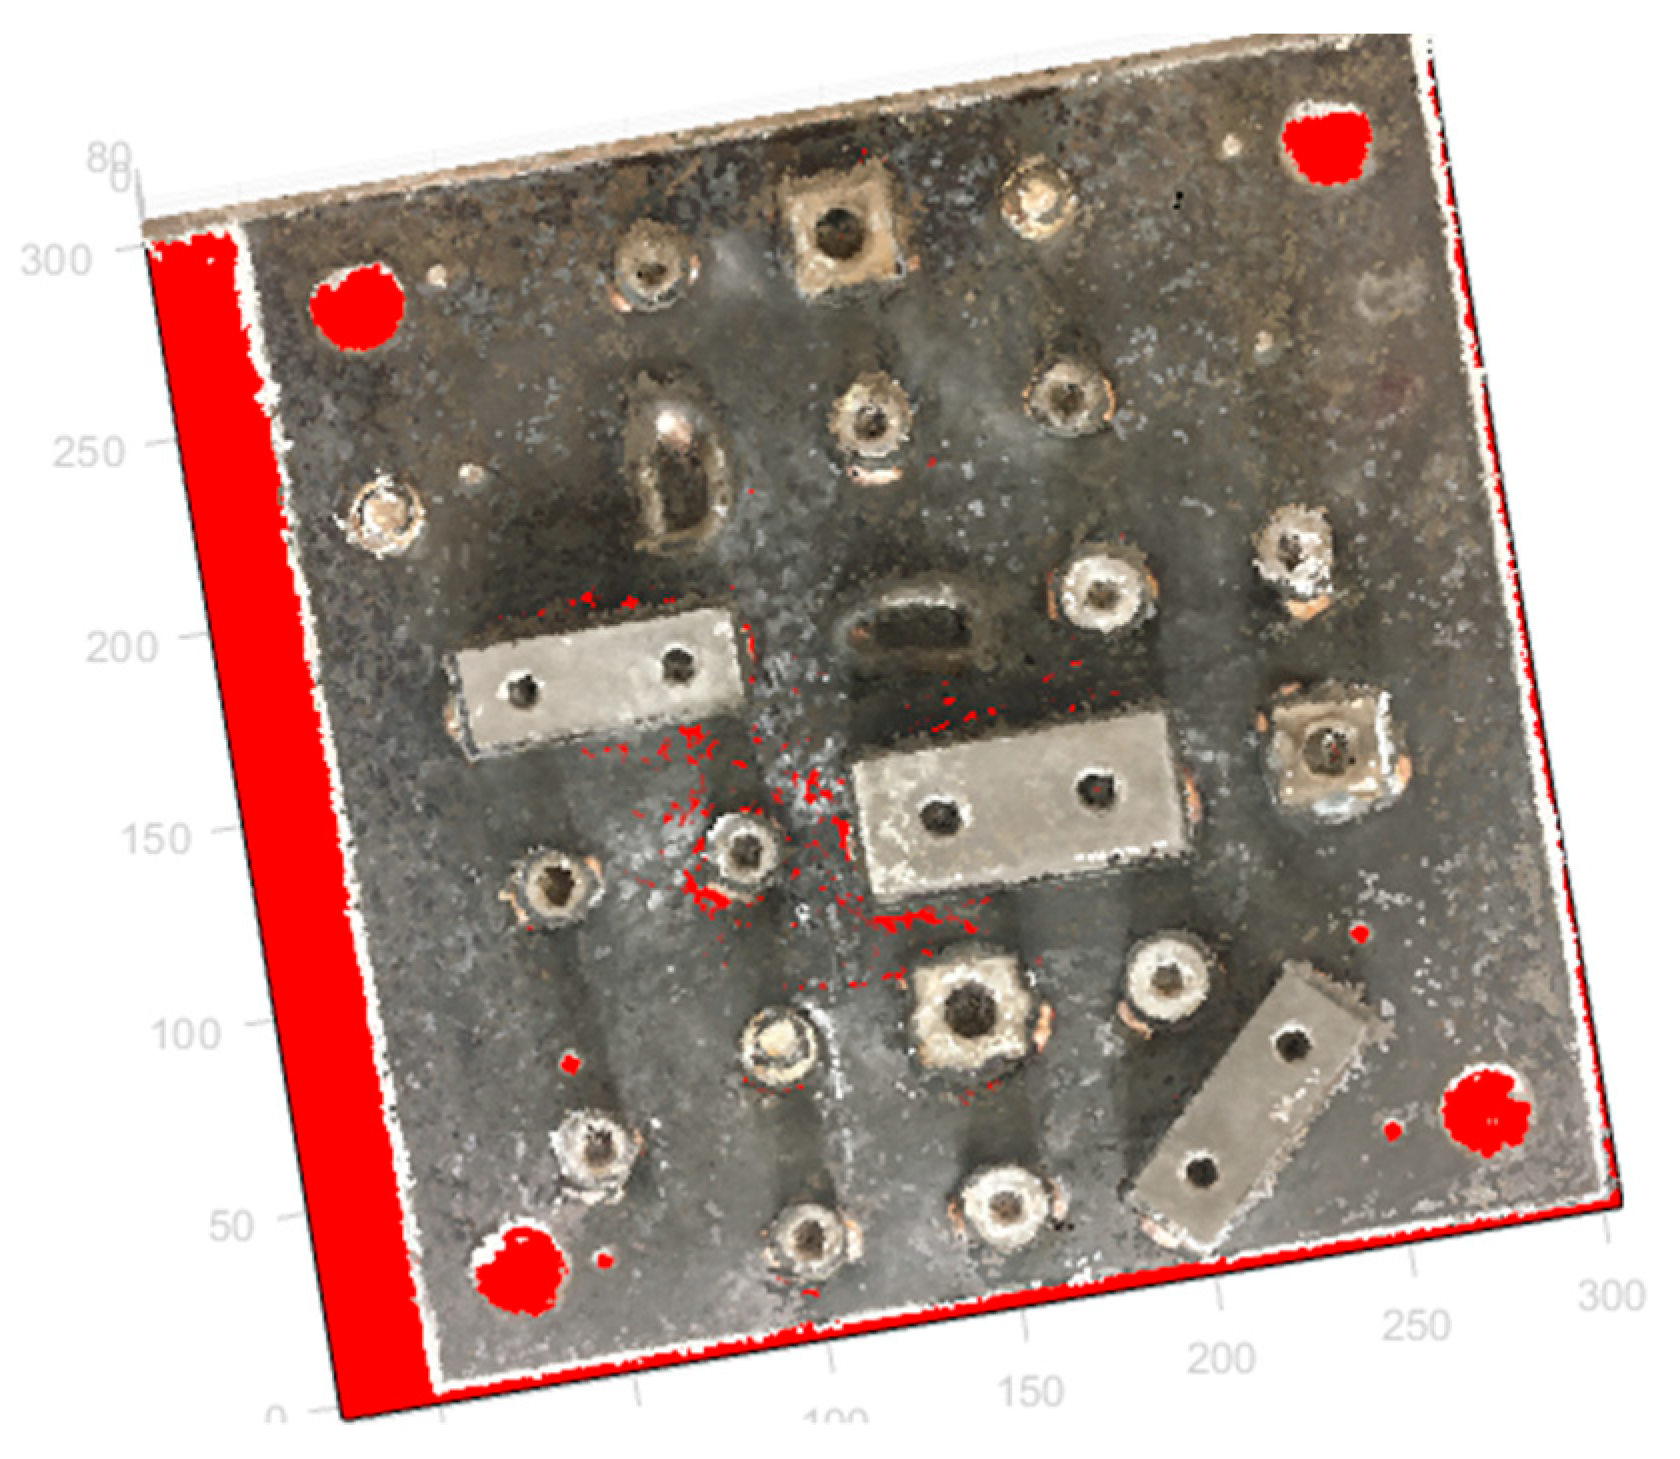
The equation is used to rotate and level the point cloud data, so the plane is aligned to the x-y axis. Figure 7 shows the best-fit plane to the extracted point-cloud plane from the data set.
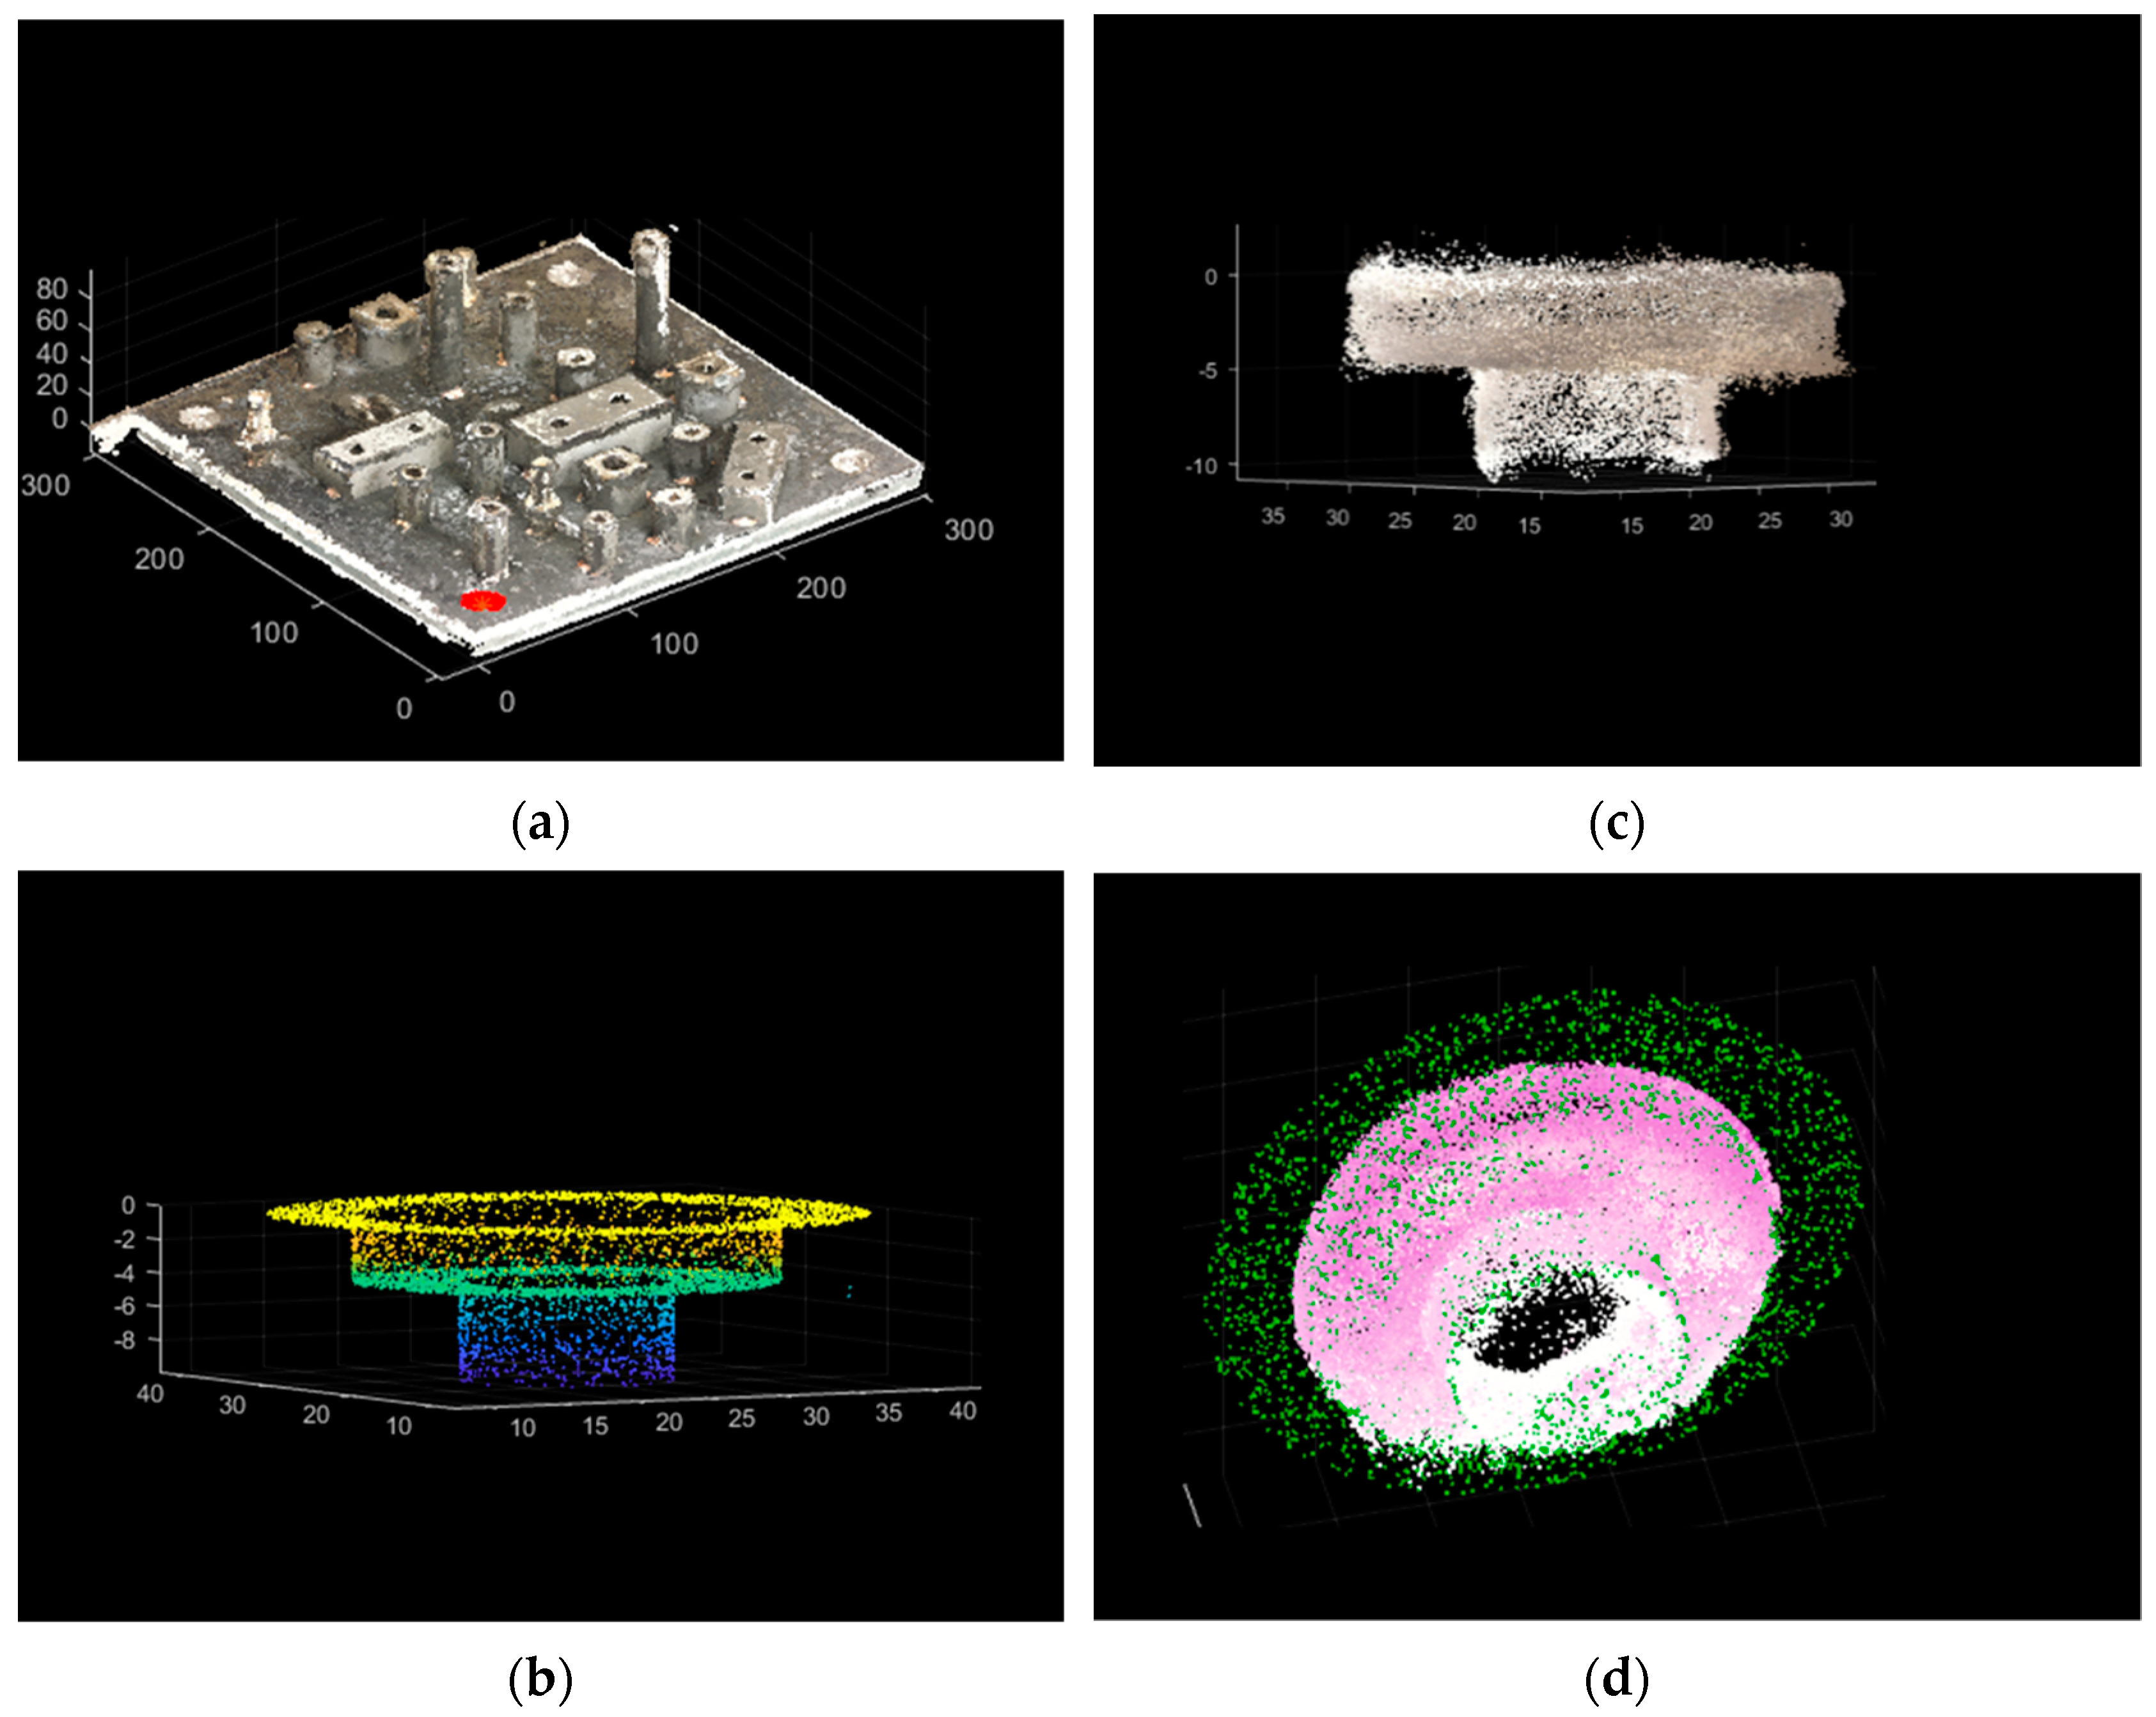
Next, the centers of two of the four holes in the plate are used to establish the origin and the x-axis. Figure 8 shows one of the corners extracted approximately using the geometrical location on the CAD model. These are then registered together using a modified ICP algorithm as shown in Figure 8d. For this ICP step, the z-axis is locked because it is defined by the already-aligned plane and only the two-translation x and y degrees of freedom are varied to align the CAD model with the data. The resulting transformation matrix then defines the location of the origin. A similar method is used with the second hole to establish an x-axis with the DOF for ICP this time kept to just rotation around the z-axis.

3.4. Position Error Estimation

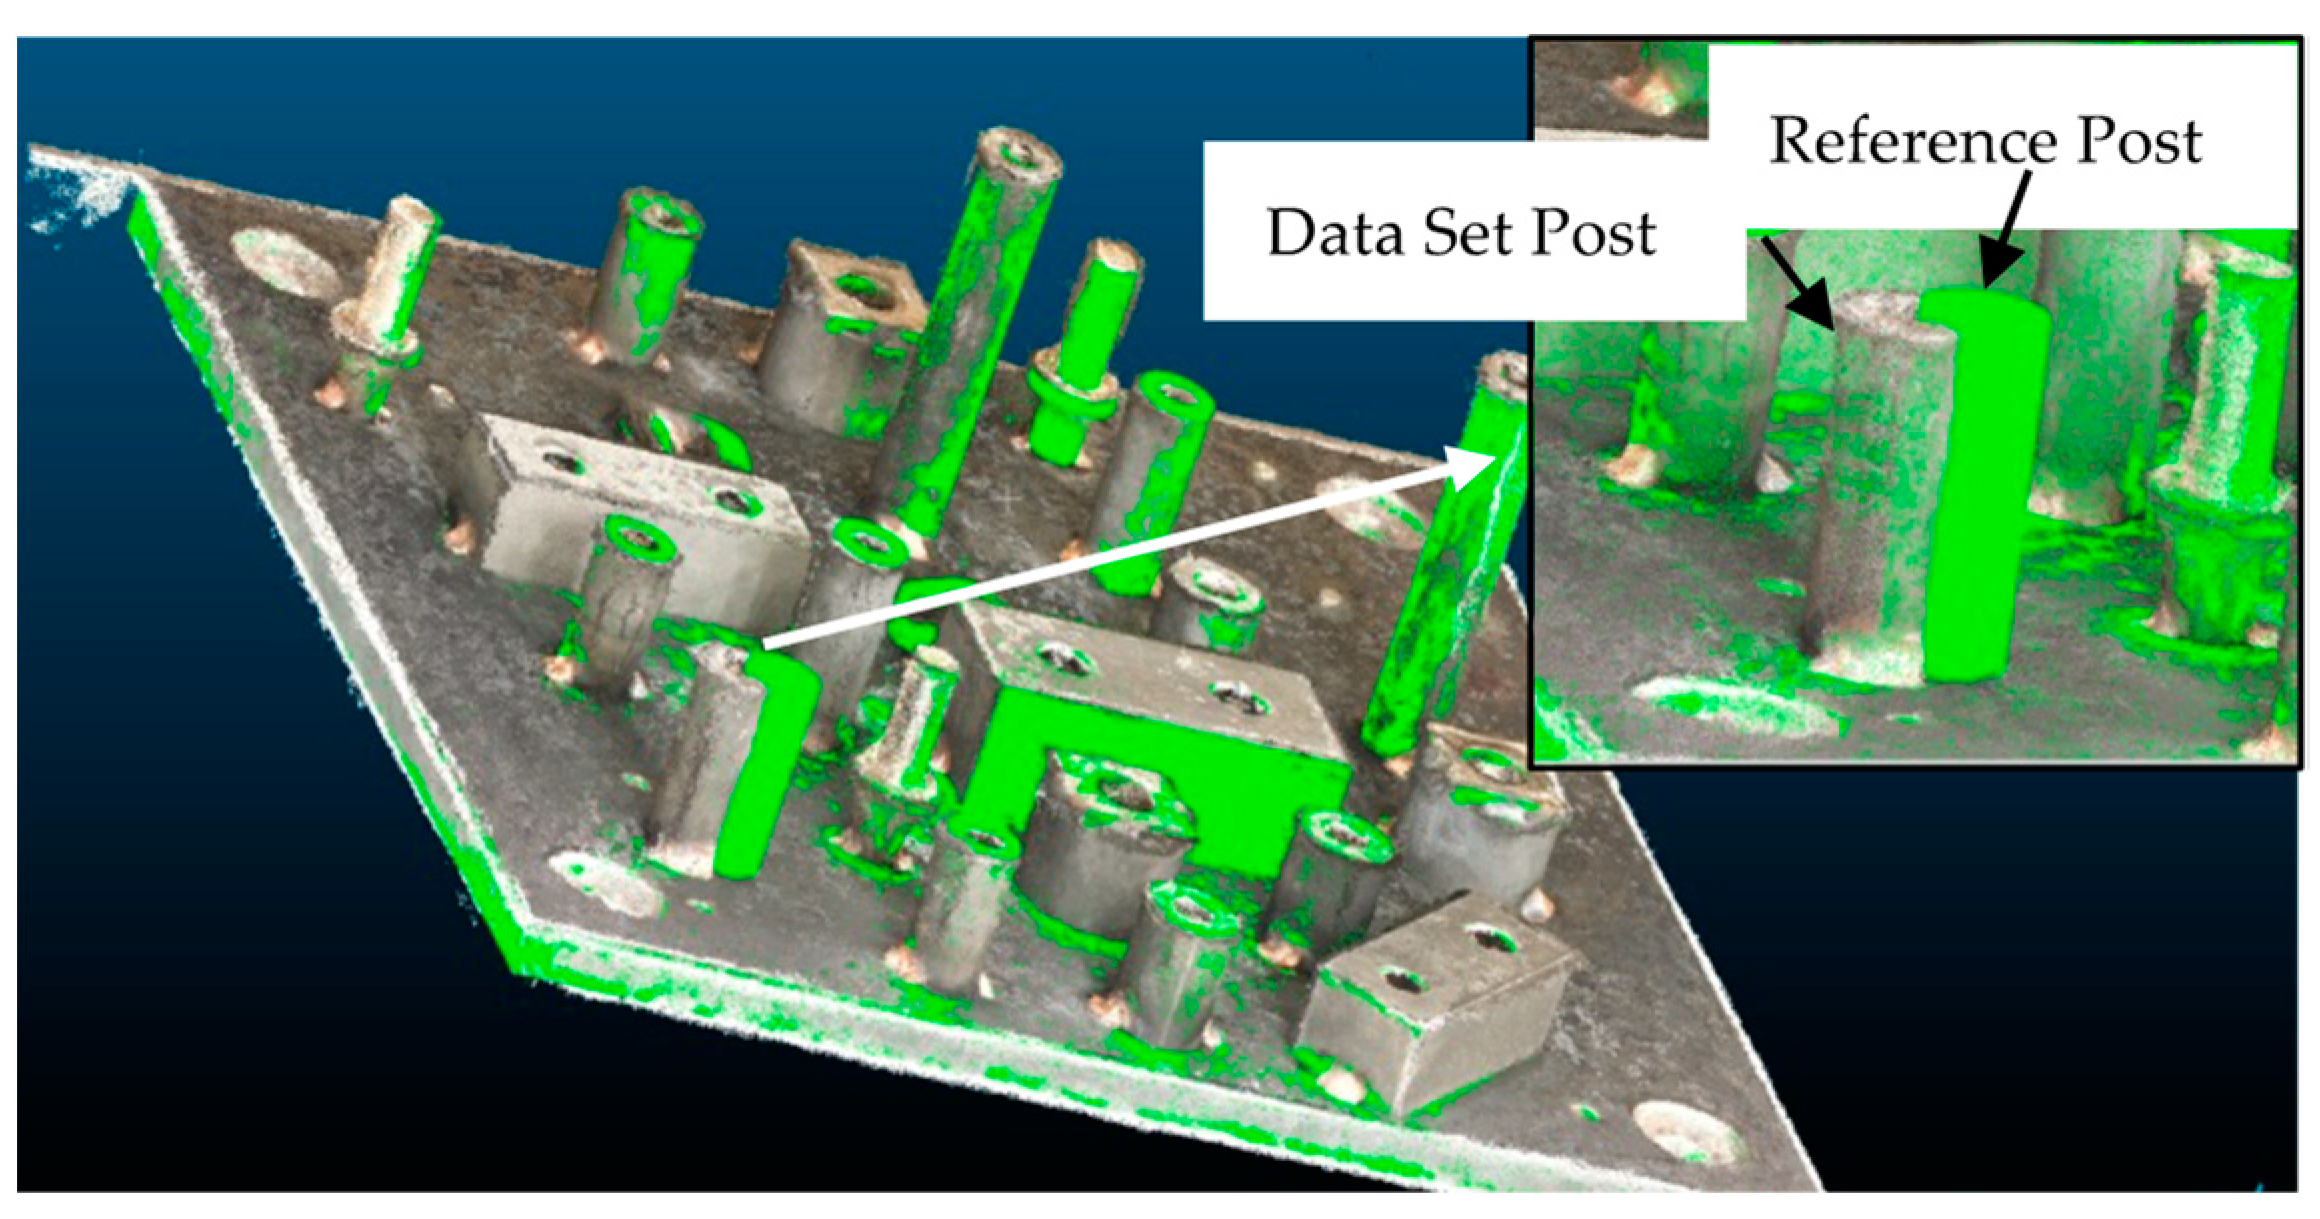
Once the 3-D point cloud is reconstructed and aligned to a global coordinate system, the positions of the components and features of interest can be compared with the CAD as reference. This is performed using the process mentioned in Section 2.2. Figure 9 shows the point cloud and the CAD registered on a global coordinate axis. To demonstrate the process, a CAD model is used with a shifted position of a post on the assembly (near the front) so a position error is clearly present and can be quantified. The figure in the insert is a higher magnification of the misplaced-post region.
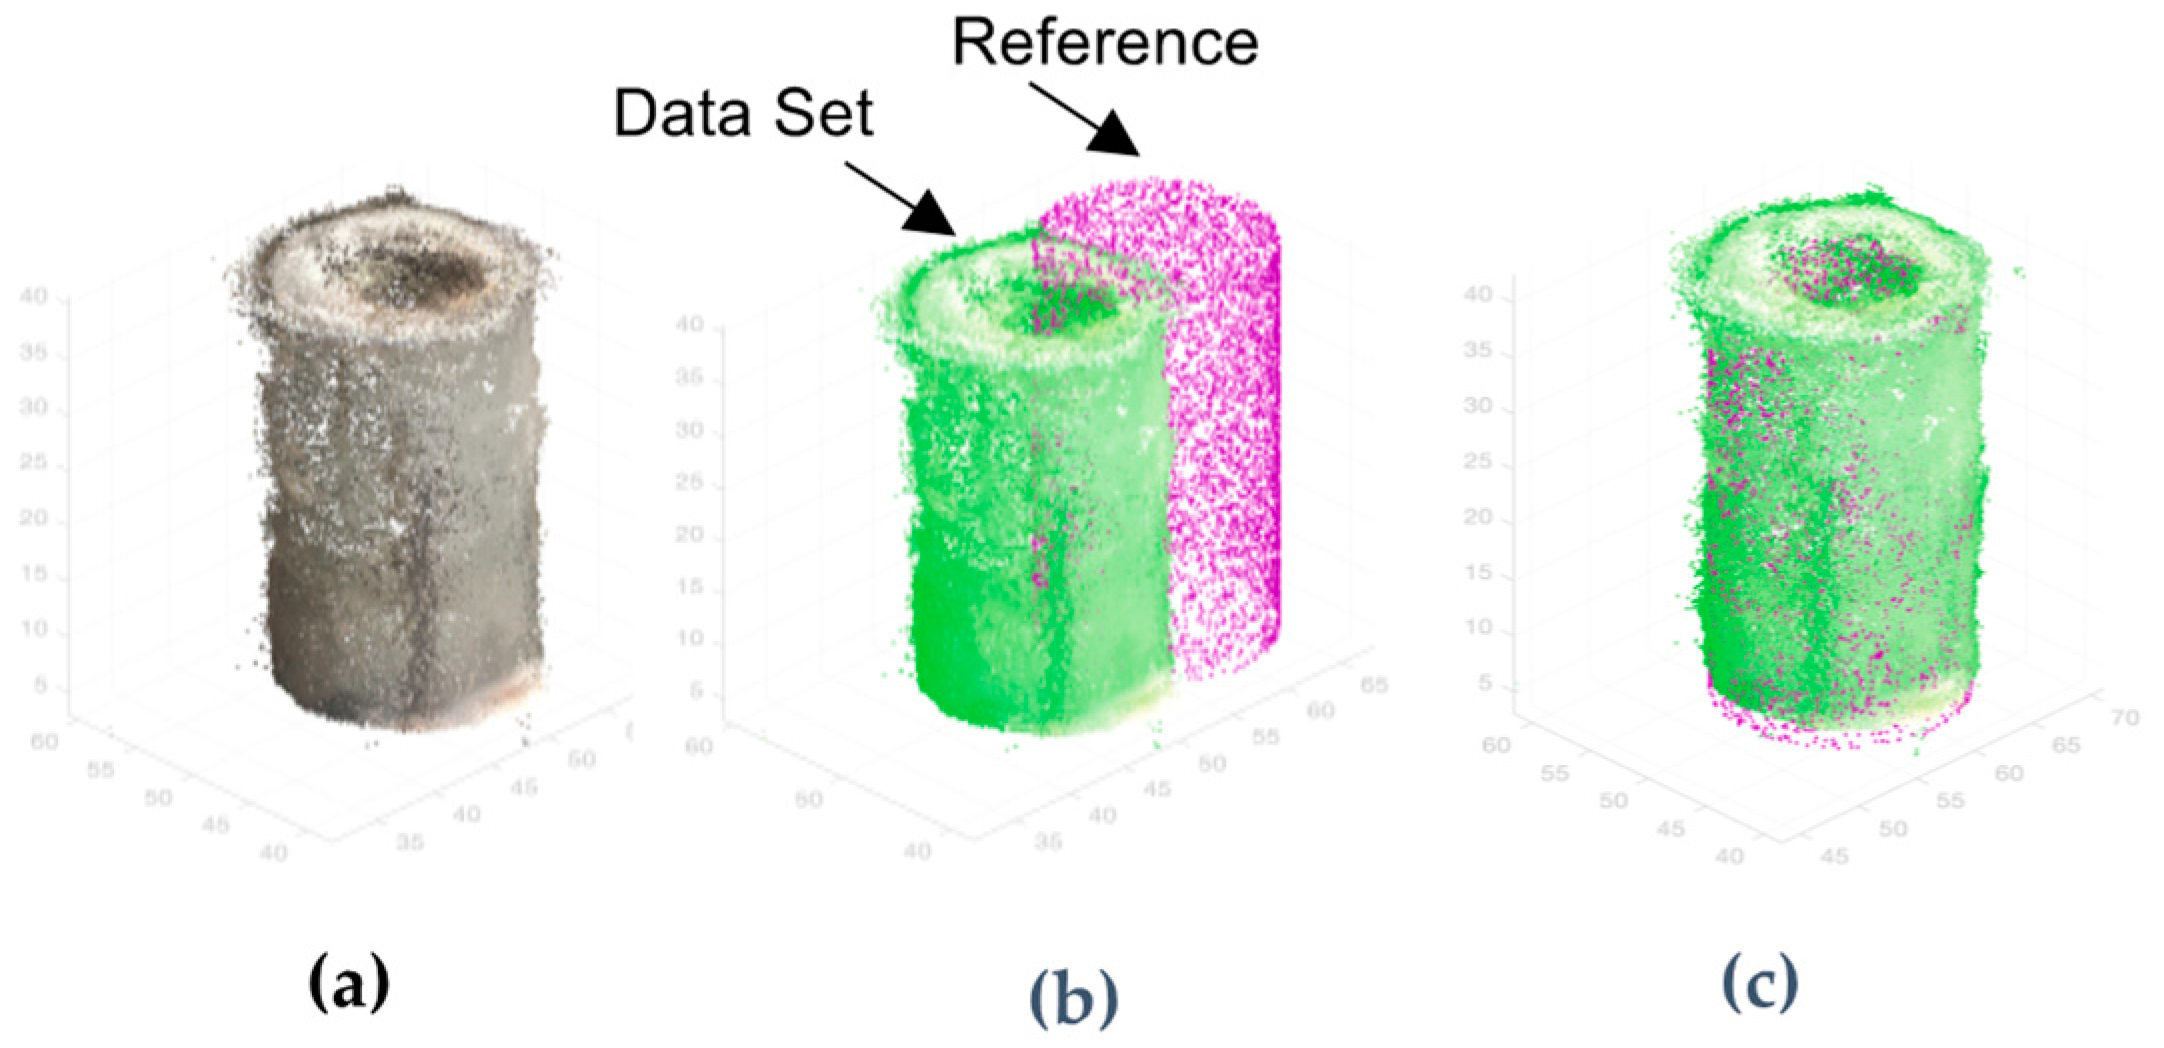
The geometrical positioning of the post in the CAD model is used to approximately select a region in the 3-D space likely to contain the post in the point cloud data set. Figure 10a shows the post isolated from the plate. Then, the fine registration ICP step with the 3D point cloud of the post and the CAD model of the post is used to determine the post position error. Figure 10b,c show the point clouds before and after ICP registration, respectively.
To check how well the registration is working for large positional deviations, the post in the reference was displaced from 1 to 9 mm. ICP was then performed and the displacement between the two posts calculated. Figure 11 shows the actual and measured positional deviations, the corresponding values are shown in Table 1. The error in the measurement falls within ±0.4 mm of the actual. This uncertainty in measurement can be improved by improving camera quality, lighting conditions, and studying the effect of noise on the measurand, among others. Further work on improving the accuracy of the results is underway.

3.5. Augmented Reality

The third and final step of our pipeline is to effectively view the dimensional deviations in real time using augmented reality. An object tracking class for the real-world model target tracking is generated using the CAD model. Figure 12a shows the guide view created from this model target. This guide view is then used to locate and track the object in the live video feed in real world using a phone camera or tablet. The guide view should contain unique features to be able to distinguish the object in the real-world environment.
Figure 12b shows a screenshot of such a live feed. Once the object is detected, the relevant position error information is displayed on the screen. Figure 13 shows a screenshot of the demonstration, after the object is detected. In this demonstration, individual CAD components were displayed in the AR environment as shown in the screenshot and any errors in assembly highlighted. This offers a more efficient and user-friendly way to perform fast quality inspection compared to looking at numeric data on an excel sheet or CAD software.

4. Discussion

Although not as accurate as commercial CMMs and laser trackers, the methodology presented is a very cost effective and easily accessible prototype for quality inspection in large scale assembly metrology where measurement uncertainty can be tolerated at the sub mm level. Furthermore, since the only on-site equipment needed is a camera, quality inspection can easily be performed in areas where CMMs and commercial grade laser trackers cannot be installed. The proposed pipeline compromises on the accuracy by providing a cost effective and user-friendly system. Increasing the number of images and improving their quality can further improve the point cloud reconstruction and thereby the position error uncertainty of the features and this work is underway. We demonstrated a positional error measurement. The same process can easily be modified to estimate other assembly errors like angle deviations. Furthermore, to study shape defects alternating forms of point cloud comparison processes can be explored, particularly object detection.
The AR component of the project helps the user in visualizing and locating the problem areas that data on a sheet cannot. In industry where quality inspection is done visually, this pipeline offers a quantitative avenue without compromising the visual aspect for the user.

5. Summary

We proposed an economical pipeline for large scale quality inspection in the industrial assembly line environment. The demonstration using an artifact showed how to estimate assembled position errors and visually display the errors for the user. Photogrammetry and dense point cloud reconstruction are performed using a series of open-source libraries. ICP was then used to perform coordinate system registration and estimate individual positional assembly errors of the feature of interest relative to the CAD model. Using a point cloud registration approach like ICP offers more flexibility compared to object detection (e.g., cylinder detection), allowing us to calculate the position of complex objects and free form bodies. Augmented reality was effectively employed to create an application to display the relevant information for the user using a smart phone camera or tablet.
The presented work shows that we have a viable pipeline in place. Work is underway to reduce the uncertainty of our results. This involves studying the effect of noise on the measurand as well as removing any bias present due to noise. Improving initial point cloud reconstruction is another avenue to explore.

Author Contributions

Conceptualization, A.D.A. and R.N.; Methodology, R.N. and A.D.A.; Software, R.N.; Validation, R.N.; Formal Analysis, R.N. and A.D.A.; Investigation, R.N.; Resources, A.D.A.; Data Curation, R.N.; Writing—Original Draft Preparation, R.N.; Writing—Review and Editing, A.D.A. and R.N.; Visualization, R.N. and A.D.A.; Supervision, A.D.A.; Project Administration, A.D.A.; Funding Acquisition, A.D.A. All authors have read and agreed to the published version of the manuscript.

Funding

This research was funded by the Center for Precision Metrology at University of North Carolina at Charlotte.

Institutional Review Board Statement

Not applicable.

Informed Consent Statement

Not applicable.

Data Availability Statement

Not applicable.

Acknowledgments

We thank Nien Lee (Industry Affiliate of the Center for Precision Metrology) for providing technical support, conceptualization ideas and formal analysis.

Conflicts of Interest

The authors declare no conflict of interest.

References

  1. Babic, M.; Farahani, M.A.; Wuest, T. Image Based Quality Inspection in Smart Manufacturing Systems: A Literature Review. Procedia CIRP 2021, 103, 262–267. [Google Scholar] [CrossRef]
  2. Pérez, L.; Rodríguez, Í.; Rodríguez, N.; Usamentiaga, R.; García, D. Robot Guidance Using Machine Vision Techniques in Industrial Environments: A Comparative Review. Sensors 2016, 16, 335. [Google Scholar] [CrossRef] [PubMed]
  3. Moon, D.; Chung, S.; Kwon, S.; Seo, J.; Shin, J. Comparison and utilization of point cloud generated from photogrammetry and laser scanning: 3D world model for smart heavy equipment planning. Autom. Constr. 2019, 98, 322–331. [Google Scholar] [CrossRef]
  4. Li, J.; Berglund, J.; Auris, F.; Hanna, A.; Vallhagen, J.; Åkesson, K. Evaluation of Photogrammetry for Use in Industrial Production Systems. In Proceedings of the IEEE 14th International Conference on Automation Science and Engineering (CASE), Munich, Germany, 20–24 August 2018; pp. 414–420. [Google Scholar] [CrossRef]
  5. Sioma, A. 3D imaging methods in quality inspection systems. In Photonics Applications in Astronomy, Communications, Industry, and High-Energy Physics Experiments 2019; Proceedings of the Photonics Applications in Astronomy, Communications, Industry, and High-Energy Physics Experiments 2019, Wilga, Poland, 27 May–2 June 2019; SPIE: Bellingham, WA, USA, 2019; p. 91. [Google Scholar] [CrossRef]
  6. Luhmann, T. Close range photogrammetry for industrial applications. ISPRS J. Photogramm. Remote Sens. 2010, 65, 558–569. [Google Scholar] [CrossRef]
  7. Wang, Q.; Kim, M.-K. Applications of 3D point cloud data in the construction industry: A fifteen-year review from 2004 to 2018. Adv. Eng. Inform. 2019, 39, 306–319. [Google Scholar] [CrossRef]
  8. González-Jorge, H.; Riveiro, B.; Arias, P.; Armesto, J. Photogrammetry and laser scanner technology applied to length measurements in car testing laboratories. Measurement 2012, 45, 354–363. [Google Scholar] [CrossRef]
  9. Geodetic Systems, Inc. Reports. Available online: https://www.geodetic.com/resources/reports/ (accessed on 31 August 2021).
  10. Aldao, E.; González-Jorge, H.; Pérez, J.A. Metrological comparison of LiDAR and photogrammetric systems for deformation monitoring of aerospace parts. Measurement 2021, 174, 109037. [Google Scholar] [CrossRef]
  11. Wang, X.; Ong, S.K.; Nee, A.Y.C. A comprehensive survey of augmented reality assembly research. Adv. Manuf. 2016, 4, 1–22. [Google Scholar] [CrossRef]
  12. de Souza Cardoso, L.F.; Mariano, F.C.M.Q.; Zorzal, E.R. A survey of industrial augmented reality. Comput. Ind. Eng. 2020, 139, 106159. [Google Scholar] [CrossRef]
  13. Fraunhofer IGD. Quality Checks with Augmented Reality. Available online: https://www.igd.fraunhofer.de/en/press/news/quality-checks-augmented-reality (accessed on 31 August 2021).
  14. FARO. Visual Inspect Augmented Reality; FARO: Lake Mary, FL, USA, 2017; Available online: https://www.faro.com/en/Products/Software/Visual-Inspect-Augmented-Reality (accessed on 31 August 2021).
  15. PTC. Creo Parametric 3D Modeling Software; PTC: Boston, MA, USA, 2011; Available online: https://www.ptc.com/en/products/creo/parametric (accessed on 19 February 2022).
  16. Dai, F.; Lu, M. Photo-Based 3D modeling of construction resources for visualization of operations simulation: Case of modeling a precast façade. In Proceedings of the 2008 Winter Simulation Conference, Miami, FL, USA, 7–10 December 2008; pp. 2439–2446. [Google Scholar] [CrossRef]
  17. OpenMVG_Main_SfMInit_ImageListing—OpenMVG Library. Available online: https://openmvg.readthedocs.io/en/latest/software/SfM/SfMInit_ImageListing/ (accessed on 18 February 2022).
  18. openMVG. OpenMVG (Open Multiple View Geometry). 2021. Available online: https://github.com/openMVG/openMVG (accessed on 31 August 2021).
  19. Bianco, S.; Ciocca, G.; Marelli, D. Evaluating the Performance of Structure from Motion Pipelines. J. Imaging 2018, 4, 98. [Google Scholar] [CrossRef] [Green Version]
  20. Lowe, D.G. Distinctive Image Features from Scale-Invariant Keypoints. Int. J. Comput. Vis. 2004, 60, 91–110. [Google Scholar] [CrossRef]
  21. Cheng, J.; Leng, C.; Wu, J.; Cui, H.; Lu, H. Fast and Accurate Image Matching with Cascade Hashing for 3D Reconstruction. In Proceedings of the IEEE Conference on Computer Vision and Pattern Recognition, Columbus, OH, USA, 23–28 June 2014; pp. 1–8. [Google Scholar] [CrossRef] [Green Version]
  22. Moulon, P.; Monasse, P.; Marlet, R. Global Fusion of Relative Motions for Robust, Accurate and Scalable Structure from Motion. In Proceedings of the IEEE International Conference on Computer Vision, Sydney, Australia, 1–8 December 2013; pp. 3248–3255. [Google Scholar] [CrossRef] [Green Version]
  23. cDc. OpenMVS: Open Multi-View Stereo Reconstruction Library. 2021. Available online: https://github.com/cdcseacave/openMVS (accessed on 31 August 2021).
  24. Ground Control Points Registration—OpenMVG Library. Available online: https://openmvg.readthedocs.io/en/latest/software/ui/SfM/control_points_registration/GCP/ (accessed on 18 February 2022).
  25. Register Two Point Clouds Using ICP Algorithm—MATLAB Pcregistericp. Available online: https://www.mathworks.com/help/vision/ref/pcregistericp.html (accessed on 25 September 2021).
  26. Li, P.; Wang, R.; Wang, Y.; Tao, W. Evaluation of the ICP Algorithm in 3D Point Cloud Registration. IEEE Access 2020, 8, 68030–68048. [Google Scholar] [CrossRef]
  27. Downsample a 3-D Point Cloud—MATLAB Pcdownsample. Available online: https://www.mathworks.com/help/vision/ref/pcdownsample.html#References (accessed on 18 February 2022).
  28. Getting Started with Vuforia Engine in Unity. VuforiaLibrary. Available online: https://library.vuforia.com/getting-started/getting-started-vuforia-engine-unity (accessed on 31 August 2021).
  29. Unity Technologies. Unity Real-Time Development Platform. 3D, 2D VR & AR Engine. Available online: https://unity.com/ (accessed on 6 September 2021).
  30. Shen, S. Depth-Map merging for Multi-View Stereo with high resolution images. In Proceedings of the 21st International Conference on Pattern Recognition (ICPR2012), Tsukuba, Japan, 11–15 November 2012; pp. 788–791. [Google Scholar]
  31. CloudCompare—Open Source Project. Available online: https://www.danielgm.net/cc/ (accessed on 24 September 2021).
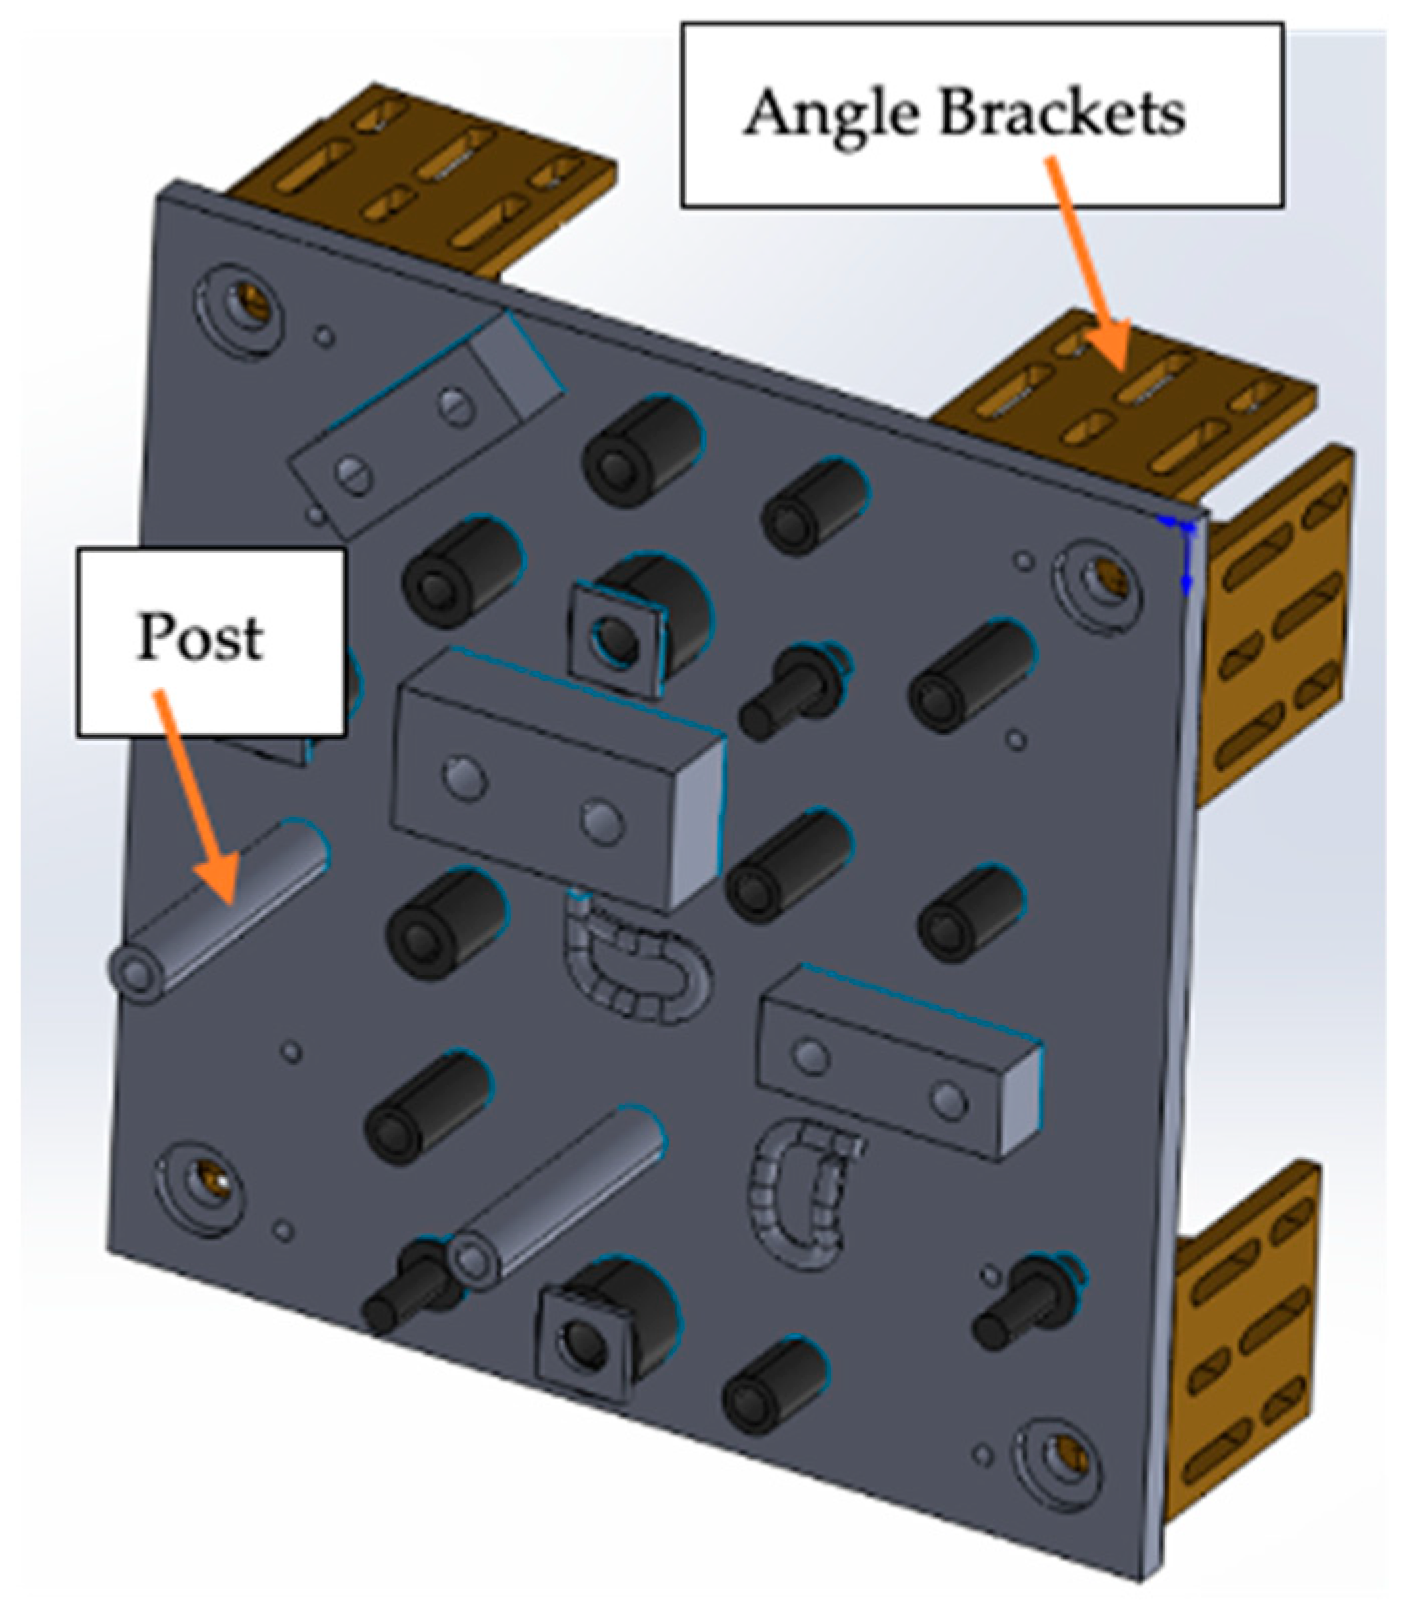
Figure 1. CAD model of the artifact to resemble assembly line features.
Machines 10 00243 g001
Figure 2. Coordinate system alignment using targets placed in the scene, corners of the target are used to lock the origin and the x-y plane.
Machines 10 00243 g002
Figure 3. Flow chart of the proposed pipeline.
Machines 10 00243 g003
Figure 4. Plate constructed using the CAD design, individual features were welded on to the plate, this plate will be used to demonstrate the pipeline.
Machines 10 00243 g004
Figure 5. Sparse point cloud generated using photogrammetry, showing camera positions where the images were taken from.
Machines 10 00243 g005
Figure 6. (a) Dense point cloud, (b) Close-up of the point cloud with distance map in the insert.
Machines 10 00243 g006
Figure 7. Plane fitting done on the dense point cloud to lock in the x-y.
Machines 10 00243 g007
Figure 8. Corner circles on the plate being used for global coordinate system registration. (a) The circle feature shown on the dense point cloud, (b) CAD model’s point cloud of the feature, (c) point cloud extracted from the photogrammetry data set of the same circle, (d) The two point clouds after ICP registration.
Machines 10 00243 g008
Figure 9. Point cloud superimposed with the CAD model, the insert shows a magnified misplaced-post region.
Machines 10 00243 g009
Figure 10. (a) Post isolated as a feature of interest, (b) point cloud and reference data set before registration and (c) after registration.
Machines 10 00243 g010
Figure 11. The actual simulated displacement error present plotted against the calculated position of the post in the photogrammetry data set.
Machines 10 00243 g011
Figure 12. (a) Guide view created from the CAD model, (b) the guide view being used to detect the object in a live video feed.
Machines 10 00243 g012
Figure 13. Augmented reality application demonstration, the individual parts are displayed on the screen after object detection and any potential defects highlighted.
Machines 10 00243 g013
Table 1. Actual displacement values vs. calculated displacement values of the post from its reference (CAD) position.
Actual Displacement between
the Posts in x/mm
Calculated Displacement between
the Posts/mm
1.01.2
2.01.8
3.02.9
4.03.9
5.05.4
6.05.9
7.07.0
8.08.4
9.08.7
Publisher’s Note: MDPI stays neutral with regard to jurisdictional claims in published maps and institutional affiliations.