Article

The Effect of Rotating Speeds on the Cavitation Characteristics in Hydraulic Torque Converter

1
School of Mechanical Engineering, Beijing Institute of Technology, Beijing 100081, China
2
Faculty of Engineering, National University of Singapore, Singapore 119260, Singapore
3
Chongqing Innovation Center, Beijing Institute of Technology, Chongqing 401135, China
4
Institute of Advanced Technology, Beijing Institute of Technology, Jinan 250307, China
5
National Key Laboratory for Vehicular Transmission, Beijing Institute of Technology, Beijing 100081, China
*
Author to whom correspondence should be addressed.
Machines 2022, 10(2), 80; https://doi.org/10.3390/machines10020080
Submission received: 23 December 2021 / Revised: 18 January 2022 / Accepted: 20 January 2022 / Published: 23 January 2022
(This article belongs to the Section Turbomachinery)

Abstract

:
Hydraulic torque converter is a kind of high speed rotating machine using viscosity hydraulic oil as working medium, and its internal flow field is very complex. Thereby cavitation can occur easily in the working process, resulting in severe degradation of torque converter performance, noise, vibration and even failure. In order to reveal the effect of rotating speeds on the cavitation characteristics, a full flow passage geometry and a computational fluid dynamics (CFD) model with cavitation were developed to analyze the flow behavior in the torque converter. The results show that cavitation occurs when the speed difference between pump and turbine exceeds 1400 rpm for the basic model torque converter, which could be used as a useful indicator for the occurrence and degree of severity of flow cavitation. The increase of pump rotating speed or the decrease of speed ratio will intensify cavitation, which reduces the hydraulic transmission capacity and efficiency by over 20%, and seriously alters the shape, size, vapor volume fraction and region of cavitation bubbles. In extreme cases, more than 80% of the area on the suction side of the stator blade could be covered by cavitation bubbles. Moreover, the increase of pump rotating speed also changes the critical cavitation number and extends the cavitation range towards high speed ratio conditions not previously affected. These findings can provide guidance on how to choose the operating conditions of the hydraulic torque converter and how to improve its hydrodynamic performance and stability.

1. Introduction

Hydraulic torque converter is a closed-loop fluid machine that transfers power by the conversion between fluid kinetic energy and mechanical energy, and it serves as a core component of an automatic transmission and hydraulic transmission since it is able to provide continuously variable transmission, self-adaption to load, and absorption of vibration from the engine [1]. Therefore, it is widely used in the transmission systems of passenger cars, off-road vehicles, construction machinery, cruise ships, liners, tankers, large marine vehicles, etc. A hydraulic torque converter is mainly composed of pump, turbine, stator, and shell. The working fluid absorbs energy from the pump which is connected to the engine, impacts the turbine which in turn drives the load, and flows back to the pump via a stator. Each impeller contains a series of blades with different shapes and numbers, as shown in Figure 1.
The internal flow state of a hydraulic torque converter is very complex, where the fluid pressure, velocity and temperature vary drastically over different operating conditions. The increasing demand for higher power density and higher speed leads to higher flow velocity and lower local pressure, which consequently makes the flow inside the torque converter more prone to cavitation. Cavitation is a transient phase change phenomenon where vapor bubbles occur, grow, and collapse in liquid with the variation of local pressure. Moreover, hydraulic transmission oil is prone to cavitation because it contains a huge amount of dissolved gas and micro gas bubbles.
Cavitation could reduce the performance of the torque converter. Besides, the periodic growth and collapse of cavitation bubbles would induce vibration and noise, and the high pressure generated during cavitation collapse would cause erosion, thus cavitation inside torque converters invariably leads to poor performance, short service life, or even failure [2,3]. Cavitation in torque converters has become one of the key issues affecting performance and reliability. Therefore, it is of great importance and practical significance to study the cavitation characteristics of a torque converter.
In recent decades, the cavitation phenomenon of rotating fluid machinery such as hydraulic torque converters and retarders have attracted more attention. Anderson et al. [4] made a systematic study on cavitation inside torque converters under stall operating conditions using various experimental methods. Watanabe et al. [5] predicted the cavitation behavior of an automotive torque converter under stall, and studied the relationship between cavitation and vibration through experiments. Dong et al. [6] found cavitation grew near the stator leading edge and expanded with the increase of the pump rotating speed, resulting in severe performance degradation in the hydraulic torque converter. Tsutsumi et al. [7,8] studied the cavitation characteristics of a torque converter under different charging pressures and operating conditions. Ju et al. [9] studied the cavitation characteristics of a torque converter under various working conditions. They found that cavitation mainly occurred in the stator, which leads to serious deterioration of torque capability. Zhao et al. [10] studied the mechanism of bubble breakup in the hydraulic torque converter numerically by implanting bubbles in it. Guo et al. [11,12] and Ran et al. [13] investigated the evolution of transient cavitation in the torque converter, and the results indicated that cavitation mainly occurred in the stator, and severely reduced the performance of the torque converter. Liu et al. [14,15,16] studied the influence of stator blade shape on the cavitation process of a torque converter and found out that cavitation was directly affected by internal mass flow rate, which they then improved the torque converter design considering the presence of cavitation. Kang et al. [17] and Dong et al. [18] studied the flow structure and cavitation phenomena in a hydraulic retarder and found out that cavitation appeared near the back and root of the rotor blade, and the vapor volume fraction increased with the increase of rotor speed.
Most of the current research focused on the effect of cavitation on hydrodynamic machinery. Few reported on the cavitation mechanism and behavior under various operating conditions. However, the pump and the turbine rotating speeds varies drastically during operating, which in turn changes the cavitation behavior inside the torque converter. This paper is devoted to studying the influences of the pump and the turbine rotating speed on both internal two-phase flow field and overall hydrodynamic performance centered on the cavitation in the torque converter. These findings can serve as good guidance on how to choose the operating conditions of the hydraulic torque converter and how to improve its hydrodynamic performance and stability.

2. Numerical Method

ANSYS CFX was employed to resolve the Reynolds-averaged Navier–Stokes equation of the full three-dimensional flow field based on the following assumptions [2]: (1) The flow is incompressible and the heat transfer is ignored in the torque converter. (2) The components are assumed to be absolutely rigid bodies, and deformation and axial displacement are not considered. (3) The leakage is neglected.

2.1. Cavitation Model

The key to cavitation simulation is to establish a proper cavitation model [19] which governs the transformation between liquid and vapor. The cavitation phenomenon of hydraulic torque converter was studied based on the Zwart cavitation model in this paper [11,13,20,21].
Assuming that the cavitation bubble is spherical and there is no slip between fluid and cavitation bubbles, the dynamic equation of cavitation can be deduced from the Rayleigh–Plesset equation,
R B d 2 R B d t 2 + 3 2 ( d R B d t ) 2 + 4 v f R B d R B d t + 2 σ ρ f R B = p v p ρ f ,
where RB is the cavitation vapor bubble radius, p is the liquid pressure, pv represents the vaporization pressure, ρf is the liquid density, and σT is the coefficient of surface tension. According to the Rayleigh–Plesset equation, the volume change of a single bubble depends on the difference between vaporization pressure and liquid pressure. The above equation reduces to:
d R B d t = 2 3 p v p ρ f .
Therefore, the volume change rate of bubble can be described by:
d V B d t = d d t ( 4 3 π R B 3 ) = 4 π R B 2 2 3 p v p ρ f .
The mass change of bubble is as follows,
d m B d t = ρ v d V B d t = 4 π R B 2 ρ v 2 3 p v p ρ f ,
where ρv represents the density of the vapor.
Zwart calculated the volume fraction (rg) by multiplying the number of bubbles per unit volume (NB) and the mass transfer rate of bubble volume (VB) [21]. The expression is as follows,
r v = V B N B = 4 3 π R B 3 N B .
The total interphase mass transfer rate is obtained as:
m ˙ f v = N B d m B d t 3 r v ρ v R B 2 3 p v p ρ f .
This expression depends on the direction of phase transition. For the growth/vaporization of bubbles, it is given by the equation:
m ˙ f v = F 3 r v ρ v R B 2 3 | p v p | ρ f sgn ( p v p ) ,
where F is a factor expressing the mass conversion rate direction which includes vaporization (Fvap) and condensation (Fcond) processes. Fvap is much greater than Fcond because the condensation process is much slower than the vaporization process [22].
The vaporization process begins with the nuclei and grows up to form bubbles. However, with the increase of vapor volume fraction, the nuclei volume fraction decreases correspondingly; therefore, we replace rv in Equation (7) with rnuc(1 − rv) to give:
m ˙ f v = F 3 r n u c ( 1 r v ) ρ v R B 2 3 | p v p | ρ f sgn ( p v p ) ,
where rnuc represents the nuclei volume fraction, which is also expressed in NVF.
For the condensation process, the equation of mass transfer rate is:
m ˙ f v + = F c o n d 3 r v ρ v R B 2 3 p p v ρ f .
For vaporization, the mass transfer rate can be reorganized as:
m ˙ f v = F v a p 3 r n u c ( 1 r v ) ρ v R B 2 3 p v p ρ f .

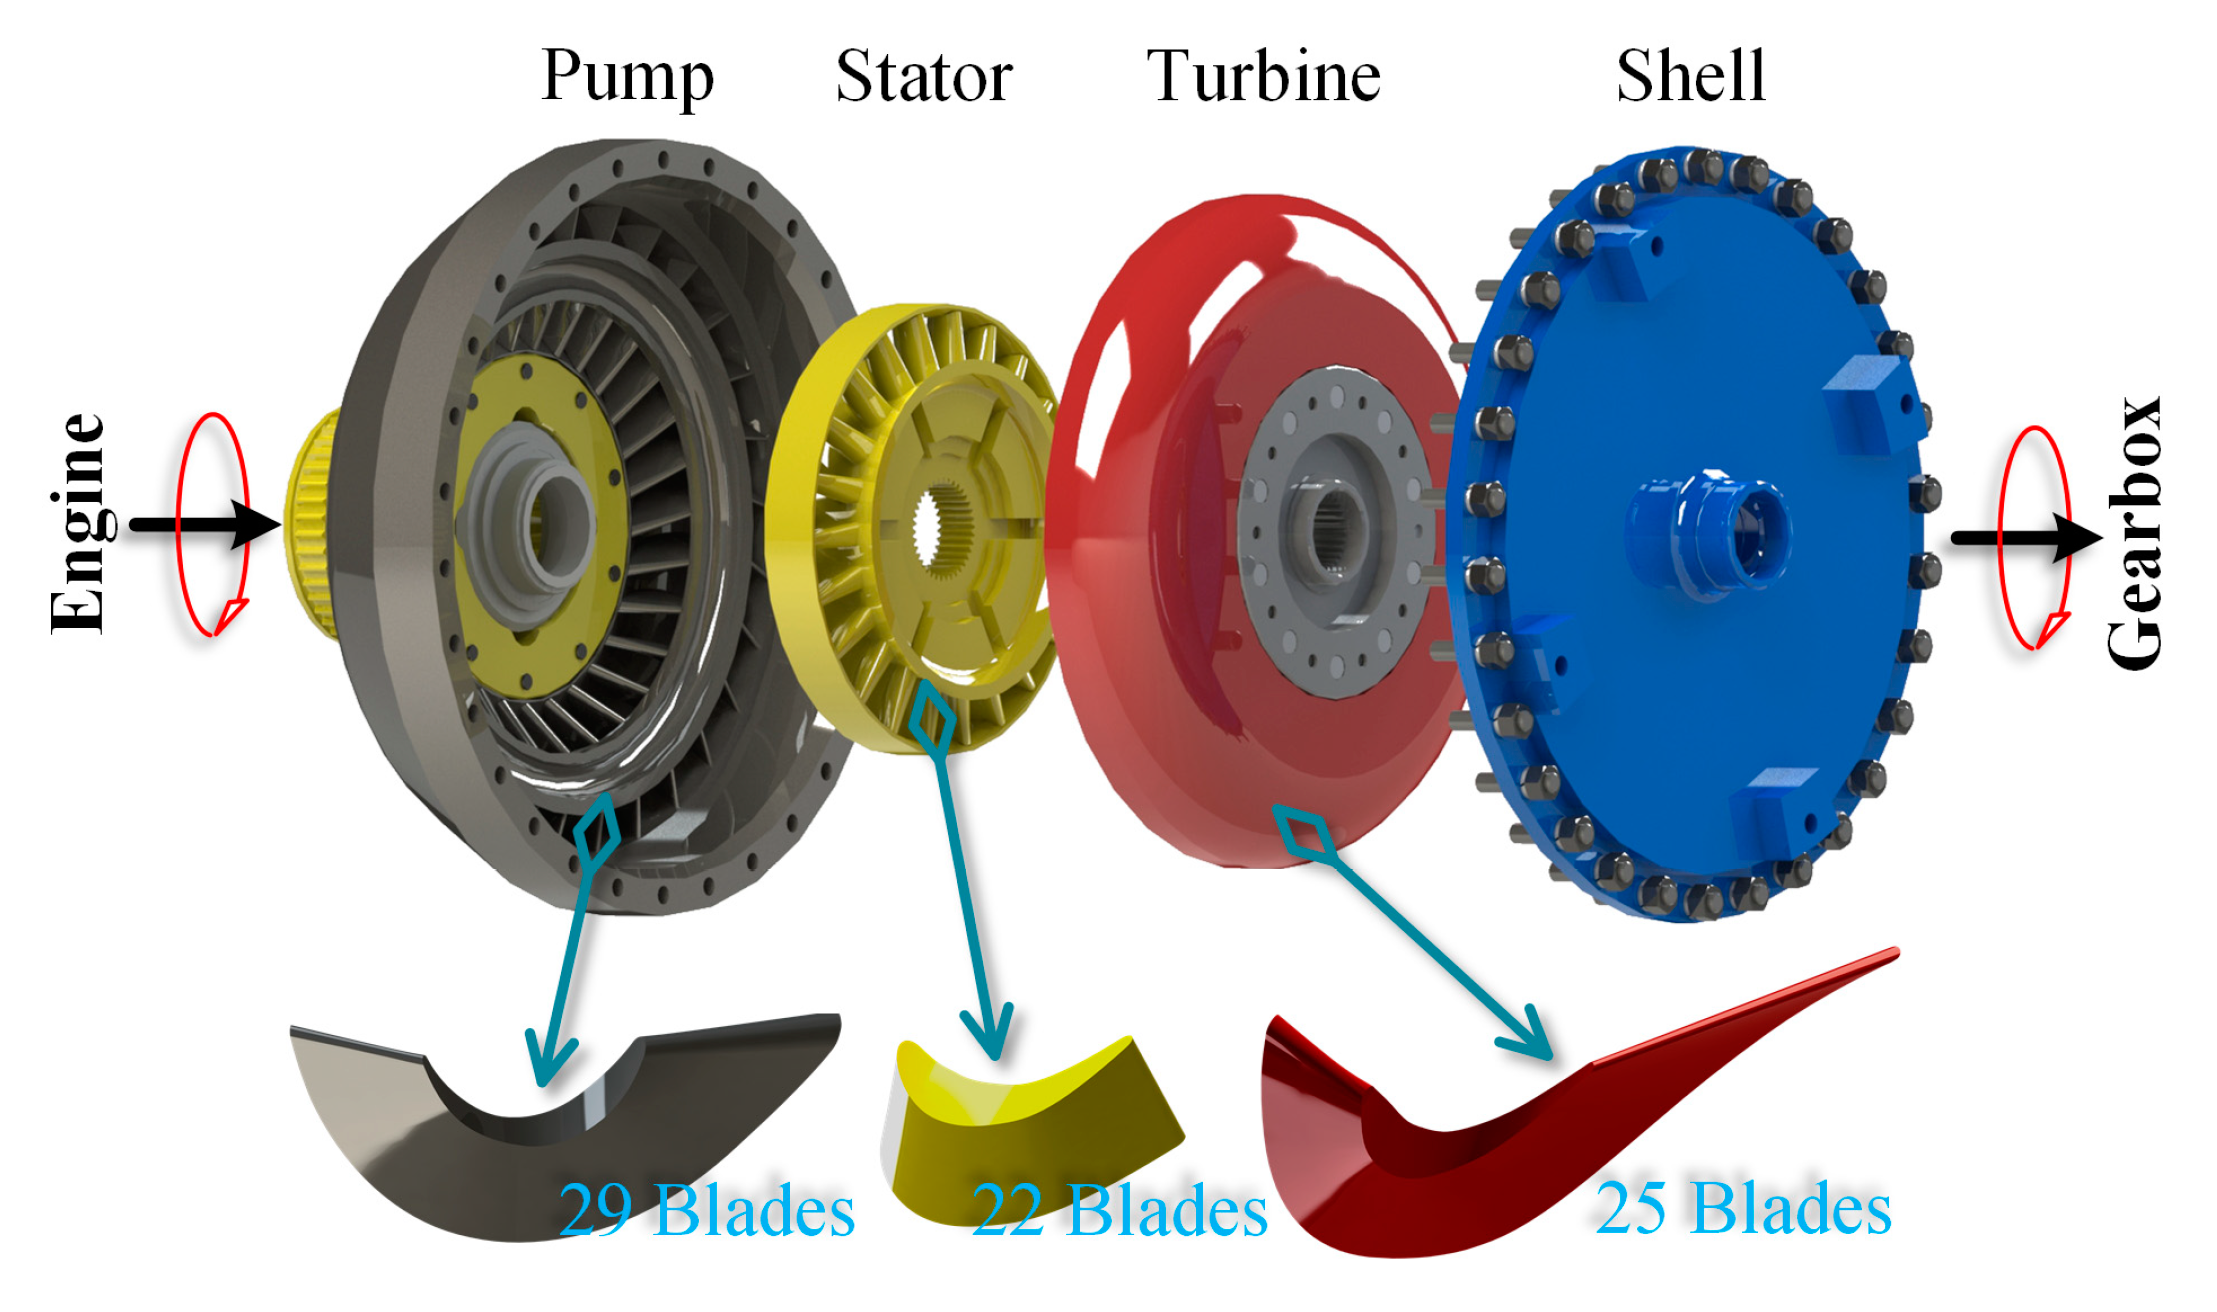
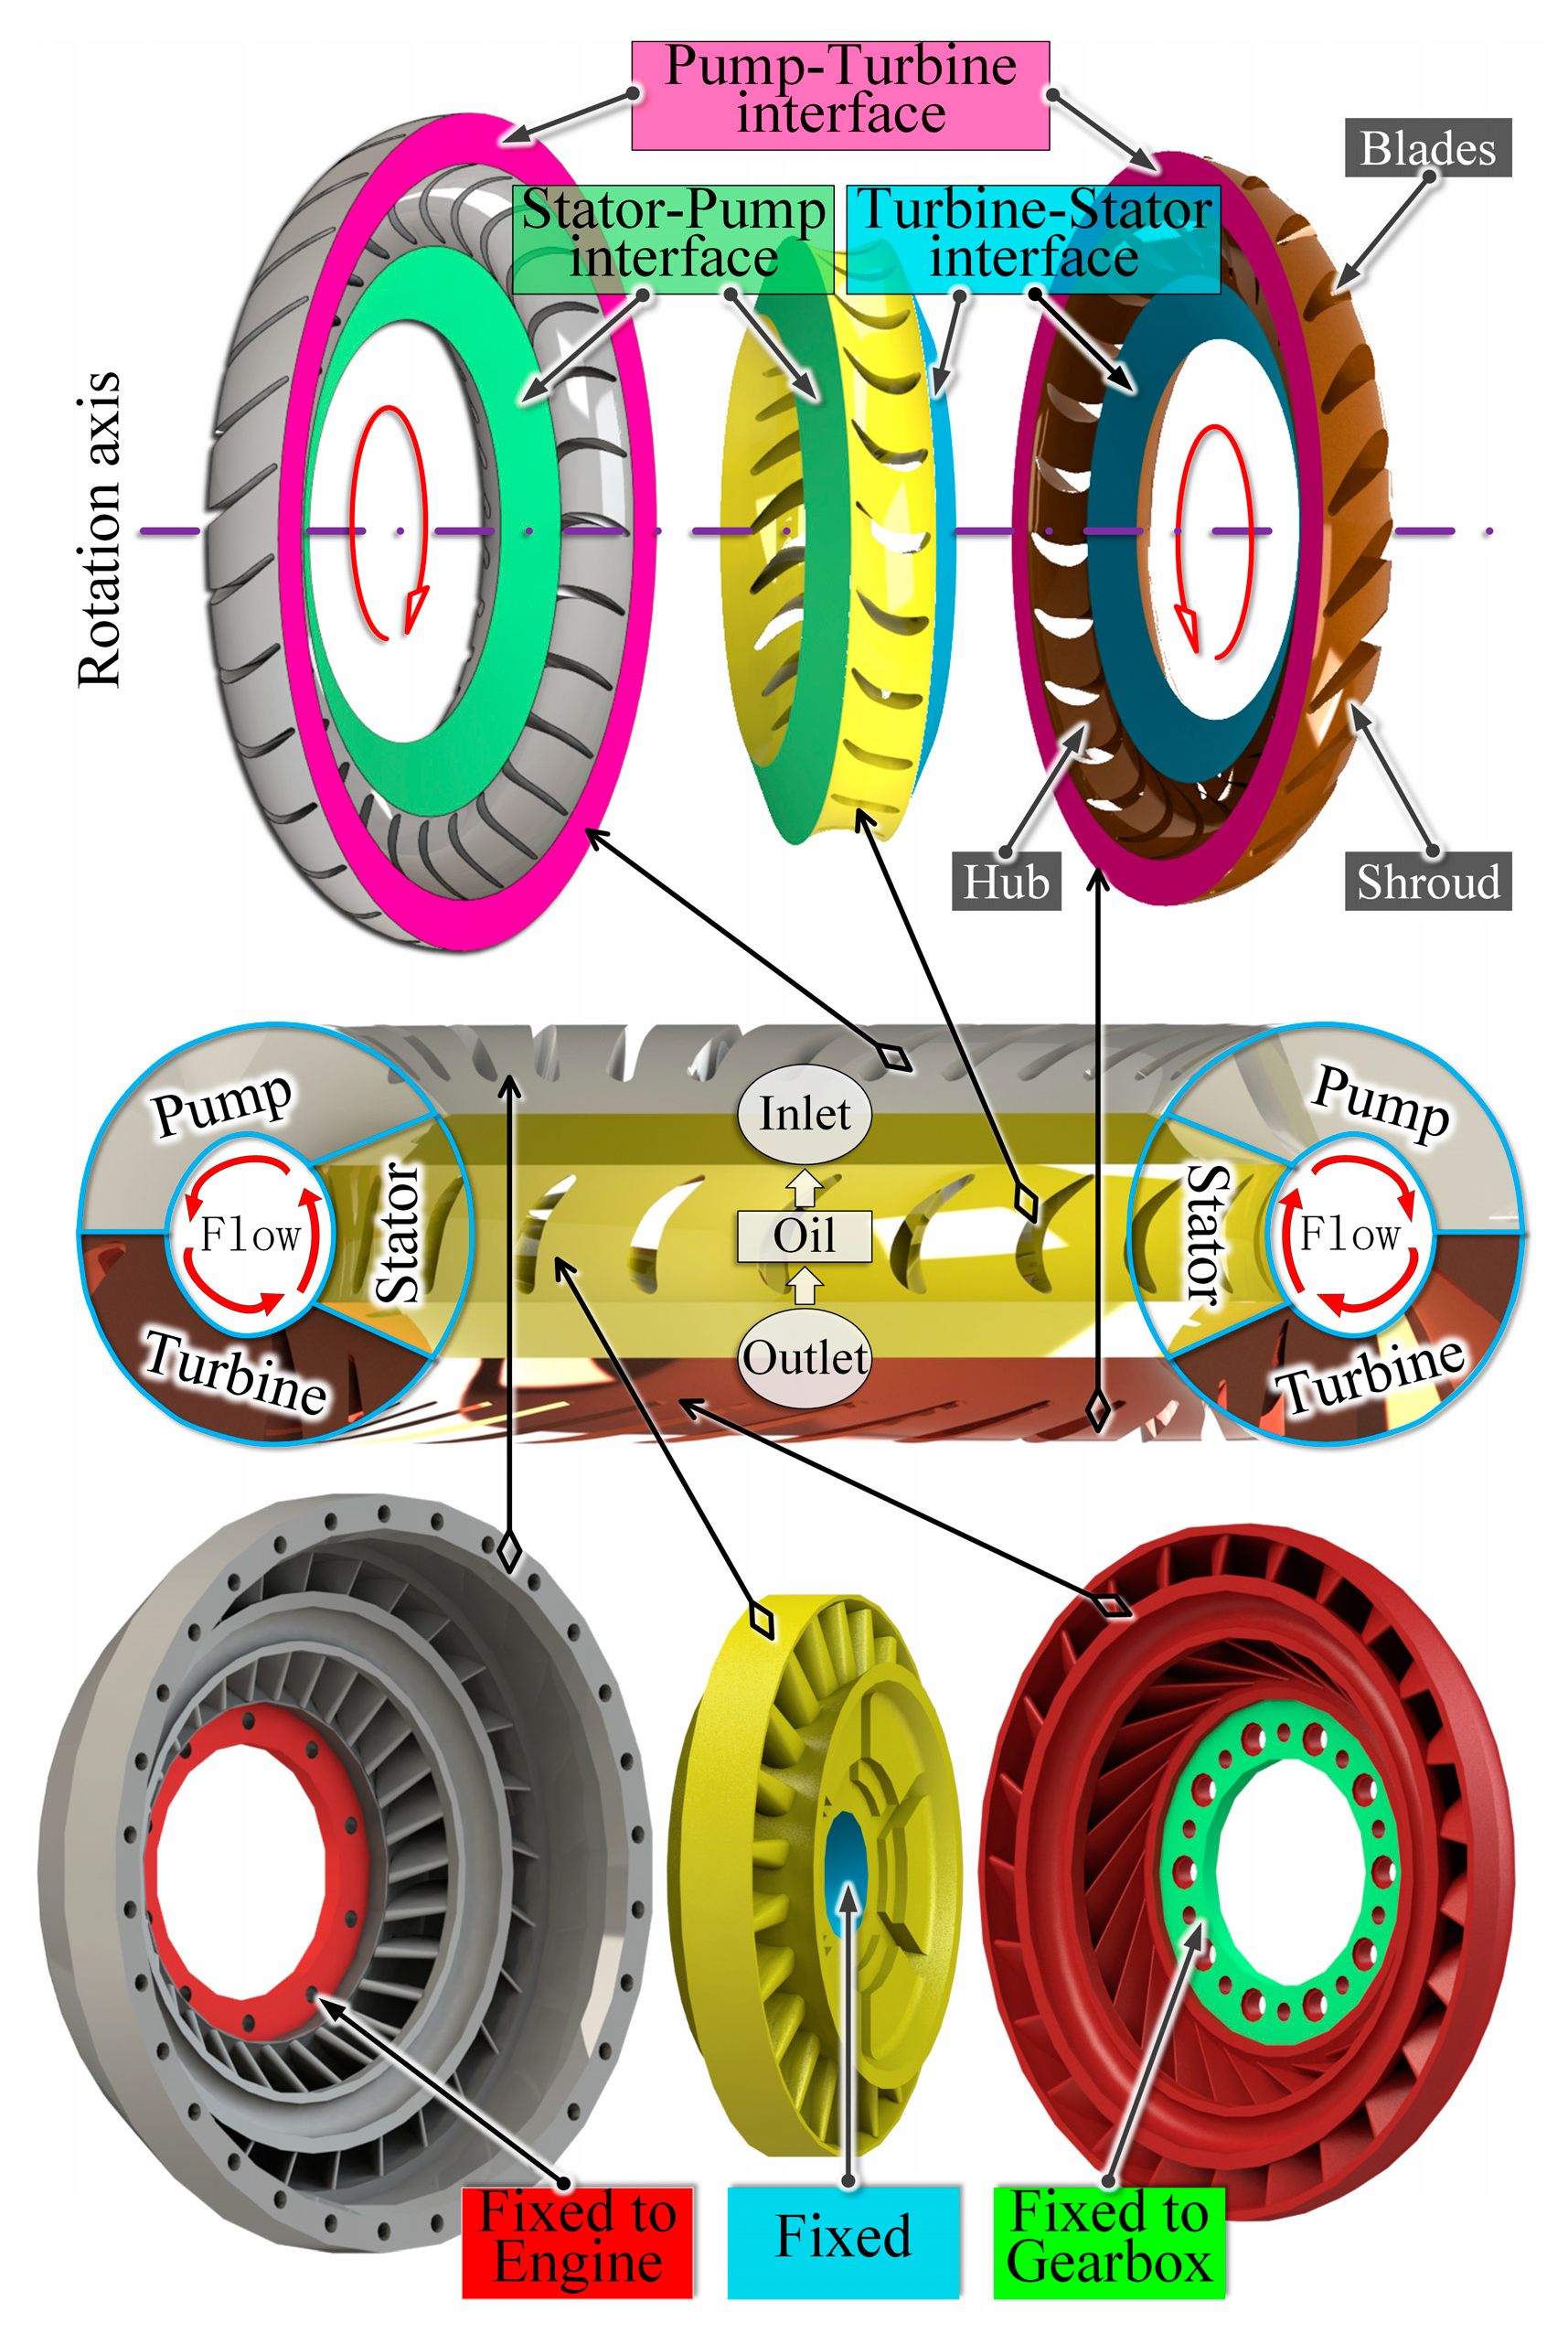
2.2. Full Three-Dimensional Computational Fluid Dynamics (CFD) Model of the Torque Converter

The torque converter is mainly composed of three impellers which are placed next to each other. The fluid is first driven by the pump which connects to the engine, then enters the turbine and drives the gearbox. Fluid coming out of the turbine and again goes back to the pump domain after the stator (Figure 2). Therefore, the full flow passage was extracted from a torque converter whose torus diameter is 315 mm, and every impeller domain includes the hub, shroud, inlet, outlet, and blades. Then the steady-state CFD model was developed in ANSYS CFX to simulate the cavitation of hydraulic torque converter, and an automatic transmission fluid 15W–40 was used in the simulations.
The charging oil inlet of the whole model is located between the stator and the pump, and the outlet is between the turbine and the stator. The liquid flows in a closed-loop in the sequence of pump–turbine–stator, and the frozen rotor model [23] was applied to the interfaces, i.e., the interface between adjacent domains, and where more details are provided. The no-slip smooth walls were applied to all other surfaces, which assumes that the speed of the fluid layer in direct contact with the boundary is identical to the velocity of the corresponding boundary, as shown in Figure 2. The shear stress transport (SST) turbulence model was adopted to calculate the boundary layer flow and the flow separation caused. The time-step was set to auto timescale, and a total of 400 time-steps were performed. The simulation was considered convergent when the root mean square (RMS) residuals reached 1 × 10⁻⁵.

2.3. CFD Settings

As shown in Table 1, the torque converter cavitation was calculated by three CFD models. The results of previous calculations were used as the initial value of the next simulation to improve the convergence and accuracy.
Firstly, the flow field inside the torque converter ignoring cavitation was solved by a steady-state model with the upwind advection scheme. Then the steady-state non-cavitation CFD model was performed by a high-resolution advection scheme and turbulence numerics to provide an accurate flow field status. Lastly, the steady-state cavitation model was performed at various pump and turbine rotating speeds.
The detailed CFD model settings are listed in Table 1. The model has no inlet or outlet boundaries because the fluid flows in a closed loop. Therefore, a pressure value of 0.4 MPa was set at the charge oil inlet which is located at the interface between pump and stator corresponding to the test, as shown in Figure 2. The internal fluid fields of the torque converter under various operating conditions were calculated with non-cavitation and cavitation models, and then the pump torque (TP), turbine torque (TT), stator torque (TS), and other performance indices were derived from the CFD results.
In addition, there are several cavitation parameters in the torque converter cavitation model, which have been set according to the experimented conditions as detailed in [11]: Pv is the saturated vapor pressure, and it was set to be 700 Pa according to the vapor pressure of automatic transmission oil, Fcond is the cavitation condensation coefficient whose value is 0.01 as condensation usually occurs slowly, Fvap is the cavitation vaporization coefficient with a value of 20 to represent the growth (vaporization) rate of the cavitation bubbles, RB is the mean radius of cavitation bubble and the value of 2 × 10⁻⁵ m is deemed reasonable, MDR is the maximum density ratio of oil and vapor and its value is 1163, and finally NVF is the volume fraction of the nucleation sites with a value of 5 × 10⁻⁵.

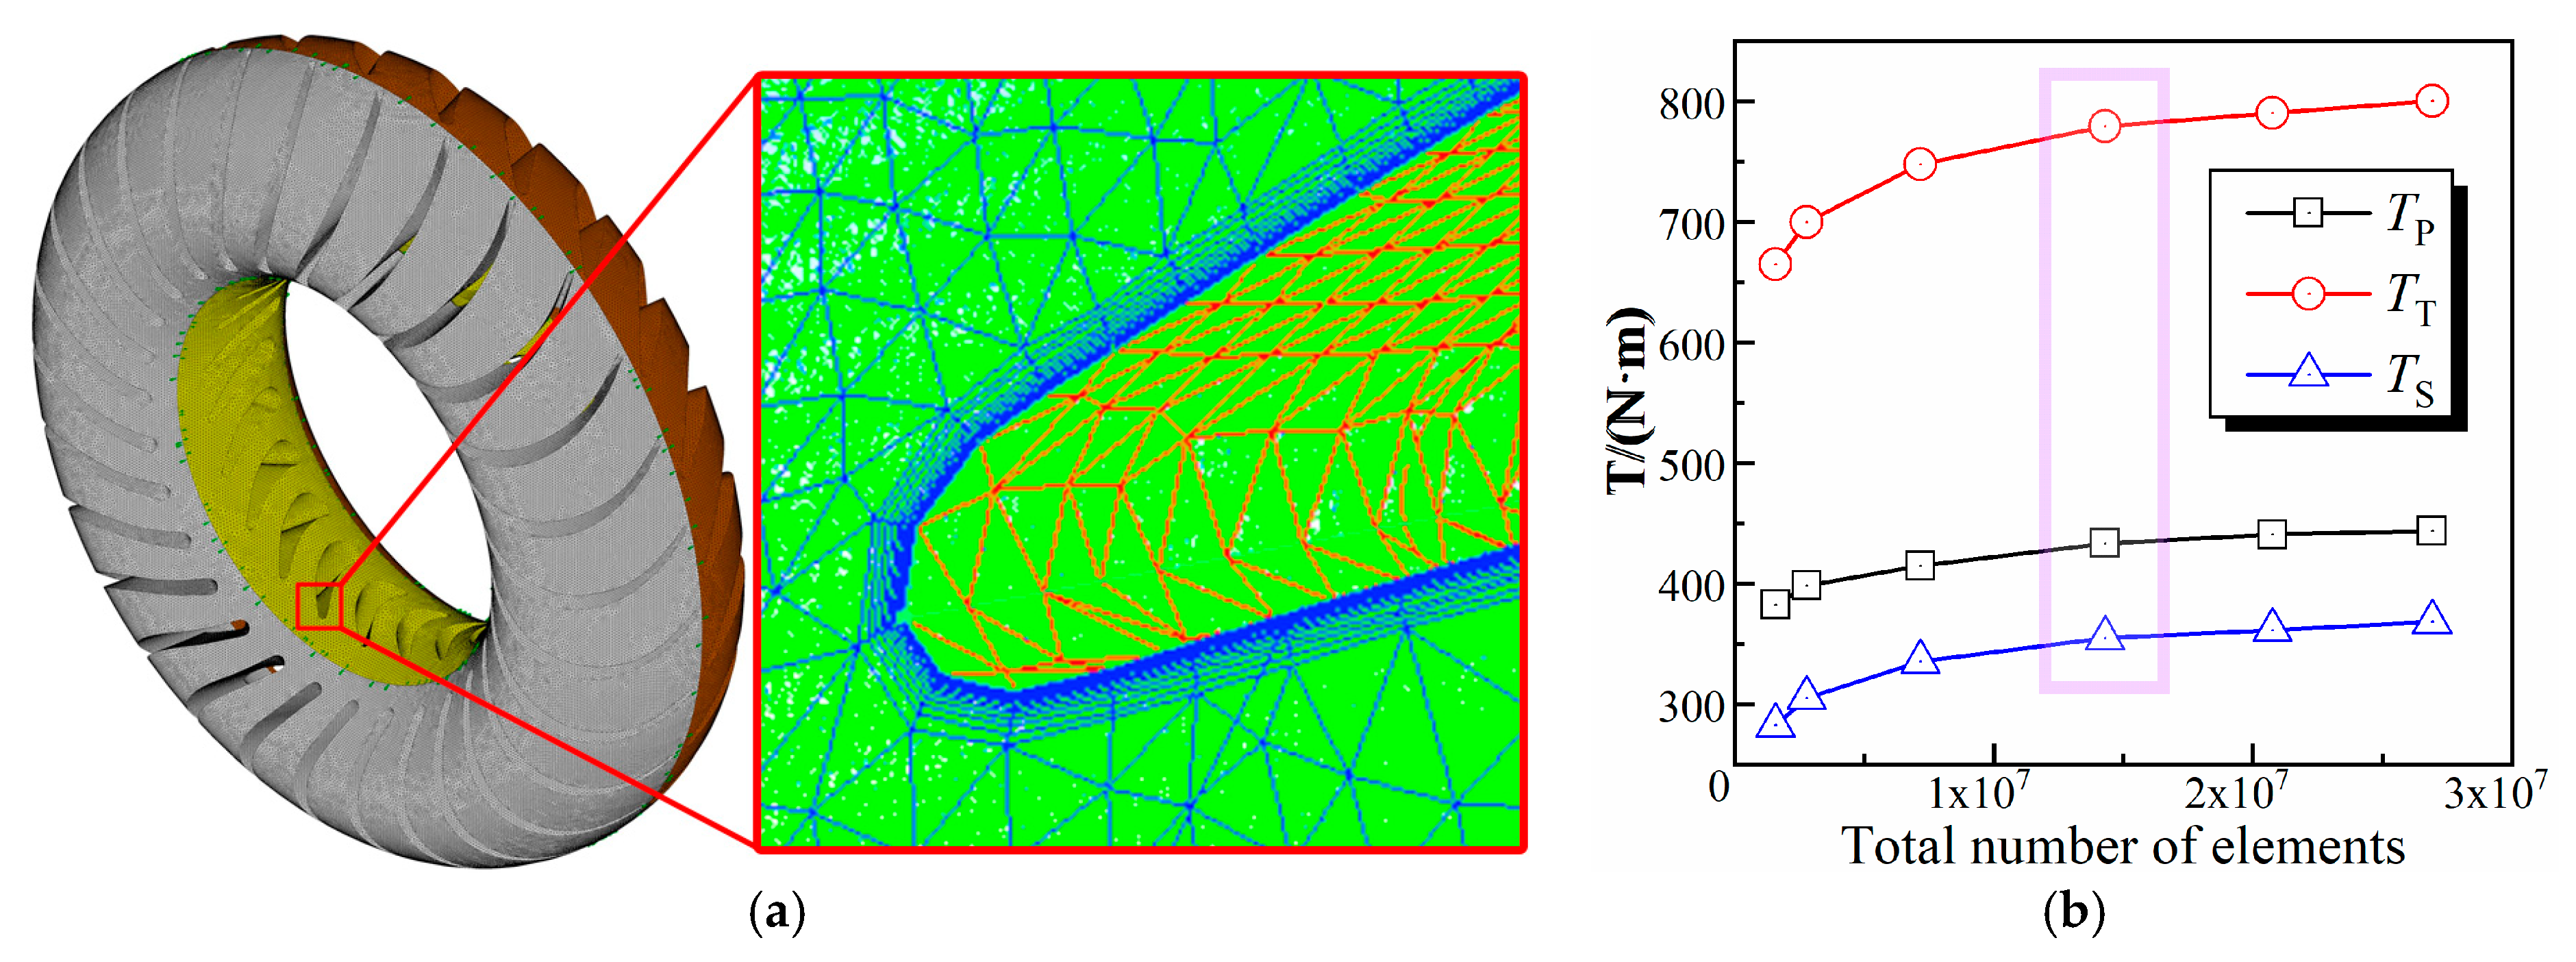
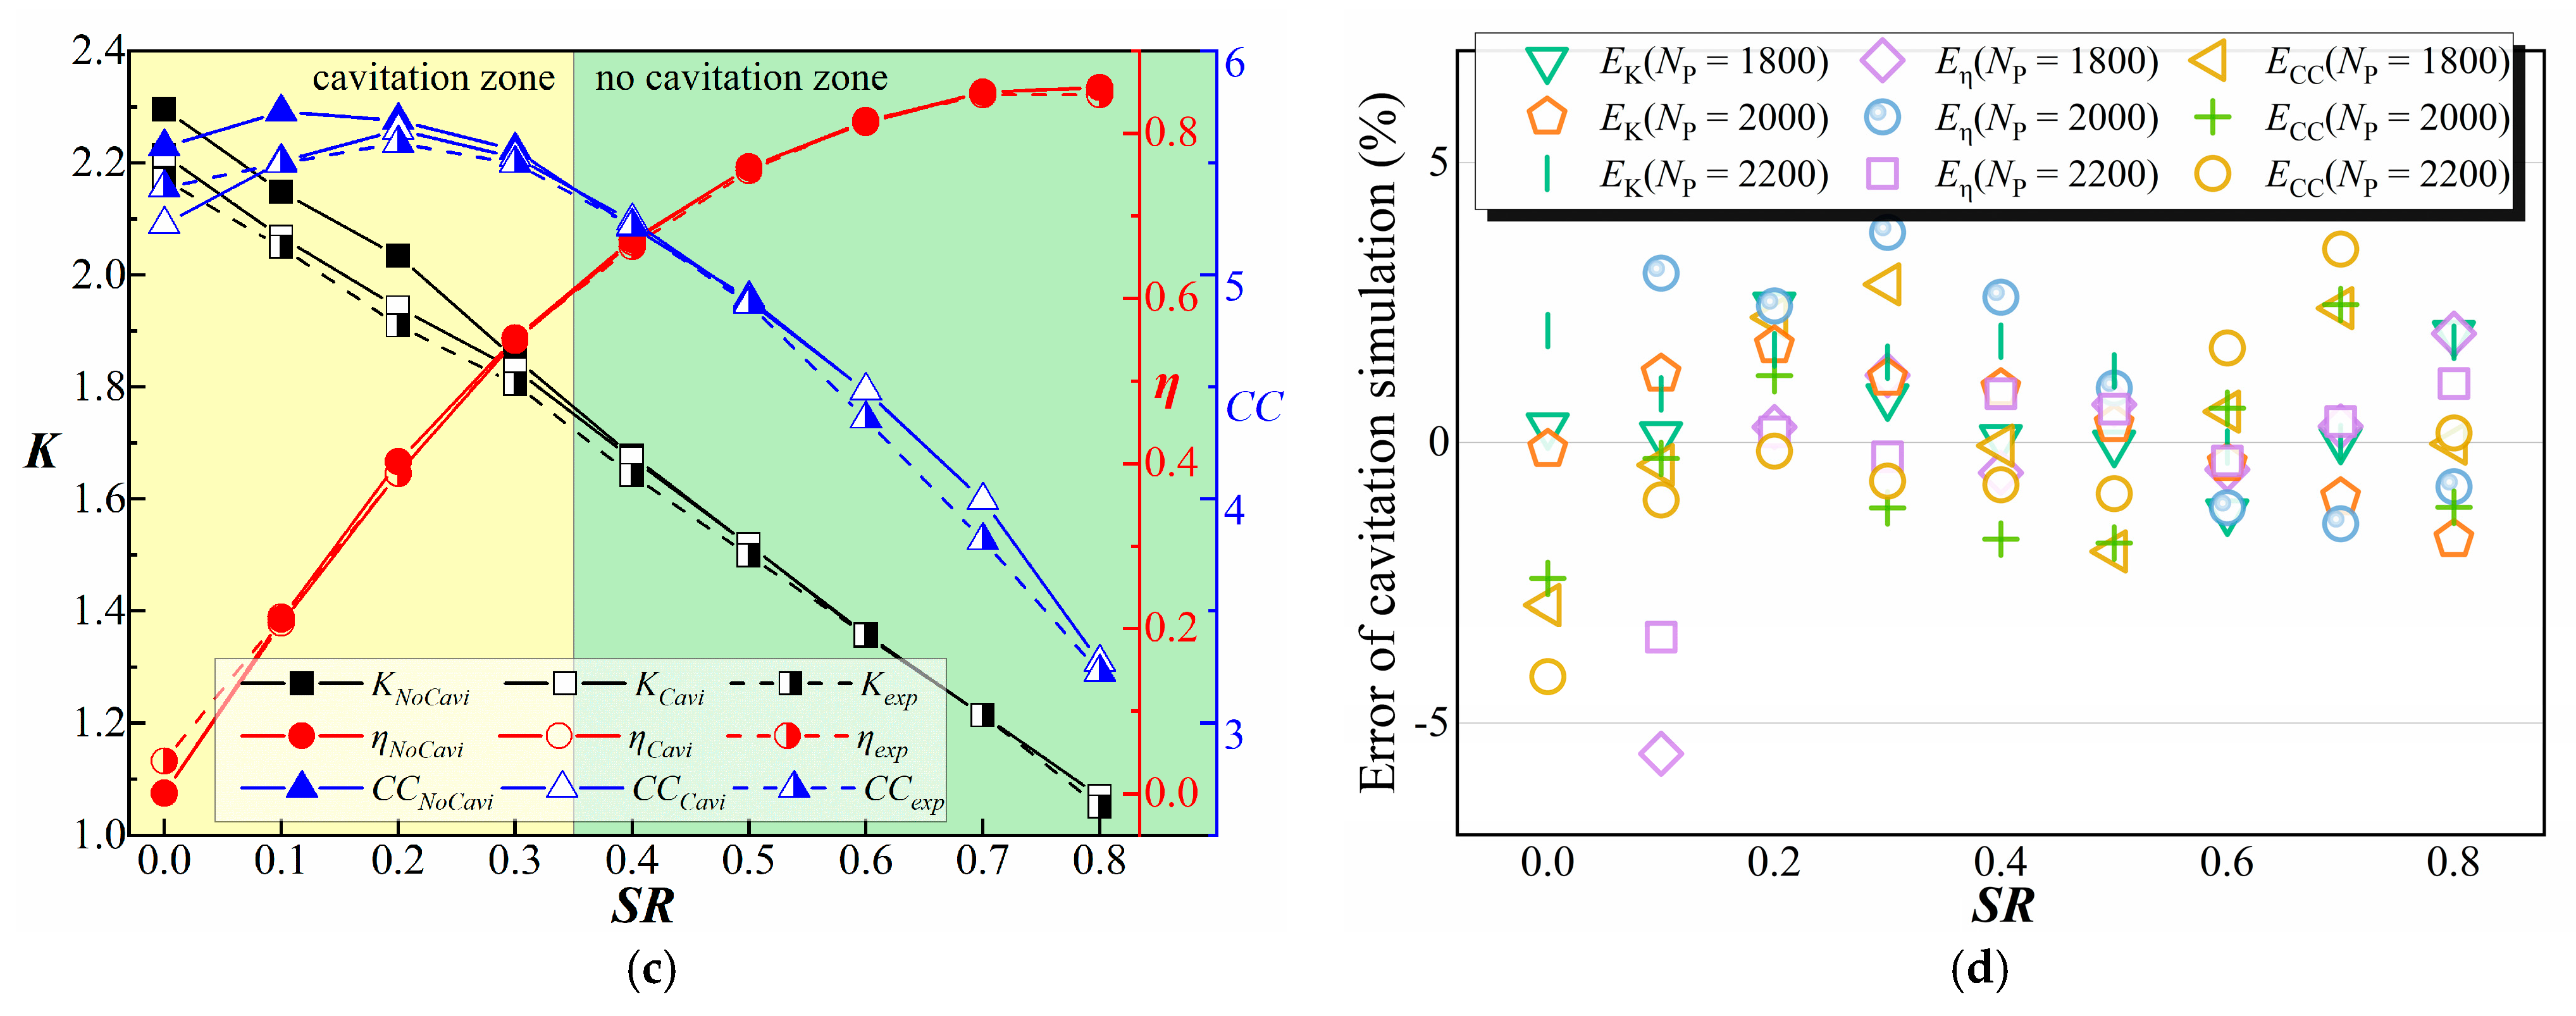
2.4. Mesh Independence Analysis

The three impellers were discretized using unstructured tetrahedral elements. As the cavitation bubbles were generally small, a refined mesh around the blade is required to restore the real flow status and capture the cavitation flow behaviors.
A mesh independence test was performed with different mesh resolutions when the pump rotating speed and turbine rotating speed were 2000 rpm and 800 rpm, respectively, and the pressure was 0.4 MPa. The detailed settings of the flow analysis were completely in accordance with the above CFD model of the torque converter, including the boundary, surfaces, interfaces, material, solver, etc., as shown in the No Cavitation I model in Table 1. Figure 3 shows the torque results of the pump, the turbine, and the stator over the different mesh densities. The number of elements for the fluid domain of pump, turbine and stator are 7,538,148; 4,319,448; and 2,442,091, respectively, when the torque variation of pump, turbine and stator is 1.63%, 1.42%, and 1.90%, respectively.
We refined the boundary mesh of the torque converter after the mesh independence analysis, the mesh around the blade surface was densified with 12 layers of prism mesh whose minimum height was 0.015 mm, and the Yplus values of the three impellers were all less than 2, which means that the boundary layer and wall function can meet the requirements of the CFD model. The final total element number was 22,431,217 after the boundary mesh generation.

3. Experiment and Validation

3.1. Hydraulic Torque Converter Test Rig

The test cell consists of a motor and a generator to simulate various speed conditions. The speed and torque sensors with calibration accuracy of 0.25% are mounted at the input and output ends of the torque converter, respectively. Besides, the working fluid was supplied by a hydraulic system. The test speed ratio (SR = NT/NP) is related to the pump rotating speed (NP = 1500, 1800, 2000, and 2200 rpm) and the turbine rotating speed (NT = 0–2200 rpm), which are controlled by the motor and generator, respectively, during the experiment. And the internal liquid pressure (PC = 0.4 MPa) and temperature (TC = 90 °C) are controlled by the hydraulic system, as shown in Figure 4.

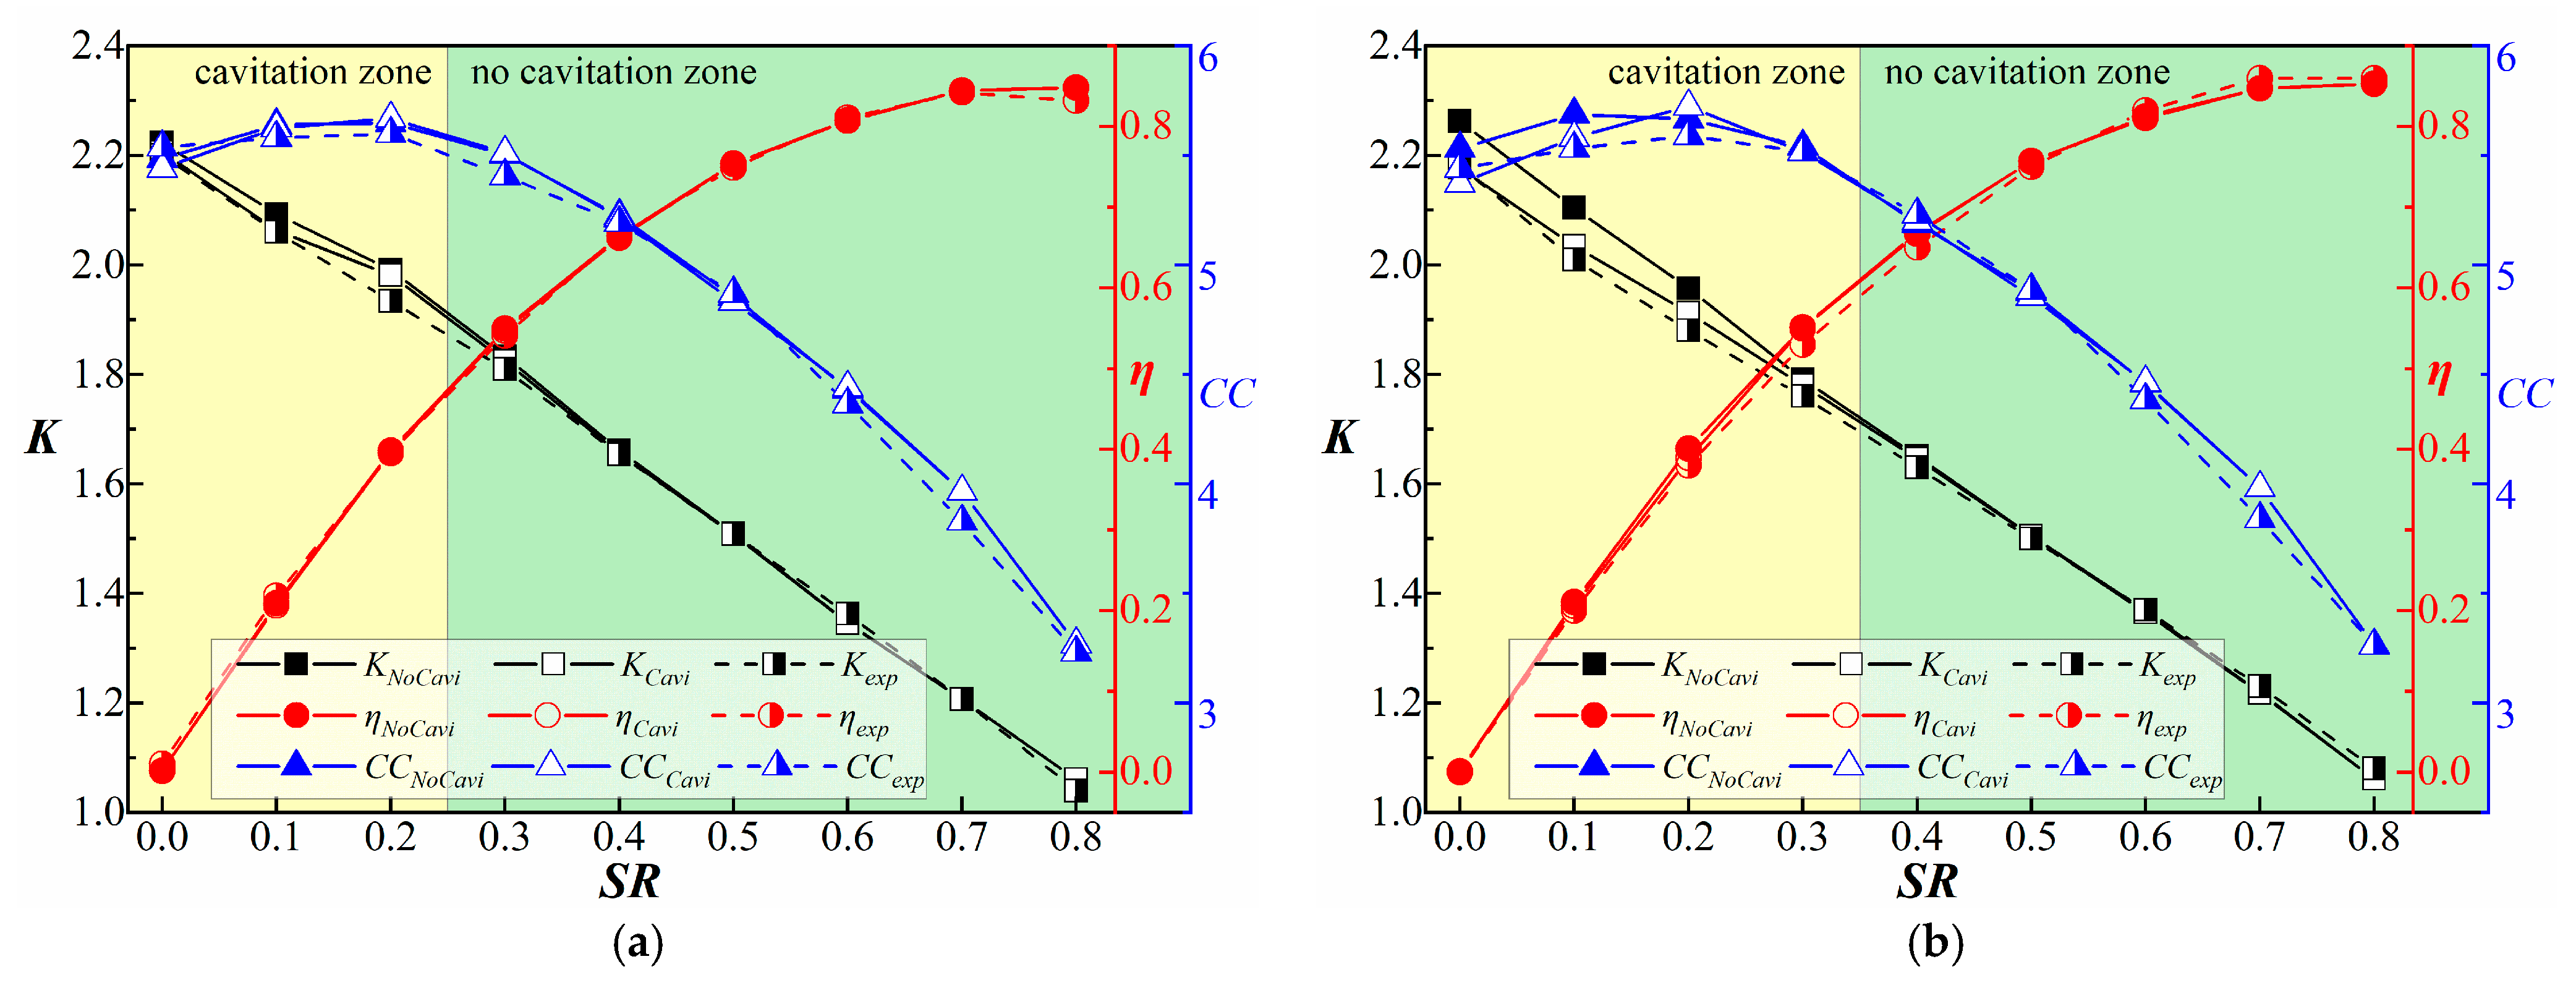
3.2. Validation of CFD Model

Under the same conditions as the experiment, the torque of the pump, turbine, and stator can be obtained by simulation. Besides, these performance metrics were always used to evaluate the basic cavitation performance of the torque converter [1,24], including torque ratio, efficiency, and capacity constant, which are defined as,
K = T T T P ; η = K × S R ; C C = T P D 5 ω P 2 .
The performance of the torque converter before and after considering cavitation were analyzed, which were also compared with the actual performance measured by the experiment in Figure 5. And the error (as follows) between the simulation results of cavitation model and experimental data was also analyzed and is shown in Figure 5d.
E K = ( K C a v i K e x p ) K e x p ; E η = ( η C a v i η e x p ) η e x p ; E CC = ( C C C a v i C C e x p ) C C e x p .
The results at various speeds revealed that cavitation deteriorated torque converter performance, especially under low speed ratio operating conditions and high pump rotating speeds, and the simulation accuracy was improved by considering cavitation [7]. On comparing to experiments, the maximum error of the cavitation model drops below 5.5%, whereas the model ignoring cavitation yielded a maximum error of 17.4%. The validation results prove that cavitation occurred under low speed ratio conditions, and the cavitation model is able to calculate torque converter performance reasonably accurately.

4. Results and Discussion

4.1. Cavitation Characteristics of Hydraulic Torque Converter

The flow field simulations of the hydraulic torque converter under various pump rotating speeds and speed ratios are carried out by the CFD models with and without cavitation. The pump rotating speed varied from 1000 rpm to 3000 rpm, and the turbine rotating speed was determined by speed ratio which varied from 0 to 1 at intervals of 0.1, the pressure was 0.4 MPa and the temperature was 90 °C. The torque of each component can be derived from the CFD results, and then the performance indices such as efficiency, capacity constant and torque were determined. In order to study the influence of cavitation on the performance of torque converter in detail, we compared the performance deviations between the results from CFD model with cavitation and CFD model without cavitation, which is then able to indicate the level (or contribution) of cavitation, including capacity constant deviation, efficiency deviation, and torque deviation, as shown in Figure 6. The formulas are as follows,
D T = ( T C a v i T N o C a v i ) T N o C a v i ; D η = ( η C a v i η N o C a v i ) η N o C a v i ; D CC = ( C C C a v i C C N o C a v i ) C C N o C a v i .
It can be concluded from Figure 6 that the occurrence and influence of cavitation are related to the rotating speeds, and cavitation has a significant effect on the performance of the torque converter. All performance indices decrease drastically with an increasing pump rotating speed and a decreasing speed ratio, indicating that high pump rotating speed and low turbine rotating speed will aggravate cavitation and cause serious performance deterioration. In our simulations, cavitation intensity/degree reaches its peak under stall condition when NP = 3000 rpm, and cavitation will reduce the torque of the turbine by 20.3%, the capacity constant by 18.1%, and the efficiency by 5.8%.

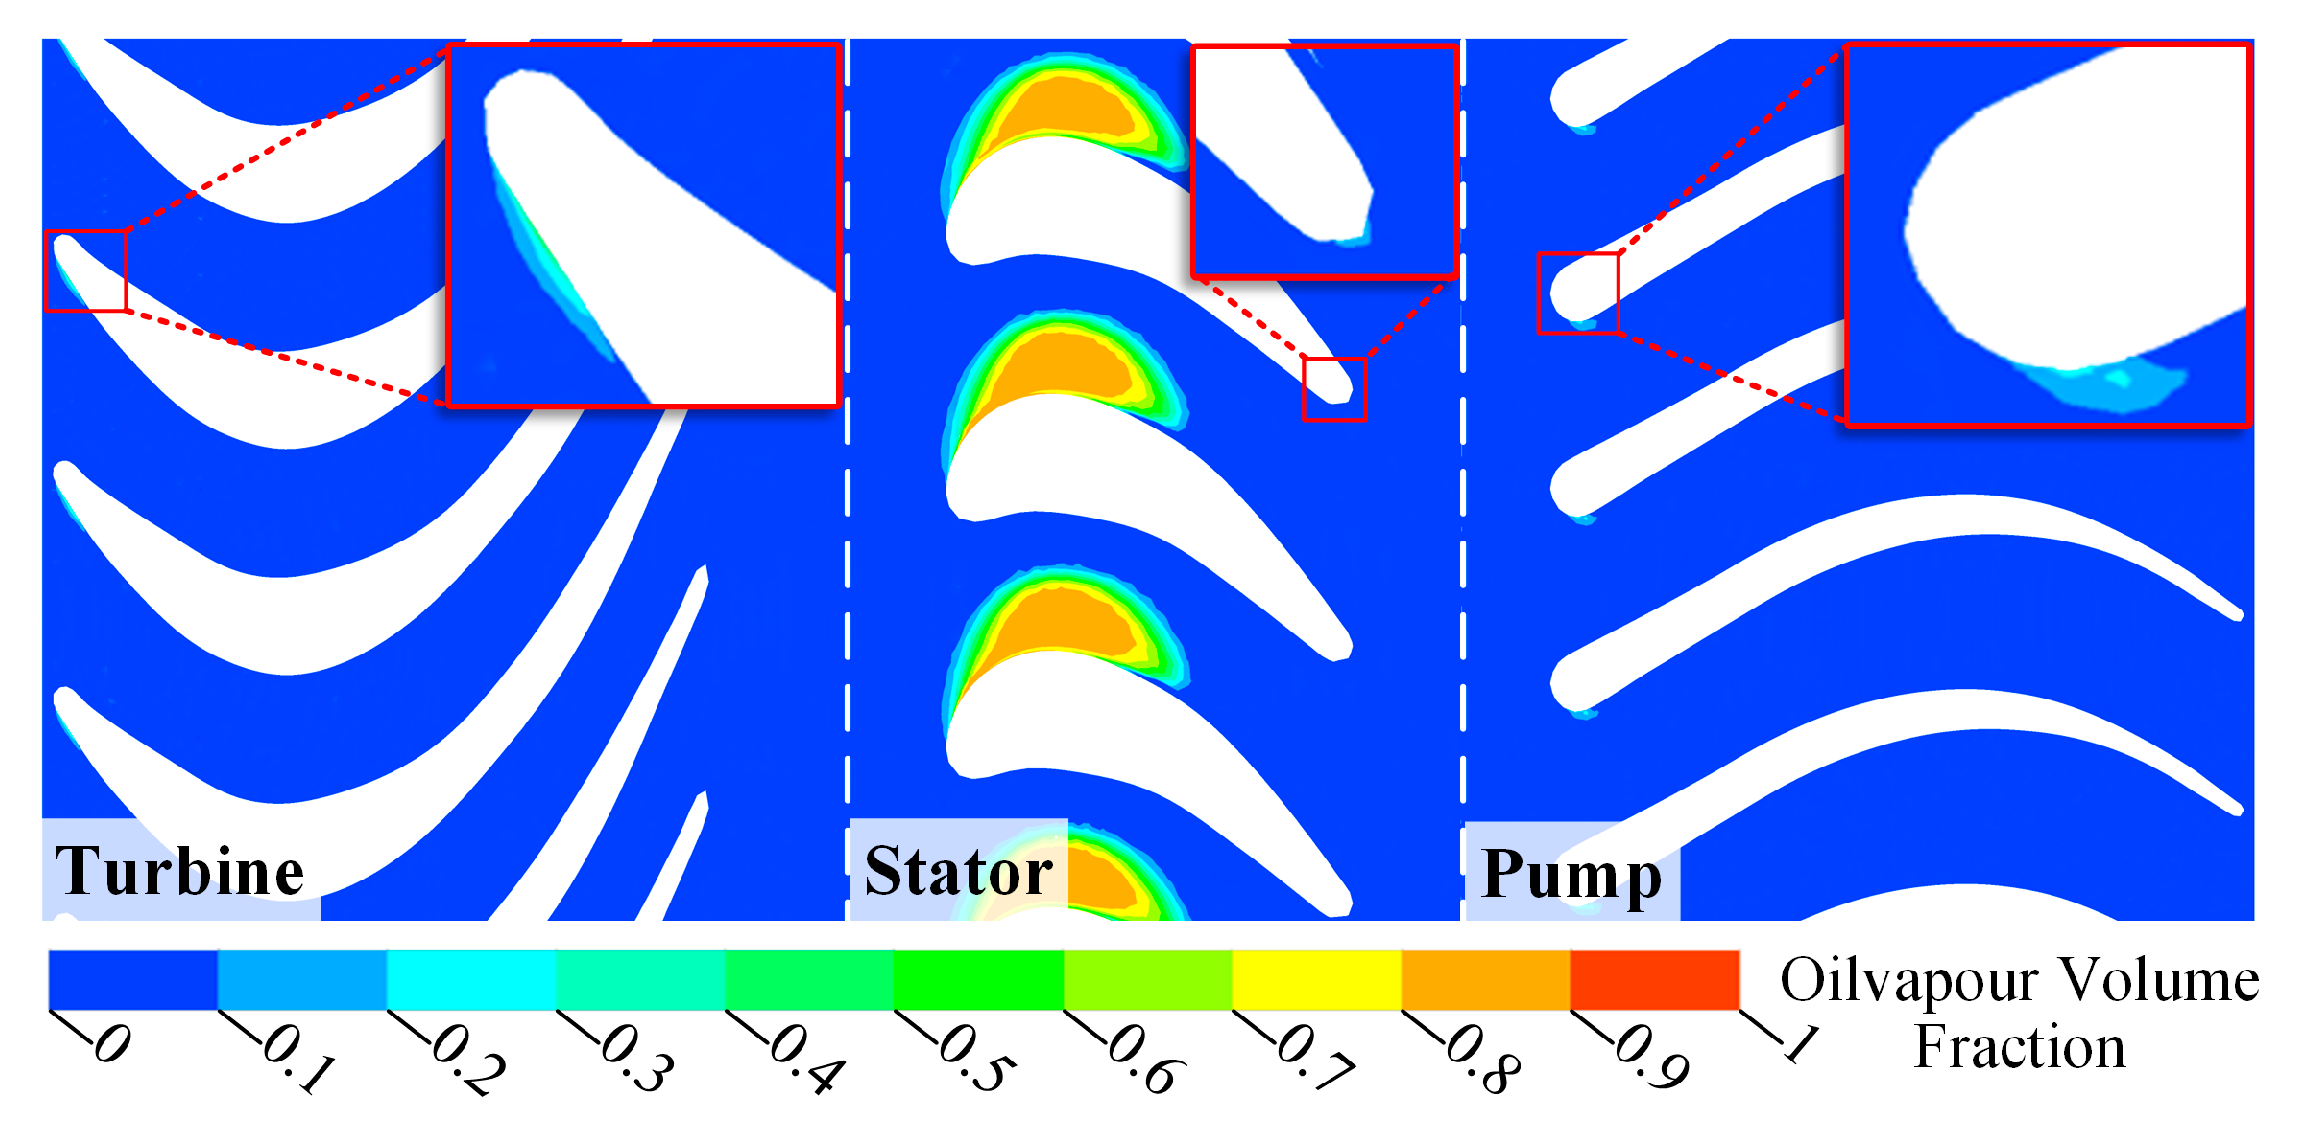
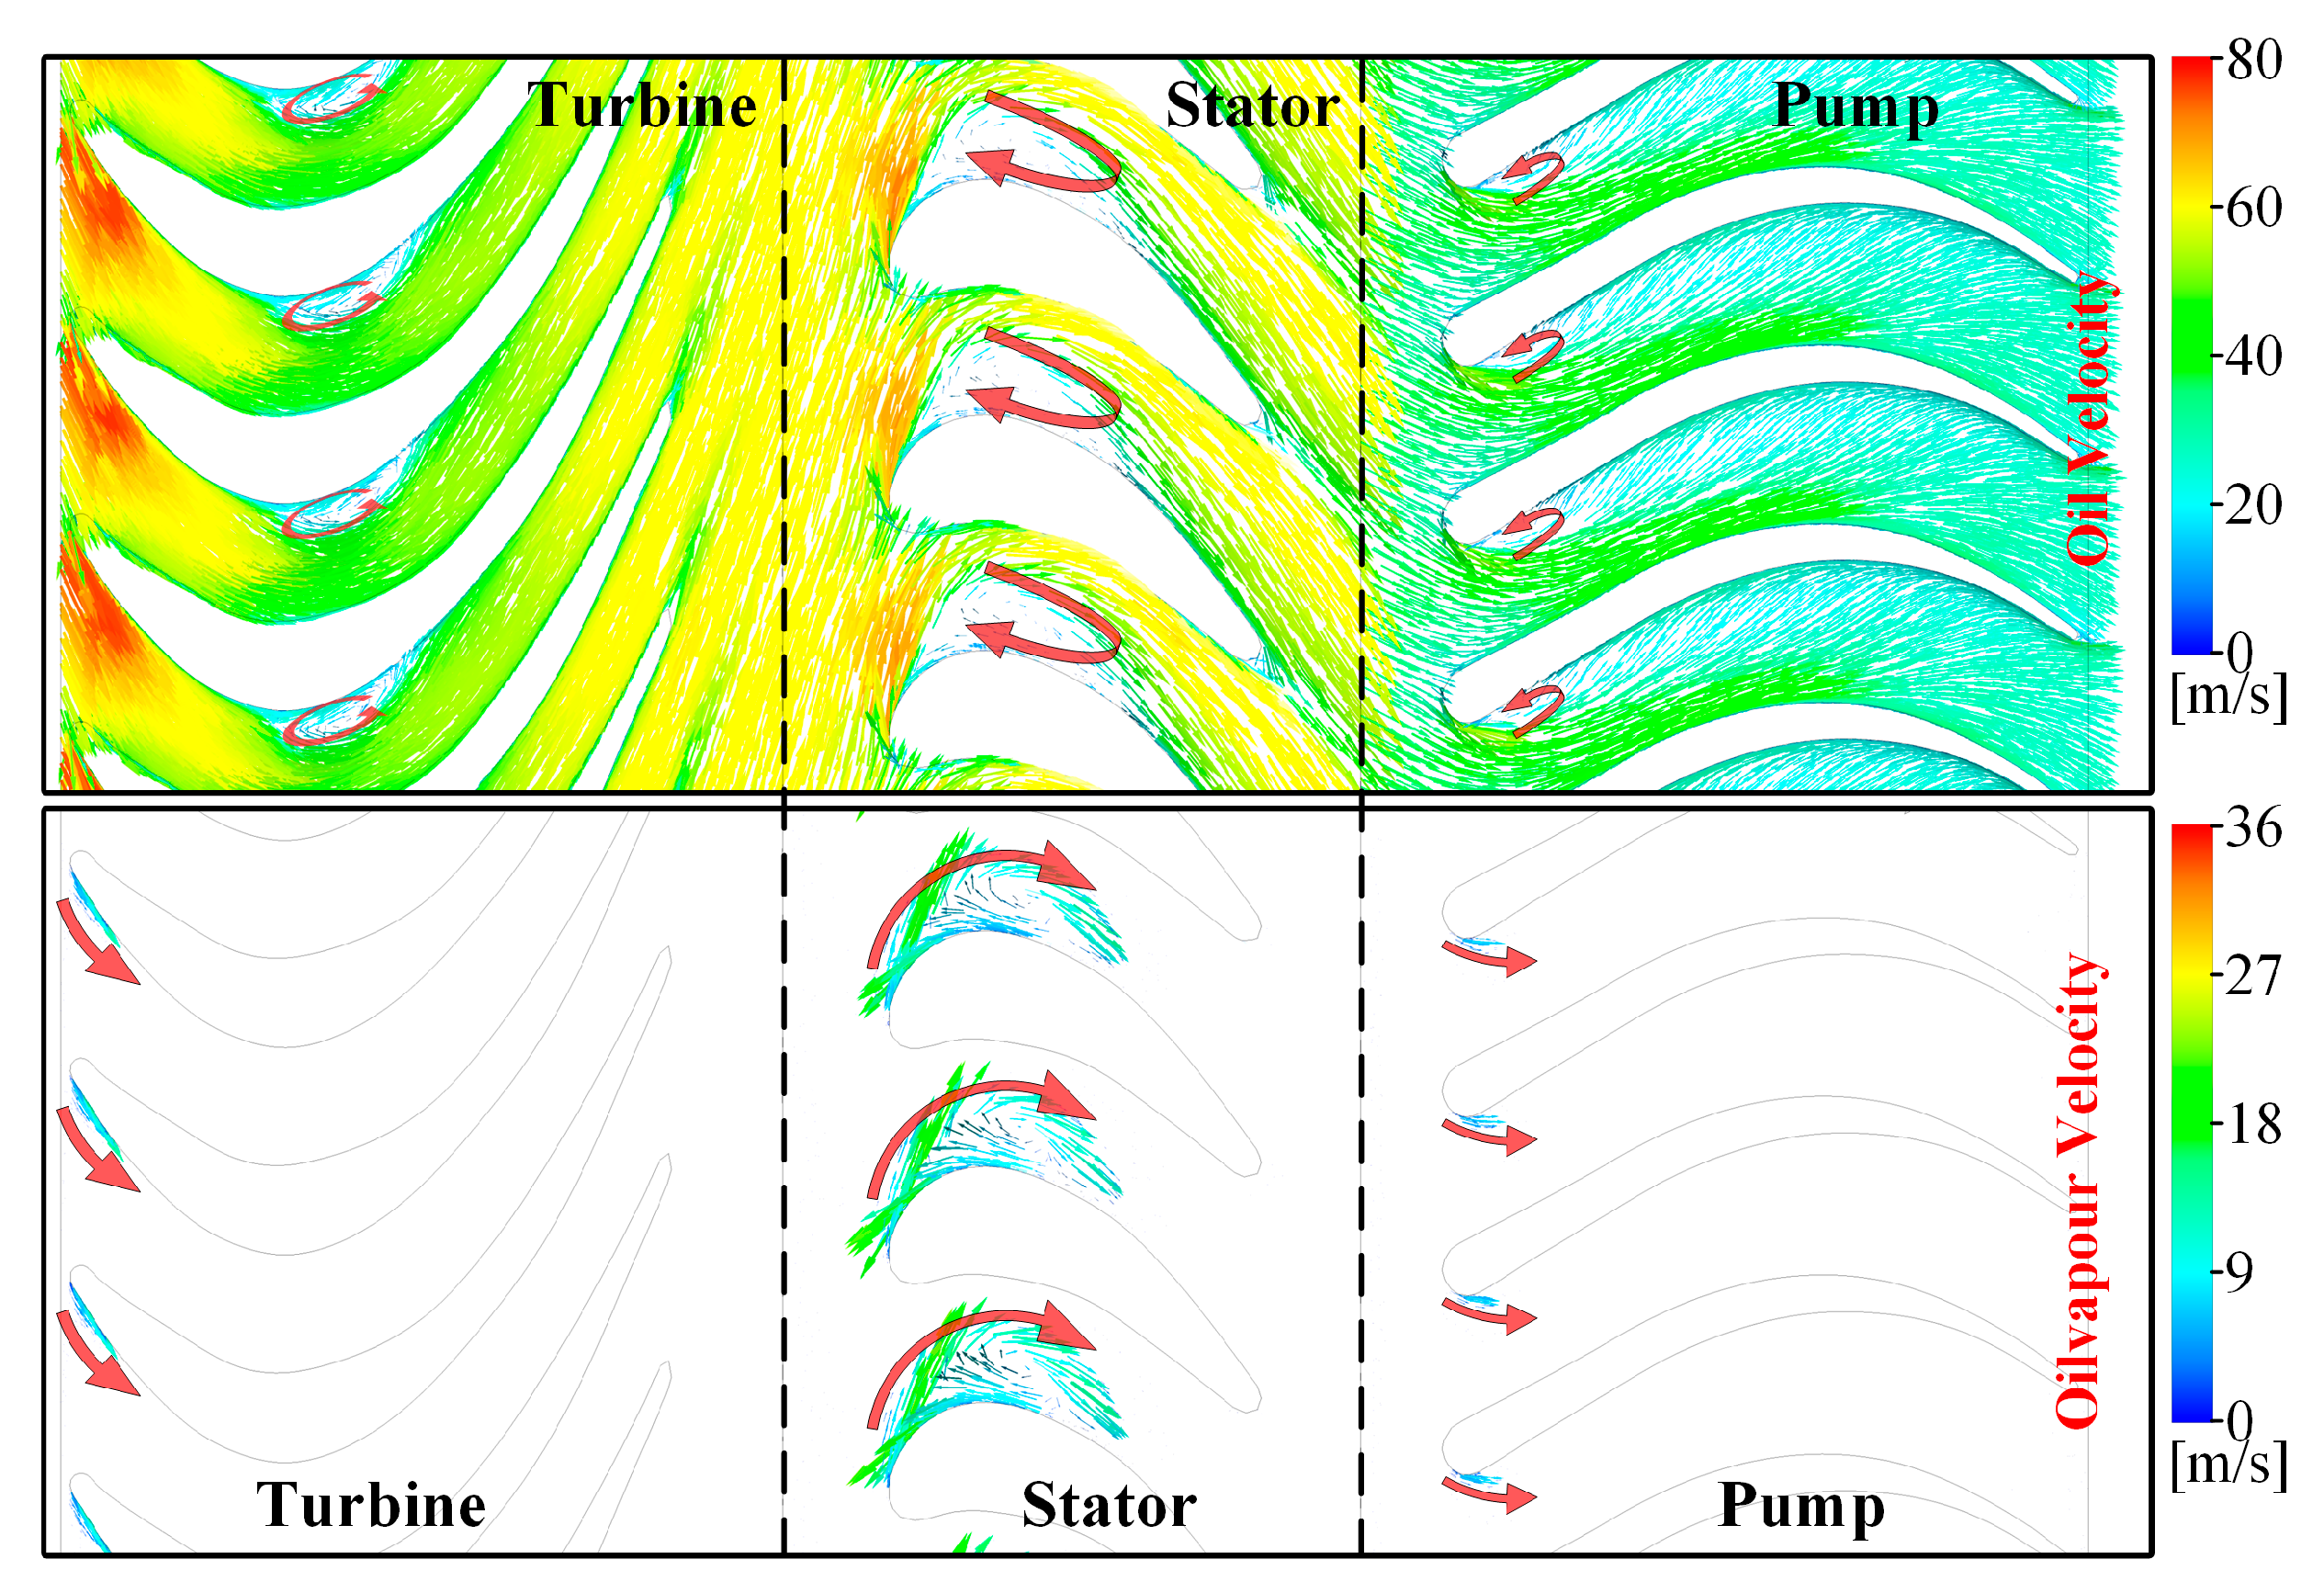
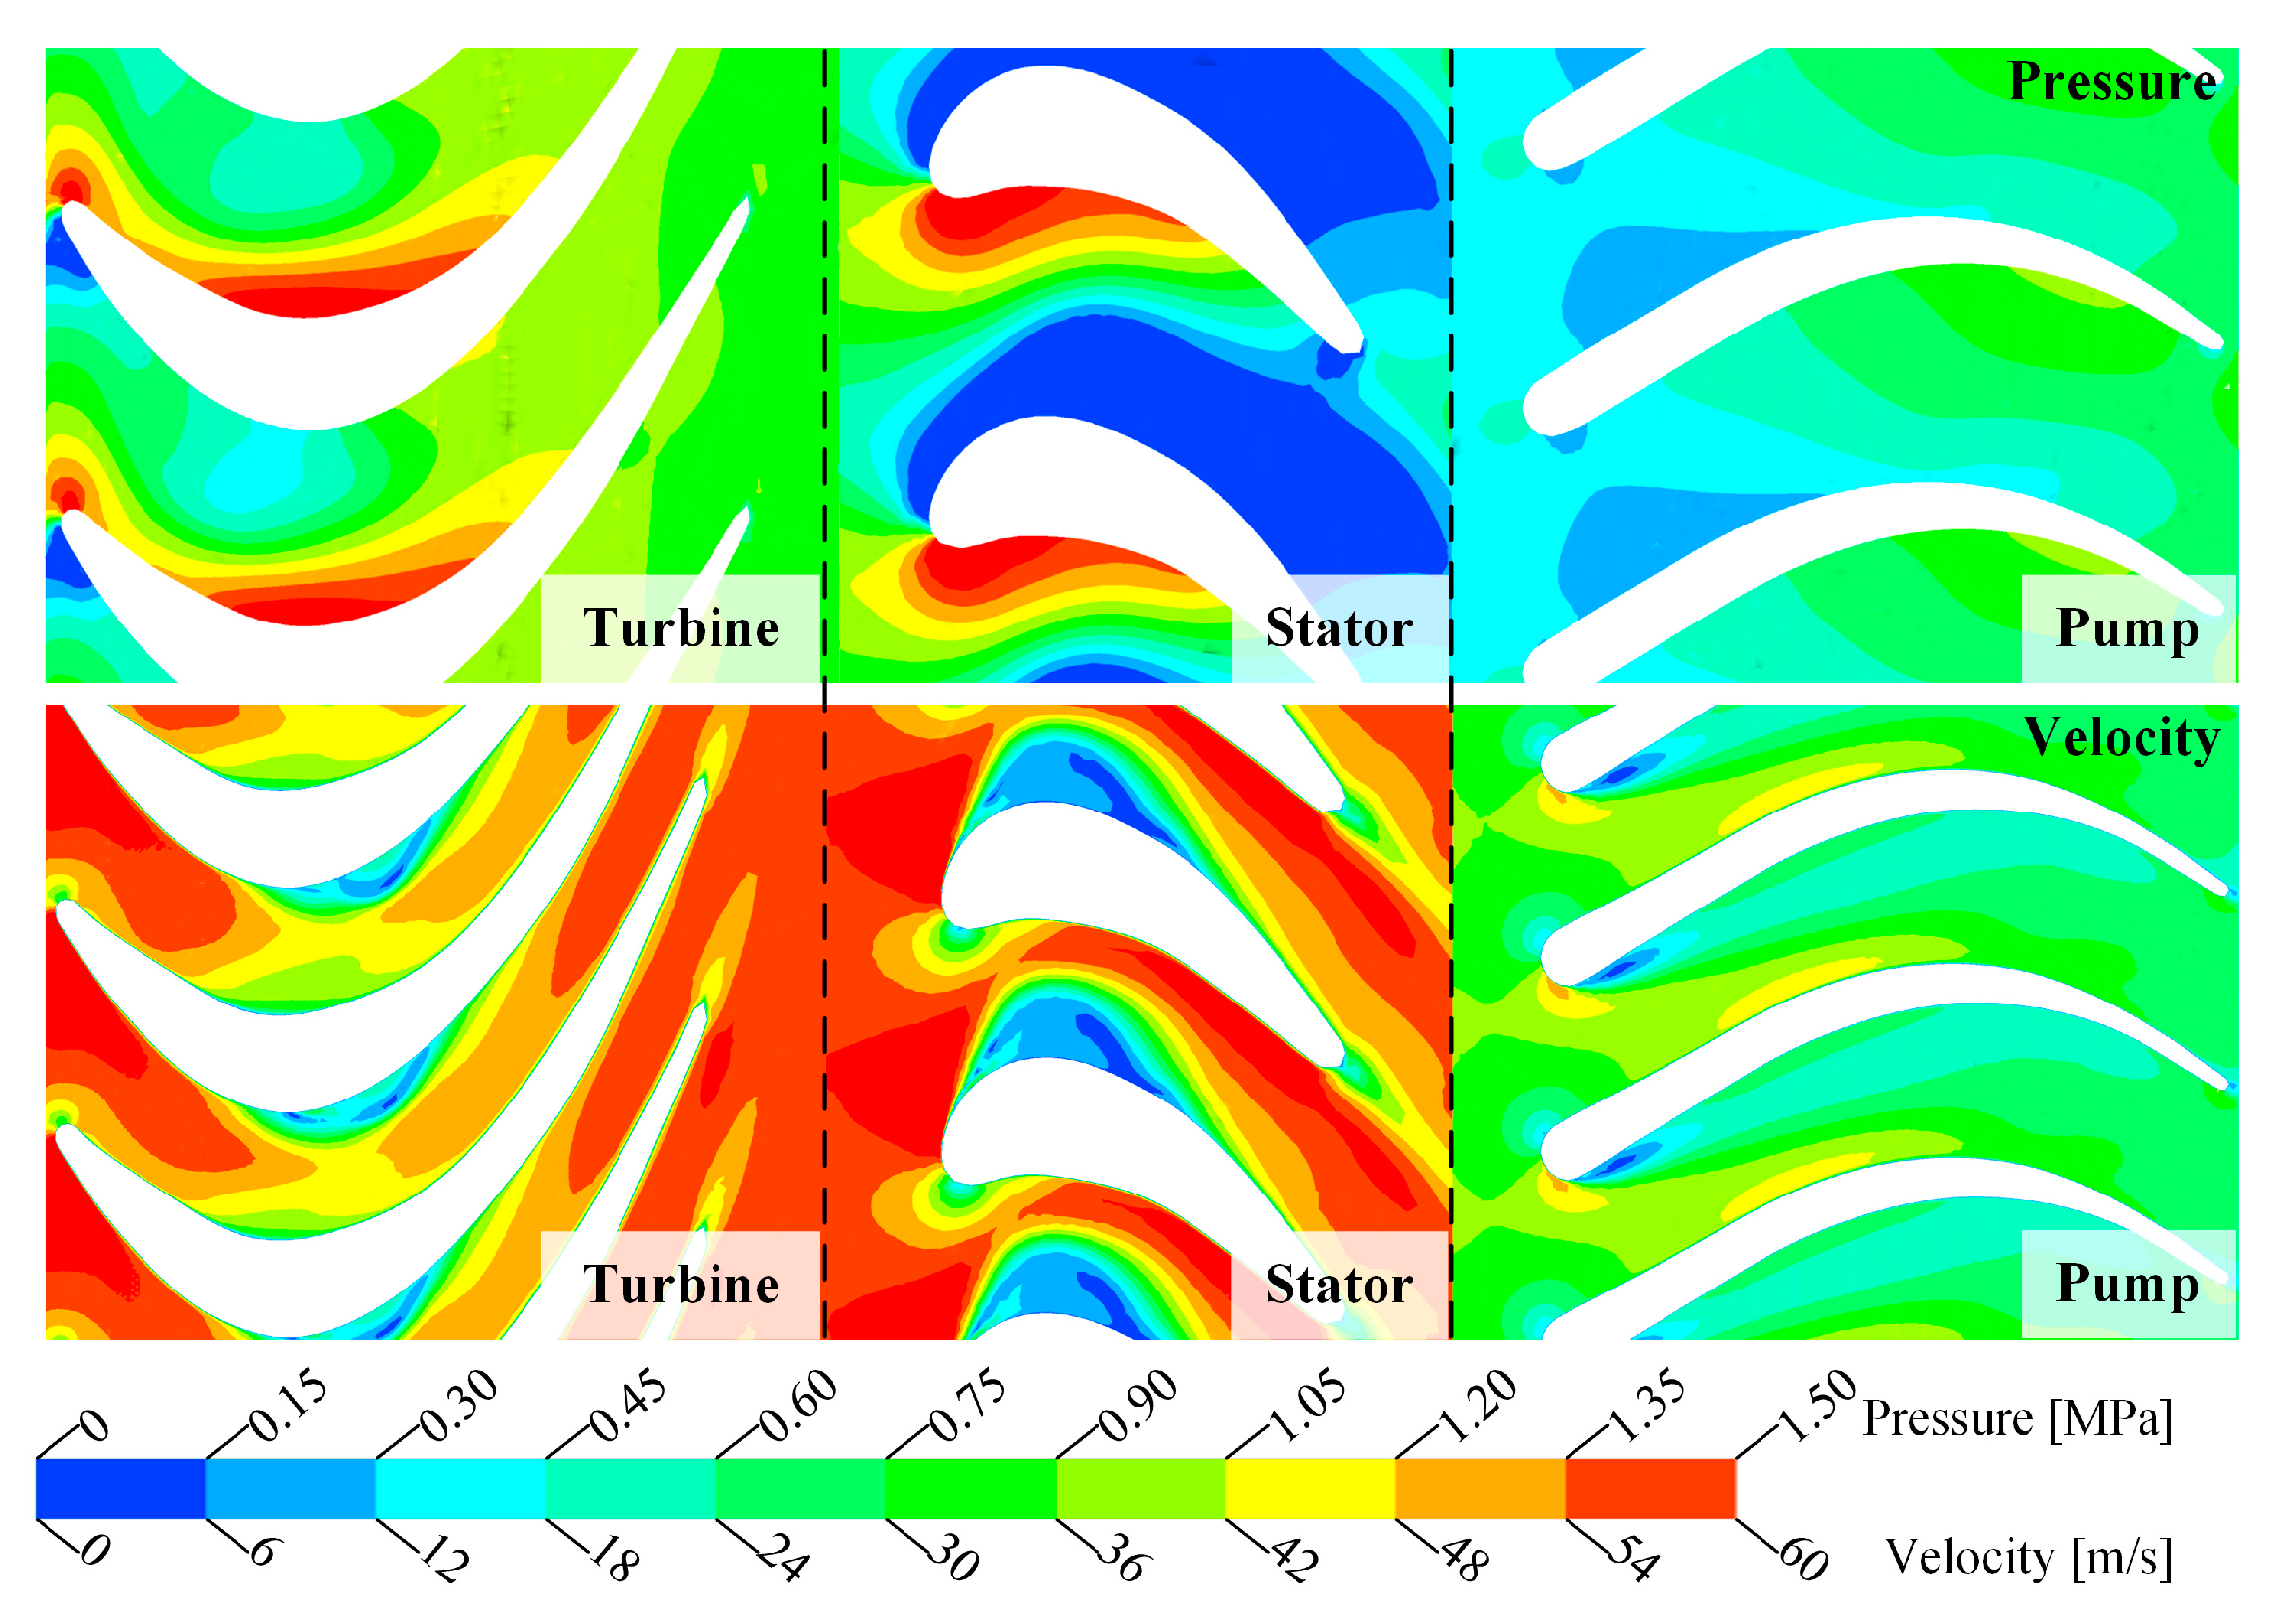
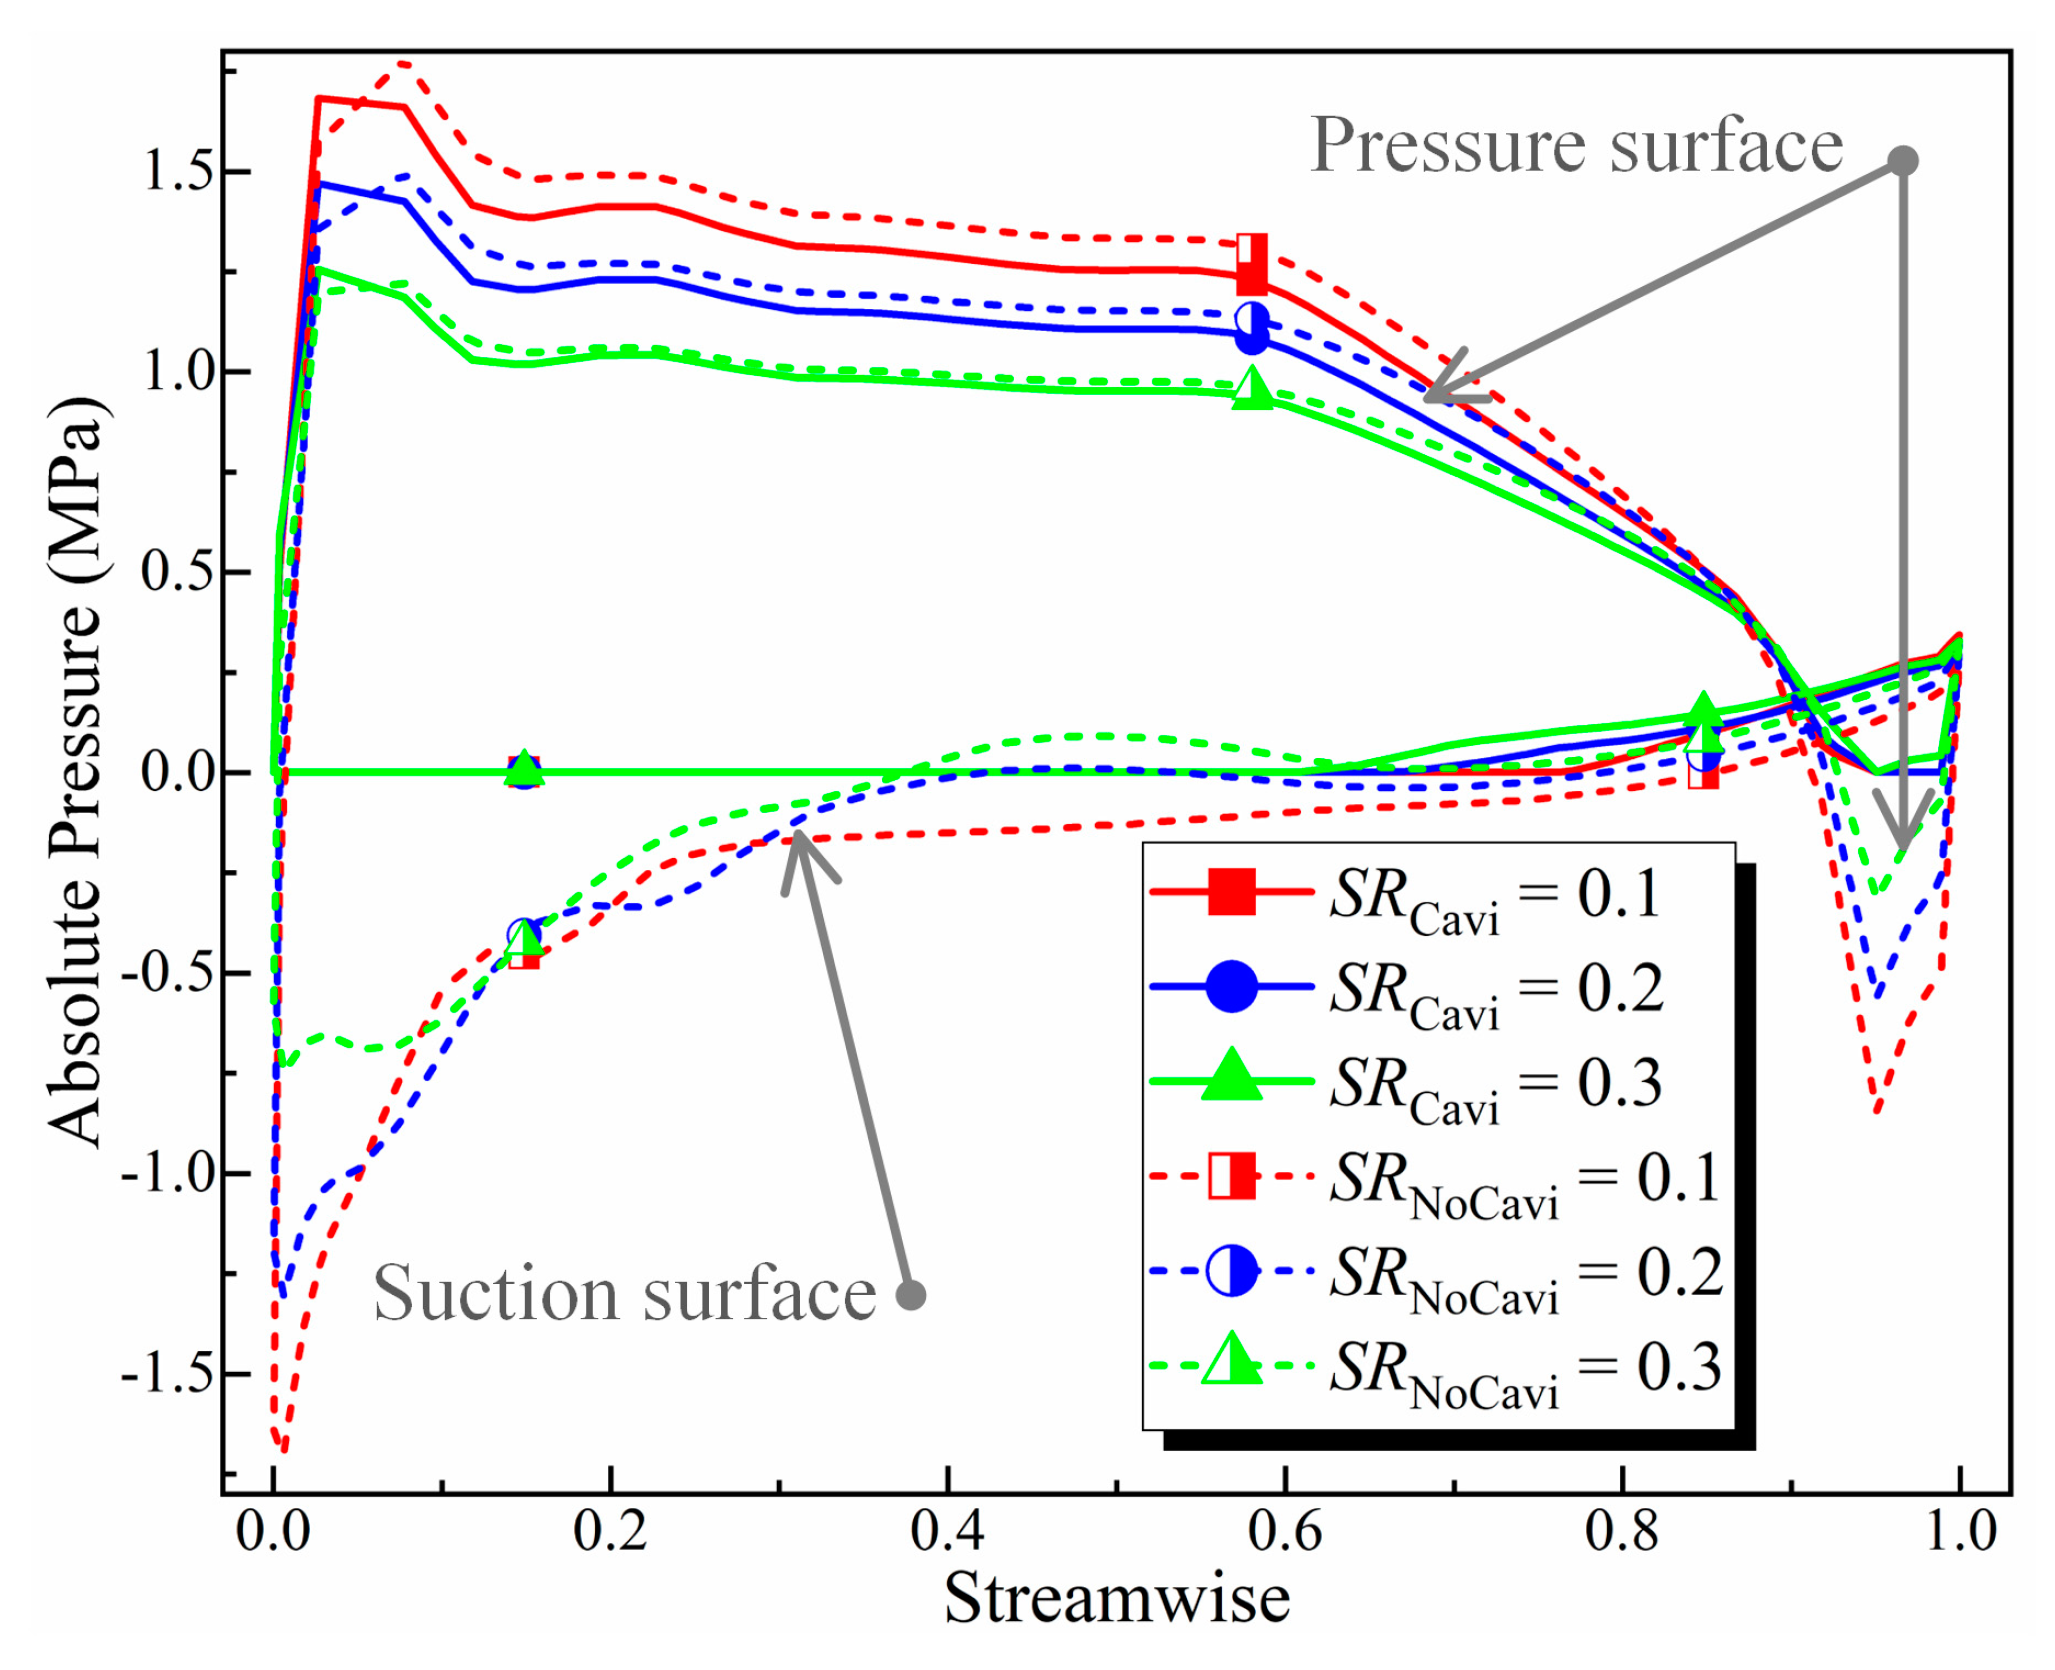
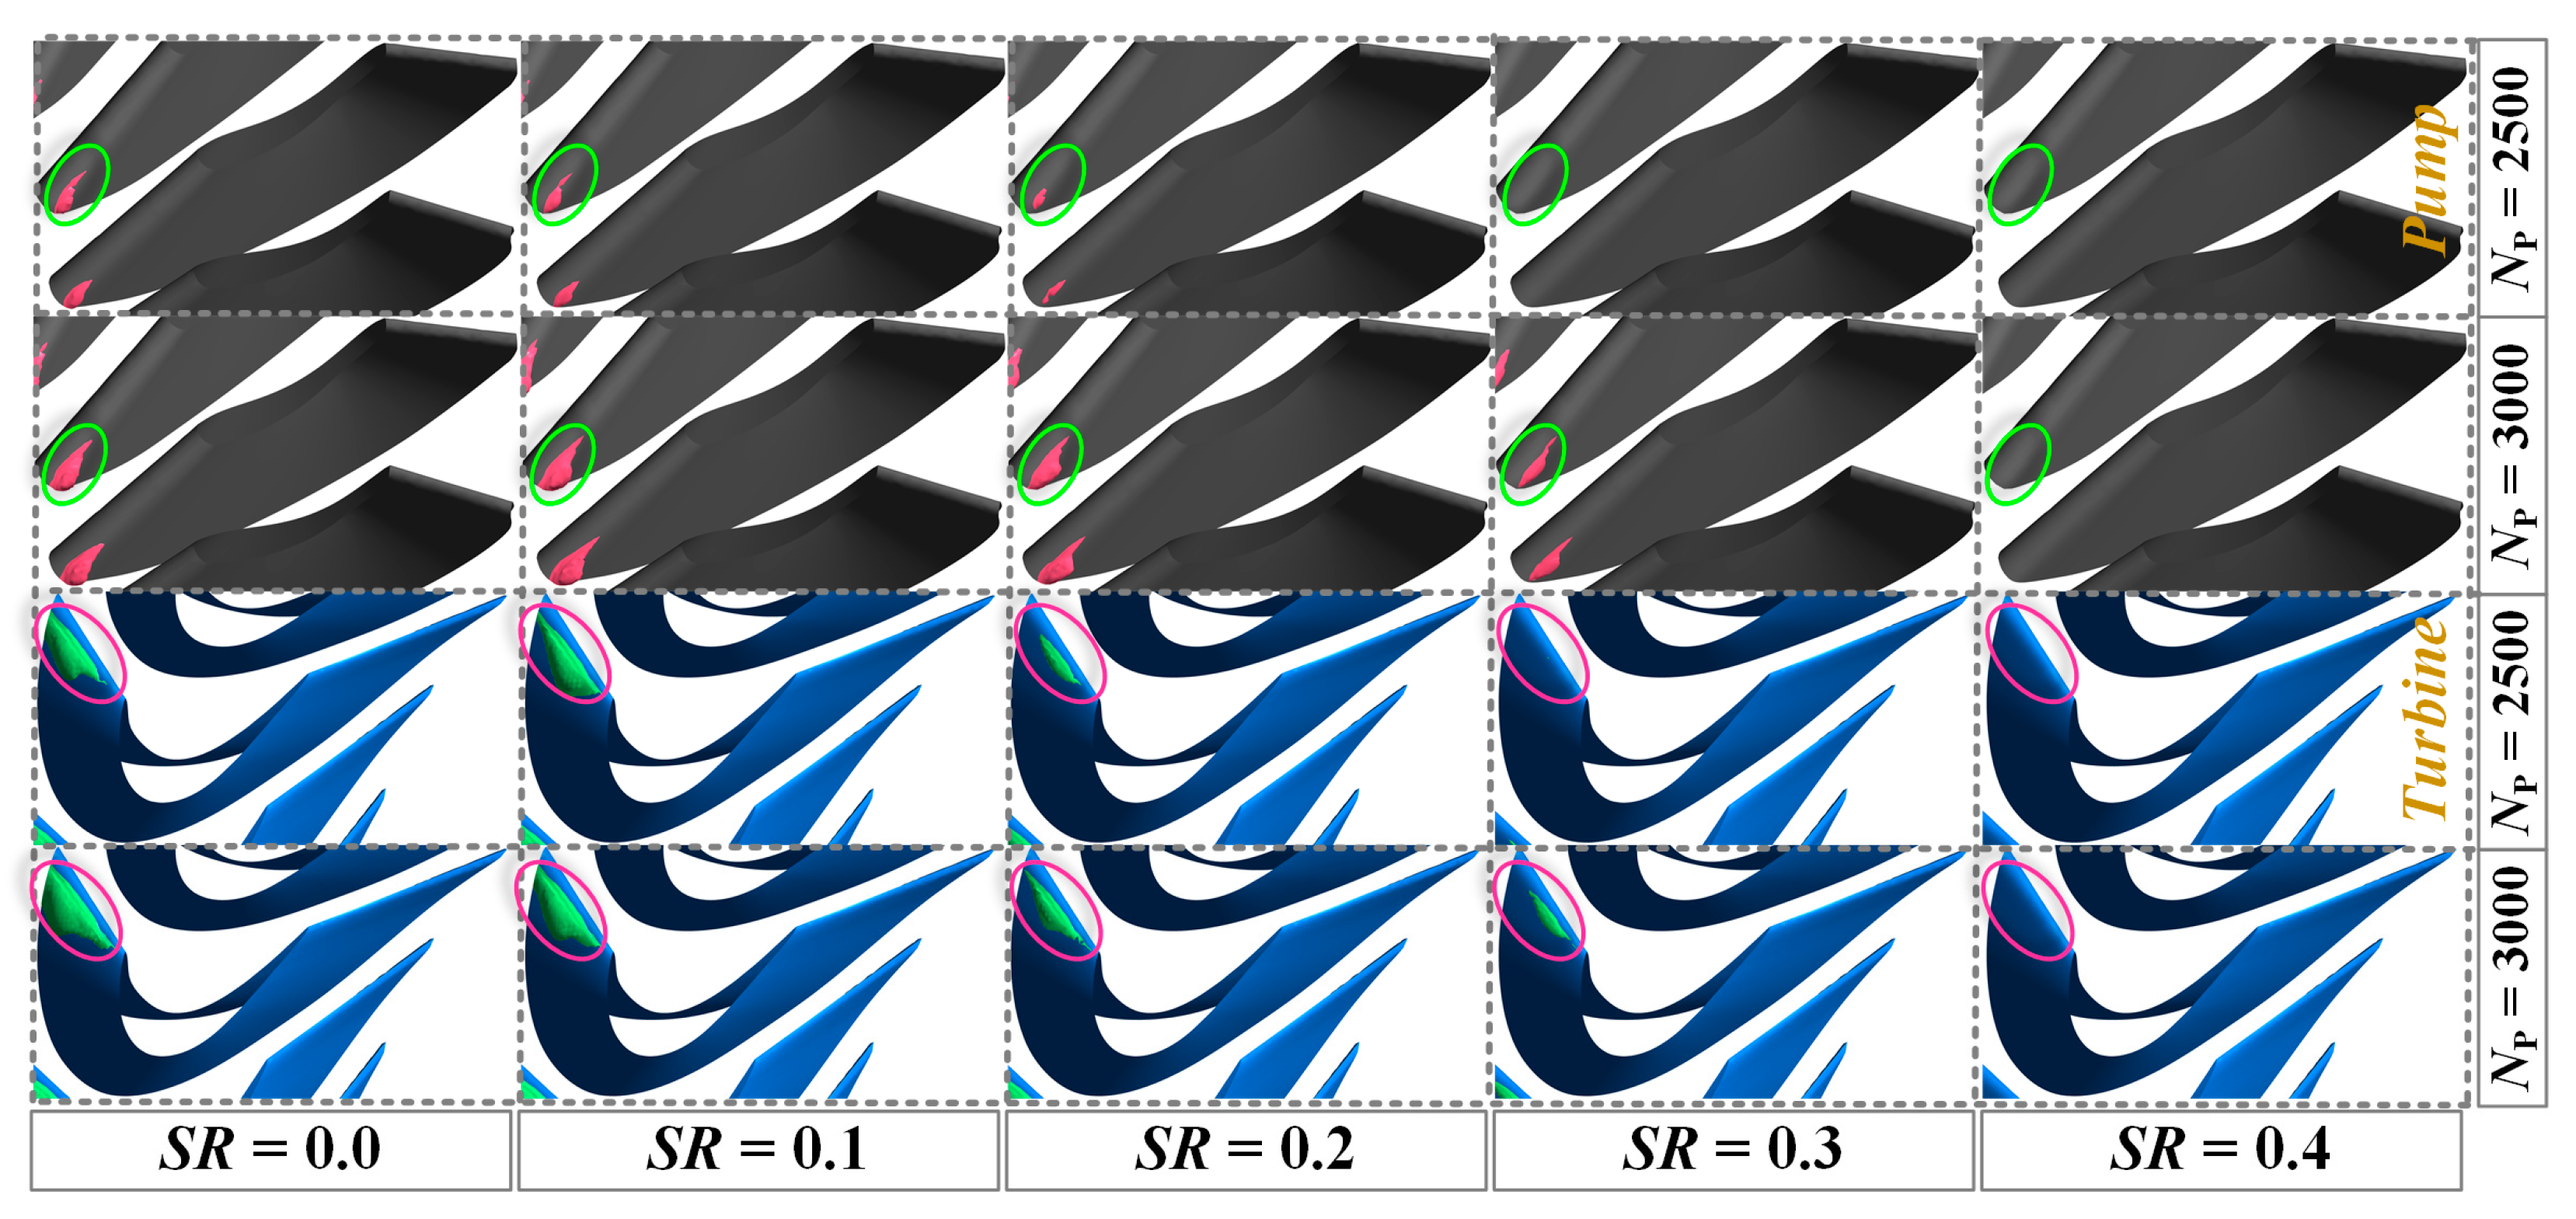
4.2. Cavitating Flow Field in the Torque Converter

4.2.1. Cavitating Flow Field

The 10% vapor volume fraction distribution inside the torque converter at stall when NP = 3000 rpm is shown in Figure 7. The figure clearly shows the existence of cavitation in the torque converter and the distribution of vapor inside each component.
It was found that cavitation occurred near the blade leading edge of the three impellers, and the cavitation inside the stator was the most serious from the volume and quantity of cavitation bubbles and the area covering the blade surface, followed by the turbine and the pump. Cavitation in the stator domain mainly occurred near the head on the suction side and covered most of the blade head [25], and then the cavitation bubbles broke and flowed downwards. It is worth noting that a small amount of cavitation bubbles also appeared at the tail of the blade. For the turbine, cavitation mainly occurred at the head near the suction side, covering only a small portion of the blade. Besides, only a small amount of cavitation bubbles can be found at the head of the pump blade.
The vapor volume fraction distribution in Figure 8 shows that most cavitation bubbles were generated in the stator domain, with the highest vapor volume fraction exceeding 90%, and a small amount of cavitation also appearing at the tail of the blade. Cavitation in the pump and the turbine occurred only to a small extent, and the maximum vapor volume fraction was about 30%.
The flow velocity distribution and variation in the torque converter also play a key role in cavitation. It can be found from Figure 9 that the velocity in the turbine and stator is greater than that in the pump. Moreover, reverse flows were observed in these impellers [26], which were located on the suction side of the stator blade near the inlet, in the middle of the turbine flow passages and on the pressure side of the pump blade near the inlet [27]. These reverse flows were located near the cavitation site, which would induce cavity breakoff and hence cause vibration and noise. It is worth noting that the velocity at the turbine inlet was higher than that at the stator inlet, but no intense cavitation was detected. The reason is that the turbine inlet was adjacent to the pump outlet, and the high-speed rotation of the pump gives rise to high centrifugal pressure, which adds up the overall pressure level at the turbine inlet, resulting in less-intense cavitation (Figure 10).
The absolute pressure distributions along the streamwise direction in the stator domain under various speed ratios are shown in Figure 11. The results show that if cavitation is ignored, unrealistic negative pressure can be found on the suction side of the stator blade near the entrance, resulting in an overprediction of stator torque. The results from the cavitation model show that cavities occurred near the absolute negative pressure region clipping the absolute pressure to the vapor pressure, consequently leading to performance reduction. It can be concluded that the existence of cavities would change the pressure distribution drastically, resulting in torque reduction and performance degradation, and the simulation results for the CFD model without cavitation are unrealistic as negative absolute pressure occurs, which can be seen in Figure 12. It also shows that the results considering cavitation can effectively improve the calculation accuracy.

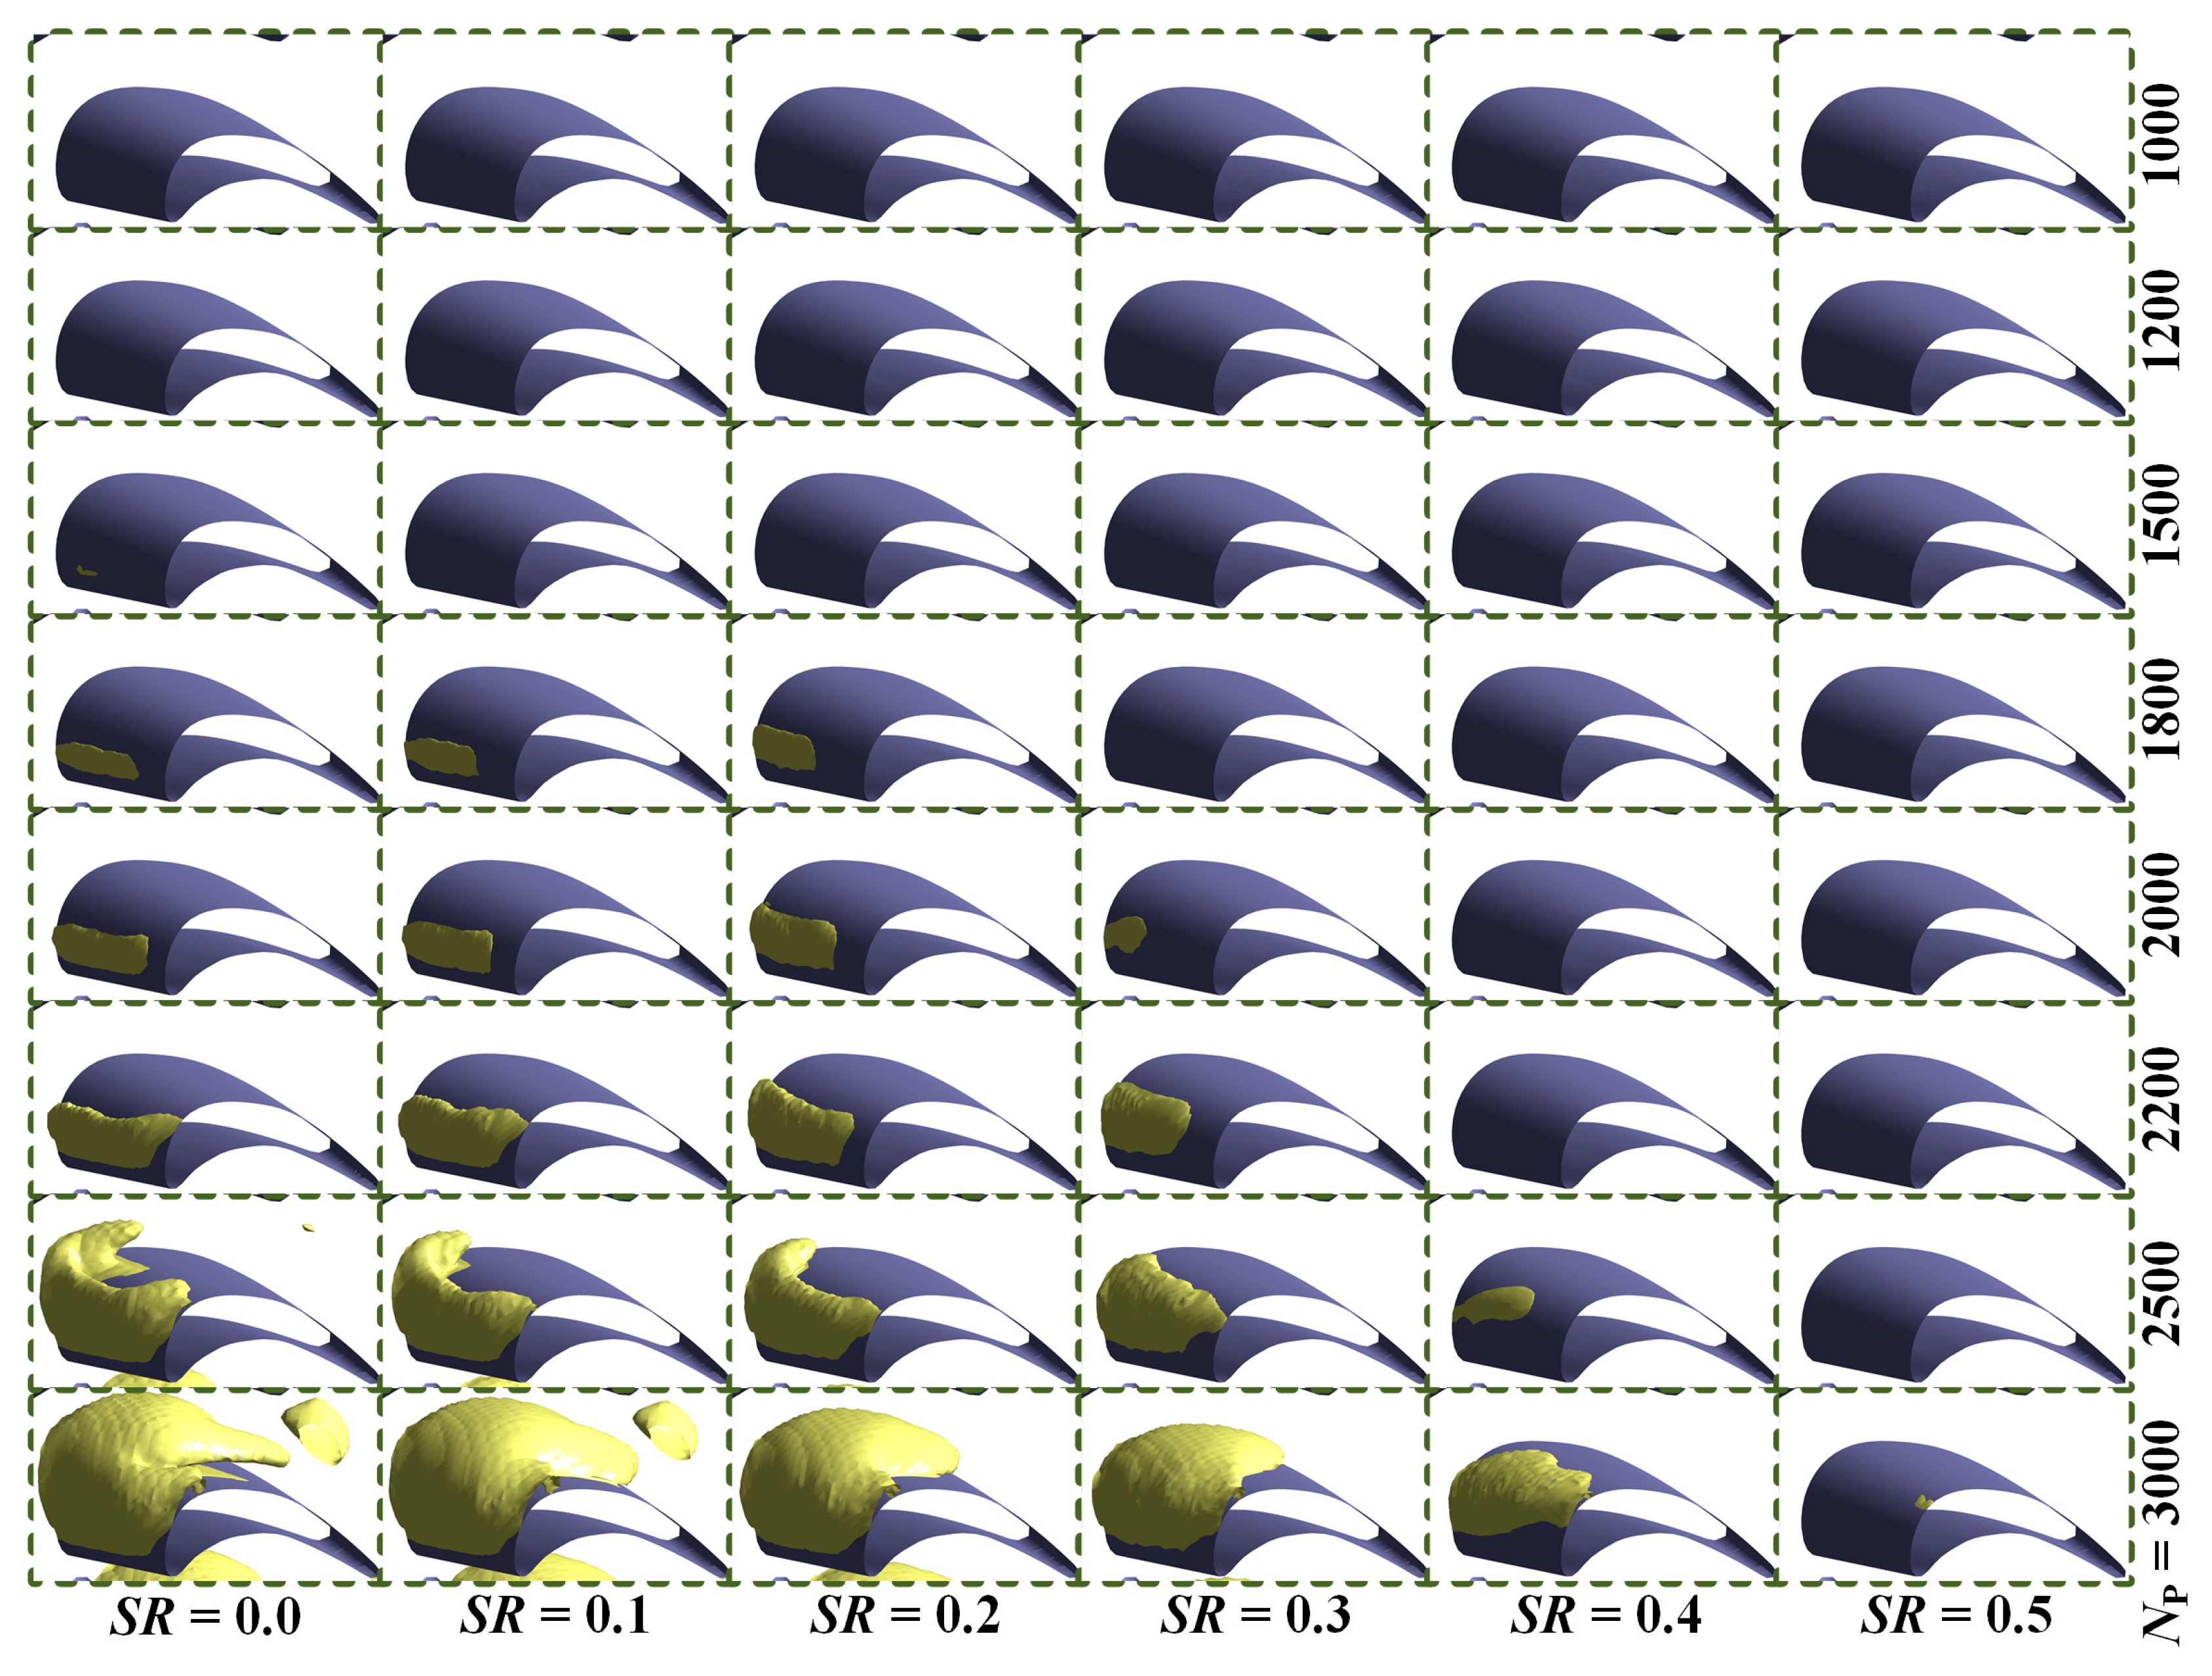
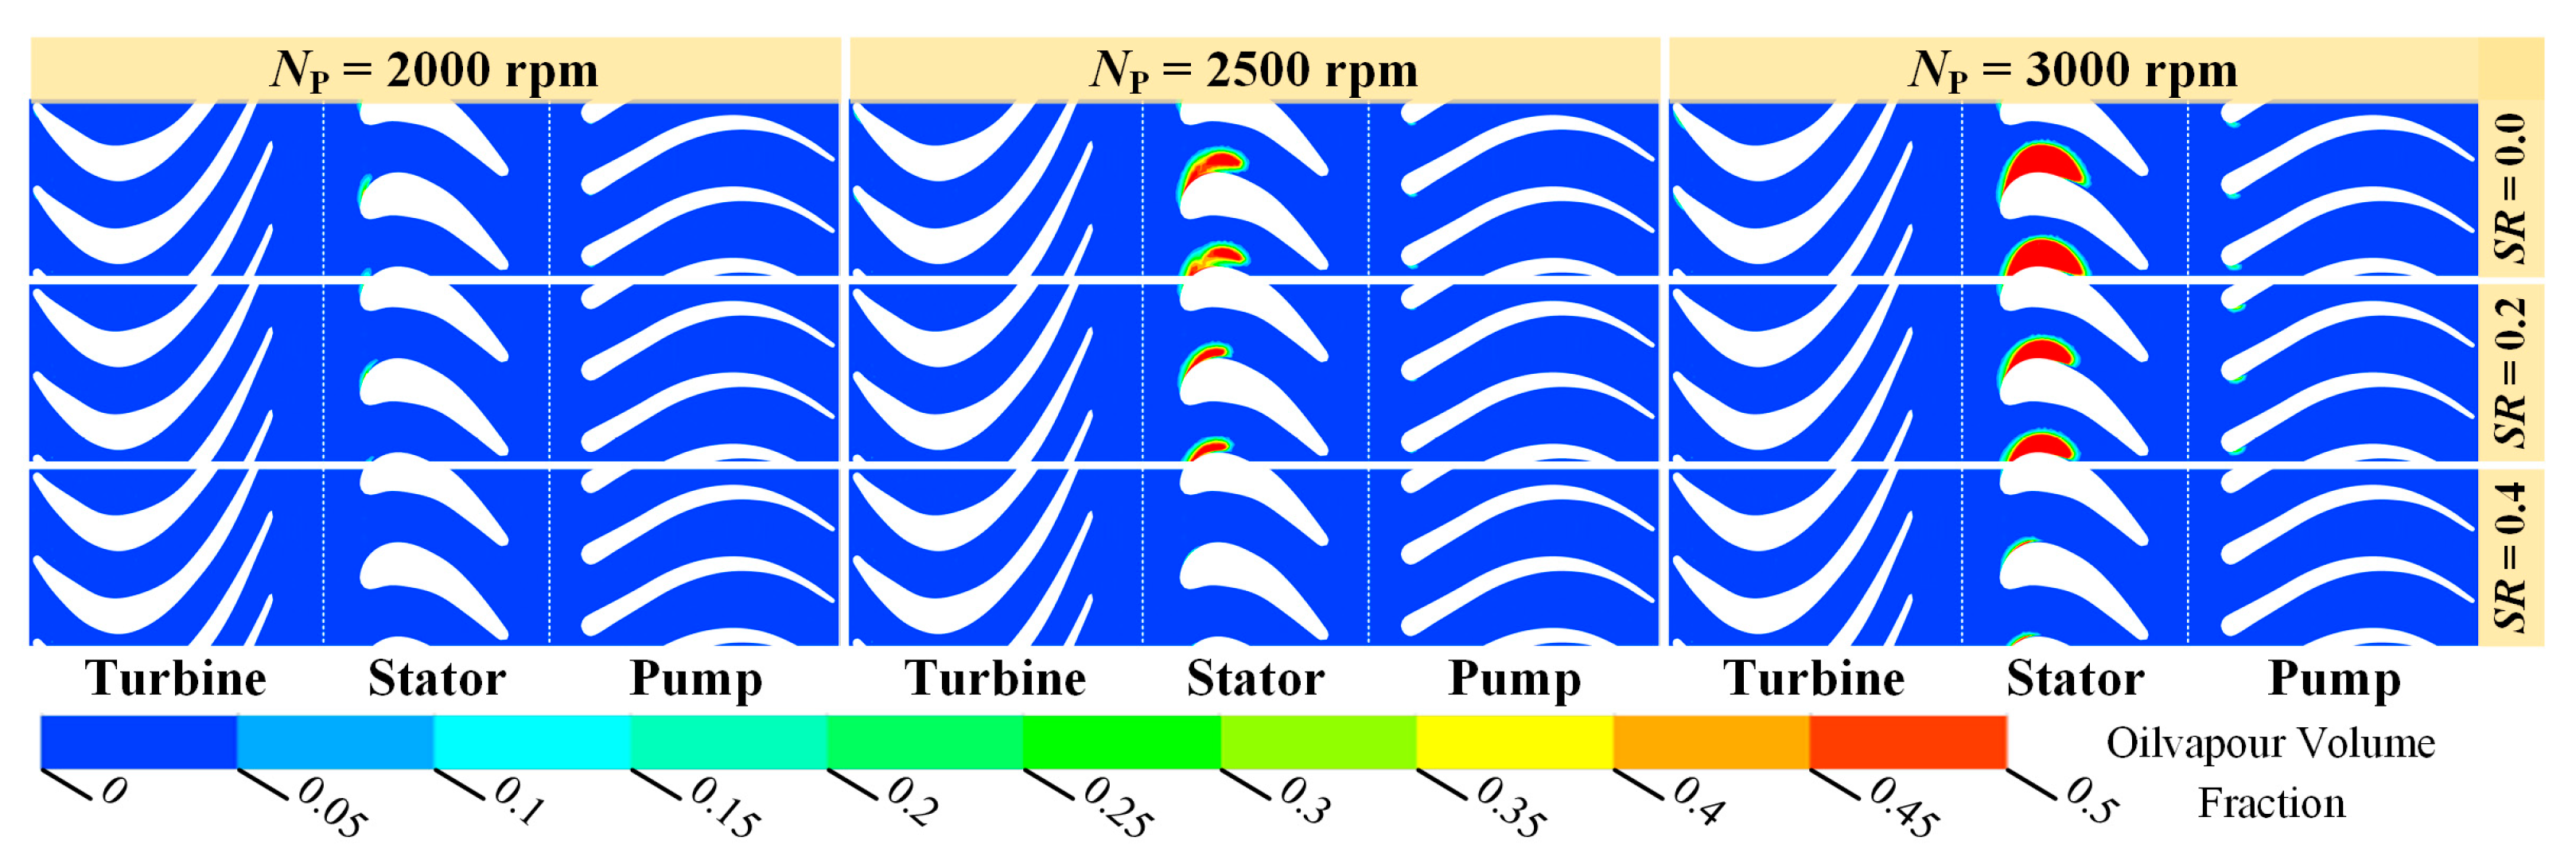
4.2.2. Cavitation Characteristics under Different Rotating Speeds

The 10% vapor volume fraction distribution in Figure 13 shows that cavitation began to appear in the stator at stall when NP = 1500 rpm, and the cavitation range expanded with an increasing pump rotating speed [28]. When the pump rotating speed reaches 3000 rpm, most of the suction side of the stator blade was covered by cavitation and some bubbles were detached from the blade head and flowed downstream. The cavitation region shrinks with an increasing speed ratio, and no obvious cavitation bubbles could be found when SR > 0.5 in our simulations.
The 10% vapor volume fraction distribution in the pump and the turbine domain indicates that the cavitation degree is directly related to the pump rotating speed and inversely related to the speed ratio, as shown in Figure 14. The cavitation mainly occurred at the pressure side in the pump domain; on the contrary, cavitation bubbles appeared on the suction side in the turbine domain. Moreover, cavitation firstly occurred in the stator domain, followed by the turbine and the pump with the increase of pump rotating speed or the decrease of speed ratio. It should be noted that there was no cavitation in the torque converter at high speed ratios when NP ≤ 3000 rpm, and the working conditions with SR > 0.5 will not be described in detail.
The data in Table 2 shows that the critical working condition for cavitation occurrence varies with the pump rotating speed and the speed ratio. The critical cavitation condition shifts towards a high speed ratio with the increase of the pump rotating speed.
The relationship between cavitation conditions and the speed difference between the pump and the turbine (△NPT) is provided in Table 3. The data show that cavitation will occur in the stator when △NPT is greater than 1400 rpm; moreover, cavitation appears in the turbine and the pump when △NPT is greater than 2000 rpm and 1700 rpm, respectively. It can be concluded that cavitation degree and range increase with the increase of △NPT, which could be used as a cavitation indicator to reflect the critical cavitation condition.
It can be found from Figure 15 that both cavitation extent and vapor volume fraction increase significantly with the increase of the pump rotating speed, especially in the stator blade. Besides, the cavitation volume and vapor volume fraction decrease, and even disappear when the turbine rotating speed (speed ratio) increases. It is worth noting that high pump rotating speed makes the torque converter more prone to cavitation. Higher pump rotating speed indicates greater cavitation degree and longer cavitation range.
Figure 16 shows that the overall cavitation level, which is indicated by the average and maximum vapor volume fraction, increases with the increase of the pump rotating speed and decreases with the increase of speed ratio. Moreover, the maximum vapor volume fraction exceeds 0, indicating the occurrence of cavitation bubbles, when △NPT is greater than 1400 rpm. Therefore, the critical cavitation condition for this torque converter is △NPT = 1400 rpm.
It can be found from Figure 17 that cavitation occurred when the average velocity exceeded 17 m/s and the average pressure was lower than 0.453 MPa, the degree of cavitation is directly proportional to the average velocity and inversely proportional to the average pressure. It will increase the average velocity in the stator and aggravate the cavitation phenomenon when increasing the pump rotating speed or reducing the speed ratio. It should be noted that the influence of the pump rotating speed on average pressure in the stator domain is greater than that of speed ratio, and the pressure change rate under cavitation conditions is less than that under no cavitation conditions with the increase of speed ratio at the same pump rotating speed. This is also one of the main manifestations of cavitation.

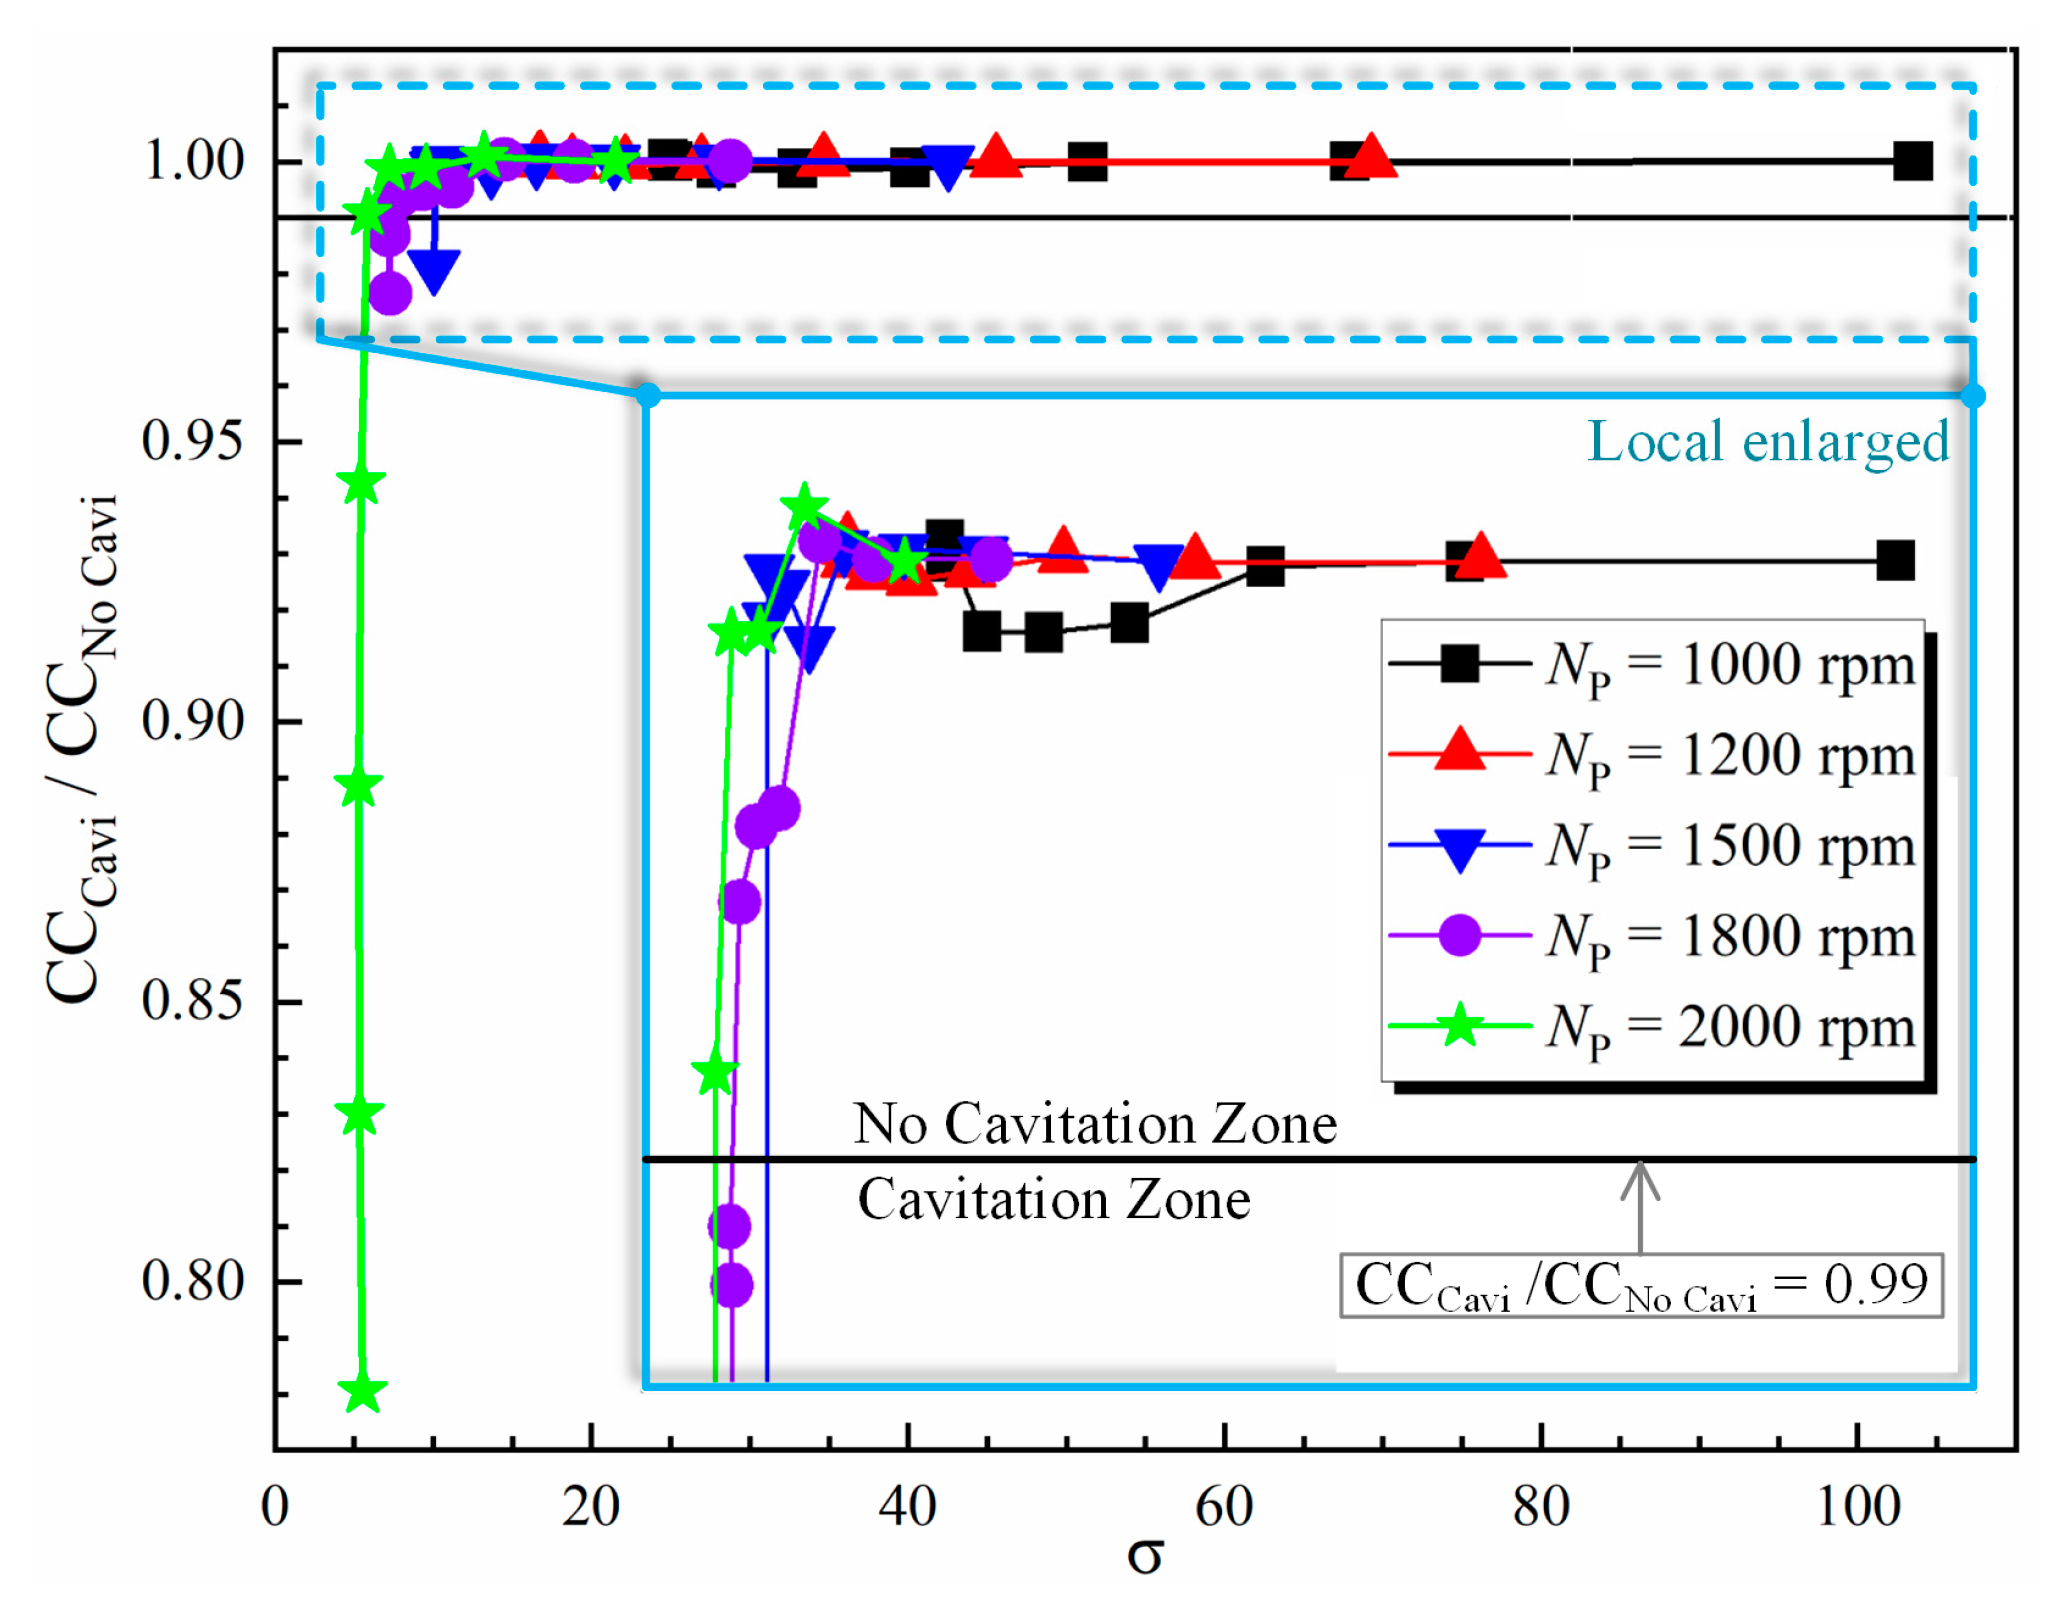
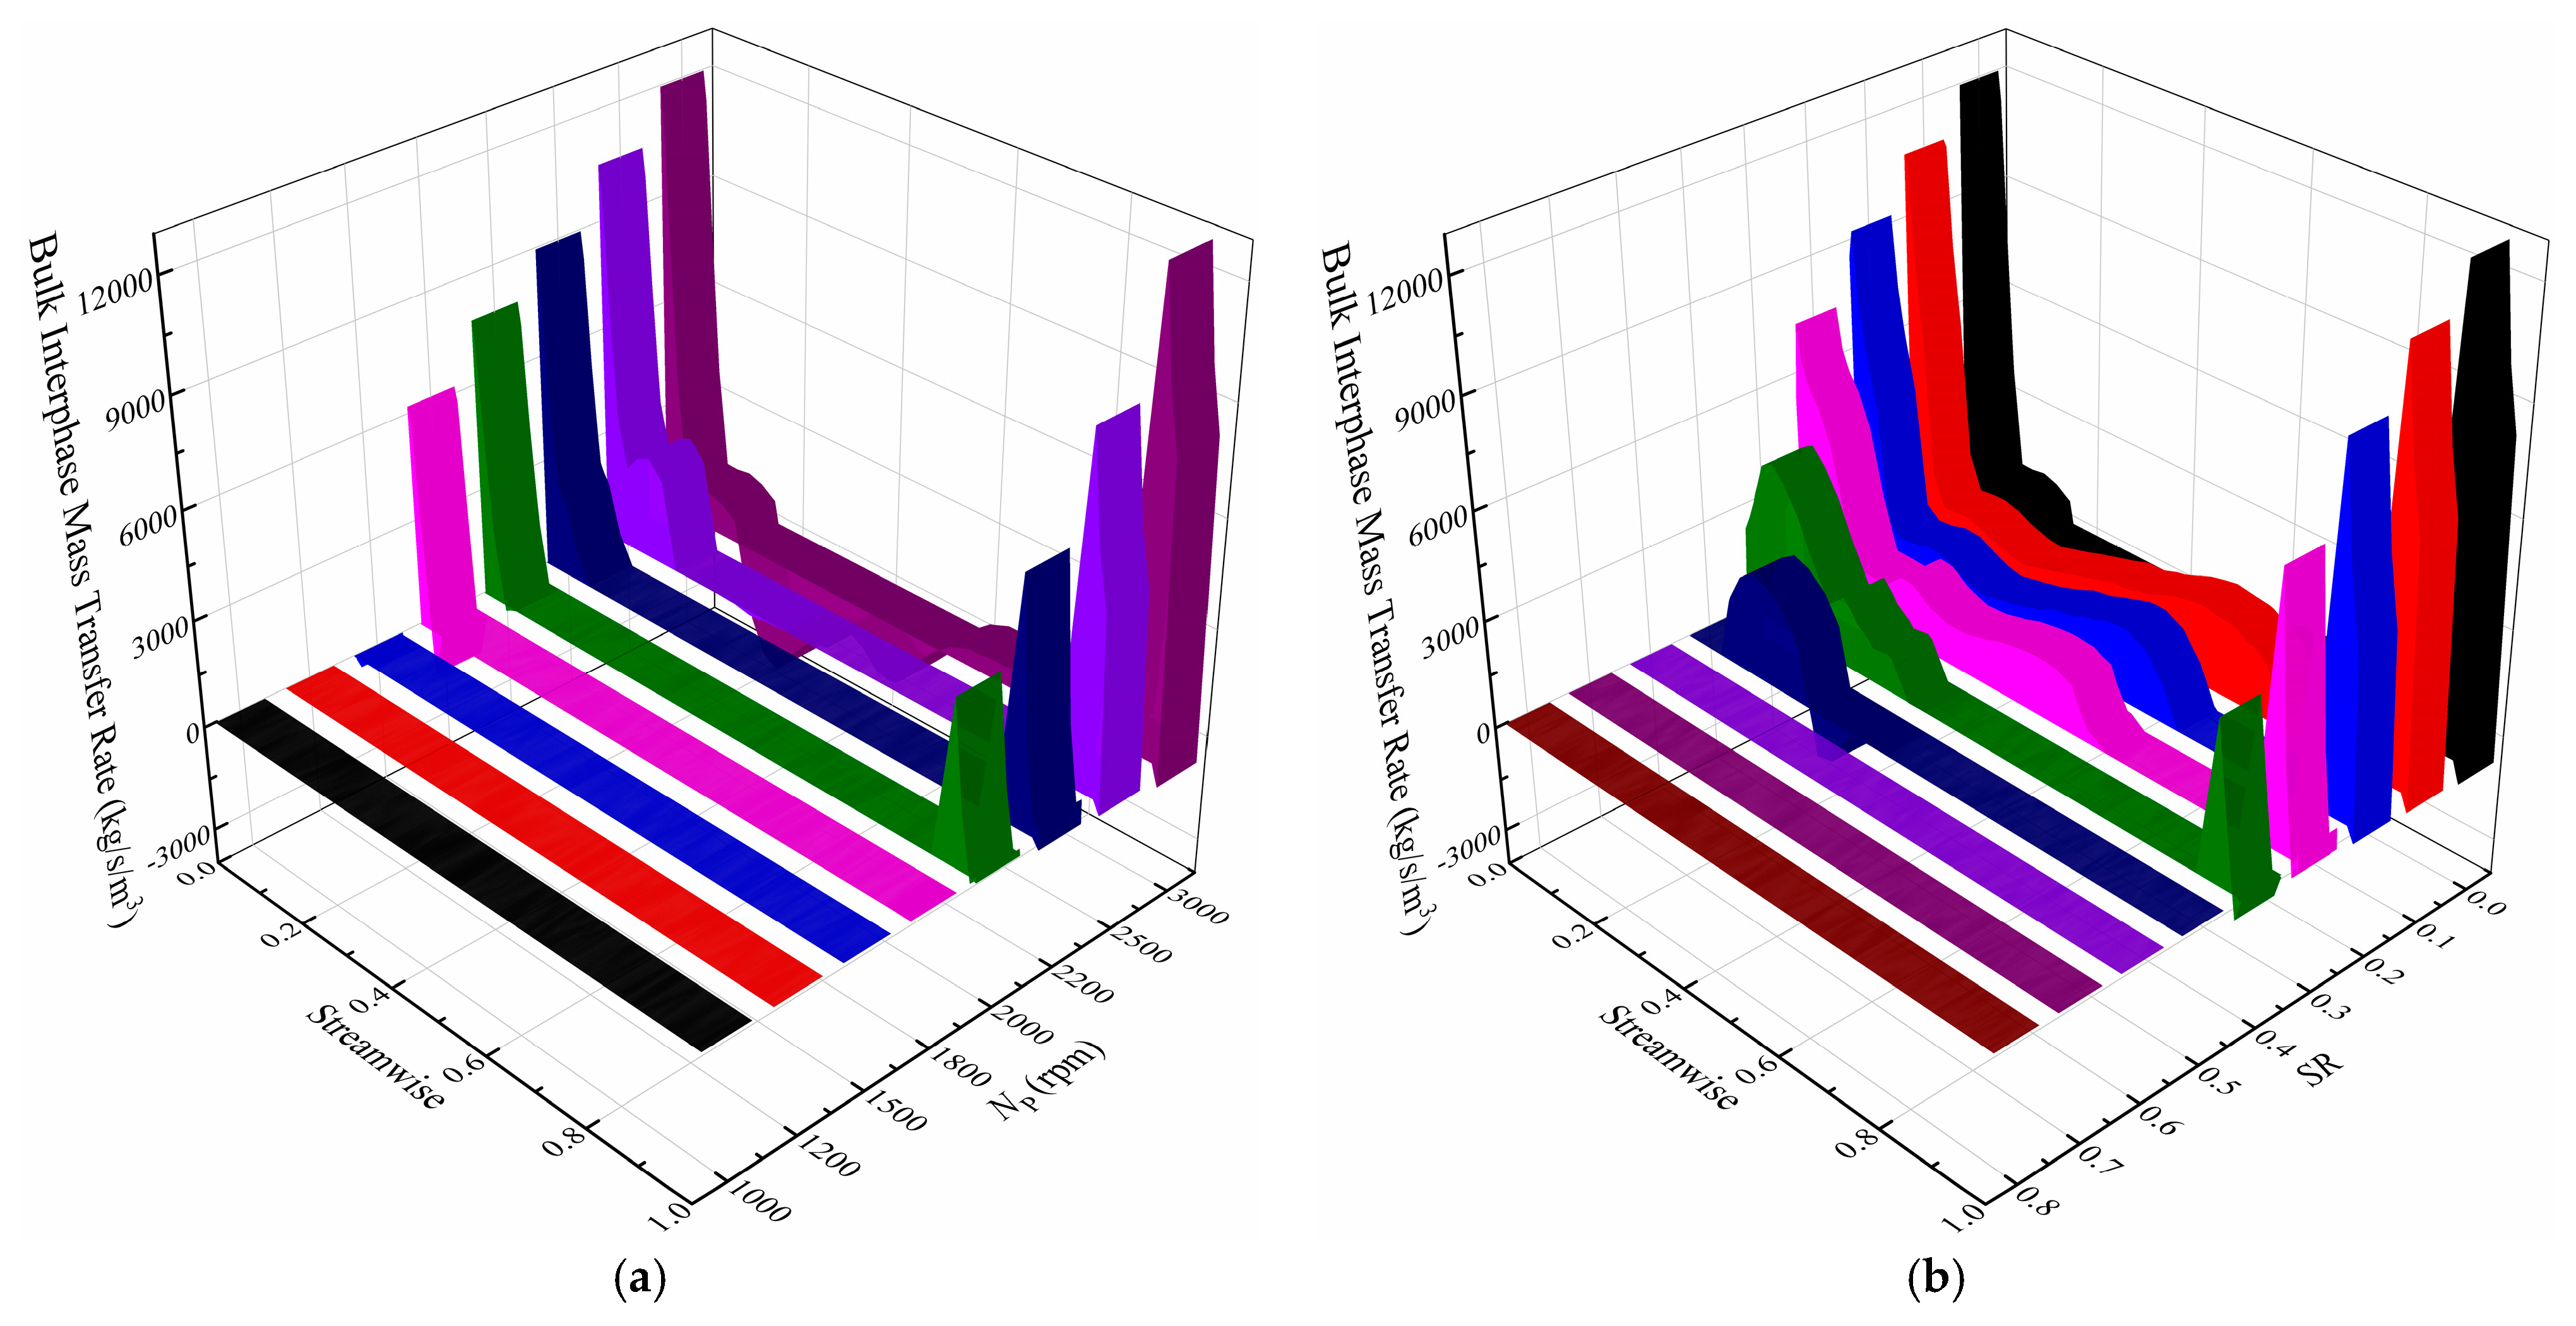
4.3. Cavitation Number and Interphase Mass Transfer

The non-dimensional cavitation number σ is a measure of the cavitation degree. Cavitation occurs when σ drops below the critical level, and smaller cavitation number indicates a higher degree of cavitation. The cavitation number in the torque converter can be calculated using the following,
σ = p r e f p v 0.5 ρ l v r e f 2 .
where pref represents the charge pressure, pv is the saturated vapor pressure, ρl is the oil density, and vref is the equivalent average velocity inside the torque converter, which correlated directly to the mass flow rate, given as:
v r e f = M F A ρ l .
Here, A is constant throughout the whole flow passage, A = 2.7 × 10⁻² m2 in this model.
As shown in Figure 18, σ is positively related to the speed ratio and negatively correlated to the pump rotating speed. The influence of the pump rotating speed on the cavitation number is much greater than the turbine rotating speed. At the same time, the critical cavitation number is also the key feature to determine whether cavitation has occurred or otherwise. It is worth noting that the critical cavitation number is also affected by the torque converter rotating speed effect and the internal unsteady flow field. We can conclude from Figure 18 that increasing the pump rotating speed will reduce the critical cavitation number of the torque converter, and extend the cavitation range towards high-speed ratio conditions.
The capacity constant ratio (CCCavi/CCNoCavi, the simulation ratio of the capacity constant with and without cavitation) was determined and shown in Figure 19 to illustrate the capacity losses caused by cavitation. Combined with the relationship between cavitation number and pump rotating speed and speed ratio, we can conclude that the capacity constant ratio increases with the increase of the cavitation number, the speed ratio and the decrease of pump rotating speed. In addition, the data show that cavitation occurs when the capacity constant ratio is less than 0.99, and gradually weaken to disappear when it is higher than 0.99.
The vapor mass fraction, the oil absolute pressure and the bulk interphase mass transfer rate between oil and vapor on the stator blade surface at various pump rotating speeds and speed ratios were compared and analyzed.
The bulk interphase mass transfer rate between oil and vapor on the stator blade surface demonstrates that there was a conversion of the two phases at the head and tail of the stator blade, and most of it was positive, thereby resulting in vaporization at the corresponding area, as shown in Figure 20. A higher bulk interphase mass transfer rate indicated more intense cavitation. It can be seen clearly that positive bulk interphase mass transfer occurred only when NP was greater than 1500 rpm, and increased with the increase of the pump rotating speed and the decrease of speed ratio.
The vapor mass fraction on the stator blade under various pump rotating speeds and speed ratios (Figure 21) expresses the distribution and movement of cavitation bubbles on the blade surface. The data show that the cavitation bubbles were mainly distributed on the head and tail of the stator blades, and the vapor mass fraction on the head of the blades was much greater than that on the tail. Moreover, with the increase of pump rotating speed and the decrease of speed ratio, the coverage area gradually expands from a small part on the head to more than half of the whole blade suction surface.
As the absolute pressure will be limited by the vapor pressure when local pressure drops below the critical level, the absolute pressure distribution on the surface of the stator blades is able to reflect the position where cavitation occurred, as shown in Figure 22. It shows that the pressure may drop to vapor pressure (700 Pa) at the head and tail of the blades under certain pump rotating speeds and speed ratios, which indicates that cavitation occurs at the corresponding area. As the pump rotating speed increases or the speed ratio decreases, the cavitation area, most of which is located at the head, grows towards the tail and takes up to 80% of the blade surface at stall when NP = 3000 rpm. In addition, the pressure on the stator pressure side is directly proportional to the pump rotating speed and inversely proportional to the speed ratio [29].
The mass flow difference between the cavitation model and the non-cavitation model is shown in Figure 23. When cavitation occurs, the generated bubble would block the flow passage and reduce the mass flow rate of the working fluid [30]. The data show that the increase of the pump rotating speed and the decrease of speed ratio will lead to a decrease of mass flow, indicating that more intense cavitation leads to a lower oil mass flow rate, consequently resulting in lower torque.

5. Conclusions

The full flow passage CFD models with and without cavitation were put forward to study the overall hydrodynamic performance as well as the internal flow field under variant pump rotating speed and speed ratios. The results from both models were compared and analyzed to investigate the effects of rotating speeds and speed ratios on the cavitation flow inside a hydraulic torque converter. The following conclusions are drawn:
(1)
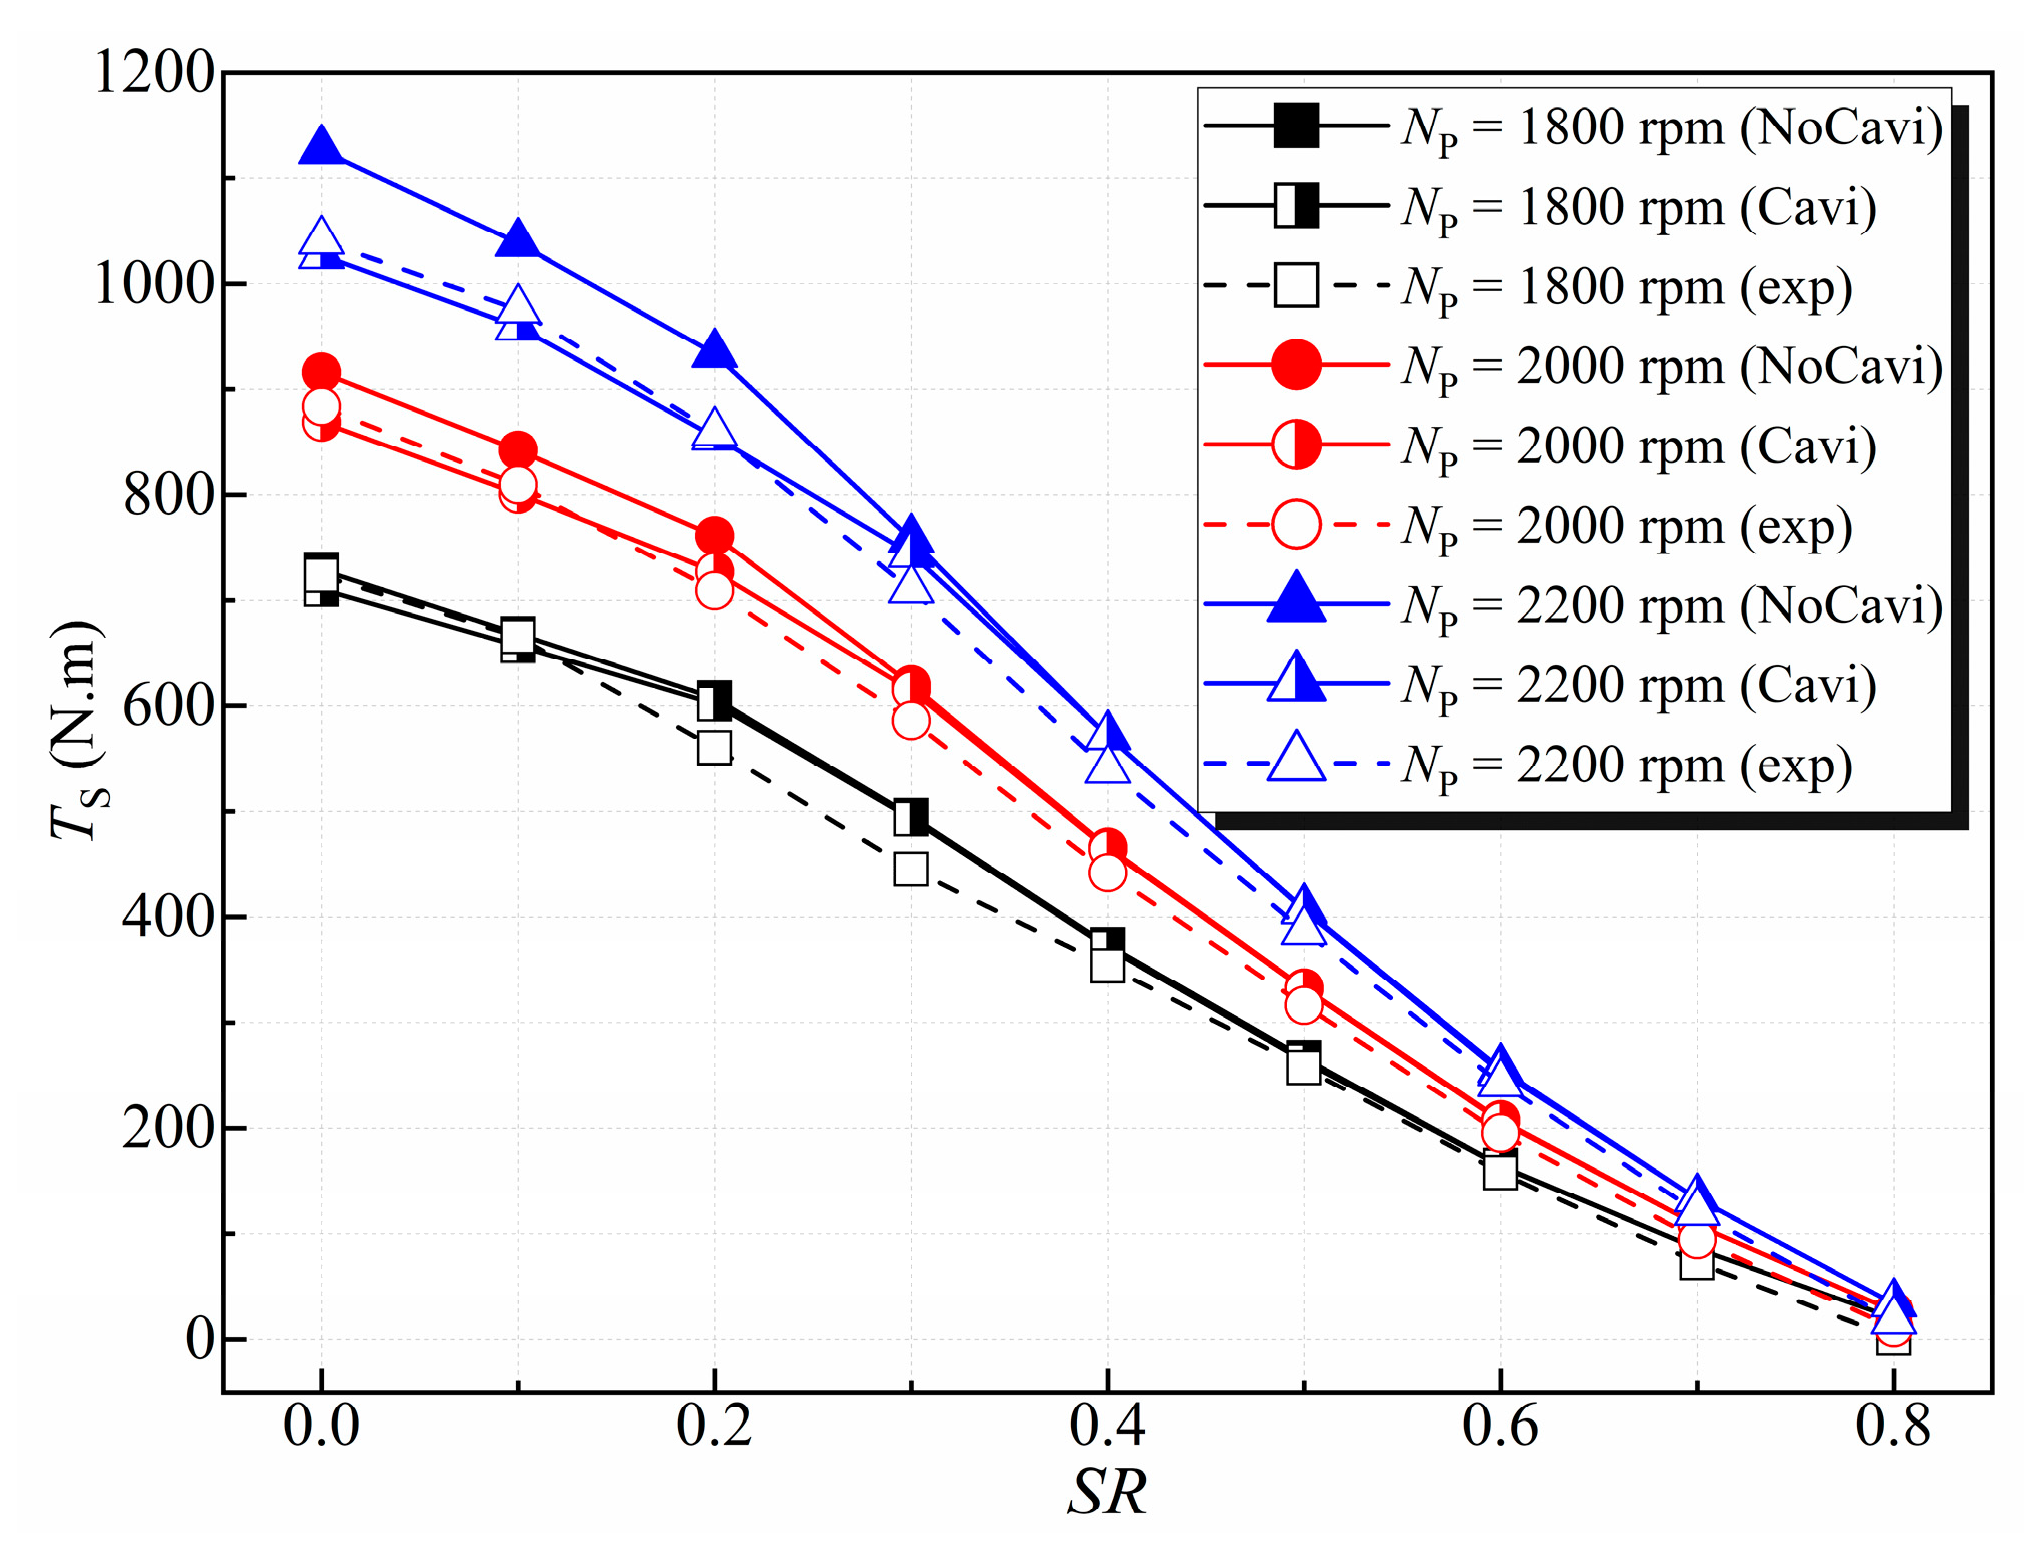
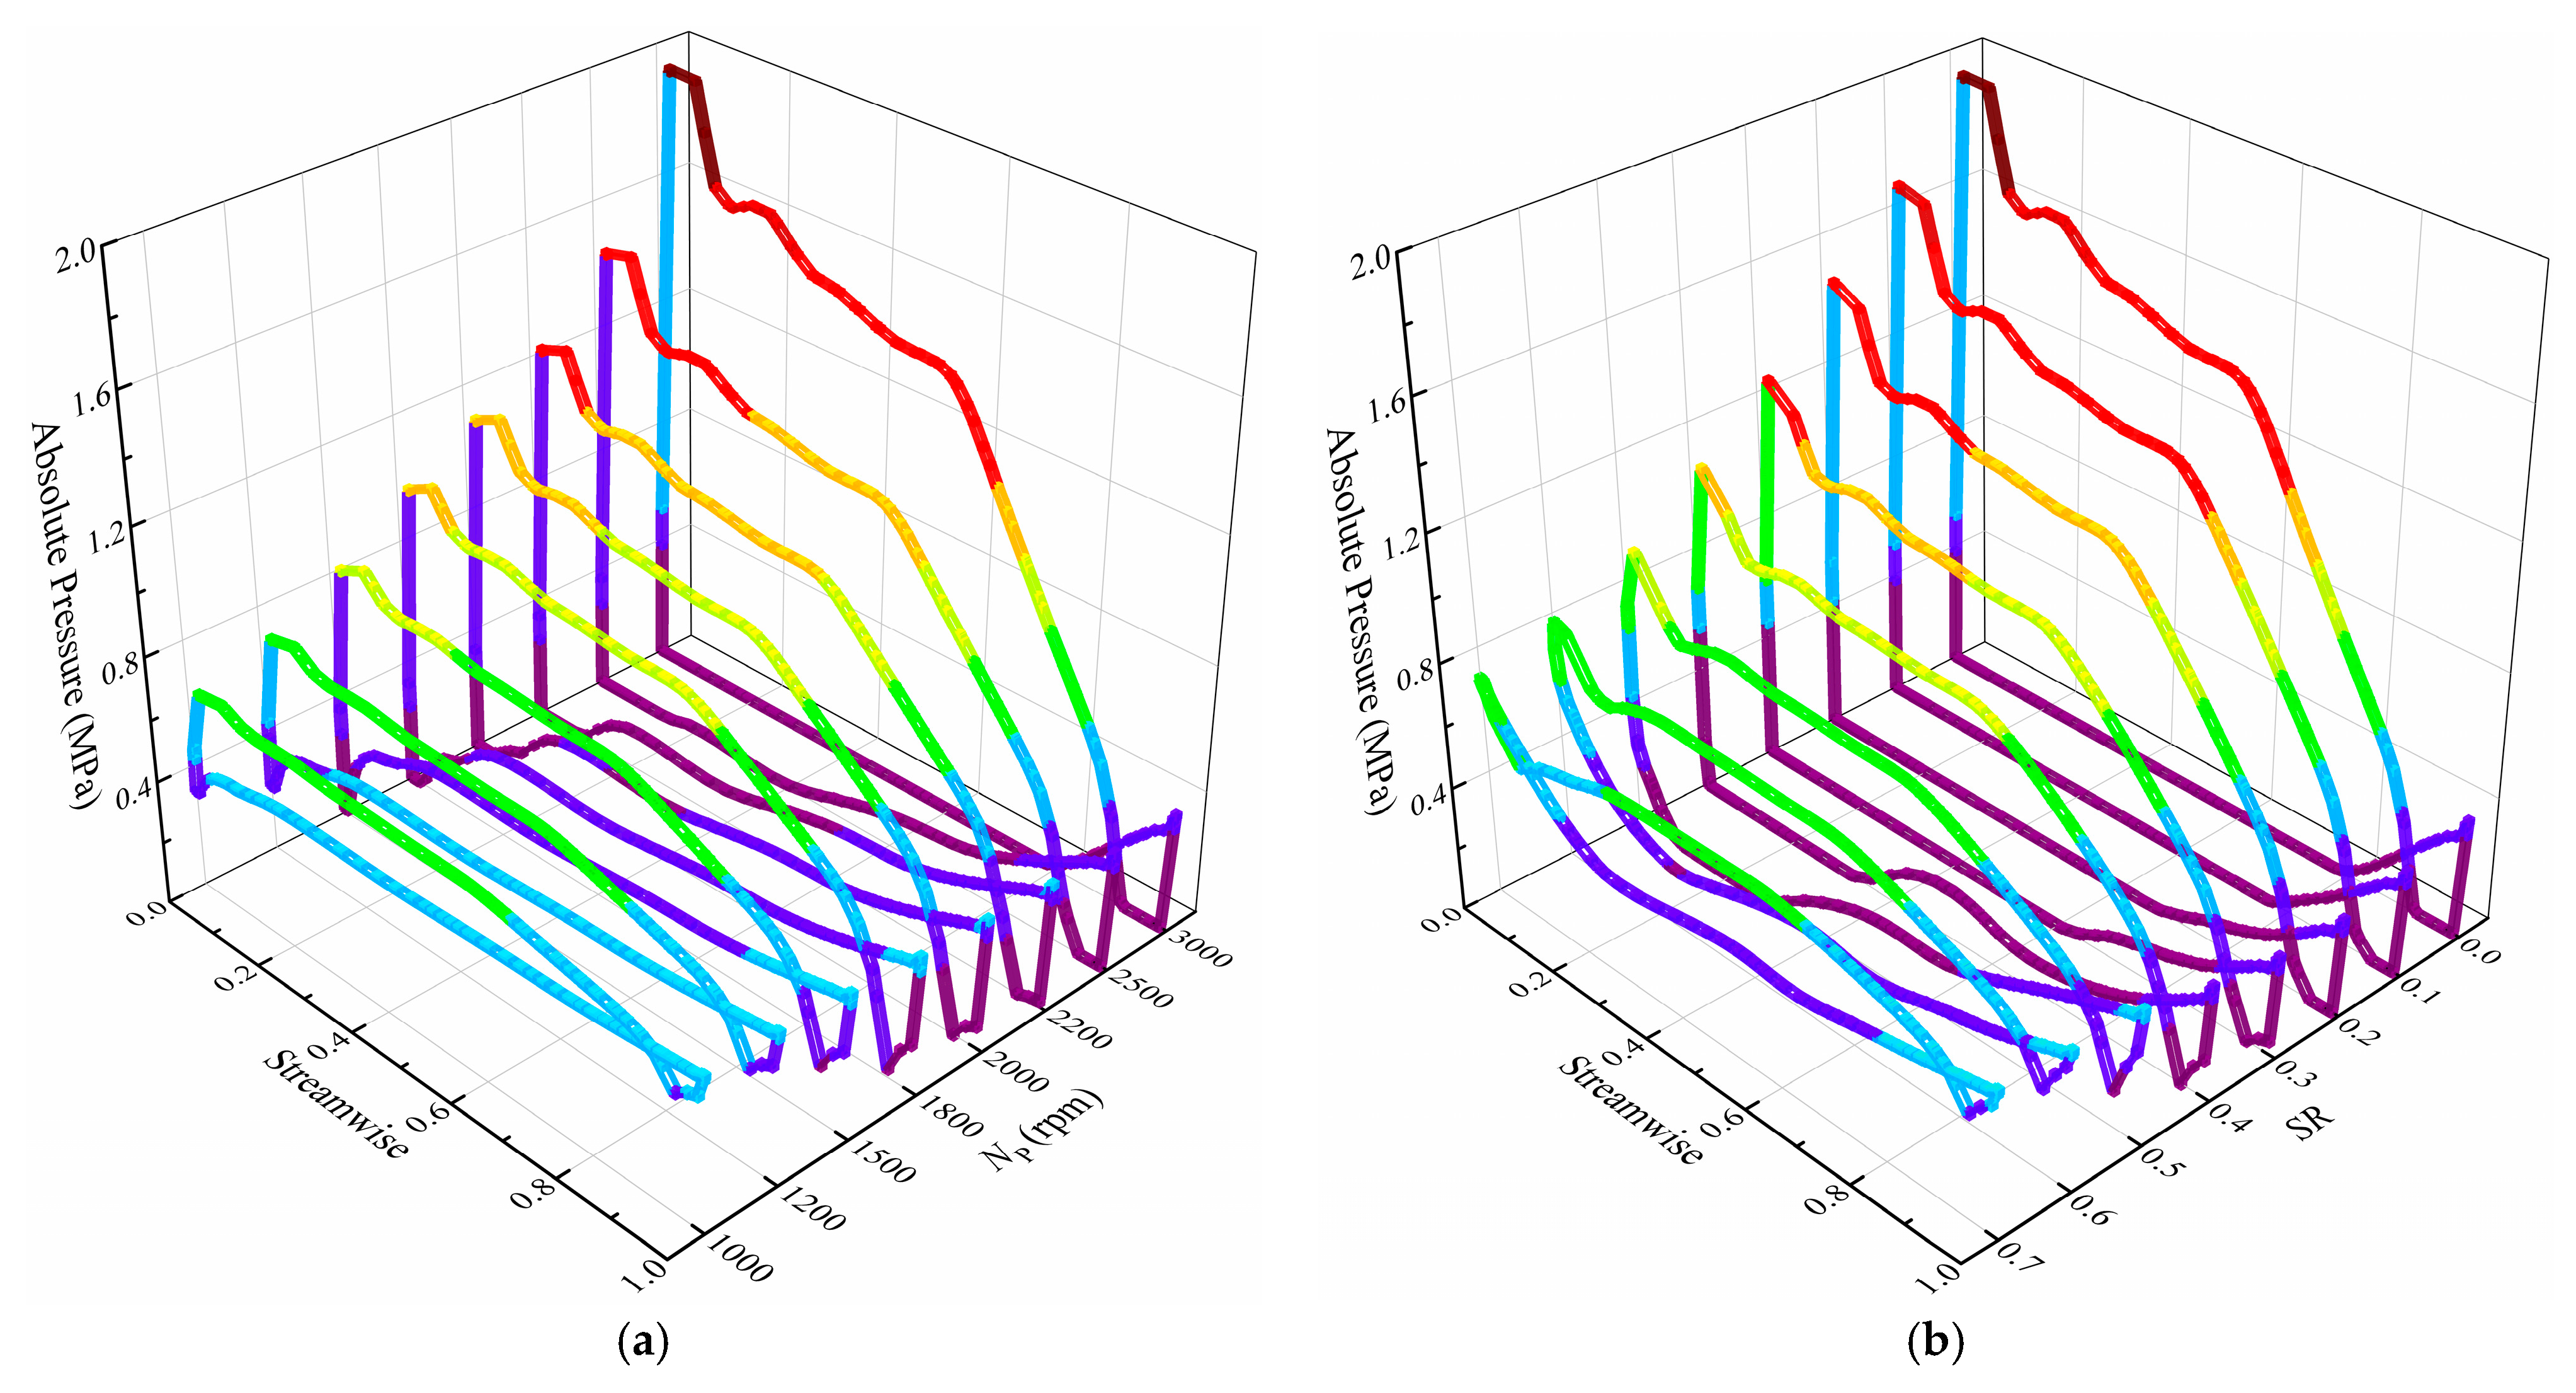
The pump rotating speed and speed ratio have strong influences on the cavitation characteristics of the torque converter. The cavitation degree demonstrates a positive relationship with the pump rotating speed and a negative relationship with the speed ratio. Higher pump rotating speed and lower speed ratio lead to bigger cavitation regions and more performance degradation. Therefore, one should consider the cavitation effects when designing high capacity and high NP torque converters.
(2)
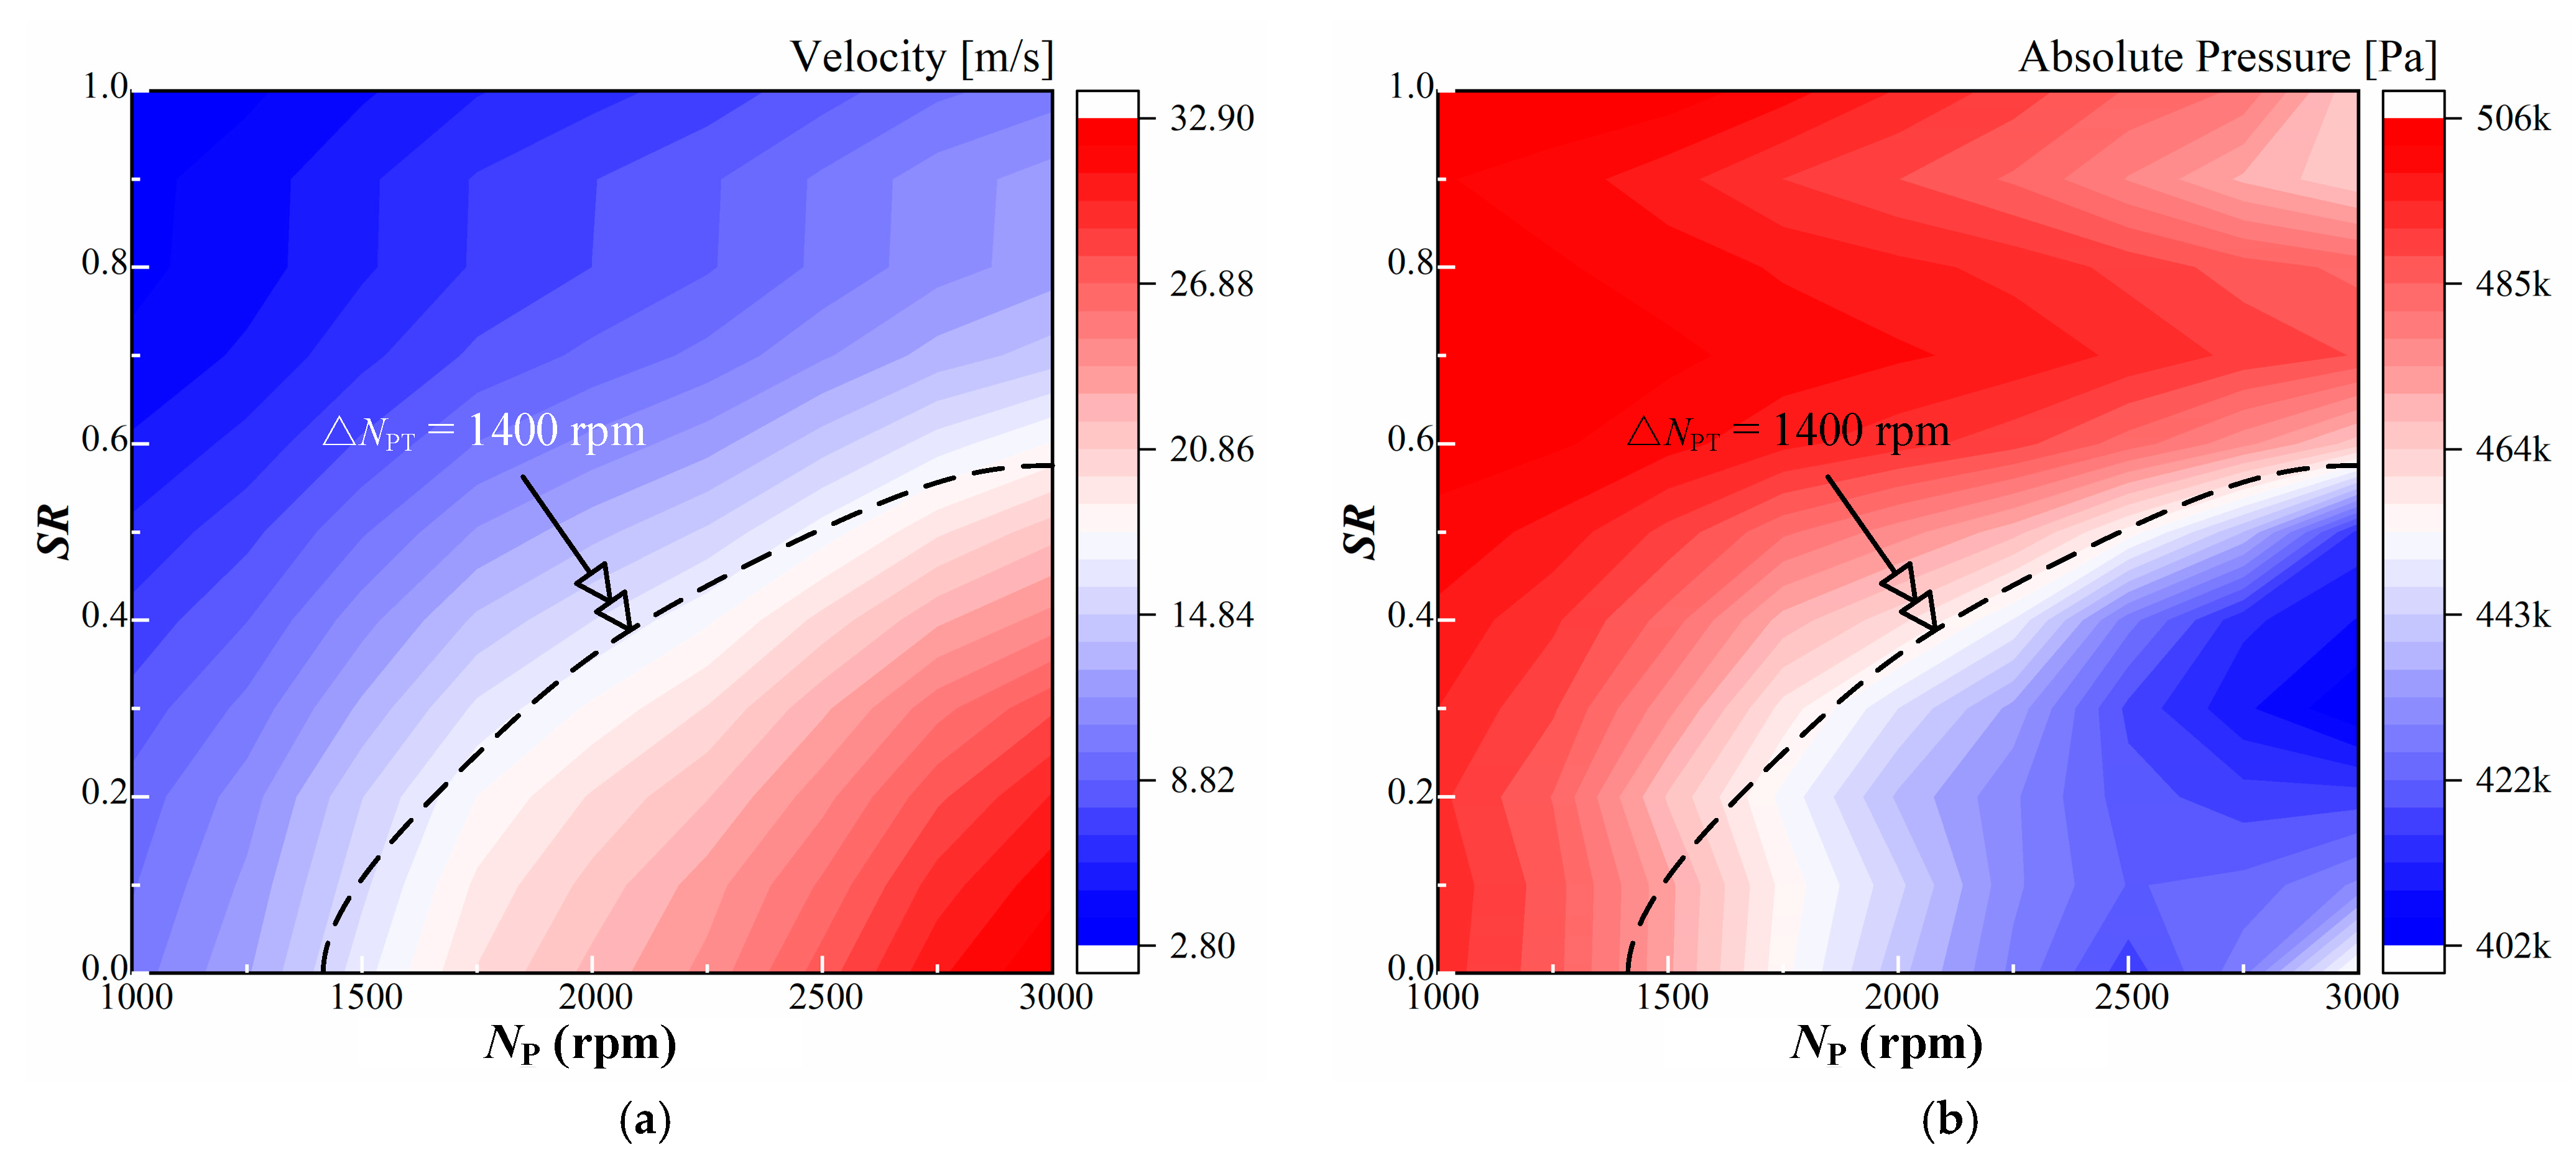
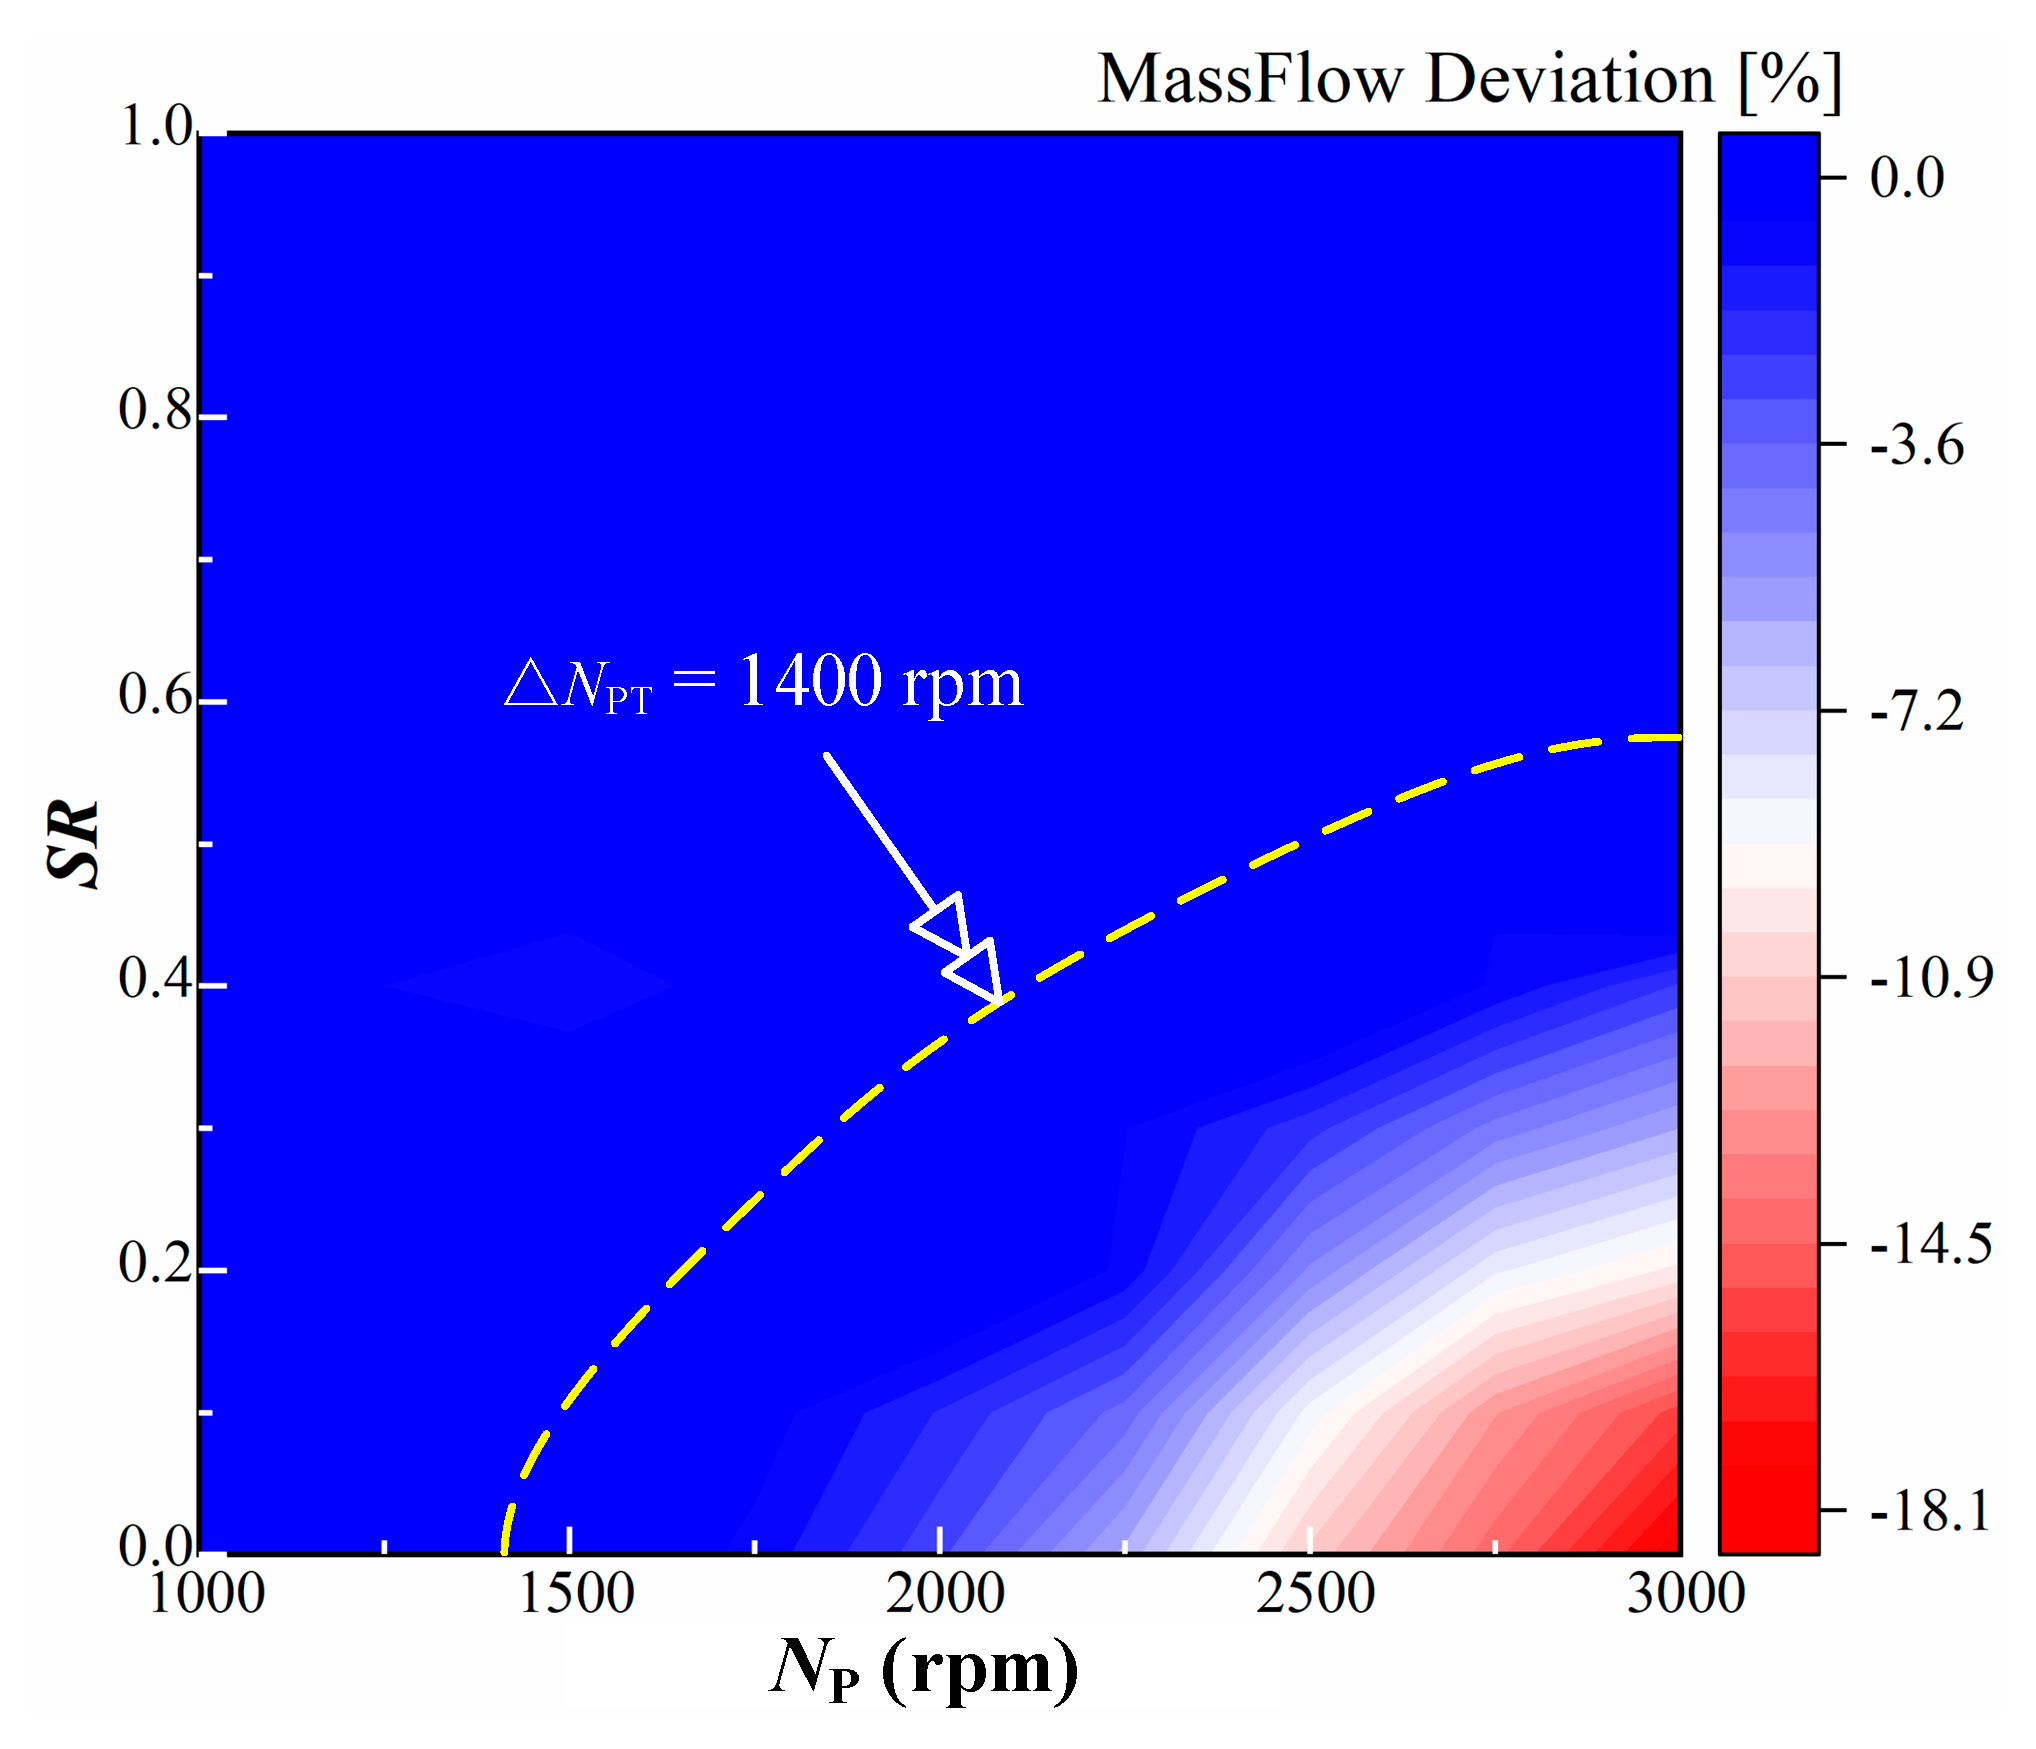
The difference between NP and NT could be used as a useful indicator for the occurrence and degree of cavitation. We found out that cavitation takes place when △NPT is greater than 1400 rpm regardless of the variations of the pump rotating speed and speed ratio, and the cavitation degree is directly related to △NPT.
(3)
Cavitation will not occur if the torque converter runs at low pump rotating speeds (less than 1500 rpm). However, cavity bubbles begin to emerge and the cavitation range expands when pump rotating speed increases, consequently resulting in performance reduction. The stall operating condition is the most critical for cavitation under different pump rotating speeds, and the cavity bubbles may cover as much as 80% of the stator blade suction surface when NP reaches 3000 rpm, which would lead to strong vibration, noise and even cavitation erosion. Moreover, the increase of pump rotating speed also changes the critical cavitation number and extends the cavitation range towards high speed ratio conditions not previously affected.
(4)
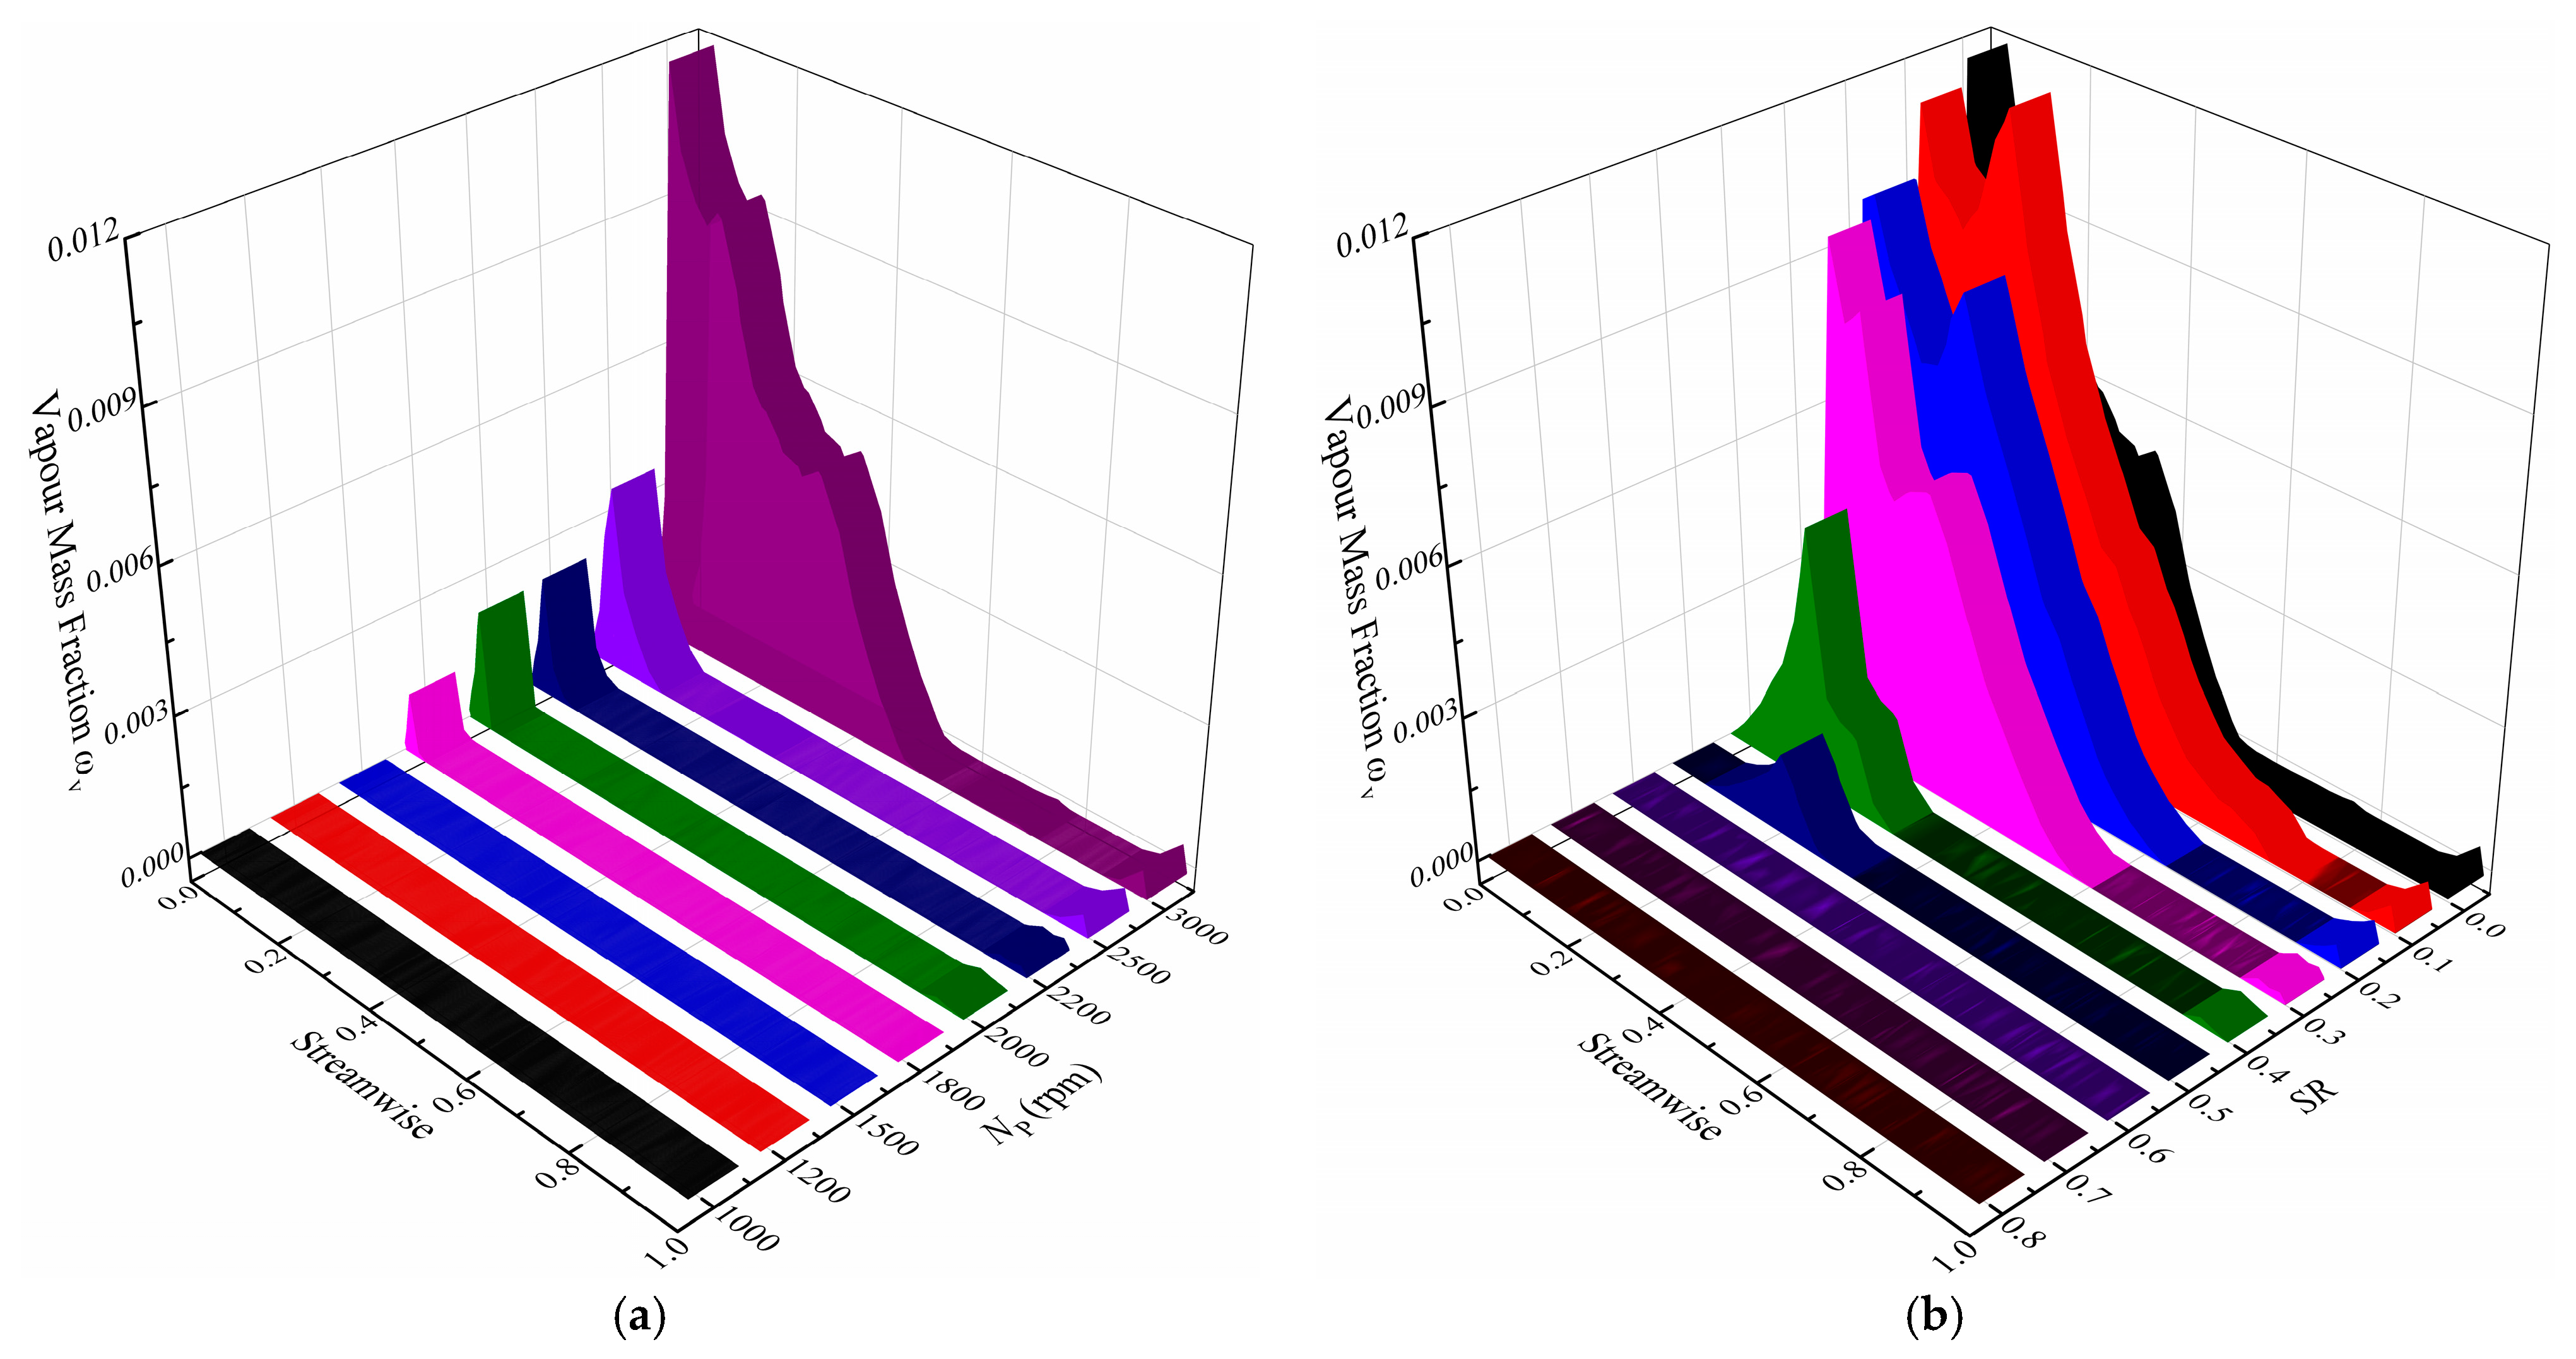
The results show that the cavitation area, the cavitation extent and the vapor volume fraction increase with the increase of the pump rotating speed and decrease with the increase of the speed ratio. Cavitation bubbles block the flow passage, reduce the mass flow rate and alter the pressure distribution on the blade surface, consequently leading to lower torque and capacity.

Author Contributions

M.G. performed the data analyses, designed and performed the experiments, and wrote the manuscript; C.L. contributed significantly to analysis and manuscript preparation; Q.Y. and W.W. contributed to the conception of the study; B.C.K. helped perform the analysis with constructive discussions. All authors have read and agreed to the published version of the manuscript.

Funding

Supported by National Natural Science Foundation of China (NSFC) through Grant No. 51805027and 51475041, Beijing Institute of Technology Research Fund Program for young Scholars (3030011181804), and Vehicular Transmission Key Laboratory Fund. The first author thanks the China Scholarship Council (CSC) for financial support (202006030045).

Acknowledgments

The authors sincerely thank to Boo Cheong Khoo of the Temasek Laboratories, National University of Singapore for his critical discussion and reading during manuscript preparation.

Conflicts of Interest

The authors declare that they have no conflict of interest.

Nomenclature

NPTNP-NT, The speed difference between pump and turbine [rpm]
AToroidal area [m2]
CCTP*D−5*ωP−2, Capacity constant [kg/rad2/m3]
DTorque converter torus diameter [m]
DCC(CCCaviCCNoCavi)/CCNoCavi, Capacity constant deviation
DT(TCaviTNoCavi)/TNoCavi, Torque deviation
Dη(ηCaviηNoCavi)/ηNoCavi, Efficiency deviation
ECC(CCCaviCCexp)/CCexp, Capacity constant error
EK(KCaviKexp)/Kexp, Torque ratio error
Eη(ηCaviηexp)/ηexp, Efficiency error
FcondCavitation Condensation Coefficient
FvapCavitation Vaporization Coefficient
KTT/TP, Torque ratio
MDRMaximum Density Ratio
MFMass flow rate [kg/s]
NBNumber of bubbles per unit volume
NPRotating speed of pump [rpm]
NSRotating speed of stator [rpm]
NTRotating speed of turbine [rpm]
NVFNuclei Volume Fraction
pLiquid pressure [Pa]
prefReference pressure [Pa]
pvPressure in the bubble [Pa]
PvSaturated Vapor Pressure [Pa]
RBMean Radius [m]
rgVapor volume fraction
SRNT/NP, Speed ratio
TPPump torque [N m]
TSStator torque [N m]
TTTurbine torque [N m]
VBMass transfer rate of bubble volume
vrefReference velocity [m/s]
vrefEquivalent average velocity [m/s]
ZPPump blade count
ηK*SR, Efficiency
ρfLiquid density [kg/m3]
ρlLiquid oil density [kg/m3]
ρvVapor density [kg/m3]
σCavitation number
σTCoefficient of surface tension
ωPPump rotating speed [rad/s]
ωTTurbine rotating speed [rad/s]
ωVvapor mass fraction
m ˙ Interphase mass transfer per unit [kg/s]
CaviCavitation
expExperiment
NoCaviNo cavitation
PPump
STurbine
TStator

References

  1. Yan, Q.D.; Wei, W.; Liu, C.; Liu, S.C.; Li, J.; Liu, B.S. Torque Converter Modern Design Theory and Methodology. Chin. Hydraul. Pneum. 2015, 4, 1–8. [Google Scholar] [CrossRef]
  2. Zhao, L.L. The Cavitation Research of the Flow Field in the Hydraulic Torque Converter Based on CFD. Ph.D. Thesis, Taiyuan University of Science and Technology, Taiyuan, China, 2016. [Google Scholar]
  3. Tseng, C.C. Modeling of Turbulent Cavitating Flows. Ph.D. Thesis, Dissertation of The University of Michigan, Ann Arbor, MI, USA, 2010. [Google Scholar]
  4. Anderson, C.L.; Zeng, L.; Sweger, P.O.; Narain, A. Experimental Investigation of Cavitation Signatures in an Automotive Torque Converter Using a Microwave Telemetry Technique. Int. J. Rotating Mach. 2003, 9, 403–410. [Google Scholar] [CrossRef] [Green Version]
  5. Watanabe, S.; Otani, R.; Kunimoto, S.; Hara, Y.; Furukawa, A.; Yamaguchi, T. Vibration Characteristics due to Cavitation in Stator Element of Automotive Torque Converter at Stall Condition. In Proceedings of the ASME 2012 Fluids Engineering Summer Meeting Rio Grande, Rio Grande, PR, USA, 8–12 July 2012; pp. 535–541. [Google Scholar] [CrossRef]
  6. Dong, Y.; Korivi, V.; Attibele, P.; Yuan, Y.Q. Torque converter CFD engineering part 2: Performance improvement through core leakage flow and cavitation control. SAE Int. 2002, 111, 1272–1285. [Google Scholar]
  7. Tsutsumi, K.; Watanabe, S.; Tsuda, S.; Yamaguchi, T. Cavitation simulation of automotive torque converter using a homogeneous cavitation model. Eur. J. Mech. B/Fluids 2017, 61, 263–270. [Google Scholar] [CrossRef] [Green Version]
  8. Hayata, R.; Tsutsumi, K.; Watanabe, S.; Tsuda, S.; Yamaguchi, T.; Yoshihide, M. Modeling of Gaseous Cavitation in Torque Converter. In Proceedings of the Japan Mechanical Engineering Congress, Fukuoka, Japan, 11–14 September 2016. [Google Scholar] [CrossRef]
  9. Ju, J.; Jang, J.; Choi, M.; Baek, J.H. Effects of cavitation on performance of automotive torque converter. Adv. Mech. Eng. 2016, 8, 1–9. [Google Scholar] [CrossRef] [Green Version]
  10. Zhao, L.L.; Dong, Z.Q.; Lian, J.Y.; Zhao, F.Q. Analysis of Bubble Breakup Motion for Hydrodynamic Torque Converter. Hydraul. Pneum. Seals 2016, 36, 1–4. [Google Scholar] [CrossRef]
  11. Guo, M.; Liu, C.; Yan, Q.D.; Ke, Z.F.; Wei, W.; Li, J. Evaluation and Validation of Viscous Oil Cavitation Model Used in Torque Converter. Appl. Sci. 2021, 11, 3643. [Google Scholar] [CrossRef]
  12. Liu, C.; Guo, M.; Yan, Q.D.; Wei, W. Numerical Investigation on the Transient Cavitating Flow Inside a Torque Converter. In Proceedings of the IEEE 8th International Conference on Fluid Power and Mechatronics, Wuhan, China, 10–13 April 2019; pp. 208–216. [Google Scholar] [CrossRef]
  13. Ran, Z.; Ma, W.; Liu, C. 3D Cavitation Shedding Dynamics: Cavitation Flow-Fluid Vortex Formation Interaction in a Hydrodynamic Torque Converter. Appl. Sci. 2021, 11, 2798. [Google Scholar] [CrossRef]
  14. Liu, C.; Wei, W.; Yan, Q.D.; Weaver, B.K.; Wood, H.G. Influence of Stator Blade Geometry on Torque Converter Cavitation. ASME J. Fluids Eng. 2018, 140, 041102. [Google Scholar] [CrossRef]
  15. Liu, C.; Wei, W.; Yan, Q.D.; Weaver, B.K. Torque Converter Capacity Improvement through Cavitation Control by Design. ASME J. Fluids Eng. 2017, 139, 041103. [Google Scholar] [CrossRef]
  16. Liu, C.; Yan, Q.D.; Li, J.; Li, J.; Zou, B. Investigation on the Cavitation Characteristics of High Power-densityTorque Converter. J. Mech. Eng. 2020, 56, 147–155. [Google Scholar] [CrossRef]
  17. Kang, C.; Mao, N.; Zhang, G.F. Highly Confined Floes and Cavitation Phenomenon in a Hydraulic Retarder. J. Eng. Thermophys. 2017, 38, 2151–2158. [Google Scholar]
  18. Dong, L.; Xiao, J.W.; Ming, J.Y.; Liu, H.L. Numerical simulation and experimental study on cavitation behavior of hydraulic retarder model. J. Drain. Irrig. Mach. Eng. 2017, 35, 1–5. [Google Scholar] [CrossRef]
  19. Liu, H.L.; Liu, D.X.; Wang, Y.; Du, H.; Xu, H. Numerical research status and prospects of cavitating flow in a pump. Fluid Mach. 2011, 39, 38–44. [Google Scholar] [CrossRef]
  20. Xue, R.; Zhang, M.; Xu, Z.J.; Lin, L.L. Comparison and Study on Different Cavitation Models. Northwest Hydropower 2014, 2, 85–89. [Google Scholar]
  21. Zwart, P.; Gerber, A.G.; Belamri, T. A two-phase flow model for predicting cavitation dynamics. In Proceedings of the ICMF 2004 International Conference on Multiphase Flow, Yokohama, Japan, 30 May–4 June 2004; pp. 1–11. [Google Scholar]
  22. Mejri, I.; Bakir, F.; Rey, R.; Belamri, T. Comparison of computational results obtained from a homogeneous cavitation model with experimental investigations of three inducers. ASME J. Fluids Eng. 2006, 128, 1308–1323. [Google Scholar] [CrossRef]
  23. Liu, C.; Wei, W.; Yan, Q.D.; Morgan, N.R. Design of Experiments to Investigate Blade Geometric Effects on the Hydrodynamic Performance of Torque Converters. Proc. Inst. Mech. Eng. Part D J. Automob. Eng. 2019, 233, 276–291. [Google Scholar] [CrossRef]
  24. Xiong, P.; Sun, H.; Zhong, J.; Zhen, C.; Chen, X.; Gao, H. Analysis of the Influence of the Number of Torque Converter Blades on Working Performance Based on the Response Surface Method. J. Phys. Conf. Ser. 2021, 1748, 1–9. [Google Scholar] [CrossRef]
  25. Usui, T.; Iga, Y. Prediction Method of Cavitation inside Torque Converter using Gaseous Cavitation Model. Trans. Soc. Automot. Eng. Jpn. 2021, 52, 961–966. [Google Scholar] [CrossRef]
  26. Ma, W.X.; Liu, H.; Liu, C.B.; Liu, C.S. Measurement and analysis of the internal flow field in the hydrodynamic torque converter with adjustable guide vanes. Adv. Mech. Eng. 2015, 7, 168781401558966. [Google Scholar] [CrossRef]
  27. Pan, X.; Xinyuan, C.; Hongjun, S.; Jiping, Z.; Lin, W.; Huichao, G. Effect of the blade shaped by Joukowsky airfoil transformation on the characteristics of the torque converter. Proc. Inst. Mech. Eng. Part D J. Automob. Eng. 2021, 235, 3314–3321. [Google Scholar] [CrossRef]
  28. Mekkes, J.; Anderson, C.; Narain, A. Static pressure measurements and cavitation signatures on the nose of a torque converters stator blades. In Proceedings of the International Symposium on Rotating Machinery (ISROMAC), Honolulu, HI, USA, 7–11 March 2004. [Google Scholar]
  29. Liu, B.S.; Tan, L.; Li, J. Influence of Pump Rotation Speed on Hydrodynamic Performance and Stator Blade Surface Pressure Pulsation in Torque Converter. J. Fluids Eng. 2020, 142, 101207. [Google Scholar] [CrossRef]
  30. Liu, C.; Wei, W.; Yan, Q.; Weaver, B.K.; Wood, H.G. On the application of passive flow control for cavitation suppression in torque converter stator. Int. J. Numer. Methods Heat Fluid Flow 2019, 29, 204–222. [Google Scholar] [CrossRef]
Figure 1. A basic model of hydraulic torque converter.
Machines 10 00080 g001
Figure 2. Full 3D flow model of the torque converter.
Machines 10 00080 g002
Figure 3. Mesh model and independence analysis results of torque converter. (a) The full flow mesh model and the refined mesh of the blade. (b) Mesh independence analysis.
Machines 10 00080 g003
Figure 4. Torque converter test cell.
Machines 10 00080 g004
Figure 5. Comparison of torque ratio, efficiency, and capacity constant between no cavitation, cavitation, and test under various NP and SR. (a) NP = 1800 rpm. (b) NP = 2000 rpm. (c) NP = 2200 rpm. (d) Error of the cavitation simulation.
Machines 10 00080 g005aMachines 10 00080 g005b
Figure 6. Influence of cavitation on hydraulic performance of torque converter under various NP and SR. (a) Capacity constant (CC). (b) Efficiency (η). (c) Torque of turbine (TT). (d) Torque of stator (TS).
Machines 10 00080 g006
Figure 7. The 10% vapor volume fraction distribution in torque converter at stall when NP = 3000 rpm.
Machines 10 00080 g007
Figure 8. The vapor volume fraction distribution in torque converter at stall when NP = 3000 rpm.
Machines 10 00080 g008
Figure 9. The velocity vector of oil and vapor distribution in torque converter at stall when NP = 3000 rpm.
Machines 10 00080 g009
Figure 10. The absolute pressure and velocity nephogram in torque converter at stall when NP = 3000 rpm.
Machines 10 00080 g010
Figure 11. Comparison of the absolute pressure of stator blade surface between no cavitation and cavitation under various SR when NP = 3000 rpm.
Machines 10 00080 g011
Figure 12. Comparison of the stator torque between simulation and test at stall under various NP.
Machines 10 00080 g012
Figure 13. The 10% vapor volume fraction distribution in stator domain under various NP and SR.
Machines 10 00080 g013
Figure 14. The 10% vapor volume fraction distribution in the pump and turbine domain under various NP and SR.
Machines 10 00080 g014
Figure 15. The vapor volume fraction distribution in torque converter under various NP and SR.
Machines 10 00080 g015
Figure 16. The vapor volume fraction spectrogram in stator domain under various NP and SR. (a) The average vapor volume fraction spectrogram. (b) The maximum vapor volume fraction spectrogram.
Machines 10 00080 g016
Figure 17. The average velocity and average absolute pressure spectrogram in the stator domain under various NP and SR. (a) The average velocity spectrogram. (b) The average absolute pressure spectrogram.
Machines 10 00080 g017
Figure 18. The cavitation number under various NP and SR.
Machines 10 00080 g018
Figure 19. The capacity constant ratio with regard to cavitation number under various NP.
Machines 10 00080 g019
Figure 20. The bulk interphase mass transfer rate between oil and vapor on stator blade under various conditions. (a) Under various NP when SR = 0. (b) Under various SR when NP = 3000 rpm.
Machines 10 00080 g020
Figure 21. The vapor mass fraction on stator blade under various conditions. (a) Under various NP when SR = 0. (b) Under various SR when NP = 3000 rpm.
Machines 10 00080 g021
Figure 22. The absolute pressure on stator blade under various conditions. (a) Under various NP when SR = 0. (b) Under various SR when NP = 3000 rpm.
Machines 10 00080 g022
Figure 23. The influence of cavitation on mass flow in torque converter under various NP and SR.
Machines 10 00080 g023
Table 1. Detailed setting of torque converter CFD model.
Analysis StepNo Cavitation ⅠNo Cavitation ⅡCavitation Ⅲ
Analysis typeSteady-stateSteady-stateSteady-state
Advection schemeUpwindHigh resolutionHigh resolution
Interface modelFrozen rotorFrozen rotorFrozen rotor
Cavitation modelNoneNoneZwart model
Time step0.01 sAuto timescaleAuto timescale
Step number400300400
Convergence targetRMS 1 × 10⁻⁵RMS 1 × 10⁻⁵RMS 1 × 10⁻⁵
Turbulence modelSSTSSTSST
Fluid propertiesρl = 835.2 kg·m−3, μl = 1.46 × 10⁻² Pa·s
Vapor propertiesρv = 2.1 kg·m−3, μv = 1.2 × 10⁻⁵ Pa·s
Pump statusFrom 1000 rpm to 3000 rpm
Turbine statusFrom 0 rpm to 3000 rpm
Stator statusStationary
Boundary detailsNo-slip and smooth wall
Table 2. The occurrence of cavitation inside the torque converter under various NP and SR.
NP/rpmSR = 0SR = 0.1SR = 0.2SR = 0.3SR = 0.4SR = 0.5SR = 0.6SR = 0.7SR = 0.8
1000□△○□△○□△○□△○□△○□△○□△○□△○□△○
1200□△○□△○□△○□△○□△○□△○□△○□△○□△○
1500□△●□△○□△○□△○□△○□△○□△○□△○□△○
1800□▲●□△●□△●□△○□△○□△○□△○□△○□△○
2000■▲●□▲●□△●□△●□△○□△○□△○□△○□△○
2200■▲●■▲●□▲●□△●□△○□△○□△○□△○□△○
2500■▲●■▲●■▲●□▲●□△●□△○□△○□△○□△○
2800■▲●■▲●■▲●□▲●□△●□△○□△○□△○□△○
3000■▲●■▲●■▲●■▲●□▲●□△●□△○□△○□△○
Note: □△○ means no detectable cavitation in the pump/turbine/stator, ■▲● means cavitation in the pump/turbine/stator.
Table 3. The cavitation occurrence inside the torque converter under various △NPT.
NPT/rpm<14001400150016001700180019002000>2000
Cavitation in the pump
Cavitation in the turbine
Cavitation in the stator
Note: □△○ means no detectable cavitation in the pump/turbine/stator, ■▲● means cavitation in the pump/turbine/stator.
Publisher’s Note: MDPI stays neutral with regard to jurisdictional claims in published maps and institutional affiliations.

