Article

Influence of Graded Surface Decarburization of Automobile Forging Front Axle on the Bending Behavior Based on a Third-Order Shear Deformation Beam Theory

1
School of Automotive Engineering, Wuhan University of Technology, Wuhan 430070, China
2
Hubei Key Laboratory of Advanced Technology for Automotive Components, Wuhan 430070, China
3
Hubei Collaborative Innovation Center for Automotive Components Technology, Wuhan 430070, China
*
Author to whom correspondence should be addressed.
Machines 2022, 10(2), 139; https://doi.org/10.3390/machines10020139
Submission received: 5 January 2022 / Revised: 4 February 2022 / Accepted: 8 February 2022 / Published: 16 February 2022
(This article belongs to the Section Machine Design and Theory)

Abstract

:
During the forging process of automobile front axle, the steel near the surface is often decarburized for a certain depth. The mechanical properties at the decarburization layer are graded and different from the inner area, influencing the bending behavior of axles under heavy loads. In this paper, the decarburized forging of front axle is regarded as a rectangular thick sandwich beam, composed of a homogeneous core and the functionally graded layer coated on both bottom and top surface. A Third-order Shear Deformation Theory (TSDT) is employed to investigate the static bending behaviors under two point−loads. The properties of sandwich FG material are represented with a piecewise power−law function, and the displacement field governing equations are derived through the virtual work principle. The Navier analytical method and numerical DQM procedures are employed to obtain the bending responses under simply supported boundary conditions, and the results are validated through the comparison with an example in the literature. Then, the transverse deflection, rotation, axial stress, and shear stress are studied in terms of different power−law exponents, decarburization depth, unsymmetrical decarburization depth, unbalance loading, and beam sectional dimension. The study reveals the influence of surface decarburization on the bending behavior of forged automobile front axles, and contributes to the optimization of structure design.

1. Introduction

During the hot forging process of automobile component, such as the front axle, connecting rod, knuckle, etc., the solid surface reactions of decarburization have adverse effects, including reduced ductility, reduced strength, and increased susceptibility of crack initiation [1]. Decarburization is a phenomenon that the amount of carbon reduces in the surface-adjacent zone of steel, occurs when the metal is heated to temperatures of 700 °C or above when carbon in the metal reacts with gases containing oxygen or hydrogen. In the hot forging process of automobile front axle, the 42CrMo steel is preheated to about 1200 °C, and then experiences a forging forming operation and a quenching operation at 850 °C (Figure 1). During a long time at the high temperature, the oxidation of Fe and the decarburization occurred simultaneously. For decarburization process, the affinity of carbon is greater than Fe at high temperature, the cementite (Fe3C) in the surface-adjacent area reacts with the oxygen and hydrogen (O2, H2, H2O, CO2) in the atmosphere, forming the CO and CH4, and the cementite is reduced to Fe. For the oxidation process, Fe reacts with the oxidizing gas (O2, H2O, CO2) and forming the oxide (FeO, Fe2O3). [2,3]. When the decarburization process prevails the oxidation process, the reduction of C content at the surface happened, and the decarburization layer appears [4]. The decarburization degree is determined by the atmosphere, exposure duration, temperature, and the alloying element of the material. With increasing duration time in high temperature, oxygen and hydrogen diffuse to the deeper layer, and the carbon atoms migrate to the surface layer continuously. Thus, the depth of the decarburization increases with the duration of exposure in high temperature atmosphere with oxygen and hydrogen, and the degree of decarburization increases from the deep layer to the top surface [5]. As is illustrated in Figure 2, in the surface-adjacent area, a complete decarburization zone with almost total removal of carbon appears, and the partial decarburization zone in the deeper area is produced, where partial carbon is removed. Carbon is one of the primary strengthening elements in steel. With the decreasing amount of carbon, forming of martensite phases with high strength is hindered, and thus the amount of the martensite decreases with the degree of decarburization. The pure ferrite phases with a lower strength and hardness appear at the complete decarburization zone [6,7].
With increasing fractions of ferrite and reduced amount of carbides, pearlite, and martensite through the thickness, the graded mechanical properties (strength, rigidity, elasticity modulus, and Poisson’s ratio) at the decarburization zone are produced, which may influence the bending behaviors of automobile front axle beam under heavy loads. For decarburization of steel, most researchers investigated the decarburization mechanisms [8,9], influence factors of decarburization [10,11], crack propagation and fatigue [1,12,13], and the controlling method [14]. For the forgings of an automobile, most attention is paid to metal forming optimization, lightweight design of the structure, and material selection [15,16]. Little attention has been paid to the influence of surface decarburization on the bending behaviors of forgings.
Currently, Functionally Graded Materials (FGM) [17] is increasingly used in aerospace, marine, automotive, mechanical, and civil engineering field as new material. FGMs are composites made from a mixture of two materials with the continuous variation of fractions along one or two directions, such as the ceramic and metal or polymer, and thus have continuous material properties from one surface to another, eliminating the stress concentration found in laminated composites [18]. FGMs can be tailored to plates or beams with different dimensions for various applications and service environments. Numerous theories have been developed to analyze the bending, bulking and vibration characteristics of FGMs plates and beams, such as the Classical Euler–Bernoulli Beam Theory (CBT) with the Kirchhoff hypothesis, ignoring the transverse shear deformation effect, which is limited to the slender beam of plate [19]; the First-order Shear Deformation Theory (FSDT) including the transverse deformation through the assumption that the transverse shear strain is constant across the beam thickness, and a shear correction factor is introduced to correct the deviation of transverse shear deformation between the actual condition and the assumptive linear variation [20]. Plenty of higher-order beam theories (HSDTs) are proposed to describe the transverse shear deformation accurately, such as the Sinusoidal Shear Deformation Theory (SSDT) [21], Exponential Shear Deformation Theory (ESDT) [22], Third-order Shear Deformation Theory (TSDT) [23], quasi-3D theory considering the thickness stretching effects [24], which employ higher-order polynomials in the expansion of displacement through the thickness, and are suitable for both thin and thick beams.
For the material with graded physical and mechanical properties, the power−law function, exponential function, or polynomial function are often used to represent the variation of density, elasticity modulus, and Poisson’s ratio [25]. Usually, the classical or first-order beam theory are not enough to express the nonlinear deformation response of the FGMs beam or plate [26]. Kadoli et al. [27] analyzed the static bending response of metal-ceramic FG beams using third-order shear deformation theory; the deflection and stresses under different boundary conditions and power−law exponents were investigated through a finite element procedure. Zhang [28] studied the nonlinear bending behaviors of FGM beams based on physical neutral surface and third-order shear deformation theory; the Ritz method is adopted to obtain approximate solutions. Niknam et al. [29] investigated the nonlinear bending of FG tapered beams subjected to thermal and mechanical loading. The linear variation was considered for the thickness, an exponential function was used to describe the material properties, and the Glerkin and GDQ approaches were used to obtain the solution. Belarbi Ouejdi et al. [30] studied the static bending behaviors of FG sandwich curved beams via a new refined fifth-order shear deformation theory with three unknowns, a finite element models and Navier analytical method were employed to solve the governing equations under simply supported, camped, and free boundaries and distributed loads. Şimşek et al. [31] used a Navier analytical solution for bending and buckling of FG nano-beams based on the non-local Timoshenko beam theory under distributed and point load. Nejad et al. [32] employed the non-local elasticity theory and Euler–Bernoulli beam theory for bending analysis of two-directional FG nano-beams, and the Generalized Differential Quadrature Method (GDQM) was used to obtain the transverse defection with various boundary conditions. Eftekhari [33] used the DQM procedure for in-plane vibration analysis of variable thickness circular arches traversed by a moving point load.
The graded mechanical properties at decarburization zone on surface of forgings are analogous to the functionally graded material mentioned in the literature. Therefore, in Section 2 of this paper, the automobile front axle forgings are regarded as a thick rectangular beam with the functionally graded layer coated on both sides, namely a rectangular sandwich beam with FG surface and homogeneous core. The sandwich FG material is represented with a piecewise power−law function. A third-order shear deformation theory (TSDT) is adopted to investigate the static bending behaviors of automobile front axles with surface decarburization, and the displacement field governing equations are derived through the virtual work principle. The Navier analytical method and numerical DQM procedures are employed to obtain the bending responses under two point−loads. Then, in Section 3, the model reliability and accuracy are validated through the comparison with an example in the literature. The transverse deflection, rotation, axial stress, and shear stress are studied in terms of different power−law exponents, decarburization depth, unsymmetrical decarburization depth, unbalance loading, and beam sectional dimension. The results can reveal the influence of surface decarburization on the bending behavior of forged automobile front axles, and contribute to the optimization of structure design.

2. Materials and Methods
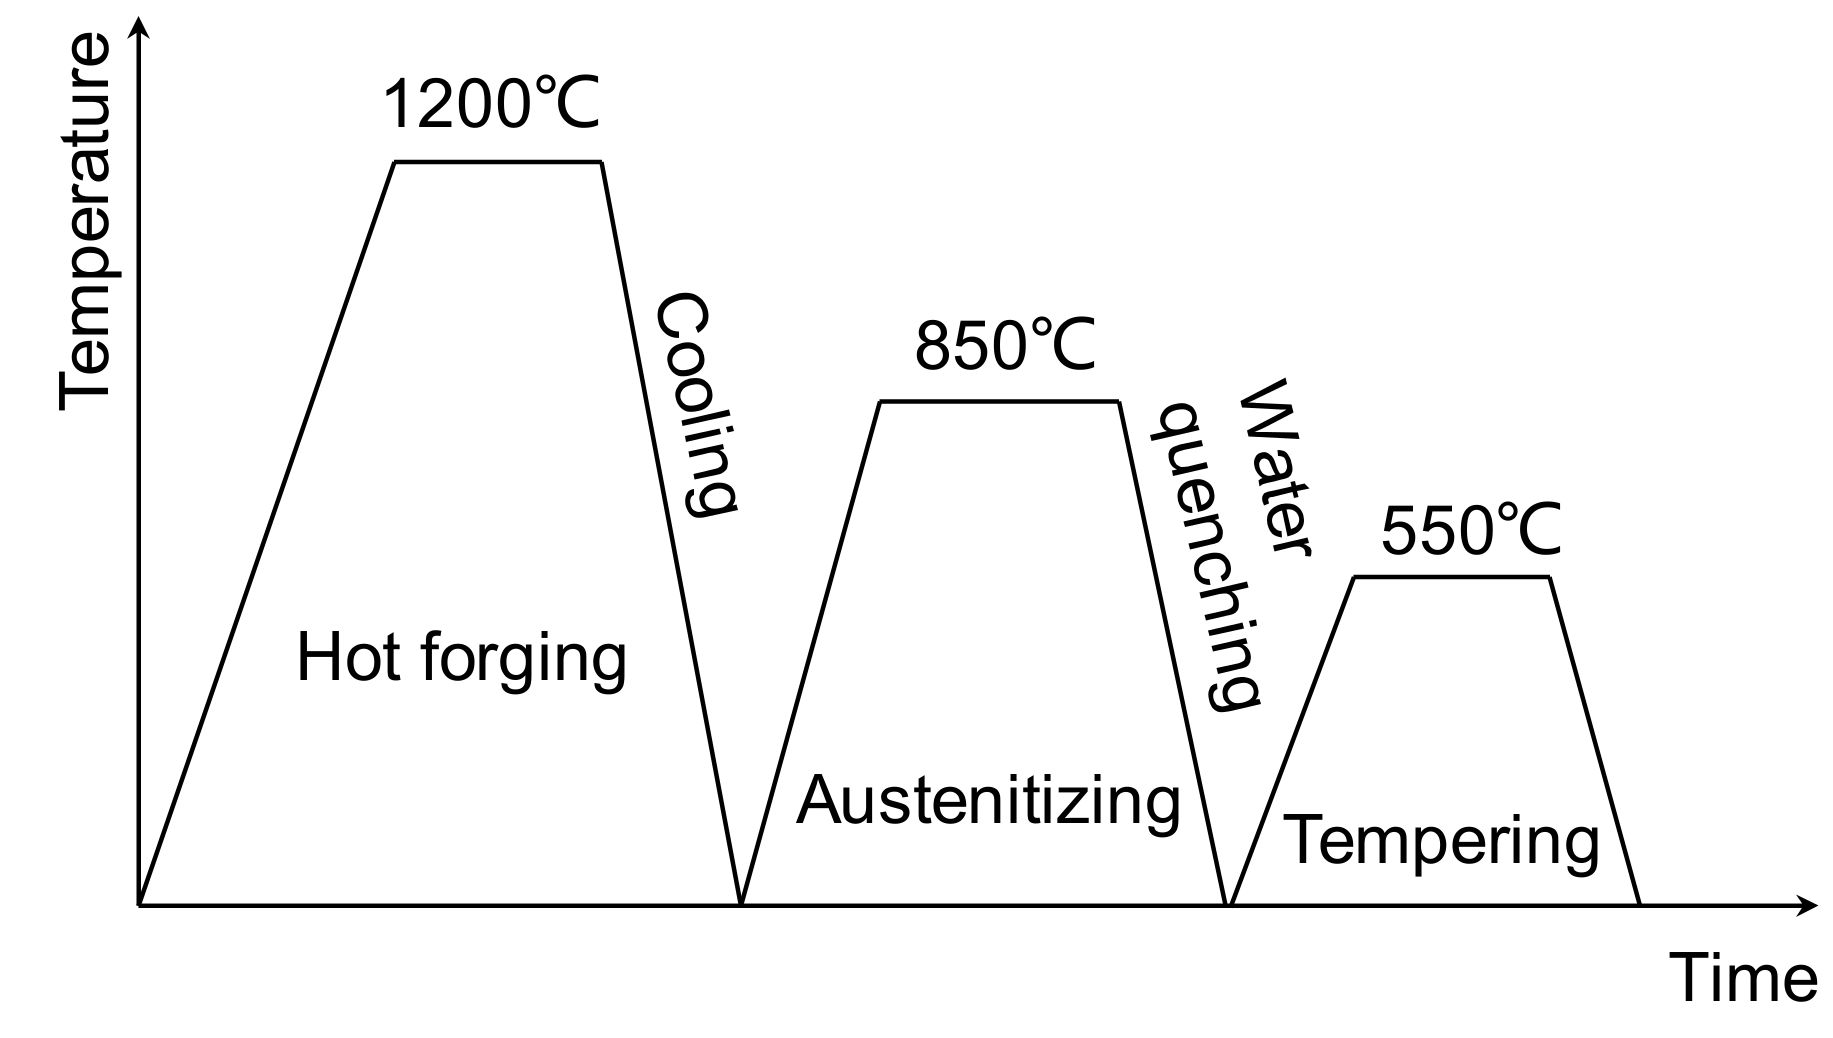
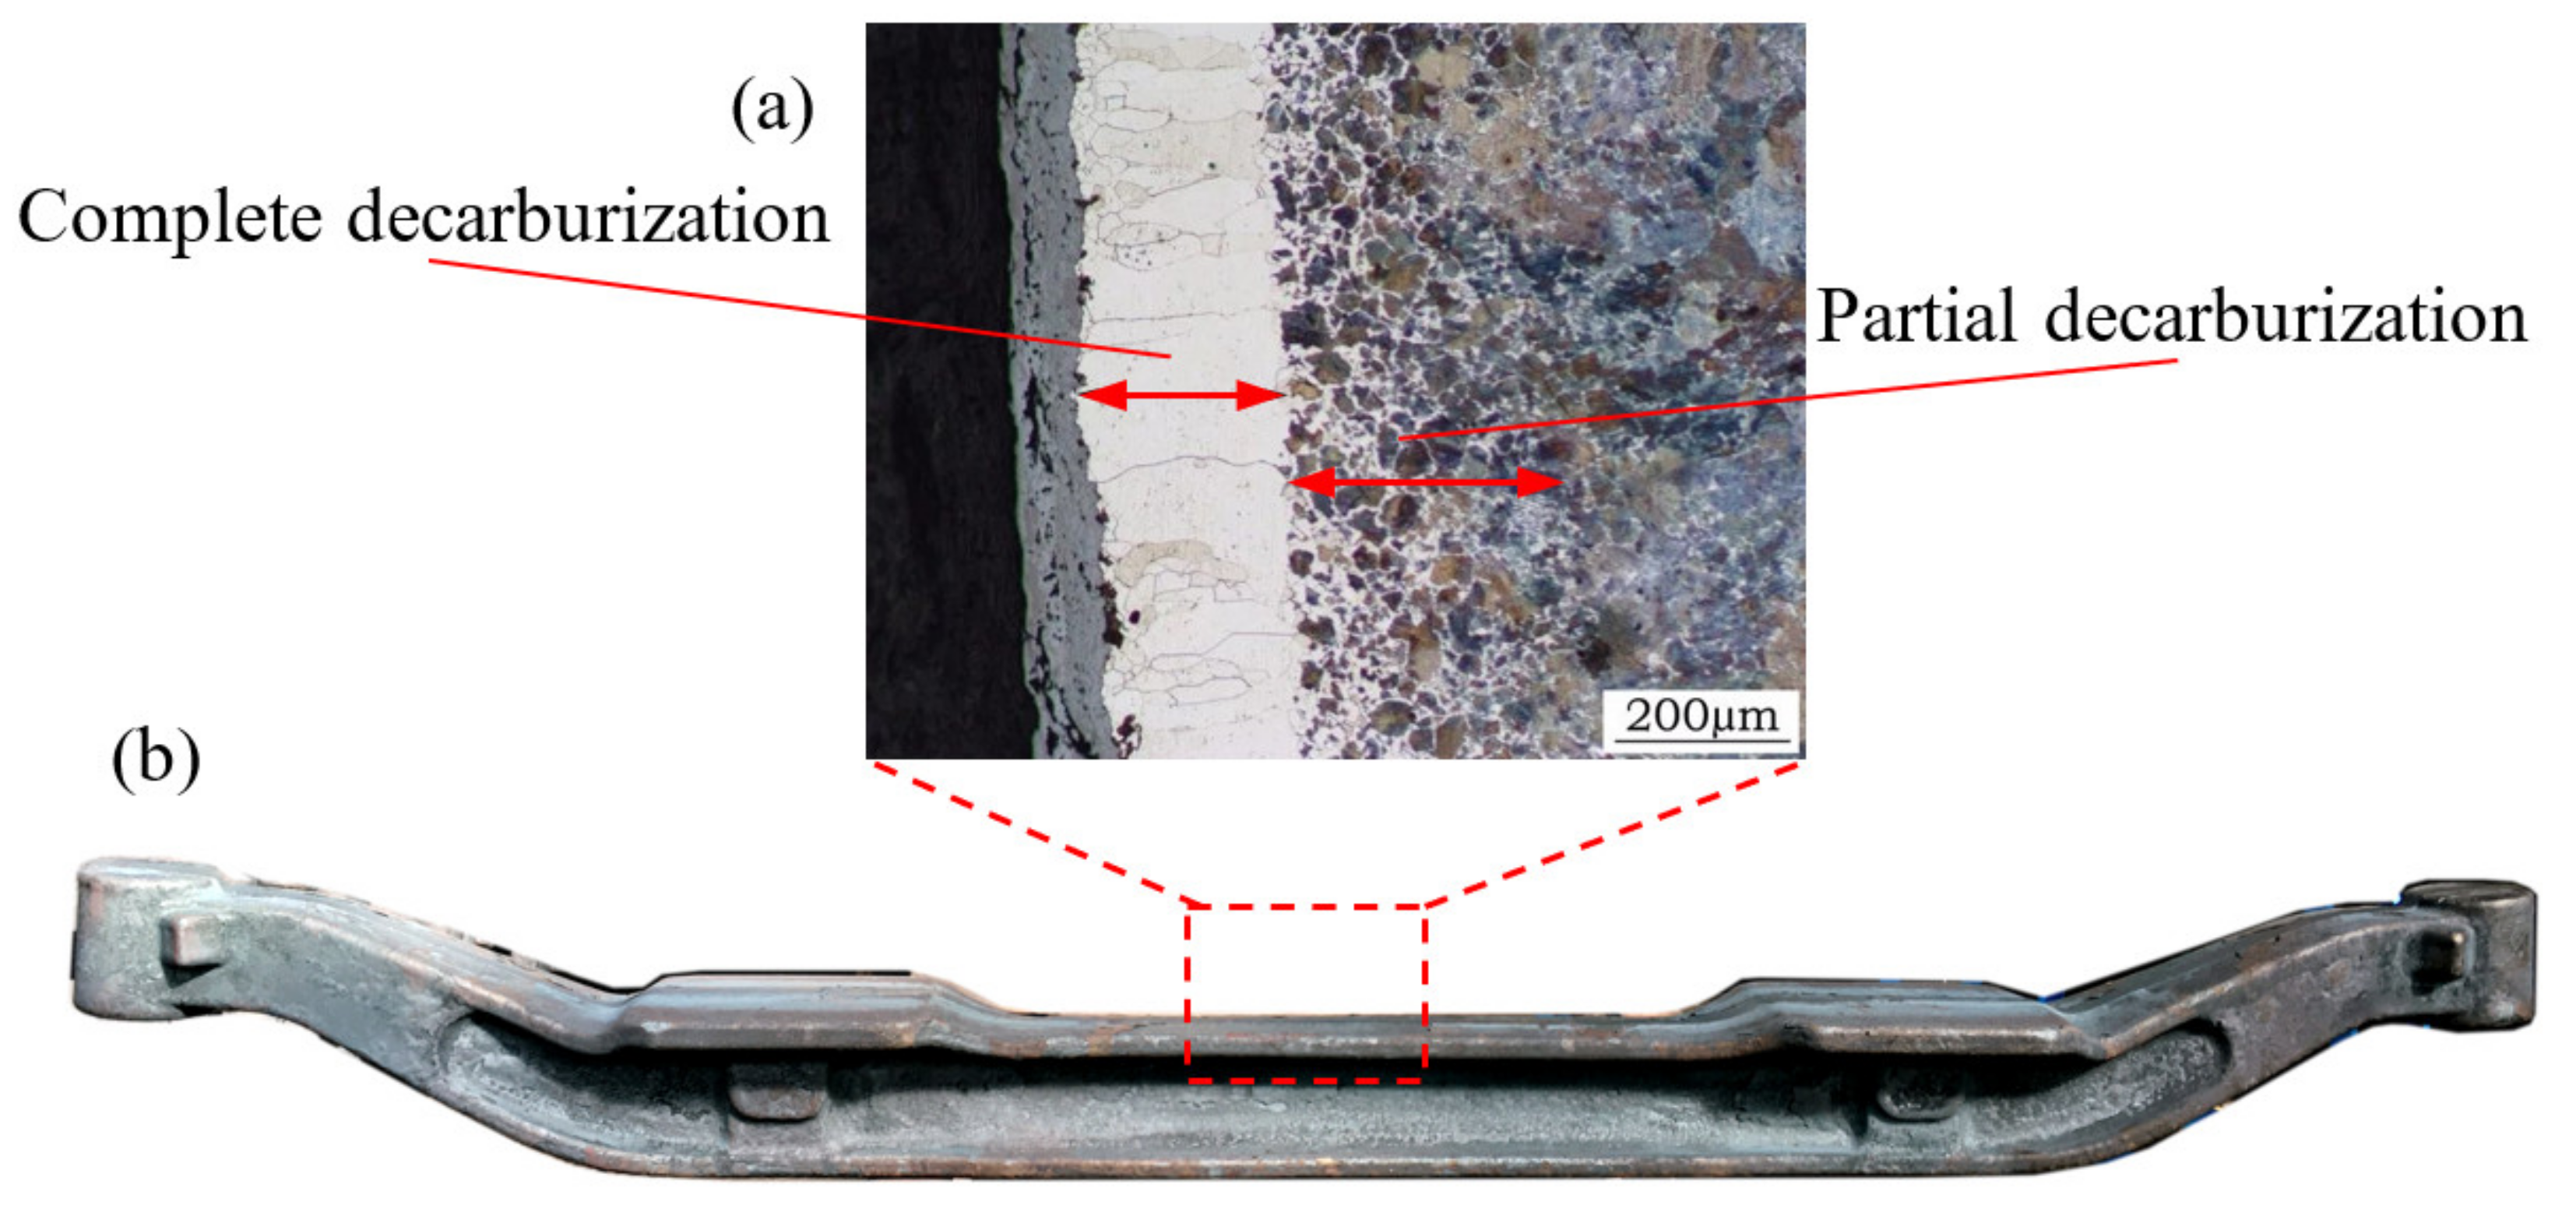
2.1. Materials

Material of the automobile forging front axle is AISI 4140 (GB 42CrMo), and the element content is shown in Table 1. The material contains 0.9~1.2% Cr element, which help form the carbide and improve the hardness, corrosion resistance; 0.15~0.25% Mo element, can help refine the grain, improve the hardenability, and heat endurance. The material is a kind of high-strength steel, with excellent strength (σs ≥ 930 MPa), toughness, and hardenability. The good fatigue resistance and impact resistance can be obtained through the quenched-tempered heat treatment. The material is usually applied for the automobile bearing component, such as the front axle, knuckle, gear and mould [34].

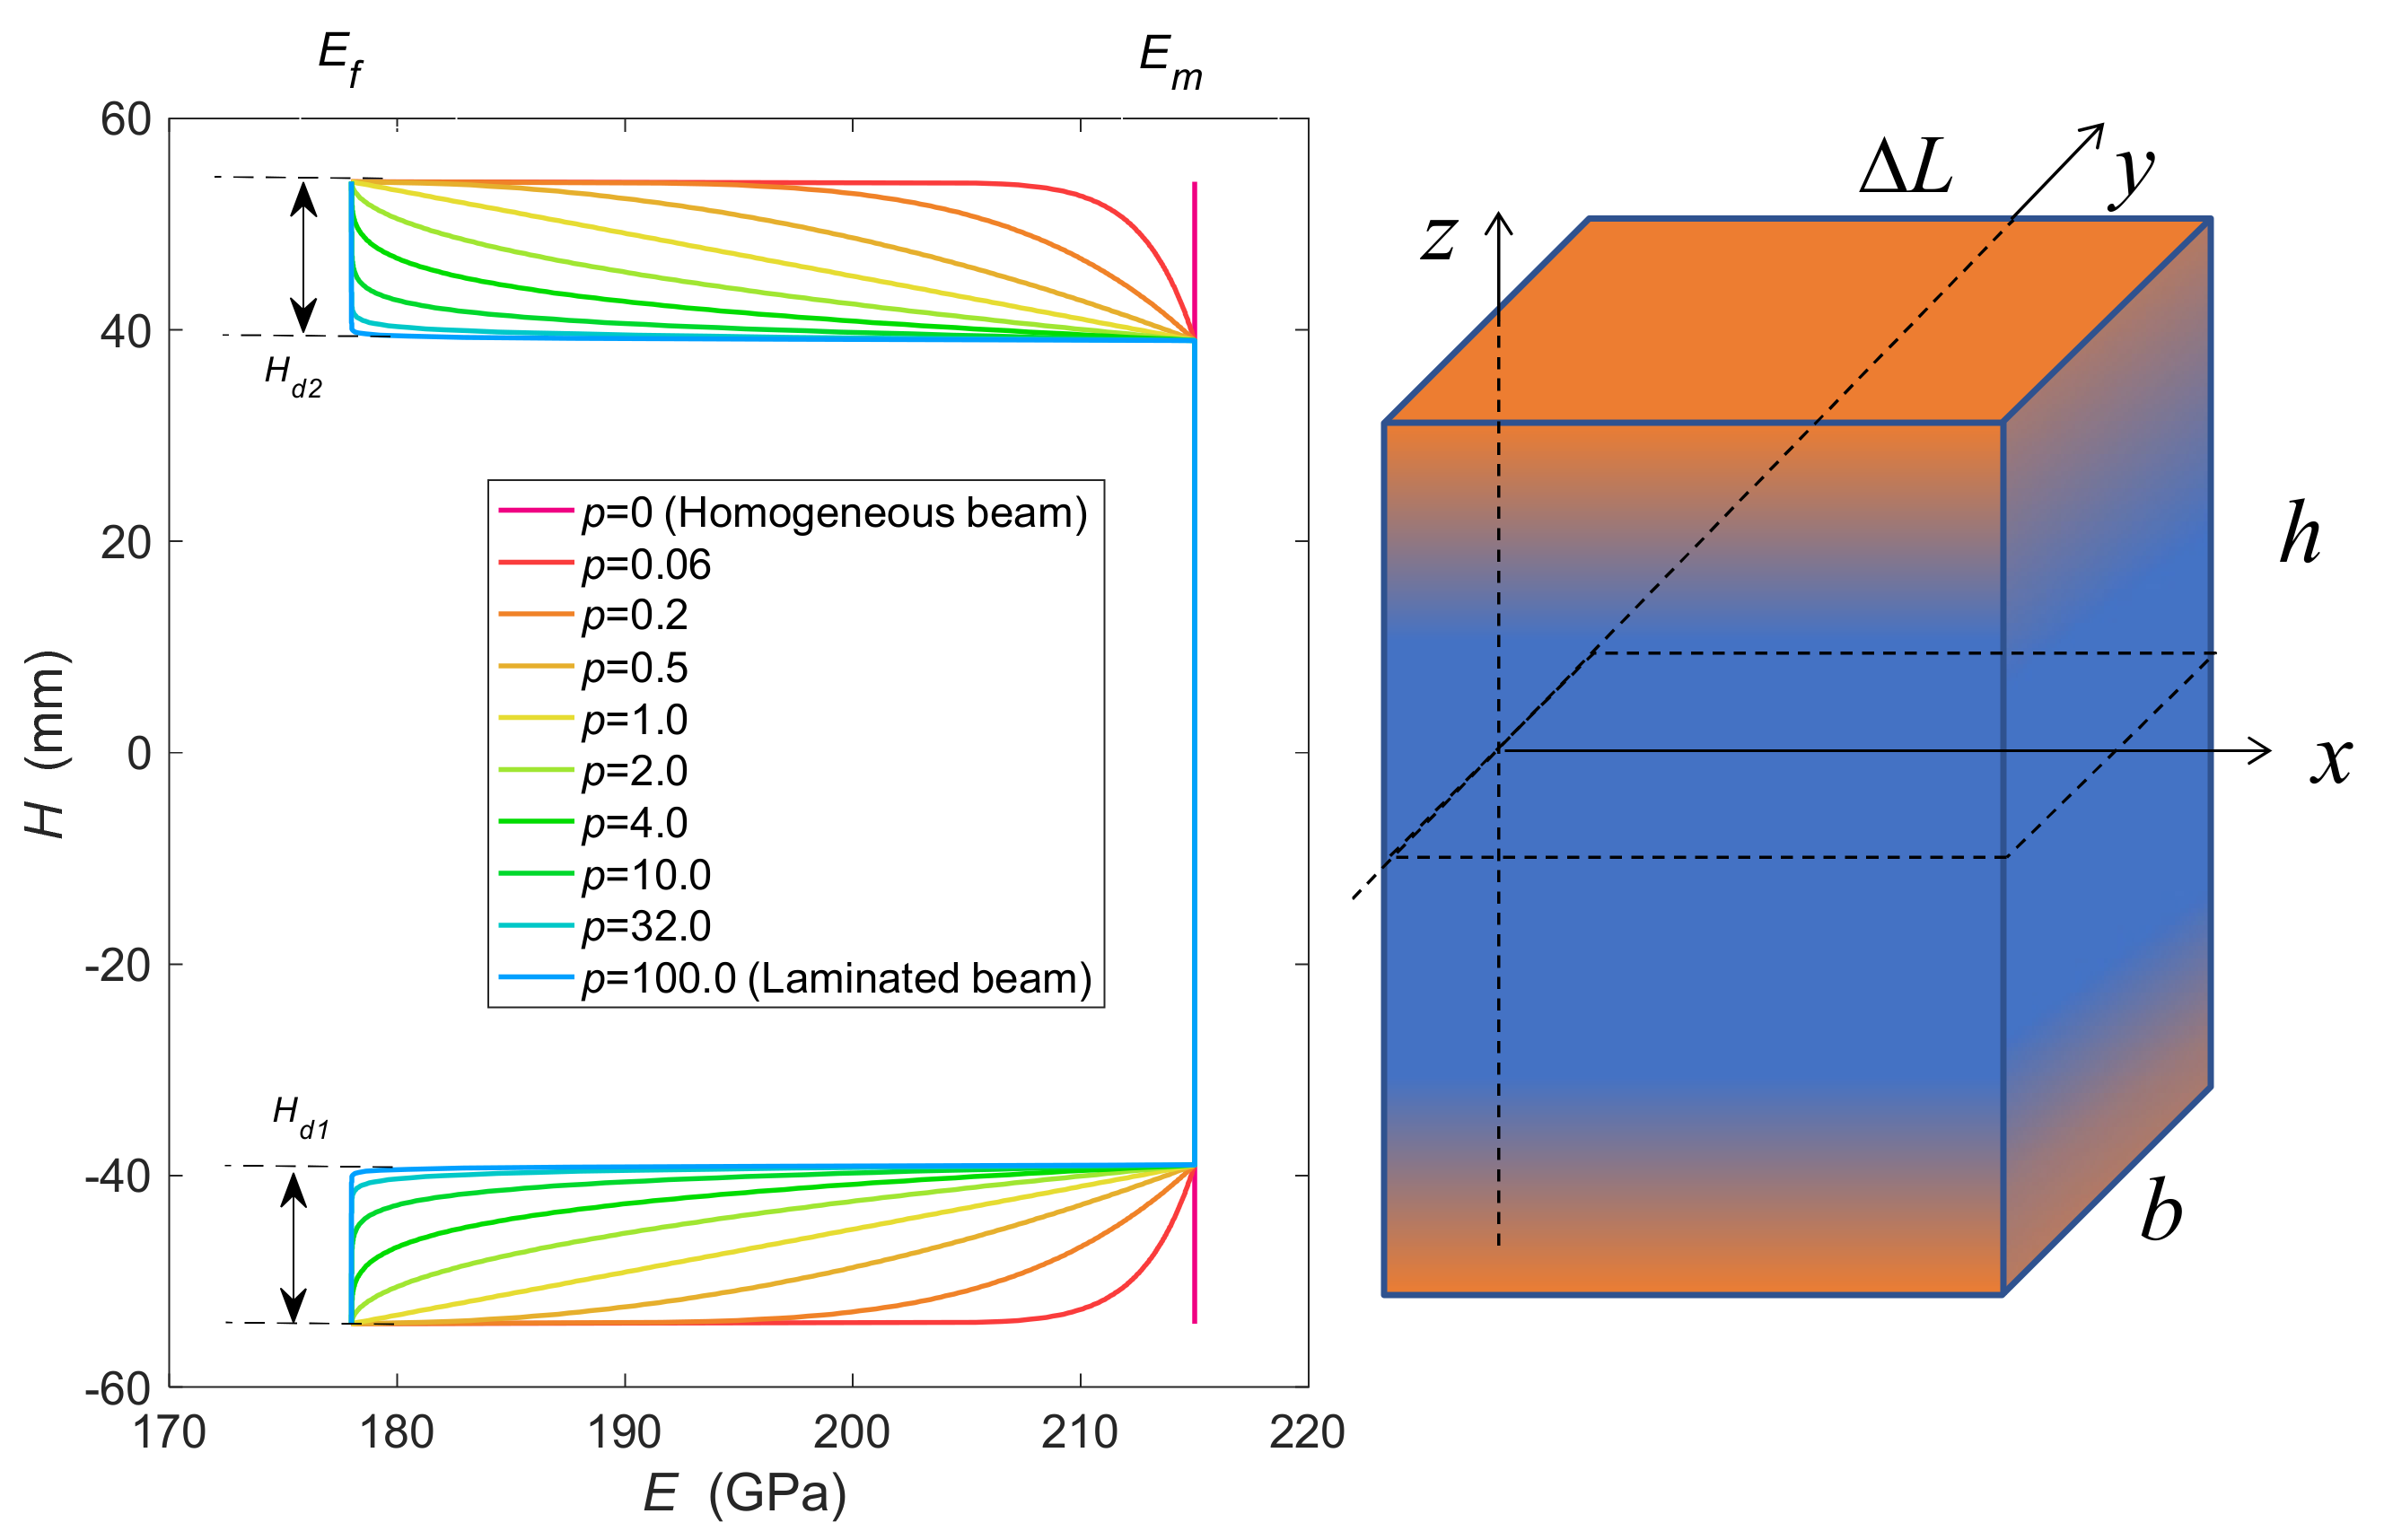
2.2. Mechanical Properties of Beams with Surface Decarburization
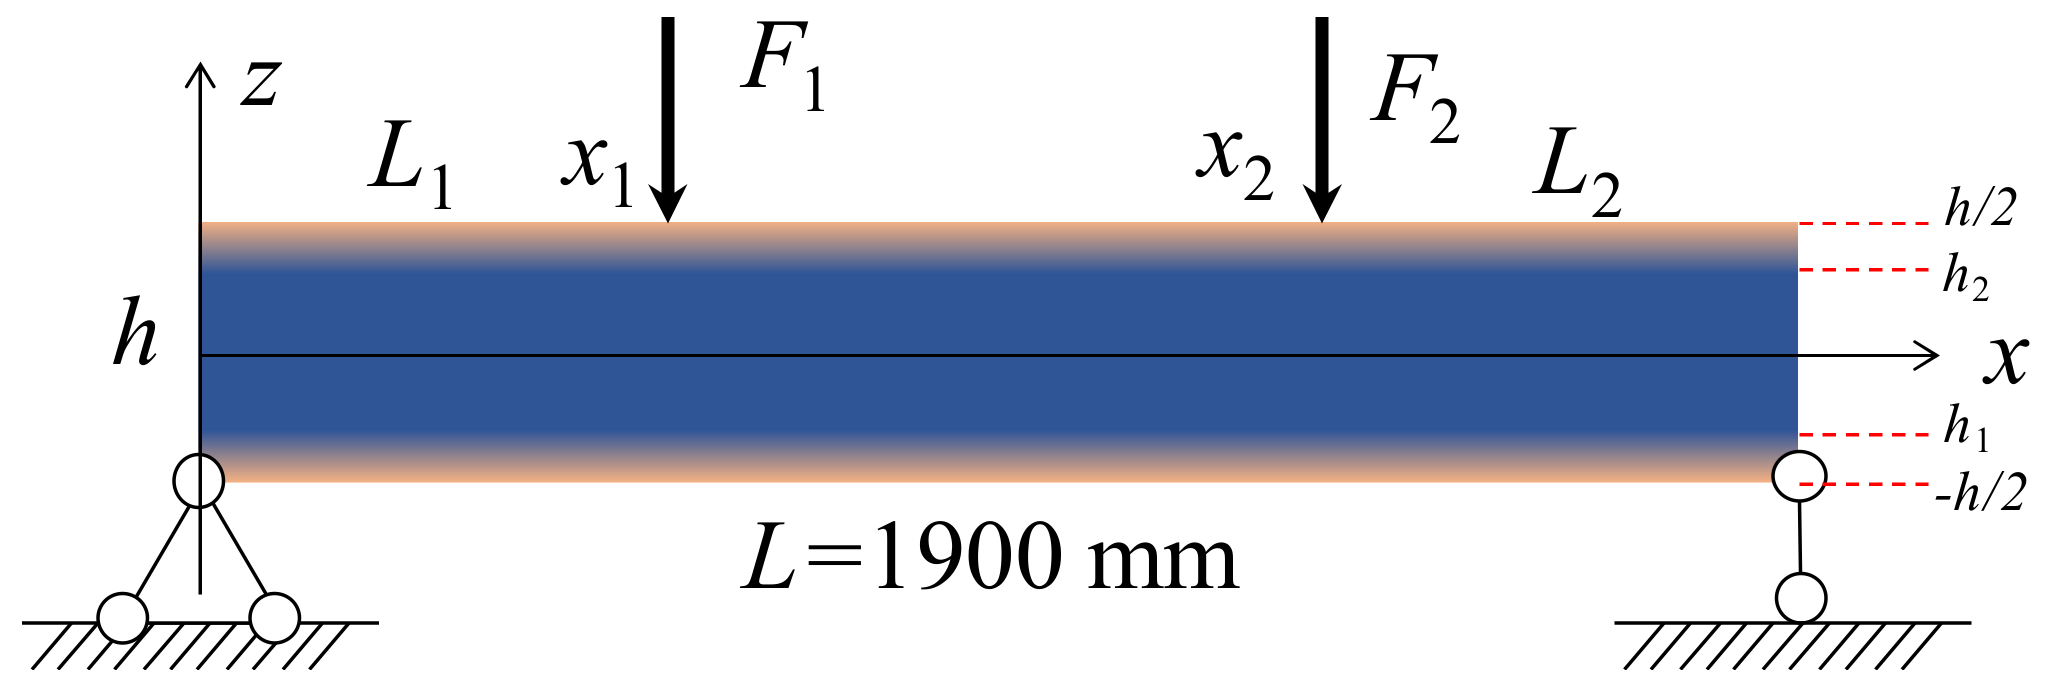
For the automobile front axle forging with surface decarburization, the metal at the surface is fully decarburized, which is constituted of ferrite phases. The core material experienced the quenching heat treatment, which is mainly constituted of the martensite phases, and the amount of the martensite decreases from the top surface to the core area, while the amount of the ferrite increases. Therefore, the automobile front axle forging with surface decarburization is simplified as a simply supported sandwich beam [35] with functionally graded surface and homogeneous core, as is illustrated in Figure 3. The length is L = 1900 mm, width is b = 90 mm, and height is h = 108 mm. The FG beam is subjected to two point−loads (F1 = F2 = 70,000 N) representing the body load of the automobile, where the distances between the load position (x1, x2) to both ends are L 1 = L 1 = 0.28 L . The decarburization depth (Hd) is denoted through the distance between h1 and h2 to bottom and top surface ( z = ± h / 2 ).
Material at decarburization zone is a mixture of low-strength ferrite and other high-strength phases (martensite, residual austenite). The fraction of ferrite is 100% at the surface and reduces to zeros continuously to the height h1 and h2; while the fraction of the martensite is zero at the surface, and increases continuously through the thickness to h1 and h2. The effective material properties (elasticity modulus, Poisson’s ratio, or density) can be expressed z dependent based on the mixture rule as follows:
P ( z ) = P f V f + P m V m
where P f is properties of ferrite phases at surface, P m is properties of martensite phases at core. V f and V m are the volume fractions, respectively, and V f + V m = 1 .
Considering that the FG sandwich beam constitutes two FG surface layers and one homogeneous core layer, a piecewise function for the effective material properties is constructed with the varying volume fractions V m z as the following formula:
V m z = z + h / 2 h 1 + h / 2 p       ,   z h / 2 , h 1     1                                     ,   z h 1 , h 2 z h / 2 h 2 h / 2 p       ,   z h 2 , h / 2
where p is the non-negative power−law exponent ( p [ 0 , + ] ), denoting the material properties variation profile across the beam height h. The parameter p = 0 represents the complete martensite phases, while p = + denotes the full ferrite phases.
The elasticity modulus of pure ferrite phases at bottom and top surface is Ef = 178 GPa [36]; while that of martensite phases at core area is Em = 215 GPa [37]; The influence of Poisson’s ratio on the deflection is much less than that of elasticity modulus [38]. Therefore, Poisson’s ratio of the graded beams is assumed to be constant at 0.3. Variation of the elasticity modulus E through the beam height h in terms of power−law index p is shown in Figure 4. The power−law index p increases with the concentration of ferrite phases, and the elasticity modulus decreases with the increasing ferrite phases, namely the index p. The effective elasticity modulus varies smoothly across the beam height; the value at the surface of both sides is equal to pure ferrite phases, while that at the core area is equal to the martensite phases. Different power−law exponents describe the various profile. When p = 0, properties at the decarburization area is equal to the core area, which degenerate to a homogeneous beam; when p = + , properties at the decarburization area is entirely equal to pure ferrite phases, which is similar to the laminated beam with a drastic change of properties; when p 0 , + , the properties vary smoothly, denoting a functionally graded characteristic.

2.3. Methods

Based on the third-order parabolic shear deformation theory (TSDT), the displacement field at any position of the beam is expressed as follows [27]:
u ( x , z ) = u 0 ( x ) + z ϕ x 4 3 h 2 z 3 ϕ x + d w 0 d x v x , z = 0 w ( x , z ) = w 0 ( x )
where u(x, z), v(x, z), and w(x, z) are the axial displacements and transverse defection of any point on the beam along x, y, and z direction. u 0 ( x ) and w 0 ( x ) are the axial and transverse displacement of a point on the middle surface (z = 0) along x and z direction, ϕ x is the bending rotation of the cross-sections at the neural axis about y axes.
The non-zero axial and shear strain field is calculated according to the following equations:
ε x = d u d x = d u 0 d x + z d ϕ d x α z 3 d ϕ d x + d 2 w 0 d x 2 γ x z = d u d z + d w d x = ϕ x + d w 0 d x β z 2 ϕ + d w 0 d x = 1 β z 2 ϕ + d w 0 d x
where, α = 4 / 3 h 2 , β = 4 / h 2 .
The axial and shear stress can be obtained via the stress-strain relations expressed as Equation (5), where the elasticity modulus E z varies across the beam height according to Equations (1) and (2), and shear modulus G ( z ) is calculated according to Equation (6).
σ x = E ( z ) ε x τ x z = G ( z ) γ x z
G ( z ) = E ( z ) 2 [ 1 + v ]
The virtual work principle [39] is employed to derive the governing equations of motion and boundary conditions. The internal strain energy δ U performed by axial and shear stress is given by:
δ U = 0 L A σ x x δ ε x x + σ x z δ γ x z d A d x = 0 L A σ x x d δ u 0 d x + z d δ ϕ d x α z 3 d δ ϕ d x + d 2 δ w 0 d x 2   + σ x z 1 β z 2 δ ϕ + d δ w 0 d x d A d x = 0 L N x x d δ u 0 d x + M x x α P x x d δ ϕ d x α P x x d 2 δ w 0 d x 2   + Q x z β R x z δ ϕ + d δ w 0 d x d x
where N x x , M x x , and Q x z are usual axial force, bending moment, and shear force, respectively. P x x and R x z are high-order stress resultants, as is calculated by the following equations:
N x x = A σ x x d A = A E z ε x , z d A = A 1 d u 0 d x + A 2 d ϕ d x + A 3 d 2 w 0 d x 2
M x x = A z σ x x d A = A E z ε x , z z d A = B 1 d u 0 d x + B 2 d ϕ d x + B 3 d 2 w 0 d x 2
P x x = A z 3 σ x x d A = A E z ε x , z z 3 d A = C 1 d u 0 d x + C 2 d ϕ d x + C 3 d 2 w 0 d x 2
Q x z = A σ x z d A = A G z γ x , z d A = D 1 ϕ x + D 2 d w 0 d x
R x z = A z 2 σ x z d A = A G z γ x , z z 2 d A = F 1 ϕ x + F 2 d w 0 d x
The coefficients A i , B i , C i , D i , F i are calculated through the following integral formula (13) about the variable z, elasticity modulus E z , and shear modulus G z . The modulus varies through the piecewise power−law function, and thus the coefficients reflect the variation of material properties.
A 1 , A 2 , A 3 = b h / 2 h / 2 1 , z α z 3 , α z 3 E z d z B 1 , B 2 , B 3 = b h / 2 h / 2 z , z 2 α z 4 , α z 4 E z d z C 1 , C 2 , C 3 = b h / 2 h / 2 z 3 , z 4 α z 6 , α z 6 E z d z D 1 = D 2 = b h / 2 h / 2 G z 1 β z 2 d z F 1 = F 2 = b h / 2 h / 2 G z z 2 β z 4 d z
The external virtual potential energy performed by transverse distributed load q and virtual displacement δ w 0 is expressed as follows:
δ V = 0 L q ( x ) δ w 0 d x
Based on the principle of minimum potential energy [40], equilibrium equation of the energy in the displacement field is given by:
δ W = δ U + δ V = 0
By substituting Equations (7) and (14) into Equation (15), the final expression is written as follows:
δ W = 0 L N x x d δ u 0 d x + M x x α P x x d δ ϕ d x α P x x d 2 δ w 0 d x 2   + ( Q x β R x ) δ ϕ + d δ w 0 d x q x δ w 0 d x = 0 L d N x x d x δ u 0 + d M x x α P x x d x + Q x z β R x z δ ϕ + α d 2 P x x d x 2 d Q x z β R x z d x q δ w 0 d x   + N x x δ u 0 + M x x α P x x δ ϕ + α d P x x d x + Q x z δ w 0 R α P x x d δ w 0 d x 0 L = 0
To satisfy Equation (15), the coefficients of δ u 0 , δ ϕ , and δ w 0 in Equation (16) should be zeros, and thus the equilibrium equations based on the third-order shear deformation theory are developed as follows:
d N x x d x = 0 d M x x α P x x d x Q x z β R x z = 0 d 2 M x x d x 2 + q = 0
By substituting the Equations (8) to (12) into Equation (17), and applying the derivative method, the final expression is given by:
A 1 d 2 u 0 d x 2 + A 2 d 2 ϕ d x 2 + A 3 d 3 w 0 d x 2 = 0 B 1 α C 1 d 2 u 0 d x 2 D 1 β F 1 ϕ + B 2 α C 2 d 2 ϕ d x 2 D 2 β F 2 d w 0 d x + B 3 α C 3 d 3 w 0 d x 3 = 0 B 1 d 3 u 0 d x 3 + B 2 d 3 ϕ d x 3 + B 3 d 4 w 0 d x 4 + q = 0
For boundary conditions of the simplified beam with graded decarburization layers, one end of the beam is fixed simply supported, and the other end is movable simply supported. The expression of boundary conditions can be given as:
Fixed simply supported (Sf) at x = 0 :
u 0 = 0 ;     w 0 = 0 ;       M x x = 0 ;
Movable simply supported (Sm) at x = L :
N x x = 0 ;     w 0 = 0 ;       M x x = 0 ;

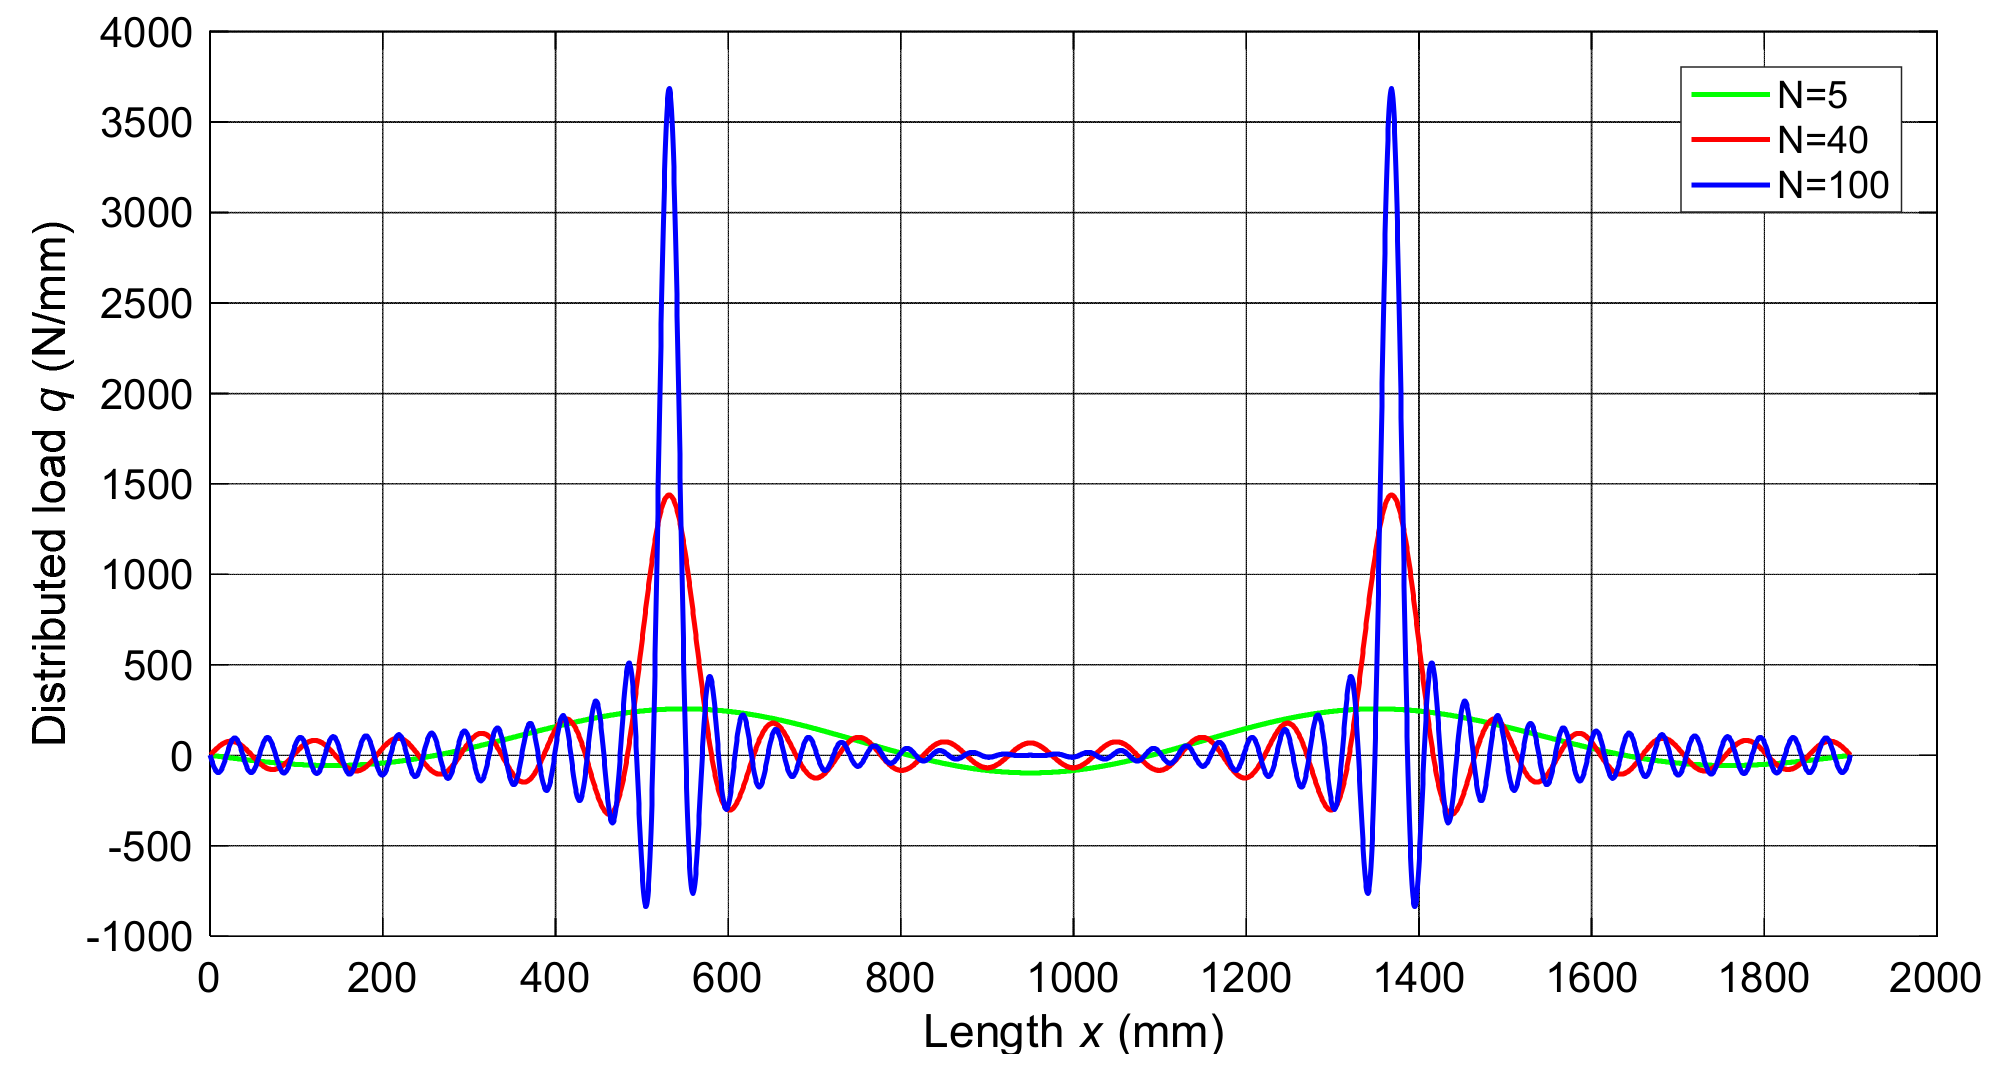
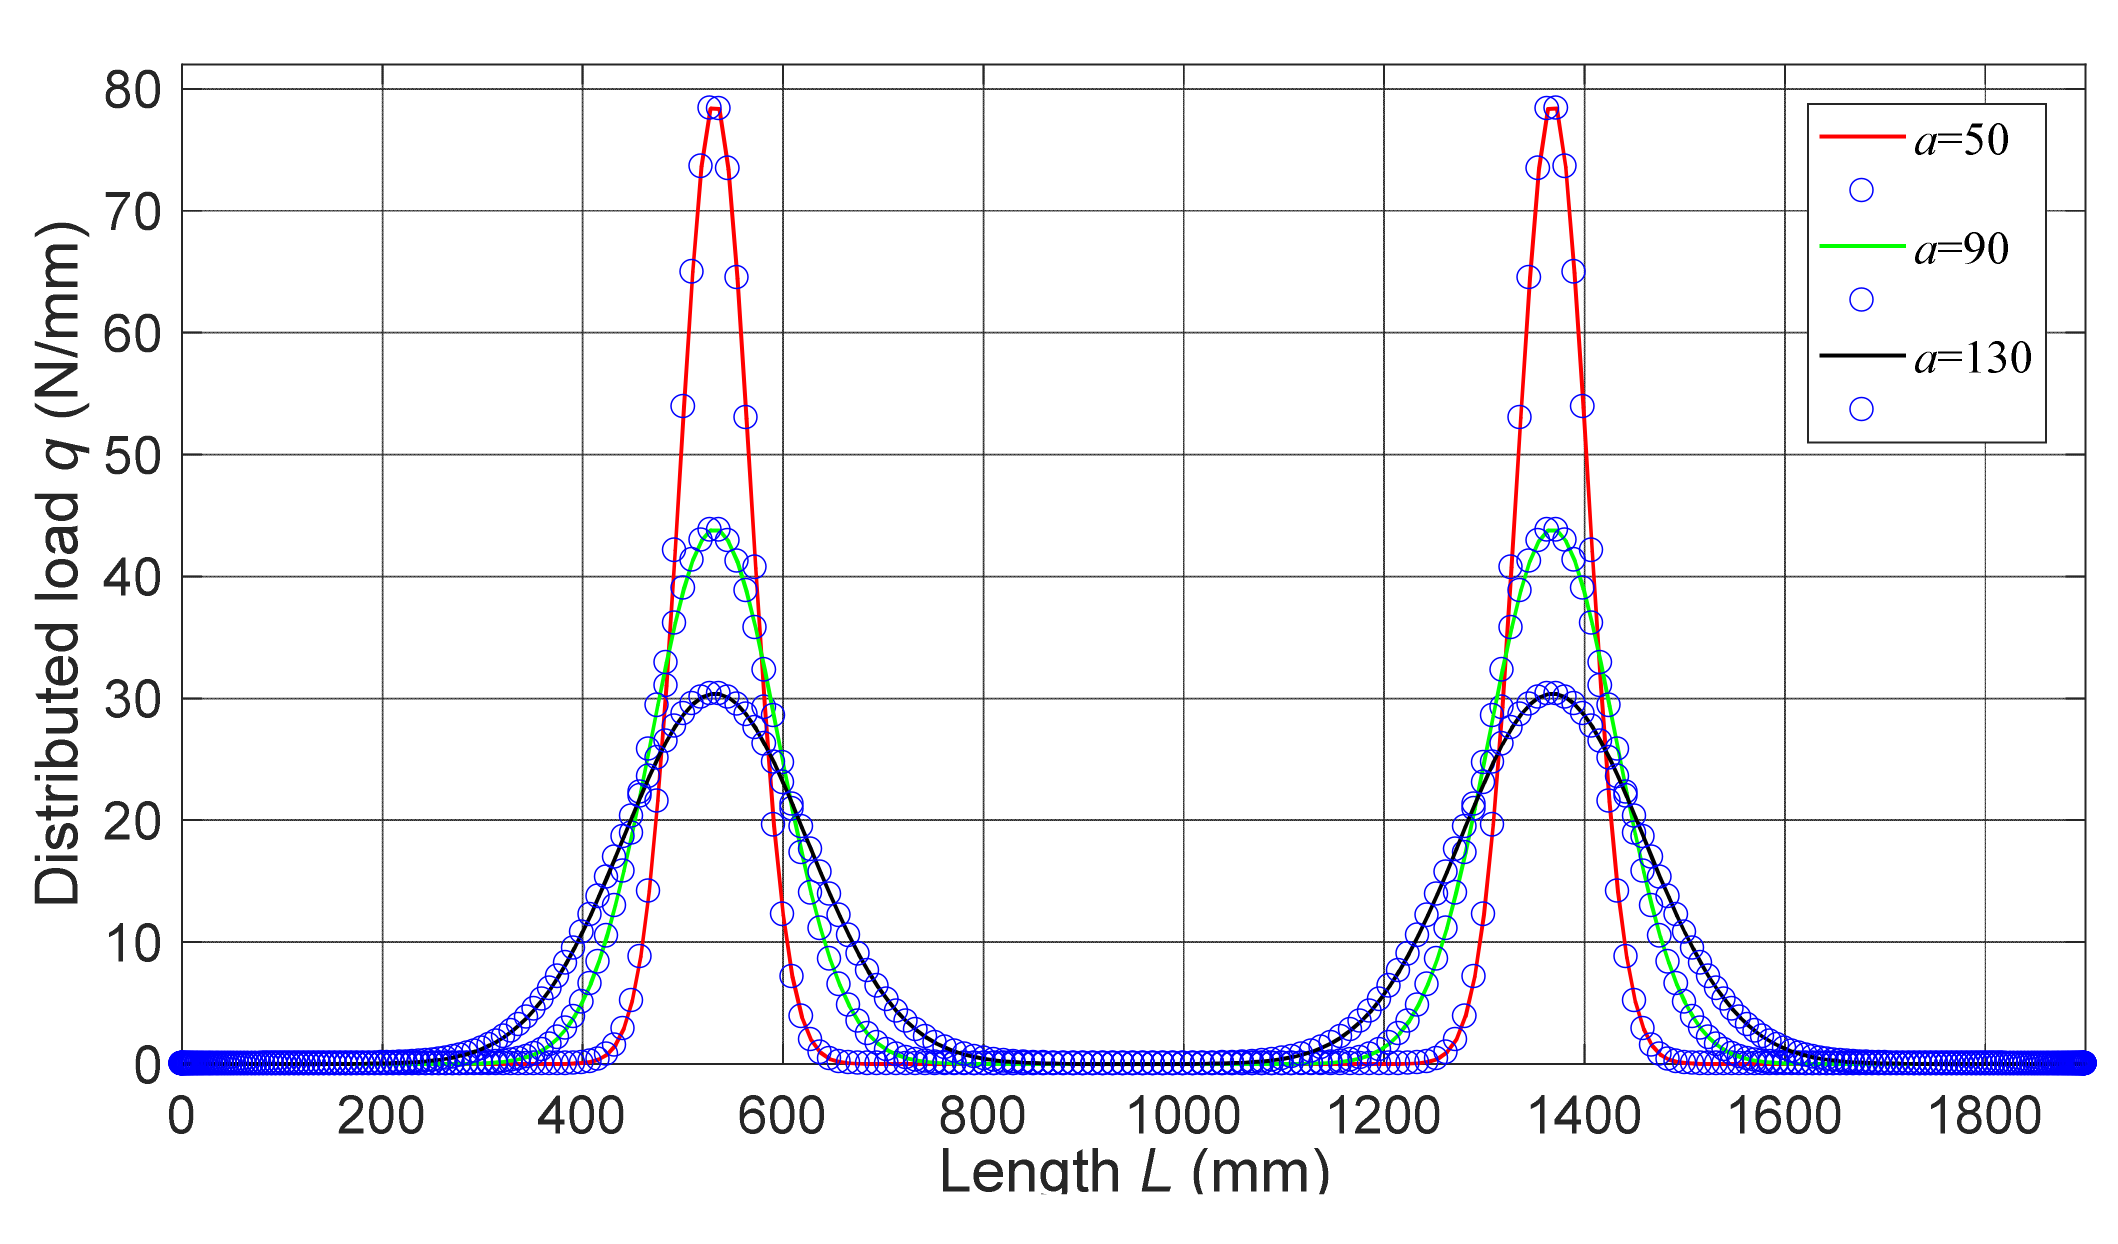
2.4. Analytical Solution with Navier Method

The Navier method is adopted to obtain an analytical solution of the bending behaviors. Variables of displacement filed can be written as follows:
u 0 ( x ) = n = 1 u n cos ( n π L x ) ϕ ( x ) = n = 1 ϕ n cos ( n π L x ) w 0 ( x ) = n = 1 w n sin ( n π L x )       n = 1 , 2 , 3 , , N
where u n , ϕ n , and w n are the coefficients of the nth terms, and it means that the displacement is approached by the sum of trigonometric functions. It should be noted that the expressions of displacement with Equation (21) satisfy the boundary conditions with Equations (19) and (20).
For the application of automobile front axle, two transverse point-loads F 1 and F 2 are applied at different positions of the beam, as is illustrated in Figure 3. The point loads are transferred to a distributed load through the Dirac delta function q x = F δ x x p , where F is the magnitude of the point-load force, x p is the coordinate of applying position. To obtain the analytical solution, the transverse distributed load is expanded in Fourier series as:
q x = n = 1 N Q n sin n π L x       n = 1 , 2 , 3 N
where Q n is the coefficient of the nth term, which is calculated as the following formula:
Q n = 2 L 0 L q x sin n π L x d x = 2 F L sin n π L x p       n = 1 , 2 , 3 N
With two point−loads F1 and F2 applied at x 1 and x 2 respectively, the coefficient is obtained as Equation (24), and load distribution with different N is shown in Figure 5. Similarity of the expanded Fourier series and original point loads δ increases with the number N.
Q n d = 2 F 1 L sin n π L x 1 + 2 F 2 L sin n π L x 2       n = 1 , 2 , 3 N
By substituting Equations (21), (22) and (24), and their derivatives of different orders into the final equilibrium Equation (18), 3 × N linear system of equations including 3 × N unknowns, and ( n [ 1 , 2 , 3 , N ] ) can be obtained. The coefficients can be solved through the elimination method, and the displacement, strain, and stress can be further calculated.

2.5. Differential Quadrature Method (DQM)

In order to validate the analytical solution with Navier method, another numerical method named differential quadrature method (DQM) [41] is also employed, which is an effective method for the differential equations. The domain is discretized into N points a = x 1 < x 2 < < x N = b , according to the Chebyshev–Gauss–Lobatto method [42] as Equation (25), with the function value f 1 , f 2 , f 3 , , f N . The derivatives at any point are approximately calculated with a weighted nonlinear summation of all functional values as Equations (26) and (27).
x i = L 2 1 cos i 1 N 1 ,       i = 1 , 2 , 3 , , N
f ( x ) = j = 1 N l j ( x ) f x j = j = 1 N l j ( x ) f j
f i k = j = 1 N A i j k f j ,       ( i = 1 , 2 , , N )
where the weighted coefficients l j x are expressed with Lagrange interpolation functions [43], A i j k is the weighted coefficient of kth order derivative, which can be calculated with Equation (28).
A i j 1 = l j x i = k = 1 k i , j N x i x k / k = 1 k j N x j x k , ( i j ) k = 1 k i N 1 x i x k , ( i = j ) A i j 2 = k = 1 N A i k 1 A k j 1 , ( i , j = 1 , 2 , , N ) A i j 3 = k = 1 N A i k 2 A k j 1 , ( i , j = 1 , 2 , , N ) A i j 4 = k = 1 N A i k 3 A k j 1 , ( i , j = 1 , 2 , , N )
To implement the DQM, the discrete two point−loads is approximately represented with a smooth regularized Dirac-delta function as follows:
q x = δ x x 1 + δ x x 1 F 1 a π exp x x 1 2 a 2 + F 2 a π exp x x 2 2 a 2 , a 0
where a is the regularization parameter that controls the smoothness and accuracy of approximation. When a 0 , the accuracy is the highest, as is shown in Figure 6.
By substituting Equations (28), (29) and their derivatives with different orders into the final equilibrium Equation (18) and the boundary conditions Equations (19) and (20), 3 × N + 6 linear system of equations including 3 × N unknowns u 0 i , ϕ i , and w 0 i ( i 1 , 2 , 3 , , N ) can be obtained. The coefficients can also be solved through the elimination method.

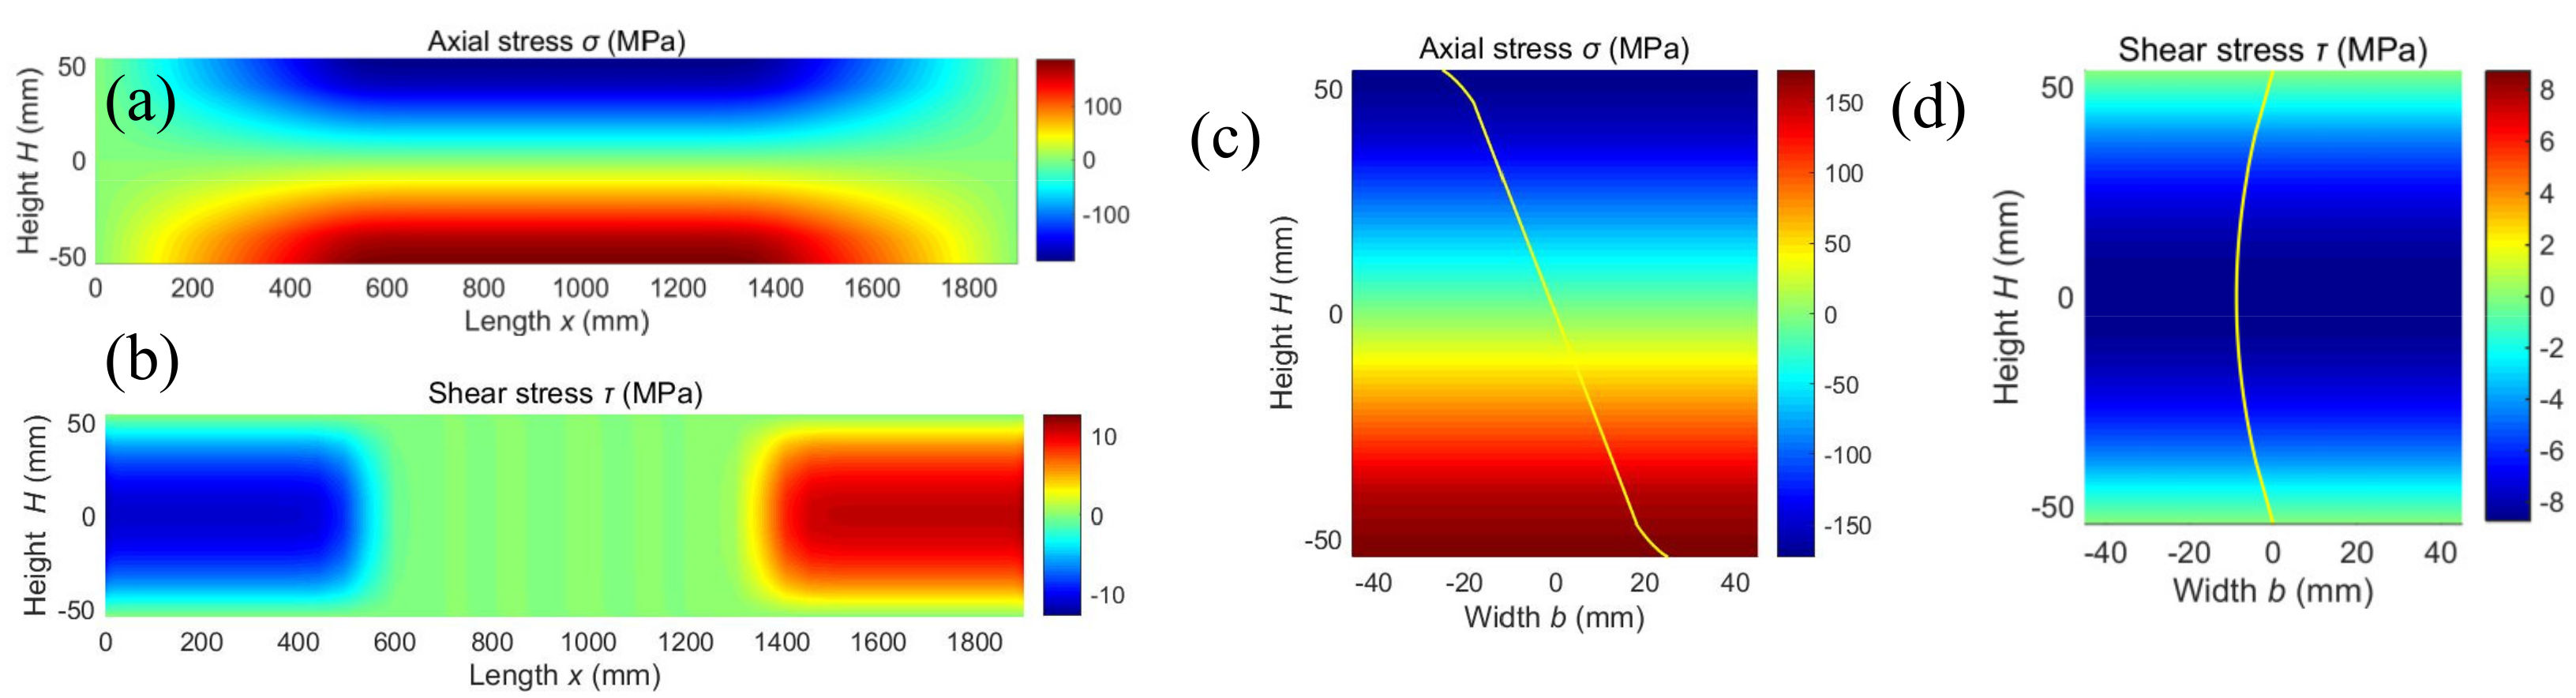
3. Results and Discussion

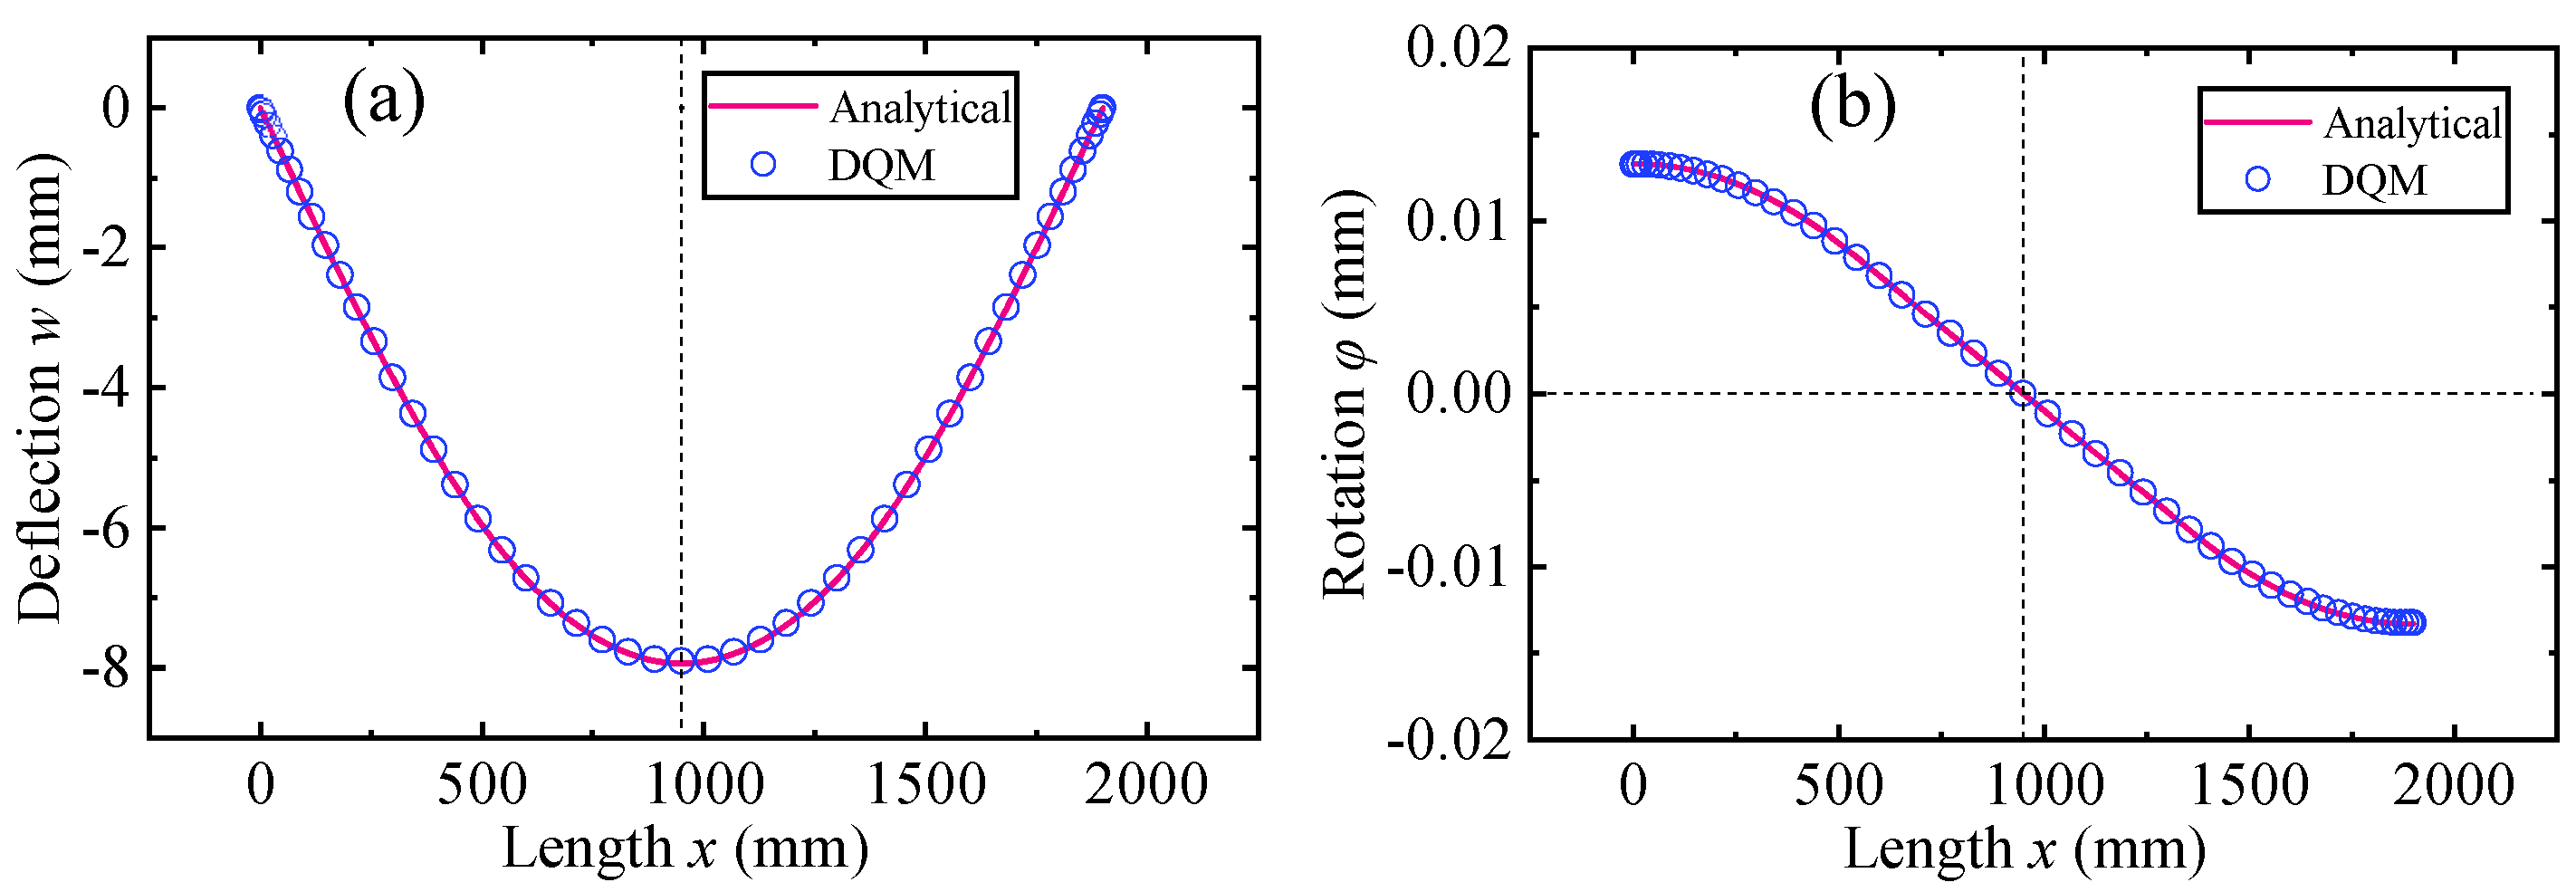
3.1. Numerical Verification

Before further analysis of bending behaviors, the reliability and accuracy are verified. Since there is no previous published data for the bending of graded beam with decarburization layers, an example with the functionally graded material sandwich beam consisting of the aluminum and Al2O3 ceramic is calculated through present model, and the results are compared with the literature. The comparison of center deflection is shown in Table 2. It can be found that the center deflections in terms of power−law index p with the method in this paper are in good agreement with that of Koutoati et al. [44] using finite element approach.
Meanwhile, the center deflection and maximum rotation for beams with graded decarburization layer calculated with the analytical Navier method and DQM are compared, as is shown in Table 3 and Figure 7. With different power−law indexes indicating the profile of material properties, the results are also in good agreement with each other, with the maximum deviation less than 0.31%. It demonstrates that the method with third-order shear deformation theory of graded beam to predict the bending behavior has an excellent reliability and accuracy.

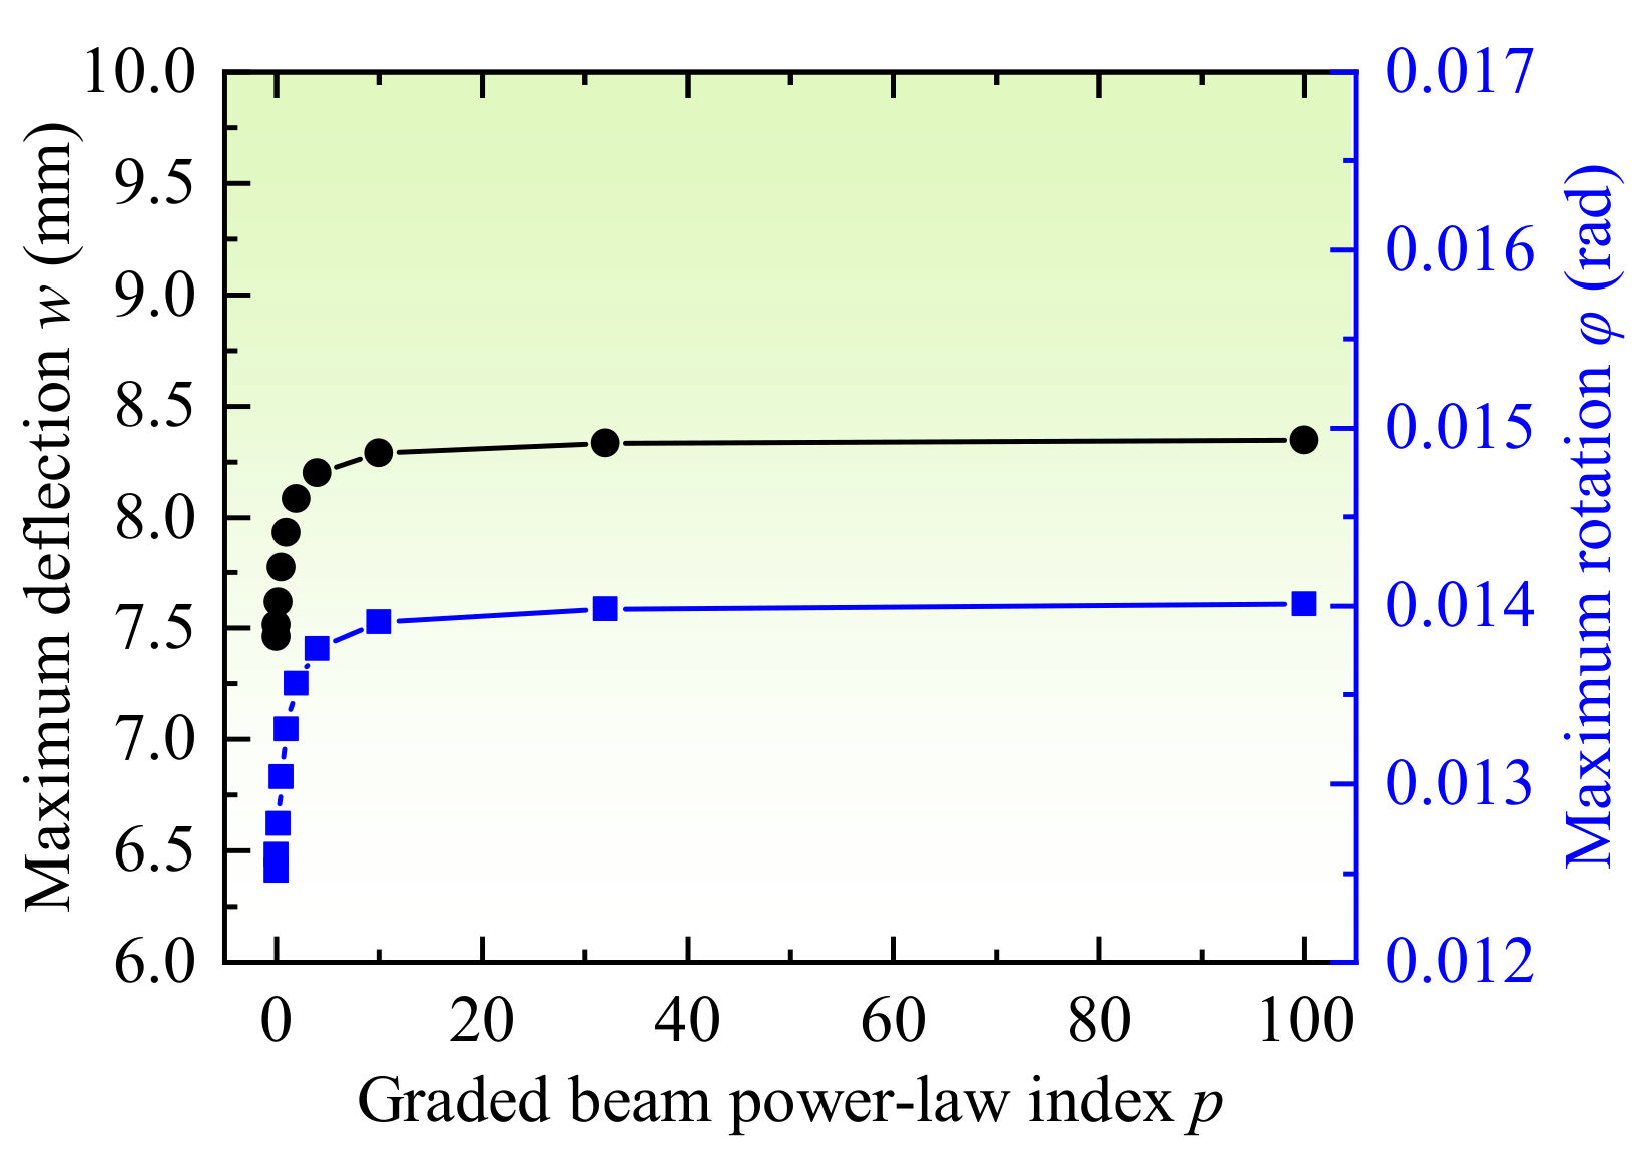
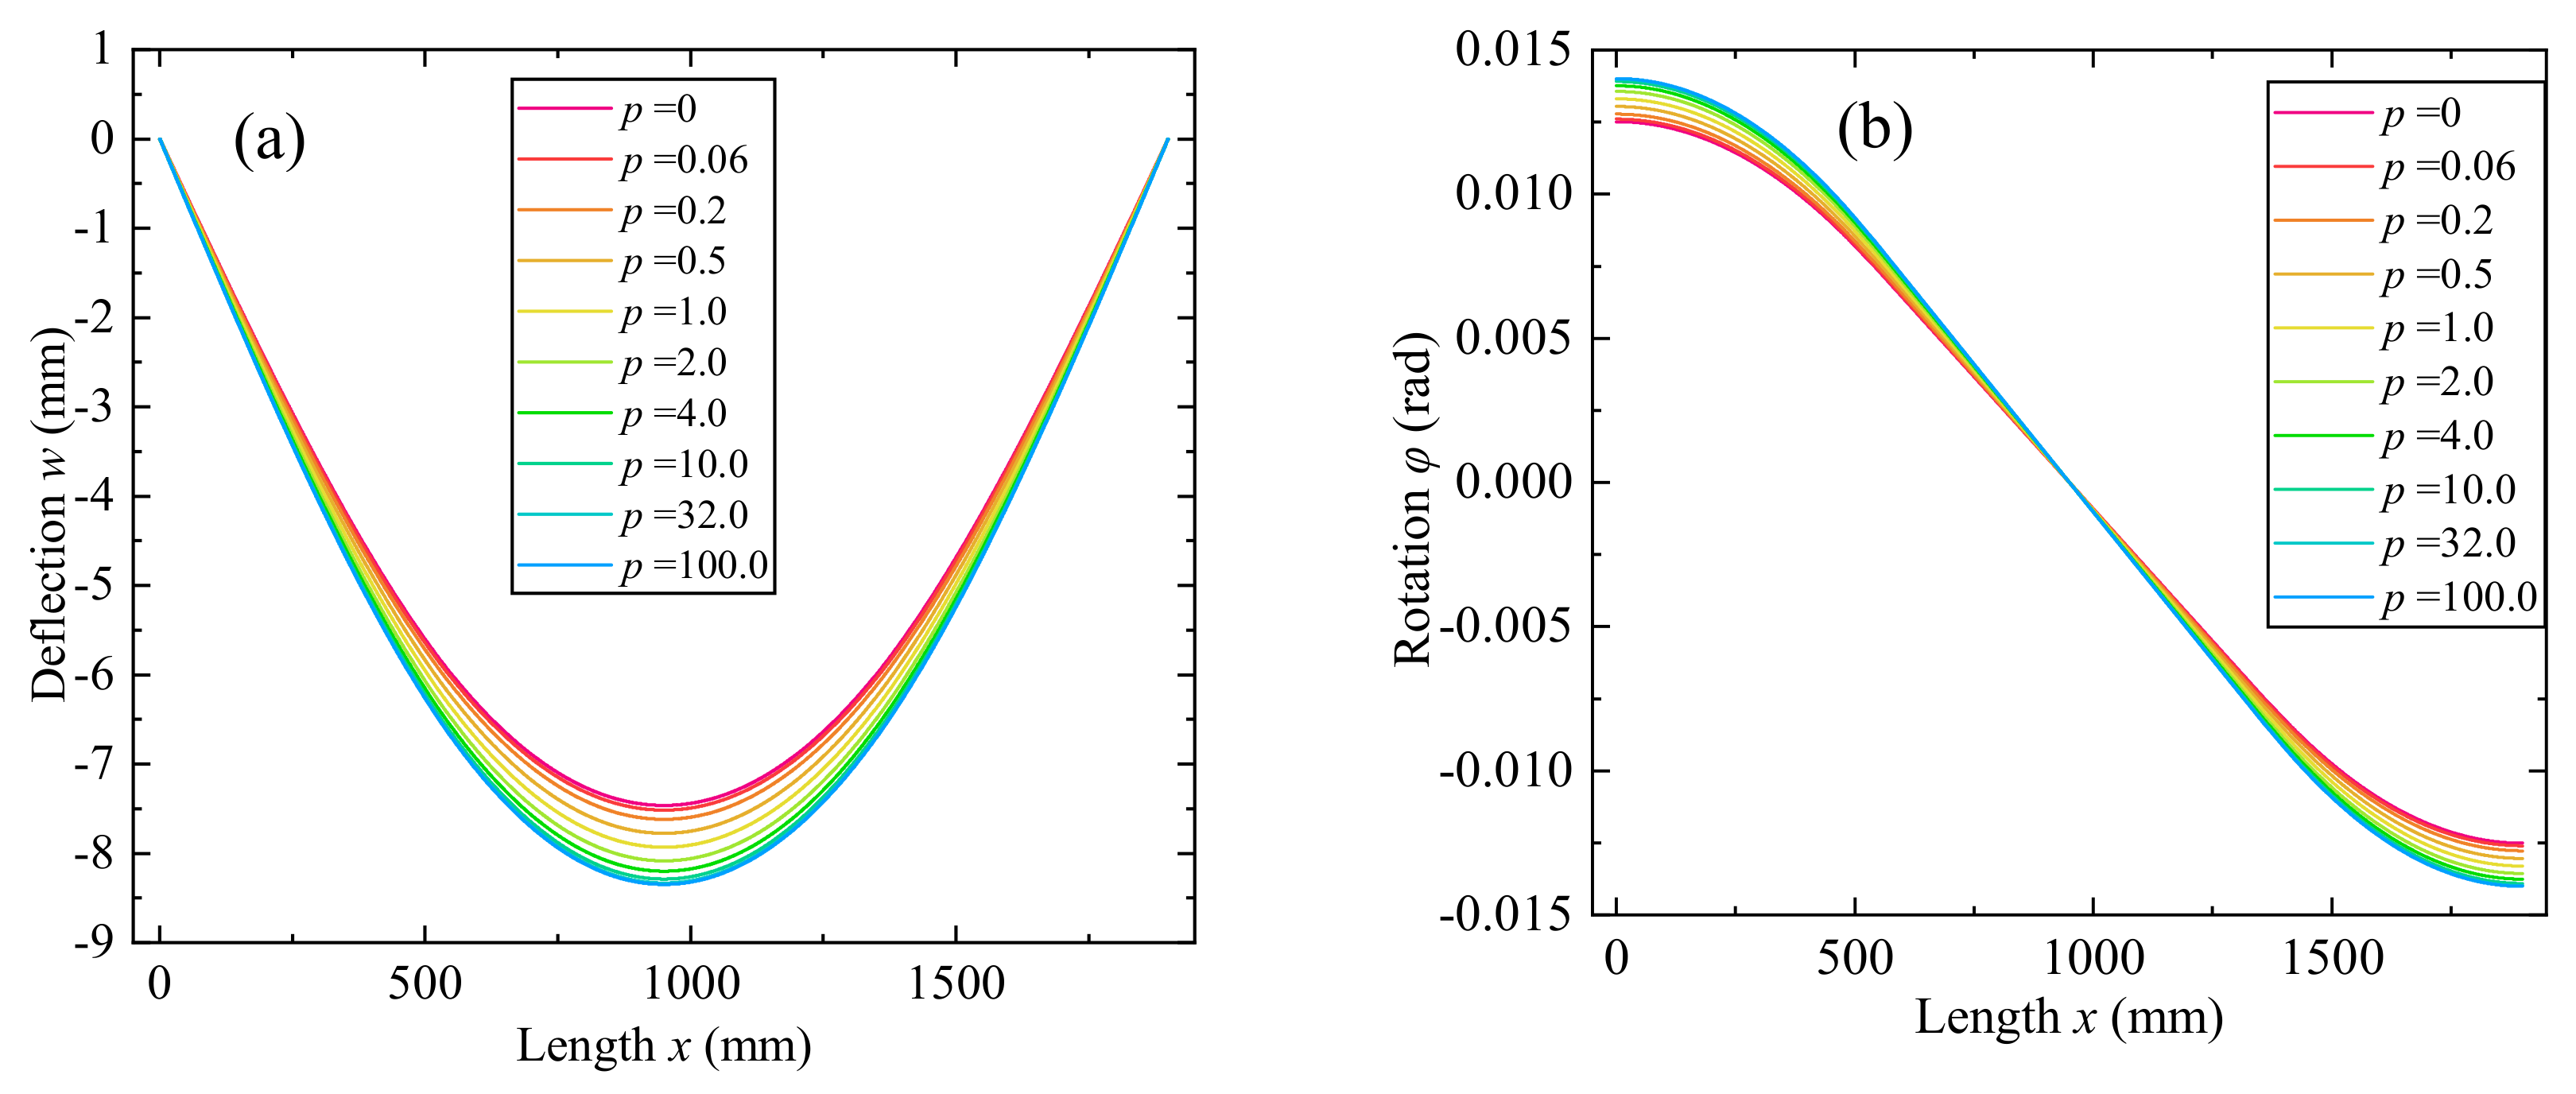
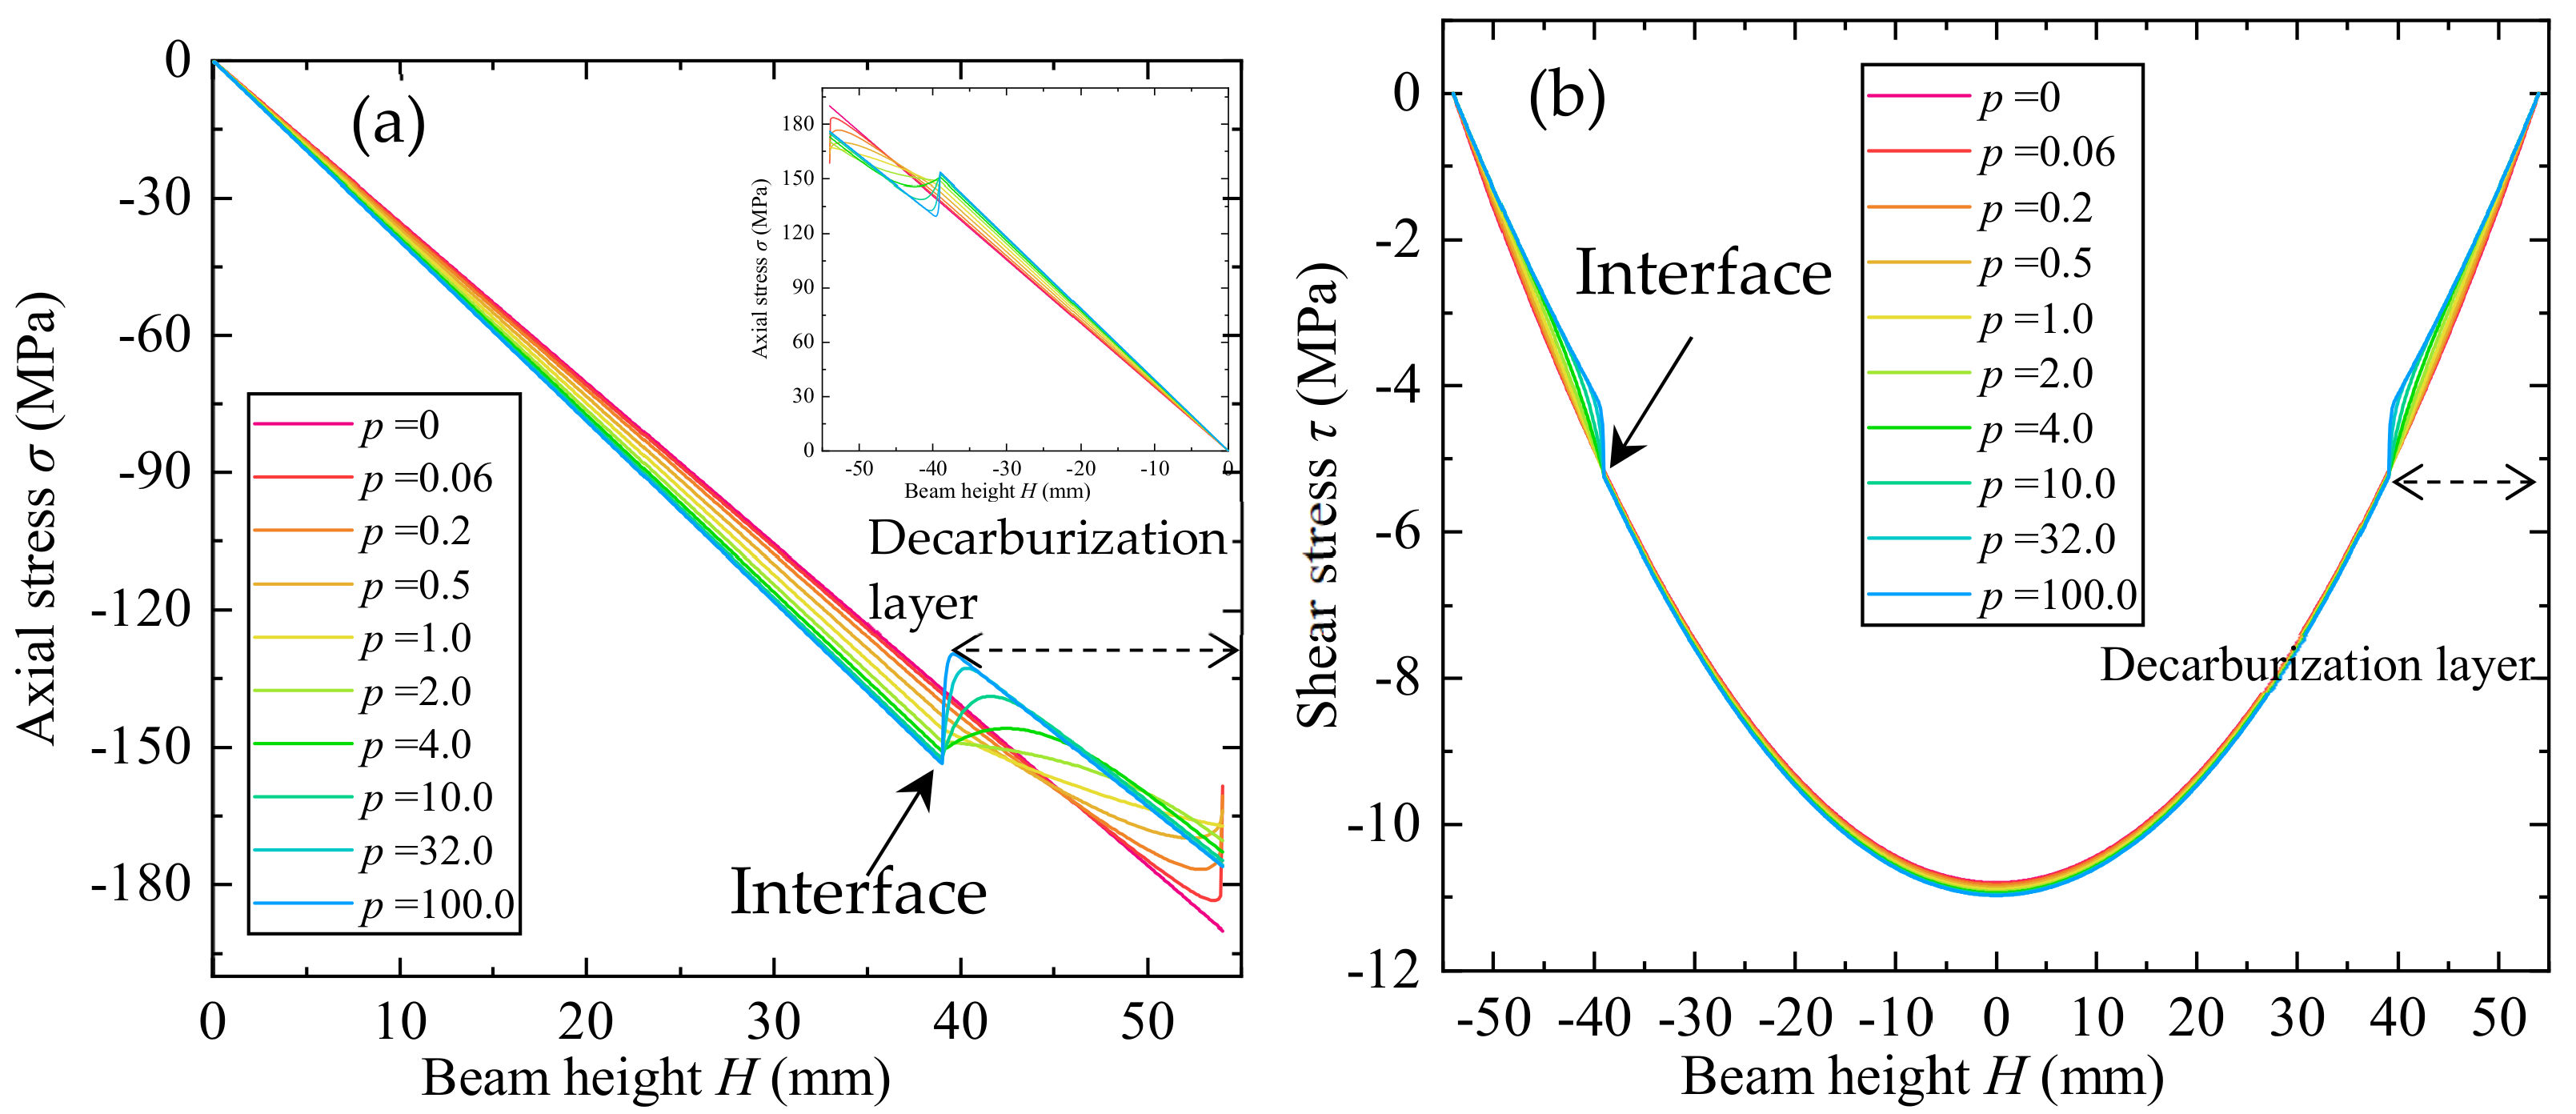
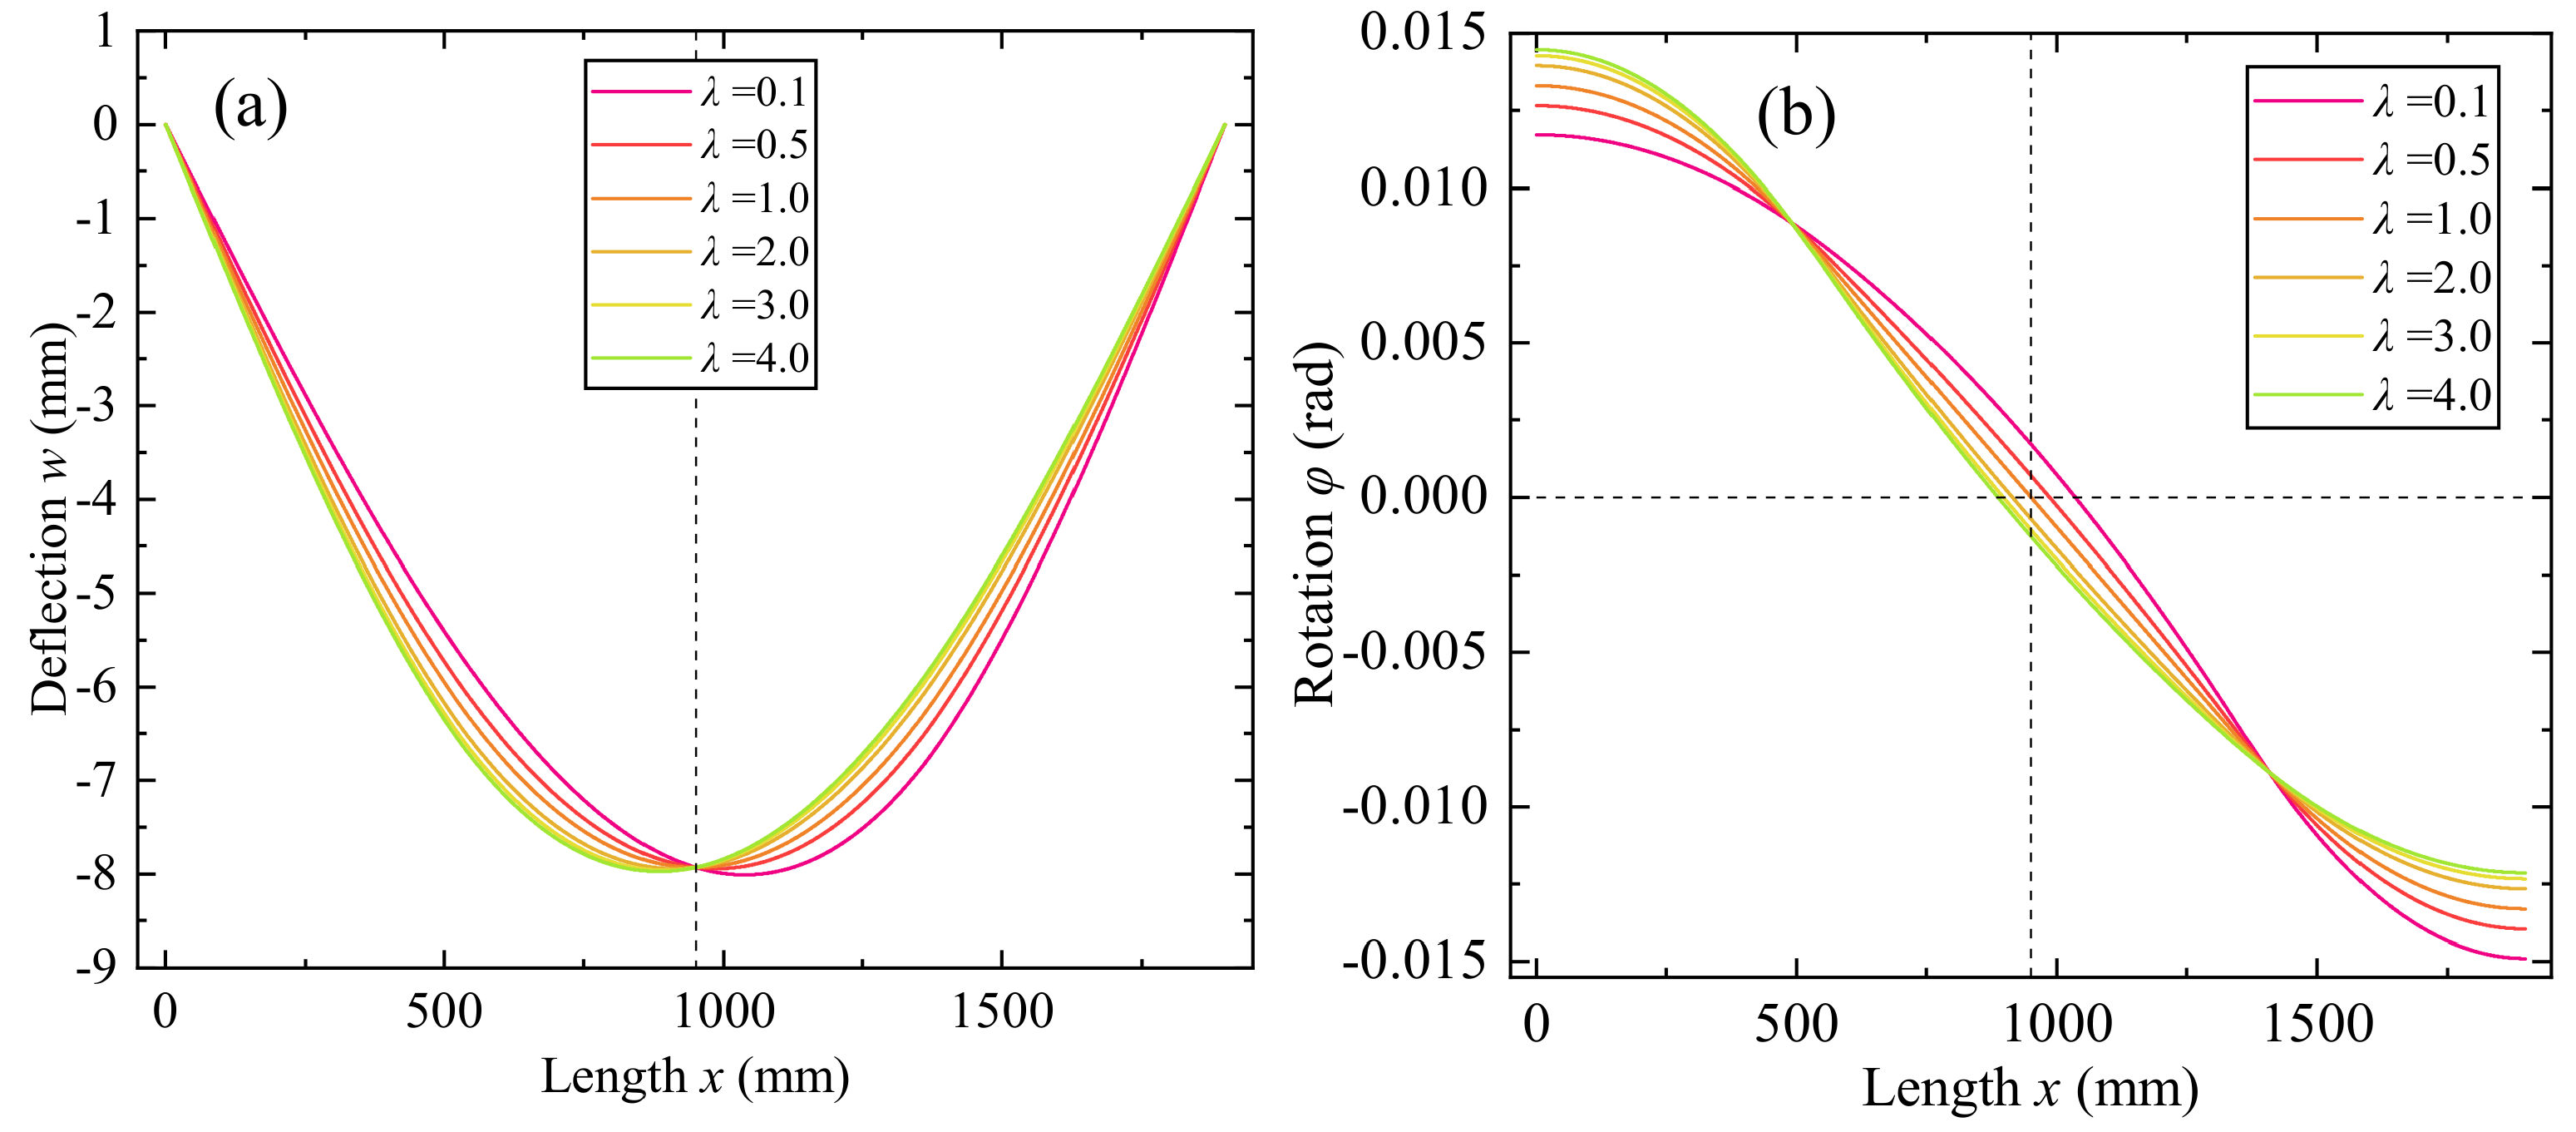
3.2. Effect of Power−Law Index of Graded Decarburization Layer

The effect of power−law index p of graded decarburization layer is firstly investigated, with the decarburization depth at both sides are equal and constant. Figure 8 shows variations of the beam deflection and rotation through the length, under simply supported boundary conditions. The axial displacement at middle surface is zeros, the maximum deflection is at the center point, and the maximum rotation is at two ends. When p = 0, V m z = 1 , z h / 2 , h 1 h 2 , h / 2 , the elasticity modulus of the decarburization layer is constant and utterly equal to the inner area without decarburization, and it can be regarded as homogeneous material, the deflection and rotation are the slightest; when p = 100.0, V m z 0 , z h / 2 , h 1 h 2 , h / 2 , the elasticity modulus is almost equal to the soft ferrite phases, and changes sharply at the interface, which is similar to the laminated beam, the deflection and rotation are the most significant, since the rigidity of the complete decarburization layer is the lowest; when p 0 , 100.0 , the rigidity is between the above two extreme cases, which results in that the deflection and rotation is also between the two cases. Figure 9 depicts the variation of maximum deflection and rotation with different power−law indexes. With the increasing p, the maximum deflection and rotation increase drastically and reach a quasi-steady state at p ≈ 10, because when p > 10 , the variation of the elasticity modulus and rigidity is not significant.
Variations of beam axial and shear stress through the length with different power−law index are shown in Figure 10. The axial stress at top half side of the beam is compressive and tensile at the bottom half side, and both stresses are symmetrical about the geometrical middle surface (z = 0), which coincides with the physical neutral surface, for the equal decarburization distribution at two sides. When p = 0, the axial stress increases linearly in terms of the beam height, for the homogeneous material properties. The value reaches the peak point at bottom and top surface, and equals zero at the middle surface (z = 0); the shear stress varies parabolically through the beam height, and reaches the maximum value at middle surface and equals zero at bottom and top surfaces. Since the shape function of shear deformation in the third order theory is expressed with a parabolic function [39] ψ z = z 1 4 z 2 / 3 h 2 . When p = 100.0, the axial and shear stress decrease dramatically for the reduced elasticity and discontinuous properties of decarburization layer and the inner area, which may result in the stress concentration and early fatigue failure of the component. When p 0 , 100.0 , the axial and shear stress change smoothly near the interface without the saltation. At the inner homogeneous area, the stresses increase with the power−law index. At the decarburization area, when p 0 , 1.0 , the elasticity modulus decreases rapidly near the surface, leading to the simultaneous reduction of axial stress; when p 1.0 , 100.0 , the elasticity modulus decreases rapidly near the inner interface, thus leading to the simultaneous reduction near the interface; at these occasions, the influence on the stress caused by the reduction of elasticity modulus is more significant than the increasing beam height. When p = 1.0, the variation at both inner interface and surface are smooth.
Distribution of axial and shear stress on longitudinal and cross section of the beam is illustrated in Figure 11. It is observed that the axial and shear stress are symmetrical about the middle surface for both sections. On the longitudinal-section (y = 0), the axial stress is zero at both ends and reaches the crest value at center point; the shear stress is nearly zero between x 1 and x 2 , and reaches the peak value at both ends, which is caused by the point−loads acting at position x 1 and x 2 . On the cross-section (x = 425 mm), the axial stress is zero at the middle surface, increases linearly with the beam height to the interface, and increases nonlinearly at the decarburization area, determined by the graded variation of material properties. The shear stress is zeros at both side surfaces and reaches the greatest at middle surface.

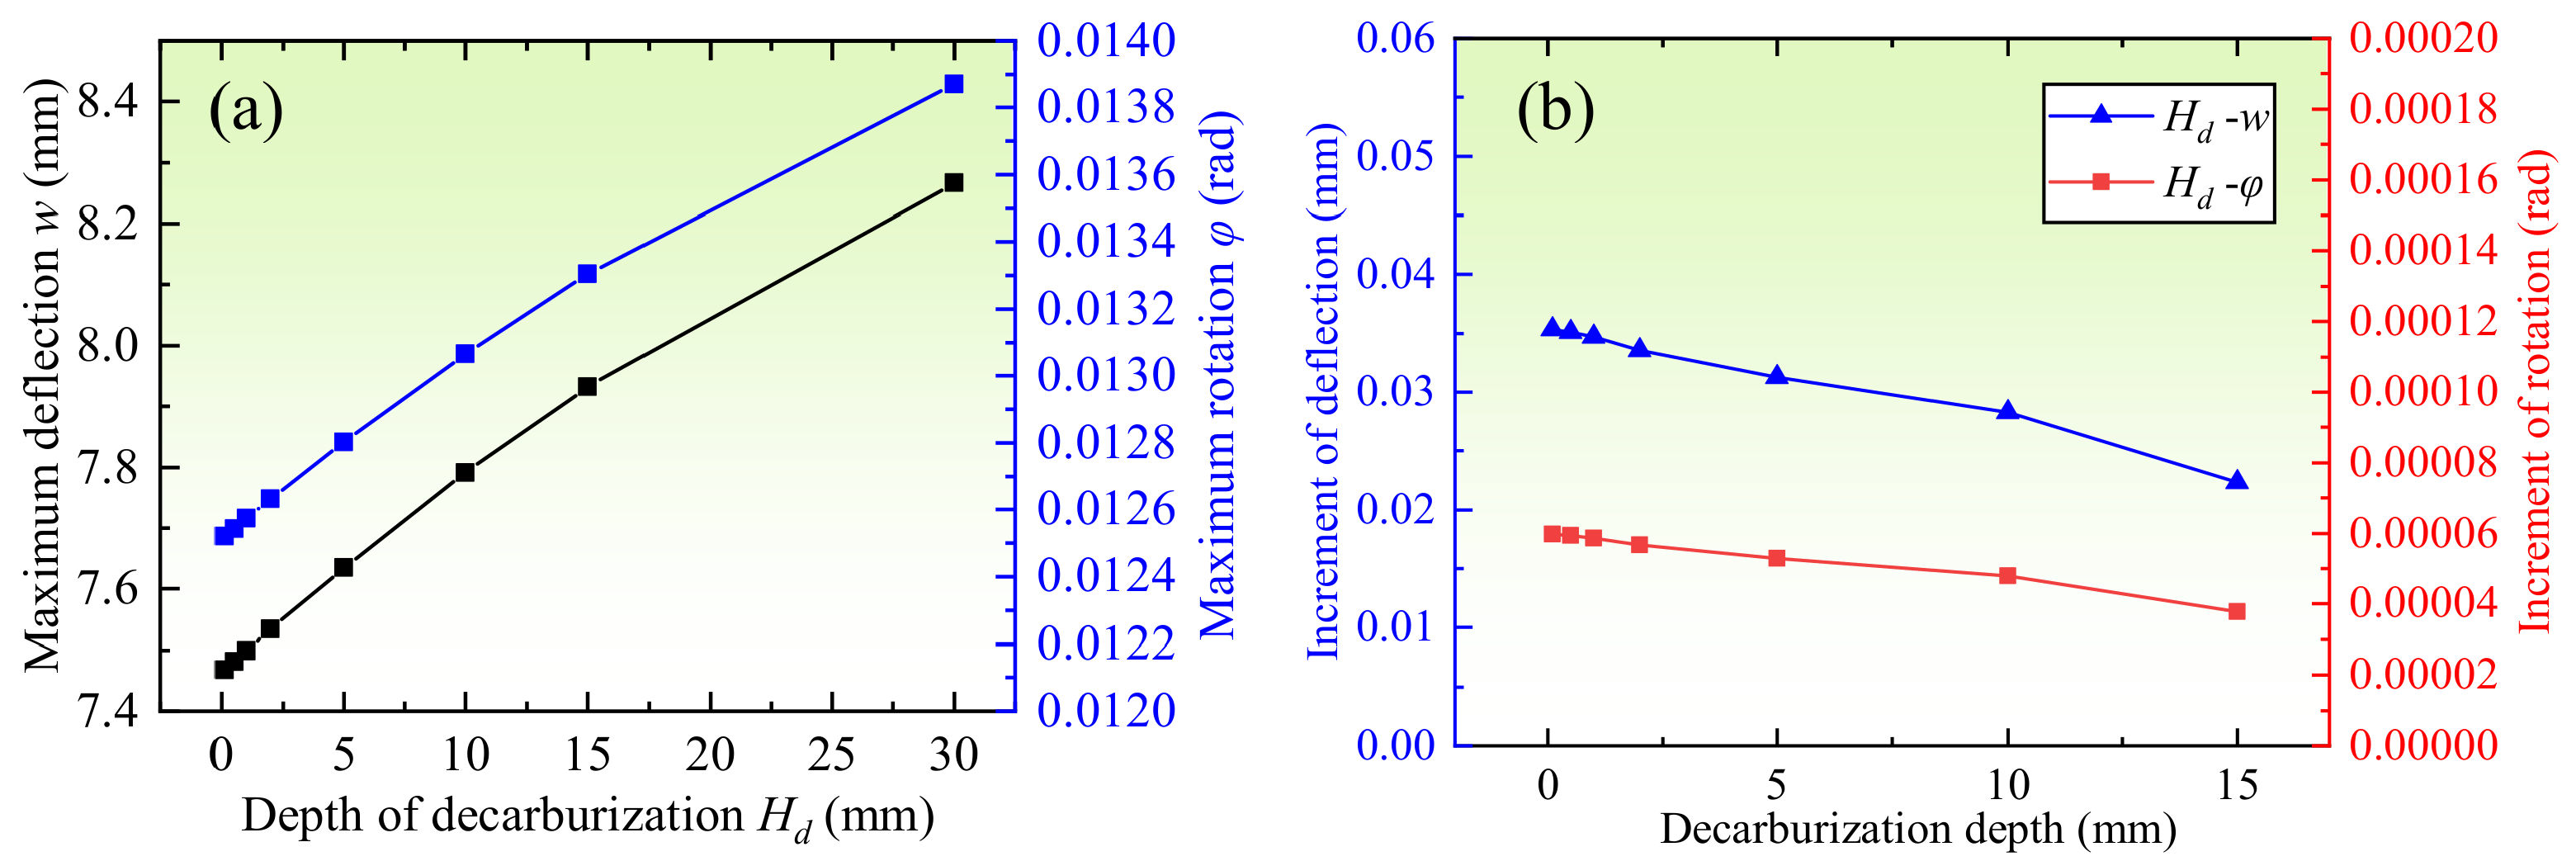
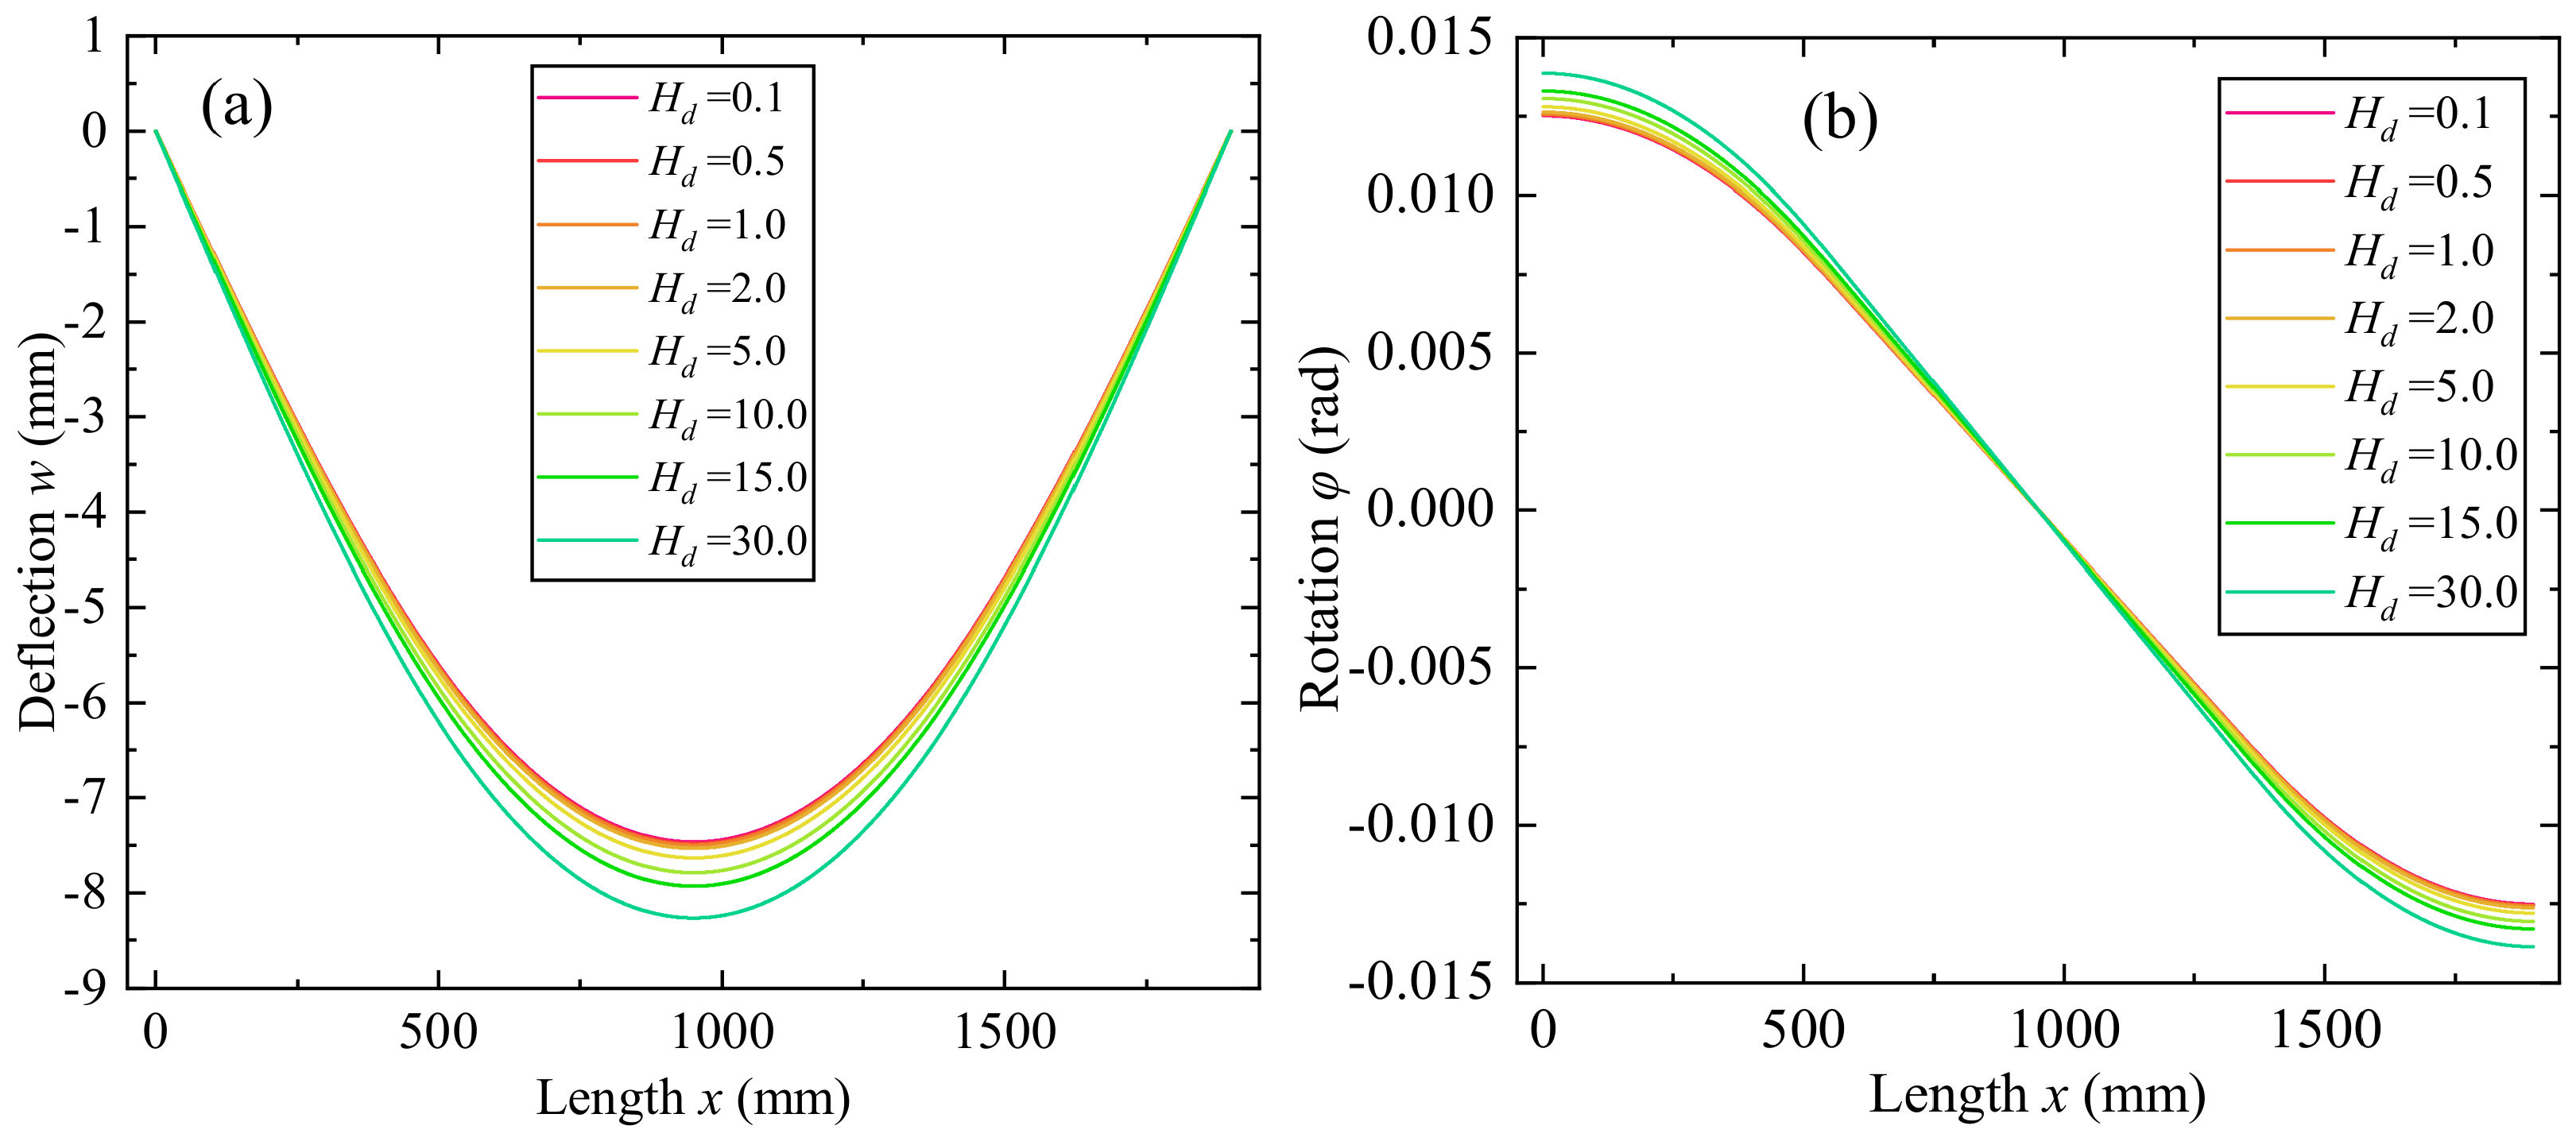
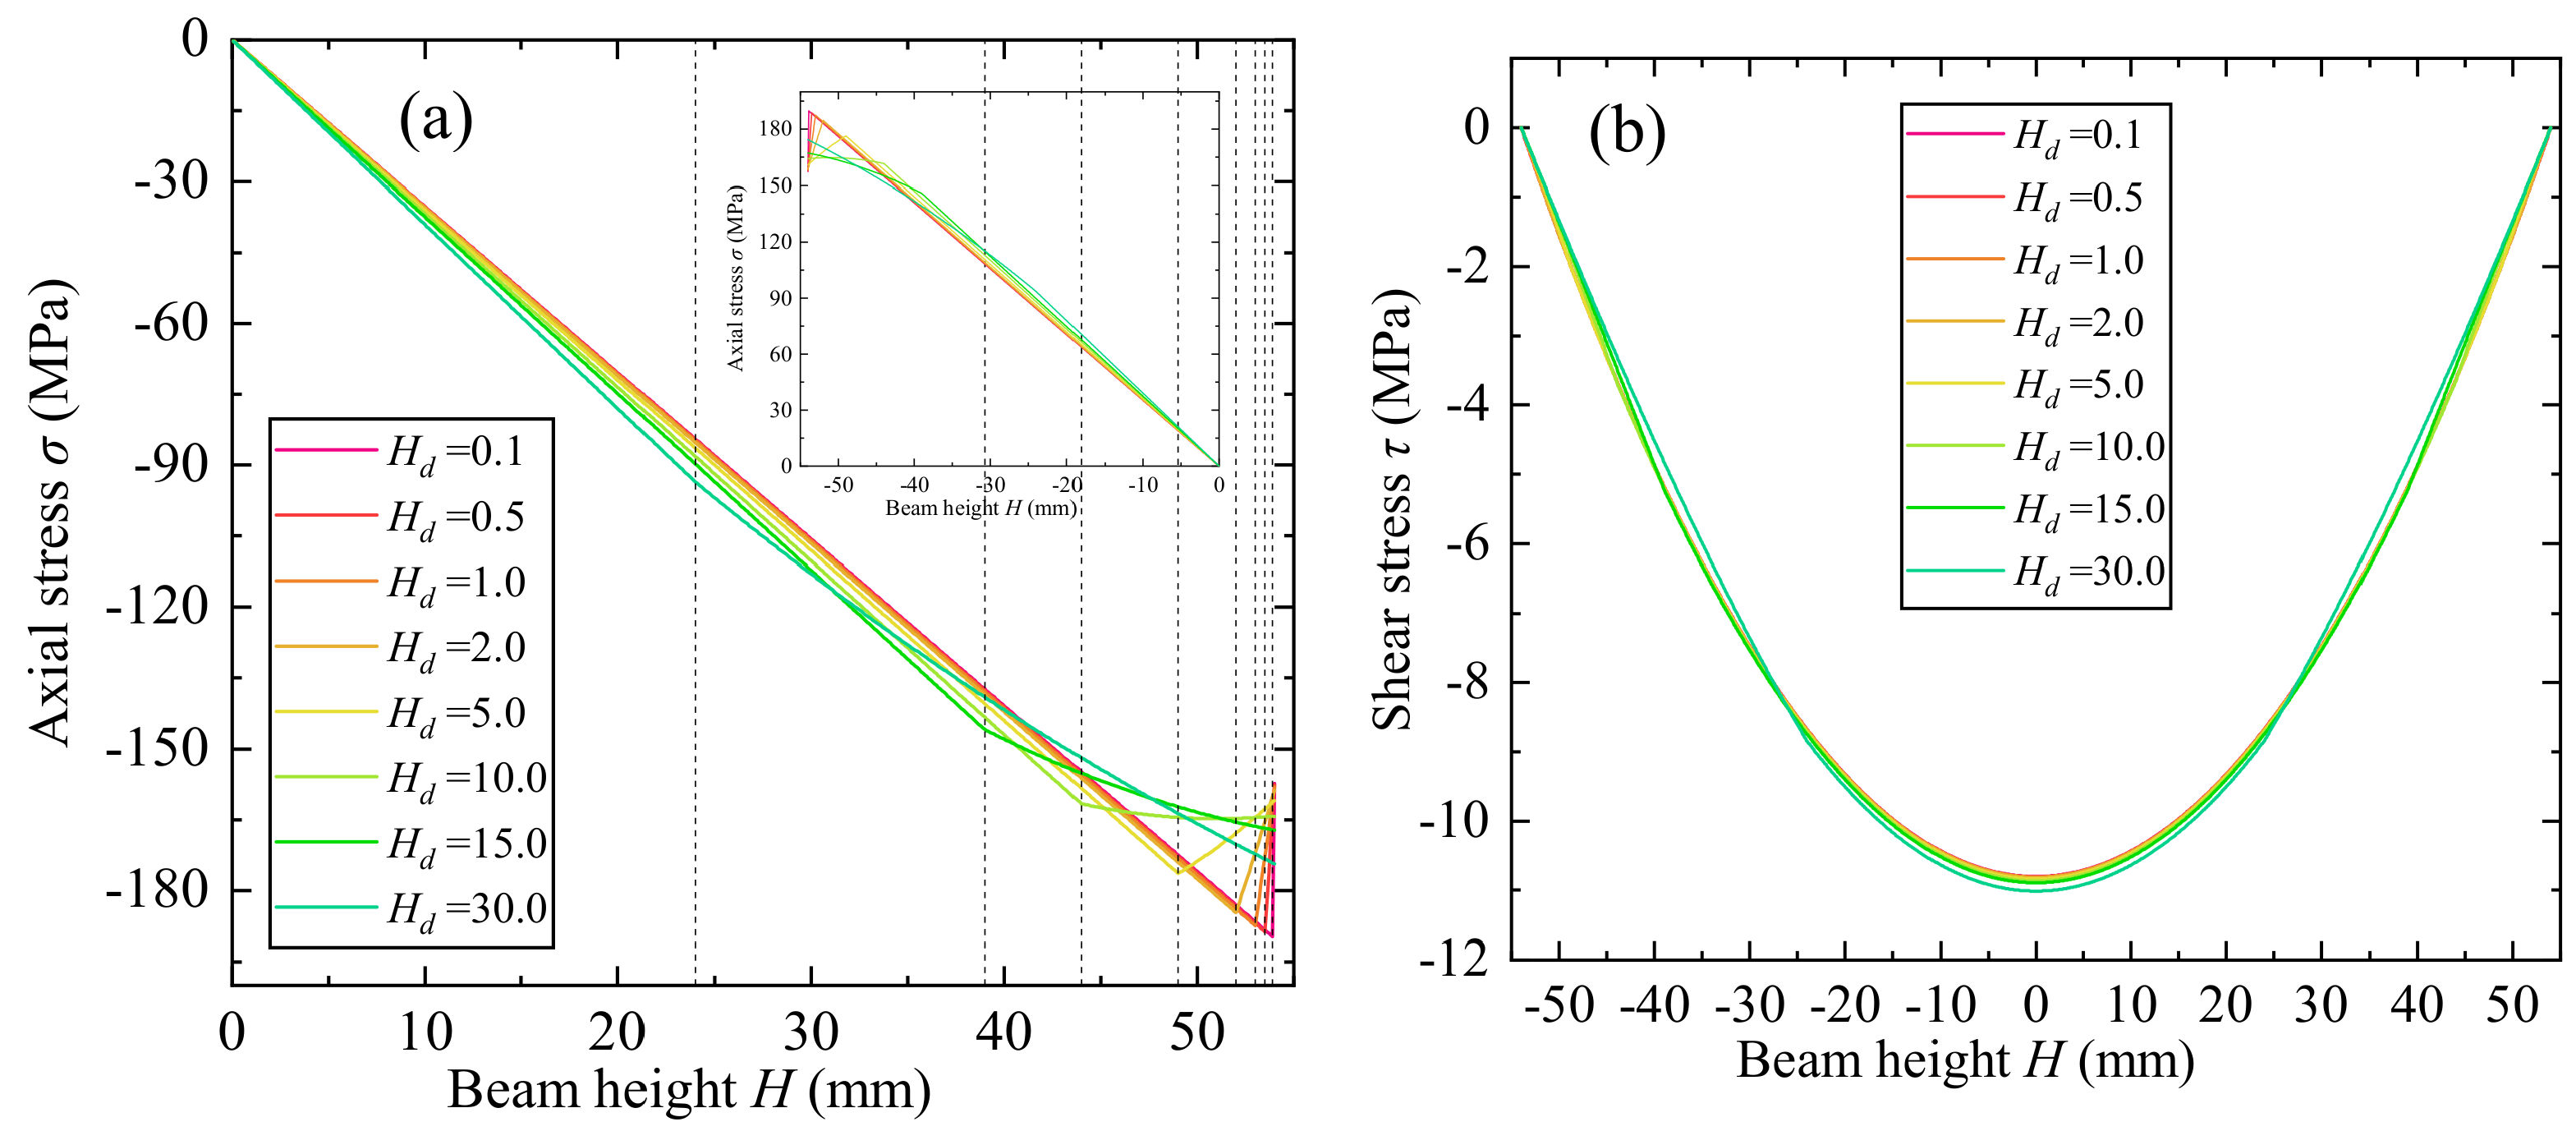
3.3. Effect of Depth of Graded Decarburization Layer

The effect of decarburization depth (Hd) near bottom and top surface on the bending behavior is then inspected. Figure 12 shows the variations of beam deflection and rotation through the length, and Figure 13 shows variation of the maximum deflection and rotation with different decarburization depth. The maximum deflection and rotation increase with the decarburization depth, since the elasticity modulus of the surface decarburization layer is lower than the inner area, and rigidity of the beam decreases with the decarburization depth. The increment of maximum deflection and rotation decreases with the decarburization depth, and when the depth is between 0~15 mm, the increment of deflection and rotation is between 0.02~0.035 mm, and 3.7 × 10⁻⁵~6.0 × 10⁻⁵ rad respectively, for every millimeter of increment for the decarburization depth.
Variations of beam axial and shear stress through the length with different decarburization depth for p = 1.0 is shown in Figure 14. When the depth H d < 5.0 mm, the axial stress increases with the beam height until the interface, and then decreases gradually. Because when the decarburization depth is small, the elasticity modulus decreases from the martensite phases to the ferrite phases drastically, leading to the rapid reduction of the axial stress, which is greater than the effect caused by the increasing beam height. When the depth H d > 5.0 mm, the increasing rate of axial stress at the decarburization area is nonlinear and smaller than the inner area. Because the material properties change slowly when the depth is considerable, and the reduction caused by elasticity modulus reduction is smaller than the increment caused by increasing beam height. For the shear stress, the value decreases with the depth at decarburization layer, and increases with the depth at middle non-decarburization area.

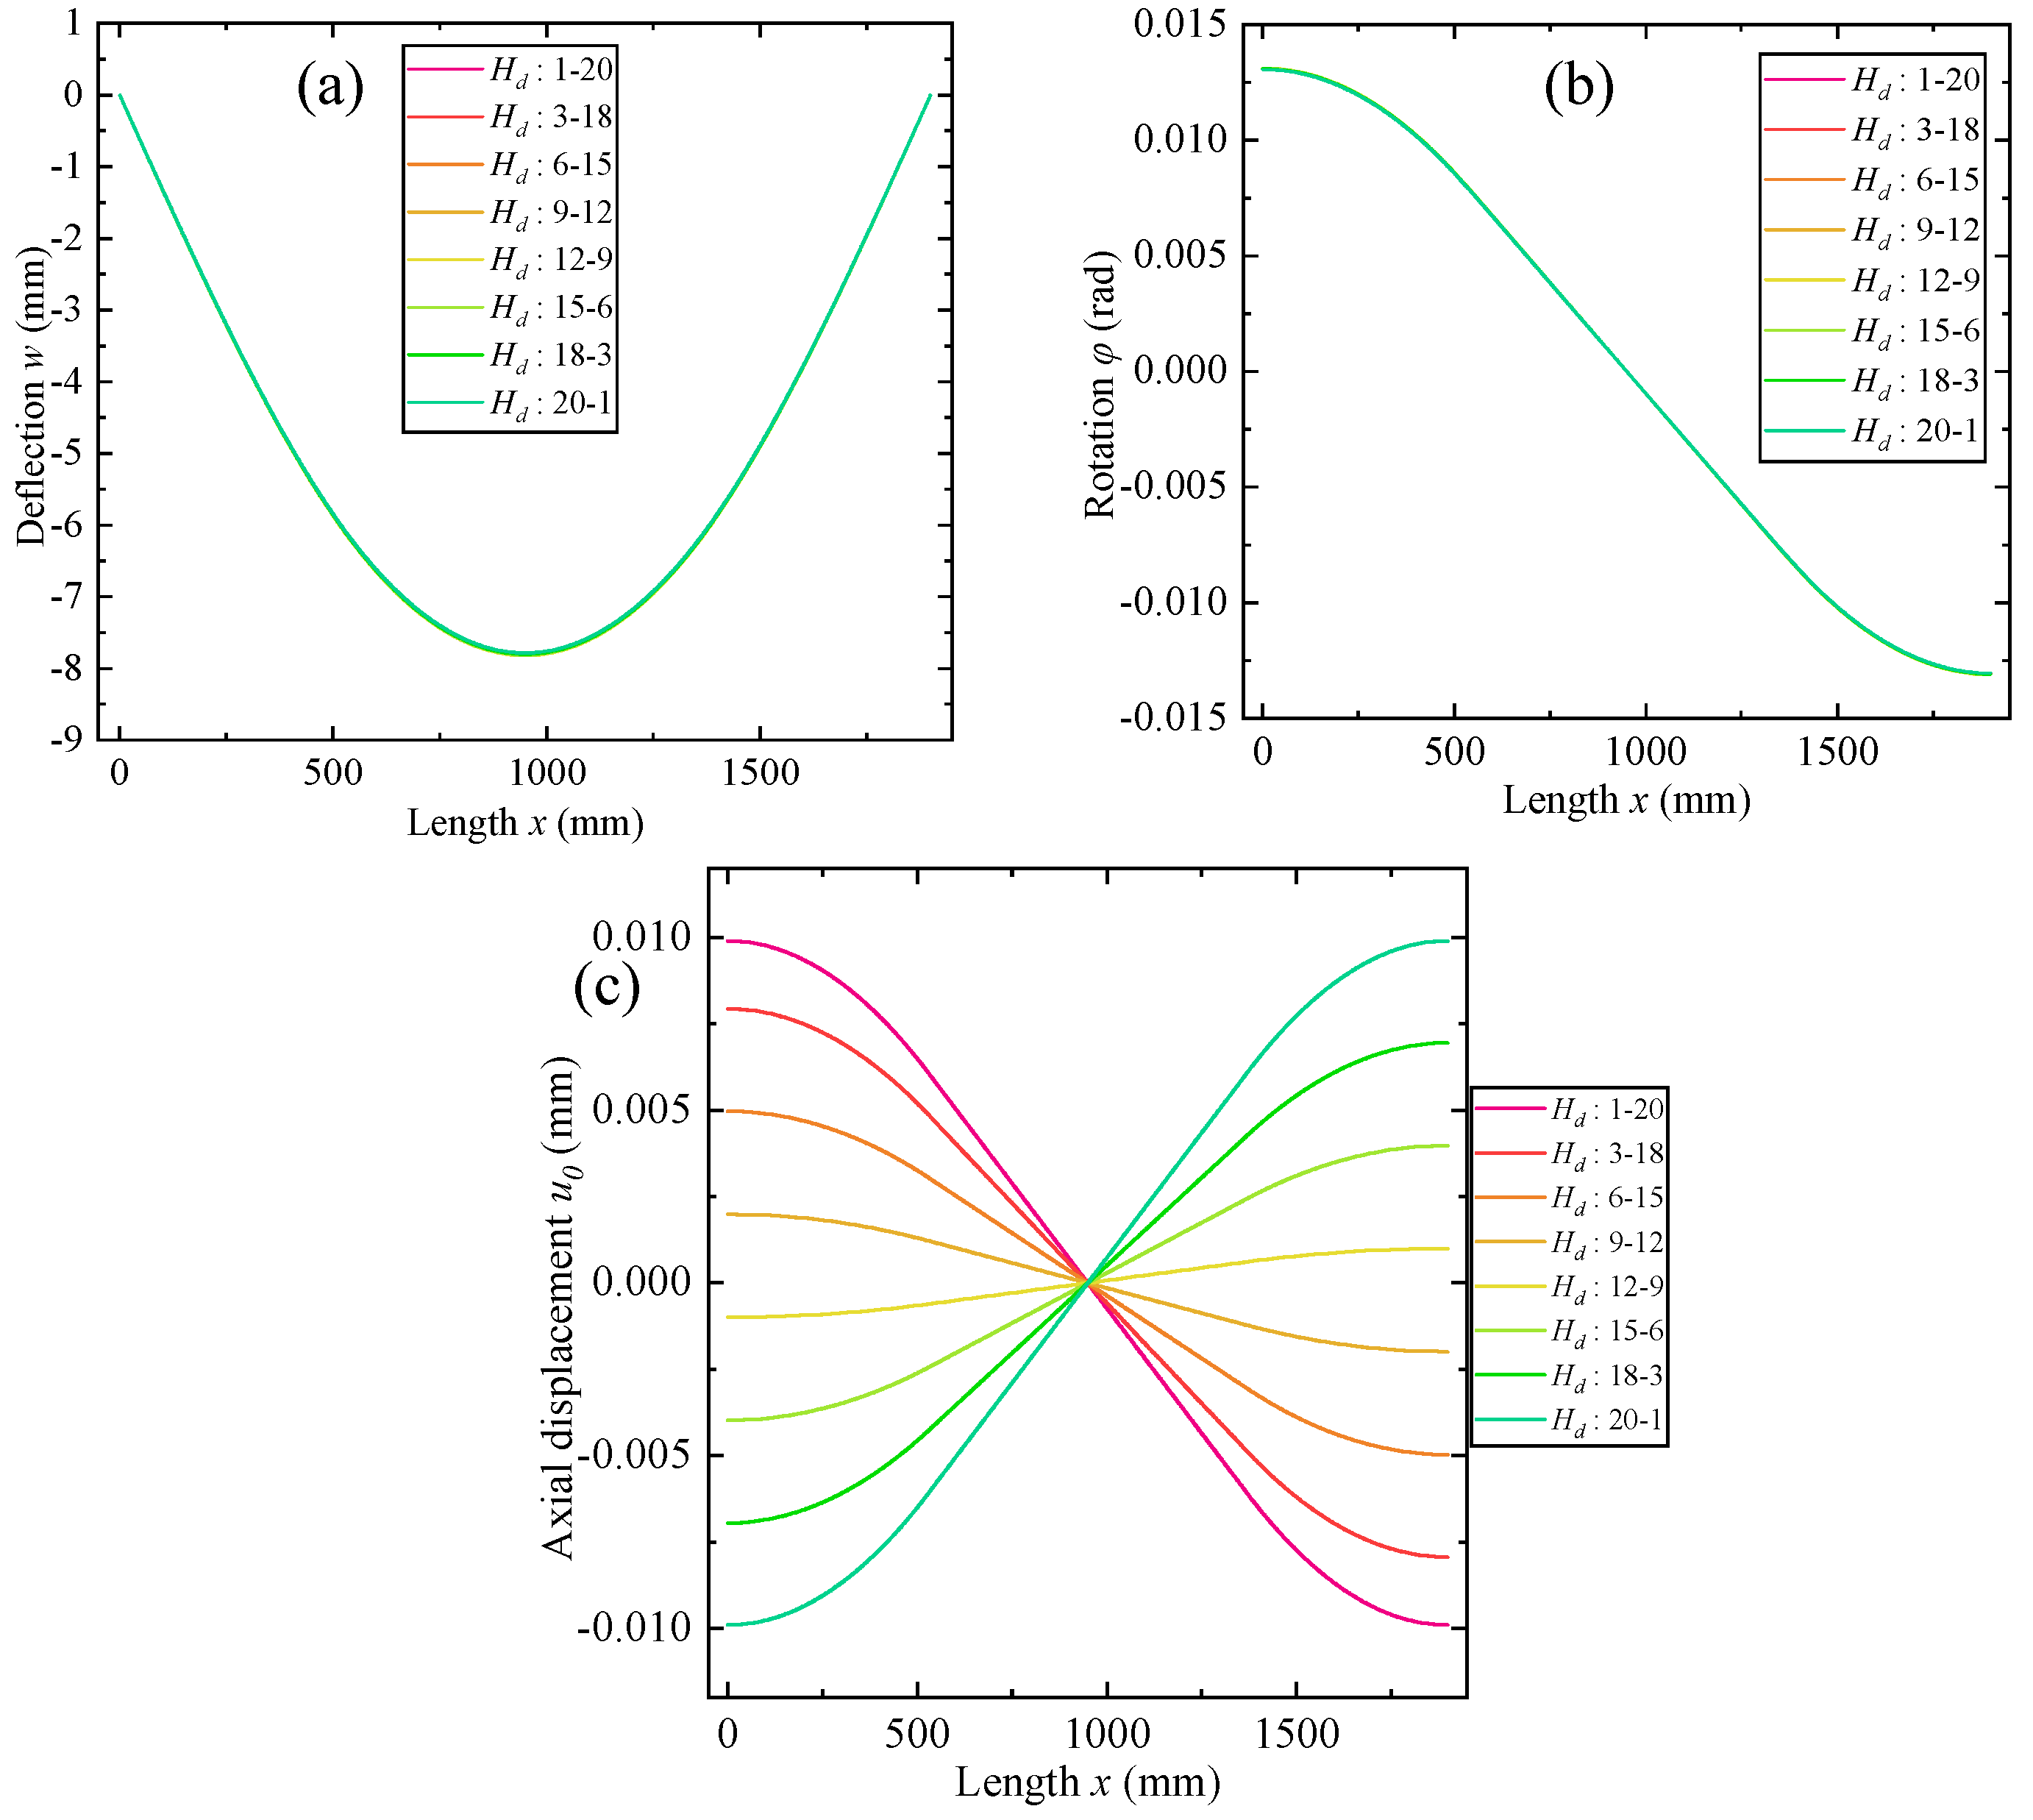
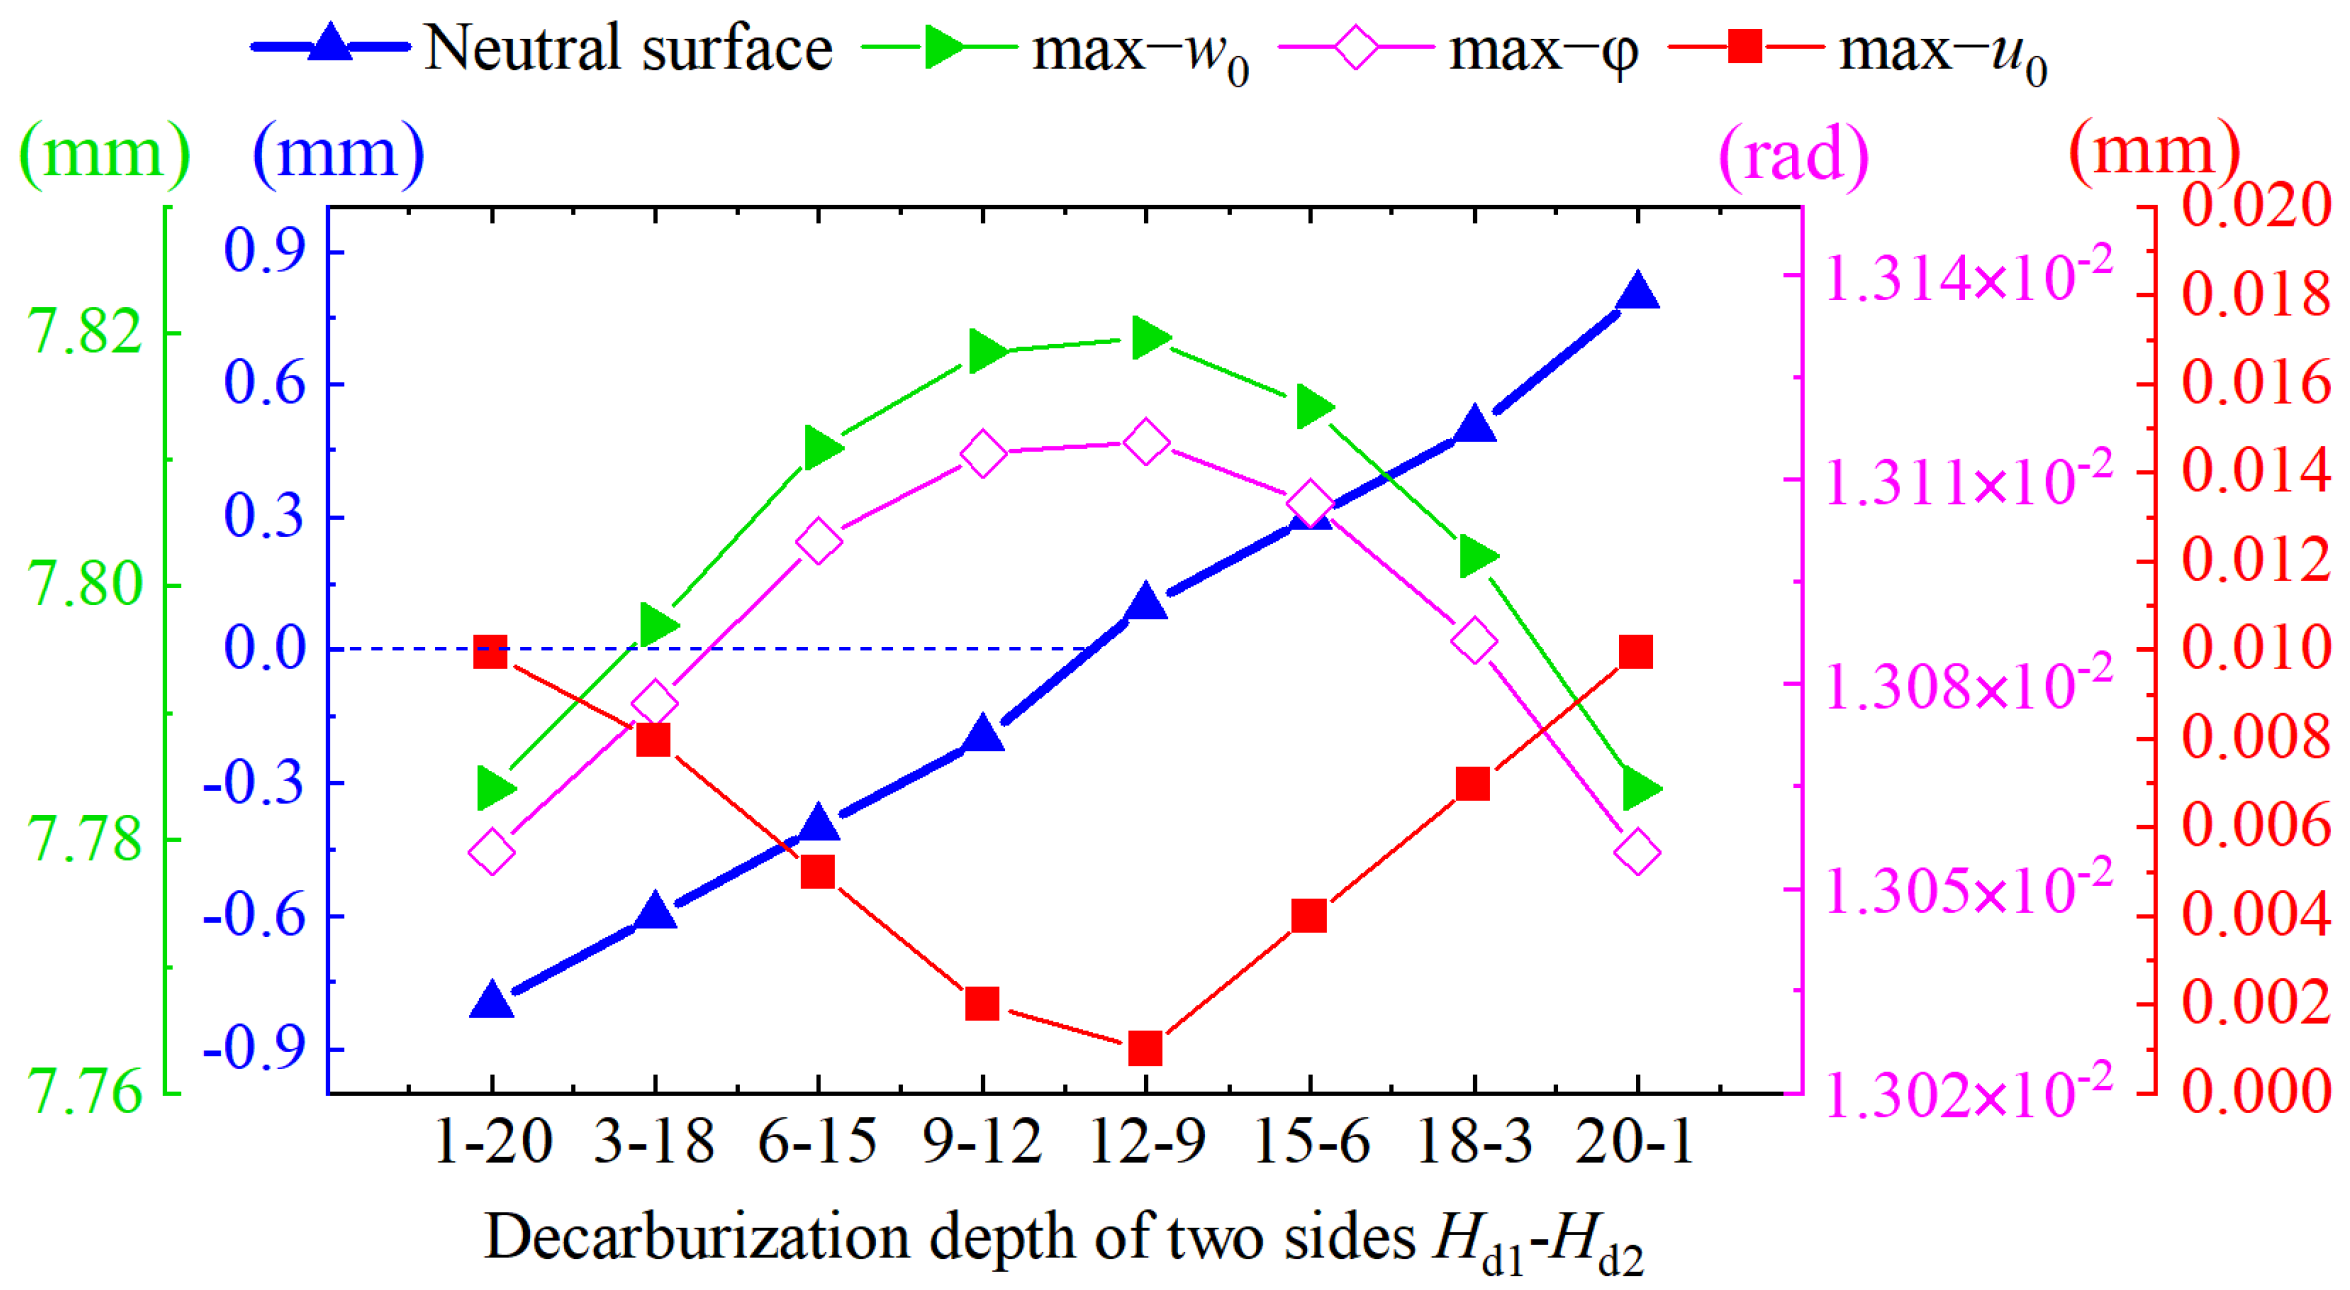
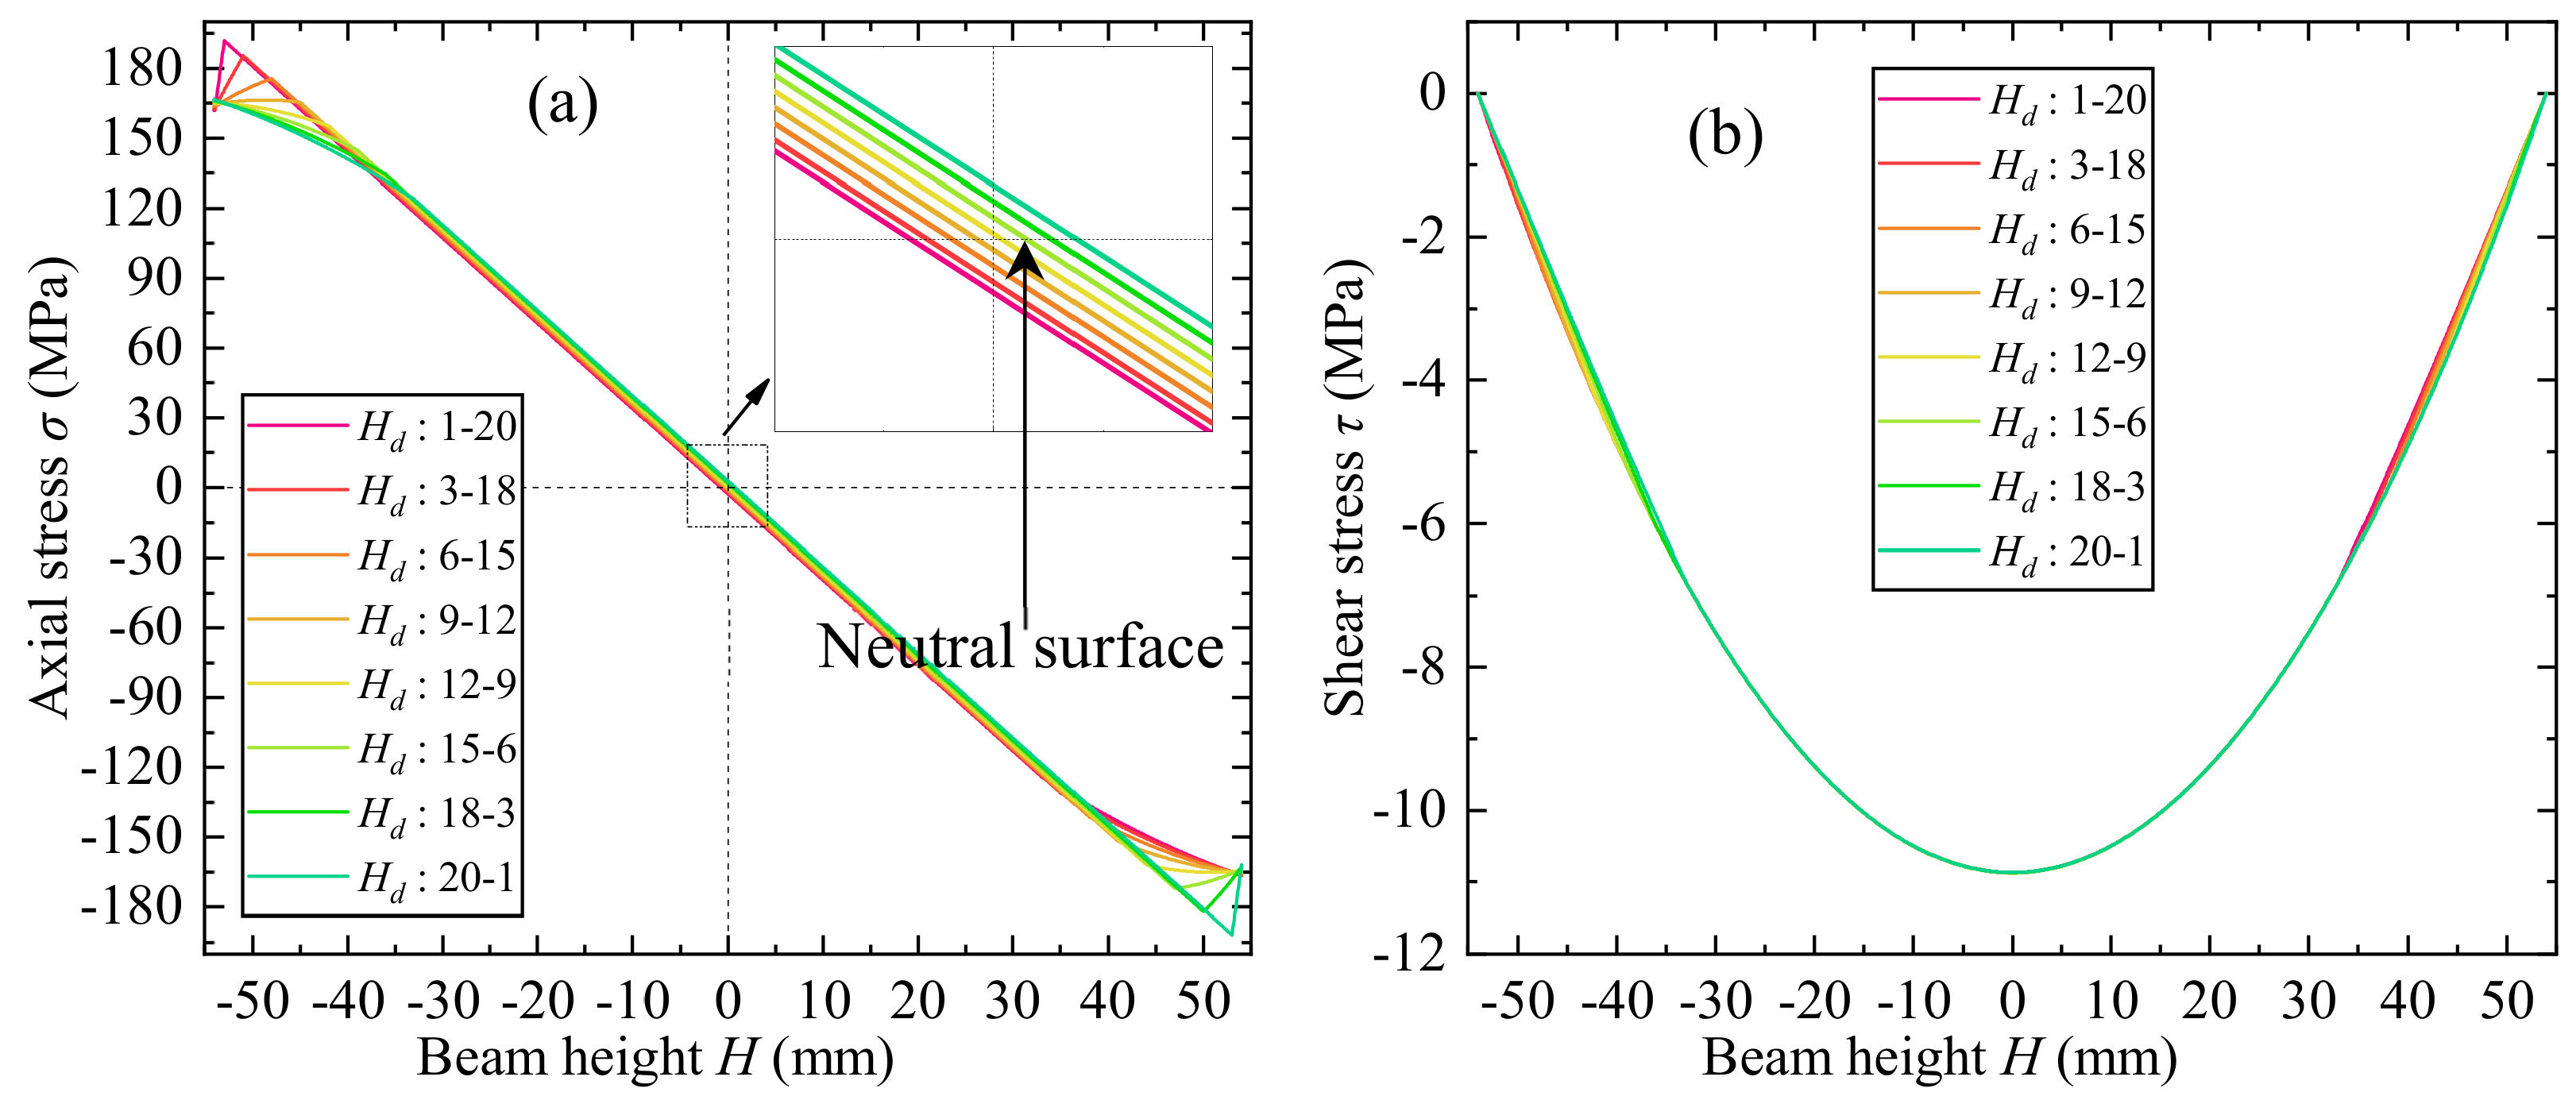
3.4. Effect of Unsymmetrical Decarburization Depth of Two Sides

Sometimes, the decarburization depth of bottom and top side is different, and thus the material properties are unsymmetrical about the geometrical middle surface. The effect of unsymmetrical decarburization is investigated through the different depths at two sides, as is listed in Table 4. The sum of decarburization at two sides is maintained constant at 21.0 mm, and the power−law index p = 1.0.
Variations of beam deflection, rotation, and axial displacement through the length with different decarburization depths are shown in Figure 15. It is observed that the deflection and rotation with different decarburization distribution are similar with a low deviation, because the total decarburization depth is constant under the same loads. The axial displacement is no longer zeros and the maximum value is located at two ends of the beam, but the displacement is distinct with different depth configurations. With the increasing depth at bottom side, and the decreasing depth at top side, displacement at left end of the beam reduces from positive value to negative value, and when the depth at two sides is similar, and axial displacement is approximate to zero, which is consistent with the occasions mentioned above with symmetrical cross-sections. The schematic diagram of axial displacement near the middle surface is illustrated in Figure 16. For group 1 to 4, the decarburization depth at bottom side is less than the top side, and thus the rigidity of bottom side is higher than the top side. Therefore, the position of physical neutral surface and axis where the axial displacement and stress exactly equals zero, migrates to the position below the geometrical middle surface. The material below the physical neutral surface is stretched, and that above the neutral surface is compressed. Therefore, for groups 1 to 4, the geometrical middle surface is above the physical neutral surface, so the axial displacement u0 at left end of middle surface is positive, and that at the right end is negative. For groups 5 to 8, the variation is on the contrary.
Variation of physical neutral surface, maximum deflection, rotation, and axial displacement through different distribution of unsymmetrical decarburization depth are shown in Figure 17. Migrating distance of neutral surface increases with the difference of decarburization depth at bottom and top sides. The maximum deflection and rotation increase with the decreasing migrating distance of neutral surface slightly, while the variation of maximum axial displacement is on the contrary.
Variations of beam axial stress and shear stress through the length with different unsymmetrical decarburization depth are shown in Figure 18. With the unsymmetrical decarburization depth at two sides, the axial stress is no longer symmetrical about the middle surface. The axial stress increases nonlinearly at the decarburization layer, determined by the depth and power−law index; at the inner non-decarburization area, the axial stress increases linearly. When the depth is small, the axial stress increase and then decrease near the interface, caused by the rapid reduction of elasticity modulus, as is discussed above. For shear stress, the distribution at the inner area is similar, and different at the decarburization area of two sides. At bottom side, the shear stress decreases with the increasing decarburization depth, and at top side, the shear stress increases with the decreasing decarburization depth.

3.5. Effect of Unbalancing Loading

During automobile running, the loadings on front axle at two points x1 and x2 are occasionally unbalancing. The unbalancing is expressed with Equation (30):
F 1 + F 2 = 140000 F 1 / F 2 = λ F 1 = 140000 λ 1 + λ           F 2 = 140000 1 + λ
where λ is the unbalance rate, the sum of F1 and F2 is constant, and the decarburization depth and power−law index are also constant.
Figure 19 reveals the variations of beam deflection, and rotation through the length with different unbalance rates. It is observed that the transverse deflection and rotation are no longer symmetrical about middle axis of the beam (x = L/2). When λ < 1.0 , F 1 < F 2 , the position of maximum deflection migrates to right side of the middle axis; when λ > 1.0 , F 1 > F 2 , the position of maximum deflection migrates to left side, and the migrating distance and maximum deflection increase with the unbalance rate λ. Similarly, rotation at the side with heavier loading is larger than the other side, and the migrating distance increases with the unbalance rate.

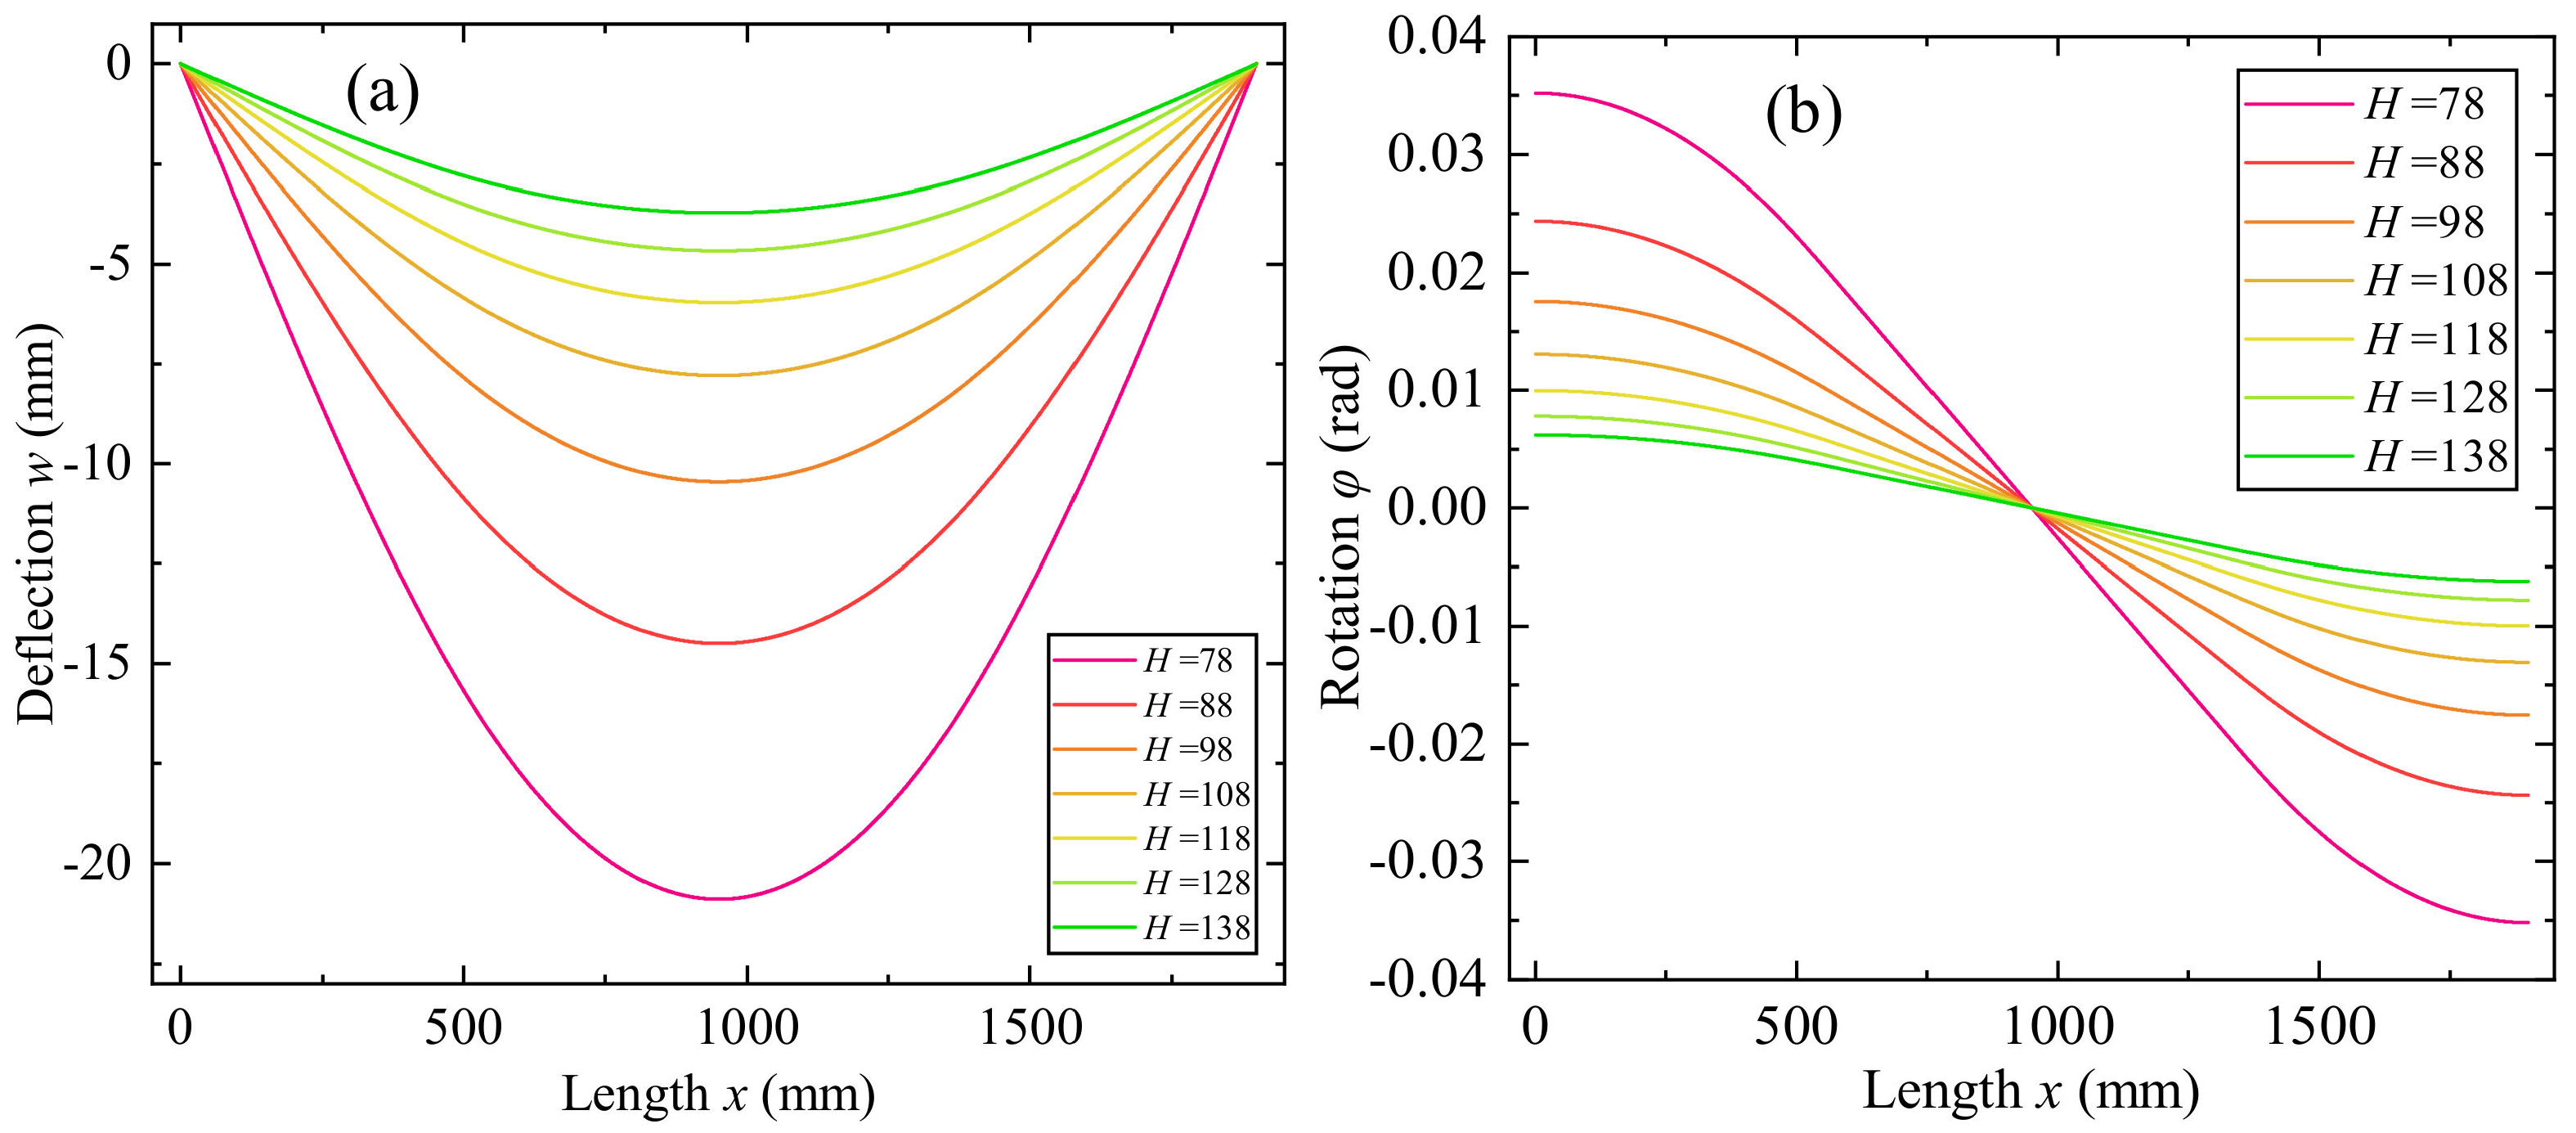
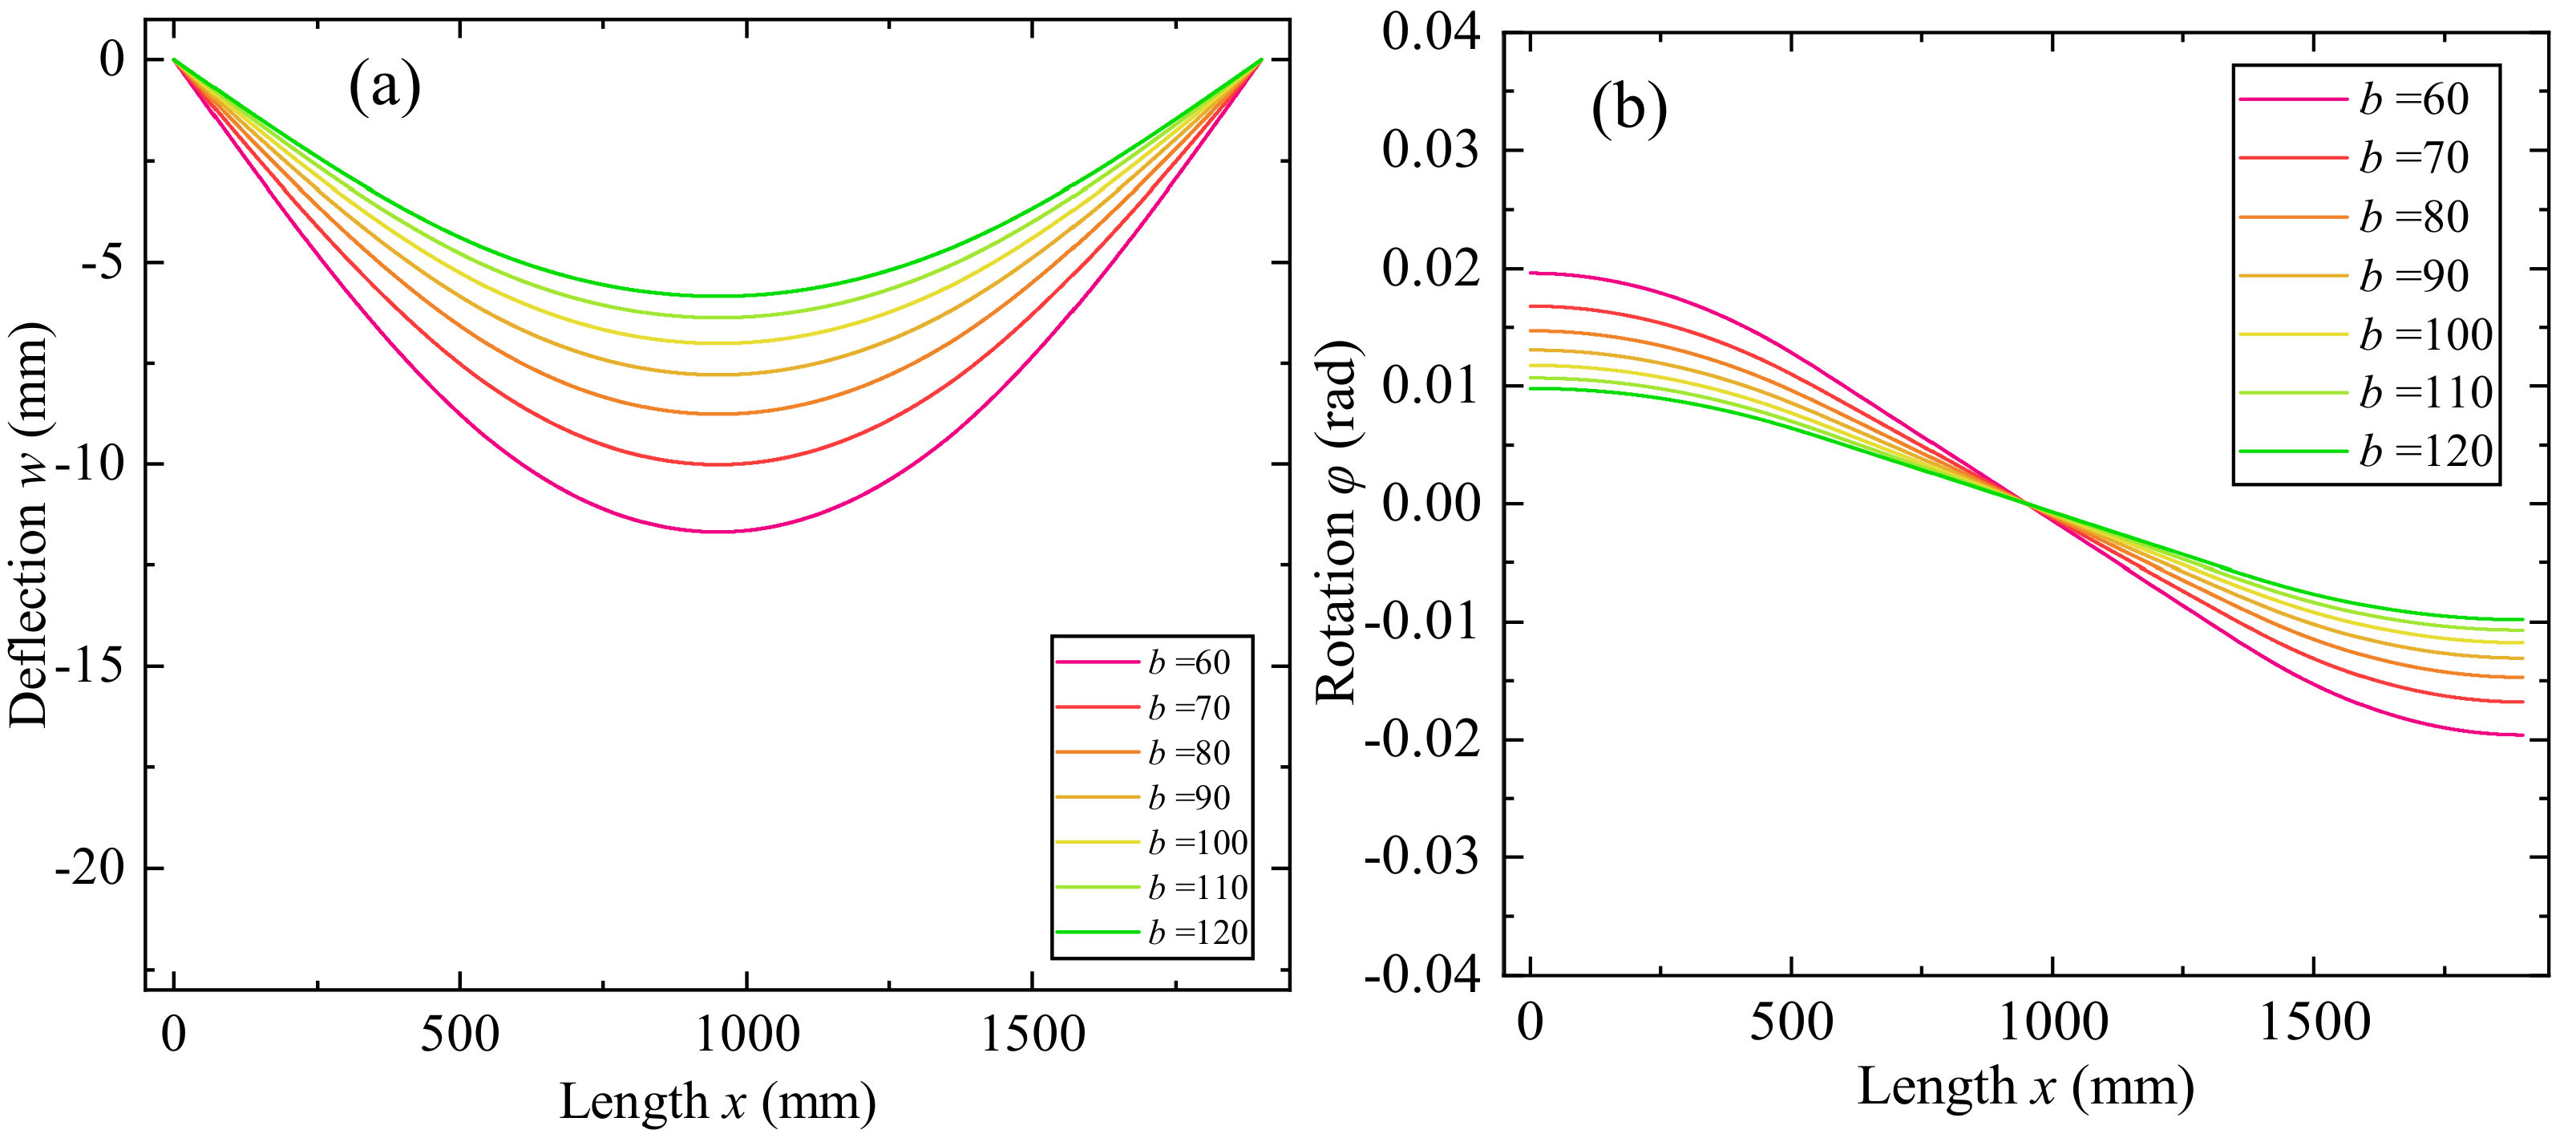
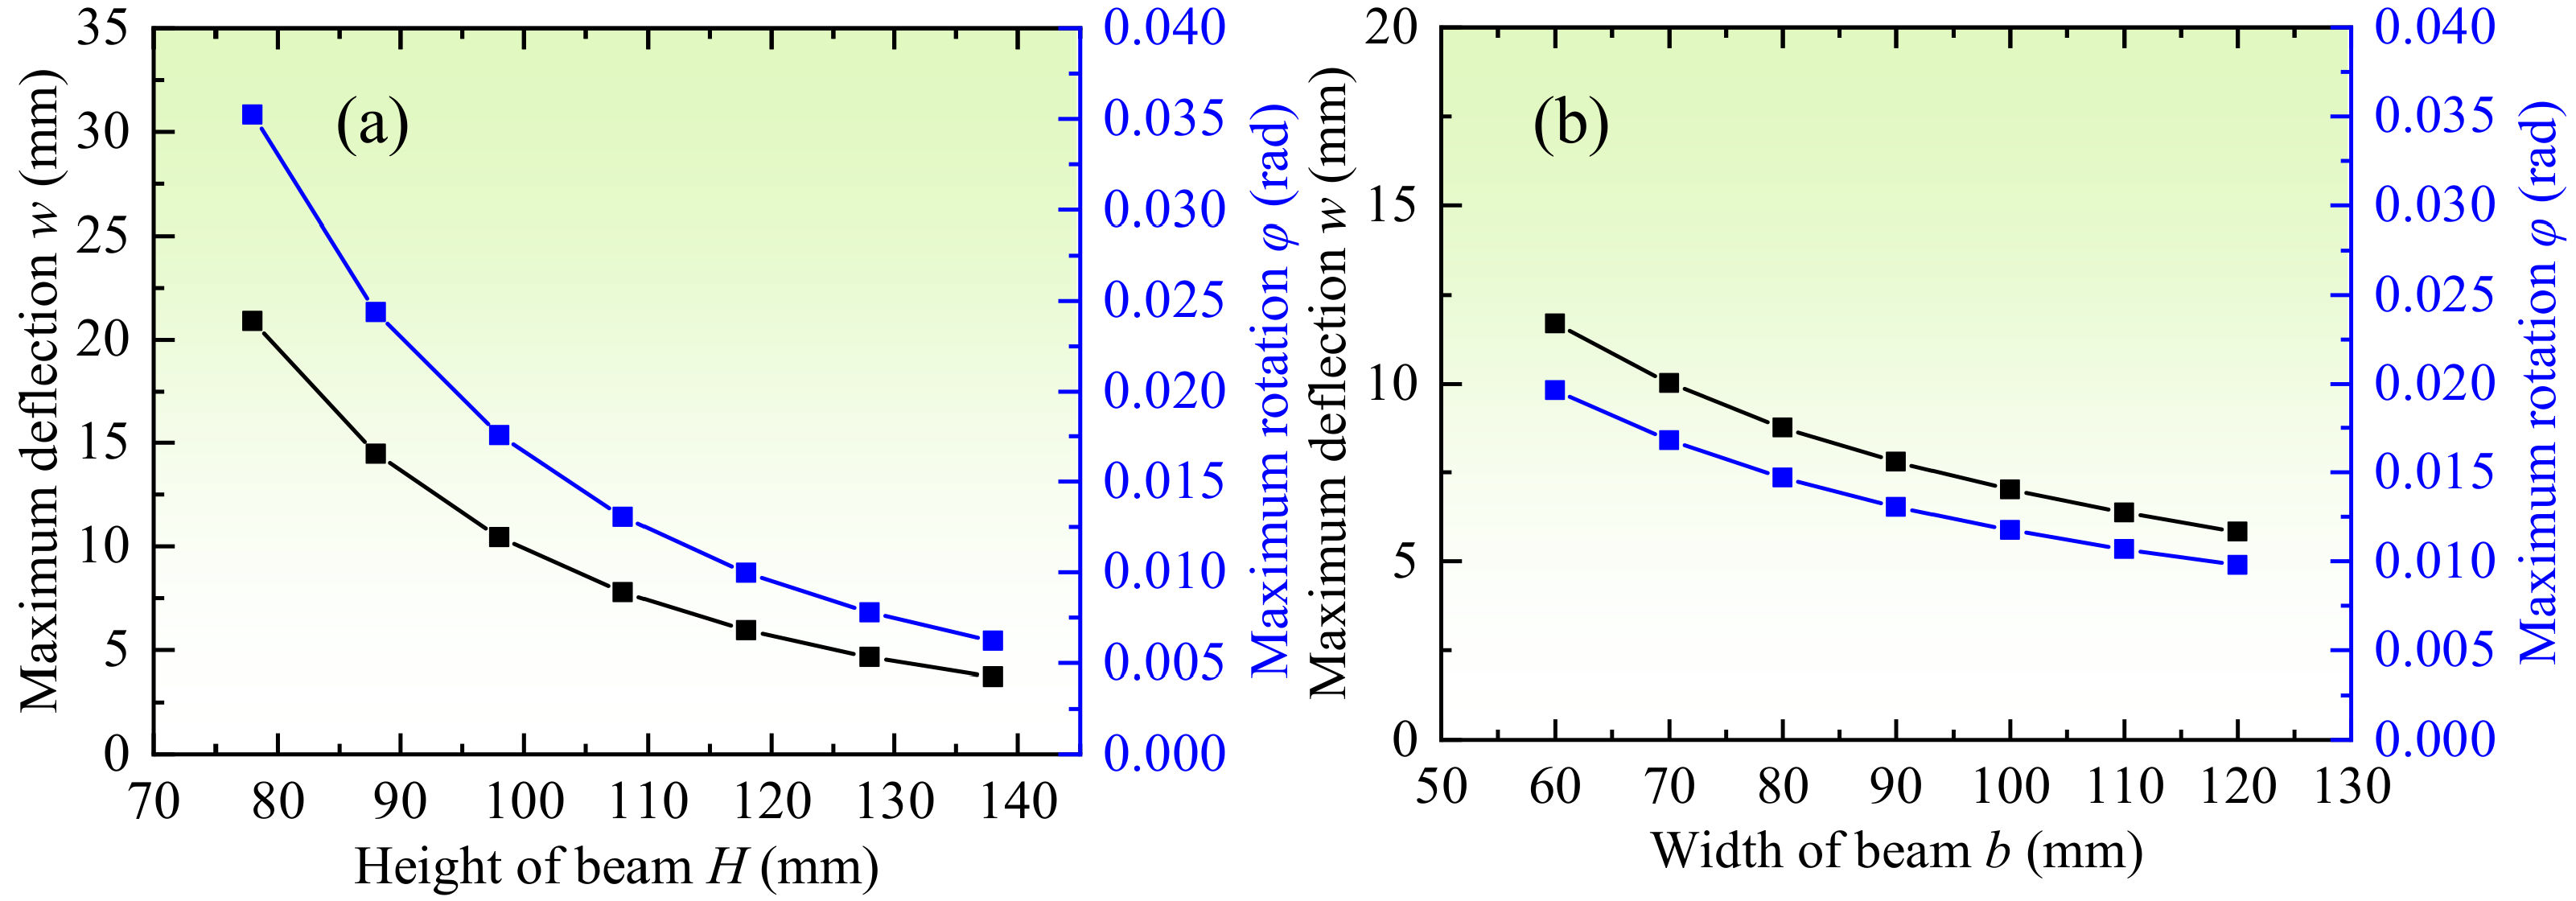
3.6. Effect of Beam Dimension

Finally, the effect of graded beam dimension on the bending behavior is investigated. The decarburization is maintained symmetrical and constant, and the power−law index is kept at p = 1.0. Figure 20 and Figure 21 show the variations of beam deflection, and rotation through the length with different beam height and width, respectively. Figure 22 shows the variation of the maximum deflection and rotation with different beam heights and widths. It is observed that the deflection and rotation decrease with the increase of beam height and width. The increment range of deflection is 0.09~0.64 mm when the beam height changes from 128 to 78 mm, that of the rotation is 1.59 × 10⁻⁴~1.08 × 10⁻³ rad; The increment range of deflection is 0.05~0.16 mm when the beam width changes from 110 to 60 mm, that of the rotation is 8.90 × 10⁻⁵~2.79 × 10⁻⁴ rad. It indicates that the influence degree of the beam height is greater than the beam width.

4. Conclusions

According to the decarburization phenomenon of automobile front axle forgings, a model of rectangular thick sandwich beam with a homogeneous core and functionally graded layer coated on bottom and top surfaces is constructed. The displacement field governing equations are derived based on a third-order shear deformation theory (TSDT) to investigate the static bending behaviors under two point−loads. The Navier analytical method and numerical DQM procedures are employed to obtain the bending responses under simply supported boundary conditions.
The results are in good agreement with an example in the literature, and the responses for the decarburized beam under point−loads obtained by the analytical and numerical method are also highly consistent with the deviation less than 0.31%. The transverse deflection, rotation, axial stress, and shear stress are studied in terms of different power−law exponents, decarburization depth, unsymmetrical decarburization depth, unbalance loading, and beam sectional dimension.
The results reveal that with the increasing power−law index p, the maximum deflection and rotation increase drastically and reach a quasi-steady state at p = 10. The axial and shear stress increase with the beam height linearly at the inner homogenous area and varies nonlinearly affected by the power−law index and beam height. When p is large (such as p = 100.0), the stress through the beam height experiences a steep saltation, which is similar to the laminated beams. At the position where the elasticity modulus reduces rapidly, the influence on stresses caused by the reduction of material properties is greater than that caused by increase of beam height.
The maximum deflection and rotation increase with the decarburization depth, the increment of maximum deflection and rotation decreases with the decarburization depth. When the depth is between 0~15 mm, the increment of deflection and rotation is between 0.02~0.035 mm, and 3.7×10⁻⁵~6.0×10⁻⁵ rad respectively, for every millimeter increment of decarburization depth. The material properties change slowly when the depth is significant (Hd > 5.0), and the reduction caused by the elasticity modulus change is smaller than that caused by the increase of beam height.
The deflection, rotation, axial stress, and shear stress are no longer symmetrical when the decarburization depth of two sides is different, and the axial displacement is no longer zero. The migrating distance of the physical neutral surface increases with difference of the decarburization depth at two sides. The maximum deflection and rotation increase with the decreasing migrating distance of neutral surface, while the variation of maximum axial displacement is on the contrary.
The position of maximum deflection migrates with the load unbalance rate and is approximate to the side with a larger loading. The maximum deflection, rotation, and migrating distance increase with the unbalance rate. The influence degree of the beam height is greater than the beam width. The increment range of deflection is 0.09~0.64 mm when the beam height changes from 128 to 78 mm, and that of rotation is 1.59×10⁻⁴~1.08×10⁻³ rad; The increment range of deflection is 0.05~0.16 mm when the beam width changes from 110 to 60 mm, and that of rotation is 8.90×10⁻⁵~2.79×10⁻⁴ rad.
The results reveal the influence of surface decarburization on the bending behavior of automobile forging front axle, and help optimize the beam dimension and structure to reduce the adverse effect caused by the surface decarburization.

Author Contributions

Conceptualization, Z.H.; methodology, Z.H. and L.H.; software, Z.H. and M.W.; validation, M.W.; writing—original draft preparation, Z.H. and M.W.; writing—review and editing, L.H., X.Q. and M.N.; supervision, L.H. All authors have read and agreed to the published version of the manuscript.

Funding

This research was funded by China Postdoctoral Science Foundation (2020M682498), the Major Project of Technological Innovation in Hubei Province (2020BED010), the Major Project of Technological Innovation in Hubei Province (2019AAA075), the Fundamental Research Funds for the Central Universities (WUT: 2020IVA092), the Support Plan Project of Science and Technology in Hubei Province (2014BAA271), the 111 Project (B17034), the Innovative Research Team Development Program of Ministry of Education of China (No. IRT17R83), and State Key Laboratory of Materials Processing and Die & Mould Technology, Huazhong University of Science and Technology (P2021-018).

Institutional Review Board Statement

Not applicable.

Informed Consent Statement

Not applicable.

Data Availability Statement

Not applicable.

Conflicts of Interest

The authors declare no conflict of interest.

References

  1. Zhao, X.J.; Guo, J.; Wang, H.Y.; Wen, Z.F.; Liu, Q.Y.; Zhao, G.T.; Wang, W.J. Effects of decarburization on the wear resistance and damage mechanisms of rail steels subject to contact fatigue. Wear 2016, 364–365, 130–143. [Google Scholar] [CrossRef]
  2. Zhan, Q.; Yu, L.; Ye, F.; Xue, Q.; Li, H. Quantitative evaluation of the decarburization and microstructure evolution of WC–Co during plasma spraying. Surf. Coat. Technol. 2012, 206, 4068–4074. [Google Scholar] [CrossRef]
  3. Zhang, C.; Liu, Y.; Zhou, L.; Jiang, C.; Xiao, J. Forming condition and control strategy of ferrite decarburization in 60Si2MnA spring steel wires for automotive suspensions. Int. J. Miner. Metall. Mater. 2012, 19, 116–121. [Google Scholar] [CrossRef]
  4. Grake, H.J. Kinetics and mechanisms of the surace reactions occurring during carburization and decarburizaition and also nitrogenation and dednitrogenation of iron in gases. Arch. Eisenhüttenwesen 1975, 46, 75–81. [Google Scholar]
  5. Liu, Y.; Zhang, W.; Tong, Q.; Sun, Q. Effects of Si and Cr on Complete Decarburization Behavior of High Carbon Steels in Atmosphere of 2 vol. % O2. J. Iron Steel Res. Int. 2016, 23, 1316–1322. [Google Scholar] [CrossRef]
  6. Hao, X.J.; Yin, W.; Strangwood, M.; Peyton, A.J.; Morris, P.F.; Davis, C.L. Off-line measurement of decarburization of steels using a multifrequency electromagnetic sensor. Scr. Mater. 2008, 58, 1033–1036. [Google Scholar] [CrossRef]
  7. Zhao, X.; Song, B.; Zhang, Y.; Zhu, X.; Wei, Q.; Shi, Y. Decarburization of stainless steel during selective laser melting and its influence on Young’s modulus, hardness and tensile strength. Mater. Sci. Eng. A 2015, 647, 58–61. [Google Scholar] [CrossRef]
  8. Suresh Babu, P.; Basu, B.; Sundararajan, G. Processing–structure–property correlation and decarburization phenomenon in detonation sprayed WC–12Co coatings. Acta Mater. 2008, 56, 5012–5026. [Google Scholar] [CrossRef]
  9. Kovačič, M. Modeling of Total Decarburization of Spring Steel with Genetic Programming. Mater. Manuf. Process. 2015, 30, 434–443. [Google Scholar] [CrossRef]
  10. Suresh Babu, P.; Basu, B.; Sundararajan, G. Abrasive wear behavior of detonation sprayed WC–12Co coatings: Influence of decarburization and abrasive characteristics. Wear 2010, 268, 1387–1399. [Google Scholar] [CrossRef]
  11. Zhang, C.; Zhou, L.; Liu, Y. Surface decarburization characteristics and relation between decarburized types and heating temperature of spring steel 60Si2MnA. Int. J. Miner. Metall. Mater. 2013, 20, 720–724. [Google Scholar] [CrossRef]
  12. Heo, N.H.; Jung, Y.C.; Lee, J.K.; Kim, K.T. Decarburization, grain boundary segregation of P and primary water stress corrosion cracking in a low-alloy steel. Scr. Mater. 2008, 59, 1200–1203. [Google Scholar] [CrossRef]
  13. Leitner, M.; Aigner, R.; Grün, F. Numerical Fatigue Analysis of Induction-Hardened and Mechanically Post-Treated Steel Components. Machines 2019, 7, 1. [Google Scholar] [CrossRef] [Green Version]
  14. Qiu, C.; Zurob, H.S.; Hutchinson, C.R. The coupled solute drag effect during ferrite growth in Fe–C–Mn–Si alloys using controlled decarburization. Acta Mater. 2015, 100, 333–343. [Google Scholar] [CrossRef]
  15. Zhuang, W.; Hua, L.; Wang, X.; Liu, Y.; Han, X.; Dong, L. Numerical and experimental investigation of roll-forging of automotive front axle beam. Int. J. Adv. Manuf. Technol. 2015, 79, 1761–1777. [Google Scholar] [CrossRef]
  16. Ji, H.; Liu, J.; Wang, B.; Fu, X.; Xiao, W.; Hu, Z. A new method for manufacturing hollow valves via cross wedge rolling and forging: Numerical analysis and experiment validation. J. Mater. Process. Technol. 2017, 240, 1–11. [Google Scholar] [CrossRef]
  17. Nguyen, H.N.; Hong, T.T.; Van Vinh, P.; Van Thom, D. An efficient beam element based on Quasi-3D theory for static bending analysis of functionally graded beams. Materials 2019, 12, 2198. [Google Scholar] [CrossRef] [Green Version]
  18. Farahmand, S.; Soorgee, M.H.; Monazzah, A.H. Evaluating the elastic properties of Al2O3–Al FGMs by longitudinal and transverse ultrasonic bulk waves velocity features. Ceram. Int. 2021, 47, 24906–24915. [Google Scholar] [CrossRef]
  19. Cardoso, R.P.R. A new beam element which blends the Euler-Bernoulli beam theory with idealised transverse shear flows for aircraft structural analysis. Thin-Walled Struct. 2020, 157, 107118. [Google Scholar] [CrossRef]
  20. Qin, X.; Shen, Y.; Chen, W.; Yang, J.; Peng, L.X. Bending and free vibration analyses of circular stiffened plates using the FSDT mesh-free method. Int. J. Mech. Sci. 2021, 202–203, 106498. [Google Scholar] [CrossRef]
  21. Żur, K.K.; Arefi, M.; Kim, J.; Reddy, J.N. Free vibration and buckling analyses of magneto-electro-elastic FGM nanoplates based on nonlocal modified higher-order sinusoidal shear deformation theory. Compos. Part B Eng. 2020, 182, 107601. [Google Scholar] [CrossRef]
  22. Khorshidi, K.; Fallah, A. Buckling analysis of functionally graded rectangular nano-plate based on nonlocal exponential shear deformation theory. Int. J. Mech. Sci. 2016, 113, 94–104. [Google Scholar] [CrossRef]
  23. Zheng, X.; Xu, D.; Ni, Z.; Zhou, C.; An, D.; Wang, B.; Li, R. New benchmark free vibration solutions of non-Lévy-type thick rectangular plates based on third-order shear deformation theory. Compos. Struct. 2021, 268, 113955. [Google Scholar] [CrossRef]
  24. Thai, H.-T.; Kim, S.-E. A simple quasi-3D sinusoidal shear deformation theory for functionally graded plates. Compos. Struct. 2013, 99, 172–180. [Google Scholar] [CrossRef]
  25. Karamanlı, A. Bending behaviour of two directional functionally graded sandwich beams by using a quasi-3d shear deformation theory. Compos. Struct. 2017, 174, 70–86. [Google Scholar] [CrossRef]
  26. Sayyad, A.S.; Ghugal, Y.M. Bending, buckling and free vibration of laminated composite and sandwich beams: A critical review of literature. Compos. Struct. 2017, 171, 486–504. [Google Scholar] [CrossRef]
  27. Kadoli, R.; Akhtar, K.; Ganesan, N. Static analysis of functionally graded beams using higher order shear deformation theory. Appl. Math. Model. 2008, 32, 2509–2525. [Google Scholar] [CrossRef]
  28. Zhang, D.-G. Nonlinear bending analysis of FGM beams based on physical neutral surface and high order shear deformation theory. Compos. Struct. 2013, 100, 121–126. [Google Scholar] [CrossRef]
  29. Niknam, H.; Fallah, A.; Aghdam, M.M. Nonlinear bending of functionally graded tapered beams subjected to thermal and mechanical loading. Int. J. Non-Linear. Mech. 2014, 65, 141–147. [Google Scholar] [CrossRef]
  30. Belarbi, M.-O.; Houari, M.S.A.; Hirane, H.; Daikh, A.A.; Bordas, S.P.A. On the finite element analysis of functionally graded sandwich curved beams via a new refined higher order shear deformation theory. Compos. Struct. 2022, 279, 114715. [Google Scholar] [CrossRef]
  31. Şimşek, M.; Yurtcu, H.H. Analytical solutions for bending and buckling of functionally graded nanobeams based on the nonlocal Timoshenko beam theory. Compos. Struct. 2013, 97, 378–386. [Google Scholar] [CrossRef]
  32. Nejad, M.Z.; Hadi, A. Eringen’s non-local elasticity theory for bending analysis of bi-directional functionally graded Euler–Bernoulli nano-beams. Int. J. Eng. Sci. 2016, 106, 1–9. [Google Scholar] [CrossRef]
  33. Eftekhari, S.A. Differential quadrature procedure for in-plane vibration analysis of variable thickness circular arches traversed by a moving point load. Appl. Math. Model. 2016, 40, 4640–4663. [Google Scholar] [CrossRef]
  34. Zhu, X.; Xiong, C.; Yin, J.; Yin, D.; Deng, H. Bending experiment and mechanical properties analysis of composite sandwich laminated box beams. Materials 2019, 12, 2959. [Google Scholar] [CrossRef] [Green Version]
  35. Jiang, B.; Zhou, L.; Wen, X.; Zhang, C.; Liu, Y. Heat Treatment Properties of 42CrMo Steel for Bearing Ring of Varisized Shield Tunneling Machine. Acta Metall. Sin. 2014, 27, 383–388. [Google Scholar] [CrossRef]
  36. Olanipekun, A.T.; Nthabiseng, M.; Ayodele, O.O.; Mphahlele, M.R.; Mampuya, B.M.; Olubambi, P.A. Datasets on the measurement of mechanical properties of ferrite and austenite constitutive phases using nanoindentation and micro hardness techniques. Data Br. 2019, 27, 104551. [Google Scholar] [CrossRef]
  37. Kiefer, D.; Gibmeier, J.; Stark, A. Determination of Temperature-Dependent Elastic Constants of Steel AISI 4140 by Use of In Situ X-ray Dilatometry Experiments. Materials 2020, 13, 2378. [Google Scholar] [CrossRef]
  38. Hadji, L.; Khelifa, Z.; El Abbes, A.B. A new higher order shear deformation model for functionally graded beams. KSCE J. Civ. Eng. 2016, 20, 1835–1841. [Google Scholar] [CrossRef]
  39. Ben-Oumrane, S.; Abedlouahed, T.; Ismail, M.; Mohamed, B.B.; Mustapha, M.; El Abbas, A.B. A theoretical analysis of flexional bending of Al/Al2O3 S-FGM thick beams. Comput. Mater. Sci. 2009, 44, 1344–1350. [Google Scholar] [CrossRef]
  40. Lv, Z.; Liu, H. Nonlinear bending response of functionally graded nanobeams with material uncertainties. Int. J. Mech. Sci. 2017, 134, 123–135. [Google Scholar] [CrossRef]
  41. Eshraghi, I.; Jalali, S.K.; Pugno, N.M. Imperfection sensitivity of nonlinear vibration of curved single-walled carbon nanotubes based on nonlocal timoshenko beam theory. Materials 2016, 9, 786. [Google Scholar] [CrossRef] [PubMed] [Green Version]
  42. Twinkle, C.M.; Jeyaraj, P. A semi-analytical nonlocal elasticity model for static stability and vibration behaviour of agglomerated CNTs reinforced nano cylindrical panel under non-uniform edge loads. Appl. Math. Model. 2022, 103, 68–90. [Google Scholar] [CrossRef]
  43. Wang, X.; Jin, C. Differential Quadrature Analysis of Moving Load Problems. Adv. Appl. Math. Mech. 2016, 8, 536–555. [Google Scholar] [CrossRef]
  44. Koutoati, K.; Mohri, F.; Daya, E.M. Finite element approach of axial bending coupling on static and vibration behaviors of functionally graded material sandwich beams. Mech. Adv. Mater. Struct. 2021, 28, 1537–1553. [Google Scholar] [CrossRef]
Figure 1. Schematic diagram of heat treatment process of hot forgings.
Machines 10 00139 g001
Figure 2. (a) OM microstructure of decarburization zone on steel (GB 42CrMo, 4% HNO3 in alcohol for 10s). (b) Forgings of automobile front axle.
Machines 10 00139 g002
Figure 3. Geometry, loadings, and constraints of the graded beam.
Machines 10 00139 g003
Figure 4. Variation of elasticity modulus through beam height in terms of power−law index.
Machines 10 00139 g004
Figure 5. Distribution of two point−loads expressed with Fourier series.
Machines 10 00139 g005
Figure 6. Distribution of two point−loads expressed with regularized Dirac-delta function.
Machines 10 00139 g006
Figure 7. Comparison of deflection and rotation with different solution method (p = 1.0). (a) Deflection w. (b) Rotation φ.
Machines 10 00139 g007
Figure 8. Variations of beam deflection and rotation through the length with different power−law indexes. (a) Deflection w. (b) Rotation φ.
Machines 10 00139 g008
Figure 9. Variation of the maximum deflection and rotation with different power−law indexes.
Machines 10 00139 g009
Figure 10. Variations of beam axial stress and shear stress through the length with different power−law index (x = 425 mm). (a) Axial stress. (b) Shear stress.
Machines 10 00139 g010
Figure 11. Distribution of axial and shear stress on longitudinal and cross-section of the beam (p = 1.0). (a) Axial stress on longitudinal-section. (b) Shear stress on longitudinal-section. (c) Axial stress on cross-section. (d) Shear stress on cross-section.
Machines 10 00139 g011
Figure 12. Variations of beam deflection and rotation through the length with different decarburization depth. (a) Deflection w. (b) Rotation φ.
Machines 10 00139 g012
Figure 13. (a) Variation of the maximum deflection and rotation with different decarburization depth. (b) Variation of the increment of maximum deflection and rotation.
Machines 10 00139 g013
Figure 14. Variations of beam axial stress and shear stress through the length with different decarburization depth. (a) Axial stress. (b) Shear stress.
Machines 10 00139 g014
Figure 15. Variations of beam deflection, rotation, and axial displacement through the length with different decarburization depths. (a) Deflection w0. (b) Rotation φ. (c) Rotation u0.
Machines 10 00139 g015
Figure 16. Schematic diagram of axial displacement near geometrical middle surface.
Machines 10 00139 g016
Figure 17. Variation of neutral surface, maximum deflection, rotation, and axial displacement through different distribution of unsymmetrical decarburization depth.
Machines 10 00139 g017
Figure 18. Variations of beam axial stress and shear stress through the length with different unsymmetrical decarburization depths. (a) Axial stress. (b) Shear stress.
Machines 10 00139 g018
Figure 19. Variations of beam deflection, and rotation through the length with different unbalance rate. (a) Deflection w0. (b) Rotation φ.
Machines 10 00139 g019
Figure 20. Variations of beam deflection, and rotation through the length with different beam height. (a) Deflection w0. (b) Rotation φ.
Machines 10 00139 g020
Figure 21. Variations of beam deflection, and rotation through the length with different beam width. (a) Deflection w0. (b) Rotation ∅.
Machines 10 00139 g021
Figure 22. Variation of the maximum deflection and rotation with different beam height and width. (a) maximum deflection. (b) maximum rotation.
Machines 10 00139 g022
Table 1. Chemical composition of AISI 4140 (GB 42CrMo) (wt.%).
ElementContent
C0.38~0.45
Si0.17~0.37
Mn0.50~0.80
Cr0.9~1.2
Mo0.15~0.25
Ni≤0.03
Cu≤0.03
S≤0.03
P≤0.03
Table 2. Comparison of center deflection w between the method in this paper and the literature ( E m = 70   GPa , E c = 380   GPa , v = 0.3 , L = 2000   mm , h = 200   mm , b = 50   mm , h 1 = 0.3 h , h 2 = 0.7 h ).
MethodKoutoati et al. [44]Present-NavierPresent-DQM
p = 0.084.2984.2984.29
p = 0.5126.59126.60126.60
p = 1.0162.00162.00162.00
p = 5.0281.12281.12281.12
p = 10.0314.74314.74314.74
Table 3. Comparison of center deflection and maximum rotation with different solution methods for beam with graded decarburization layer.
MethodNavierDQMDeviation
p = 0.2ϕ0.01270.0127−0.31%
w−7.6190−7.5994−0.26%
p = 1.0ϕ0.01330.0132−0.31%
w−7.9319−7.9114−0.26%
p = 5.0ϕ0.01380.0137−0.31%
w−8.2277−8.2064−0.26%
Table 4. Decarburization depth of two sides.
No.12345678
Bottom side Hd1 (mm)201815129631
Top side Hd2 (mm)136912151820
Publisher’s Note: MDPI stays neutral with regard to jurisdictional claims in published maps and institutional affiliations.

