Abstract
Measurements are crucial for research in the fields of microelectromechanical (MEMS), nanoelectromechanical (NEMS) and industrial applications. In this work, the design approach for the development and construction of a testing 4D mechatronic system, and respective validation, including the detailed description of the used components and parts as well as the performed tests for respective validation in the working environment, are presented. Because this is testing equipment, the measurement feature is presented and validated, in detail, making this system available and reliable for the mentioned purposes of use. An important result in this work is the possibility of on-site control or the remote control of the 4D mechatronic system for measurement and integrated control of processes, with the aim of reducing the cost of obtaining the necessary measurements.
1. Introduction
The aim of this work is to design, develop and construct an intelligent system that can be used for high-precision measurements in industrial manufacturing processes and, also, to integrate MEMS and NEMS subsystems and respective dedicated software components. User instructions are also presented. Along with the achievement of the above-mentioned objectives, experimental validations are performed to validate the obtained results, which allow for the generation of measurement protocols.
The international literature provides vast information on MEMS and NEMS equipment and systems. If in the United States, the nomenclatures MEMS and NEMS are mainly used; in Japan, the nomenclature micromachines is used; and in Europe, microsystems technology (MST) is used. Past and present trends in manufacturing processes and ultra-precise measurements are inclined towards miniaturization [1], this trend also being found in the medium- and long-term strategies of companies in this field [2].
MEMS and NEMS technologies and applications, as are known nowadays, have been influenced by moments such as the appearance of the first integrated circuit (IC) (JS Kilby 1958/Robert Noyce 1959) [3], the invention of the microprocessor in 1971 [4], the use of LIGA technology (an acronym from German language for lithographie/lithography, galvanoformung/galvanization and abformung/casting) in 1982, the invention of the atomic force microscope (AFM) in 1986 [5,6], the discovery of the carbon nanotube (CNT) in 1991 and others. Since 2000, MEMS and NEMS devices and applications have been constantly developed [7] and are found in several industrial applications and multiple fields, facilitating their development.
MEMS and NEMS harness on the potential given by the Internet of Things (IoT) [8,9,10,11], virtual reality (VR) [12] and augmented reality (AR) [13] providing the possibility to control and monitor remotely but also the possibility to visualize, in virtual or augmented reality, equipment, installations, materials and others with the aim of streamlining work processes and facilitating the skills development on human resources.
The development of manufacturing processes is correlated with the four identified industrial revolutions [14].
Globally, there is an ongoing concern for microfabrication, especially for its manufacturing methods/processes. One of the most popular microfabrication processes is micro-forming [15,16].
Industry 4.0 [17,18,19,20] is not influenced by the emergence of a new source of energy, as the previous ones, but is based on the concept of the digitization of processes, plants and factories. Some examples are based on the design and development of autonomous vehicles, drones and even virtual assistants. Industry 4.0 transforms economies, jobs and, implicitly, the society in which we live. Available digital technologies offer new solutions that use data analysis, artificial intelligence, cognitive technologies and, last but not least, IoT, thus favoring the emergence of interconnected digital enterprises. A specific example of manufacturing within Industry 4.0 is the collaborative robots (cobots) that share the same space and collaborate with the human operators, offering safety to them but also an improved efficiency of the design process. Industry 4.0 refers to the digitization of all industrial processes and their transformation into smart, efficient and autonomous processes through detection, connectivity, big data analysis and control, as can be seen in Figure 1.

Figure 1.
Industry 4.0 ecosystem.
An important component of Industry 4.0 is 3D printing [21,22]. Along with additive manufacturing (AM), it is possible to use the name rapid manufacturing (RM) or rapid prototyping (RP). Other less common names are digital manufacturing/fabrication, layered manufacturing or desktop manufacturing (DMF).
Nowadays, there is a connected world where billions of computers, tablets, smartphones, buildings, portable objects, medical devices, game consoles and other smart items are constantly purchasing, processing and providing information.
The IoT, presented in Figure 2 is a global communications network infrastructure that connects physical and virtual entities around us, taking advantage of massive data capture and communication capabilities, in cyber-security space [23,24,25].

Figure 2.
IoT and fields where can be applied.
Augmented reality (AR) and virtual reality (VR) develop several applications that deal with virtual space and physical space. AR considers the actual space over which computer-generated objects overlap in that environment. VR builds an unreal or synthetic environment.
Cloud and big data are concepts used in the IoT and Industry 4.0 where a huge amount of information is collected and processed. Cloud technology is usually used to succeed in data processing, making it easy to save and later access data in a fast and convenient way.
Today’s industry has facilitated the rise of collaborative robots [26], called cobots, especially due to the need for a common work environment in which humans and cobots carry out complex activities [27,28,29,30,31,32,33].
Cobots are specially created to work with people, not just for them. Instead of being in a cage, they work in a cooperative environment and help with complex tasks that cannot be fully automated. For example, they can hand over components to the people they work with, who will perform more precise assemblies or quality control tasks.
The transmission of data via internet connections is subject to a large number of risks because of security issues. Symmetrical or asymmetrical algorithms are used to encrypt the transmitted data and eliminate the risk of it being intercepted.
A VPN [34,35] is a set of two or more private networks or individual users that use secure tunnels on a public telecommunications infrastructure, such as the Internet, for connection. A VPN is commonly used to provide distributed offices or individual users with secure access to their organization’s network.
2. Design Methodology
The 4D mechatronic system for measurement and integrated control of processes is designed according to the VDI-2206 [36,37,38] guideline standard [39] for the product development process. In the design process, an important step was to reduce the complexity of the system. The 4D mechatronic system was designed in phases: integrate mechatronic components, integrate support components of the system, integrate designed software and integrate cyber-physical systems.
According to VDI-2206 guidelines, the design of the 4D mechatronic system for measurement and integrated control of processes focuses on environmental, impact, hierarchical and structure perspectives. The environmental perspective was oriented to identification of the system, the context of use and boundary and its environment. The impact perspective was oriented to identification of the main system function, the interactions between the system and its functions and interfaces between the system and its form. The hierarchical perspective was oriented to identification of the system entities and system entities’ functions. The structure perspective was oriented to identification of the interactions between system functions, interfaces between system form and also was oriented to the creation of a system architecture by the mapping of a functional system structure to an element-based system structure.
The design methodology is also based on principles described in other scientific papers where low-cost solutions and various parameters such as vibrations, temperature, rotational speed and power consumption are analyzed [40]. An important aspect analyzed is the datasets for precise measurements for statistical modeling according to the machine learning concept [41].
3. Materials and Methods
3.1. Mechatronic System Overview
The testing 4D mechatronic system for measurement processes and integrated control (MMI4D)—presented in Figure 3—consists of three linear electrical systems (X, Y and Z) and a rotation system (R) installed on the linear electrical system Z, which increases the capacity of the microsystem, allowing further expansion of technical and technological services by connecting the equipment profile, gripping, measuring probe and other smart equipment required for integration into cyber–mix–electronic assemblies for remote control, remote measurement, remote monitoring and remote configuration.
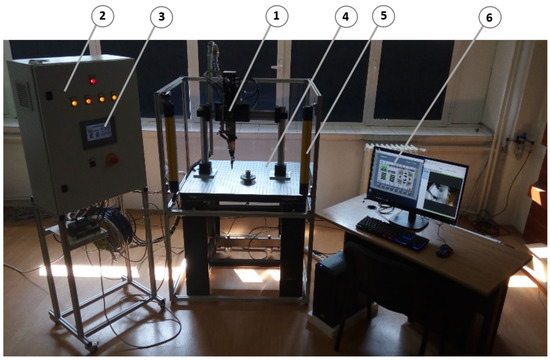
Figure 3.
Smart 4D mechatronic microsystem used in metrological processes of integrated measurement and control—real view. Legend: 1—4D mechatronic system; 2—command and control panel; 3—HMI display; 4—anti-vibration table system; 5—sensoristic barriers; 6—PC display for remote monitoring and remote control.
Figure 3 shows the physically constructed MMI4D equipment with the respective components highlighted. Figure 4 shows the conceptual model of MMI4D equipment in computer aided design (CAD) software.
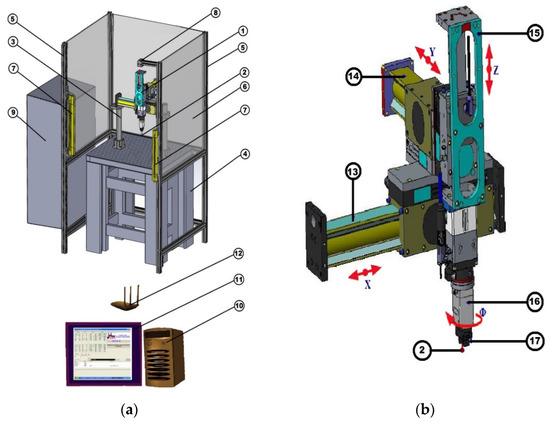
Figure 4.
Conceptual CAD model of MMI4D (in SolidWorks): (a) MMI4D construction; (b) 4D linear and rotating electrical assembly—4D mechatronic system. Legend: 1—mechatronic system in 4D; 2—highly precise 3D Probe; 3—adjustable positioning system; 4—anti-vibration table system; 5—frame for protection; 6—protective walls made of transparent plastic; 7—sensory barriers; 8—IP camera; 9—command and control panel; 10—PC central unit; 11—PC monitor; 12—router; 13—linear electric system X; 14—linear electric system Y; 15—linear electric system Z; 16—electrical rotation system R; 17—electric parallel gripper system.
The construction of MMI4D is shown in Figure 4 position a, and the four linear and rotating electrical systems, together with the parallel gripping device, are shown in Figure 4 position b. According to Figure 4, MMI4D contains:
- A mechatronic system in four coordinates XYZR (1) which allows the direct positioning, with precision, of the parts to be tested, analyzed and measured;
- An ultra-precise 3D probe (2) for measuring and controlling small- and medium-sized industrial parts. The integration of the 3D probe is done by positioning and technological fixation in the parallel gripper (17);
- An adjustable system (3) for the precise positioning, in the desired position, of the mechatronic subsystem in 4D XYZR (1);
- An anti-vibration table subsystem (4) with a self-leveling mechanism in the horizontal plane, to ensure the accuracy of positioning and measurement of the parts to be controlled;
- An integrable frame (5) for the protection of the positioning and measuring process in the workspace;
- Transparent plastic protective walls (6) to secure the positioning and measurement process in the workspace;
- Sensoristic barriers (7) installed on the integrated frame (5) to secure the positioning and measuring process in the workspace;
- An IP camera (8), destined to visualize the mechatronic subsystem in four XYZR remote coordinates (1) for remote control and remote monitoring;
- A command and control module (9) made of special electronic components: controllers for the mechatronic–mixmechatronic subsystem in four coordinates XYZR (1); programmable controllers: PLC, communication modem, GPRS 4G, power supply, etc.;
- A PC central unit (10) for software, MMI4D command, IP camera command (8), etc.;
- A PC display (11) for display software and running programs required for the measurement and positioning process;
- A router (12) for connecting to cyberspace;
- Electric system X (13) made in a structure defined by the nominal stroke of 200 mm;
- Electric system Y (14) made in a structure defined by the nominal stroke of 100 mm;
- Electric system Z (15) made in a structure defined by the nominal stroke of 100 mm;
- Electric rotation system R (16) with a dedicated controller and positioned at the end of the power axis Z (15);
- An electric parallel gripper system (17) for handling and positioning small and miniaturized parts and for holding/fixing the highly-precise 3D probe (2).
For an overview, Figure 5 shows the subassembly consisting of the linear electrical system Z axis, rotary electrical system R, parallel gripper and highly-precise 3D feeler.
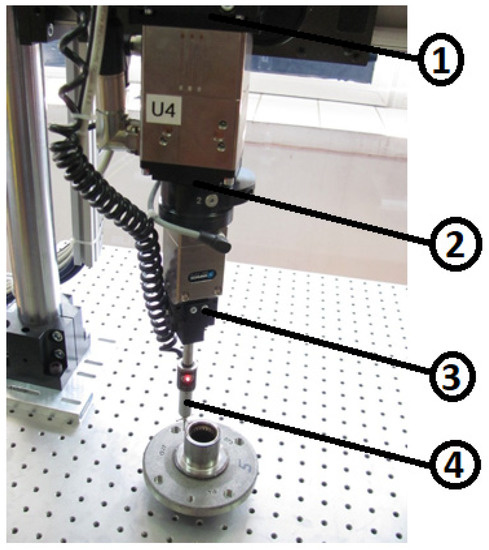
Figure 5.
MMI4D subsystem. Legend: 1—linear electrical system Z; 2—electric rotation system R; 3—electric gripper electric system; 4—highly-precise 3D probe.
The subassembly shown in Figure 5 ensures the movement of the MMI4D system on the Z axis but also the rotation of the gripper installed on the Z axis and of the 3D probe.
Figure 6 shows the anti-vibration table subsystem with a self-leveling mechanism in the horizontal plane, to ensure the precision of positioning and measurement of the parts to be measured. The table work measures 750 mm × 900 mm × 60 mm, is powered by compressed air and has movable wheels for transport.
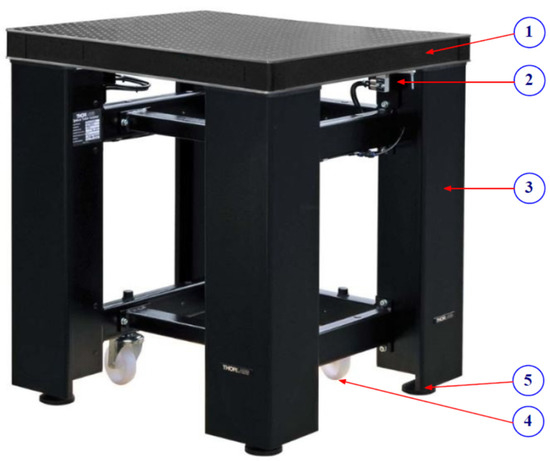
Figure 6.
Anti-vibration table subsystem. Legend: 1—table work; 2—self-leveling mechanism; 3—mechanical frame; 4—movable wheels; 5—adjustable support.
The anti-vibration table subsystem ensures the flatness of the workpiece when an external force is applied at any point on the table. The self-leveling mechanism is functional by using compressed air. The displacement rollers (position 4 in Figure 6) ensure the displacement of the MMI4D system in the position required by the work application.
Figure 7 shows the adjustable system for positioning the MMI4D system. It has the role of moving the MMI4D system on the Z-axis so that it can be positioned according to the desired application and provide its maximum functionality. Mounting and positioning on the anti-vibration table is done only once.
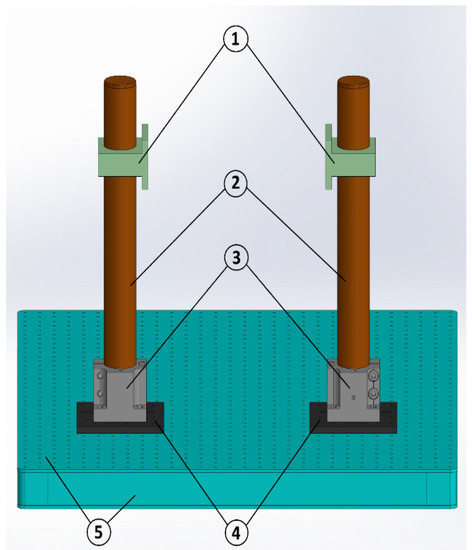
Figure 7.
Adjustable system for MMI4D positioning. Legend: 1—reference for adjusting the position of the MMI4D on the Z axis; 2—cylinders for supporting MMI4D; 3—reference for fixing the MMI4D on the cylinders; 4—plate for mounting the adjustment system on the anti-vibration table; 5—anti-vibration table.
To ensure the prevention of accidents, in the workspace, MMI4D was equipped with two optical safety barriers, shown in Figure 8a where it is highlighted with a: 1—emitter, 2—receiver and 3—area indicator. Their role is to stop the work/measurement process when unauthorized objects or the operator’s hand enter the workspace.
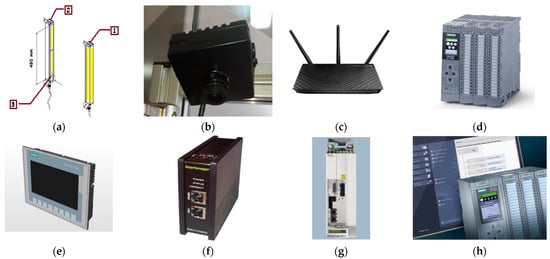
Figure 8.
MMI4D components for safety and control. (a) Schematic representation of optical barriers; (b) IP camera for remote monitoring and remote control of the MMI4D system; (c) router WiFi Assus RT-N—66U [42]; (d) PLC: S7-1512C-1PN [43]; (e) HMI: KTP700 BASIC PN [43]; (f) remote control: Secomea site manager [44]; (g) converter Rexroth IndraDrive CS [45]; (h) TIA PORTAL V14: PLC programming [46].
An IP camera is used for the remote monitoring and remote control of the MMI4D system, shown in Figure 8b. Its role is video inspection of the parts on the anti-vibration table during remote-controlled probing operations. In order to be able to view the work table with the help of the IP camera, it is necessary to connect it to the Internet, the quality of the image being dependent on the data transfer speed offered by this connection.
The Assus RT-N—66U [42] (Gygabite) WiFi router in Figure 8c has the role of achieving local sharing (in the laboratory or at the Telecommunications and Telecontrol Center) of the Internet network with any other compatible devices. The router shown in Figure 8c connects to the local network and then to the network from where the command and control of the MMI4D system is performed through a virtual private network. To be able to achieve effective control and command of the MMI4D system, a data transfer speed of at least 1 Gb/s is recommended.
3.2. Hardware Component
The PLC model used in this project is S7-1512C-1PN [43], which is part of the family of compact processors and is shown in Figure 8d. Compact CPUs can be used for small or medium applications and have integrated input/output modules for analog and digital signals, as well as integrated technological functions.
The used processor is installed in the command-and-control panel and has the role of processing the information received from the control elements of the X, Y, Z and R axes, the gripper and the signals received from the 3D high-precision probe. These signals transposed in the application designed by the thesis author for the MMI4D system.
The HMI screen KTP700 BASIC PN [43] shown in Figure 8e is installed on the main side of the command-and-control panel and is accessible to the operator for use during the work process. The main role of the screen is to access the MMI4D system and to activate and touch control the X, Y, Z and R axes and the gripper for the work process and the application used.
The Secomea SiteManager [44] shown in Figure 8f are robust aluminum devices designed to industrial specifications. They support all the features needed to function as secure access gateways for industrial installations, from small machines to complete production lines and entire factories.
The IndraDrive CS [45] (HCS01) shown in Figure 8g are compact converters that cover the lower power range of the power field. They combine power and control units into a single unit and offer Ethernet communications, a multi-encoder interface and integrated security technology.
Internationally recognized interfaces are available for communication with top control systems: Sercos, PROFIBUS, Multi-Ethernet (Sercos, PROFINET IO, Ethernet/IP, EtherCAT), CANopen, DeviceNet, analog and parallel. The role of converters is to control the X, Y, Z and R axes by converting their movements into signals, movements visualized through the above-mentioned screen.
3.3. Software Component
The full integrated automation TIA PORTAL V14 [46] portal shown in Figure 8h offers unlimited access to the full range of digital automation services, from digital planning and integrated engineering to seamless operation.
It offers many programming languages such as LADDER, FBD, IL, ST and SFC so that the programmer can use the language with which he feels most comfortable, and at the same time can be able to use them as needed.
SIMATIC WinCC shown in Figure 9 is a control and data acquisition system (SCADA) and human–machine interface (HMI) from Siemens. SCADA systems are used to monitor and control the physical processes involved in industry and infrastructure on a large scale and over long distances.
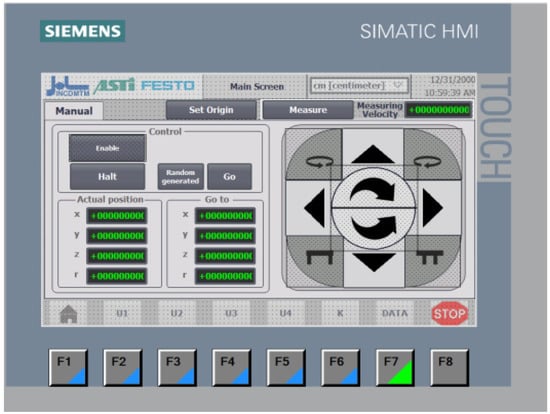
Figure 9.
Simatic WINCC V14-HMI programming.
3.4. Command and Control Panel
The MMI4D system consists of the command-and-control panel shown in Figure 10 which includes the software components, shown in Figure 11, abovementioned.
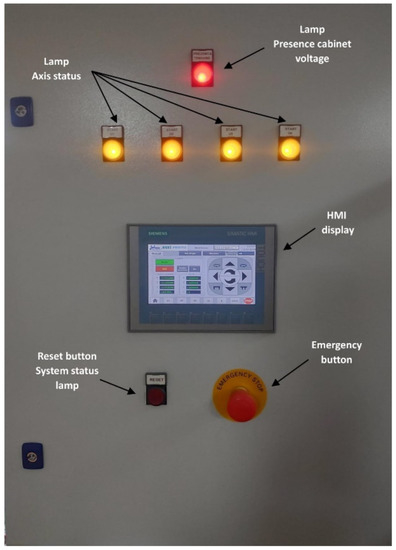
Figure 10.
Command and control panel.
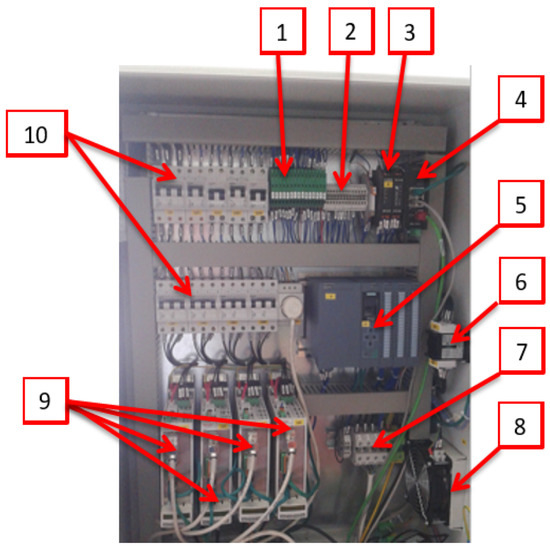
Figure 11.
The command-and-control panel, with the included software component, of the MMI4D system. Legend: 1—24V fuses; 2—34V connection clamps; 3—controller’s gripper; 4—the communications module SECCOMAT; 5—Programmable Logic Controller (PLC); 6—general power supply switch; 7—connecting clamps for the X, Y, Z and R axis control cables; 8—cooling fan; 9—modules for controlling linear and rotating electrical systems; 10—the thermal protection voltage circuit breakers.
On the right side of the command-and-control panel is the general switch for powering the cabinet. It has two possible positions, ON and OFF. When it is in the ON position of the command-and-control panel, it will be supplied with voltage.
On the front of the command-and-control panel are several status lamps with two switches.
At the top side, there is a red lamp that detects the presence or lack of voltage in the control cabinet.
There are four more yellow lamps, one for each axis that indicates the status. Thus, if the lamp is lit continuously, it means that the shaft is activated and ready for operation. If the lamp is flashing, it means that the axis is moving. If the lamp is off, the axis is not active.
The reset switch also includes a system-wide status lamp. Thus, if the system is completely turned off, this lamp will flash. To restart the system, it is necessary to press the reset button, which will also turn off the lamp.
The MMI4D system is controlled through a touch screen HMI display (Figure 12a) with innovative high-resolution displayers with 64,000 colors (Figure 12b). A USB interface allows for connecting a keyboard, a mouse or a scanner of barcodes and allows a simple storage of data on an USB flash drive.
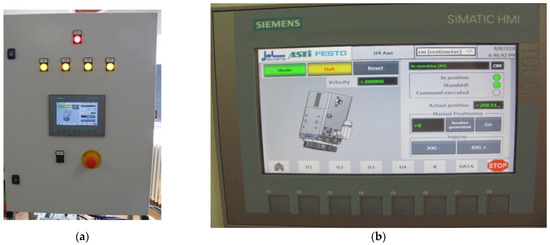
Figure 12.
HMI display (a) HMI display installed on the command-and-control panel; (b) b-HMI display for command and control of the MMI4D system.
By using the touch screen display placed on the command or control panel or projected on the display of the PC unit (Figure 3, position 6), the MMI4D system can be controlled and set. Figure 13 shows the main switches used in MMI4D.
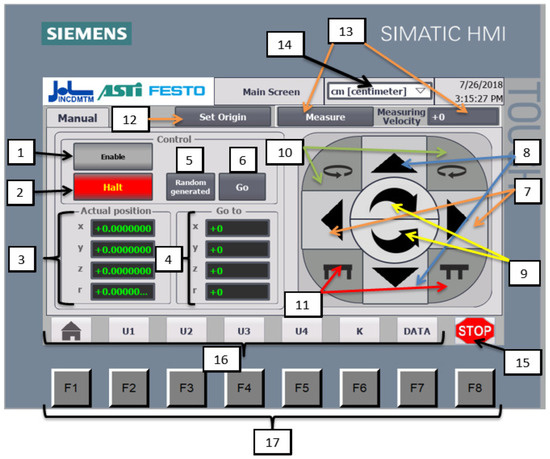
Figure 13.
MMI4D system command and control panel.
According to Figure 13, we have the following description of the switches:
- The Enable switch has the function of activating all the axes and setting them in the “ready” state. When pressed, it will change color to green, a sign that all axes are activated. To deactivate all axes, press this switch again;
- The Halt switch is used to stop all axes from moving. If this switch is pressed, it will flash red. Pressing the switch releases the axes and they can be set in motion;
- In this section, the current positions of the axes in their coordinate system will be displayed. The values can be displayed in the following units of measurement: centimeter, millimeter or micrometer;
- Certain positions can be entered in these fields where the axis system is to be positioned;
- The Random generated switch is used to generate random positions in which to move the axis system;
- The Go switch moves the axes to the positions specified in point 4;
- The two switches move the system on the X axis;
- These switches move the system on the Y axis;
- Using these switches, the system can be moved on the Z axis;
- With the help of these switches, rotations can be made on the R axis;
- Closing and opening the gripper can be done with these two switches;
- If you want to measure an object, setting the origin of this object will be done using the Set Origin button. The coordinates of the axes will remain the same, but the measured coordinates will be reported at the point of origin;
- In this section, you can start/stop the measurement process and also set a measurement speed between 0 and 250,000 tenths of a micron. Outside of this speed, the measurement will suffer drastically;
- From this field, you can select the unit of measurement for displaying current positions, but also for measuring objects;
- The STOP button deactivates the axles and the gripper completely;
- With these graphic switches you can navigate between the pages of the HMI screen;
- These physical switches have the same role as the switches at number 16 plus the STOP button function.
A joystick can also be used to control the MMI4D system, as shown in Figure 14.
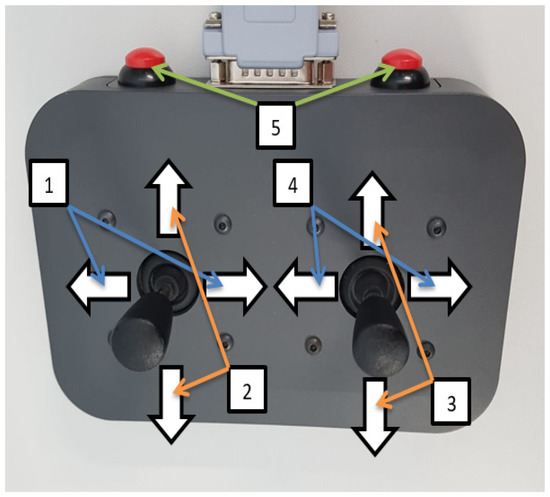
Figure 14.
Joystick used to control the MMI4D system. Legend: 1—U1 axis control; 2—U2 axis control; 3—U3 axis control; 4—U4 axis control; 5—gripper control.
3.5. Data Acquisition
Data acquisition is presented as a working procedure, below:
- Measuring coordinates
The display for measuring coordinates is shown in Figure 15:
- 18.
- Start/Stop measurement.
- 19.
- Setting the unit of measurement to be measured.
- 20.
- Measured coordinates.
- 21.
- Measurement number.
- 22.
- Deleting measurements and reset to initial settings.
- 23.
- Save the data in files in the PLC memory.
- 24.
- The name of the file in which the measured data will be saved.
- 25.
- Delete the data file from the PLC memory.
- 26.
- Navigating to the second data screen, this being identical to the one above, the only difference being the measurement index.
- 27.
- The STOP button deactivates the axes.
- 28.
- With these graphic switches, you can navigate between the pages of the HMI.
- 29.
- These physical switches have the same role as the buttons at number 16 plus the STOP button function.
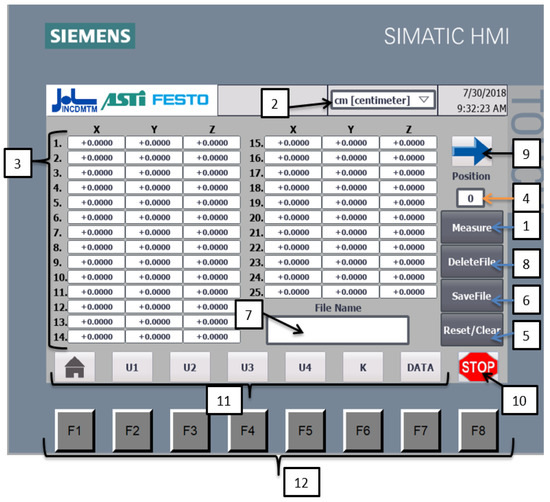
Figure 15.
Coordinate measurement with the MMI4D system.
- REMOTE Connection
To perform the remote control and remote command functions, the PC unit of the MMI4D system connects to the Internet, then the user connects to the interface provided by LinkManager to make the virtual private network (VPN) connection. Through the Smart Client application installed on the PC unit, it is connected to the MMI4D system, thus visualizing the HMI touch screen installed on the command-and-control panel.
The connection with the HMI will be made differently:
- The Smart Client software application offered by Siemens opens.
- Enter the HMI IP: 192.168.0.2 (Figure 16).
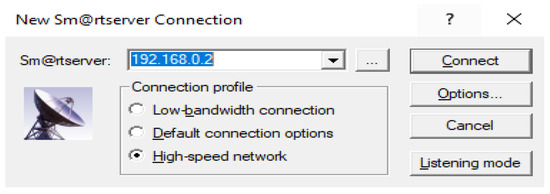 Figure 16. Enter IP to make the connection.
- 3.
- Enter password (Figure 17).
 Figure 17. Enter password.
- 4.
- Now, we can visualize the graphical interface of the HMI and we can control the axis system (Figure 18).
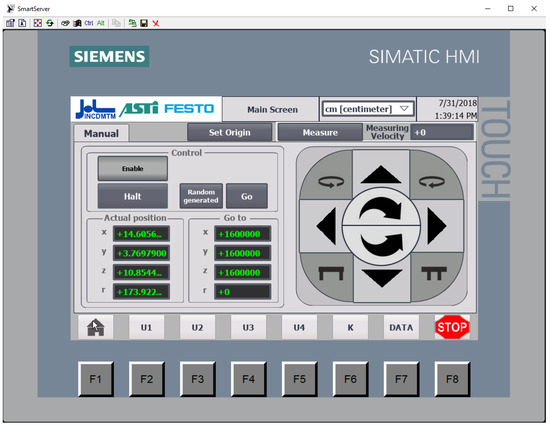 Figure 18. Center panel view.
The realization of the remote control function is shown in Figure 19. The PC unit of the MMI4D system connects to the Internet, then the user connects to the interface provided by LinkManager to create a VPN (virtual private network) connection.

Figure 19.
The global telecommunication elements for the realization of the remote control function.
4. Results
In order to validate the MMI4D system, a series of tests were performed through measurements.
Experimental research for the mechatronic system MMI4D on its metrological validation for measurement and control processes were conducted. In this paper, only a selection of these set measurement tests are presented. The parts measured were the gauge of 1 mm, 5 mm, 10 mm, 20 mm, 50 mm and 150 mm. Ten dimensional measurements related to each of the gauges mentioned were performed. The MMI4D starts from the zero position and is controlled to gauge proximity and, when contact from the highly precise 3D Probe and the gauge is made, the 3D measurement appears on the HMI display. The MMI4D system can store up to 50 measurements and can be saved in a file in the PLC memory, and accessed later to be analyzed and processed.
The following were performed, in the complete set of measurements: repeatability of the standard measurement, determination of the calculated average value; determining the variation of repeatability, through the mathematical relation; determination of the measurement uncertainty, through the mathematical relation; and determination of the metrological decision.
The expected results must respect the standard ISO 13385-1:2019 [47] and Evaluation of the Uncertainty of Measurement in calibration EA-4/02 M: 2022 [48]. Measurement repeatability values with selected parts are ≤0.001 mm and, more precisely, they must not exceed the allowed tolerance of 0.0008 mm. In addition, the measurement uncertainty value must be ≤0.0005 mm.
Below, there is a selection of performed tests.
4.1. Repeatability of Measurement with Parts on the MMI4D System
The repeatability of 10 part measurements (p1–p10) on the MMI4D system for dimension measurement characteristics of industrially manufactured CNC parts of 1, 5, 20, 50 and 150 mm is shown in Table 1.

Table 1.
Industrial part measurements for repeatability (mm).
Dispersal measurement repeatability with metrologically selected industrial parts:
- (a)
- for 1.0000:0.0000÷0.0005 mm;
- (b)
- for 5.0000:0.0000÷0.0006 mm;
- (c)
- for 10.0000:0.0000÷0.0006 mm;
- (d)
- for 20.0000:0.0000÷0.0007 mm;
- (e)
- for 50.0000:0.0000÷0.0007 mm;
- (f)
- for 150.0000:0.0000÷0.0008 mm;
Measurement repeatability values with selected parts do not exceed the allowed tolerance of 0.0008 mm (according to European standards [48]: ISO 13385-1:2019).
4.2. Determination of Calculated Average Value
The determination of calculated average value through relation:
where p = part measurement, m = number of measurement and i = part index.
The average values of the 10 selected parts were calculated using relation (1), for the six nominal sizes (according to Table 1), as follows:
- (a)
- ;
- (b)
- ;
- (c)
- ;
- (d)
- ;
- (e)
- ;
- (f)
- ;
The repeatability of measurement and calculated average value for the selected parts do not exceed the permitted tolerance of 0.0008 mm (also according to calculation relation 1)
4.3. Determination of Variation Repeatability
The determination of variation repeatability is conducted through the mathematical relationship:
According to Relation (2), we have:
- (a)
- (b)
- (c)
- (d)
- (e)
- (f)
Measurement variation repeatability values for the selected parts are ≤0.001 mm.
4.4. Determination of Measurement Uncertainty
The determination of measurement uncertainty, through the mathematical relationship:
where Ic = measurement uncertainty and Vr = variation repeatability.
Applying the Relationship (3), we have:
- (a)
- Ic (1 mm) = 0.000126 mm;
- (b)
- Ic (5 mm) = 0.000183 mm;
- (c)
- Ic (10 mm) = 0.000223 mm;
- (d)
- Ic (20 mm) = 0.000234 mm;
- (e)
- Ic (50 mm) = 0.000367 mm;
- (f)
- Ic (150 mm) = 0.000389 mm;
The ISO 13385-1:2019 and Evaluation of the Uncertainty of Measurement in calibration EA-4/02 M: 2022 [42] recommend the measurement uncertainty value to be ≤0.0005 mm.
Comparing the uncertainties Ic(1 mm), Ic(5 mm), Ic(10 mm), Ic(20 mm), Ic(50 mm) and Ic(150 mm), it is found that they are lower than the value recommended by international and European standards.
So, industrial parts being measured with the MMI4D mechatronic system proves that the 4D mechatronic system is metrologically COMPLIANT and VALIDATED for measurement uncertainty.
4.5. Determination of Metrological Values for the MMI4D Mechatronic System
The determined metrological values were performed on standard metrological installations from the Metrological Laboratory for Lengths (a measuring machine in 3D Leitz-Germany type coordinates, with an accuracy of 0.000001 mm) from the National Institute of Research-Development for Mechatronics and Measurement Technique.
4.5.1. Metrological Values
According to Table 2, Table 3, Table 4, Table 5, Table 6 and Table 7, the metrological values for the six-dimensional categories of parts were obtained, as follows:
- (a)
- For the dimension of 1 mm (Table 2):
- (a1)
- Ten (10) standard gauge values were considered: 1.00060 mm; 1.00040 mm; 1.00050 mm; 1.00060 mm; 1.00040 mm; 1.00050 mm; 1.00050 mm; 1.00040 mm; 1.00050 mm; and 1.00040 mm;
- (a2)
- Metrological values were determined on the industrial parts compared to the standard gauge values considered, thus:
- (a2.1)
- For the standard gauge 1.00060 mm, ten metrological measurements were made, resulting: (as deviations, with variability between −0.00010 ÷ −0.00020 mm);
- (a2.2)
- For the standard gauge 1.00040 mm, ten metrological measurements were made, resulting: (as deviations, with variability between 0.00012 ÷ 0.00016 mm);
- (a2.3)
- for standard gauge 1.00050 mm, ten metrological measurements were made, resulting: (as deviations, with variability between 0.00004 ÷ 0.00010 mm);
- (a2.4)
- For the standard gauge 1.00060 mm, ten metrological measurements were made, resulting: (as deviations, with variability between 0.00000 ÷ −0.00004 mm);
- (a2.5)
- For the standard gauge 1.00040 mm, ten metrological measurements were made, resulting: (as deviations, with variability between 0.00022 ÷ −0.00020 mm);
- (a2.6)
- For the standard gauge 1.00050 mm, ten metrological measurements were made, resulting: (as deviations, with variability between 0.00001 ÷ 0.00007 mm);
- (a2.7)
- For the standard gauge 1.00050 mm, ten metrological measurements were made, resulting: (as deviations, with variability between 0.00007 ÷ 0.00012 mm);
- (a2.8)
- For the standard gauge 1.0040 mm, ten metrological measurements were made, resulting: (as deviations, with variability between 0.00020 ÷ −0.00019 mm);
- (a2.9)
- For the standard gauge 1.00050 mm, ten metrological measurements were made, resulting: (as deviations, with variability between −0.00006 ÷ 0.00012 mm);
- (a2.10)
- For the standard gauge 1.00040 mm, ten metrological measurements were made, resulting: (with constant value 0.00013 mm);
- (a3)
- Was determined:

Table 2.
Protocol of metrological measurements for determination of metrological values (E1mm).
Table 2.
Protocol of metrological measurements for determination of metrological values (E1mm).
| Metrological Values GaugeXi | Xi | X1 | X2 | X3 | X4 | X5 | X6 | X7 | X8 | X9 | X10 |
|---|---|---|---|---|---|---|---|---|---|---|---|
| Gauge Values Xi | 1.00060 | 1.00040 | 1.00050 | 1.00060 | 1.00040 | 1.00050 | 1.00050 | 1.00040 | 1.00050 | 1.00040 | |
| di1 = di1 − die | −0.00020 | 0.00016 | 0.00004 | −0.00002 | −0.00020 | 0.00007 | 0.00012 | −0.00019 | −0.00006 | 0.00013 | |
| di2 = di2 − die | −0.00020 | 0.00016 | 0.00004 | 0.00000 | −0.00018 | 0.00006 | 0.00007 | −0.00019 | 0.00009 | 0.00013 | |
| di3 = di3 − die | −0.00010 | 0.00016 | 0.00004 | −0.00004 | −0.00020 | 0.00010 | 0.00007 | 0.00019 | 0.00009 | 0.00013 | |
| di4 = di4 − die | −0.00010 | 0.00016 | 0.00006 | 0.00000 | 0.00017 | 0.00007 | 0.00010 | 0.00020 | 0.00009 | 0.00013 | |
| di5 = di5 − die | −0.00020 | 0.00012 | 0.00010 | 0.00000 | 0.00016 | 0.00001 | 0.00007 | 0.00018 | 0.00012 | 0.00013 | |
| di6 = di6 − die | −0.00020 | 0.00016 | 0.00010 | −0.00002 | 0.00022 | 0.00007 | 0.00012 | 0.00019 | 0.00010 | 0.00013 | |
| di7 = di7 − die | −0.00020 | 0.00014 | 0.00004 | −0.00004 | 0.00020 | 0.00006 | 0.00010 | 0.00019 | 0.00009 | 0.00013 | |
| di8 = di8 − die | −0.00010 | 0.00016 | 0.00006 | −0.00002 | 0.00018 | 0.00007 | 0.00008 | 0.00018 | 0.00010 | 0.00013 | |
| di9 = di9 − die | −0.00010 | 0.00014 | 0.00006 | −0.00002 | 0.00020 | 0.00006 | 0.00010 | 0.00019 | 0.00010 | 0.00013 | |
| di10 = di10 − die | −0.00010 | 0.00016 | 0.00004 | −0.00004 | 0.00017 | 0.00007 | 0.00008 | 0.00020 | 0.00009 | 0.00013 | |
| ] | |||||||||||
- (b)
- For the dimension of 5 mm (Table 3):
- (b1)
- Ten (10) standard gauge values were considered: 5.00040 mm; 5.00050 mm; 5.00060 mm; 5.00060 mm; 5.00070 mm; 5.00060mm; 5.00060 mm; 5.00060 mm; 5.00070 mm; and 5.00060 mm;
- (b2)
- Metrological values were determined on the industrial parts compared to the standard gauge values considered, thus:
- (b2.1)
- For the standard gauge 5.00040 mm, ten metrological measurements were made, resulting: (as deviations, with variability between 0.00010 ÷ 0.00020 mm);
- (b2.2)
- For the standard gauge 5.00050 mm, ten metrological measurements were made, resulting: (as deviations, with variability between 0.00008 ÷ 0.00010 mm);
- (b2.3)
- For the standard gauge 5.00060 mm, ten metrological measurements were made, resulting: (as deviations, with variability between -0.00002 ÷ 0.00004 mm);
- (b2.4)
- For the standard gauge 5.00060 mm, ten metrological measurements were made, resulting: (as deviations, with variability between -0.00005 ÷ −0.00002 mm);
- (b2.5)
- For the standard gauge 5.00070 mm, ten metrological measurements were made, resulting: (as deviations, with variability between -0.00015 ÷ −0.0004 mm);
- (b2.6)
- For the standard gauge 5.00060 mm, ten metrological measurements were made, resulting: (as deviations, with variability between -0.00006 ÷ −0.00004 mm);
- (b2.7)
- For the standard gauge 5.00060 mm, ten metrological measurements were made, resulting: (as deviations, with variability between -0.00006 ÷ −0.0004 mm);
- (b2.8)
- For standard gauge 5.00060 mm ten metrological measurements were made, resulting: (as deviations, with variability between -0.00002 ÷ 0.00002 mm);
- (b2.9)
- For the standard gauge 5.00070 mm, ten metrological measurements were made, resulting: (as deviations, with variability between -0.00010 ÷ −0.00006 mm);
- (b2.10)
- For the standard gauge 5.00060 mm, ten metrological measurements were made, resulting: (as deviations, with variability −0.00002 mm);
- (b3)
- Was determined: .

Table 3.
Protocol of metrological measurements for determination of metrological values (E5mm).
Table 3.
Protocol of metrological measurements for determination of metrological values (E5mm).
| Metrological Values GaugeXi | Xi | X1 | X2 | X3 | X4 | X5 | X6 | X7 | X8 | X9 | X10 |
|---|---|---|---|---|---|---|---|---|---|---|---|
| Gauge Values Xi | 5.00040 | 5.00050 | 5.00060 | 5.00060 | 5.00070 | 5.00060 | 5.00060 | 5.00060 | 5.00070 | 5.00060 | |
| di1 = di1 − die | 0.00020 | 0.00010 | −0.00001 | −0.00005 | −0.00004 | −0.00006 | −0.00006 | −0.00002 | −0.00006 | −0.00002 | |
| di2 = di2 − die | 0.00010 | 0.00008 | 0.00002 | −0.00003 | −0.00015 | −0.00004 | −0.00006 | 0.00000 | −0.00008 | −0.00002 | |
| di3 = di3 − die | 0.00020 | 0.00010 | 0.00003 | −0.00002 | −0.00011 | −0.00005 | −0.00005 | 0.00002 | −0.00008 | −0.00002 | |
| di4 = di4 − die | 0.00020 | 0.00008 | 0.00004 | −0.00004 | −0.00010 | −0.00006 | −0.00006 | 0.00000 | −0.00010 | −0.00002 | |
| di5 = di5 − die | 0.00010 | 0.00010 | −0.00001 | −0.00003 | −0.00011 | −0.00004 | −0.00005 | 0.00002 | −0.00008 | −0.00002 | |
| di6 = di6 − die | 0.00020 | 0.00010 | 0.00002 | −0.00005 | −0.00010 | −0.00005 | −0.00004 | 0.00000 | −0.00008 | −0.00002 | |
| di7 = di7 − die | 0.00010 | 0.00008 | −0.00001 | −0.00003 | 0.00011 | −0.00004 | −0.00005 | 0.00002 | −0.00006 | −0.00002 | |
| di8 = di8 − die | 0.00020 | 0.00008 | −0.00001 | −0.00004 | −0.00010 | −0.00005 | −0.00004 | 0.00000 | −0.00008 | −0.00002 | |
| di9 = di9 − die | 0.00010 | 0.00008 | −0.00002 | −0.00003 | −0.00011 | 0.00006 | −0.00005 | 0.00000 | −0.00006 | −0.00002 | |
| di10 = di10 − die | 0.00020 | 0.00010 | −0.00001 | −0.00005 | −0.00010 | −0.00005 | −0.00004 | 0.00002 | −0.00008 | −0.00002 | |
| ] | |||||||||||
- (c)
- For the dimension of 10 mm (Table 4):
- (c1)
- Ten (10) standard gauge values were considered: 10.00030 mm; 10.00040 mm; 10.00050 mm; 10.00050 mm; 10.00070 mm; 10.00070 mm; 10.00060 mm; 10.00070 mm; 10.00080 mm; and 10.00080 mm;
- (c2)
- Metrological values were determined on the industrial parts compared to the standard gauge values considered, thus:
- (c2.1)
- For the standard gauge 10.00030 mm, ten metrological measurements were made, resulting: (as deviations, with variability between 0.00020 ÷ 0.00040 mm);
- (c2.2)
- For the standard gauge 10.00040 mm, ten metrological measurements were made, resulting: (as deviations, with variability between 0.00016 ÷ 0.00019 mm);
- (c2.3)
- For the standard gauge 10.00050 mm, ten metrological measurements were made, resulting: (as deviations, with variability between 0.00010 ÷ 0.00011 mm);
- (c2.4)
- For the standard gauge 10.00050 mm, ten metrological measurements were made, resulting: (as deviations, with variability between 0.00010 ÷ 0.00012 mm);
- (c2.5)
- For the standard gauge 10.00070 mm, ten metrological measurements were made, resulting: (as deviations, with variability between −0.00009 ÷ −0.00007 mm);
- (c2.6)
- For the standard gauge 10.00070 mm, ten metrological measurements were made, resulting: (as deviations, with variability between −0.00006 ÷ −0.00005 mm);
- (c2.7)
- For the standard gauge 10.00060 mm, ten metrological measurements were made, resulting: (as deviations, with variability between 0.00001 ÷ 0.00003 mm);
- (c2.8)
- For the standard gauge 10.00070 mm, ten metrological measurements were made, resulting: (as deviations, with variability between −0.00005 ÷ 0.00004 mm);
- (c2.9)
- For the standard gauge 10.00080 mm, ten metrological measurements were made, resulting: (as deviations, with variability between −0.00014 ÷ 0.000013 mm);
- (c2.10)
- For the standard gauge 10.00080 mm, ten metrological measurements were made, resulting: (as deviations, with variability between −0.00019 ÷ −0.00012 mm);
- (c3)
- Was determined: .

Table 4.
Protocol of metrological measurements for determination of metrological values (E10mm).
Table 4.
Protocol of metrological measurements for determination of metrological values (E10mm).
| Metrological Values GaugeXi | Xi | X1 | X2 | X3 | X4 | X5 | X6 | X7 | X8 | X9 | X10 |
|---|---|---|---|---|---|---|---|---|---|---|---|
| Gauge Values Xi | 10.00030 | 10.00040 | 10.00050 | 10.00050 | 10.00070 | 10.00070 | 10.00060 | 10.00070 | 10.00080 | 10.00080 | |
| di1 = di1 − die | 0.00020 | 0.00018 | 0.00011 | 0.00010 | −0.00007 | −0.00005 | 0.00001 | 0.00004 | 0.00013 | −0.00018 | |
| di2 = di2 − die | 0.00030 | 0.00016 | 0.00010 | 0.00012 | −0.00008 | −0.00006 | 0.00002 | −0.00005 | −0.00014 | −0.00012 | |
| di3 = di3 − die | 0.00030 | 0.00017 | 0.00011 | 0.00011 | −0.00008 | −0.00006 | 0.00002 | −0.00005 | −0.00013 | −0.00018 | |
| di4 = di4 − die | 0.00020 | 0.00016 | 0.00010 | 0.00011 | −0.00007 | −0.00005 | 0.00003 | −0.00004 | −0.00014 | −0.00019 | |
| di5 = di5 − die | 0.00020 | 0.00017 | 0.00011 | 0.00010 | −0.00008 | −0.00005 | 0.00002 | −0.00004 | −0.00013 | −0.00019 | |
| di6 = di6 − die | 0.00020 | 0.00016 | 0.00010 | 0.00011 | −0.00009 | −0.00006 | 0.00002 | −0.00005 | −0.00014 | −0.00019 | |
| di7 = di7 − die | 0.00040 | 0.00017 | 0.00011 | 0.00012 | −0.00009 | −0.00005 | 0.00003 | −0.00005 | −0.00012 | −0.00019 | |
| di8 = di8 − die | 0.00030 | 0.00019 | 0.00010 | 0.00011 | −0.00008 | −0.00005 | 0.00001 | −0.00004 | −0.00013 | −0.00018 | |
| di9 = di9 − die | 0.00020 | 0.00017 | 0.00011 | 0.00010 | −0.00007 | −0.00006 | 0.00003 | −0.00005 | −0.00013 | −0.00018 | |
| di10 = di10 − die | 0.00020 | 0.00016 | 0.00011 | 0.00010 | −0.00007 | −0.00005 | 0.00002 | −0.00005 | −0.00014 | −0.00018 | |
| ] | |||||||||||
- (d)
- For the dimension of 20 mm (Table 5):
- (d1)
- Ten (10) standard gauge values were considered: 20.00030 mm; 20.00040 mm; 20.00040 mm; 20.00050 mm; 20.00050 mm; 20.00060 mm; 20.00060 mm; 20.00070 mm; 20.00070 mm; and 20.00060 mm;
- (d2)
- Metrological values were determined on the industrial parts compared to the standard gauge values considered, thus:
- (d2.1)
- For the standard gauge 20.00030 mm, ten metrological measurements were made, resulting: (as deviations, with variability between 0.00020 ÷ 0.00030 mm);
- (d2.2)
- For the standard gauge 20.00040 mm, ten metrological measurements were made, resulting: (as deviations, with variability between 0.00016 ÷ 0.00017 mm);
- (d2.3)
- For the standard gauge 20.00040 mm, ten metrological measurements were made, resulting: (as deviations, with variability between 0.00017 ÷ 0.00019 mm);
- (d2.4)
- For the standard gauge 20.00050 mm, ten metrological measurements were made, resulting: (as deviations, with variability between 0.00011 ÷ 0.00012 mm);
- (d2.5)
- For the standard gauge 20.00050 mm, ten metrological measurements were made, resulting: (as deviations, with variability between 0.00016 ÷ 0.00019 mm);
- (d2.6)
- For the standard gauge 20.00060 mm, ten metrological measurements were made, resulting: (as deviations, with variability between 0.00009 ÷ 0.00010 mm);
- (d2.7)
- For the standard gauge 20.00060 mm, ten metrological measurements were made, resulting: (as deviations, with variability between 0.00006 ÷ 0.00009 mm);
- (d2.8)
- For the standard gauge 20.00070 mm, ten metrological measurements were made, resulting: (as deviations, with variability between −0.00014 ÷ −0.00012 mm);
- (d2.9)
- For the standard gauge 20.00070 mm, ten metrological measurements were made, resulting: (as deviations, with variability between −0.00012 ÷ −0.00010 mm);
- (d2.10)
- For the standard gauge 20.00060 mm, ten metrological measurements were made, resulting: (as deviations, with variability between −0.00003 ÷ −0.00002 mm);
- (d3)
- Was determined: .

Table 5.
Protocol of metrological measurements for determination of metrological values (E20mm).
Table 5.
Protocol of metrological measurements for determination of metrological values (E20mm).
| Metrological Values GaugeXi | Xi | X1 | X2 | X3 | X4 | X5 | X6 | X7 | X8 | X9 | X10 |
|---|---|---|---|---|---|---|---|---|---|---|---|
| Gauge Values Xi | 20.00030 | 20.00040 | 20.00040 | 20.00050 | 20.00050 | 20.00060 | 20.00060 | 20.00070 | 20.00070 | 20.00060 | |
| di1 = di1 − die | 0.00030 | 0.00016 | 0.00019 | 0.00012 | 0.00018 | 0.00010 | 0.00006 | −0.00012 | −0.00010 | −0.00003 | |
| di2 = di2 − die | 0.00020 | 0.00017 | 0.00018 | 0.00011 | 0.00016 | 0.00009 | 0.00007 | −0.00013 | −0.00011 | −0.00003 | |
| di3 = di3 − die | 0.00020 | 0.00016 | 0.00017 | 0.00011 | 0.00016 | 0.00010 | 0.00008 | −0.00014 | −0.00012 | −0.00002 | |
| di4 = di4 − die | 0.00030 | 0.00017 | 0.00018 | 0.00012 | 0.00017 | 0.00010 | 0.00007 | −0.00013 | −0.00011 | −0.00002 | |
| di5 = di5 − die | 0.00030 | 0.00017 | 0.00017 | 0.00011 | 0.00016 | 0.00009 | 0.00008 | −0.00012 | −0.00012 | −0.00002 | |
| di6 = di6 − die | 0.00030 | 0.00017 | 0.00017 | 0.00011 | 0.00017 | 0.00009 | 0.00008 | −0.00013 | −0.00011 | −0.00002 | |
| di7 = di7 − die | 0.00020 | 0.00016 | 0.00018 | 0.00012 | 0.00016 | 0.00010 | 0.00009 | −0.00014 | −0.00010 | −0.00002 | |
| di8 = di8 − die | 0.00020 | 0.00016 | 0.00019 | 0.00012 | 0.00019 | 0.00009 | 0.00007 | −0.00013 | −0.00011 | −0.00002 | |
| di9 = di9 − die | 0.00030 | 0.00017 | 0.00018 | 0.00012 | 0.00018 | 0.00009 | 0.00008 | −0.00012 | −0.00012 | −0.00003 | |
| di10 = di10 − die | 0.00030 | 0.00016 | 0.00017 | 0.00011 | 0.00017 | 0.00010 | 0.00008 | −0.00013 | −0.00010 | −0.00002 | |
| ] | |||||||||||
- (e)
- For the dimension of 50 mm (Table 6):
- (e1)
- Ten (10) standard gauge values were considered: 50.00020 mm; 50.00030 mm; 50.00040 mm; 50.00050 mm; 50.00050 mm; 50.00050 mm; 50.00060 mm; 50.00060 mm; 50.00070 mm; and 50.00070 mm;
- (e2)
- Metrological values were determined on the industrial parts compared to the standard gauge values considered, thus:
- (e2.1)
- For the standard gauge 50.00020 mm, ten metrological measurements were made, resulting: (as deviations, with variability between 0.00030 ÷ 0.00040 mm);
- (e2.2)
- For the standard gauge 50.00030 mm, ten metrological measurements were made, resulting: (as deviations, with variability between 0.00025 ÷ 0.00026 mm);
- (e2.3)
- For the standard gauge 50.00040 mm, ten metrological measurements were made, resulting: (as deviations, with variability between 0.00018 ÷ 0.00019 mm);
- (e2.4)
- For the standard gauge 50.00050 mm, ten metrological measurements were made, resulting: (as deviations, with variability between 0.00012 ÷ 0.00014 mm);
- (e2.5)
- For the standard gauge 50.00050 mm, ten metrological measurements were made, resulting: (as deviations, with variability between 0.00016 ÷ 0.00017 mm);
- (e2.6)
- For the standard gauge 50.00050 mm, ten metrological measurements were made, resulting: (as deviations, with variability between 0.00020 ÷ 0.00022 mm);
- (e2.7)
- For the standard gauge 50.00060 mm, ten metrological measurements were made, resulting: (as deviations, with variability between 0.00008 ÷ 0.00009 mm);
- (e2.8)
- For the standard gauge 50.00060 mm, ten metrological measurements were made, resulting: (as deviations, with variability between 0.00015 ÷ 0.00016 mm);
- (e2.9)
- For the standard gauge 50.00070 mm, ten metrological measurements were made, resulting: (as deviations, with variability between −0.00008 ÷ −0.00007 mm);
- (e2.10)
- For the standard gauge 50.00070 mm, ten metrological measurements were made, resulting: (as deviations, with variability between −0.00018 ÷ −0.00017 mm);
- (e3)
- Was determined: .

Table 6.
Protocol of metrological measurements for determination of metrological values (E50mm).
Table 6.
Protocol of metrological measurements for determination of metrological values (E50mm).
| Metrological Values GaugeXi | Xi | X1 | X2 | X3 | X4 | X5 | X6 | X7 | X8 | X9 | X10 |
|---|---|---|---|---|---|---|---|---|---|---|---|
| Gauge Values Xi | 50.00020 | 50.00030 | 50.00040 | 50.00050 | 50.00050 | 50.00050 | 50.00060 | 50.00060 | 50.00070 | 50.00070 | |
| di1 = di1 − die | 0.00030 | 0.00025 | 0.00019 | 0.00014 | 0.00017 | 0.00022 | 0.00009 | 0.00016 | −0.00007 | −0.00017 | |
| di2 = di2 − die | 0.00040 | 0.00025 | 0.00018 | 0.00013 | 0.00016 | 0.00021 | 0.00008 | 0.00015 | −0.00008 | −0.00018 | |
| di3 = di3 − die | 0.00040 | 0.00026 | 0.00018 | 0.00012 | 0.00017 | 0.00021 | 0.00008 | 0.00016 | −0.00008 | −0.00018 | |
| di4 = di4 − die | 0.00030 | 0.00025 | 0.00019 | 0.00012 | 0.00016 | 0.00020 | 0.00009 | 0.00015 | −0.00007 | −0.00018 | |
| di5 = di5 − die | 0.00030 | 0.00025 | 0.00019 | 0.00013 | 0.00017 | 0.00021 | 0.00009 | 0.00015 | −0.00008 | −0.00017 | |
| di6 = di6 − die | 0.00040 | 0.00026 | 0.00018 | 0.00014 | 0.00016 | 0.00020 | 0.00008 | 0.00016 | −0.00007 | −0.00017 | |
| di7 = di7 − die | 0.00040 | 0.00025 | 0.00019 | 0.00013 | 0.00017 | 0.00021 | 0.00009 | 0.00016 | −0.00007 | −0.00018 | |
| di8 = di8 − die | 0.00040 | 0.00026 | 0.00018 | 0.00014 | 0.00016 | 0.00022 | 0.00008 | 0.00015 | −0.00008 | −0.00017 | |
| di9 = di9 − die | 0.00030 | 0.00026 | 0.00019 | 0.00013 | 0.00016 | 0.00022 | 0.00009 | 0.00016 | −0.00007 | −0.00018 | |
| di10 = di10 − die | 0.00040 | 0.00025 | 0.00019 | 0.00014 | 0.00017 | 0.00021 | 0.00008 | 0.00015 | −0.00008 | −0.00018 | |
| ] | |||||||||||
- (f)
- For the dimension of 150 mm (Table 7):
- (f1)
- Ten (10) standard gauge values were considered: 150.00030 mm; 150.00040 mm; 150.00040 mm; 150.00050 mm; 150.00050 mm; 150.00050 mm; 150.00060 mm; 150.00060 mm; 150.00070 mm; and 150.00070 mm;
- (f2)
- Metrological values were determined on the industrial parts compared to the standard gauge values considered, thus:
- (f2.1)
- For the standard gauge 150.00030 mm, ten metrological measurements were made. resulting: (as deviations, with variability between 0.00020 ÷ 0.00030 mm);
- (f2.2)
- For the standard gauge 150.00040 mm, ten metrological measurements were made, resulting: (as deviations, with variability between 0.00021 ÷ 0.00022 mm);
- (f2.3)
- For the standard gauge 150.00040 mm, ten metrological measurements were made, resulting: (as deviations, with variability between 0.00027 ÷ 0.00028 mm);
- (f2.4)
- For the standard gauge 150.00050 mm, ten metrological measurements were made, resulting: (as deviations, with variability between 0.00023 ÷ 0.00024 mm);
- (f2.5)
- For the standard gauge 150.00050 mm, ten metrological measurements were made, resulting: (as deviations, with variability between 0.00027 ÷ 0.00028 mm);
- (f2.6)
- For the standard gauge 150.00050 mm, ten metrological measurements were made, resulting: (as deviations, with variability between 0.00029 ÷ 0.00030 mm);
- (f2.7)
- For the standard gauge 150.00060 mm, ten metrological measurements were made, resulting: (as deviations, with variability between 0.00025 ÷ 0.00028 mm);
- (f2.8)
- For the standard gauge 150.00060 mm, ten metrological measurements were made, resulting: (as deviations, with variability between 0.00021 ÷ 0.00023 mm);
- (f2.9)
- For the standard gauge 150.00070 mm, ten metrological measurements were made, resulting: (as deviations, with variability between 0.00017 ÷ 0.00018 mm);
- (f2.10)
- For the standard gauge 150.00070 mm, ten metrological measurements were made, resulting: (as deviations, with variability -0.00010 mm);
- (f3)
- was determined: .

Table 7.
Protocol of metrological measurements for determination of metrological values (E150mm).
Table 7.
Protocol of metrological measurements for determination of metrological values (E150mm).
| Metrological Values GaugeXi | Xi | X1 | X2 | X3 | X4 | X5 | X6 | X7 | X8 | X9 | X10 |
|---|---|---|---|---|---|---|---|---|---|---|---|
| Gauge Values Xi | 150.00030 | 150.00040 | 150.00040 | 150.00050 | 150.00050 | 150.00050 | 150.00060 | 150.00060 | 150.00070 | 150.00070 | |
| di1 = di1 − die | 0.00030 | 0.00021 | 0.00028 | 0.00024 | 0.00028 | 0.00030 | 0.00026 | 0.00022 | 0.00018 | −0.00010 | |
| di2 = di2 − die | 0.00030 | 0.00022 | 0.00027 | 0.00023 | 0.00027 | 0.00029 | 0.00025 | 0.00023 | 0.00017 | −0.00010 | |
| di3 = di3 − die | 0.00030 | 0.00021 | 0.00028 | 0.00023 | 0.00028 | 0.00029 | 0.00025 | 0.00021 | 0.00017 | −0.00010 | |
| di4 = di4 − die | 0.00030 | 0.00021 | 0.00028 | 0.00024 | 0.00028 | 0.00029 | 0.00026 | 0.00021 | 0.00018 | −0.00010 | |
| di5 = di5 − die | 0.00020 | 0.00022 | 0.00027 | 0.00024 | 0.00027 | 0.00029 | 0.00028 | 0.00022 | 0.00018 | −0.00010 | |
| di6 = di6 − die | 0.00020 | 0.00021 | 0.00027 | 0.00023 | 0.00028 | 0.00030 | 0.00025 | 0.00022 | 0.00017 | −0.00010 | |
| di7 = di7 − die | 0.00030 | 0.00021 | 0.00028 | 0.00023 | 0.00027 | 0.00030 | 0.00025 | 0.00022 | 0.00017 | −0.00010 | |
| di8 = di8 − die | 0.00020 | 0.00022 | 0.00027 | 0.00023 | 0.00027 | 0.00029 | 0.00026 | 0.00021 | 0.00017 | −0.00010 | |
| di9 = di9 − die | 0.00030 | 0.00021 | 0.00028 | 0.00024 | 0.00028 | 0.00029 | 0.00027 | 0.00021 | 0.00018 | −0.00010 | |
| di10 = di10 − die | 0.00030 | 0.00022 | 0.00027 | 0.00023 | 0.00027 | 0.00030 | 0.00025 | 0.00023 | 0.00017 | −0.00010 | |
| ] | |||||||||||
4.5.2. Determining Accuracy
Determining accuracy error (Ej), through relation:
for relation (4) is calculated ;
Then, it is determined and ;
where
Similarly, it is calculated:
- Accuracy error () for 5 mm. is:
- Accuracy error () for 10 mm is:
- Accuracy error () for 20 mm is:
- Accuracy error () for 50 mm is:
- Accuracy error () for 150 mm is:
5. Discussion of Measuring Results
The measurements performed on the gauges of 1 mm, 5 mm, 10 mm, 20 mm, 50 mm and 150 mm respect the ISO 13385-1:2019 and Evaluation of the Uncertainty of Measurement in calibration EA-4/02 M: 2022. Chapter 3 describes the procedure and the MMI4D used system for measurements. The obtained measurements are presented in seven tables.
The gauges of 1 mm, 5 mm, 10 mm, 20 mm, 50 mm and 150 mm are each measured 10 times, and the data collected are used to calculate repeatability. According to Table 1, we have dispersal measurement repeatability with metrologically selected industrial parts. For the 1 mm gauge, we have a dispersal from 0.0000 mm to 0.0005 mm. For the 5 mm gauge, we have a dispersal from 0.0000 mm to 0.0006 mm. For the 10 mm gauge, we have a dispersal from 0.0000 mm to 0.0006 mm. For the 20 mm gauge, we have a dispersal from 0.0000 mm to 0.0007 mm. For the 50 mm gauge, we have a dispersal from 0.0000 mm to 0.0007 mm. For the 150 mm gauge, we have a dispersal from 0.0000 mm to 0.0008 mm. According to Table 1, the average values for the nominal values are obtained and: for the 1 mm gauge, 1.00041 mm is obtained; for the 5 mm gauge, 1.00047 mm is obtained; for the 10 mm gauge, 1.00055 mm is obtained; for the 20 mm gauge, 1.00057 mm is obtained; for the 50 mm gauge, 1.00063 mm is obtained; and for the 150 mm gauge, 1.00070 mm is obtained. All the results obtained are ≤0.0008 mm and respect the ISO 13385-1:2019 standard.
According to relation 2, the variation repeatability is obtained: for the 1 mm gauge, ≌0.00014 mm is obtained; for the 5 mm gauge, ≌0.00028 mm is obtained; for the 10 mm gauge, ≌0.00031 mm is obtained; for the 20 mm gauge, ≌0.00046 mm is obtained; for the 50 mm gauge, ≌0.00078 mm is obtained; and for the 150 mm gauge, ≌0.00095 mm is obtained. The values obtained are ≤0.001 mm and respect the ISO 13385-1:2019 and Evaluation of the Uncertainty of Measurement in calibration EA-4/02 M: 2022.
According to relation 3, and using the variation repeatability calculated with relation 2, the measurement uncertainty is obtained: for the 1 mm gauge, ≌0.000126 mm is obtained; for the 5 mm gauge, ≌0.000183 mm is obtained; for the 10 mm gauge, ≌0.000223 mm is obtained; for the 20 mm gauge, ≌0.000234 mm is obtained; for the 50 mm gauge, ≌0.000367 mm is obtained; and for the 150 mm gauge, ≌0.000389 mm is obtained. The values obtained are ≤0.0005 mm and respect the ISO 13385-1:2019 and Evaluation of the Uncertainty of Measurement in calibration EA-4/02 M: 2022.
According to Table 2, Table 3, Table 4, Table 5, Table 6 and Table 7, the metrological values for six gauges were obtained. Ten measurements were made for each one of the six used gauges.
- -
- For the 1 mm gauge, 1.00060 mm; 1.00040 mm; 1.00050 mm; 1.00060 mm; 1.00040 mm; 1.00050 mm; 1.00050 mm; 1.00040 mm; 1.00050 mm; and 1.00040 mm is considered;
- -
- For the 5 mm gauge, 5.00040 mm; 5.00050 mm; 5.00060 mm; 5.00060 mm; 5.00070 mm; 5.00060 mm; 5.00060 mm; 5.00060 mm; 5.00070 mm; and 5.00060 mm is considered;
- -
- For the 10 mm gauge, 10.00030 mm; 10.00040 mm; 10.00050 mm; 10.00050 mm; 10.00070 mm; 10.00070 mm; 10.00060 mm; 10.00070 mm; 10.00080 mm; and 10.00080 mm is considered;
- -
- For the 20 mm gauge, 20.00030 mm; 20.00040 mm; 20.00040 mm; 20.00050 mm; 20.00050 mm; 20.00060 mm; 20.00060 mm; 20.00070 mm; 20.00070 mm; and 20.00060 mm is considered;
- -
- For the 50 mm gauge, 50.00020 mm; 50.00030 mm; 50.00040 mm; 50.00050 mm; 50.00050 mm; 50.00050 mm; 50.00060 mm; 50.00060 mm; 50.00070 mm; and 50.00070 mm is considered;
- -
- For the 150 mm gauge, 150.00030 mm; 150.00040 mm; 150.00040 mm; 150.00050 mm; 150.00050 mm; 150.00050 mm; 150.00060 mm; 150.00060 mm; 150.00070 mm; and 150.00070 mm is considered;
- -
- For the 1 mm gauge, it was determined: ∑∑dij = 0.00592 mm;
- -
- For the 5 mm gauge, it was determined: ∑∑dij = −0.00042 mm;
- -
- For the 10 mm gauge, it was determined: ∑∑dij = 0.00199 mm.
- -
- For the 20 mm gauge, it was determined: ∑∑dij = 0.00797 mm;
- -
- For the 50 mm gauge, it was determined: ∑∑dij = 0.01297 mm;
- -
- For the 150 mm gauge, it was determined: ∑∑dij = 0.02112 mm.
According to relation 4 and the obtained values from Table 2, Table 3, Table 4, Table 5, Table 6 and Table 7, the accuracy is determined and is obtained as: 0.0000592 mm for the 1 mm gauge; 0.0000042 mm for the 5 mm gauge; 0.0000199 mm for the 10 mm gauge; 0.0000797 mm for the 20 mm gauge; 0.001297 mm for the 50 mm gauge; and 0.0002112 mm for the 150 mm gauge.
The MMI4D system respects the ISO 13385-1:2019 and Evaluation of the Uncertainty of Measurement in calibration EA-4/02 M: 2022, and the obtained data through the measurements confirm that it is an accurate and precise system in measurements tasks and also is validated for metrological and industrial measurements.
A limitation of the system is related to internet speed when commanded remotely. In this situation, the image observed on the computer display has a maximum delay of 3 s.
In terms of economics, the benefit of the MMI4D system is that the equipment can be remote controlled (from a distance), reducing the cost of its operation, but also a reduction in maintenance costs (maintenances cost savings). For example, if the one who operates the system is in another city, a human from the system location can put the piece for measurement on the table and the measurement is done from a distance by the operator.
6. Conclusions and Perspectives
This study presented a precision and accurate mechatronic system for performing measurement operations, as previously illustrated. The development of precision and ac-curate systems are at the core of the strategy of INCDMTM Bucharest. These systems can be controlled and monitored from a distance in order to reduce the time of the measurements or the equipment’s service. The mechatronic system consists of a submechatronic system in 4D, highly precise 3D probe, adjustable positioning system, anti-vibration table system, frame for protection, protective walls made of transparent plastic, sensory barriers, IP camera, command-and-control panel, PC central unit, PC monitor, router, linear electric system X, linear electric system Y, linear electric system Z, electrical rotation system R and parallel electric gripper system. Along with the presentation of the MMI4D system the paper describes the hardware and software component, command-and-control panel, data acquisition steps and how the remote connection is performed. The MMI4D system can be controlled by three modes: from the plant, using the HMI display or the joystick, and also remotely according to the presented procedure. Furthermore, the paper presents experimental measurements with the MMI4D system used for metrological validation. Parts of 1 mm, 5 mm, 10 mm, 20 mm, 50 mm and 150 mm are used for the measurement, calculation and determination of repeatability and average value, variation repeatability, metrological values and accuracy error.
The Innovative inputs of this paper are the construction of the MMI4D on VDI 2206 standards, the procedure for data acquisition, the procedure for data analysis according to standards and the remote function. The remote function is important in terms of economics and refers to the reduction of costs for expert support if the human operator needs it. In addition, the remote control reduces the costs of maintenance by providing access to MMI4D facilities from a distance and so there is no need for an expert to travel to the on-site location. The MMI4D program can be changed accordingly to a specific type of industry or desired application. With the remote control component, the equipment is fully integrated in industrial processes.
Starting from the conception, design and realization of the MMI4D mechatronic system, future research and concept development are highlighted below:
- Research on the realization of a mechatronic ecosystem to improve the speed and stability with which a complex system (MMI4D system) is controlled and monitored remotely;
- Research on the implementation of an improved intelligent constructive solution for the protection of the human operator;
- Research on the development of the complex system (MMI4D) by adding a complex collaborative robot subsystem that offers the possibility to add work operations such as video identification in the workspace, automatic handling of parts and others;
- Research on the development of the MMI4D system by adding a mobile platform subsystem that offers the possibility to access the space around the MMI4D system so that work paths can be implemented for the positions of the parts analyzed with the mentioned system;
- Research on the mapping of the workspace so that we can accurately identify, at any time, the position of the analyzed parts at a defined time;
- Research on the development of a virtual application that offers the possibility to train an operator to operate the system (MMI4D);
- Research on the implementation of the design and development of a data acquisition system (DAQ) with statistical parameters for vibration signals [49];
- Research on the identification and implementation of an open-design movement concept [50].
Author Contributions
The authors’ contributions for this paper were multiple and are presented as follows: conceptualization, I.I. and J.M.; methodology, I.I. and J.M.; software, I.I.; validation, S I.I. and J.M.; formal analysis, I.I. and J.M.; investigation, I.I.; resources, I.I. and J.M.; data curation, I.I. writing—original draft preparation, I.I.; writing—review and editing, I.I. and J.M.; visualization, I.I. and J.M.; supervision, I.I.; project administration, I.I. All authors have read and agreed to the published version of the manuscript.
Funding
This work was supported by the project “Increasing INCDMTM performance and international involvement by supporting expertise in advanced mechatronic technologies—PERFORM-MECH”, financed by The Ministry of Research, Innovation, and Digitalization, in the framework of Programme 1—Development of the national research and development system, Sub-programme 1.2—Institutional Performance—Projects for financing excellence in Research, Development and Innovation, Contract no. 3PFE/2021. The authors are grateful, too, to FCT—Fundação para a Ciência e Tecnologia (Portugal), who partially financially supported this work through the RD Units Project Scope: UIDP/04077/2020 and UIDB/04077/2020.
Data Availability Statement
The data presented in this study are available on request from the respective authors. The data are not publicly available due to being part of an industrial application study.
Acknowledgments
The authors are really grateful to INCDMTM Bucharest. The design execution and testing parts was an extremely delicate process due to its innovative character and precision of execution. For this reason, we preferred to make them on specialized 3D printing equipment, existing in the CERMISO center from INCDMTM Bucharest. In this sense, an EP-M250 Shining 3D equipment was used for 3D metal printing and a JCR 1000 Dual Sicnova equipment for 3D plastic printing. Access to these modern technologies has greatly facilitated the process of adapting the elements mentioned above to the executed mechatronic system, eliminating costs and additional time generated by the classic casting technology.
Conflicts of Interest
The authors declare no conflict of interest.
References
- Brousseau, E.B.; Dimov, S.S.; Pham, D.T. Some recent advances in multi-material micro- and nano-manufacturing. Int. J. Adv. Manuf. Technol. 2010, 47, 161–180. [Google Scholar] [CrossRef]
- Krishnamoorthy, S.; Dua, A.; Gupta, S. Role of emerging technologies in future IoT-driven healthcare 4.0 technologies: A survey, current challenges and future directions. J. Ambient. Intell. Humaniz. Comput. 2021. [Google Scholar] [CrossRef]
- Tang, J.; Cao, Q.; Tulevski, G.; Jenkins, K.A.; Nela, L.; Farmer, D.B.; Han, S. Flexible CMOS integrated circuits based on carbon nanotubes with sub-10 ns stage delays. Nat. Electron. 2018, 1, 191–196. [Google Scholar] [CrossRef]
- Sima, D. Decisive aspects in the evolution of microprocessors. Proc. IEEE 2004, 92, 1896–1926. [Google Scholar] [CrossRef]
- Ilie, C.; Popa, M.; Prioteasa, P.; Chiriţǎ, I.; Tǎnase, N. Applications of liga technology for the development of micromechanical systems. UPB Sci. Bull. Ser. D Mech. Eng. 2011, 73, 137–150. [Google Scholar]
- Garcia, R. Nanomechanical mapping of soft materials with the atomic force microscope: Methods, theory and applications. Chem. Soc. Rev. 2020, 49, 5850–5884. [Google Scholar] [CrossRef]
- Gauthier, M. Microhandling Strategies and Microassembly in Submerged Medium; Wiley: Hoboken, NJ, USA, 2011; pp. 189–224. [Google Scholar] [CrossRef]
- Díaz, M.; Martín, C.; Rubio, B. State-of-the-art, challenges, and open issues in the integration of internet of things and cloud computing. J. Netw. Comput. Appl. 2016, 67, 99–117. [Google Scholar] [CrossRef]
- Malhotra, P.; Singh, Y.; Anand, P.; Bangotra, D.K.; Singh, P.K.; Hong, W. Internet of things: Evolution, concerns and security challenges. Sensors 2021, 21, 1809. [Google Scholar] [CrossRef]
- Sousa, J.; Mendonça, J.P.; Machado, J. A generic interface and a framework designed for industrial metrology integration for the internet of things. Comput. Ind. 2022, 138, 103632. [Google Scholar] [CrossRef]
- Vermesan, O.; Bacquet, J. Internet of Things—The Call of the Edge: Everything Intelligent Everywhere; CRC Press: Boca Raton, FL, USA, 2020; pp. 1–392. [Google Scholar]
- Freina, L.; Bottino, R.; Tavella, M. From e-learning to VR-learning: An example of learning in an immersive virtual world. J. E-Learn. Knowl. Soc. 2016, 12, 101–113. [Google Scholar]
- Smith, M.; Maiti, A.; Maxwell, A.D.; Kist, A.A. Augmented and mixed reality features and tools for remote laboratory experiments. Int. J. Online Eng. 2016, 12, 45–52. [Google Scholar] [CrossRef][Green Version]
- Vinitha, K.; Ambrose Prabhu, R.; Bhaskar, R.; Hariharan, R. Review on industrial mathematics and materials at industry 1.0 to industry 4.0. Mater. Today Proc. 2020, 33, 3956–3960. [Google Scholar] [CrossRef]
- Xu, J.; Wang, X.; Wang, C.; Yuan, L.; Chen, W.; Bao, J.; Su, Q.; Xu, Z.; Wang, C.; Wang, Z.; et al. A review on Micro/Nanoforming to fabricate 3D metallic structures. Adv. Mater. 2021, 33, 2000893. [Google Scholar] [CrossRef] [PubMed]
- Pradeep Raja, C.; Ramesh, T. Influence of size effects and its key issues during microforming and its associated processes—A review. Eng. Sci. Technol. Int. J. 2021, 24, 556–570. [Google Scholar] [CrossRef]
- Zheng, T.; Ardolino, M.; Bacchetti, A.; Perona, M. The applications of industry 4.0 technologies in manufacturing context: A systematic literature review. Int. J. Prod. Res. 2021, 59, 1922–1954. [Google Scholar] [CrossRef]
- Ivanov, D.; Tang, C.S.; Dolgui, A.; Battini, D.; Das, A. Researchers’ perspectives on industry 4.0: Multi-disciplinary analysis and opportunities for operations management. Int. J. Prod. Res. 2021, 59, 2055–2078. [Google Scholar] [CrossRef]
- Oztemel, E.; Gursev, S. Literature review of industry 4.0 and related technologies. J. Intell. Manuf. 2020, 31, 127–182. [Google Scholar] [CrossRef]
- Ghobakhloo, M. Industry 4.0, digitization, and opportunities for sustainability. J. Clean. Prod. 2020, 252, 119869. [Google Scholar] [CrossRef]
- Budzik, G.; Woźniak, J.; Paszkiewicz, A.; Przeszłowski, Ł.; Dziubek, T.; Dębski, M. Methodology for the quality control process of additive manufacturing products made of polymer materials. Materials 2021, 14, 2202. [Google Scholar] [CrossRef]
- Ilie, I.; Ardeleanu, M.N.; Soare, V.A. Mems measurement using a plastic and metal arm integrated into a mechatronic system. Int. J. Mechatron. Appl. Mech. 2022, 11, 259–265. [Google Scholar] [CrossRef]
- Ferrag, M.A.; Maglaras, L.; Moschoyiannis, S.; Janicke, H. Deep learning for cyber security intrusion detection: Approaches, datasets, and comparative study. J. Inf. Secur. Appl. 2020, 50, 102419. [Google Scholar] [CrossRef]
- Campos, J.C.; Machado, J.; Seabra, E. Property patterns for the formal verification of automated production systems. IFAC Proc. Vol. 2018, 41, 5107–5112. [Google Scholar] [CrossRef]
- Kunz, G.; Machado, J.; Perondi, E.; Vyatkin, V. A Formal Methodology for Accomplishing IEC 61850 Real-Time Communication Requirements. IEEE Trans. Ind. Electron. 2017, 64, 6582–6590. [Google Scholar] [CrossRef]
- Onososen, A.O.; Musonda, I.; Ramabodu, M. Construction robotics and Human–Robot teams research methods. Buildings 2022, 12, 1192. [Google Scholar] [CrossRef]
- Dumitriu, D.; Ionescu, M.; Melinte, D.O. New scissor-grasping tool for parallel grippers, ensuring stroke enhancement. In Proceedings of the 36th Danubia Adria Symposium on Advances in Experimental Mechanics, DAS 2019, Plzeň, Czech Republic, 24–27 September 2019; pp. 131–132. [Google Scholar]
- Ardeleanu, M.; Ionita, M.; Ivan, A.; Gurgu, V. Innovative bidimensional absolute transducer based on video detection for positioning into micro assembly processes. In Applied Mechanics and Materials; Trans Tech Publications Ltd.: Wollerau, Switzerland, 2014; Volume 658, pp. 535–540. [Google Scholar] [CrossRef]
- Atanasescu, A.; Ancuţa, P.N.; Sorea, S.; Anghel, C.; Stanciu, D.I. Conceptual model of computerized nationwide scale multiparameter monitoring system for drinking water quality. Int. J. Mechatron. Appl. Mech. 2017, 1, 154–158. [Google Scholar]
- Ancuța, P.N.; Constantin, A.; Munteanu, I.S.; Gornoavă, V. Studyon Improving the Measurement Accuracyby Touch Probe witha Cobotic Multi-Application Platform. Int. J. Mechatron. Appl. Mech. 2022, 11, 243–248. [Google Scholar] [CrossRef]
- Voicu, A.C.; Gheorghe, G.I. Complex 3D measuring by multiple laser scanning of automotive parts. In Advanced Materials Research; Trans Tech Publications Ltd.: Wollerau, Switzerland, 2014; Volume 837, pp. 511–516. [Google Scholar] [CrossRef]
- Munteanu, M.; Bechet, P.; Rusu, C.; Micu, D.D.; Munteanu, R.A.; Moga, R.; Amza, C. Application of virtual instrumentation for transmitting and processing ecg signals. In Proceedings of the International Conference on Advancements of Medicine and Health Care through Technology, Cluj-Napoca, Romania, 5–7 June 2014; Volume 44, pp. 215–218. [Google Scholar] [CrossRef]
- El Zaatari, S.; Marei, M.; Li, W.; Usman, Z. Cobot programming for collaborative industrial tasks: An overview. Robot. Auton. Syst. 2019, 116, 162–180. [Google Scholar] [CrossRef]
- Zakaria, M.I.; Norizan, M.N.; Isa, M.M.; Jamlos, M.F.; Mustapa, M. Comparative analysis on virtual private network in the internet of things gateways. Indones. J. Electr. Eng. Comput. Sci. 2022, 28, 488–497. [Google Scholar] [CrossRef]
- Vitalii, T.; Anna, B.; Kateryna, H.; Hrebeniuk, D. Method of building dynamic multi-hop VPN chains for ensuring security of terminal access systems. In Proceedings of the 2020 IEEE International Conference on Problems of Infocommunications Science and Technology, PIC S and T 2020, Kharkiv, Ukraine, 6–9 October 2020; pp. 613–618. [Google Scholar] [CrossRef]
- Graessler, I.; Hentze, J. The new V-Model of VDI 2206 and its validation. at-Automatisierungstechnik 2020, 68, 312–324. [Google Scholar] [CrossRef]
- Eigner, M.; Dickopf, T.; Apostolov, H. The Evolution of the V-Model: From VDI 2206 to a System Engineering Based Approach for Developing Cybertronic Systems. In Proceedings of the 14th IFIP WG 5.1 International Conference, PLM 2017, Seville, Spain, 10–12 July 2017; pp. 382–393. [Google Scholar] [CrossRef]
- Gräßler, I.; Wiechel, D.; Roesmann, D.; Thiele, H. V-model based development of cyber-physical systems and cyber-physical production systems. Procedia CIRP 2021, 100, 253–258. [Google Scholar] [CrossRef]
- VDI/VDE 2206, Development of Mechatronic and Cyber-Physical Systems. Available online: https://www.vdi.de/en/home/vdi-standards/details/vdivde-2206-development-of-mechatronic-and-cyber-physical-systems (accessed on 18 November 2022).
- Shewale, M.S.; Mulik, S.S.; Deshmukh, S.P.; Patange, A.D.; Zambare, H.B.; Sundare, A.P. Novel Machine Health Monitoring System. In Proceedings of the 2nd International Conference on Data Engineering and Communication Technology, Pune, India, 15–16 December 2017. [Google Scholar] [CrossRef]
- Patange, A.D.; Jegadeeshwaran, R.; Bajaj, N.S.; Khairnar, A.N.; Gavade, N.A. Application of Machine Learning for Tool Condition Monitoring in Turning. Sound Vib. 2022, 56, 127–145. [Google Scholar] [CrossRef]
- Assus RT-N—66U Router. Available online: https://www.asus.com/ro/Networking-IoT-Servers/WiFi-Routers/ASUS-WiFi-Routers/RTAC66U/ (accessed on 5 October 2022).
- Siemens Infrastructure. Available online: https://mall.industry.siemens.com/ (accessed on 5 October 2022).
- Secomea Site Manager. Available online: https://www.secomea.cz/ (accessed on 5 October 2022).
- Converter Rexroth IndraDrive CS. Available online: https://www.boschrexroth.com/ (accessed on 5 October 2022).
- TIA Portal. Available online: https://www.fiverr.com/ (accessed on 5 October 2022).
- ISO Standards. Available online: https://www.iso.org/standard/71149.html (accessed on 5 October 2022).
- Evaluation of the Uncertainty of Measurement in Calibration. Available online: https://www.enac.es/documents/7020/635abf3f-262a-4b3b-952f-10336cdfae9e (accessed on 5 October 2022).
- Pardeshi, S.S.; Patange, A.D.; Jegadeeshwaran, R.; Bhosale, M.R. Tyre Pressure Supervision of Two Wheeler Using Machine Learning. SDHM Struct. Durab. Health Monit. 2022, 16, 271–290. [Google Scholar] [CrossRef]
- Medhi, A.M.; Patange, A.D.; Pardeshi, S.S.; Jegadeeshwaran, R.; Kuntoglu, M. Overview of contemporary systems driven by open-design movement. arXiv 2022, arXiv:2201.05698. [Google Scholar] [CrossRef]
Publisher’s Note: MDPI stays neutral with regard to jurisdictional claims in published maps and institutional affiliations. |
© 2022 by the authors. Licensee MDPI, Basel, Switzerland. This article is an open access article distributed under the terms and conditions of the Creative Commons Attribution (CC BY) license (https://creativecommons.org/licenses/by/4.0/).