
A Self-Adaptive Multiple Exposure Image Fusion Method for Highly Reflective Surface Measurements


Abstract
1. Introduction
2. The Proposed Method
2.1. Initial Exposure Searching Based on Information Entropy
2.1.1. Selecting Criteria for Initial Exposure
2.1.2. Information Entropy Metric for Initial Exposure Selecting Criteria
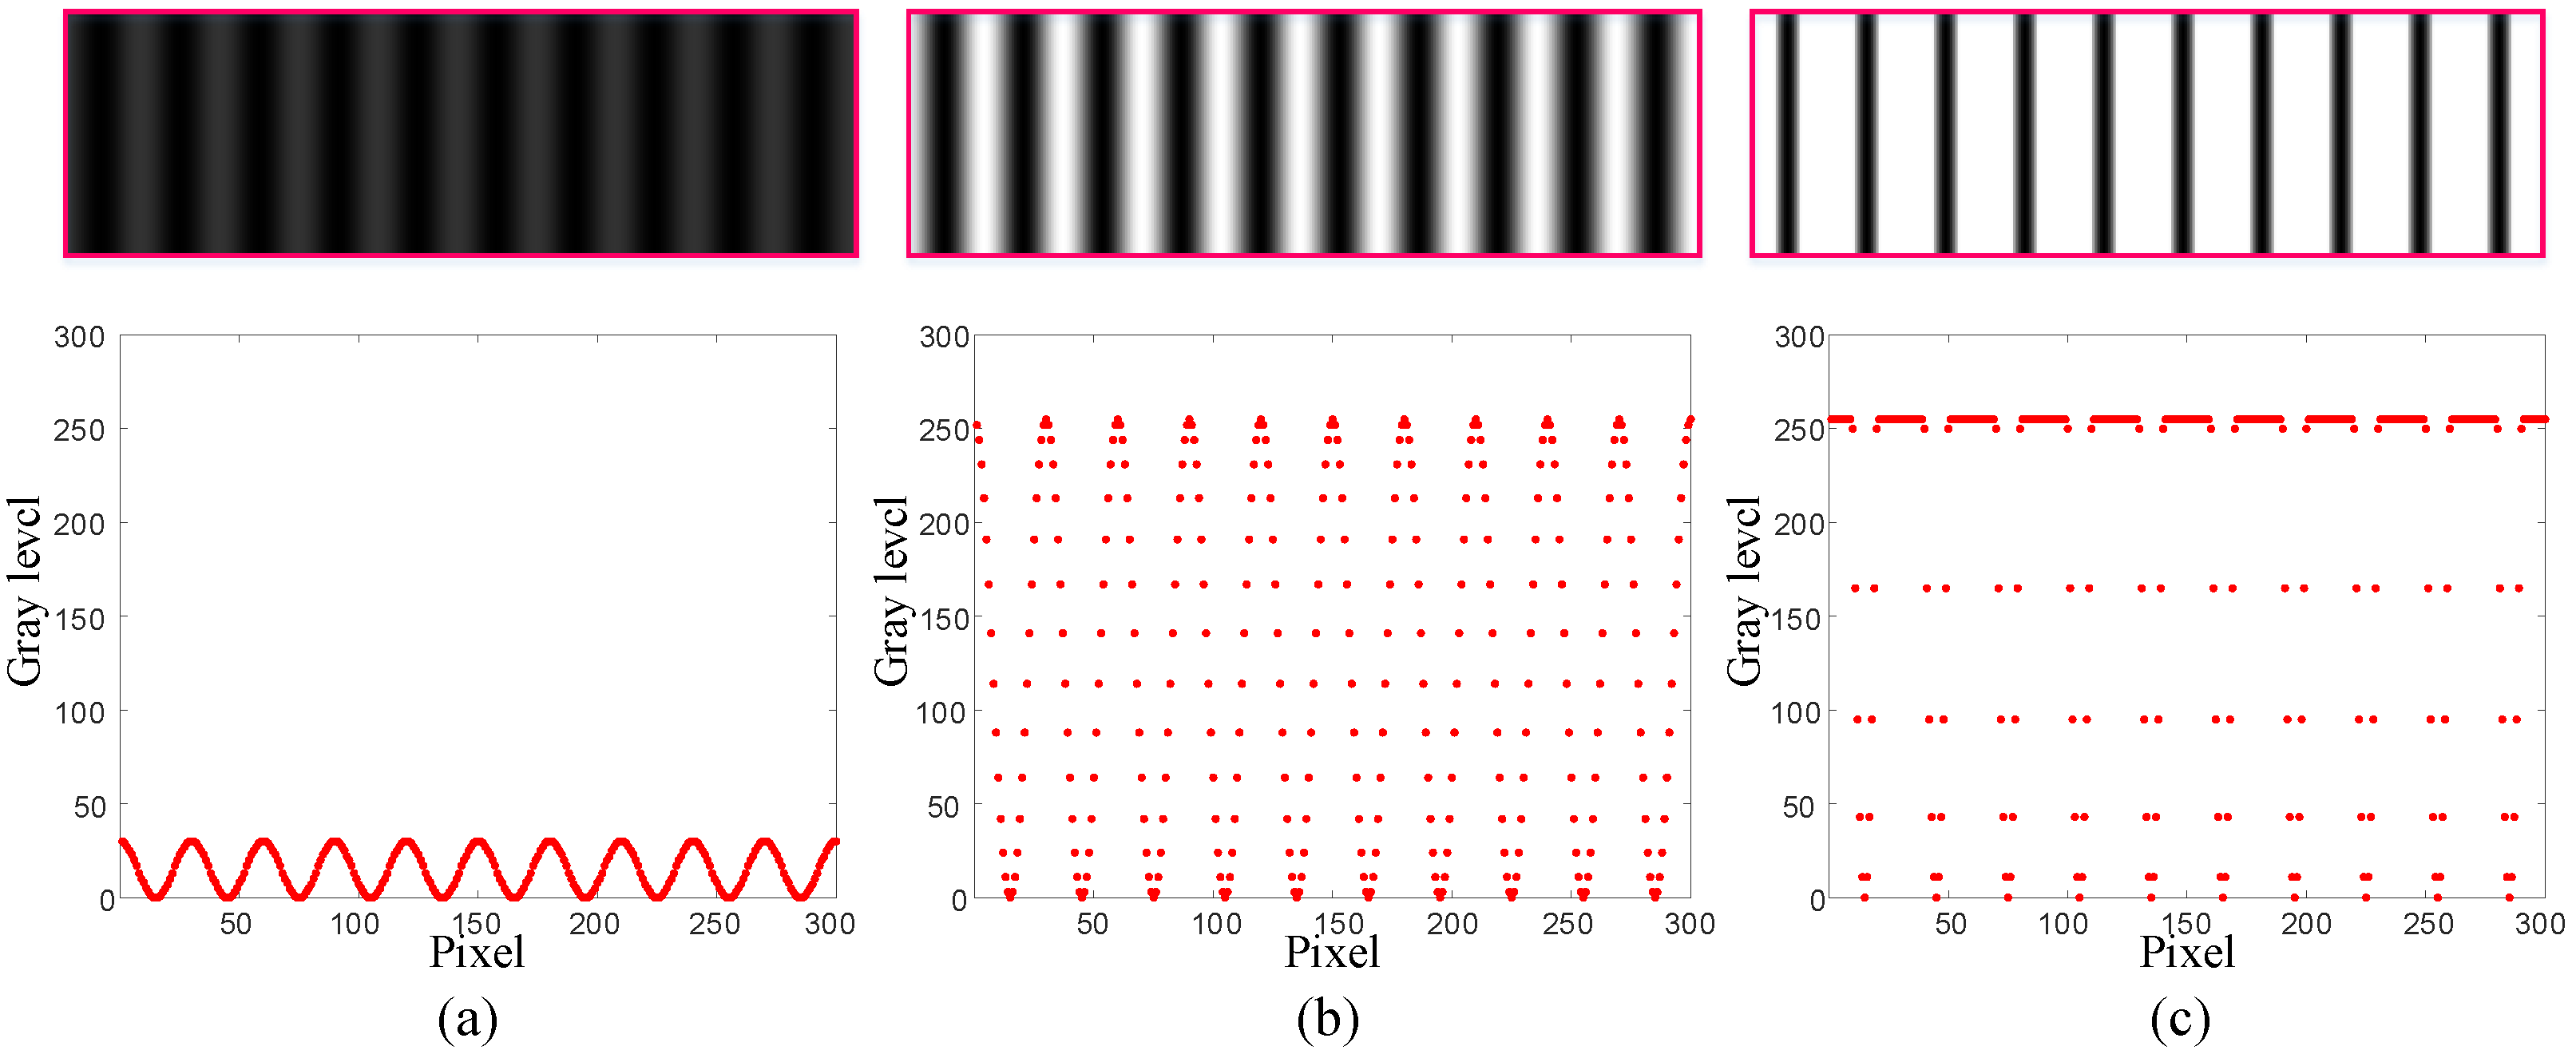
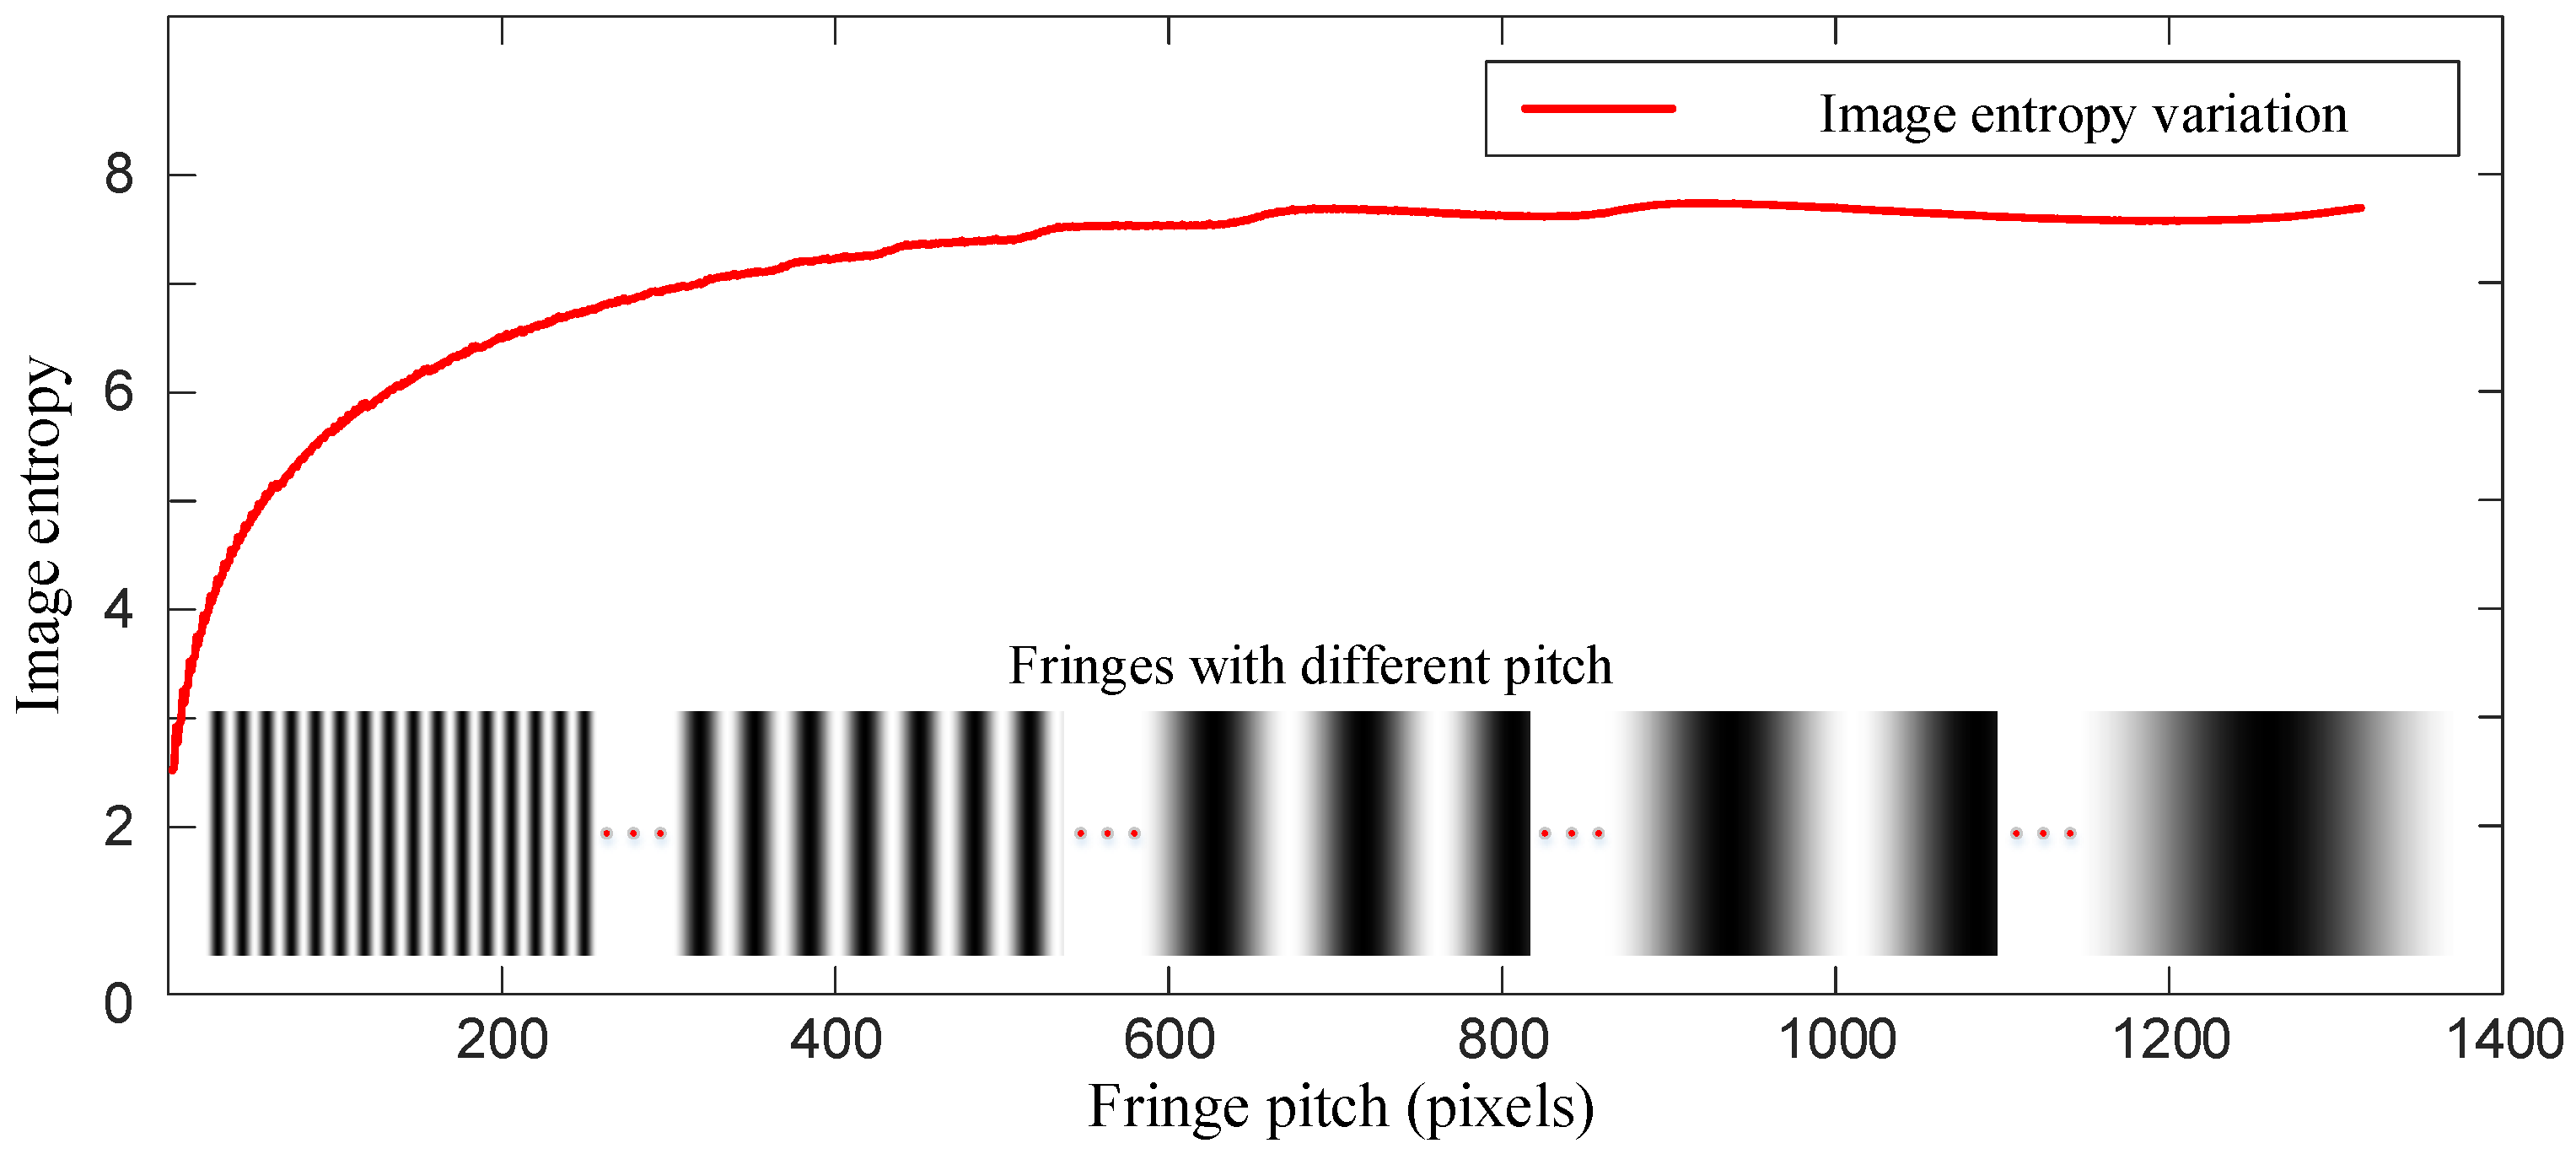
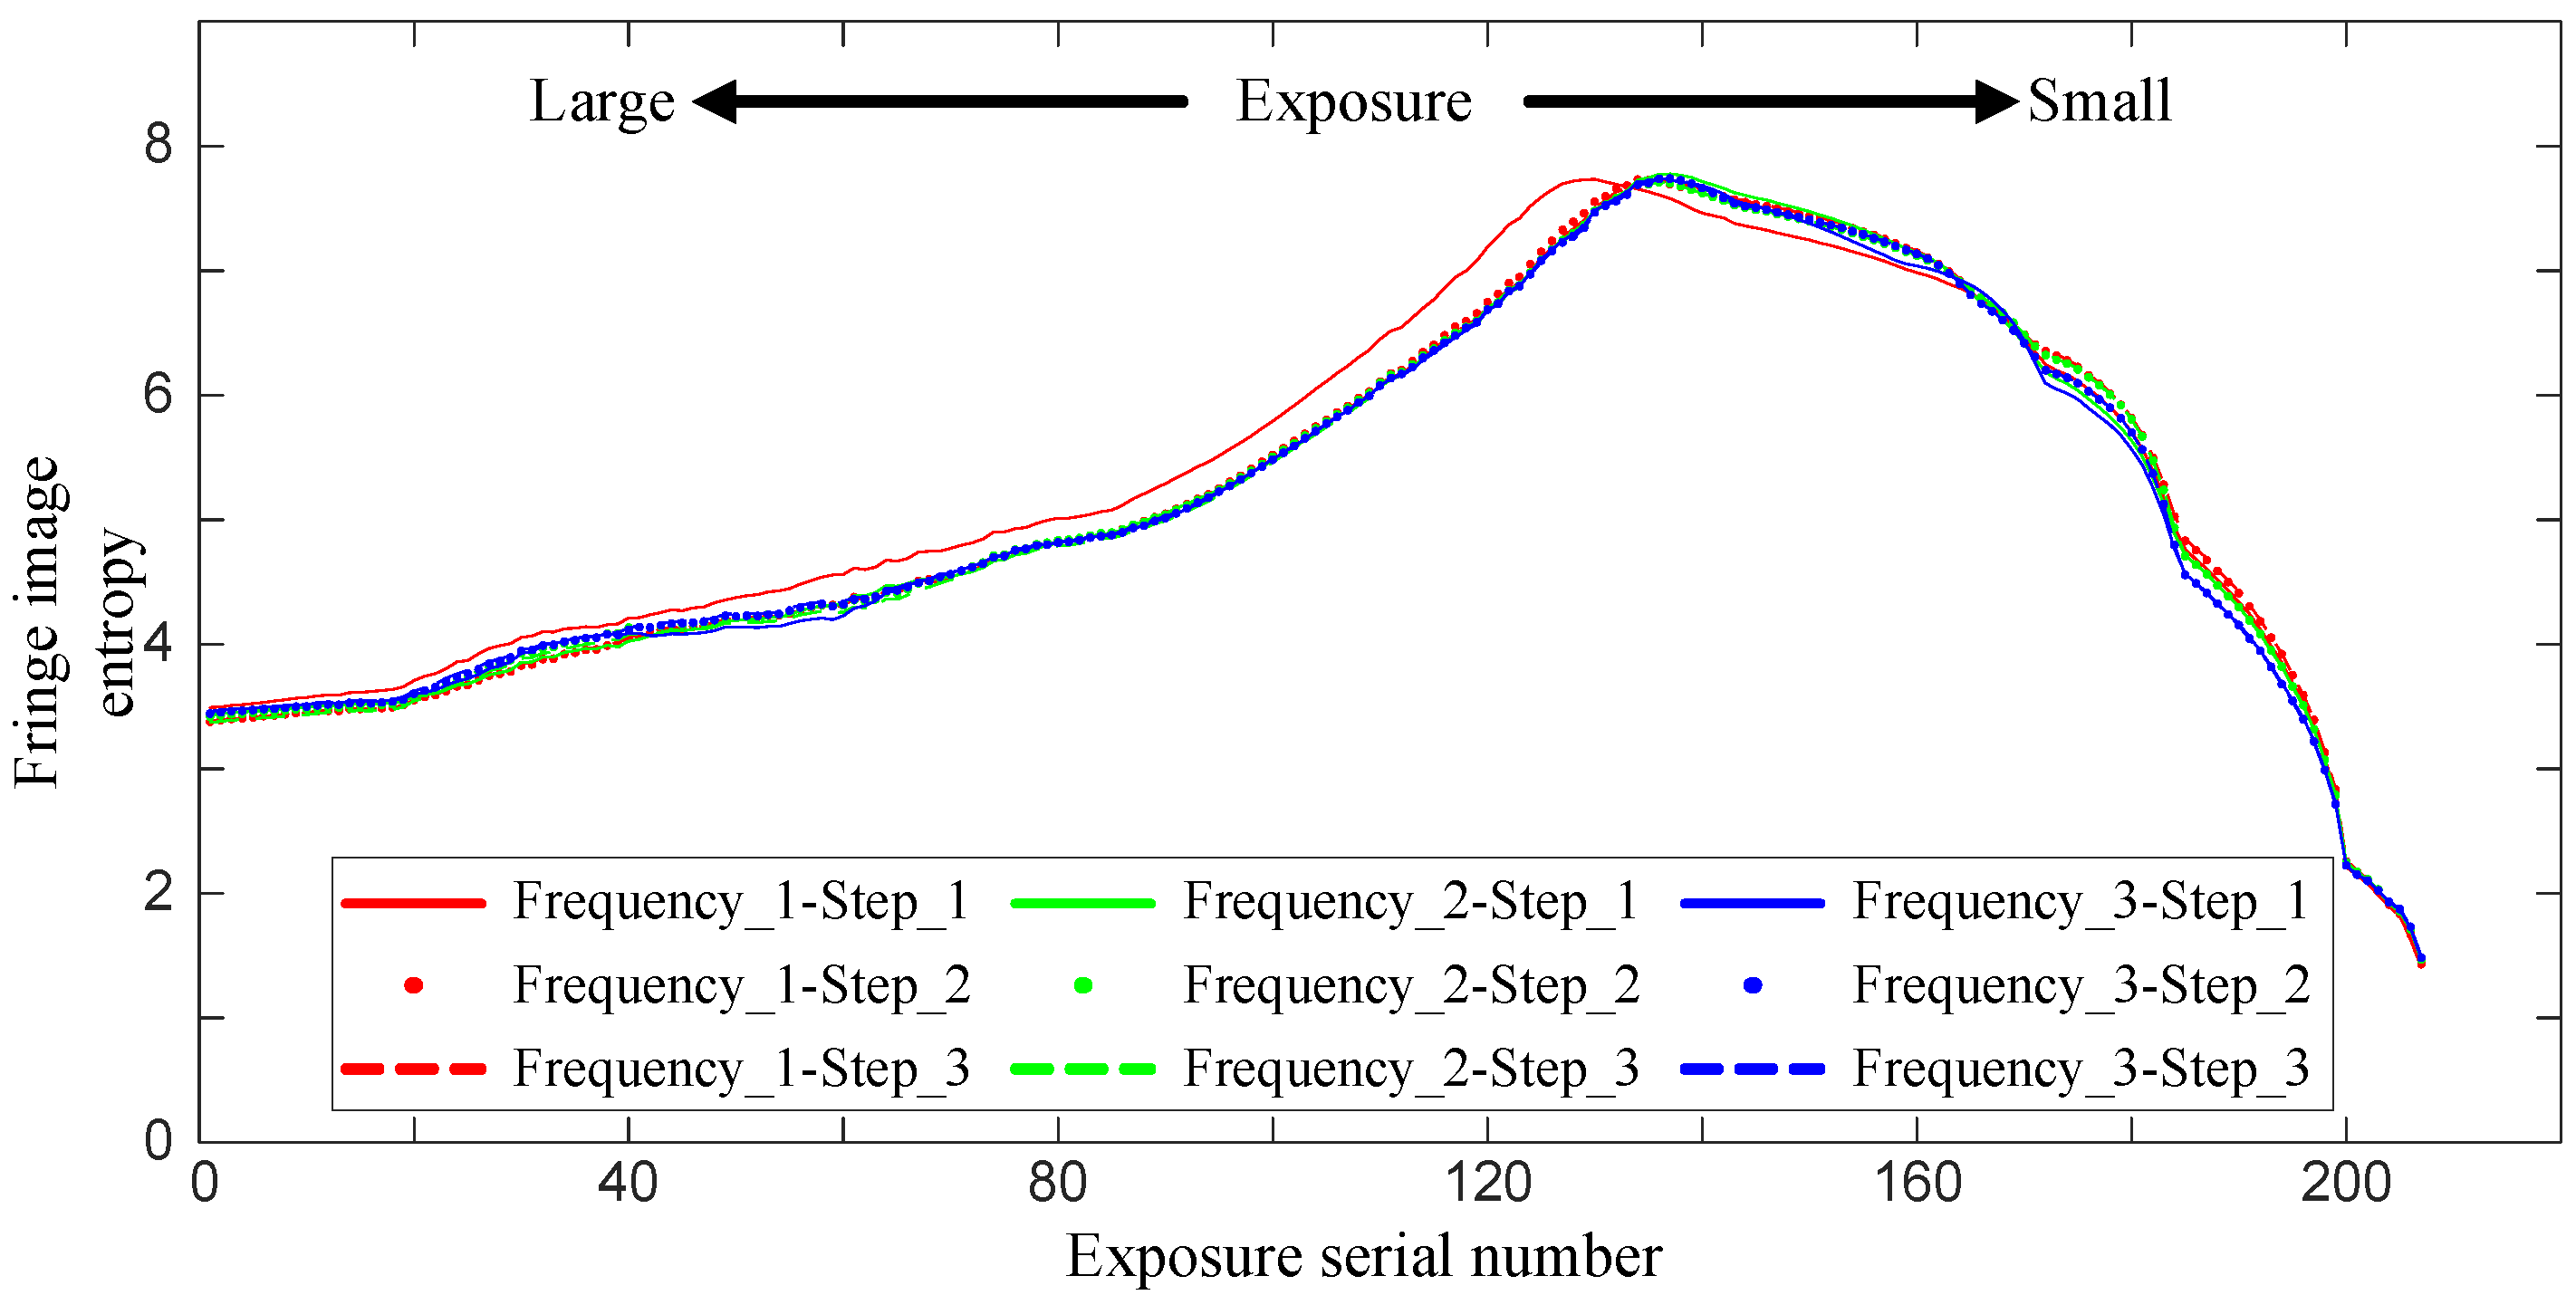
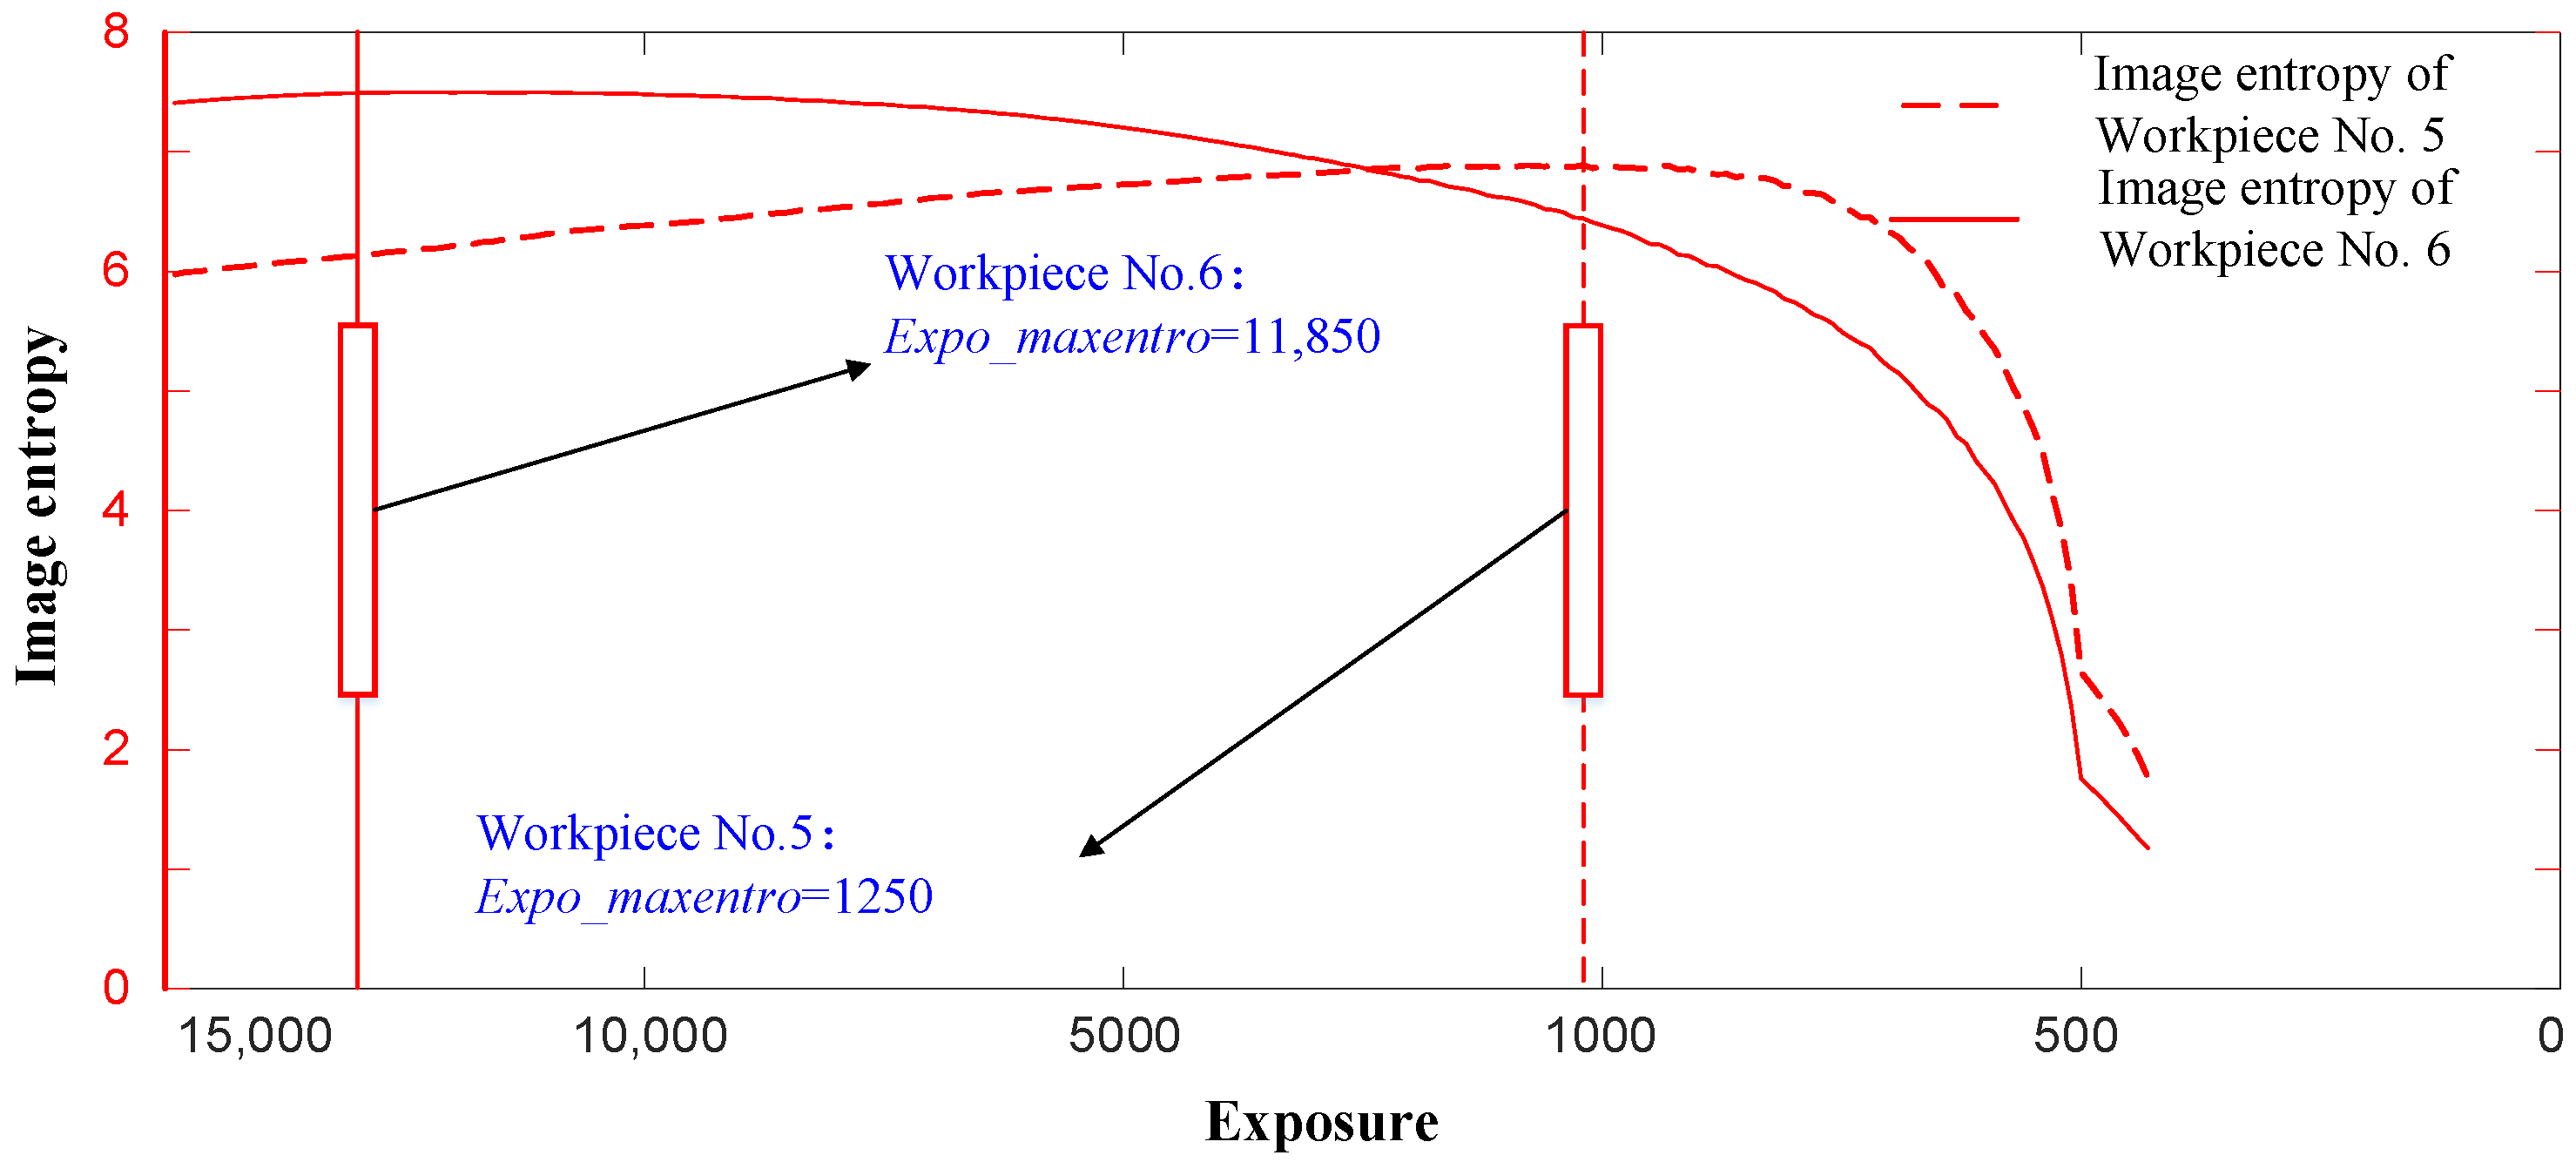
2.1.3. Variation Characteristics for Fringe Image Information Entropy
- (1)
- Information entropy for multi-frequency fringe images
- (2)
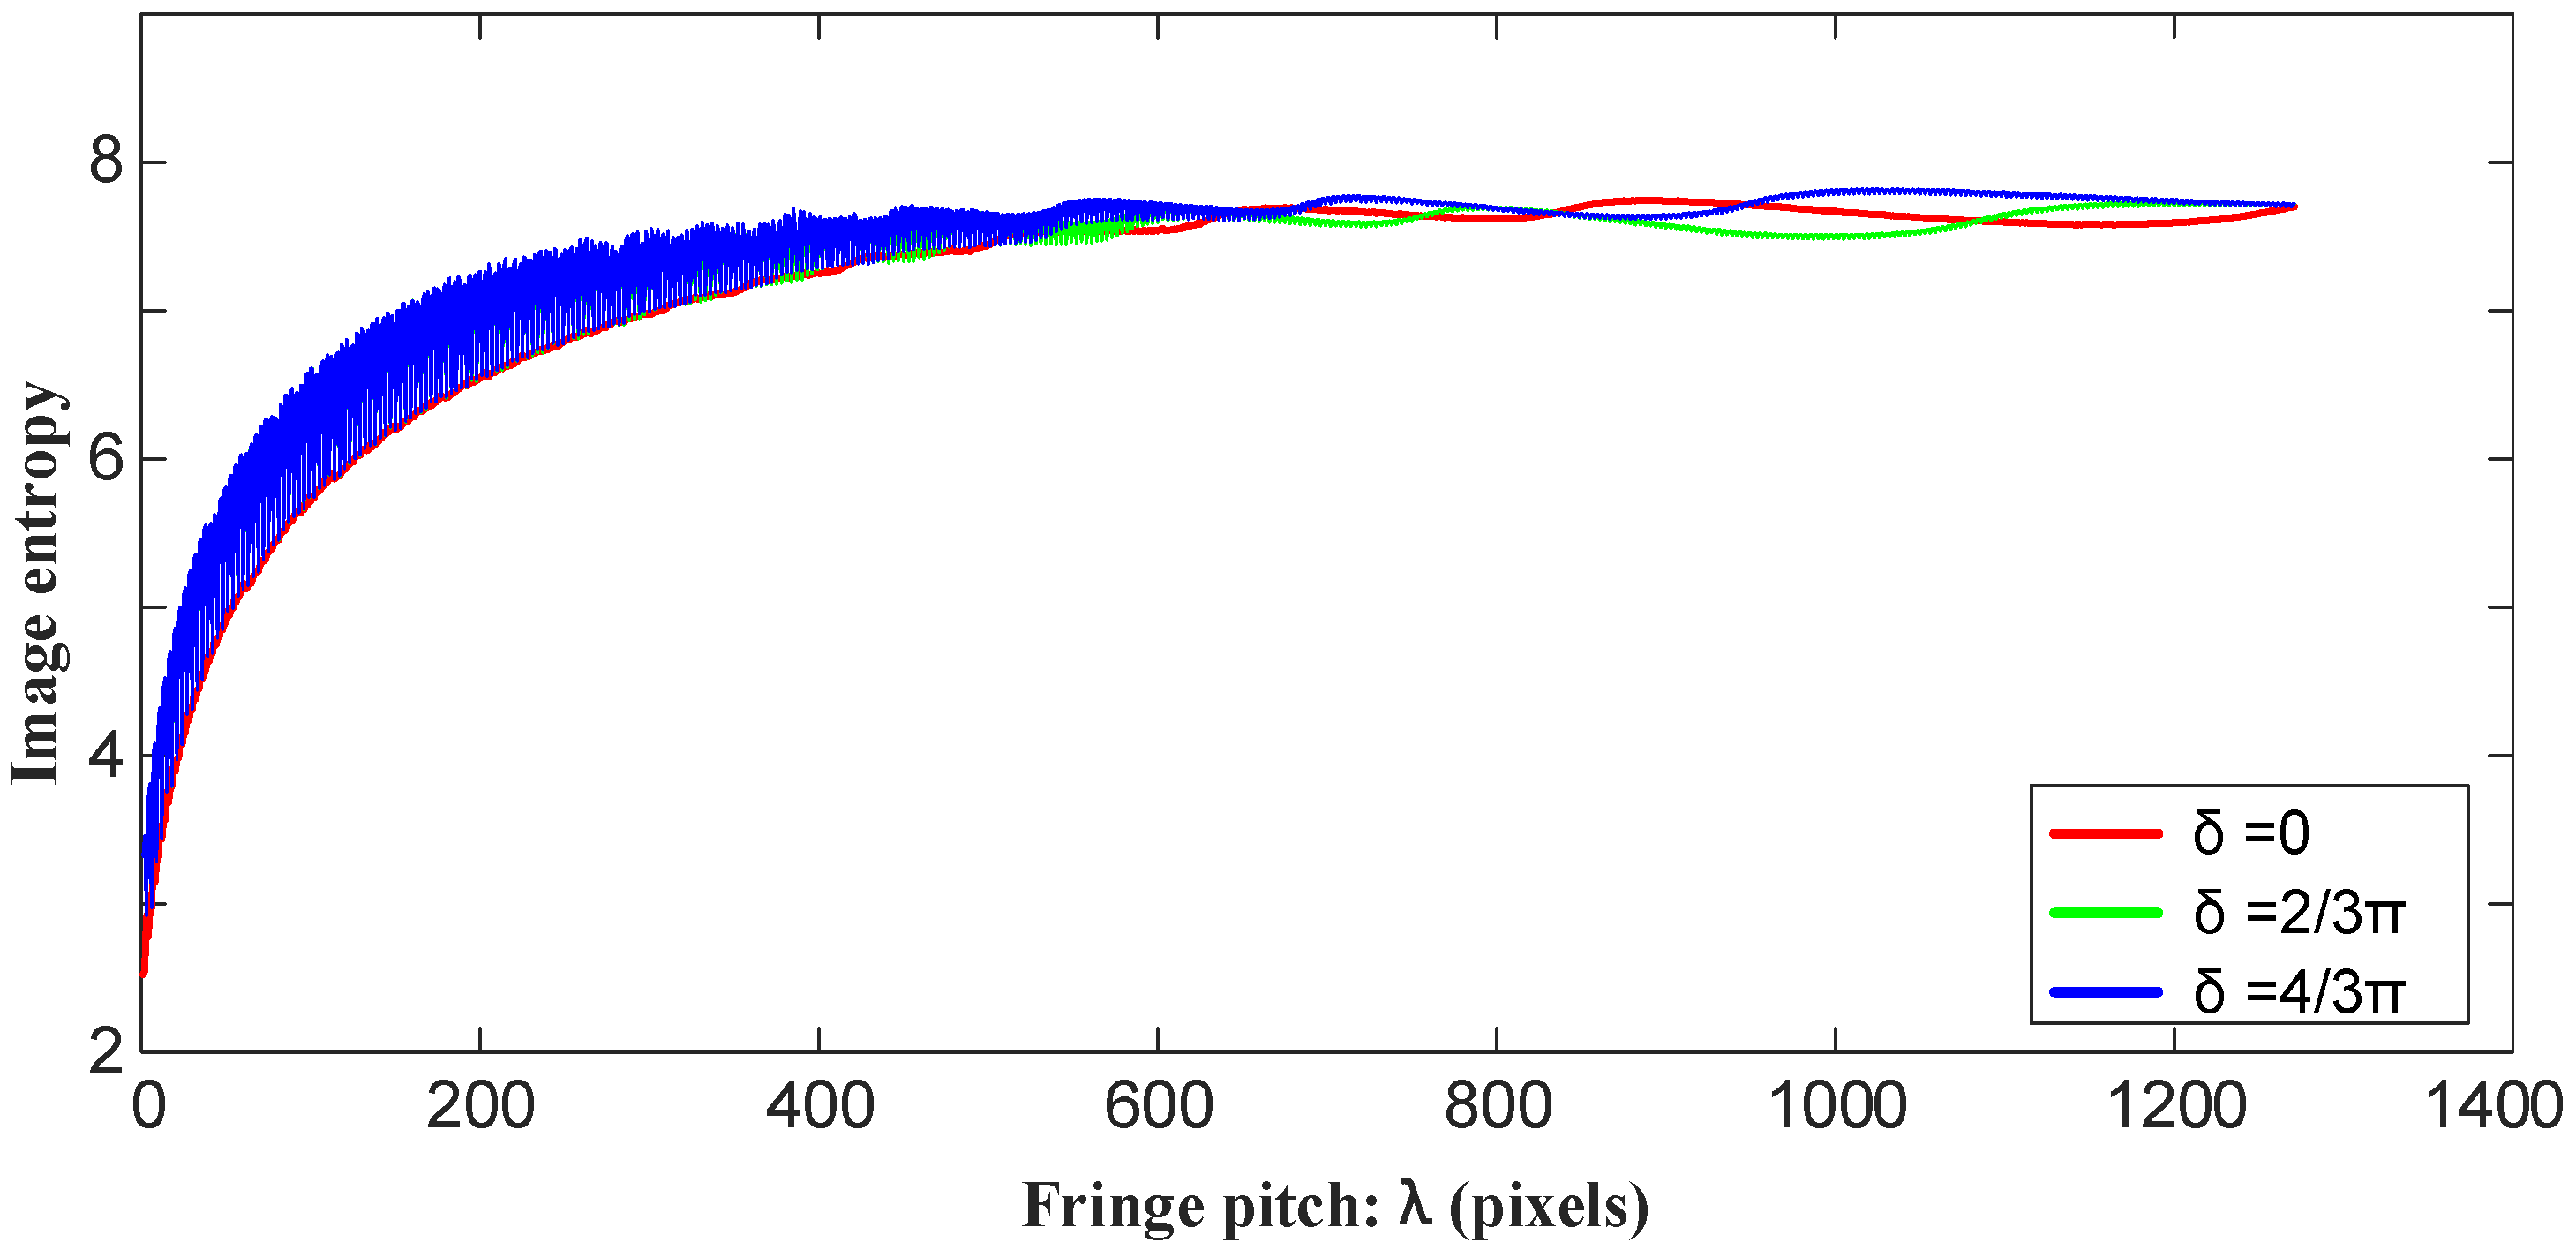
- Information entropy for three-step phase-shift fringe images
- (3)
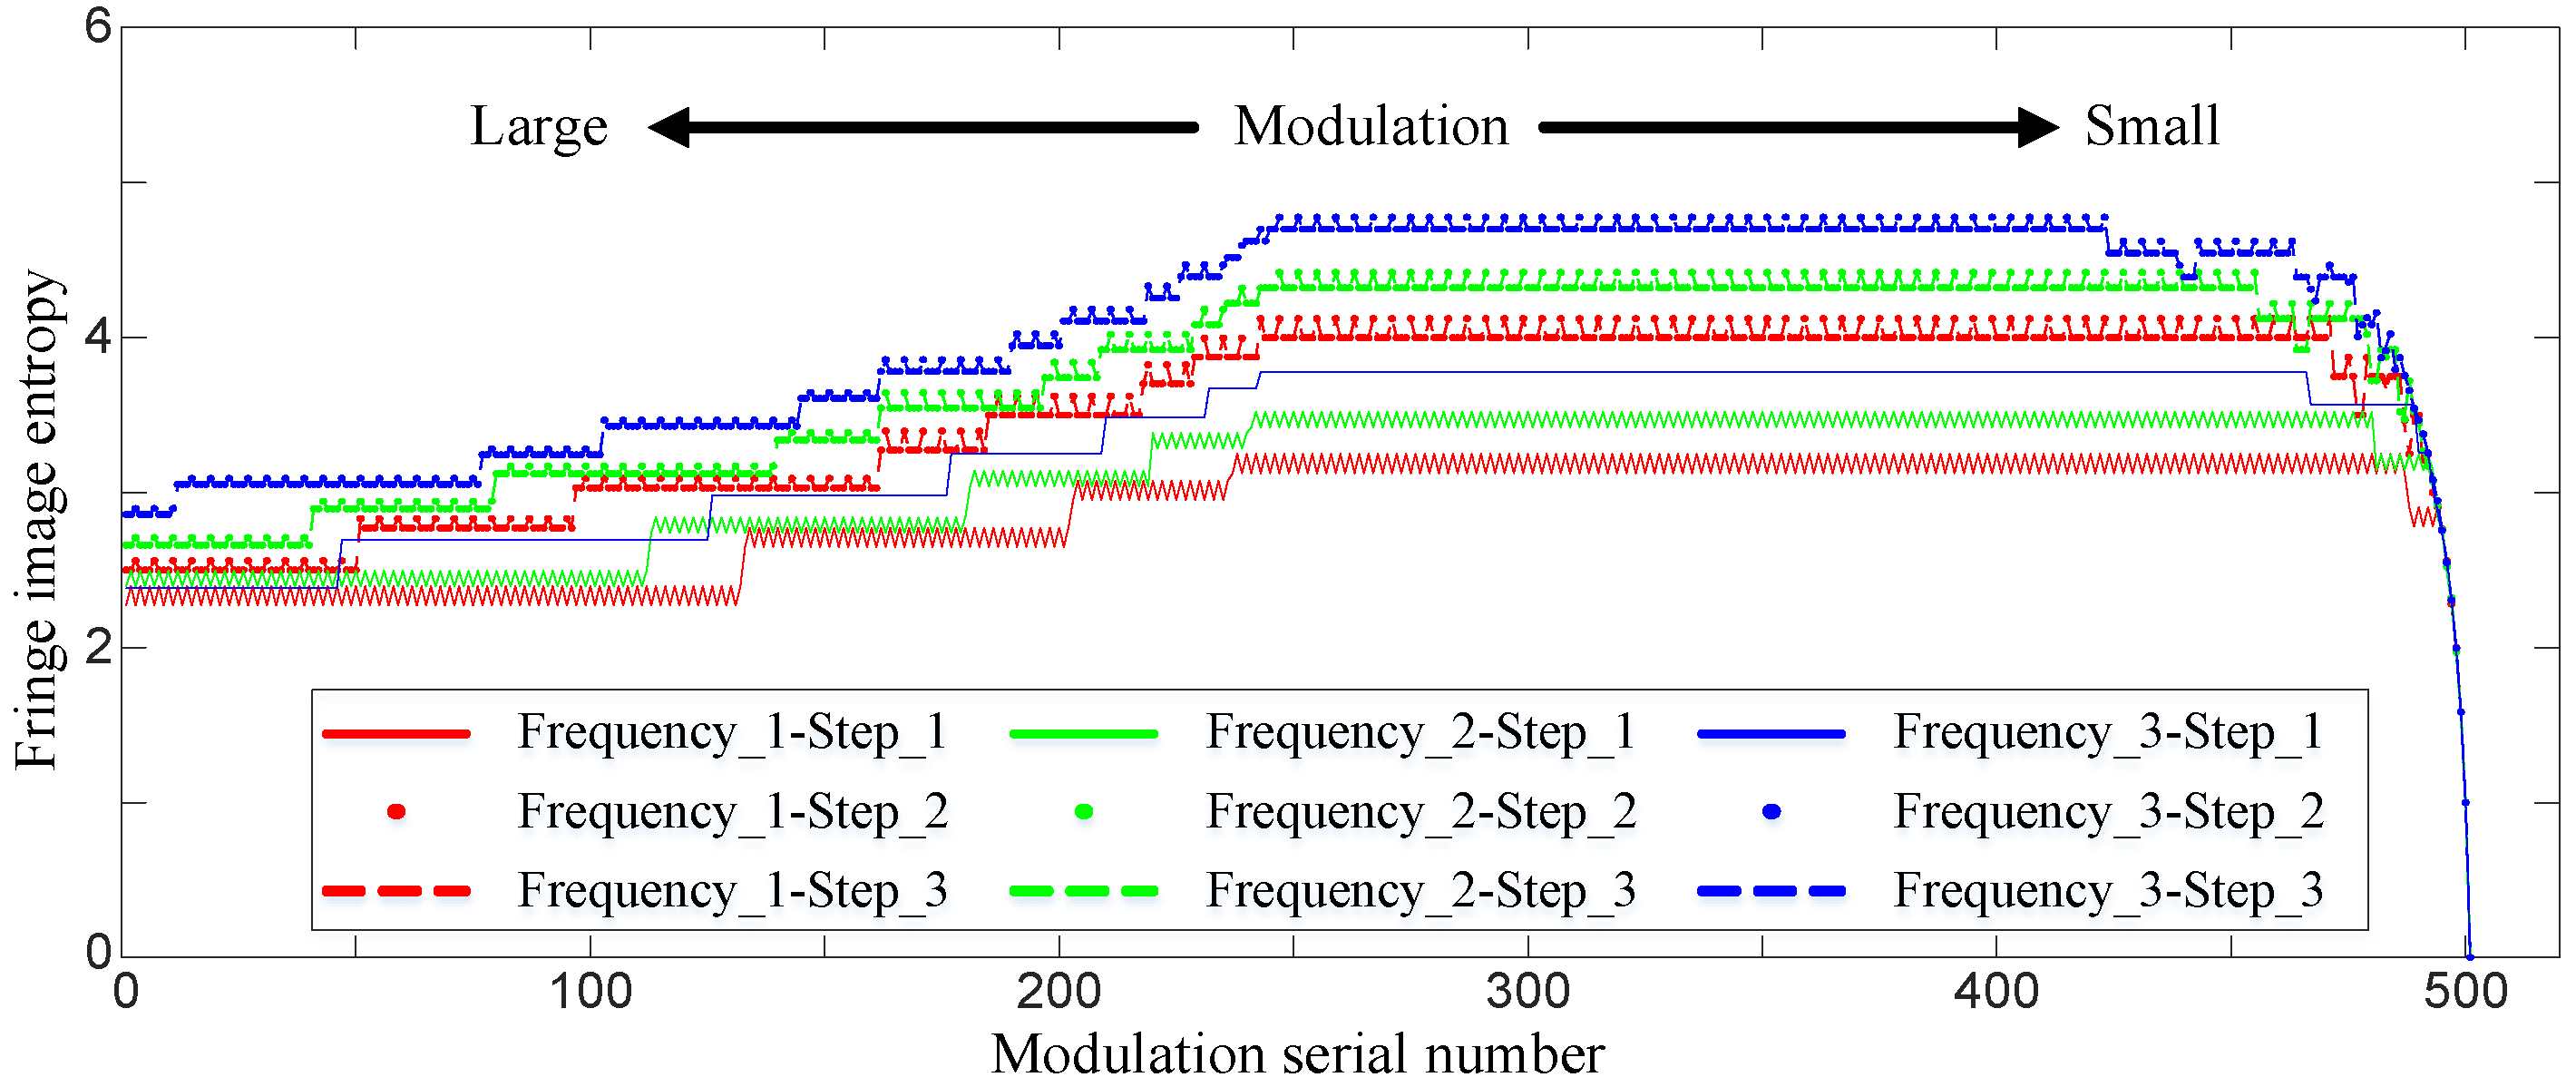
- Information entropy for phase-shifting fringe images at different exposures
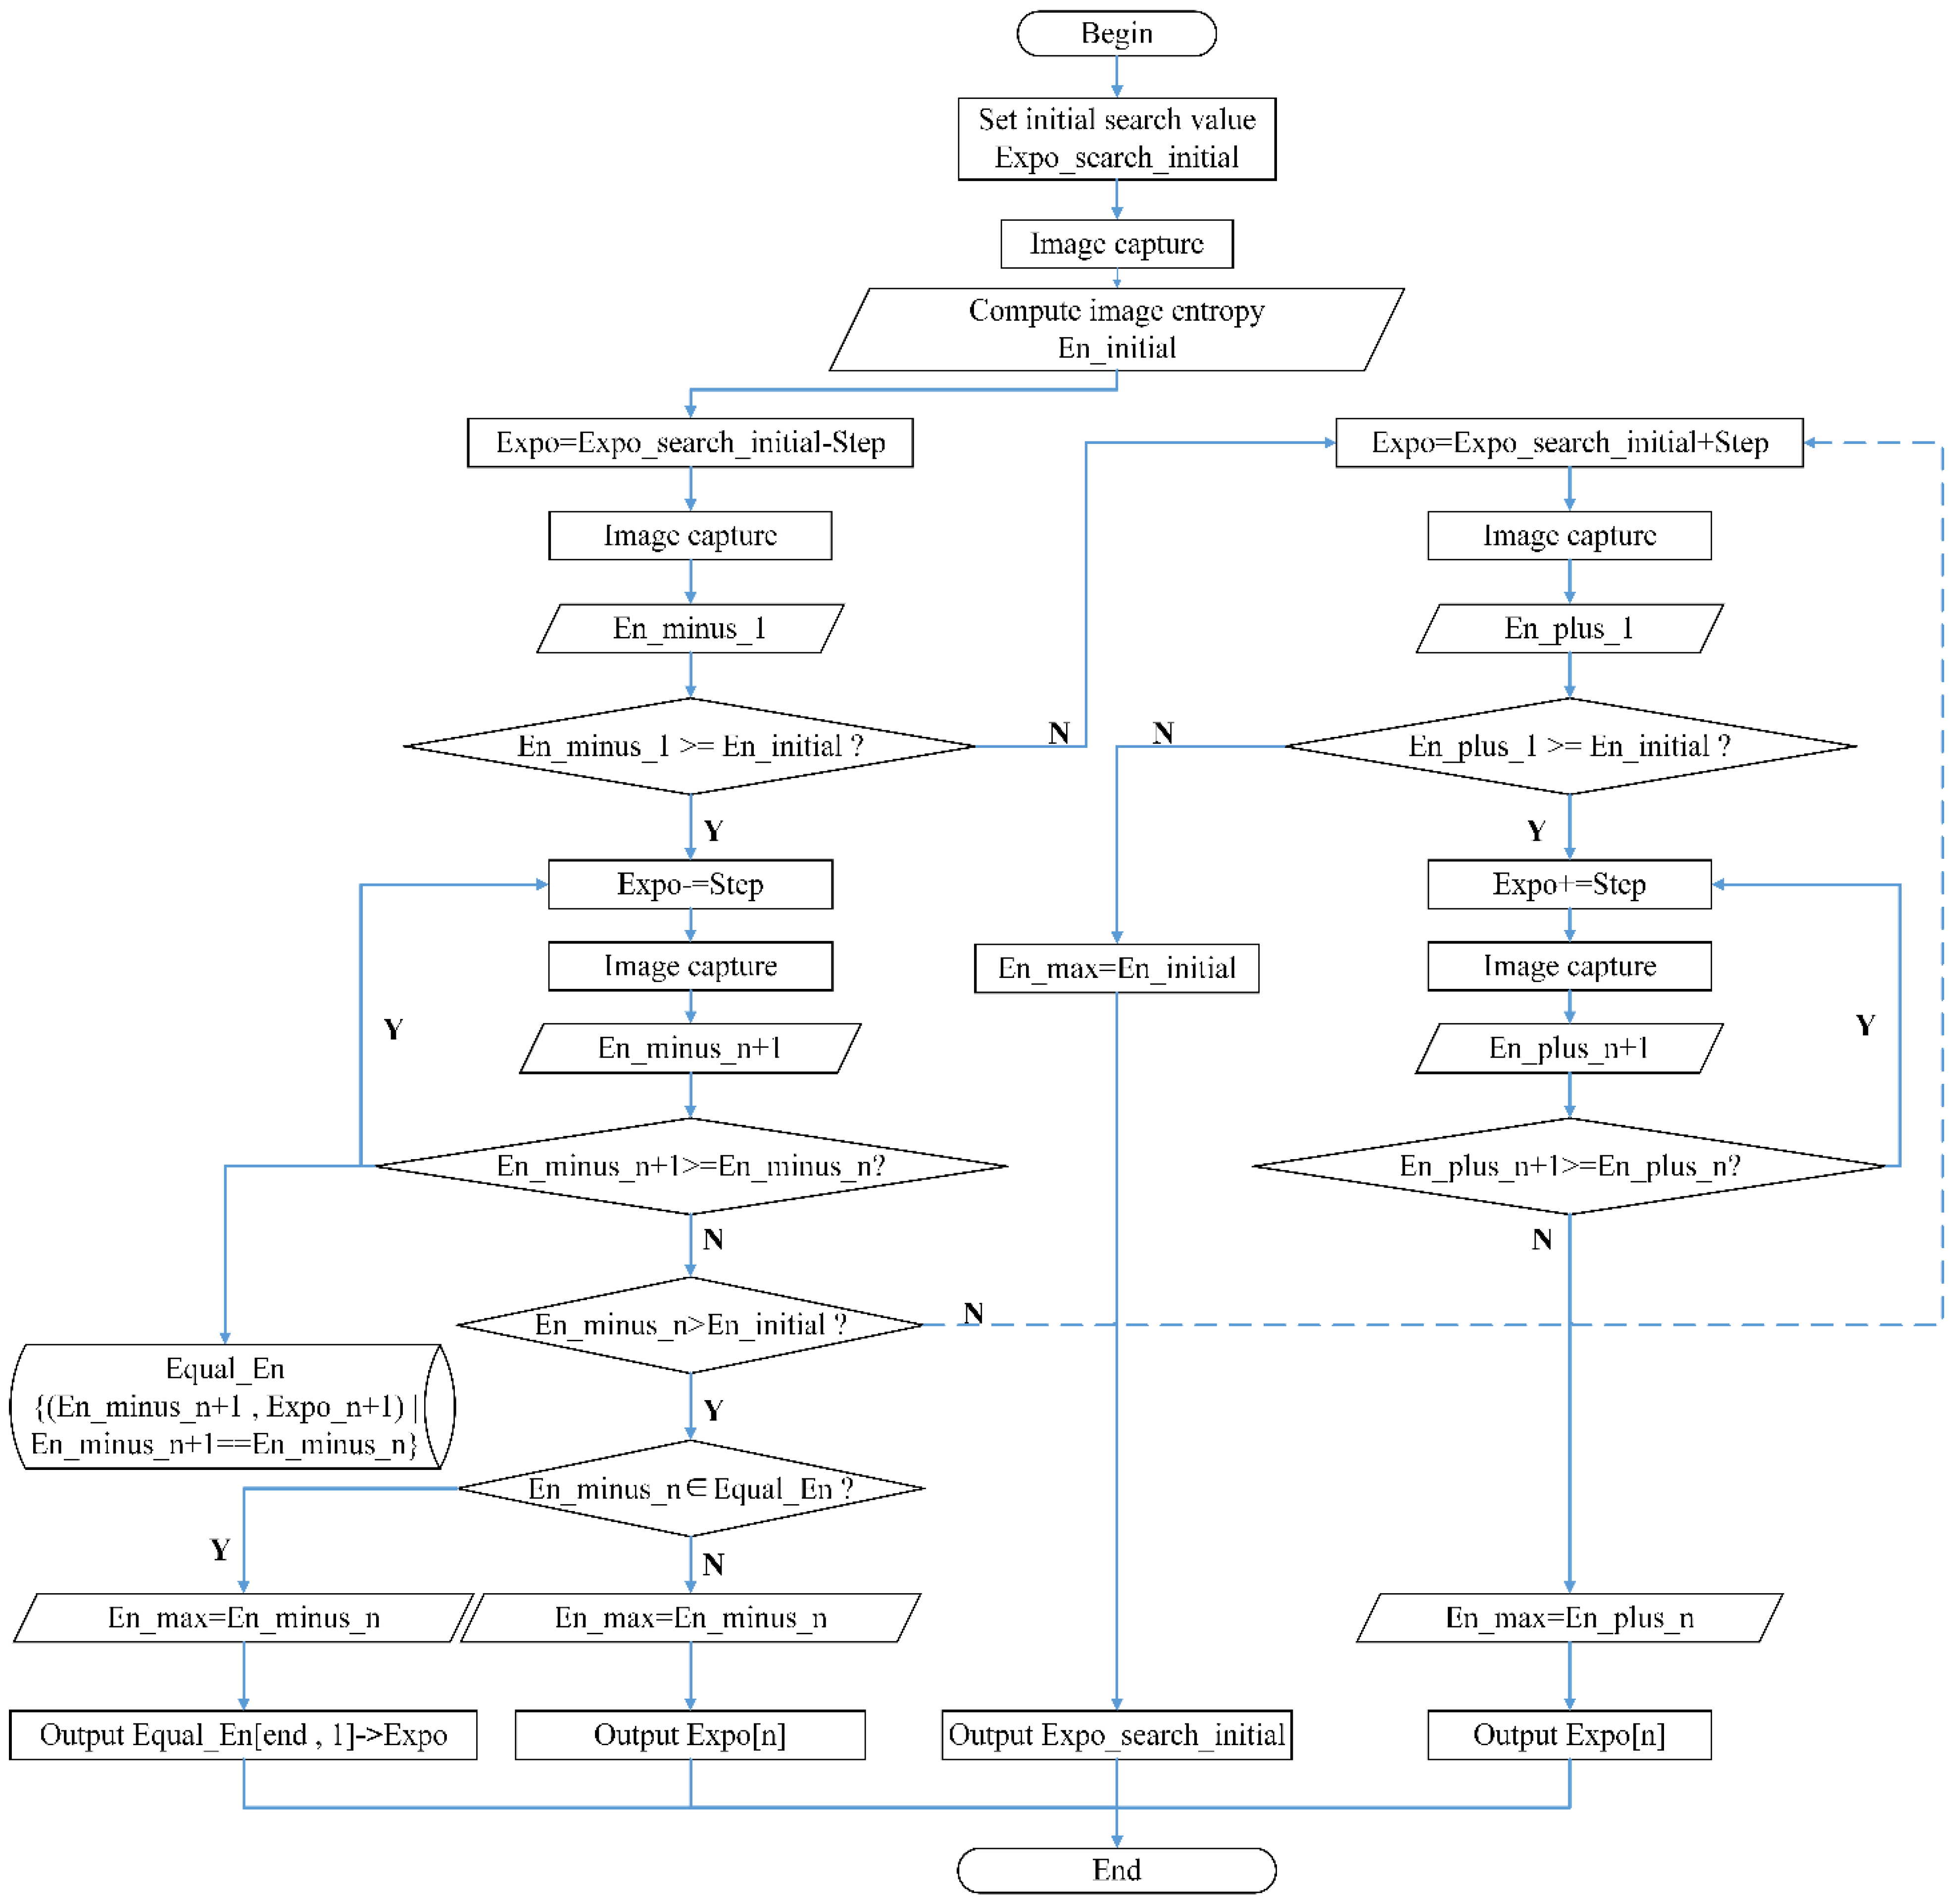
2.1.4. The Initial Exposure Searching Algorithm Based on Information Entropy
- (1)
- Manually or automatically set an initial value for exposure searching according to the adjustment range of the camera. This initial value is denoted as .
- (2)
- Acquire the reference fringe image of the third phase shift with the largest fringe pitch at the initial exposure. Calculate the image information entropy .
- (3)
- Search along the direction the exposure reduces. Taking as the exposure searching step, let . Capture the images under this exposure and calculate the entropy, , for the reference fringe image.
- (4)
- Determine the searching direction according to the relationship between and . If , according to the variation characteristics of the fringe image entropy with the change in exposure, it will never reach the maximum in this direction. Therefore, searching in this direction stops and the procedure goes to 8. If , this means that the entropy may reach the maximum in this direction. Continue to search in this direction and proceed to 5).
- (5)
- Continue to search in the direction of exposure reduction. Reduce the exposure by an interval of and calculate the fringe image entropy. Then, compare the two values acquired before and after the adjustment of exposure. If , the exposure is further reduced by and the loop continues. If the two values are equal, the image entropy and corresponding exposure will be saved to the data set in a form of key–value pair. If , proceed to 6.
- (6)
- If , proceed to 7. Otherwise, the stop searching in the current direction and switch to the opposite direction to that in which the exposure increases. Taking as the initial exposure searching value, proceed to 8.
- (7)
- If belongs to the data set , set to . Select the exposure value of the first entropy–exposure pair in the last equivalent entropy–exposure pair of as the desired exposure for the maximum entropy. The procedure then ends here. Otherwise, set equal to and output the corresponding exposure value. Then the procedure ends.
- (8)
- Search in the direction the exposure value increases. Let , capture corresponding fringe images and calculate the image entropy. If , then continue to search in this direction and proceed to 9. Otherwise, let and output the corresponding exposure, . This means that the initial exposure set at the beginning of the searching algorithm makes the image entropy reach the maximum. The procedure then ends here.
- (9)
- Continue the searching loop in the direction of rising exposure. Increase the exposure and calculate the image entropy. If , increase the exposure and the loop continues. Otherwise, set to be equal to . The corresponding exposure, , will be outputted and the procedure ends here.
2.2. Exposure Sequence Generation Based on Dichotomy
- (1)
- Set the desired total number of exposure N and determine and ;
- (2)
- Build the initial exposure sequence . The exposure number in the current exposure sequence is denoted as ;
- (3)
- Update the exposure sequence. Compute the average of the upper and lower limit of exposure and insert it into the sequence. In this way, the updated exposure sequence S1 can be generated.
- (4)
- Continue to update the exposure sequence.
- (5)
- If , then the procedure ends and outputs the exposure sequence. Otherwise, continue to execute the dichotomy method until the aforementioned inequation works. The final generated exposure sequence can be denoted as .
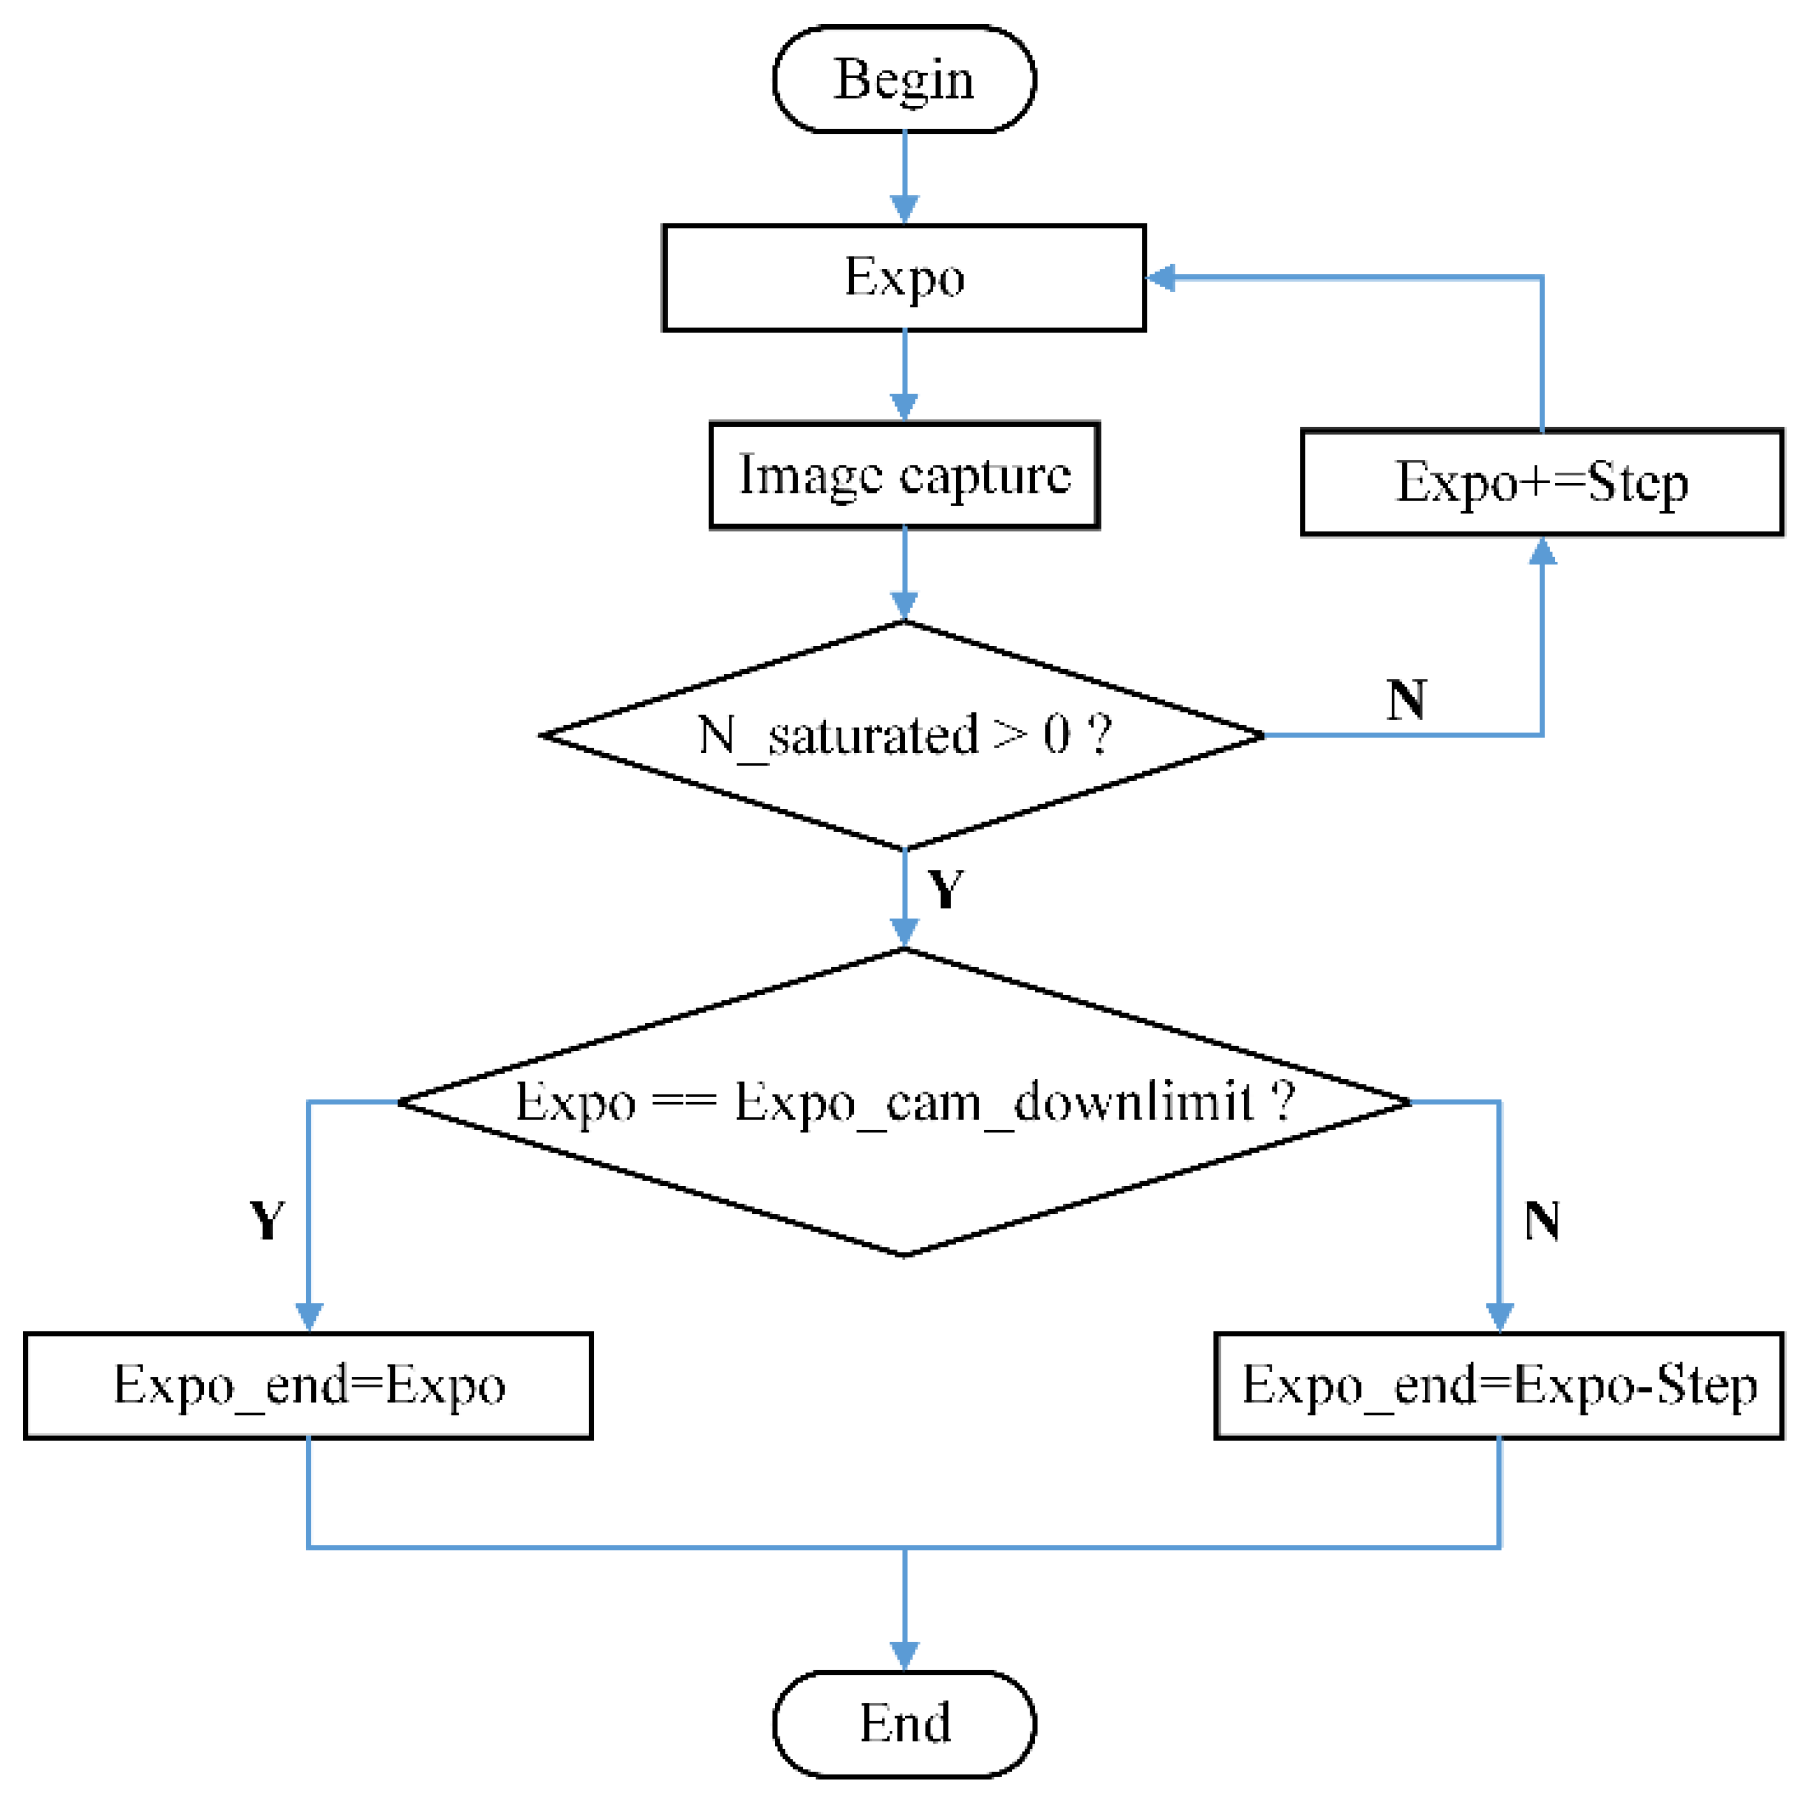
2.3. Self-Adaptive Multiple Exposure Image Fusion Algorithm for FPP
- (1)
- Determine the beginning and ending exposure values. Determine the initial exposure, , using the method proposed in Section 2.1. Then, the beginning exposure can be given by:
- (2)
- Generate the exposure sequence automatically. After providing the exposure times, the exposure sequence will be generated by the method proposed in Section 2.2.
- (3)
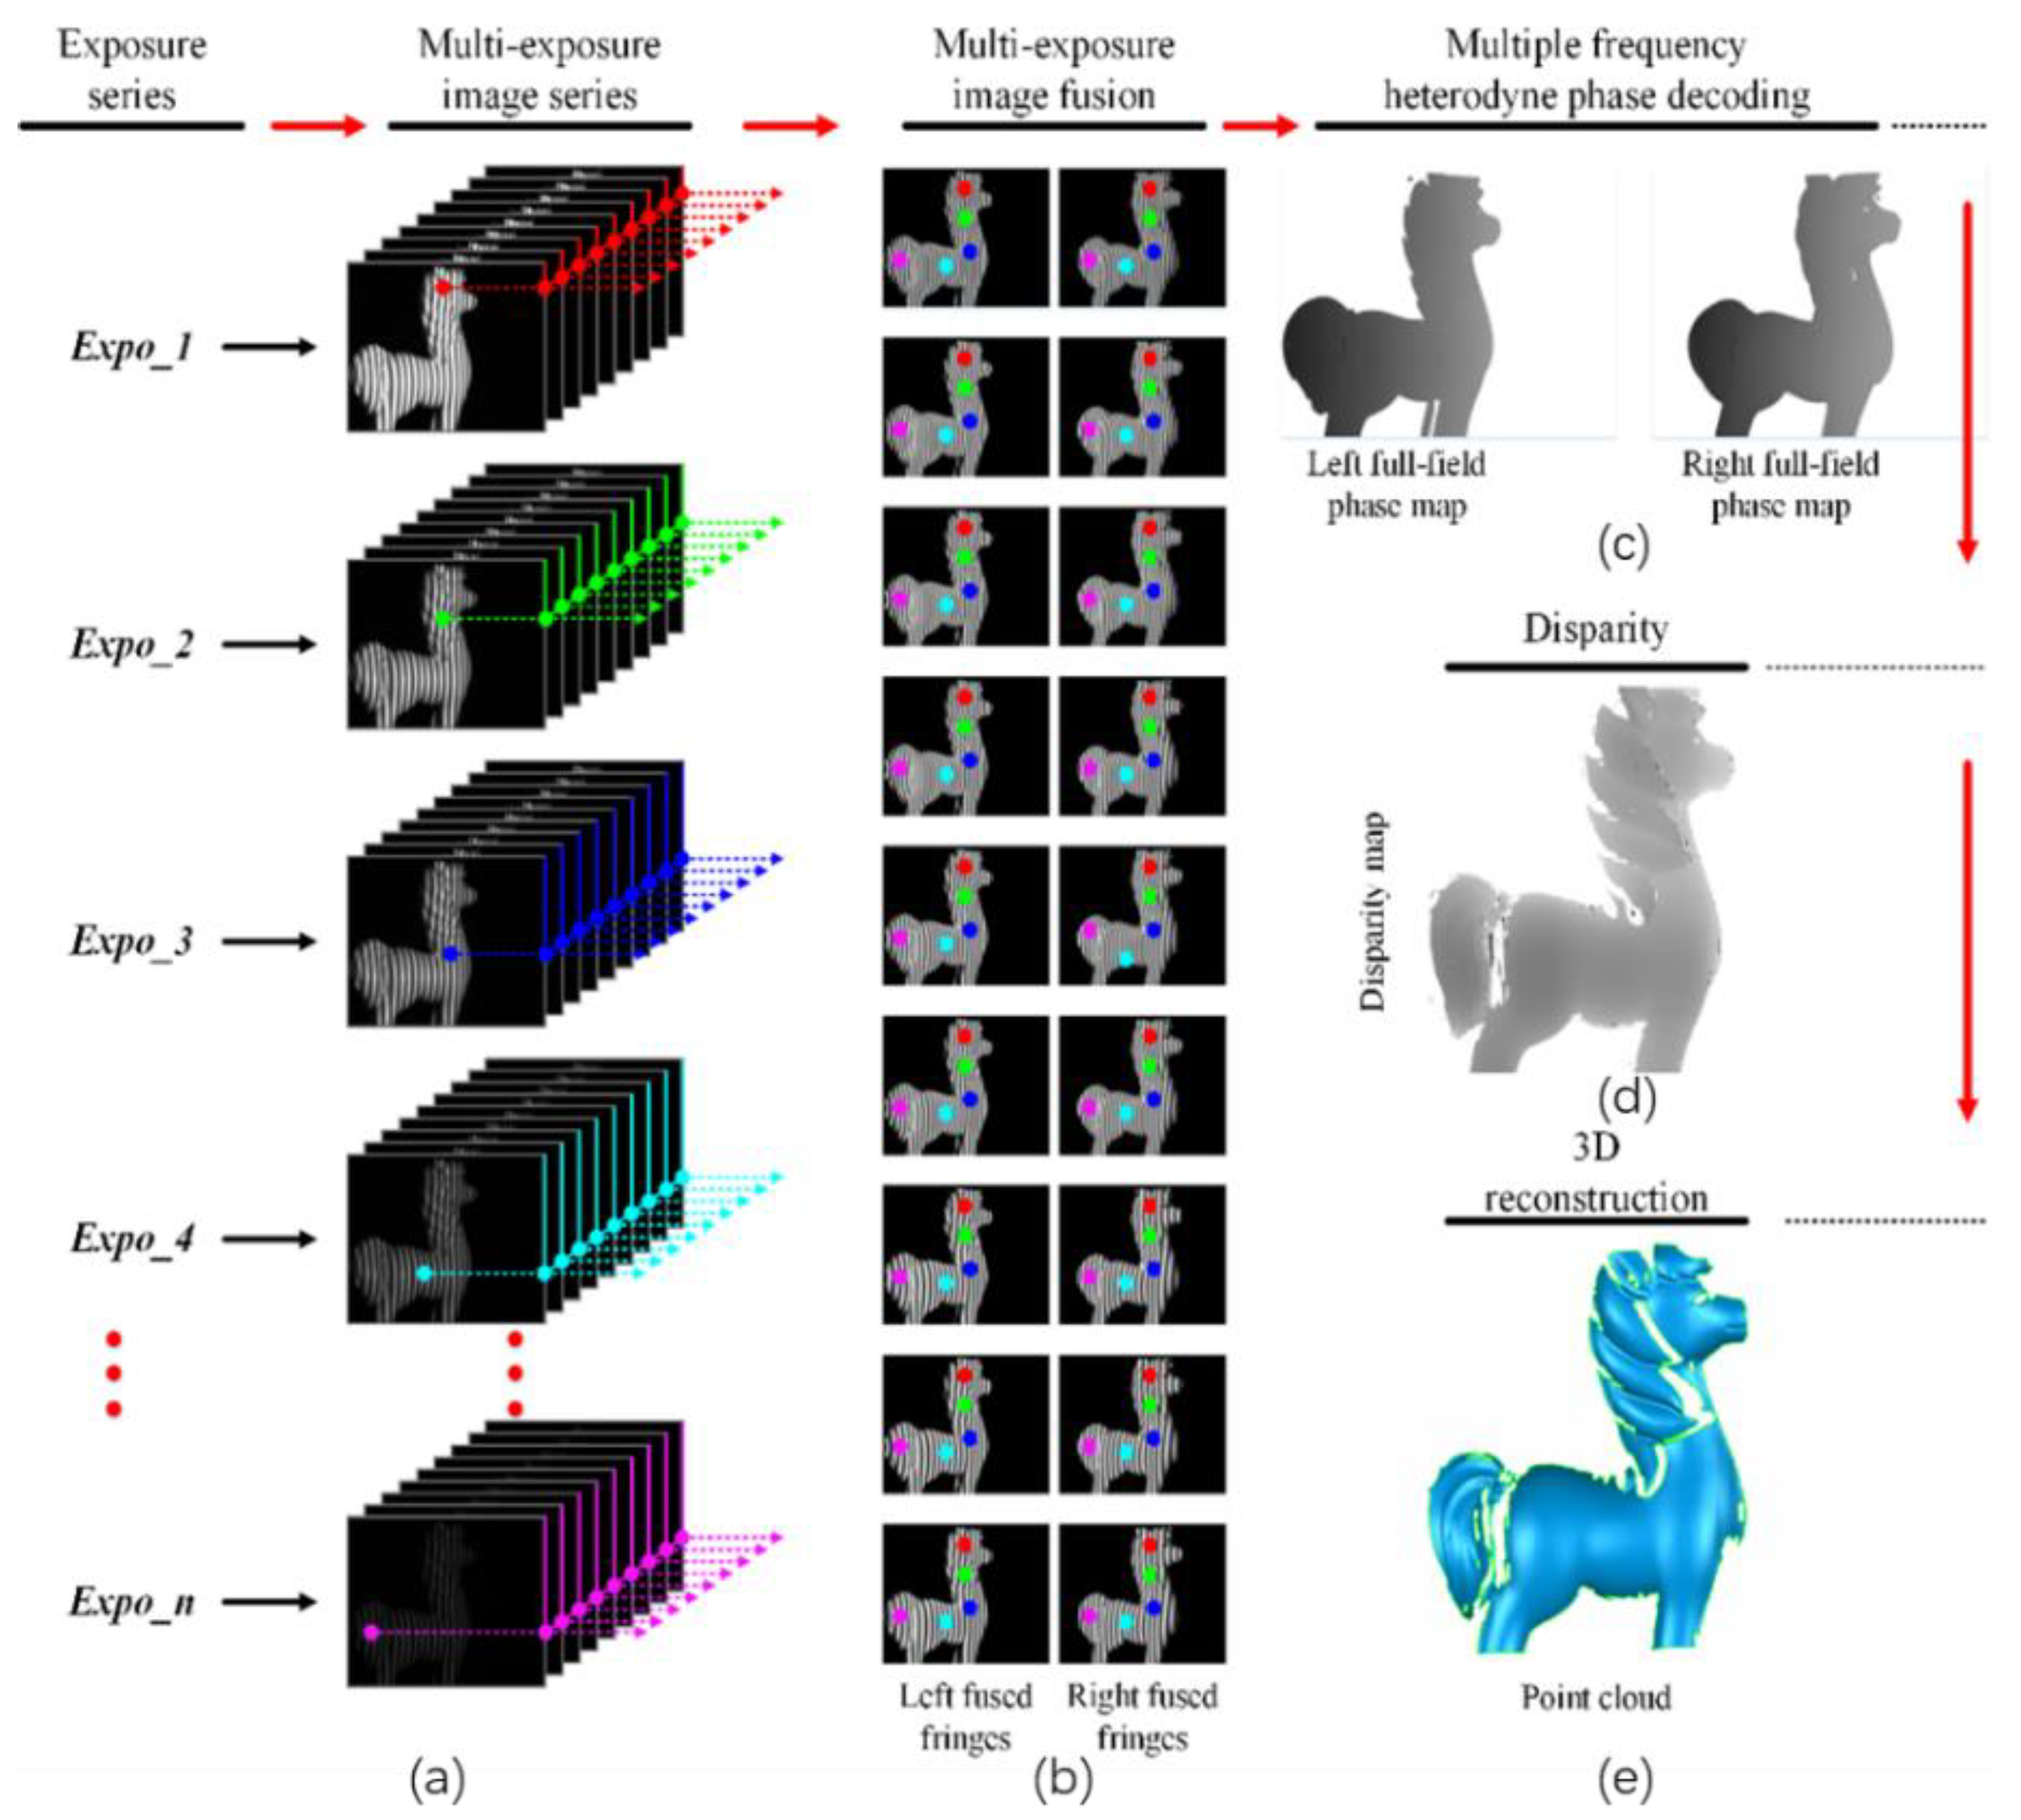
- Project the fringes and capture the images according to the generated exposure sequence in Step (2). Suppose are the n exposure values from the exposure sequence, as shown in Figure 9a, then n groups of images, each of which has nine phase shift fringe images, are captured at each of the exposure values.
- (4)
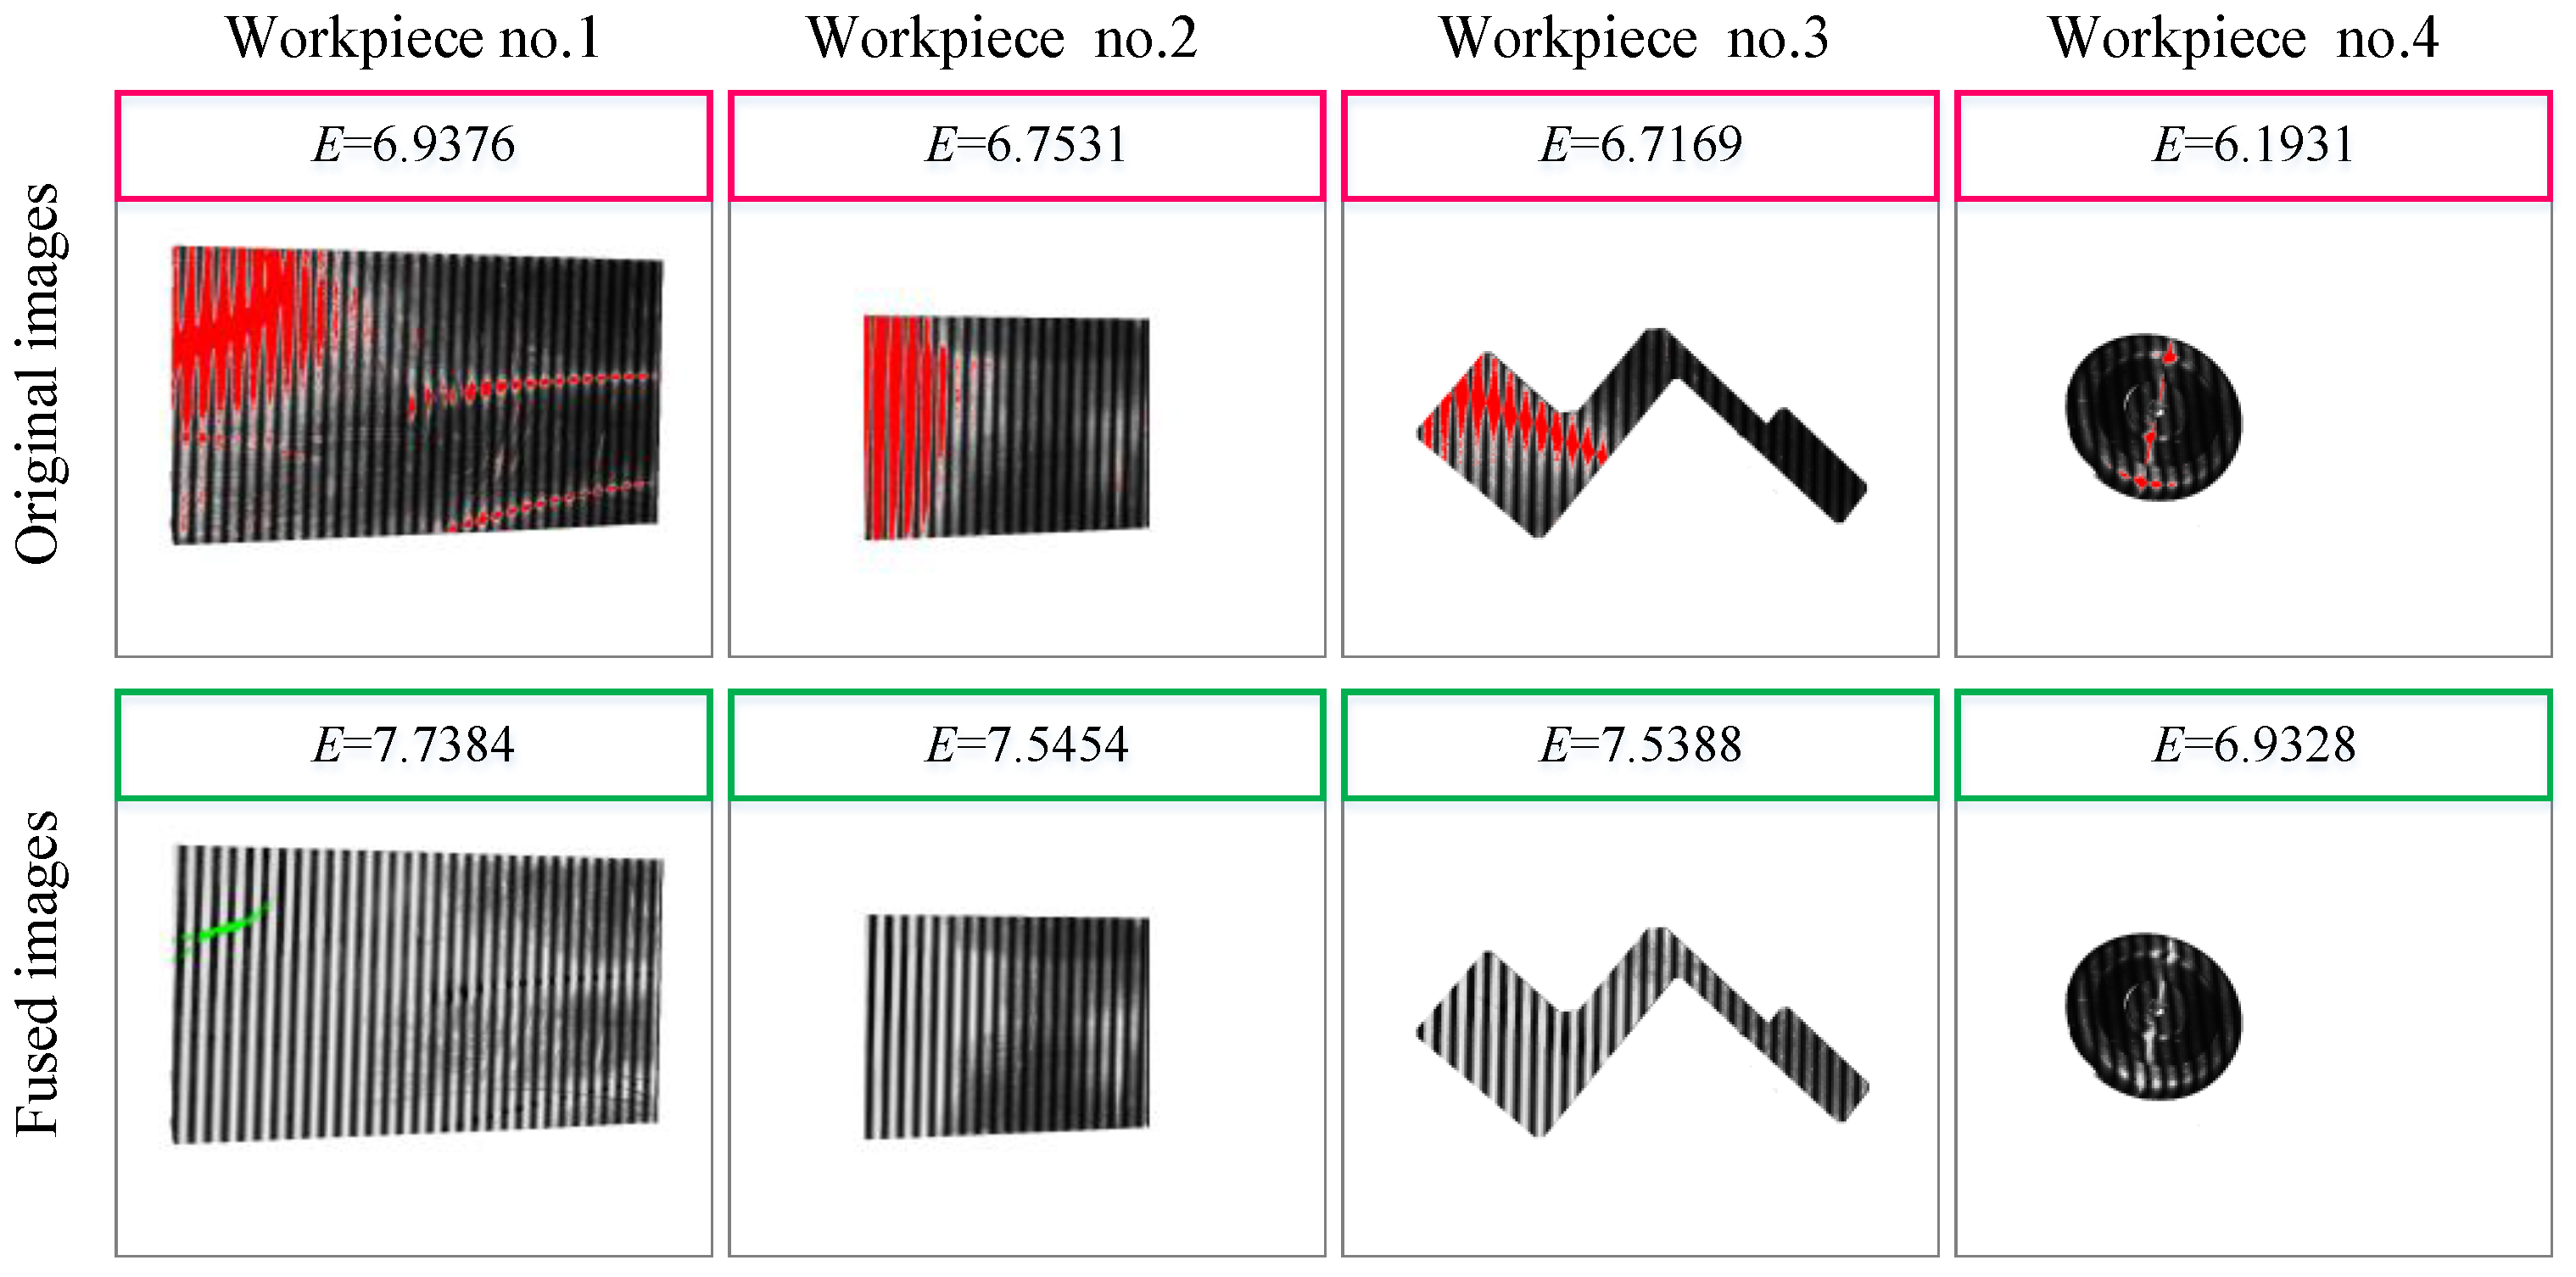
- Multiple exposure image fusion. Image fusion starts with the image group of three-frequency three-step fringe images captured at the largest exposure value, , by the pixel-by-pixel analysis. If a certain position pixel at this exposure value is not over-exposed in all the nine fringe images of this group, select this pixel, with its intensities in the nine phase shift images, to form the final fused images. Otherwise, if this pixel is overexposed in at least one image of the nine fringe images in this group, then select the image group at a lower exposure value to repeat the above judgment procedures. As shown in Figure 9b, a set of fused three-frequency three-step phase-shifting fringe images for both left and right cameras can finally be obtained in this way.
- (5)
- (6)
3. Experiments and Discussions
3.1. Adaptivity Verification of the Proposed Initial Exposure Searching Algorithm
3.1.1. Algorithm Adaptivity Verification in Different Ambient Lighting Conditions
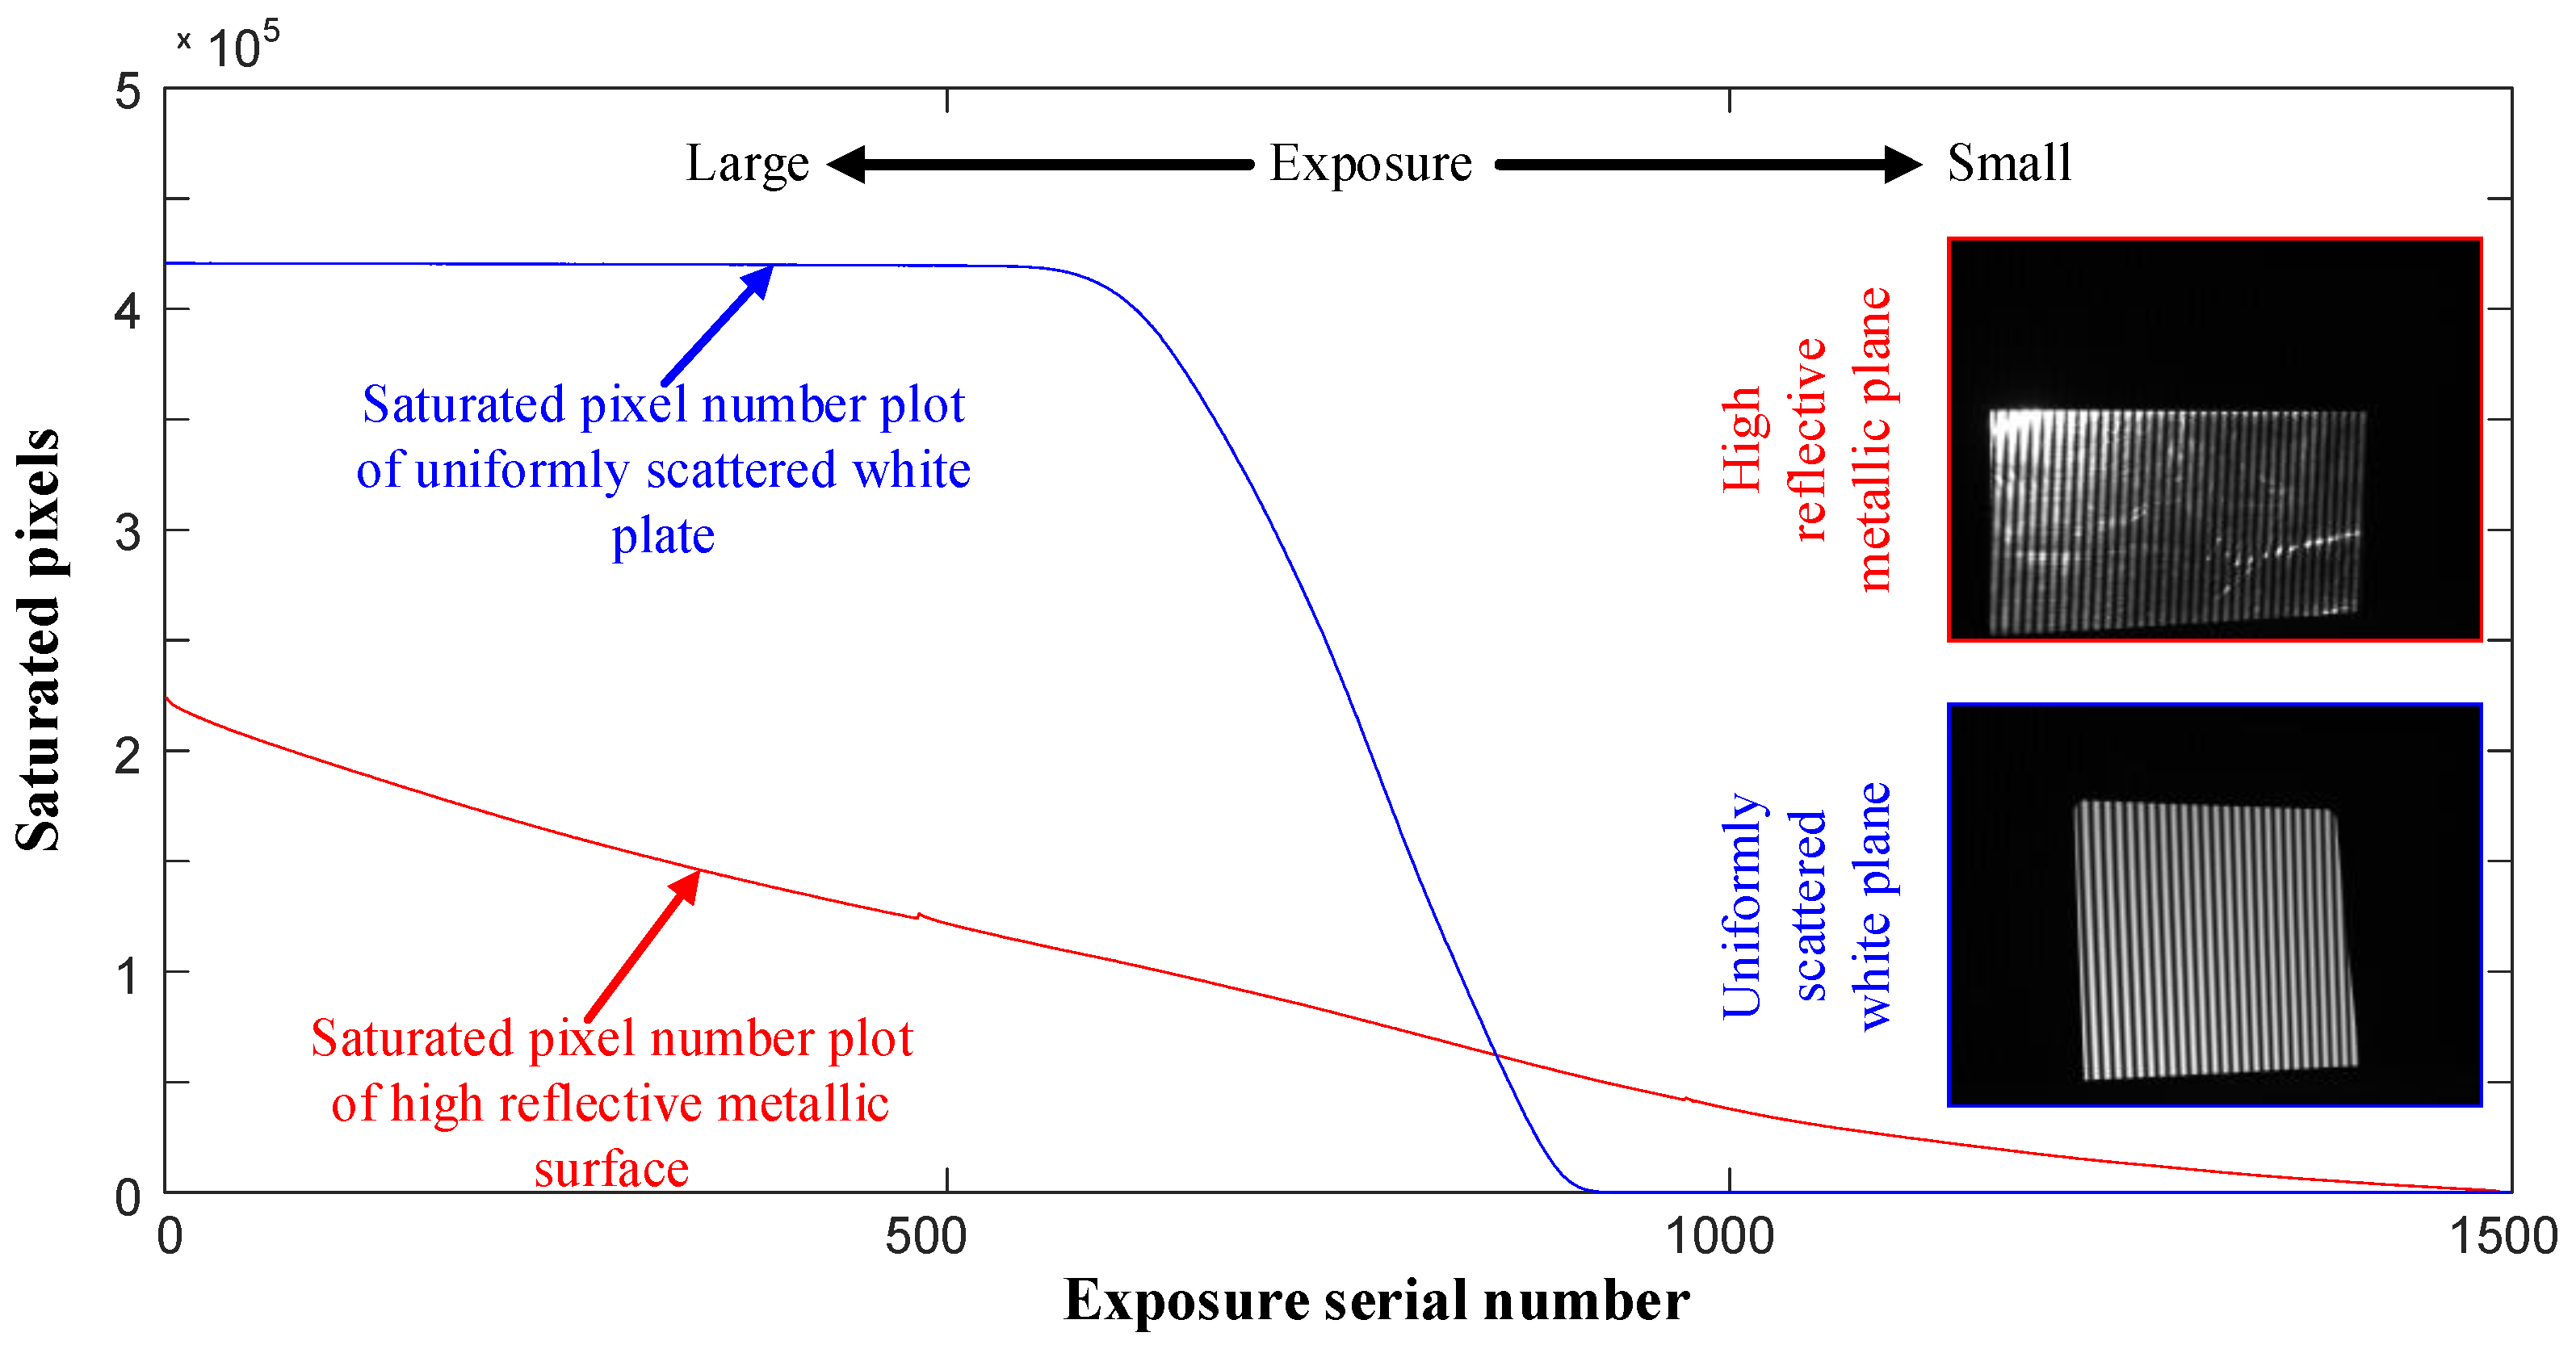
3.1.2. Algorithm Verification for Surfaces with Differences in Reflectivity
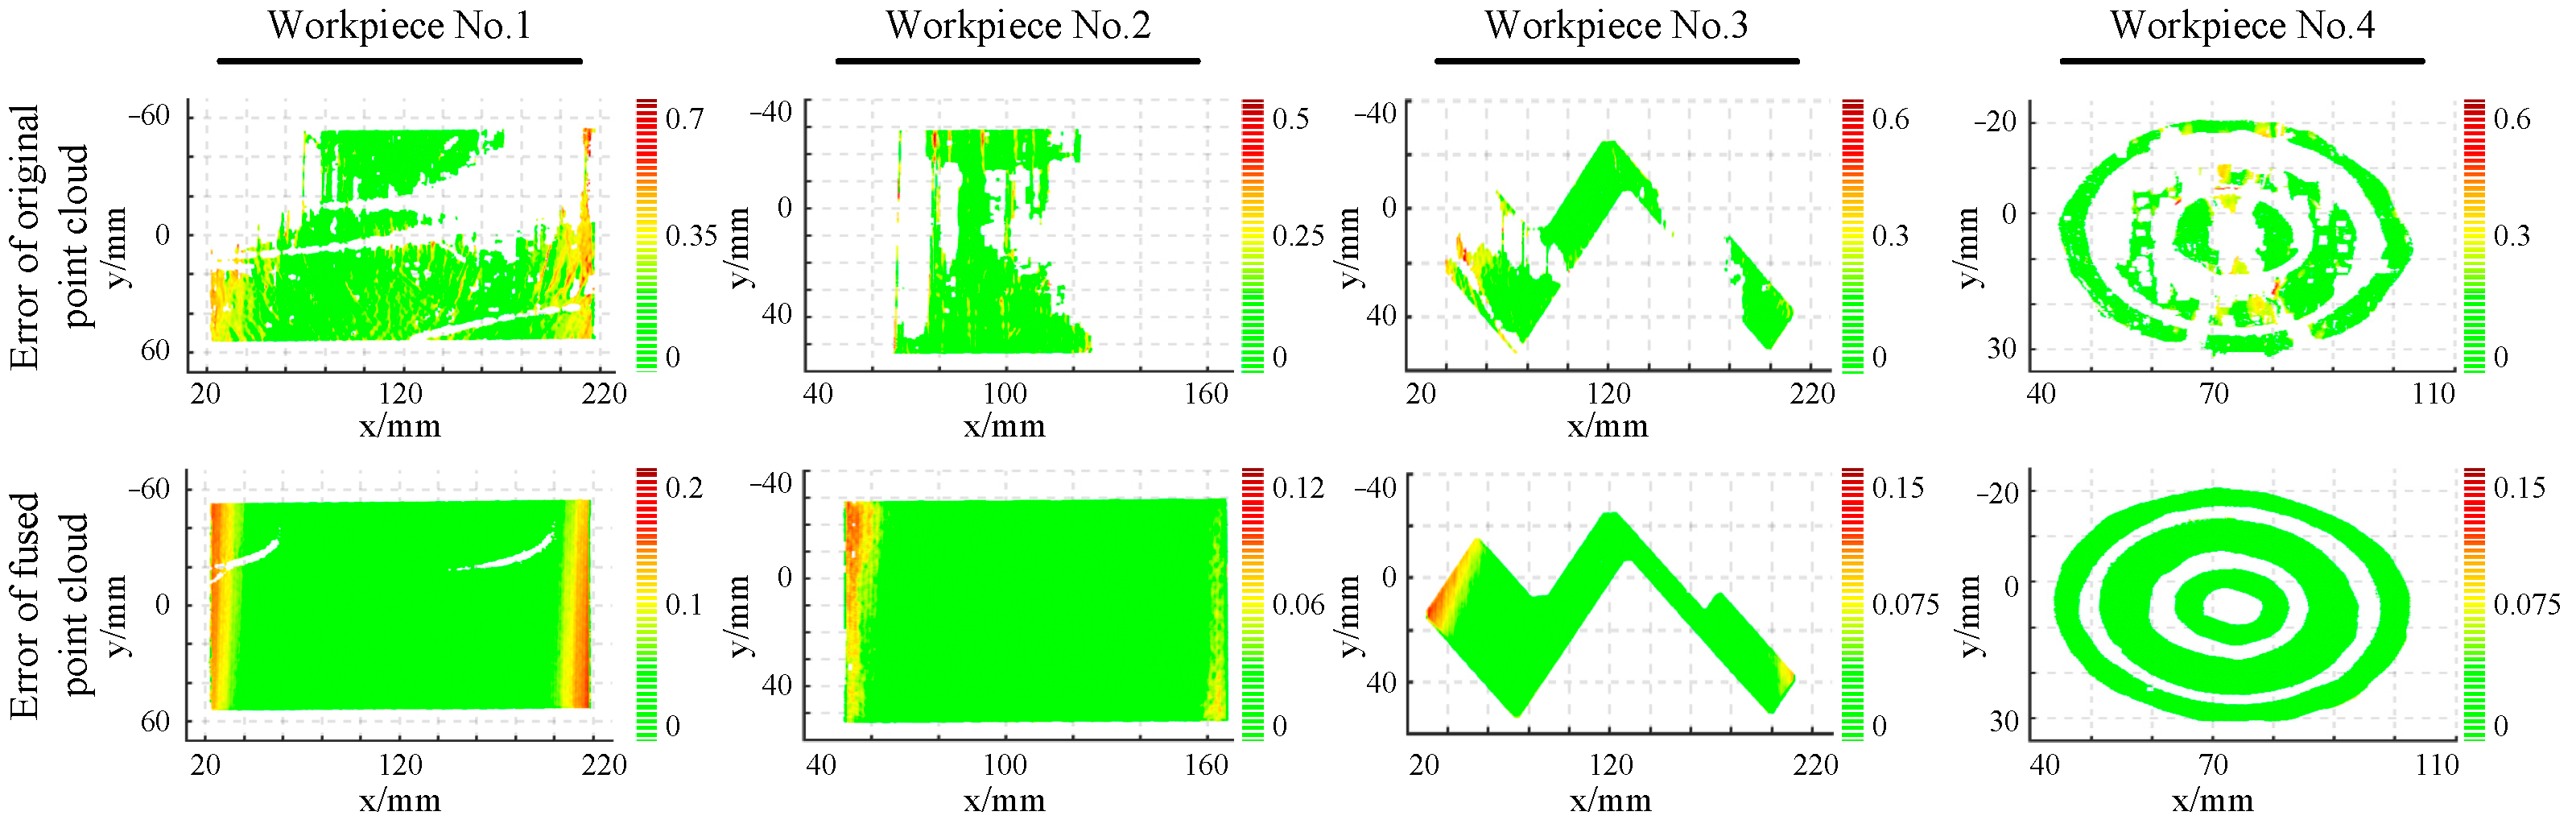
3.2. Measurement Verification of the Adaptive Multiple Exposure Fringe Fusion Method
4. Conclusions
Author Contributions
Funding
Data Availability Statement
Acknowledgments
Conflicts of Interest
References
- Chen, R.; Wang, G.; Zhao, J.; Xu, J.; Chen, K. Fringe Pattern Based Plane-to-Plane Visual Servoing for Robotic Spray Path Planning. IEEE/ASME Trans. Mechatron. 2018, 23, 1083–1091. [Google Scholar] [CrossRef]
- Li, J.; Chen, Z.; Rao, G.; Xu, J. Structured Light-Based Visual Servoing for Robotic Pipe Welding Pose Optimization. IEEE Access 2019, 7, 138327–138340. [Google Scholar] [CrossRef]
- Laughner, J.I.; Zhang, S.; Li, H.; Shao, C.C.; Efimov, I.R. Mapping cardiac surface mechanics with structured light imaging. Am. J. Physiol.-Heart Circ. Physiol. 2012, 303, H712–H720. [Google Scholar] [CrossRef] [PubMed]
- NIJ. Forensic Science Technology Working Group Operational Requirements. 2018. Available online: https://www.nij.gov/topics/forensics/documents/2018-11-forensic-twg-table.pdf (accessed on 21 September 2022).
- Zhang, S.; Yau, S.T. High-resolution, real-time 3d absolute coordinate measurement based on a phase-shifting method. Opt. Express 2006, 14, 2644–2649. [Google Scholar] [CrossRef] [PubMed]
- Zhang, S.; Yau, S.-T. High dynamic range scanning technique. Opt. Eng. 2009, 48, 33604. [Google Scholar]
- Ekstrand, L.; Zhang, S. Autoexposure for three-dimensional shape measurement using a digital-light-processing projector. Opt. Eng. 2011, 50, 123603. [Google Scholar] [CrossRef]
- Long, Y.; Wang, S.; Wu, W.; Liu, K. Accurate identification of saturated pixels for high dynamic range measurement. Opt. Eng. 2015, 54, 43106. [Google Scholar] [CrossRef]
- Waddington, C.; Kofman, J. Camera-independent saturation avoidance in measuring high-reflectivity-variation surfaces using pixel-wise composed images from projected patterns of different maximum gray level. Opt. Commun. 2014, 333, 32–37. [Google Scholar] [CrossRef]
- Babaie, G.; Abolbashari, M.; Farahi, F. Dynamics range enhancement in digital fringe projection technique. Precis. Eng. 2015, 39, 243–251. [Google Scholar] [CrossRef]
- Lin, H.; Gao, J.; Mei, Q.; He, Y.; Liu, J.; Wang, X. Adaptive digital fringe projection technique for high dynamic range three-dimensional shape measurement. Opt. Express 2016, 24, 7703–7718. [Google Scholar] [CrossRef] [PubMed]
- Yadid-Pecht, O.; Fossum, E. Wide intrascene dynamic range CMOS APS using dual sampling. IEEE Trans. Electron Devices 1997, 44, 1721–1723. [Google Scholar] [CrossRef]
- Cheng, H.-Y.; Choubey, B.; Collins, S. A High-Dynamic-Range Integrating Pixel With an Adaptive Logarithmic Response. IEEE Photon- Technol. Lett. 2007, 19, 1169–1171. [Google Scholar] [CrossRef]
- Bub, G.; Tecza, M.; Helmes, M.; Lee, P.; Kohl, P. Temporal pixel multiplexing for simultaneous high-speed, high-resolution imaging. Nat. Methods 2010, 7, 209–211. [Google Scholar] [CrossRef] [PubMed]
- Nayar, S.K.; Branzoi, V.; Boult, T.E. Programmable imaging using a digital micromirror array. In Proceedings of the 2004 IEEE Computer Society Conference on Computer Vision and Pattern Recognition, Washington, DC, USA, 27 June–02 July 2004. CVPR 2004. [Google Scholar]
- Ri, S.; Fujigaki, M.; Morimoto, Y. Intensity range extension method for three-dimensional shape measurement in phase-measuring profilometry using a digital micromirror device camera. Appl. Opt. 2008, 47, 5400–5407. [Google Scholar] [CrossRef] [PubMed]
- Nayar, S.K.; Branzoi, V.; Boult, T.E. Programmable Imaging: Towards a Flexible Camera. Int. J. Comput. Vis. 2006, 70, 7–22. [Google Scholar] [CrossRef]
- Feng, W.; Zhang, F.; Wang, W.; Xing, W.; Qu, X. Digital micromirror device camera with per-pixel coded exposure for high dynamic range imaging. Appl. Opt. 2017, 56, 3831–3840. [Google Scholar] [CrossRef] [PubMed]
- Jeong, J.; Min, Y.K. Adaptive imaging system with spatial light modulator for robust shape measurement of partially specular objects. Opt. Express 2010, 18, 27787. [Google Scholar] [CrossRef] [PubMed]
- Nayar, S.K.; Gupta, M. Diffuse structured light. In Proceedings of the 2012 IEEE International Conference on Computational Photography (ICCP), Seattle, WA, USA, 28–29 April 2012. [Google Scholar]
- Shannon, C.E. A mathematical theory of communication. Bell Syst. Tech. J. 1948, 27, 44. [Google Scholar] [CrossRef]
- Zhang, B.; Ziegert, J.; Farahi, F.; Davies, A. In situ surface topography of laser powder bed fusion using fringe projection. Addit. Manuf. 2016, 12, 100–107. [Google Scholar] [CrossRef]
- Du, H.; Chen, X.; Xi, J. An improved background segmentation algorithm for fringe projection profilometry based on Otsu method—ScienceDirect. Opt. Commun. 2019, 453, 124206. [Google Scholar] [CrossRef]


| Workpiece No.1 | Workpiece No.2 | Workpiece No.3 | Workpiece No.4 | |
|---|---|---|---|---|
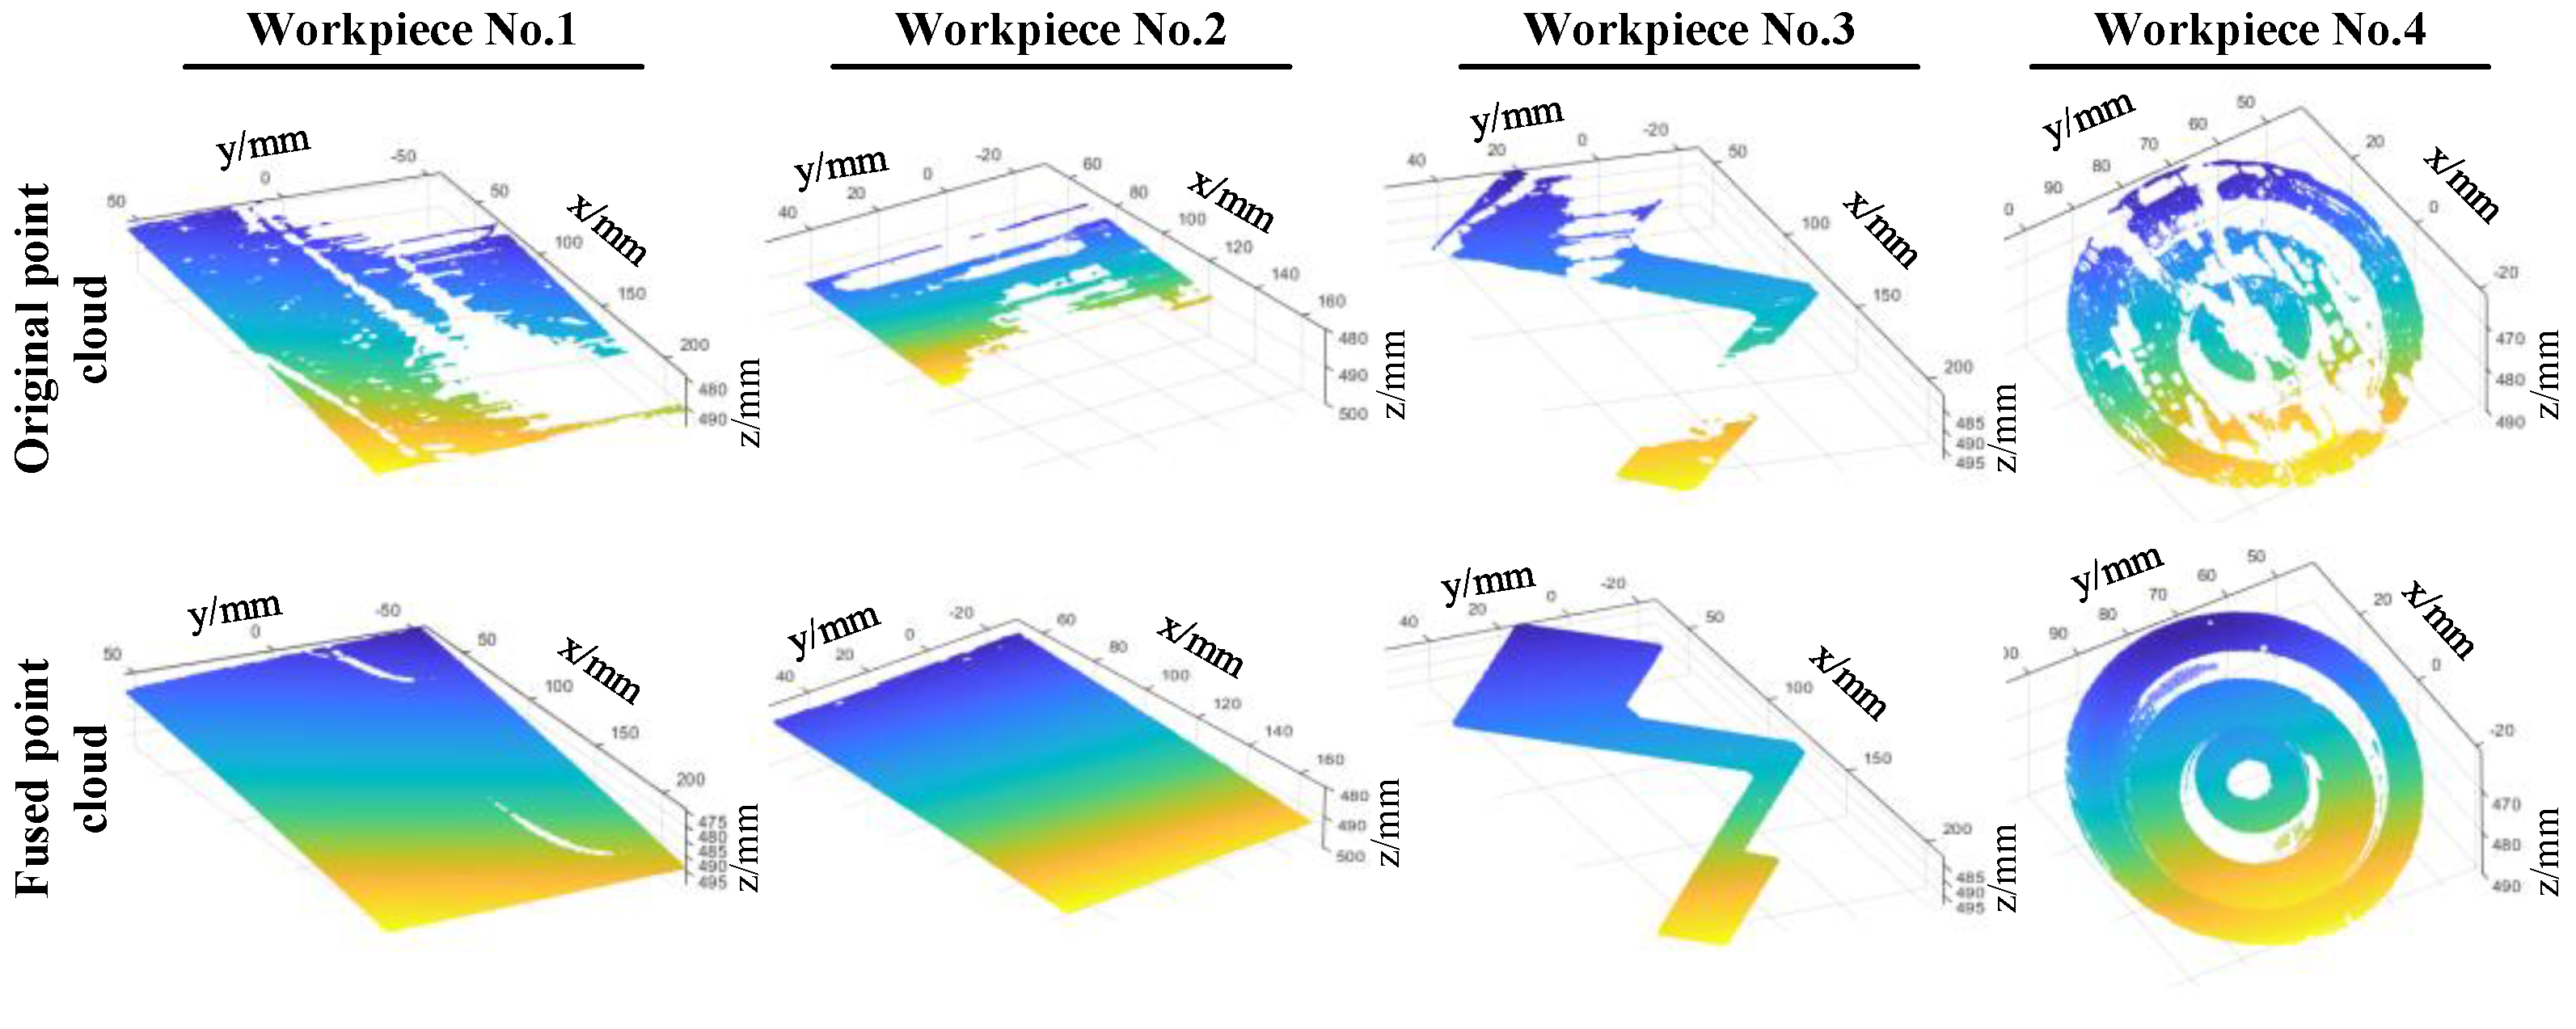
| Initial point cloud | 192535 | 23534 | 50454 | 4782 |
| Fused point cloud | 418859 | 129824 | 98169 | 33894 |
| Error Item | Workpiece No.1 | Workpiece No.2 | Workpiece No.3 | Workpiece No.4 | |
|---|---|---|---|---|---|
| Initial point cloud | Mean Error/mm | 0.0639 | 0.0478 | 0.0537 | 0.0496 |
| RMSE/mm | 0.1125 | 0.0942 | 0.0937 | 0.0786 | |
| Fused point cloud | Mean error/mm | 0.0332 | 0.0308 | 0.0281 | 0.0313 |
| RMSE | 0.0358 | 0.0362 | 0.0297 | 0.0344 |
Publisher’s Note: MDPI stays neutral with regard to jurisdictional claims in published maps and institutional affiliations. |
© 2022 by the authors. Licensee MDPI, Basel, Switzerland. This article is an open access article distributed under the terms and conditions of the Creative Commons Attribution (CC BY) license (https://creativecommons.org/licenses/by/4.0/).
Share and Cite
Chen, X.; Du, H.; Zhang, J.; Yang, X.; Xi, J. A Self-Adaptive Multiple Exposure Image Fusion Method for Highly Reflective Surface Measurements. Machines 2022, 10, 1004. https://doi.org/10.3390/machines10111004
Chen X, Du H, Zhang J, Yang X, Xi J. A Self-Adaptive Multiple Exposure Image Fusion Method for Highly Reflective Surface Measurements. Machines. 2022; 10(11):1004. https://doi.org/10.3390/machines10111004
Chicago/Turabian StyleChen, Xiaobo, Hui Du, Jinkai Zhang, Xiao Yang, and Juntong Xi. 2022. "A Self-Adaptive Multiple Exposure Image Fusion Method for Highly Reflective Surface Measurements" Machines 10, no. 11: 1004. https://doi.org/10.3390/machines10111004
APA StyleChen, X., Du, H., Zhang, J., Yang, X., & Xi, J. (2022). A Self-Adaptive Multiple Exposure Image Fusion Method for Highly Reflective Surface Measurements. Machines, 10(11), 1004. https://doi.org/10.3390/machines10111004