Article

An Intravascular Catheter Bending Recognition Method for Interventional Surgical Robots

School of Optoelectronic Science and Engineering, Soochow University, Suzhou 215131, China
*
Author to whom correspondence should be addressed.
Machines 2022, 10(1), 42; https://doi.org/10.3390/machines10010042
Submission received: 23 November 2021 / Revised: 29 December 2021 / Accepted: 3 January 2022 / Published: 6 January 2022
(This article belongs to the Topic Recent Advances in Robotics and Networks)

Abstract

:
Robot-assisted interventional surgery can greatly reduce the radiation received by surgeons during the operation, but the lack of force detection and force feedback is still a risk in the operation which may harm the patient. In those robotic surgeries, the traditional force detection methods may have measurement losses and errors caused by mechanical transmission and cannot identify the direction of the force. In this paper, an interventional surgery robot system with a force detection device is designed and a new force detection method based on strain gauges is proposed to detect the force and infer the bending direction of the catheter in the vessel by using BP neural network. In addition, genetic algorithm is used to optimize the BP neural network, and the error between the calculated results and the actual results is reduced by 37%, which improves the accuracy of catheter bending recognition. Combining this new method with traditional force sensors not only reduces the error caused by the traditional mechanical transmission, but also can detect the bending direction of the catheter in the blood vessel, which greatly improves the safety of the operation.

1. Introduction

Cardiovascular and cerebrovascular diseases are some of the most serious diseases that threaten human life and health. According to statistics, the number of deaths from cardiovascular and cerebrovascular diseases in developed countries accounts for 34% of the annual deaths [1]. At present, vascular interventional surgery is the best treatment for vascular diseases such as thrombosis, vascular sclerosis and vasoconstriction. The doctor sends the medical guidewire and catheter from the patient’s radial artery into the human blood vessel and pushes them to the blood vessel where the lesion is located for treatment. The surgical incision is small and the treatment effect is good, which is widely recognized in the world [2]. In the traditional operation process, the digital subtraction angiography system (DSA) is needed for positioning, even if wearing heavy metal protective clothing, the surgeons operating the catheter will still be injured by radiation [3]. Surgeons also need skills and experience to carry out the operation, which increases the difficulty of the operation. In traditional surgery, the surgeons must stand beside the patient and position the catheter and guidewire to the target location under the guidance of the digital subtraction angiography (DSA) system. This process often lasts for several hours, which may cause fatigue and tremor of the surgeon’s hands, thereby affecting the success of the operation and even threatening the life of the patient. Therefore, researchers around the world are increasingly interested in vascular interventional surgery robots which can perform remote surgery to reduce the fatigue and physical harm to the surgeons.
In recent years, the research on interventional surgical robots has increased year by year [4]. There are many mature commercial surgical robot systems. In 2002, Steracoaxis Inc, St. Louis, MO, USA, developed the NIOBE remote navigation system which can navigate the catheter by a magnetic field [5]. In 2005, the CorPath 200 robot system was developed by Corindus Vascular Robotics, Waltham, MA, USA. It can use friction wheels to control the clamping and rotation of the catheter [6]. The Amigo robot system designed by Catheter Precision in 2008 provides a multi-degree-of-freedom steerable catheter controller on the slave control side [7].
In addition to the commercial products mentioned above, universities all over the world have also designed many kinds of vascular interventional surgery robotic systems. Most of them have master–slave control structure. Doctors operate the master manipulator in the control room to control the advance of the guidewire and catheter at the slave side, so as to keep doctors away from radiation and ensure their own safety. At the same time, it can offset the disturbance of the intravascular catheter caused by hand tremors and improve the safety of operation [8]. Yogesh et al. developed a remote catheter navigation system, which can remotely operate the catheter in axial and radial directions [9]. The master–slave operating system designed by Ma et al. was equipped with sensors to detect the axial force signal [10]. Relying on mechanical structure transmission, the front force is transmitted to the sensor module at the end of the guide. However, due to the gap between the mechanical structure and the friction of the transmission, the accuracy of this method is not high. Guo et al. designed the force feedback structure with magnetorheological fluid to enhance the operation safety [11]. This method can well realize the force feedback on master side, but as the number of uses increases, there is a risk of liquid leakage, and the service life is not long. Guo et al. used the 6-DOF manipulator as the master–slave manipulator, which enhanced the telepresence of the operation and increased the feedback of the main end force [12]. Cheng et al. used fuzzy PID control in the system, which effectively improved the accuracy of master–slave control [13]. Wang et al. added closed-loop force feedback and friction feedforward, greatly improving the delivery accuracy of the catheter guidewire [14]. Payne proposed a force measurement method by sticking strain gauges on the head of the catheter [15], which can accurately detect the force and direction generated by the collision between the catheter and the vessel. The disadvantage is that it increases the size of the catheter head, and there is a risk of vascular injury. Zhou et al. proposed a kind of constraint tube with thin-film sensor and gave the robot motion safety strategy with nine different motion constraint coefficients [16]. Yu et al. designed a new type of flexible clamping device to push the guidewire, which greatly improved the precision and stability of surgery [17]. Zhang et al. developed a magnetorheological fluid (MR)-based robot-assisted catheter/guidewire surgery system that increases the reality of the operation [18].
These surgical systems can achieve high-precision real-time control and effectively reduce the radiation received by doctors. However, in these systems, force sensors are usually installed in the slave side which is responsible for holding and pushing the catheter to detect the force on the front catheter through the transmission of mechanical structure. The sensor will inevitably lead to inaccurate measurement because of the gap and friction between the structures. At the same time, the sensor can only detect the axial conduction force of the catheter, and it cannot accurately identify the direction of collision between the catheter and the vessel. The traditional force measurement method has many defects, but it is almost impossible to accurately measure the collision force between the blood vessel and the catheter in the human body. All force sensors on the market cannot be installed on the head of the catheter due to size problems. Moreover, installing the sensor on the head of the catheter to enter the human blood vessel can easily scratch the blood vessel wall at the bend of the blood vessel, which causes great danger to the patient. In summary, the traditional force sensor is still needed during the operation, but the surgeon can only use its measured value as a reference. The biggest flaw in the traditional measurement method is the inability to judge the direction of the force, that is, the direction in which the catheter is bent in the human blood vessel.
In this paper, a strain gauge-based method for identifying the bending deformation of the intravascular catheter is proposed. The motion model of the catheter in the blood vessel was established and simulated to determine the external deformation area for pasting the strain gauges. At the same time, the same strain gauges were pasted on the front of the catheter, and the voltages of all the strain gauges and force sensors were collected when the catheter collided and bent while entering into the blood vessel model. After data acquisition, BP neural network was used for training, and the voltage change of internal strain gauges was judged by the voltage change of external strain gauges, so as to realize the bending recognition of the catheter inside the blood vessel. Combined with the signal of the force sensors for analysis, this method can achieve a better safety guarantee than traditional surgical robots.
The remainder of this paper is structured as follows: In Section 2, a surgery robot system that co-operates the catheter and guidewire is introduced. The catheter model is established and its motion deformation in the blood vessel is simulated. In addition, the basic principle of strain gauge and BP neural network algorithm is introduced. In Section 3, the principle and steps of the experiment are introduced. The BP neural network is used to train the experimental data and the error is analyzed. The genetic algorithm is used to optimize the BP neural network to further optimize and reduce the error between the predicted value and the actual value. The conclusion is presented in Section 4.

2. Principle and Simulation

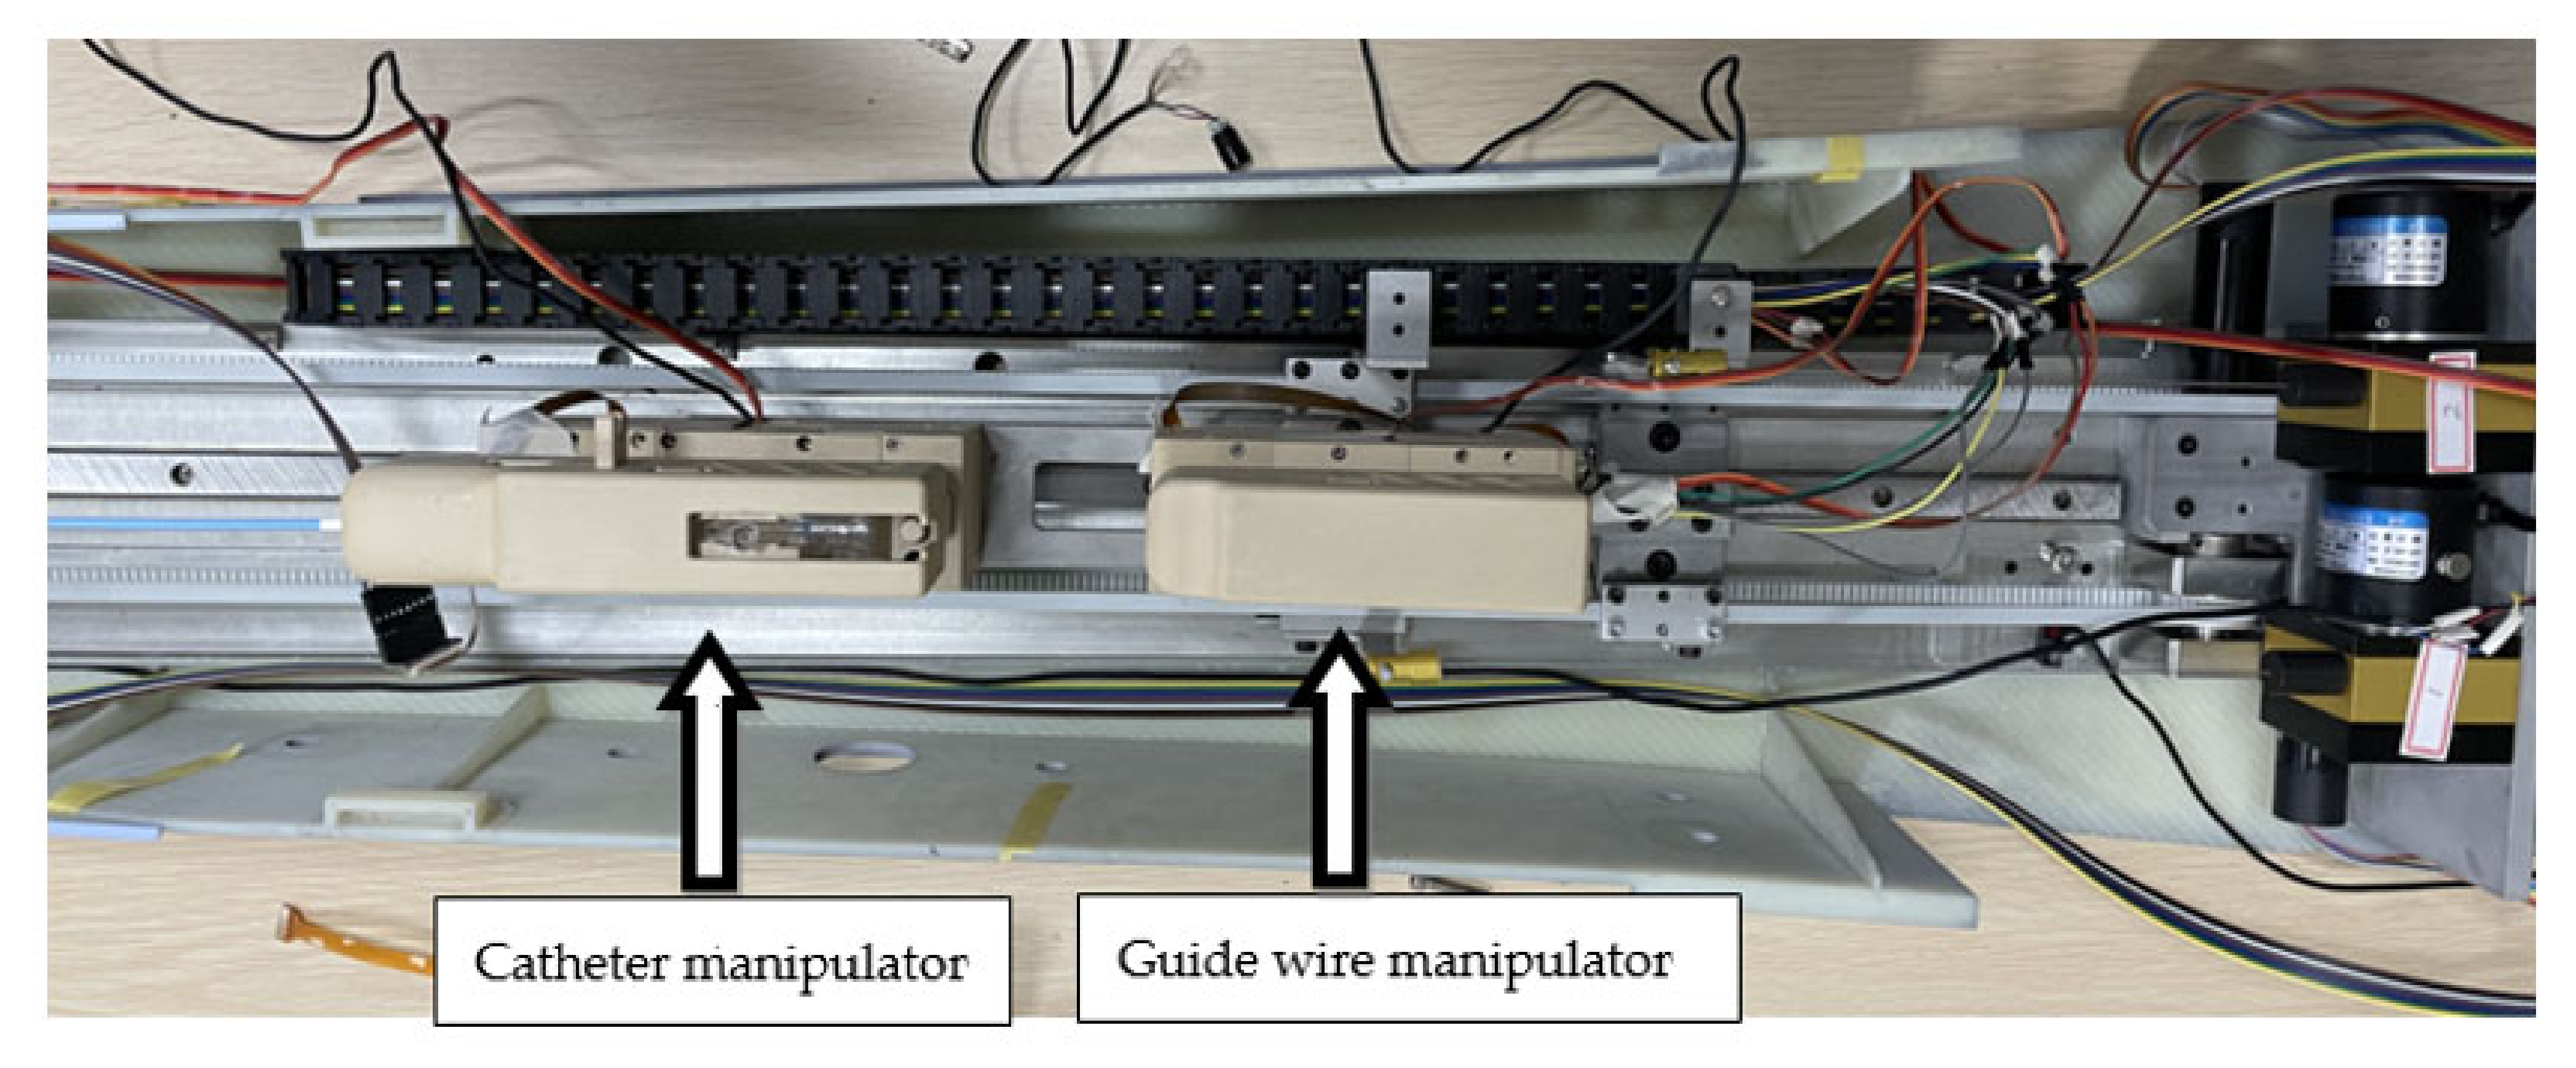
2.1. Overview of the Surgical Robot System

In the traditional interventional surgery, the guidewire is mainly responsible for providing the propulsion path in the narrow vessels and guiding the catheter. The surgeon can feel the resistance of the guidewire and catheter in the blood vessel through the fingers. The feedback force information generated by resistance can help the surgeon determine whether the guidewire and catheter are safe to move in human blood vessels. In short, the operation of the guidewire and catheter can be divided into two parts: pushing and rotating. Push action makes the guidewire and catheter reach the lesion, and rotating the guidewire and catheter can make them pass through the bifurcations or the bends of blood vessels more smoothly, so as to ensure the safety of patients. Based on this, our surgical robot system needs to be designed with two degrees of freedom: a rotational degree of freedom and a linear motion degree of freedom.
Figure 1 shows the workflow of the surgical robot. The robot system is mainly composed of three parts: the master manipulator, the slave manipulator and the motion controller (PMAC controller). In order to ensure the success rate of surgery, the surgical robot system should imitate the surgical actions of surgeons as much as possible.
The master side is the system control side, including two operating controllers which are respectively responsible for controlling the propulsion and rotation of guidewire and catheter. The master side is located outside the operating room to protect doctors from radiation damage.
The slave side is the robot action system, which is used to reproduce the surgeon’s operation instructions. The structure of the slave side is shown in Figure 2. There are two modules on a linear movement platform, which are respectively responsible for pushing or rotating the guidewire and the catheter. The slave side and the master side are connected by shielded twisted pair cables. When the surgeon operates the master manipulator, the motion information will be obtained by the computer on the master side and transmitted to the motion controller through RS232 communication protocol. The motion controller transmits the obtained signal to the slave side and drives the slave motors to push the guidewire and catheter from outside into the patient’s blood vessel. At the same time, the digital subtraction angiography system collects the position information of the catheter and the guidewire during operation and transmits it to the computer monitor on the master side so that surgeon can ensure the safety of the operation.
A force sensor is installed inside each module. As shown in Figure 3, when the catheter collides or rubs against the blood vessel wall during the catheter pushing process, the resistance of the catheter will be transmitted to the force sensor through the internal mechanical structure of the module. The model and parameters of the force sensor are shown in Table 1.

2.2. Catheter Motion Simulation

To be able to advance in the blood vessel, the medical catheter must have a certain hardness while ensuring its softness and flexibility. The hardness can ensure the integrity of force transmission when the catheter is pushed. Based on this point, many research groups put the force sensor in the push device from the slave side, as shown in Figure 3, and detect the force on the front catheter by mechanical transmission. This method is easy to implement, but due to the gap of the mechanical structure and the interference caused by blood flow, this method can only detect the general resistance during the pushing process of the catheter, and the bending direction cannot be detected, which limits the ability of the doctor to judge the safety of the operation.
In the traditional manual operation, the doctor continuously delivers the catheter by his own hand. However, the interventional surgical robot can only hold the end of the catheter to push because of its structure. This leads to the bending of the catheter due to the force on the side of the catheter head when the catheter passes through the bend of the blood vessel. This phenomenon is unique to the operation of the surgical robot, so we can use this phenomenon to analyze the catheter state and find out the deformation relationship between the end of the catheter (outside the human body) and the catheter head (inside the blood vessel) when the catheter passes through the curved blood vessel. Figure 4 shows the force analysis of the contact point when the catheter is pushed to the bend of the blood vessel.
In Figure 4, F 1 is the force of the catheter colliding with the blood vessel wall, which can be converted into vertical pressure F 3 and lateral force F 2 to the blood vessel wall. Under ideal conditions, the blood vessel wall will not rupture, and the support force of the blood vessel wall to the catheter is F 4 . Their relationship is:
F 3 = F 4
Due to the influence of F 2 , the head of the catheter begins to move forward along the vessel wall, and the catheter is subjected to the frictional force of the vessel wall F 5 . The angle between F 5 and the horizontal direction is α, and the angle between F 4 and the horizontal direction is β. Therefore, the traditional force detection method excludes the interference of catheter bending, mechanical structure gap and friction force. The detected force is actually:
F 5 × c o s α + F 4 × c o s β
F 6 is the combined force of F 5 and F 4 . It is the effect of F 6 that causes the catheter to bend as shown in Figure 5 when it is advanced to the bend of the blood vessel.
The catheter model was established based on an actual medical catheter. The 8F catheter commonly used in surgery was selected as the prototype to establish the model; the key parameters are shown in Table 2. Figure 6a shows the established conduit model, and Figure 6b shows the impact force applied to it during simulation. The arrow indicates the applied pressure.
Figure 7 shows the deformation results of the simulation, with small deformation in blue and large deformation in red. The results show that the force on the head of the catheter has an effect on the deformation of the posterior catheter, and the bending direction is the same as that in the front. The length of the catheter is 80 cm. According to the simulation results, 10 cm from the tail of the catheter is selected as the stress analysis point. The deformation here and the deformation of the catheter head are analyzed to further find the corresponding relationship between them.

2.3. Pasting of Strain Gauges

The proposed force measuring device, shown in Figure 8, consists of four strain gauges at the head of the catheter and four strain gauges at the rear of the catheter. According to the previous simulation, the strain gauges are pasted at 3 cm from the head of the catheter and 10 cm from the tail of the catheter. The strain gauge is made of Cu-Ni alloy and has good stability under repeated loading. The strain gauge we selected (BFH350-6AA) has a very long service life and an operating temperature range of −20 to 120 °C, which is suitable for the experiment. Strain gauges make good use of the physical and geometric properties of the conductor. When a conductor is stretched by an external force within its elastic limit, it will not be broken or produce permanent deformation but will become narrower and longer. This deformation causes its terminal resistance to increase [19]. On the contrary, when a conductor is compressed, it becomes wider and shorter, and this deformation causes its terminal resistance to become smaller. Through the peripheral voltage and amplifier circuit, we can obtain different output voltages to judge the bending of the strain.
The four strain gauges were pasted in four directions, respectively, to measure the bending strain of the catheter in different directions. The strain gauge is connected in a half-bridge type. The overall circuit is shown in Figure 9. The external power supply voltage is E and the output voltage is e . The initial resistance of the strain gauge is 350 ohms. The resistance values of strain gauge after bending are recorded as R 1 and R 2 . Therefore, the change of the resistance can be expressed as:
Δ R 1 = R 1 R 1 Δ R 2 = R 2 R 2
According to Kirchhoff’s current law and Ohm’s law, we can obtain the relationship between input E and output e in a balanced state:
e = R 1 R 4 R 2 R 3 R 1 + R 2 R 3 + R 4 E
After introducing the resistance increment, the formula is:
e = R 1 + Δ R 1 R 4 R 2 + Δ R 2 R 3 R 1 + R 2 + Δ R 1 + Δ R 2 R 3 + R 4 E
The equilibrium condition. R 1 R 4 = R 2 R 3 can be brought into (3) and the high-order small quantities can be omitted to obtain the formula:
e = E R 1 R 2 ( R 1 + R 2 ) 2 Δ R 1 R 1 Δ R 2 R 2
In the actual situation, we take R 1 = R 2 = R 3 = R 4 ; then, (4) can be simplified to:
e = 1 4 Δ R 1 R 1 Δ R 2 R 2 E
Let K be the sensitivity of the strain gauges and let ε 1 and ε 2 be the degree of bending of the strain gauges, then there is:
Δ R 1 R 1 = K ε 1 Δ R 2 R 2 = K ε 2
According to (6), Formula (5) can be rewritten as:
e = 1 4 K ε 1 ε 2 E
The upper and lower strain gauges are one group, and the left and right strain gauges are another group. The strain produced by bending deformation is equal in magnitude and opposite in sign. From a mathematical point of view, the value in parentheses in (7) becomes twice the strain produced on each strain gauge. Therefore, the change in voltage due to strain can be measured.

2.4. The BP Neural Network

In recent years, thanks to the performance enhancement of computers and handheld embedded devices, neural networks have been widely used in various fields, including image recognition, robot control and unmanned driving. The medical field is gradually becoming a treasure land of neural network applications. Backpropagation (BP) neural network is the most common and widely used one. BP neural network is a kind of multilayer network trained by error backpropagation algorithm. By calculating the error between each result and the ideal value, BP network can feed back to the hidden layer, so as to automatically adjust the threshold and weight of the hidden layer to reduce the error between the predicted value and the actual value [20]. After repeated training, BP neural network can well solve many nonlinear fitting problems, so it is a very good choice for the application of interventional surgical robots.
Figure 10 shows the BP neural network used in this paper, which is divided into input layer, hidden layer and output layer. The input layer has two input units, which are the voltages of two groups of strain gauges at the end of the catheter (outside the human body). The number of hidden layer units is set as 5 layers, which are responsible for calculating and outputting the results. The output layer is the voltage of strain gauges at the head of the catheter (in human body). In practical application, we only need to paste the strain gauges at the end of the catheter, collect the voltage and replace it into the neural network, so we can predict the voltage of the strain gauges at the head of the catheter, so as to judge the bending deformation of the head of the catheter. The input of the network input layer is:
O j = x j           j = 1 , 2
The input and output of the hidden layer of the network are:
n e t i 2 k   = j = 0 4 w i j 2 O j 1
O i 2 k   = f n e t i 2 k       i = 1 , 2 , 3 , 4 , 5
In (10), w i j 2 is the weighting coefficient of the hidden layer, and the superscripts (1), (2) and (3) represent the input layer, hidden layer and output layer, respectively. Assume that the activation function of the hidden layer neuron takes the Sigmoid function:
f x   = 1 1 + e x
The input and output of the network output layer are:
n e t l 3 k   = i = 0 5 w l i 3 O i 2 k
O l 3 = f n e t l 3 k
Select the performance index function as:
E k   = 1 2 ( r i n k y o u t k ) 2
Modify the weight coefficient of the network according to the gradient descent method; that is, search and adjust the negative gradient direction of the weight coefficient according to E(k), and the weight adjustment amount is:
Δ w l i 3 k   = η E k w l i 3
η is the learning rate. There is another formula:
E k w l i 3 = E k y k y k Δ u k Δ u k O l 3 k O l 3 k n e t l 3 k n e t l 3 k w l i 3
and
E k y k = e k
y k Δ u k = s g n ( k )
Δ u k O 1 3 k = Δ e k  
Δ u k O 2 3 k = e k
Δ u k O 3 3 k = Δ e k Δ e k 1
O l 3 k n e t l 3 k = f n e t l 3 k
n e t l 3 k w l i 3 = O i 2 k
Put the above formula into (16) to obtain the output layer weight adjustment amount as:
Δ w l i 3 k   = η ϕ l 3 O i 2 k
In (24), there is:
ϕ l 3 = e k s g n ( k ) Δ u k O l 3 k f n e t l 3 k
In the same way, the hidden layer weight adjustment amount can be obtained as:
Δ w l i 3 k   = η ϕ i 2 O j 1 k
and
ϕ i 2 = f n e t i 2 k l = 1 3 ϕ l 3 w l i 3 k           i = 1 , 2 , 3 , 4 , 5
In this experiment, the voltage changes of the upper and lower strain gauges and the left and right strain gauges at the end of the catheter are selected as the input, and the voltage of the corresponding strain gauge at the head of the catheter is the output. The number of hidden layer nodes is set to 5. The overall steps are as follows:
(1)
Determine the number of nodes in each layer, determine the initial value of the weighting coefficient Δ w i j 2 0 and Δ w l i 3 0 and select the learning rate η .
(2)
Sample to obtain r i n k and y o u t k ; calculate the error at this moment ( e k   = r i n k y o u t k ).
(3)
Calculate the input and output of each layer of the neural network.
(4)
Adjust the weighting coefficients Δ w i j 2 and Δ w l i 3 through the gradient descent method to achieve parameter adjustment.
(5)
Let k = k + 1 ; return to step (1).

3. Experiments and Results

3.1. Experiment Procedure

The experiments are simulated with vascular models. The interventional surgical robot was used to push the catheter into the blood vessel model, shown in Figure 11, at a constant speed until the catheter head completely passed through the first blood vessel bend. The output voltage of the strain gauge circuits was recorded during the pushing process, and the experiment was repeated many times to prevent the inaccurate training of the neural network caused by insufficient data. For the training of the neural network, the data need to be normalized and the Sigmoid function needs to be used as a nonlinear activation function. The value range of the Sigmoid function is 0–1, so negative numbers cannot appear when data are normalized. Based on the above principles, the potentiometer was adjusted to make the initial output voltage of the strain gauges circuit 1.5 V to ensure that there is no negative voltage within the voltage variation range to maintain the stability of the neural network. A total of 200 groups of catheter pushing experiments at different angles were carried out; each pushing time was 30 s, and the voltage sampling frequency was 5 Hz. So, a total of 30,000 groups of voltage samples were collected. Eighty percent of each group was substituted into the neural network for training, and the remaining 20% was transferred after training.
Figure 12 shows the voltage change of the strain gauges during a push. In Figure 12, the blue line AD1 represents the voltage change of the strain gauges in the left and right direction of the catheter head. The red line AD2 represents the voltage change of the strain gauges in the up and down direction of the catheter head. Correspondingly, the yellow line AD3 represents the voltage change of the strain gauges in the left and right direction of the rear end of the catheter which does not enter the human body. The purple line AD4 represents the voltage change of the strain gauges in the up and down direction of the back of the catheter. In Figure 12, we can see that the AD1 line has gone up and down once, which corresponds to the second bending of the catheter (vascular curve 2 in Figure 11) in the left and right direction in the blood vessel. The AD3 line corresponding to the rear of the catheter also has a corresponding slight change. This is a test of left and right bending, so the AD2 and AD4 corresponding to the up and down directions do not change significantly, and there is only a slight disturbance. During this push, the force detected by the traditional force sensor in the catheter push module is recorded at the same time as shown in Figure 13. As a comparison, we can find that the traditional force sensor cannot recognize the bending of the catheter in the blood vessel, but can only detect the resistance during propulsion, which may affect the doctor’s judgment on the safety of the operation.
The catheter was rotated 90 degrees and the push experiment was conducted again. We can see the voltage change in the left–right direction shown in Figure 14, which also shows the same characteristics. The catheter was rotated 45 degrees and the experiment was performed again. The catheter was pushed into the blood vessel model, and the voltage change of strain gauges in each direction was obtained, as shown in Figure 15. In Figure 15a, the voltage changes in each direction. Because the catheter is relatively thin, there is not a strain gauge on the market small enough to paste around the catheter. Therefore, when pasting the strain gauges, there is a space between the two strain gauges in the x-axis direction and the two strain gauges in the y-axis direction (as shown in Figure 8), which will delay the change of the two groups of voltage signals. As shown in Figure 15b, we can infer the direction of catheter deformation in the blood vessel. So far, we can infer the bending direction of the catheter head through the voltage change of the strain gauge at the end of the catheter, that is, the change of AD3 and AD4. The change of AD3 represents the bending degree of the catheter in the horizontal direction, while the change of AD4 represents the bending degree in the vertical direction. By subtracting the voltage AD1 and AD2 of the two strain gauges at the catheter head, we can determine the direction of the catheter head bending at the moment. The catheter was rotated 5 degrees for an experiment to collect the strain gauge voltage, and the relationship between the catheter direction and voltage was obtained, as shown in Figure 16.
As shown in Figure 16a, the bending direction of the catheter can be divided into four chunks according to the positive and negative values of AD1 and AD2 (based on the reference voltage of 1.5 V, the value greater than 1.5 V is positive, and the value less than 1.5 V is negative). In each block, the bending direction of the catheter head can be obtained by subtracting the two strain gauge voltages AD1 and AD2 at the catheter head. The catheter was rotated 5 degrees for an experiment to collect the strain gauge voltage, and the relationship between the catheter direction and voltage was obtained, as shown in Figure 16b–e. Firstly, the force area is selected by the positive and negative values of AD1 and AD2, and then the force angle is determined by the value of AD1-AD2. It should be noted that in the range of 90–180° and 270–360°, the value of AD1-AD2 is not in one-to-one correspondence with the angle, and the size relationship between the absolute values of AD1 and AD2 should be determined in advance, as shown in Figure 16b,e for specific differentiation.

3.2. Training and Results

We took 80% of all the data as samples; the voltage change of the strain gauges at the rear of the catheter was two sets of inputs, namely AD3 and AD4, and the voltage change of the strain gauges at the head of the catheter, AD1 and AD2, was used as the output to train the network. After the training was completed, the AD3 and AD4 in the remaining 20% of the data were substituted into the trained network, and the results obtained were compared with AD1 and AD2 to test the reliability of the neural network.
After the training was completed, the samples were substituted for testing. The test results are shown in Figure 17. The R value in the figure represents training accuracy. The closer R is to 1, the better the training effect [21]. The remaining data were substituted into the network for verification, and the image obtained is shown in Figure 18. The blue line AD3 represents the voltage change of the strain gauges at the end of the catheter. The data were substituted into the neural network for prediction, and the orange line AD1 is the voltage change predicted by the strain gauges at the catheter head. The image result is basically accurate.
In a comparison with the original data, Figure 19 shows the error. The statistical results show that the overall average error is 0.11 V.

3.3. Optimization of Neural Network

Although the above BP neural network has been able to better predict the deformation of the catheter head through the voltage signal of the strain gauge at the tail of the catheter, there are still some shortcomings: Although the average error is within the acceptable range, the error is too large at some time points, which may affect our prediction results. This may be due to the characteristics of the BP neural network itself. A BP neural network has good self-adapting, self-learning and ability of generalization, but it may become stuck in a local minimum, and the convergence rate is also slow. In the conventional BP neural network, we use the gradient descent method to train the data. In the ideal case, we can find the global minimum by continuously deriving the loss function to ensure the minimum error. In reality, the loss function is very complex. Taking the three-dimensional graph of the loss function shown in Figure 20 as an example, the gradient descent method easily falls into the local minimum value and thus cannot reach the global minimum value, or it falls into the saddle point, that is, the gradient around is all 0, and cannot escape from this area, so as to not reach the global minimum value, leading to the prediction deviation.
The genetic algorithm might resolve the issue of the BP neural system being prone to falling into local minima [22]. Therefore, the combination of the genetic algorithm and the BP neural network can improve the efficiency of training and the accuracy of prediction. The genetic algorithm simulates the natural evolution process to find the optimal solution. The weights and thresholds that need to be optimized are regarded as a kind of biological population and are constantly changed. The individual is screened according to the result error, so as to select the most suitable weights and thresholds for the neural network. The algorithm flow of the BP neural network optimized by the genetic algorithm is shown in Figure 21.
In the optimization, there are two ways to code the weight and threshold. One is binary coding, and the other is real coding. Binary encoding is where each weight is represented by a fixed-length 0,1 string. Real number coding uses real numbers to represent each weight, which overcomes the disadvantages of binary coding but requires the redesigning of the operator. A fitness function is a standard used to judge the quality of the data, and it is usually obtained by the transformation of the objective function. In this optimization, our goal is to find the minimum value of the error between the actual output and the expected output, so the reciprocal of the function value is taken as the fitness value of the individual. The larger the fitness value is, the more qualified the individual is.
The selection operation selects excellent individuals from the original group with a certain probability to form a new group. The higher the fitness of individuals, the higher the probability of being selected. The probability of individual i being selected is:
p i = F i j = 1 N F j
where F i is the fitness value of individual i and N is the total number of the population.
Crossover operation means that two individuals are randomly selected from a population, and new excellent individuals are generated through the exchange and combination of two chromosomes. The mutation operation randomly selects a sample from the population and mutates the coding of the sample to ensure the diversity of the population. The operation method of mutation of the j gene a i j of the i individual is as follows:
a i j =   a i j + a i j a m a x     f g ,         r 0.5 a i j + a m i n a i j     f g ,         r < 0.5
where a m a x is the upper bound of gene a i j and a m i n is the lower bound of gene a i j . r is a random number of interval [0,1].
In Equation (29), there is:
f g   = r 2 1 g G m a x 2
r 2 is a random number, g is the current iteration number and G m a x is the maximum number of evolutions.
The genetic algorithm was used to optimize the weight and threshold of the BP network. The optimized weights and thresholds were substituted into the neural network and trained with the same set of data. The result is shown in Figure 22. Genetic algebra in the process of optimization refers to the number of the optimization. Here, the genetic algebra is taken as 50, that is, 50 times of BP neural network weight and threshold optimization. Variation of error refers to the error between the calculated value and the actual value by bringing the weight and threshold obtained after each change into the original BP neural network. From Figure 21, we can see that with the increase in optimization times, the error is gradually reduced, and a small and stable error is finally obtained. Compared with the error result without genetic algorithm optimization, the error after 50 times of genetic algorithm optimization is reduced by 45%.

4. Conclusions

The results of Figure 16, Figure 17 and Figure 21 show that the trained BP network has a good nonlinear mapping relationship. It can accurately identify the bending degree and direction of the catheter head in the blood vessel through the voltage change of the strain gauges at the rear of the catheter. In practice, there is no need to paste strain gauges at the head of the catheter; strain gauges only need to be pasted at the catheter tail that does not enter the human body. Surgeons can infer the force and bending direction of the catheter in the human body by combining the reading of the traditional force sensor and the change of the strain gauge voltage, so as to prevent the catheter from scratching the blood vessel and improve the safety and reliability of the operation. At the same time, this measurement method still has some shortcomings that need to be improved: It is easily interfered with by external conditions and requires a clamping structure to keep the catheter vertical. When the catheter is pushed through a tortuous blood vessel, the measurement may be inaccurate due to excessive steering. In a real situation, pushing a catheter in a blood vessel will inevitably be disturbed by blood flow, and such interference may interfere with measurement results. In further research, it is necessary to increase the sample data to train a neural network with better performance and less error, so as to improve the reliability and safety of operation. At the same time, the resistance of blood flow to the catheter can be analyzed and compensated to eliminate errors and disturbances.
This paper presents the design of a master–slave interventional surgical robot, and based on this structure, a catheter force detection method applied to the surgical robot is proposed. In this method, the strain gauges attached to the front and rear of the catheter are used to collect the voltage changes in the bending process. BP neural network is trained to judge the bending direction of the catheter head when it passes through the blood vessel. The training result shows a good nonlinear mapping relationship and improves the safety and reliability of operation. The traditional force sensor cannot detect the bending direction of the catheter, and the strain gauge measurement method precisely solves this disadvantage. Therefore, the combination of traditional force sensor detection and strain gauge detection can greatly improve the safety and reliability of robotic surgical operations.
With the development of intelligent equipment, robot-assisted surgery will be more safe and intelligent. Thanks to the rise of the 5G network, remote robot-assisted surgery will also become possible. In future research, we will work to enhance the general applicability of this method in a variety of different blood vessels. In addition, we will analyze the interference of blood flow in catheter force detection, hoping to compensate for the blood flow interference to achieve more accurate detection performance.

Author Contributions

Conceptualization, W.W. and D.Y.; methodology, D.Y.; validation, D.Y. and L.L.; writing—Original draft preparation, D.Y.; writing—Review and editing, Y.X.; project administration, W.W. All authors have read and agreed to the published version of the manuscript.

Funding

This research received no external funding.

Institutional Review Board Statement

Not applicable.

Informed Consent Statement

Not applicable.

Data Availability Statement

Data sharing not applicable.

Acknowledgments

The authors would like to thank all authors of previous papers for approving the use of their published research results in this paper.

Conflicts of Interest

The authors declare no conflict of interest.

References

  1. Lloyd-Jones, D.; Adams, R.J.; Brown, T.M.; Carnethon, M.; Dai, S.; De Simone, G.; Ferguson, T.B.; Ford, E.; Furie, K.; Gillespie, C. Heart Disease and Stroke Statistics—2010 Update: A Report from the American Heart Association. Circulation 2010, 121, 948–954. [Google Scholar] [PubMed]
  2. Guo, J.; Shao, L.; Guo, S.; Yu, Y.; Gao, Q. A multidimensional information monitoring method for a novel robotic vascular interventional system. In Proceedings of the IEEE International Conference on Information and Automation, Lijiang, China, 1 October 2015; pp. 609–613. [Google Scholar]
  3. Kim, K.P.; Miller, D.L.; De Gonzalez, A.B.; Balter, S.; Kleinerman, R.A.; Ostroumova, E.; Simon, S.L.; Linet, M.S. Occupational radiation doses to operators performing fluoroscopically-guided procedures. Health Phys. 2012, 103, 80–99. [Google Scholar] [CrossRef] [PubMed] [Green Version]
  4. Daneshmand, M.; Bilici, O.; Bolotnikova, A.; Anbarjafari, G. Medical robots with potential applications in participatory and opportunistic remote sensing: A review. Robot Auton. Syst. 2017, 95, 160–180. [Google Scholar] [CrossRef]
  5. Faddis, M.N.; Blume, W.; Finney, J.; Hall, A.; Rauch, J.; Sell, J.; Bae, K.T.; Talcott, M.; Lindsay, B. Novel, magnetically guided catheter for endocardial mapping and radiofrequency catheter ablation. Circulation 2002, 106, 2980–2985. [Google Scholar] [CrossRef] [PubMed] [Green Version]
  6. Carrozza, J.P. Robotic-Assisted Percutaneous Coronary Intervention—Filling an Unmet Need. J. Cardiovasc. Transl. Res. 2012, 5, 62–66. [Google Scholar] [CrossRef] [PubMed]
  7. Khan, E.M.; Frumkin, W.; Ng, G.A.; Neelagaru, S.; Abi-Samra, F.M.; Lee, J.; Giudici, M.; Gohn, D.; Winkle, R.A.; Sussman, J.; et al. First experience with a novel robotic remote catheter system: Amigo™ mapping trial. J. Interv. Card. Electrophysiol. 2013, 37, 121–129. [Google Scholar] [CrossRef] [PubMed]
  8. Guo, J.; Guo, S.; Tamiya, T.; Hirata, H.; Ishihara, H. A Virtual Reality-based Method of Decreasing Transmission Time of Visual Feedback for A Tele-operative Robotic Catheter Operating System. Int. J. Med. Robot. Comput. Assist. Surg. 2016, 12, 32–45. [Google Scholar] [CrossRef] [PubMed]
  9. Yogesh, T.; Jeffrey, S.; David, W.; Maria, D. Design and Performance Evaluation of a Remote Catheter Navigation System. IEEE Trans. Biomed. Eng. 2009, 56, 1901–1908. [Google Scholar]
  10. Ma, X.; Guo, S.; Xiao, N.; Yoshida, S.; Tamiya, T. Evaluating Performance of a Novel Developed Robotic Catheter Manipulating System. J. Micro Bio Robot. 2013, 8, 133–143. [Google Scholar] [CrossRef]
  11. Jian, G.; Xiaoliang, J.; Shuxiang, G. Study of the Operational Safety of a Vascular Interventional Surgical Robotic System. Micromachines 2018, 9, 119. [Google Scholar] [CrossRef] [PubMed] [Green Version]
  12. Bao, X.; Guo, S.; Xiao, N.; Li, Y.; Shi, L. Compensatory Force Measurement and Multimodal Force Feedback for Remote-controlled Vascular Interventional Robot. Biomed. Microdevices 2018, 20, 74.1–74.11. [Google Scholar] [CrossRef] [PubMed]
  13. Yang, C.; Guo, S.; Bao, X.; Xiao, N.; Shi, L.; Li, Y.; Jiang, Y. A Vascular Interventional Surgical Robot Based on Surgeon’s Operating Skills. Med. Biol. Eng. Comput. 2019, 57, 1999–2010. [Google Scholar] [CrossRef] [PubMed]
  14. Shuxiang, G.; Wang, Y.; Nan, X.; Youxiang, L.; Yuhua, J. Study on Real-time Force Feedback for A Master-salve Interventional Surgical Robotic System. Biomed. Microdevices 2018, 20, 37. [Google Scholar] [CrossRef]
  15. Payne, C.J.; Rafii-Tari, H.; Yang, G.Z. A Force Feedback System for Endovascular Catheterization. In Proceedings of the IEEE/RSJ International Conference on Intelligent Robots & Systems, Vilamoura, Portugal, 7 October 2012; pp. 1298–1304. [Google Scholar]
  16. Zhou, J.; Mei, Z.; Miao, J.; Mao, J.; Wang, L.; Wu, D.; Sun, D.; Zhao, Y. A Remote-Controlled Robotic System with Safety Protection Strategy Based on Force-Sensing and Bending Feedback for Transcatheter Arterial Chemoembolization. Micromachines 2020, 11, 805. [Google Scholar] [CrossRef] [PubMed]
  17. Yu, H.; Wang, H.; Chang, J.; Niu, J.; Wang, F.; Yan, Y.; Tian, H.; Fang, J.; Lu, H. A Novel Vascular Intervention Surgical Robot Based on Force Feedback and Flexible Clamping. Appl. Sci. 2021, 11, 611. [Google Scholar] [CrossRef]
  18. Zhang, L.; Gu, S.; Guo, S.; Tamiya, T. A Magnetorheological Fluids-Based Robot-Assisted Catheter/Guidewire Surgery System for Endovascular Catheterization. Micromachines 2021, 12, 640. [Google Scholar] [CrossRef] [PubMed]
  19. Pang, C.; Lee, G.Y.; Kim, T.I.; Kim, S.M.; Kim, H.N.; Ahn, S.H.; Suh, K.Y. A Flexible and Highly Sensitive Strain-gauge Sensor using Reversible Interlocking of Nanofibers. Nat. Mater. 2012, 11, 795–801. [Google Scholar] [CrossRef] [PubMed]
  20. Sadeghi, B.H.M. A BP-neural Network Predictor Model for Plastic Injection Molding Process. J. Mater. Processing Technol. 2000, 103, 411–416. [Google Scholar] [CrossRef]
  21. Zhizhong, Z.; Haiping, X.; Yaqiong, R.; Xuesong, G. Application and Comparison of BP Neural Network Algorithm in MATLAB. In Proceedings of the International Conference on Measuring Technology & Mechatronics Automation, Changsha, China, 13–14 March 2010; pp. 590–593. [Google Scholar]
  22. Shifei, D.; Su, C.; Yu, J. An Optimizing BP Neural Network Algorithm Based on Genetic Algorithm. Artif. Intell. Rev. 2011, 36, 153–162. [Google Scholar]
Figure 1. The workflow of the surgical robot.
Machines 10 00042 g001
Figure 2. The slave side of the robot system.
Machines 10 00042 g002
Figure 3. The push module structure diagram.
Machines 10 00042 g003
Figure 4. The force analysis of the catheter. α and β are angular dimensions, which have been marked in yellow and bold in the figure.
Machines 10 00042 g004
Figure 5. The advance and deformation of a catheter.
Machines 10 00042 g005
Figure 6. (a) The model of the catheter; (b) the stress direction of the catheter.
Machines 10 00042 g006
Figure 7. The result of motion simulation.
Machines 10 00042 g007
Figure 8. The catheter with strain gauges.
Machines 10 00042 g008
Figure 9. The connection circuit diagram.
Machines 10 00042 g009
Figure 10. BP neural network structure diagram.
Machines 10 00042 g010
Figure 11. The catheter in blood vessel model.
Machines 10 00042 g011
Figure 12. The voltage change of the strain gauges during a catheter push.
Machines 10 00042 g012
Figure 13. The force detected by traditional force sensor during a catheter push.
Machines 10 00042 g013
Figure 14. The voltage change during a catheter push after rotating the catheter by 90 degrees.
Machines 10 00042 g014
Figure 15. (a) The voltage change during a catheter push after rotating the catheter by 45 degrees. (b) The predicted deformation direction of the catheter.
Machines 10 00042 g015
Figure 16. (a) The division of the force angle of the catheter; (b) 0–90 degree correspondence; (c) 90–180 degree correspondence; (d) 180–270 degree correspondence; (e) 270–360 degree correspondence.
Machines 10 00042 g016aMachines 10 00042 g016b
Figure 17. The training accuracy.
Machines 10 00042 g017
Figure 18. The image restored by neural network.
Machines 10 00042 g018
Figure 19. The result errors.
Machines 10 00042 g019
Figure 20. The local minimum, global minimum and saddle point in loss function.
Machines 10 00042 g020
Figure 21. Steps of genetic algorithm.
Machines 10 00042 g021
Figure 22. Optimization process of genetic algorithm.
Machines 10 00042 g022
Table 1. Specific parameters of the force sensor.
Product ModelZNLBS-IIX
Detection range0–5 N
Accuracy0.1% F.S
Resolution0.1% F.S
Zero output±1% F.S
Sensitivity1.5 mV/V
Table 2. Specific parameters of catheter model.
ParametersValue
Length80 cm
External diameter2.7 mm
Internal diameter2.2 mm
Elastic modulus6,000,000 N/m2
Middle Poisson’s ratio0.47
Mass density1290 kg/m3
Tensile strength13,000,000 N/m2
Publisher’s Note: MDPI stays neutral with regard to jurisdictional claims in published maps and institutional affiliations.

