Abstract
The COVID-19 pandemic has detrimentally affected people’s lives and the economies of many countries, causing disruption in the health, education, transport, and other sectors. Several countries have implemented sanitary barriers at airports, bus and train stations, company gates, and other shared spaces to detect patients with viral symptoms in an effort to contain the spread of the disease. As fever is one of the most recurrent disease symptoms, the demand for devices that measure skin (body surface) temperature has increased. The thermal imaging camera, also known as a thermal imager, is one such device used to measure temperature. It employs a technology known as infrared thermography and is a noninvasive, fast, and objective tool. This study employed machine learning transfer using You Only Look Once (YOLO) to detect the hottest temperatures in the regions of interest (ROIs) of the human face in thermographic images, allowing the identification of a febrile state in humans. The algorithms detect areas of interest in the thermographic images, such as the eyes, forehead, and ears, before analyzing the temperatures in these regions. The developed software achieved excellent performance in detecting the established areas of interest, adequately indicating the maximum temperature within each region of interest, and correctly choosing the maximum temperature among them.
1. Introduction
Coronaviruses (CoVs) are viruses that cause respiratory infections in animals such as birds and mammals, including humans. There have been seven recorded CoVs that have caused serious harm to human health, with two of them responsible for the epidemics that emerged in Hong Kong in 2003 and Saudi Arabia in 2012 [1]. In December 2019, a new CoV called SARS-CoV-2 (the virus that causes the disease COVID-19) emerged in the city of Wuhan, China. In the first part of 2020, this virus spread to virtually every country in the world. On 30 January 2020, the World Health Organization (WHO) declared the COVID-19 pandemic an international emergency [1].
As the transmission rate increased, many studies developing detection and diagnostic technologies for people infected with COVID-19 have emerged. Mild cases of COVID-19 present with symptoms such as cough, fever, runny nose, sore throat, and difficulty breathing, whereas severe cases can cause pneumonia [2]. As fever is one of the most recurrent symptoms of the infection, some countries perform temperature measurements on people at airports, bus and train stations, company gates, and other shared and public spaces. These actions sought to detect symptomatic patients to contain the spread of the virus [3,4,5].
Currently, there are several ways to measure temperatures using devices or infrared thermometers. However, these methods do not guarantee measurement reliability, as incorrect use may lead to measurements of a person or an object with significant errors. Furthermore, as it is a manual process, the collection and recording of temperatures are subject to human error in addition to intrinsic measurement uncertainties, causing many screening errors in barriers currently in use [6,7,8].
In health, noninvasive measuring and intervention equipment can prevent germ spread and contribute to the practicality of the diagnosis process [9]. Furthermore, the high demand for fever measuring devices has caused many companies to enter the field without understanding the mechanism of human temperature measurement, employing technology that may incorrectly measure body temperature [10].
Thermal imaging cameras, or thermal imagers, utilize infrared thermography to measure temperature; this is a noninvasive, fast, and objective technique. All objects with temperatures above 0 K emit infrared radiation, and the amount of radiation emitted increases with temperature. Therefore, thermography can measure the surface temperature of the bodies [11]. Thus, it is possible to develop innovative technologies and automate the measurement processes by applying computer vision algorithms to thermographic images [12].
Computer vision, a subfield of artificial intelligence, can help provide solutions to many complex problems in health; it can also assist in the diagnosis and spread prevention of COVID-19 [13]. Additionally, Ulhaq et al. [13] presented computer vision techniques to control the virus spread, including infrared thermography processing. In this case, the algorithms detect regions of interest (ROIs) extracted from the original image.
In [14], the authors applied a series of machine learning (ML) algorithms to different tasks related to processing thermographic facial images. This study also presents a method to estimate head position to increase the ability to detect reference points in nonfrontal faces. These techniques are essential for improving the accuracy of the detection algorithm by capturing the face at a more appropriate angle. However, for Wang et al. [9], the facial temperature measurement should not be used only in a small area and ignore other sectors because the facial thermal image can show specific thermal characteristics among different regions.
Thermographic cameras also have significant potential for use in measuring the temperature of the human body surface, i.e., skin temperature [15]. However, the literature indicates inconsistent diagnostic performance, possibly due to wide variations in the implemented methodologies. This study evaluated the effectiveness of fever diagnosis and the effect of measuring temperatures in 17 facial regions; it contributes to the elucidation of the impact that location has on facial temperature measurement and other issues regarding the performance of febrility detection methods.
Propelled by the lack of published studies and the urgent need for sanitary barriers for screening people who may have COVID-19, this study aims to develop a solution for screening without physical contact or holding people and with only minimal interference of the flow of the site where the barrier is established. This work was supported by the Government of the State of Espírito Santo through the Foundation for Support to Research and Innovation of Espírito Santo (FAPES).
This paper presents an intelligent system using the Transfer Learning technique of a Deep Learning network trained to detect objects. The algorithm analyzes thermographic images to quickly detect the subject’s face, forehead, eyes, and ears, as these areas present the highest temperatures in the frontal and lateral regions of the head. The algorithm can then analyze the temperature of the ROI and, subsequently, estimate body surface temperature more accurately and efficiently than manual measurement methods. Additionally, the algorithm can incorporate suitable diagnostic criteria for the different ROIs with different febrility thresholds.
This article is an expanded article from a conference paper presented at the 14th IEEE/IAS International Conference on Industry Applications (Induscon) [16], whose theme was ‘Innovation in the time of COVID-19′. This version introduces more details on human infrared thermography, presents more tests with volunteers, and applies Optical Character Recognition (OCR) technology to identify maximum and minimum temperatures in thermographs. These add-ons improved the work previously carried out in the automatic detection of febrile people at sanitary barriers, which is very relevant in this phase of the COVID-19 pandemic, where new variants of the virus are emerging.
2. Materials and Methods
This section presents the main steps in developing an automatic system for measuring the human temperature at sanitary barriers by combining thermography and computer vision technologies.
The Research Ethics Committee of the Federal Institute of Espírito Santo, linked to the National Research Ethics Commission of the Ministry of Health of Brazil, approved this research under the Certificate of Presentation and Ethical Appreciation (CAAE) 33502120.2.0000.5072, opinion number 4.180.201, on 29 July 2020.
The volunteers who participated in this research were informed about the objectives, the scope of their participation, the confidential treatment of their data, and the consolidated statistically grouped method of disclosing data. All participants provided written consent.
The inclusion criterion considered the volunteers 18 years old or older and the signature on the consent term of free participation without any burden or bonus for the volunteer or researchers, with the possibility of withdrawing from the study at any time.
2.1. Fever and Human Thermography
Fever occurs when there is an increase in the body’s thermal threshold, usually maintained at around 37 °C, triggering metabolic responses of heat production and conservation, for example, tremors and peripheral vasoconstriction. These responses help to raise the body temperature to the new threshold. After fever is resolved or treated, threshold returns to baseline and heat loss processes begin, e.g., peripheral vasodilation and sweating [17].
The surface temperature threshold for determining whether a patient is in a febrile state varies among different authors. However, the most adopted thresholds are 37.5 °C ([18,19,20]) and 38.0 °C ([21,22,23]).
However, the surface temperature of the human body is different from the core temperature, which is the gold standard for diagnosing fever. The surface temperature presents different and typically lower values from the core temperature for the different regions of the face, a surface commonly inspected in sanitary barriers. Different face regions can vary the nonfever temperature from 32.3 °C up to 35.9 °C [24,25,26]. Therefore, properly identifying the region of interest (ROI) on the human face where the temperature is being measured and applying an adequate threshold leads to a more accurate diagnosis than measuring the maximum face temperature without considering which region of the face is being treated.
For this reason, this work adopts the following ROIs: medial palpebral commissure (eyes region), temporal (forehead region), and external acoustic meatus (ear region). These regions are recommended by literature [25,27,28].
2.2. Infrared Thermography
In physics, waves are periodic disturbances that maintain their shape as they propagate through space as a function of time. The literature describes visible light, ultraviolet radiation (UV), and infrared radiation (IR) specifically as types of electromagnetic (EM) waves. The spatial periodicity, or the interval between two wave peaks, is called the wavelength, λ, and is given in meters, nanometers, or micrometers. The temporal periodicity, or the time interval between two wave peaks, is denoted as the oscillation period, T, and is given in seconds or its submultiples. The frequency, v, is the inverse of period T, with the unit as Hertz.
Figure 1 presents an overview of the most common characteristics of EM waves. Visible light, defined by the range over which the light receptors of human eyes can detect, covers a small range within the spectrum, with wavelengths ranging from 380 nm to 780 nm [11].
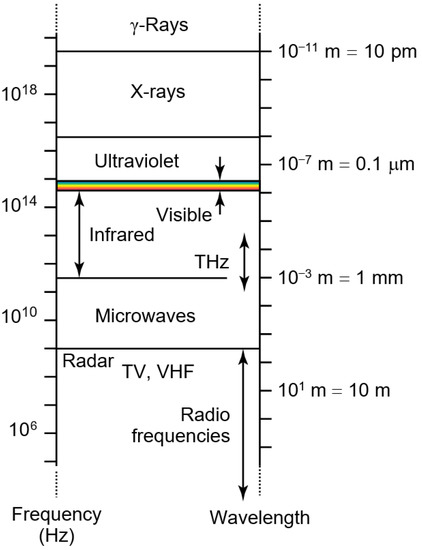
Figure 1.
Overview of the electromagnetic wave spectrum. Adapted from [11].
The spectral region with wavelengths in the range of 0.7–1000 µm is generally called the infrared region, which is the focus of this work [11]. Infrared radiation is invisible to the human eye and has a long wavelength and low energy [29]. Anybody with a temperature above absolute zero (0 K, −273.15 °C) emits infrared radiation perceived as heat. The amount of radiation emitted by a body depends on the temperature and properties of the material [11].
Within the infrared spectrum, some bands exhibit particular characteristics, which affect their applications. The main ranges are near-infrared (NIR, from 0.7–1 μm), short-wave infrared (SWIR, 1–2.5 μm), mid-wave infrared (MWIR, 3–5 μm), long-wave infrared (LWIR, 7.5–14 μm), and very long-wave infrared (VLWIR, from 14 to 1000 μm) [29]. Figure 2 depicts these ranges.
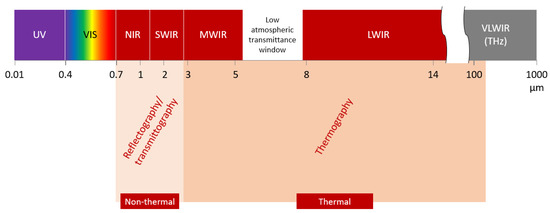
Figure 2.
Infrared spectral regions. Adapted from [29].
The infrared radiation spectrum bands generally applied in technologies involving thermographic images are MWIR and LWIR [29].
Infrared thermal imaging, also called infrared thermography (IRT), is a rapidly evolving technology. Currently, researchers are applying IRT to intelligent solutions in different fields, including condition monitoring, predictive maintenance, and gas detection. Medicine is another area that has benefited from this technology, employing IRT in oncology (breast, skin, etc.), surgery, medication effectiveness monitoring, and, more recently, for acute respiratory syndrome testing applications [30].
Technologies based on IRT can detect the intensity of thermal radiation emitted by objects since the bodies transmit, radiate, and reflect infrared radiation. Radiation transmission, or transmissivity, is the ability of a material to allow infrared radiation to pass through it. Emissivity is the capacity of a material to emit infrared radiation. Finally, reflectivity is the capability of the material/object surface to reflect radiation, that is, temperature reflected from the object.
2.3. Machine Learning
With the high volume of data generated by devices, sensors, and users, machines capable of identifying patterns and assisting in making decisions have become essential, with supervised learning and unsupervised machine learning being the most widely adopted methods. Reinforcement and semisupervised learning are other methods that may be used [31].
Deep learning is a set of machine learning technologies that utilize algorithms to detect, recognize, and classify objects and text in images or other documents. One of the leading deep learning architectures is the convolutional neural network (CNN), which is used to solve most image analysis problems [32].
2.3.1. Convolutional Neural Networks
CNNs have been widely applied in image classifiers. They excel in analyzing images and learning abstract representations. A typical CNN has an input layer, an output layer, and several hidden layers. The hidden layers of a CNN generally consist of a series of convolutional layers. The first convolution layer learns to identify the simple features. The following layers learn to detect more significant and complex characteristics. Other operations include the rectified linear unit (ReLU), grouping, fully connected, and normalizing layers. Finally, backpropagation is used for error distribution and weight adjustment [33,34].
Digital images can be represented by a matrix in which each pixel contains one or more values. First, a CNN trains and tests each input image with the pixel values going through a series of convolution operations with filters (kernels). Then, the results are grouped (pooling) to reduce the matrix dimensions and generate a new, simplified matrix. These operations complete the feature-extraction step. Then, a vector is created from the feature map, which is used to feed the input layer of a multilayer neural network (fully connected, FC) [35]. Figure 3 presents a simplified diagram of a CNN [35,36].
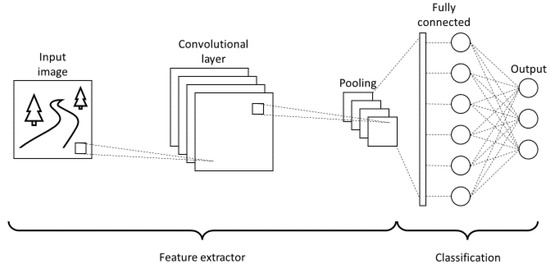
Figure 3.
Simplified diagram of the structure of a CNN.
2.3.2. Region Based Convolutional Neural Networks
Region-based CNNs (R-CNNs) emerged as an improvement of CNNs. They are able to detect and locate specific objects in an image. The architecture of an R-CNN is similar to that of a CNN. However, an added step of extracting the region containing the object to be detected is included [37]. Figure 4 presents a simplified diagram of an R-CNN [36,37].
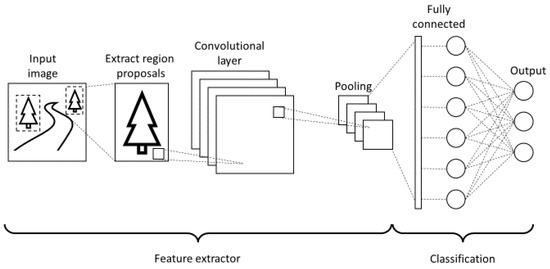
Figure 4.
Simplified diagram of the structure of an R-CNN.
The R-CNN detector consists of four main steps: candidate box generation, resource extraction, classification, and regression. For candidate box generation, approximately 2000 boxes are determined in the image using the selective search method. For resource extraction, the CNN extracts the resources of each candidate box. In the third step, a classifier determines whether the extracted features belong to a specific class. Finally, the regression step adjusts the position of the bounding box by referring to a particular resource [38,39].
2.3.3. You Only Look Once Network
According to [36], many improved algorithms have emerged from proposals of R-CNN models, all providing different degrees of improvement in the detection performance compared to the original R-CNN.
The You Only Look Once (YOLO) network, proposed by [40], is a pretrained object detector in the common objects in context (COCO) image dataset, with RGB (red, green, and blue) images of various object classes. Its main contribution is real-time image detection. Additionally, unlike other object detection algorithms, the YOLO network input is an entire image. It performs object detection through a fixed-grid regression consisting of 24 convolutional layers and two multilayer neural networks. The network can process images in real-time at 45 frames per second (FPS). Furthermore, YOLO produces fewer false positives than other similar architectures [41]. In this study, YOLO was used to apply the transfer of learning in the training of a specific dataset.
The learning transfer is a technique that takes advantage of a structure of a pre-trained CNNs structure for a given application as a starting point for a new task that is, until then, unknown. Thus, the structure of convolutional layers and filters in the feature extraction stage are reused for a new application. Afterward, changes are made in the FC layer, where the classes of the pre-trained network can be removed and/or new classes can be added to meet the new application. After the FC changes, only this layer needs to be retrained, drastically reducing the effort of training a complete CNN, which demands a high computational cost and requires a large amount of training data to achieve high performance. In this work, a pre-trained structure with a dataset of 998 images will be used to recognize volunteers’ faces. The aim is for the new structure to be able to detect the ROIs in human faces, with difficulties not originally imposed: volunteers wearing semifacial masks and glasses.
2.3.4. Optical Character Recognition
Optical character recognition (OCR) is a technology that allows the recognition and extraction of characters in image files to generate analyzable, editable, and searchable data [42]. This technology uses image and natural language processing to solve different challenges [43].
Tesseract is a free open-source OCR software, originally developed at Hewlett-Packard Laboratories Bristol and Hewlett-Packard Co., Greeley, Colorado, between 1985 and 1994. From 2006 to 2018, Google improved the software, and it is currently available on GitHub [44]. It can recognize texts in over 100 languages.
In this study, Tesseract was used to identify the minimum and maximum temperature values in the temperature scale of the analyzed thermographs.
2.4. Dataset
The dataset used in this study is publicly available in [45]. The authors used a FLIR Vue Pro camera to capture thermographic images for the dataset. During image capture, participants looked at a fixed point while the camera was moved to nine equidistant positions, forming a semicircle around the volunteer. Thus, the dataset contained nine thermographic images of the face of each participant. Figure 5 displays examples of photos that comprise the dataset.
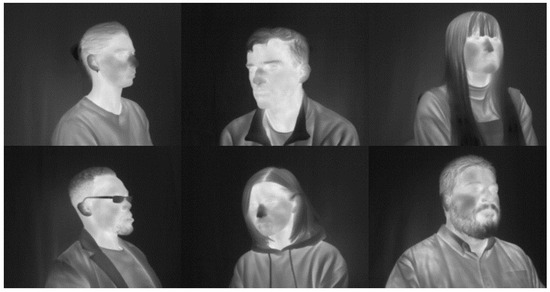
Figure 5.
Examples of dataset images [45].
The complete dataset contained 998 images from 111 participants. However, to work on a balanced dataset concerning volunteers’ gender, only 781 images were used. Of these, 658 were used for training and 123 for validation of transfer learning by the YOLO network. Aiming to evaluate the performance of YOLO for object detection, it is necessary to label each image with the annotations of their respective bounding boxes.
The face ROIs are the ear, eye, forehead, and whole face. These areas have known temperature thresholds for febrility and can be see directly; thus, they are suitable for screening febrile people using thermography [46]. However, not all regions are constantly visible on the person owing to the use of glasses, face masks, hair over the forehead or ear, and others.
LabelImg software, a free graphical tool for image and video annotation [47], was used to label all images used in this study. Figure 6 shows the graphical interface of the LabelImg software.
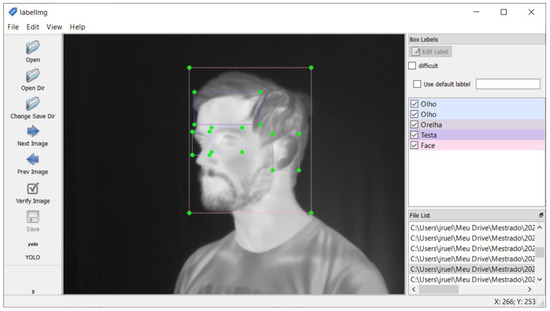
Figure 6.
LabelImg software graphical interface.
3. Results
The training of the object detector was performed on Google Collaboratory, a computational environment that runs in the cloud and requires no configuration. It allows the writing and executing of code directly in the browser.
For the R-CNN training assessment, it was necessary to quantify the prediction accuracy by comparing the prediction made by this model with the real object location in the image. Thus, the mean average precision (mAP), which is one of the most common metrics for determining the accuracy of object detectors, was employed [48].
Other methods to evaluate the performance of the trained network were precision (P), recall (R), and F1-score (F1). For these metrics, a higher value indicates a better result. Additionally, the values of true positives (TP), false positives (FP), and false negatives (FN) were employed as performance metrics.
The resultant metric values of the trained R-CNN, with a confidence limit of 25% (conf_threshold = 0.25), were as follows: TP = 452, FP = 46, FN = 9, P = 0.91, R = 0.98, and F1 = 0.94. The mAP with an intersection over union (IoU) greater than 50%, also known as mAP@0.50, was 0.97. From Table 1, it is possible to evaluate the performance of the model for each class.

Table 1.
Performance for each ROI during validation.
Tests were carried out with photos of six volunteers, different from those present in the training dataset, to evaluate the prediction accuracy of new images. A Testo-885 thermographic camera captured the new images. After transfer learning, the object detector algorithm analyzed these images and detected all ROIs, even for volunteers wearing masks, caps, and with long hair. Figure 7 displays some of these images.
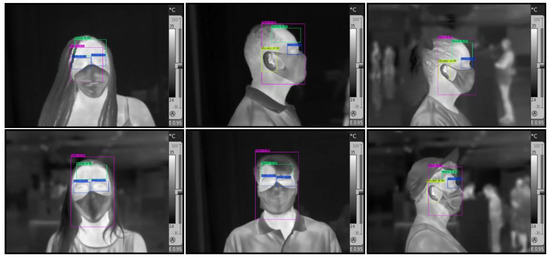
Figure 7.
Images produced using the Testo-885 camera and analyzed by YOLO.
When identifying an object, the YOLO detector provides the coordinates, width, and height of the bounding boxes. This allows delimiting ROIs where the temperature is analyzed. From each ROI, the values of the pixels with the highest temperatures were extracted. Thus, the algorithm discards regions covered by hair, sweat, and fabric, which are generally at lower temperatures. The higher temperatures are shown as the lightest colors in Figure 8.
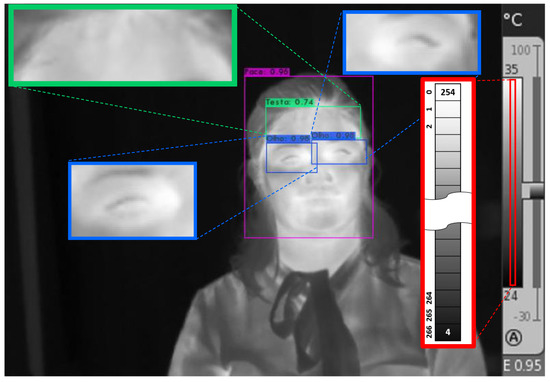
Figure 8.
Extraction of ROIs to be analyzed.
Figure 9 displays a boxplot of the pixel values in each ROI, as depicted in Figure 8. The distribution of the pixels in the forehead region displays lower values than those in the eye regions, indicating that the eyes are at a higher temperature than the forehead.
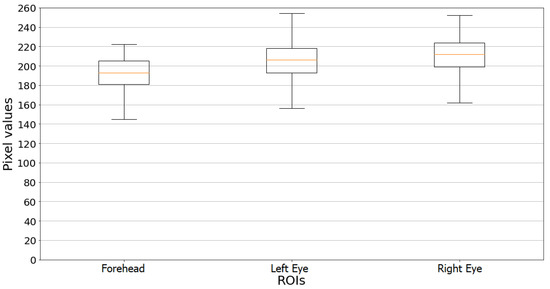
Figure 9.
Distribution of pixel values of the ROIs depicted in Figure 8.
According to [25], the maximum or mean temperatures of ROIs can be adopted to assess human body surfaces. However, the segmentation of ROIs performed in this paper may include background images, parts of the surfaces of glasses, masks, and hair, decreasing the mean temperature of the ROI. Therefore, to avoid this issue, the maximum temperature for each ROI was adopted.
The temperature scale on the right side of Figure 8 indicates that: darker colors are close to a temperature of 24 °C and lighter colors approach 35 °C. In the thermal imager standard operating mode, these values are automatically generated by the camera’s operating software, where the highest value indicates the maximum temperature of the objects in the thermal imager’s field of view and the lowest value indicates the minimum temperature of the objects.
Thermogram radiometric output is not always available, depending on the imager manufacturer. Thus, a method for reading temperatures in the region of interest directly in the thermal image was developed, so that the method can be widely used.
Along the temperature scale, there are 267 pixels, where the first one, pixel zero, has a value of 254. The last pixel of the scale has a value of 4. Figure 10 presents the relationship between the pixel values and their respective positions on the scale as a dashed line (in green). Equation (1) shows a first-order linear proportionality relation, the first-order polynomial, obtained through linear regression, with a coefficient of determination (R2) of 0.9941. The solid line (in red) on the graph shows the behavior of the equation of the straight line that describes this relationship.
where v is the pixel value and i is the position on the temperature scale.
i = −1.064v + 270.256,
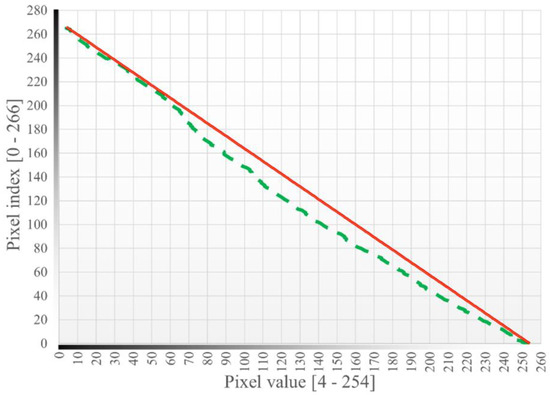
Figure 10.
Pixel value as a function of position on the temperature scale. The dashed green line depicts the pixel values extracted from the image. The solid red line displays the behavior of the equation obtained by linear regression.
As Equation (1) indicates a first-order linear proportionality between pixel position on the scale and temperature, higher temperatures will produce higher pixel values. Thus, the pixels positioned at the beginning of the scale represent the highest temperatures, and pixels at the end indicate the lowest. Figure 11 depicts the relationship between the pixel positions and the respective temperatures of the scale, as shown in Figure 8. Equation (2) presents a straight line that describes this relationship.
where i is the pixel position, obtained using Equation (1), y1 is the highest value recorded on the temperature scale, y2 is the lowest value recorded on the temperature scale, and T is the temperature (in °C) of the analyzed pixel.
T = [(y2 − y1)/266] i + y1,
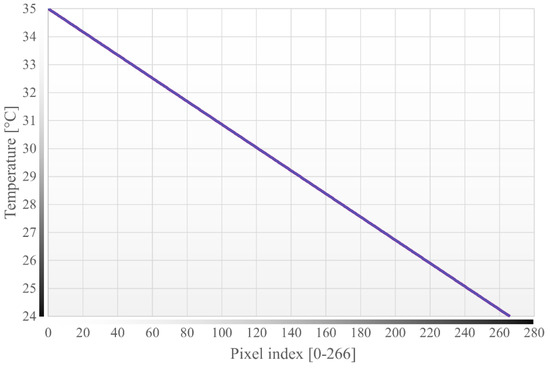
Figure 11.
Temperature as a function of pixel position.
Through algebraic manipulation of Equations (1) in (2), it is possible to obtain the value of the temperature T of the analyzed pixel, through the value, v, of the pixel, the highest value recorded on the temperature scale, y1, and the lowest value, y2. Equation (3) displays the algebraic manipulation:
T = 1/266 [y1(1.064v – 4.256) − y2(1.064v – 270.256)].
After obtaining the highest temperatures of each image ROI, the highest value among these temperatures represents the final temperature of the volunteer. Figure 12 shows images of 24 volunteers, and Table 2 lists the highest temperature recorded in each ROI for each person.
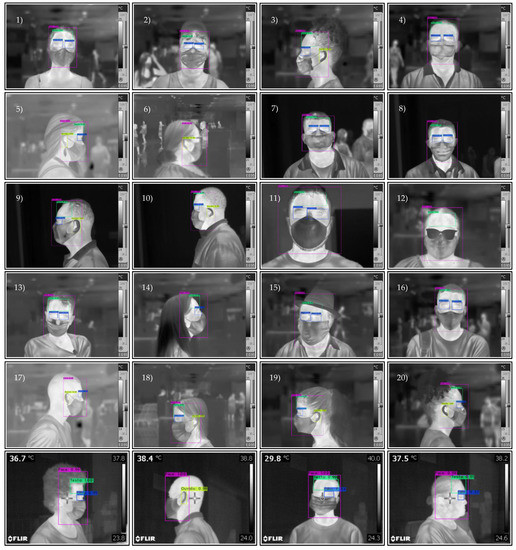
Figure 12.
Images produced using the Testo-885 camera and analyzed by YOLO, with temperature estimated using Equation (3).
Table 2.
Estimated Volunteer Temperatures.
Table 2 initially shows that there are small variations in temperature (less than 1 °C) among most volunteers. However, considering that the human being is homeothermic, this shows that the surface temperature undergoes variations not experienced by the body temperature. Furthermore, it is confirmed that face surface temperature is predominantly lower than body temperature, as shown by the mean temperature values of non-febrile volunteers.
One can note that for volunteers 6 and 22, only one ROI was visible in the image, permitting to obtain only one temperature for the analysis. The identification of only one ROI in volunteers 6 and 22 is an example of both the limitation of the intelligent system and that its objective was achieved. Volunteers were not in adequate direct sight of the thermal imager, in a way that would allow the identification of more ROIs. However, the system managed to identify at least one ROI, enabling the person’s temperature analysis.
Unfortunately, only four febrile volunteers were obtained in the image production campaign with volunteers, who were previously diagnosed as feverish by a health team by checking body temperature. Their measured temperatures are identified as 21, 22, 23, and 24 on Table 2. Despite the low sampling of febrile people, it is noted that: the maximum temperature detected in the region of the face of the volunteers 21 and 24 (37.1 °C and 37.3 °C, respectively) did not exceed the usual fever threshold for central temperature (37.5 °C or 38.0 °C); the temperatures of different facial regions of volunteer 23 showed a 0.5 °C discrepancy, which is significant for the diagnosis of fever. This supports the hypothesis that the febrile diagnostic criteria of core body temperature (37.5 °C or 38.0 °C) should not be applied to human facial temperature.
4. Conclusions
This study employed a transfer deep learning method to detect and recognize ROIs, including the face, forehead, eyes, and ears, in thermographic images using the YOLO object detector. After training a CNN from a dataset made available by other researchers, images of new volunteers obtained in the laboratory served as input to the CNN to evaluate the detection performance of the ROIs.
Tests verified that ROI detection was feasible even with the use of masks, caps, helmets, or with features hidden by hair.
As displayed in Figure 9, there were variations in temperature among ROIs. The criterion of adopting the highest temperature within each ROI proved to be efficient, as areas without a direct target, such as those covered by hair, are disregarded.
This study presents a simple system for obtaining temperature values directly from thermographic images without significant computational processing. These improvements in detecting the maximum and minimum temperatures of ROIs can provide better results for identifying febrile people.
As infrared thermography measures surface (skin) temperature and not the core temperature of the human body, future work will apply adequate criteria to analyze the febrility of the individuals from the temperatures of the ROIs. This avoids the use of a single temperature threshold to indicate a feverish state for all regions of the human face. Screening people with fevers through infrared thermography should apply a different and adequate threshold temperature for each face region, typically higher than the body threshold temperature (37.5 °C). Additionally, expanding the dataset will improve the detection of ROIs and allow more reliable screening of febrile people.
Finally, other deep learning algorithms will be applied, evaluated, and compared to the results presented in this work.
Author Contributions
Conceptualization, R.B.N., J.S. and P.R.M.; data curation, J.R.d.S.; formal analysis, J.R.d.S., R.B.N. and J.S.; funding acquisition, M.A.d.S.L.C. and P.R.M.; investigation, J.R.d.S., G.M.d.A. and M.A.d.S.L.C.; methodology, J.R.d.S., G.M.d.A., M.A.d.S.L.C., H.L.M.C., R.B.N., J.S. and P.R.M.; project administration, P.R.M.; resources, M.A.d.S.L.C. and P.R.M.; software, J.R.d.S., G.M.d.A., M.A.d.S.L.C., R.B.N. and J.S.; supervision, G.M.d.A., M.A.d.S.L.C. and P.R.M.; validation, J.R.d.S., R.B.N. and J.S.; visualization, R.B.N.; writing–original draft, J.R.d.S.; writing–review & editing, R.B.N., J.S. and P.R.M. All authors have read and agreed to the published version of the manuscript.
Funding
This research was funded by FAPES (Espírito Santo Research and Innovation Support Foundation), grant numbers 14/2019 (Master’s scholarship), 03/2020 (Induced Demand Assessment–COVID-19 Project), and 04/2021 (Research Support). APC and text review were partially funded by the Federal Institute of Espírito Santo through the Institutional Scientific Diffusion Program (PRODIF).
Institutional Review Board Statement
The study was conducted according to the guidelines of the Declaration of Helsinki, and approved by the Ethics Committee of Federal Institute of Espírito Santo - Brazil (protocol code CAAE 33502120.2.0000.5072, approved on 29 July 2020).
Informed Consent Statement
Informed consent was obtained from all subjects involved in the study.
Acknowledgments
The authors thank Masterplace Mall, Construtora Paulo Octávio, Sagrada Família Church in Jardim Camburi, and the Energy Laboratory of Ifes Campus Vitória for collaborating in the field research with volunteers. This work was also supported by the Federal Institute of Espírito Santo and the National Council for Scientific and Technological Development (CNPq).
Conflicts of Interest
The authors declare no conflict of interest.
References
- Lana, R.M.; Coelho, F.C.; Gomes, M.F.d.C.; Cruz, O.G.; Bastos, L.S.; Villela, D.A.M.; Codeço, C.T. Emergência do novo coronavírus (SARS-CoV-2) e o papel de uma vigilância nacional em saúde oportuna e efetiva. Cad. Saude Publica 2020, 36, e00019620. [Google Scholar] [CrossRef] [PubMed]
- Lima, C.M.A.d.O. Information about the new coronavirus disease (COVID-19). Radiol. Bras. 2020, 53, V–VI. [Google Scholar] [CrossRef] [PubMed]
- Willingham, R. Victorian Students in Coronavirus Lockdown Areas to Get Daily Temperature Checks on Return to Classrooms. Available online: https://www.abc.net.au/news/2020-07-09/victorian-school-kids-to-get-coronavirus-temperature-checks/12438484 (accessed on 22 January 2021).
- Thiruvengadam, M. You May Have Your Temperature Checked before Your Next Flight at JFK. Available online: https://www.travelandleisure.com/airlines-airports/jfk-airport/honeywell-temperature-monitoring-device-jfk-airport (accessed on 22 January 2021).
- Kekatos, M. FAA Opens the Door to Pre-Flight COVID-19 Screenings as a Small Airport in Iowa Rolls Out Temperature Checks and Questionnaires That Could Eventually Expand to the Nation’s more than 500 Airports. Available online: https://www.dailymail.co.uk/health/article-9169095/Small-airport-Iowa-rollout-temperature-checks-questionnaires.html (accessed on 22 January 2021).
- Jung, J.; Kim, E.O.; Kim, S.-H. Manual Fever Check Is More Sensitive than Infrared Thermoscanning Camera for Fever Screening in a Hospital Setting during the COVID-19 Pandemic. J. Korean Med. Sci. 2020, 35, e389. [Google Scholar] [CrossRef]
- Normile, D. Airport screening is largely futile, research shows. Science 2020, 367, 1177–1178. [Google Scholar] [CrossRef]
- Mekjavic, I.B.; Tipton, M.J. Myths and methodologies: Degrees of freedom—limitations of infrared thermographic screening for Covid-19 and other infections. Exp. Physiol. 2021, EP089260. [Google Scholar] [CrossRef] [PubMed]
- Wang, Z.H.; Horng, G.J.; Hsu, T.H.; Chen, C.C.; Jong, G.J. A Novel Facial Thermal Feature Extraction Method for Non-Contact Healthcare System. IEEE Access 2020, 8, 86545–86553. [Google Scholar] [CrossRef]
- Beall, E.B. Infrared Fever Detectors Used for COVID-19 Aren’t as Accurate as You Think. Available online: https://spectrum.ieee.org/news-from-around-ieee/the-institute/ieee-member-news/infrared-fever-detectors-used-for-covid19-arent-as-accurate-as-you-think (accessed on 22 January 2021).
- Vollmer, M.; Möllmann, K.P. Infrared Thermal Imaging: Fundamentals, Research and Applications; Wiley-VCH: Weinheim, Germany, 2010; ISBN 9783527407170. [Google Scholar]
- Bilodeau, G.A.; Torabi, A.; Lévesque, M.; Ouellet, C.; Langlois, J.M.P.; Lema, P.; Carmant, L. Body temperature estimation of a moving subject from thermographic images. Mach. Vis. Appl. 2012, 23, 299–311. [Google Scholar] [CrossRef]
- Ulhaq, A.; Born, J.; Khan, A.; Gomes, D.P.S.; Chakraborty, S.; Paul, M. COVID-19 Control by Computer Vision Approaches: A Survey. IEEE Access 2020, 8, 179437–179456. [Google Scholar] [CrossRef]
- Kopaczka, M.; Kolk, R.; Schock, J.; Burkhard, F.; Merhof, D. A Thermal Infrared Face Database with Facial Landmarks and Emotion Labels. IEEE Trans. Instrum. Meas. 2019, 68, 1389–1401. [Google Scholar] [CrossRef]
- Zhou, Y.; Ghassemi, P.; Chen, M.; McBride, D.; Casamento, J.P.; Pfefer, T.J.; Wang, Q. Clinical evaluation of fever-screening thermography: Impact of consensus guidelines and facial measurement location. J. Biomed. Opt. 2020, 25, 097002. [Google Scholar] [CrossRef]
- da Silva, J.R.; da Silva, Y.S.; de Souza Santos, F.; Santos, N.Q.; de Almeida, G.M.; Simao, J.; Nunes, R.B.; de Souza Leite Cuadros, M.A.; Campos, H.L.M.; Muniz, P.R. Utilização da transferência de aprendizado no detector de objetos para regiões da face humana em imagens termográficas de barreiras sanitárias. In Proceedings of the 2021 14th IEEE International Conference on Industry Applications (INDUSCON), São Paulo, Brazil, 15–18 August 2021; pp. 475–480. [Google Scholar] [CrossRef]
- Longo, D.; Fauci, A.; Kasper, D.; Hauser, S.; Jameson, J.; Loscalzo, J. (Eds.) Harrison’s Manual of Medicine, 18th ed.; McGraw-Hill: New York, NY, USA, 2014; ISBN 007174519X. [Google Scholar]
- Ring, E.F.J.; Jung, A.; Zuber, J.; Rutkowski, P.; Kalicki, B.; Bajwa, U. Detecting Fever in Polish Children by Infrared Thermography. In Proceedings of the 2008 International Conference on Quantitative InfraRed Thermography, Krakow, Poland, 2–5 July 2008. QIRT Council. [Google Scholar]
- Sun, G.; Saga, T.; Shimizu, T.; Hakozaki, Y.; Matsui, T. Fever screening of seasonal influenza patients using a cost-effective thermopile array with small pixels for close-range thermometry. Int. J. Infect. Dis. 2014, 25, 56–58. [Google Scholar] [CrossRef]
- Tay, M.R.; Low, Y.L.; Zhao, X.; Cook, A.R.; Lee, V.J. Comparison of Infrared Thermal Detection Systems for mass fever screening in a tropical healthcare setting. Public Health 2015, 129, 1471–1478. [Google Scholar] [CrossRef]
- Chiu, W.; Lin, P.; Chiou, H.Y.; Lee, W.S.; Lee, C.N.; Yang, Y.Y.; Lee, H.M.; Hsieh, M.S.; Hu, C.; Ho, Y.S.; et al. Infrared Thermography to Mass-Screen Suspected Sars Patients with Fever. Asia Pac. J. Public Health 2005, 17, 26–28. [Google Scholar] [CrossRef]
- Nishiura, H.; Kamiya, K. Fever screening during the influenza (H1N1-2009) pandemic at Narita International Airport, Japan. BMC Infect. Dis. 2011, 11, 111. [Google Scholar] [CrossRef] [PubMed]
- Silvino, V.O.; Gomes, R.B.B.; Ribeiro, S.L.G.; Moreira, D.D.L.; Santos, M.A.P. Dos Identifying febrile humans using infrared thermography screening: Possible applications during COVID-19 outbreak. Rev. Context. Saúde 2020, 20, 5–9. [Google Scholar] [CrossRef]
- Brioschi, M.; Teixeira, M.; Silva, M.T.; Colman, F.M. Medical Thermography Textbook: Principles and Applications, 1st ed.; Andreoli: São Paulo, Brazil, 2010; ISBN 978-85-60416-15-8. [Google Scholar]
- Haddad, D.S.; Brioschi, M.L.; Baladi, M.G.; Arita, E.S. A new evaluation of heat distribution on facial skin surface by infrared thermography. Dentomaxillofacial Radiol. 2016, 45, 20150264. [Google Scholar] [CrossRef] [PubMed]
- Haddad, D.S.; Oliveira, B.C.; Brioschi, M.L.; Crosato, E.M.; Vardasca, R.; Mendes, J.G.; Pinho, J.C.G.F.; Clemente, M.P.; Arita, E.S. Is it possible myogenic temporomandibular dysfunctions change the facial thermal imaging? Clin. Lab. Res. Dent. 2019. [Google Scholar] [CrossRef]
- Ferreira, C.L.P.; Castelo, P.M.; Zanato, L.E.; Poyares, D.; Tufik, S.; Bommarito, S. Relation between oro-facial thermographic findings and myofunctional characteristics in patients with obstructive sleep apnoea. J. Oral Rehabil. 2021, 48, 720–729. [Google Scholar] [CrossRef] [PubMed]
- Derruau, S.; Bogard, F.; Exartier-Menard, G.; Mauprivez, C.; Polidori, G. Medical Infrared Thermography in Odontogenic Facial Cellulitis as a Clinical Decision Support Tool. A Technical Note. Diagnostics 2021, 11, 2045. [Google Scholar] [CrossRef] [PubMed]
- Liu, Z.; Ukida, H.; Ramuhalli, P.; Niel, K. (Eds.) Integrated Imaging and Vision Techniques for Industrial Inspection; Advances in Computer Vision and Pattern Recognition; Springer: London, UK, 2015; ISBN 978-1-4471-6740-2. [Google Scholar]
- Diakides, M.; Bronzino, J.D.; Peterson, D.R. (Eds.) Medical Infrared Imaging; CRC Press: Boca Raton, FL, USA, 2012; ISBN 9780429107474. [Google Scholar]
- Ongsulee, P. Artificial intelligence, machine learning and deep learning. In Proceedings of the 2017 15th International Conference on ICT and Knowledge Engineering (ICT&KE), Bangkok, Thailand, 22–24 November 2017; pp. 1–6. [Google Scholar]
- Sultana, F.; Sufian, A.; Dutta, P. Advancements in image classification using convolutional neural network. In Proceedings of the 2018 4th IEEE International Conference on Research in Computational Intelligence and Communication Networks, ICRCICN, Kolkata, India, 22–23 November 2018. [Google Scholar]
- Andrearczyk, V.; Whelan, P.F. Deep Learning in Texture Analysis and Its Application to Tissue Image Classification. In Biomedical Texture Analysis; Elsevier: Amsterdam, The Netherlands, 2017; pp. 95–129. ISBN 9780128121337. [Google Scholar]
- Ren, J.; Green, M.; Huang, X. From traditional to deep learning: Fault diagnosis for autonomous vehicles. In Learning Control; Elsevier: Amsterdam, The Netherlands, 2021; pp. 205–219. [Google Scholar]
- Phung, V.H.; Rhee, E.J. A High-accuracy model average ensemble of convolutional neural networks for classification of cloud image patches on small datasets. Appl. Sci. 2019, 9, 4500. [Google Scholar] [CrossRef]
- Zhao, Z.Q.; Zheng, P.; Xu, S.T.; Wu, X. Object Detection with Deep Learning: A Review. IEEE Trans. Neural Netw. Learn. Syst. 2019, 30, 3212–3232. [Google Scholar] [CrossRef]
- Girshick, R.; Donahue, J.; Darrell, T.; Malik, J. Rich feature hierarchies for accurate object detection and semantic segmentation. In Proceedings of the IEEE Computer Society Conference on Computer Vision and Pattern Recognition, Columbus, OH, USA, 24–27 June 2014. [Google Scholar]
- Yang, J.; Li, S.; Wang, Z.; Dong, H.; Wang, J.; Tang, S. Using Deep Learning to Detect Defects in Manufacturing: A Comprehensive Survey and Current Challenges. Materials 2020, 13, 5755. [Google Scholar] [CrossRef]
- Wang, J.; Zhang, T.; Cheng, Y.; Al-Nabhan, N. Deep Learning for Object Detection: A Survey. Comput. Syst. Sci. Eng. 2021, 38, 165–182. [Google Scholar] [CrossRef]
- Redmon, J.; Divvala, S.; Girshick, R.; Farhadi, A. You only look once: Unified, real-time object detection. In Proceedings of the IEEE Computer Society Conference on Computer Vision and Pattern Recognition, Las Vegas, NV, USA, 27–30 June 2016. [Google Scholar]
- Ivašić-Kos, M.; Krišto, M.; Pobar, M. Human detection in thermal imaging using YOLO. In Proceedings of the ACM International Conference Proceeding Series, Daejeon, Korea, 10–13 November 2019. [Google Scholar]
- Memon, J.; Sami, M.; Khan, R.A.; Uddin, M. Handwritten Optical Character Recognition (OCR): A Comprehensive Systematic Literature Review (SLR). IEEE Access 2020, 8, 142642–142668. [Google Scholar] [CrossRef]
- Islam, N.; Islam, Z.; Noor, N. A Survey on Optical Character Recognition System. arXiv Preprint 2017, arXiv:1710.05703. [Google Scholar]
- Indravadanbhai Patel, C.; Patel, D.; Patel Smt Chandaben Mohanbhai, C.; Patel, A.; Chandaben Mohanbhai, S.; Patel Smt Chandaben Mohanbhai, D. Optical Character Recognition by Open source OCR Tool Tesseract: A Case Study. Artic. Int. J. Comput. Appl. 2012, 55, 975–8887. [Google Scholar] [CrossRef]
- Panetta, K.; Samani, A.; Yuan, X.; Wan, Q.; Agaian, S.; Rajeev, S.; Kamath, S.; Rajendran, R.; Rao, S.P.; Kaszowska, A.; et al. A Comprehensive Database for Benchmarking Imaging Systems. IEEE Trans. Pattern Anal. Mach. Intell. 2020, 42, 509–520. [Google Scholar] [CrossRef] [PubMed]
- de Souza Santos, F.; Da Silva, Y.S.; Da Silva, J.R.; Simao, J.; Campos, H.L.M.; Nunes, R.B.; Muniz, P.R. Comparative analysis of the use of pyrometers and thermal imagers in sanitary barriers for screening febrile people. In Proceedings of the 2021 14th IEEE International Conference on Industry Applications (INDUSCON), São Paulo, Brazil, 15–18 August 2021; pp. 1184–1190. [Google Scholar] [CrossRef]
- Lin, T. LabelImg. Available online: https://github.com/tzutalin/labelImg (accessed on 24 January 2021).
- Padilla, R.; Netto, S.L.; Da Silva, E.A.B. A Survey on Performance Metrics for Object-Detection Algorithms. In Proceedings of the International Conference on Systems, Signals, and Image Processing, Niteroi, Brazil, 1–3 July 2020. [Google Scholar]


Publisher’s Note: MDPI stays neutral with regard to jurisdictional claims in published maps and institutional affiliations. |
© 2022 by the authors. Licensee MDPI, Basel, Switzerland. This article is an open access article distributed under the terms and conditions of the Creative Commons Attribution (CC BY) license (https://creativecommons.org/licenses/by/4.0/).