Abstract
Studies on the tip leakage vortex (TLV) are extensive, while studies on the secondary tip leakage vortex (S-TLV) are rare. To advance the understanding of the formation mechanism of the S-TLV, turbulent cavitating flows were numerically investigated using the shear stress transport (SST) turbulence model and the Zwart–Gerber–Belamri cavitation model. The morphology and physical quantity distribution of the S-TLV under two cavitation conditions were compared, and its formation mechanism was analyzed. The results reveal that in the lower cavitation number case, there is a low-velocity zone of circumferential flow near the tip in the back half of the blade. The shear vortices formed by the leakage jet gradually accumulate and concentrate in the low-velocity area, which is one of the main sources of the S-TLV. Meanwhile, the radial jet pushes the vortices on the suction surface to the tip, which mixes with the S-TLV. The flow path formed by the radial jet and the leakage jet is in accordance with the rotation direction of the S-TLV, which promotes the S-TLV’s further development. Under the conditions of a small cavitation number and low flow rate, the circumferential velocity and radial velocity of the fluid near the gap have altered significantly, which is conducive to the formation of the S-TLV.
1. Introduction
The axial flow pump is widely used in water diversion, nuclear power, irrigation, marine water jet propulsion and other fields. When the axial flow pump is working, a leakage flow will be formed in the gap between the tip and the end wall, accompanied by the generation of vortices [1,2]. When cavitation conditions are reached, cavity bubbles are formed in the tip clearance and above the suction surface, which will affect the hydraulic performance of the axial flow pump, resulting in noise and vibration [3,4,5,6,7,8]. There are various vortices in the leakage flow field near the tip clearance. According to the position and formation mechanism, they can be divided into the tip leakage vortex (TLV), the tip separation vortex, the induced vortex, the secondary tip leakage vortex (S-TLV) and the perpendicular cavitation vortex (PCV), etc. [9,10,11,12].
Numerous attempts have been devoted to analyzing the formation and evolution mechanism of the TLV. The study of the gap flow in the in-line cascade found that the velocity gradient is an important reason for the formation of vorticity, turbulence kinetic energy (TKE) and Reynolds’ stress [13,14]. A comparative study of the numerical simulations on right-angle and rounded tip geometries found that the TLV originates from the continuous shear action between the leakage jet and the low-velocity flow on the suction surface to form and transport vorticity [15]. In the three-dimensional particle image velocimetry (PIV) experiment, it was observed that the tip leakage flow extends to the TLV in the form of a jet, and a series of vortex filaments are generated. When the TLV is delivered to the second half of the blade, the vortices gradually collapse, resulting in an increase in number but a decrease in size. Turbulence within the TLV is highly anisotropic and spatially non-uniform [16,17,18].
The tip geometry has a great influence on the TLV. The experimental study on NACA0009 hydrofoil found that the gap size had a strong correlation with the TLV, which affected the vortex core trajectory and its strength, and the existence of a specific gap width makes the vortex strength the largest [19,20,21]. Experimental studies on square and round blade tips have found that the square blade tips are responsible for the inception of unstable secondary vortices, which affect the main vortex structure of the TLV [22]. The research found that when the pressure edge of the blade is rounded in an axial flow pump, the clearance cavitation is capable of being eliminated, but the change of the gap geometry has no significant effect on the leakage vortex cavitation [23].
The development and evolution of the TLV are also affected by cavitation [24,25]. It was found that the amount of the TLV circulation declines with the decrease in the cavitation number, especially near the trailing edge, which is affected by the reduction in the lift coefficient [26]. Experimental and numerical studies of the axial flow propulsion pump under different cavitation conditions have found that cavitation reduces the leakage flow rate and increases the amplitude of pressure pulsation [27].
The flow rate has a great impact on the TLV. Under the condition of a high flow rate, the TLV intensity and the migration velocity magnitude of the low-pressure axial flow fan are fairly smaller. When the flow rate decreases, the TLV wanders around, and the vortex is unstable [28]. It is found that the initiation of the TLV trajectory under high flow rates is delayed backward, and the angle between the trajectory and the chord length diminishes by analyzing the axial flow pumps [29].
In general, the S-TLV is regarded as a series of small vortex structures attached to the blade suction surface, which is induced by the interaction of the tip clearance jet flow and mainstream in the blade-to-blade channel. The S-TLV interacts with the TLV and generates a helical entangle effect [6]. As the cavitation number decreases, the S-TLV becomes significant gradually. The formation of the perpendicular cavitation vortex (PCV) is mainly influenced by the TLV and is believed to be formed by the evolution of the S-TLV [30]. When the cavitation number is low, there are large-scale cloud-like cavitation vortex structures near the blade tip of the axial flow pump, which will cause a blockage of the flow channel, inducing instability and a rapid drop in performance [31,32,33,34]. However, there are still a few related studies on the S-TLV, and its formation mechanism requires further investigation.
In this article, the formation mechanism of the S-TLV was studied by comparing the two cavitation conditions combined with cavitation experiments and numerical calculation methods. The Shear-Stress-Transfer (SST) k-ω turbulence model and the Zwart–Gerber–Belamri cavitation model were used for numerical simulation to study the cavitation turbulent flows in the axial flow pump.
2. Numerical Method and Experimental Setup
2.1. Pump Geometry and Mesh
The main design parameters of the axial flow pump are depicted in Table 1.

Table 1.
Pump geometry and reference data.
The whole computational domain was divided into the following five subdomains: the inlet passage subdomain, the impeller subdomain, the guide vane subdomain, the ribs subdomain and the outlet passage subdomain, as presented in Figure 1.
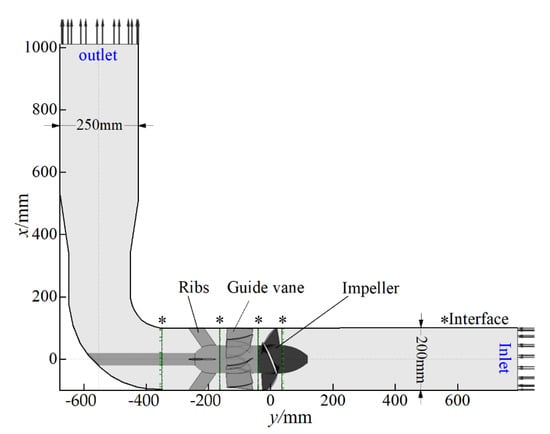
Figure 1.
Axial flow pump computational domains.
Figure 2 shows the relevant parameters of the impeller. The radial coefficient is defined as r* = r/R. The circumferential direction is the tangential direction corresponding to the circle of revolution, and it is perpendicular to the radial direction. The axial direction is aligned with the y-axis and the axial coefficient is defined as γ = y/R, where R is the radius of the impeller chamber, with a size of 100 mm. The main flow direction is from the pump inlet to the outlet. The chordwise direction is from leading edge (LE) to trailing edge (TE). The blade chord coefficient is also defined as λ = s/c, where s refers to the distance from leading edge to the chord section.
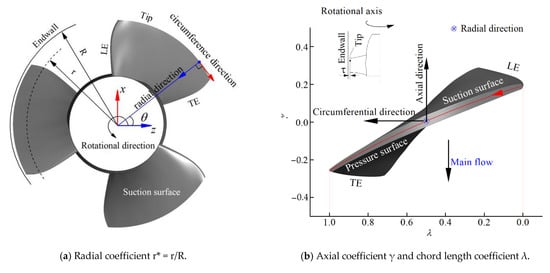
Figure 2.
(a,b) Geometric definition of the impeller.
The circumferential vorticity wc is calculated by wc = wz sinθ − wx cosθ, where wx and wz are the vorticity in the x and y directions, respectively. θ is the angle between the radial line and the z axis.
The pump head H is calculated by H = (pout − pin)/ρl g, where pin and pout represent the total inlet and outlet pressure, respectively; and ρl represents the density of the liquid. The pump heads calculated by using three groups of structural grids with 5.24 million, 7.26 million and 9.46 million nodes were 3.07, 3.08 and 3.08, respectively, which verified the grid independence of the computing domain. In order to capture the details of flow and the small-scale vortex structures, the grid with a total number of 9.46 million was selected as the computing domain grid model. Thirty nodes were set in the tip gap with a size of 0.5 mm. The details of the computational grid are depicted in Figure 3.
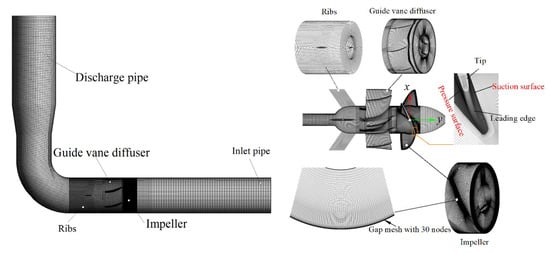
Figure 3.
Computational grid of main components.
2.2. Experimental Setup
The external characteristic experiment and the cavitation experiment of the axial flow pump were carried out on the closed test loop, as shown in Figure 4a. The experimental device was mainly composed of a gate valve, an axial flow pump model, a butterfly valve, a boosting pump, a turbine flow meter and a water tank, etc. Before the experiment, connect all the equipment, adjust the inlet and outlet valves to the maximum, fill the pipe with water and discharge the air in the pipe. Then, adjust the flow rate through the outlet gate valve and vacuum the cavitation tank to obtain different inlet pressures. After the pump is running stably, record the flow rate, head and other data. Repeat the measurement three times and take the arithmetic average so as to minimize the random error in the measurement. The cavitation image is derived by a high-speed imaging system, as shown in Figure 4c.
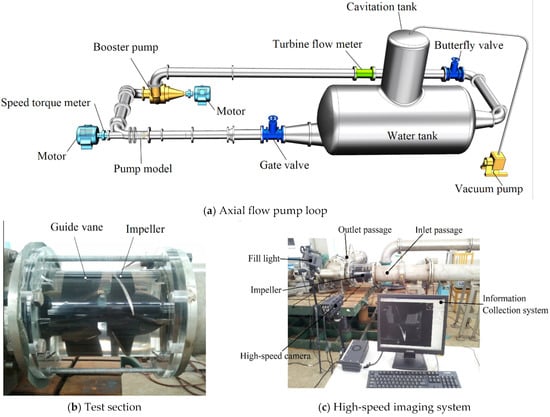
Figure 4.
(a–c) Experimental equipment for external characteristic and cavitation of the axial flow pump.
2.3. Governing Equations, Turbulence Model and Cavitation Model
The continuity and momentum equations are given by the following expression [35]:
where is the velocity component in the ith direction, is the pressure and is the turbulent viscosity. The dynamic viscosity and density were defined as and , respectively, where the subscripts l and v represent the liquid and vapor phases, respectively. is the vapor volume fraction.
The SST k-ω model can accurately predict the flow separation, which has been proven to be highly adaptable and feasible for the tip leakage flow [36,37,38].
The cavitation model was proposed by Zwart, Gerber and Belamri [39], and can be expressed as follows:
The source terms for the specific mass transfer rate corresponding to the vaporization and condensation are defined by
where Fvap and Fcond are the empirical coefficients for the mass transfer process with the recommended values of 50 and 0.01, respectively; Rb is the typical bubble radius with a value of 1 × 10⁻⁶ m; is the saturation vapor pressure, with a value of 3169 Pa; and αnuc is the nucleation site volume fraction with a value of 5 × 10⁻⁴. These parameters were validated for the simulations of cavitating flow in pumps [29,30,31,32].
The commercial code ANSYS CFX 17.1, which is widely used in engineering applications, was adopted in this study.
2.4. Numerical Calculation Result Verification
In the experiment, the outlet flow rate was adjusted to make the outlet flow rate equal to 1.0 QBEP. By reducing the inlet pressure, the axial flow pump could be manipulated under different cavitation conditions. The cavitation number was written as follows:
where is the inlet pressure. The transient rotor–stator was used for the frame change of the impeller. All the physical surfaces of the pump were set as no-slip walls. The automatic near-wall function was used as the wall treatment method. The impeller rotational speed was 1450 r/min. The time required for the impeller to complete one revolution was denoted as T. The convergence accuracy was set to 1 × 10⁻⁵. The time step was set to 1/360 T, about 1.1494 × 10⁻⁴ s.
The time-averaged value of the pump head H obtained via the transient calculation was in comparison with that from the experiment, as depicted in Figure 5. The applicability of the mesh and the turbulence model were verified by a comparison of the numerical simulation and the external characteristic experiment.
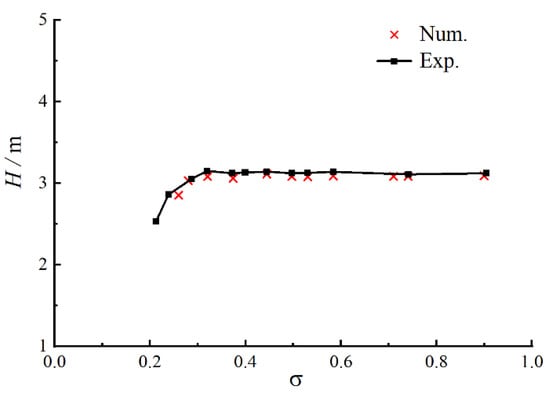
Figure 5.
Comparison of the axial flow pump’s σ–H curves from the numerical simulation and experiment.
3. Results and Discussion
3.1. TLV Formation and Evolution Mechanism
For a better presentation of the velocity field, Figure 6 illustrates the 3D streamlines along three measurement planes under non-cavitating conditions. The leakage velocity magnitude is larger at the leading edge, and subsequently, a vortex structure with concentrated vorticity is formed, which is transmitted to the trailing edge. The vortex scale gradually expands along the chord length, and the value of vorticity gradually decreases.
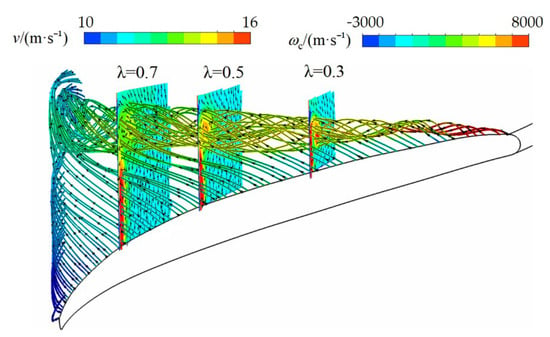
Figure 6.
3D streamlines of the tip leakage flow. The colors in the three measurement planes show the norm of the circumferential vorticity.
As observed from Figure 7, in the section of λ = 0.5, there are two opposite flows in the axial direction, the leakage jet flow and the axial main flow. A shear layer is formed between the two opposite flows, where the vorticity is relatively large. The vortex and vorticity formed by shearing are ultimately transported to the TLV core region.
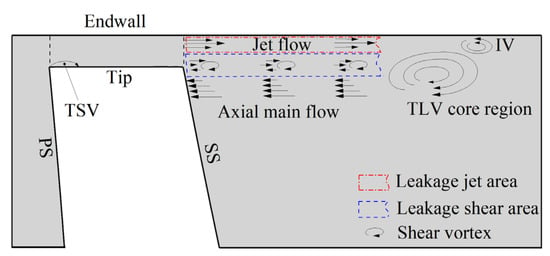
Figure 7.
Schematic diagram of axial main flow, tip leakage flow and vortex distribution (λ = 0.5 section).
3.2. S-TLV Structure and Vorticity Distribution
Liu et al. proposed a new vector Liutex to describe the local fluid rotational motion [40,41]. This method specifies the Z1 direction as the vortex axis direction and R represents the rigid rotation strength of local fluid in a new X1Y1Z1-frame. is defined as follows:
Under the standard flow rate condition (Q = 1.0QBEP), adjust the inlet pressure so that the cavitation number σ is equal to 0.53 and 0.37, case A and case B, respectively. A numerical calculation and experiment were carried out, and the leakage flow characteristics and cavities are depicted in Figure 8. The numerical calculation results choose the R = 1000 isosurface to characterize the vortex and the cavitation volume fraction αv = 0.1 isosurface to illustrate the cavity bubbles. As can be observed in the figure, both cases have a TLV structure. In case B, a significant vortex structure is formed near the blade tip at about λ = 0.7, which is defined as the secondary tip leakage vortex, S-TLV. In case A, this vortex structure is not found, and it is worth analyzing this phenomenon.
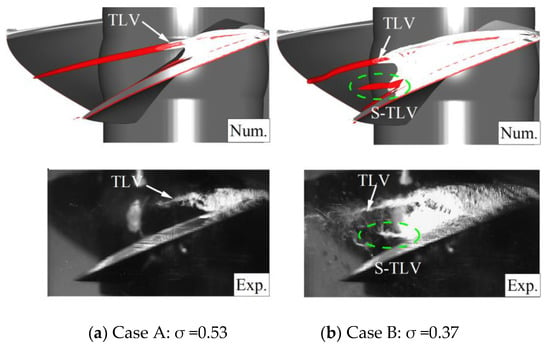
Figure 8.
(a,b) Cavitation and vortex distributions under numerical simulation and experiment.
Take three sections at λ = 0.5/0.7/0.9 of the blade to analyze the vortex distribution to further understand the S-TLV’s evolution, as demonstrated in Figure 9. Overall, case A and case B are similar in the vorticity wc distribution, and significant shear vorticity is formed near the tip of the blade. The main vortex structure of the TLV gradually moves away from the suction surface along the chord length, and the vorticity of the vortex center gradually decreases. Simultaneously, there is an induced vortex with a negative vorticity at the end wall.
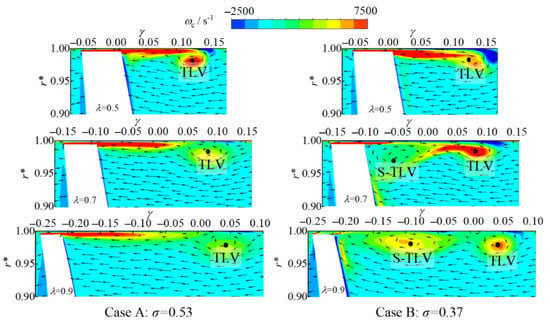
Figure 9.
Distributions of circumferential vorticity on three planes.
However, there are also obvious differences between the two cases. The double-vortex structure appears in the sections of λ = 0.7 and λ = 0.9 in case B, while this structure does not occur in case A.
In case A, there is a large vorticity in the leakage shear area of λ = 0.7−0.9, but it is difficult to form a significant S-TLV. The tip leakage channel does not have chance to transfer the vorticity generated by being sheared to the TLV core area.
In case B, the double-vortex structure changes the leakage jet and shear channels, and the vorticity distribution is quite different to case A. More noticeable differences are observed that the TLV vorticity in the two sections of λ = 0.7 and λ = 0.9 is larger, while the vorticity in the leakage shear area is smaller. This is triggered by the S-TLV transporting the vorticity formed in the leakage shear area to the TLV core region. Therefore, the TLV has a higher vorticity, and the S-TLV expands its vortex scale.
3.3. Mechanism of S-TLV Formation
(1) In the back half of the blade, continuous tip leakage jet helps to form the S-TLV.
The tip leakage flow and the TLV arise from the pressure difference between the pressure surface and the suction surface of the blade. In order to obtain the distribution of the blade pressure difference, sampling lines r* = 0.95/0.9/0.85/0.8/0.75/0.70 are taken at equal intervals. After taking the average of the pressure difference between the pressure surface and the suction surface, the Cp and Cpd are derived by non-dimensional processing. The pressure coefficient Cp and the pressure difference coefficient Cpd are defined as follows:
where is the pressure, and and are the pressure on the pressure side and suction side, respectively.
The white line frame in Figure 10a indicates the cavitation isoline αv = 0.1. A low-pressure area is generated at the leading edge above the suction surface. Affected by the cavities, the pressure difference at the leading edge is fairly large, and then gradually decreases. As the TLV vortex cavitation increases, the pressure difference gradually rises at λ = 0.05−0.15.
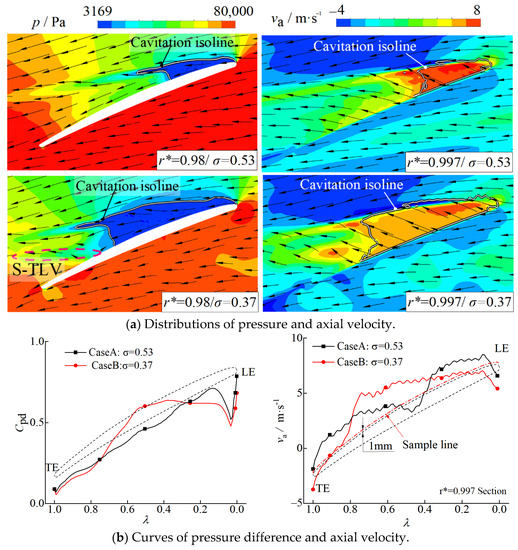
Figure 10.
(a,b) Distributions of blade pressure difference and axial velocity.
Due to the influence of cavitation, the pressure difference of case B was larger than that of case A at λ = 0.25−0.7. In the r* = 0.997 section, a line with a distance of 1 mm parallel to the suction side is used as a sampling line to obtain the axial velocity curve, as observed in Figure 10b. The axial velocity in case B is larger than in case A at λ = 0.35−0.7, which provides sufficient leakage flow and momentum for the formation of the S-TLV.
Figure 11 depicts the axial velocity distributions in the radial sections. As shown in the figure, the axial velocity near the tip of case B is higher than that of case A. The reason relies on the fact that the cavitation on the suction surface increases the pressure difference, which prompts the continuous generation of leakage jet flow. The axial velocity of case B above the double-vortex structure near the blade tip is higher than that of case A.
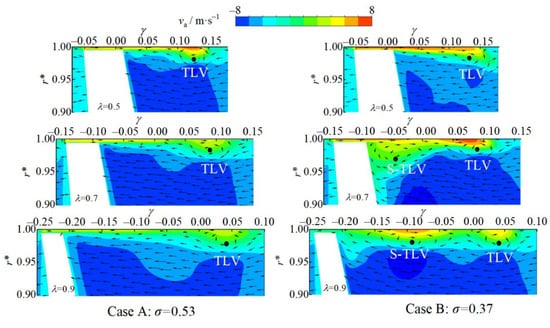
Figure 11.
Distributions of axial velocity on three planes.
(2) The low-velocity zone M is where the vortices are concentrated.
In the r* = 0.98 section, take the curve with a distance of 1mm parallel to the suction side as the sampling line to obtain the circumferential velocity curve, as shown in Figure 12. In case B, the fluid on the suction surface is blocked by the cavity at the front of the blade, and the circumferential velocity is low in the range of λ = 0.5 to λ = 1.0. Particularly, a local low-velocity zone M emerges, which is located in the position of λ = 0.6–0.7. Combined with the pressure distributions in Figure 10a, the re-entrant jet flow is caused by the circumferential pressure difference. Since the cavity bubbles are blocked in front of the blade, the circumferential flow bypasses, which further promotes the formation of the zone M.
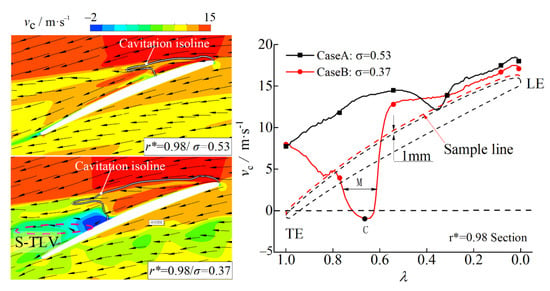
Figure 12.
Circumferential velocity distributions and low velocity zone M.
The zone M is an essential area for the development of the S-TLV, in detail, where the axial leakage velocity is high, and the formed shear vortices are gradually accumulated, which appear as the prominent source of the S-TLV.
As observed from Figure 13, in the sections of λ = 0.7 and λ = 0.9, the circumferential velocity of the S-TLV area of case B is lower than that of the corresponding position of case A.
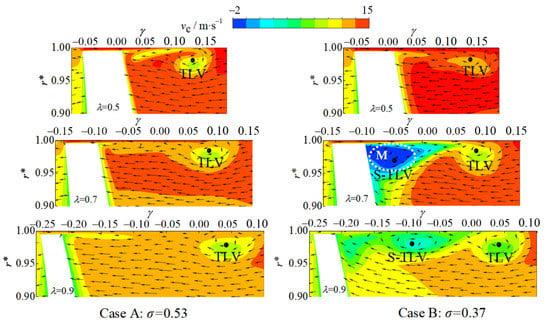
Figure 13.
Distributions of circumferential velocity on three planes.
In case B, a large-scale low-velocity zone M is formed in the section of λ = 0.7, where the leakage jet is strong and the S-TLV is generated, accumulated and evolved. Subsequently, in the section of λ = 0.9, the circumferential velocity increases.
(3) The radial jet promotes the development of the S-TLV.
Figure 14 shows the distributions of velocity streamlines and cavity bubbles on the suction surface. In case B, due to the low cavitation number, a large number of cavity bubbles (TLV cavitation, shear cavitation, sheet cavitation, etc.) are formed in the vicinity of the tip above the suction surface. The pressure in this position is lower, yielding a radial flow under the action of the pressure difference between the hub and the tip, as demonstrated in Figure 14. Additionally, the vapor–liquid separation triggered by the rotation of the impeller also contributes to the formation of a radial jet under the action of centrifugation. In case A, the radial jet is not observed due to insufficient cavities.
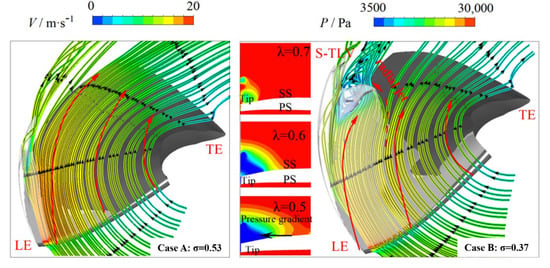
Figure 14.
Velocity streamlines and cavitation distributions on the suction surface of the blade.
As shown in case B in Figure 15, the existence of radial jet is easy to capture at the two cross-sections, λ = 0.7 and λ = 0.9. Since the flow direction formed by the radial jet and the leakage flow is in accordance with the rotation direction of the S-TLV. Therefore, this flow path is beneficial for the development of the S-TLV.
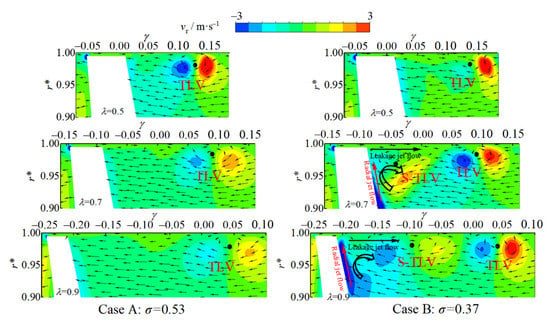
Figure 15.
Distributions of radial velocity on three planes.
Figure 16 depicts the vortex intensity distributions acquired according to the velocity swirling strength criterion [42]. In the two cases, the distributions of vortex intensity α are basically similar in the cross section of λ = 0.5. There are early forms of the S-TLV near the suction surface, and a small number of vortices cover the suction surface of the blade.
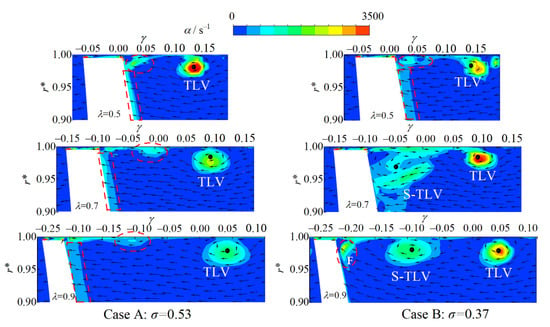
Figure 16.
Distributions of vortex intensity on three planes.
In the λ = 0.7 section of case A, the leakage velocity is small, and the TLV center is pulled away from the suction surface. The leakage jet cannot wrap the TLV, thus accelerating the TLV dissipation. In addition, the vortex intensity transported by the leakage jet in the leakage channel is not sufficient to compensate for the TLV dissipation, and the TLV vortex intensity gradually diminishes. In case B, the vortex intensity of the TLV is enhanced. Since the leakage jet flow rate at this location is still high, and the leakage jet can wrap around the TLV area, which can reduce the dissipation of the TLV. Additionally, under the action of the radial jet, the vortices attached on the wall of the suction surface are successively pushed to the tip of the blade. Under the combined action of the leakage jet and radial jet, they are mixed and absorbed with each other, leading to the further development and growth of the TLV and the S-TLV. In this process, the S-TLV played a key role in transit and transmission.
In the λ = 0.9 section of case B, there are vortices marked F in Figure 16 originating from the suction surface near the tip, which migrate to the blade tip under the action of the radial jet. It can be inferred that in the follow-up process, under the successive promotion of the leakage jet, the vortices will gradually mix with the S-TLV and evolve into a part of the S-TLV. Compared with case A, the vorticity on the suction surface in case B is almost absorbed by the S-TLV. The TLV and the S-TLV are basically equivalent in vortex intensity and scale, maintaining a relative balance. The vortices attached on the wall of the suction surface are transported to the S-TLV, which is conducive to the S-TLV’s development.
As shown in Figure 17, the formation mechanism of the S-TLV is illustrated. Compared with case A, a significant S-TLV can be formed in case B for the following reasons. Firstly, the leakage jet and shear vortices are formed by the larger pressure difference in the back half of the blade. Furthermore, a low-velocity zone is formed attributed to the blocking of the cavity bubbles and the effect of the re-entrant jet flow, which provides a favorable condition for the vortices to gather together. Simultaneously, the cavity bubbles also lift the core of the TLV, making it difficult for the S-TLV to be entrained and absorbed by the TLV. Finally, the flow path formed by the radial jet and the leakage jet promotes the development of the S-TLV, and the radial jet pushes the vortices attached on the suction surface to the blade tip, which strengthens the S-TLV.
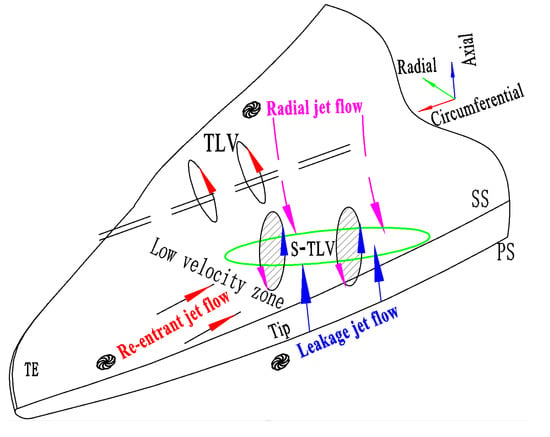
Figure 17.
Schematic diagram of the S-TLV formation mechanism.
In case A, the external conditions of the low-velocity zone and strong radial jet failed to be generated. At the same time, with its small pressure difference, the leakage jet was not sufficient to give birth to the large-scale S-TLV. Meanwhile, the tip leakage flow is also difficult to wrap around the TLV area, and consequently, the TLV is more prone to dissipating.
3.4. TKE, Pressure Pulsation and Vortex Core Trajectory
Figure 18 depicts the distributions of the TKE. In the figure, due to the mutual shear between the main flow and the leakage jet in the axial direction, the TKE is relatively large. In contrast, it is relatively small in other positions with proximity to zero.
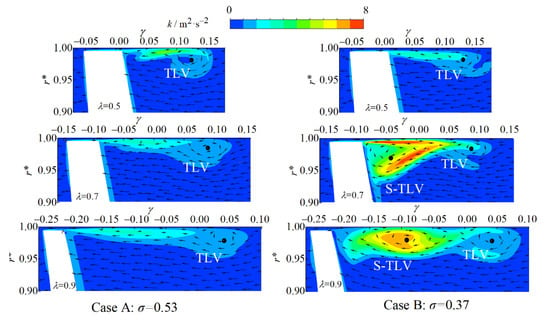
Figure 18.
Distributions of TKE on three planes.
In the λ = 0.5 section, the TKE distribution of case B basically coincides with that of case A. However, in the λ = 0.7 and λ = 0.9 sections, the TKE distribution of case B is concentrated in the S-TLV area, which varies much with case A. Under the combined action of the re-entrant jet and the radial jet, the velocity pulsation is large, and the flow shear in multiple directions occurs at the same time. Consequently, the TKE is relatively large and messy.
In general, the generation of TKE is accompanied by the generation of vorticity. In the section of λ = 0.9, the re-entrant jet weakens, whereas the radial jet is still strong. There is still circumferential vorticity being generated, and the TKE is also large in case B.
Compared with case A, the axial vorticity and its distribution in case B are more significant in the λ = 0.7 section, as demonstrated in Figure 19a. There is a pressure gradient in circumferential direction, which gives birth to the re-entrant jet in case B. When the re-entrant jet flow and the circumferential main flow form convection, a pair of axial vortices in opposite directions are formed, as demonstrated in Figure 19b.
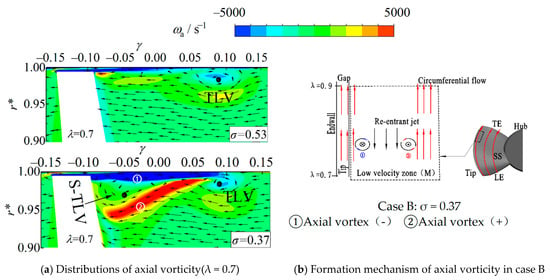
Figure 19.
(a,b) Axial vorticity distributions in the section of λ = 0.7 and its formation mechanism.
The S-TLV is sandwiched between the two axial vortices and remains stable. The axial vortices may play a certain auxiliary role in the generation and development of the S-TLV.
Figure 20 shows three monitoring points and the time-pressure coefficient curves. As illustrated in Figure 20, case A has a higher pressure in the same position than case B.

Figure 20.
Monitoring points and curves of pressure pulsation.
The pressure at the λ = 0.5 point is higher than the saturated vapor pressure, indicating that case A is free from the influence of cavitation. There is no cavitation shedding and vortex influence, and as a result, the pressure pulsation remains small.
The pressure gradually rises along the chord length (pλ=0.9 > pλ=0.7 > pλ=0.5) in the two cases, which verifies that there is a pressure gradient in the circumferential direction in the back half of the blade.
In case B, an obvious pressure pulsation appears at λ = 0.7 and λ = 0.9 points, which are triggered by cavitation shedding and vortex formation. Correspondingly, the TKE at these locations is also larger, as demonstrated in Figure 18.
The vortex can wrap and entrain the cavity bubbles, prevent the cavity bubbles from falling off and collapsing, thereby avoiding the increase in pressure pulsation. The vortices gradually dissipate along the chord length. Therefore, the pressure pulsation amplitude of the λ = 0.9 point appears slightly higher than that of the λ = 0.7 point. Simultaneously, the pressure increases, further advancing the process of the collapse of the cavities.
Figure 21 shows the distribution of the vortex core trajectory. In the axial direction, the TLV core of case B is slightly higher than that of case A at λ = 0−0.7, which is affected by the cavities. Near the trailing edge, under the influence of the S-TLV, the height of the vortex core in case B drops faster. The S-TLV primarily stays and accumulates in the low-velocity zone M on the suction surface, and subsequently driven by the TLV entrainment and jet, the vortex core trajectory develops upward.
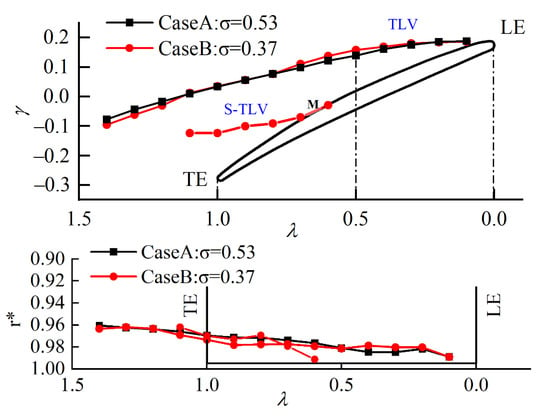
Figure 21.
Distribution of vortex core trajectory.
In the radial direction, at λ = 0−0.5, the cavity bubbles make the TLV’s vortex core trajectory in case B closer to the hub and away from the blade tip; and at λ = 0.5−1, driven by the radial jet, it migrates to the blade tip. The S-TLV is subject to the combined action of the TLV and leakage flow in case B, and the radial position of the S-TLV is basically in agreement with that of the TLV.
3.5. Influence Factors on the S-TLV’s Formation
As observed from Figure 22, the cavitation number is used as the unique variable in the experiments and numerical simulations. The Liutex method is used for vortex identification, the isosurface R = 1000. In the figure, red represents the circumferential vortex, and blue represents the axial vortex.
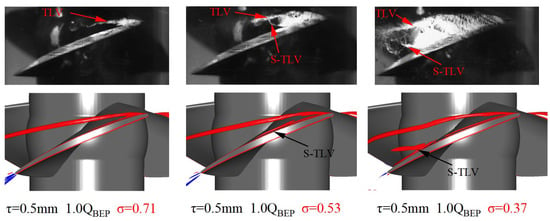
Figure 22.
Cavitation images and vortex isosurface (Liutex R = 1000, Red—circumferential vortex, Blue—axial vortex) under different cavitation numbers.
When the cavitation number decreases, the S-TLV gradually develops and extends to the middle and trailing edge of the blade. When the cavitation is enhanced, the formed cavity bubbles reduce the pressure on the suction surface, increase the pressure difference and accelerate the leakage flow velocity. Cavitation heightens the TLV vortex core and promotes the formation of a low-velocity zone. Cavitation changes the radial pressure distribution and promotes the formation of a radial jet. The lower the cavitation number decreases, the more significant the S-TLV becomes.
As depicted in Figure 23, take the flow rate as a variable and analyze its impact on the S-TLV. When the flow rate decreases, the axial mainstream velocity decreases. The main stream’s constraint on the leakage flow is weakened, and the leakage flow appears to be in a wandering state. The shear cavitation and vortex cavitation emerge and occupy the tip side of the blade, flow instability and cavitation gradually develop and finally, the S-TLV is gradually transformed to the PCV. The lower the flow rate drops, the higher the vortex intensity is generated.
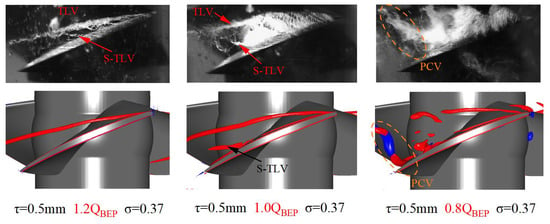
Figure 23.
Cavitation images and vortex isosurface (Liutex R = 1000, Red—circumferential vortex, Blue—axial vortex) under different flow rates.
As shown in Figure 24, take the tip clearance size as a variable and analyze its impact on the S-TLV. When the tip clearance size is reduced, the leakage jet is enhanced in the back half of the blade. With a small clearance size, the S-TLV seems to be easier to generate.
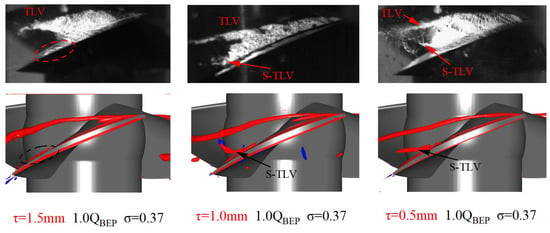
Figure 24.
Cavitation images and vortex isosurface (Liutex R = 1000, Red—circumferential vortex, Blue—axial vortex) under different tip clearance sizes.
4. Conclusions
In this study, the cavitation number σ = 0.37 of the axial flow pump with a clearance of 0.5 mm is taken to study the formation mechanism of the S-TLV. In order to facilitate the study, the case of the cavitation number σ = 0.53 is used as the control group. The main conclusions can be drawn as follows:
(1) The formation of the S-TLV is attributed to the existence of a low-velocity zone M, which is located at the λ = 0.7 section near the tip above the suction surface of the blade. The formation of the low-velocity zone is conducive to the gradual accumulation of the vortices formed by the shearing between the leakage jet flow and the axial main flow at this location. Driven by the radial jet, the small vortices attached on the suction surface are pushed to the blade tip and mixed with the S-TLV by entrainment, which contribute to the development of the TLV and the S-TLV.
(2) The S-TLV contributes to the leakage flow transporting the shear vorticity to the TLV, which can delay the dissipation of the TLV. The S-TLV changes the TLV’s vortex core trajectory in the axial direction.
(3) The S-TLV is wrapped by a pair of axial vortices located above the suction surface at λ = 0.7, which may be beneficial for its stability. The S-TLV’s generation and development process is accompanied by drastic changes in the TKE and pressure pulsation.
(4) The condition of the low cavitation number and small flow rate is conducive to the formation of the S-TLV, which can be transformed into the PCV under a certain condition.
Author Contributions
Conceptualization, H.Z. and W.S.; investigation and writing, H.Z. and D.Z.; validation, H.Z. and D.Z.; visualization, H.Z., W.S. and J.S.; methodology, H.Z., W.S. and J.Z.; software, H.Z., J.S. and J.Z.; formal analysis, H.Z., W.S. and J.Z.; resources, D.Z. and H.Z.; funding acquisition, D.Z. and W.S.; supervision, W.S. All authors have read and agreed to the published version of the manuscript.
Funding
This research was funded by the National Natural Science Foundation of China (51776087), the Equipment Pre-Research Fund Project (8151440002) and the Intelligent Manufacturing Equipment Design and Engineering Application Program of Excellent Scientific and Technological Innovation Team of Colleges and Universities in Jiangsu Province (201907).
Data Availability Statement
The numerical and experimental data used to support the findings of this study are included within the article.
Conflicts of Interest
The authors declare no conflict of interest.
Nomenclature
| Design flow rate | |
| Pump head | |
| Outlet diameter | |
| Inlet diameter | |
| Hub diameter | |
| c | Chord length |
| Tip clearance size | |
| Radius | |
| Radius of the impeller chamber | |
| Radial coefficient | |
| Axial coefficient | |
| Chord length coefficient | |
| Tip velocity | |
| Velocity | |
| Circumferential velocity | |
| Axial velocity | |
| Radial velocity | |
| Turbulence kinetic energy | |
| Pressure | |
| Laminar viscosity | |
| Turbulent eddy viscosity | |
| Rotor angular velocity | |
| Pressure differential coefficient | |
| Vorticity | |
| Pressure coefficient | |
| Cavitation number | |
| Vapor volume fraction | |
| Rigid rotation strength | |
| Vortex intensity | |
| Circumferential vorticity |
References
- Guan, X. Axial Flow Pump and Mixed Flow Pump; Aerospace Press: Beijing, China, 2009. [Google Scholar]
- Rains, D.A. Tip Clearance Flows in Axial Compressors and Pumps. Ph.D. Thesis, California Institute of Technology, Pasadena, CA, USA, 1954. [Google Scholar]
- Hsiao, C.T.; Chahine, G.L. Scaling of tip vortex cavitation inception noise with a bubble dynamics model accounting for nuclei size distribution. J. Fluids Eng. 2005, 127, 55–65. [Google Scholar] [CrossRef]
- You, D.; Wang, M.; Moin, P.; Mittal, R. Vortex Dynamics and Low-Pressure Fluctuations in the Tip-Clearance Flow. J. Fluids Eng. 2007, 129, 1002–1014. [Google Scholar] [CrossRef]
- Tan, D.; Li, Y.; Wilkes, I.; Vagnoni, E.; Miorini, R.L.; Katz, J. Experimental Investigation of the Role of Large Scale Cavitating Vortical Structures in Performance Breakdown of an Axial Waterjet Pump. J. Fluids Eng. 2015, 137, 111301. [Google Scholar] [CrossRef]
- Liu, Y.; Tan, L. Tip clearance on pressure fluctuation intensity and vortex characteristic of a mixed flow pump as turbine at pump mode. Renew. Energy 2018, 129, 606–615. [Google Scholar] [CrossRef]
- Miorini, R.L.; Wu, H.; Katz, J. The internal structure of the tip leakage vortex within the rotor of an axial Water jet pump. J. Turbomach. 2012, 134, 031018. [Google Scholar] [CrossRef]
- Chen, H.; Doeller, N.; Li, Y.; Katz, J. Experimental Investigations of Cavitation Performance Breakdown in an Axial Waterjet Pump. J. Fluids Eng. 2020, 142, 091204. [Google Scholar] [CrossRef]
- Zhang, D.; Shi, L.; Shi, W.; Zhao, R.; Wang, H.; Van Esch, B. Numerical analysis of unsteady tip leakage vortex cavitation cloud and unstable suction-side-perpendicular cavitating vortices in an axial flow pump. Int. J. Multiph. Flow 2015, 77, 244–259. [Google Scholar] [CrossRef]
- Moghadam, S.; Meinke, M.; Schröder, W. Analysis of tip-leakage flow in an axial fan at varying tip-gap sizes and operating conditions. Comput. Fluids 2019, 183, 107–129. [Google Scholar] [CrossRef]
- Shi, L.; Zhang, D.; Zhao, R.; Shi, W.; Van Esch, B. Visualized observations of trajectory and dynamics of unsteady tip cloud cavitating vortices in axial flow pump. J. Fluid Sci. Technol 2017, 12, JFST0007. [Google Scholar] [CrossRef] [Green Version]
- Zhang, H.; Zang, J.; Shi, W.; Zhang, D. Analysis of the Formation Mechanism and Evolution of the Perpendicular Cavitation Vortex of Tip Leakage Flow in an Axial-Flow Pump for Off-Design Conditions. J. Mar. Sci. Eng. 2021, 9, 1045. [Google Scholar] [CrossRef]
- You, D.; Wang, M.; Moin, P.; Mittal, R. Effects of tip-gap size on the tip-leakage flow in a turbo machinery cascade. J. Phys. Fluids 2006, 18, 105102. [Google Scholar] [CrossRef] [Green Version]
- You, D.; Wang, M.; Moin, P.; Mittal, R. Large-eddy simulation analysis of mechanisms for viscous losses in a turbomachinery tip-clearance flow. J. Fluid Mech. 2007, 586, 177–204. [Google Scholar] [CrossRef] [Green Version]
- Zhang, H.; Zuo, F.; Zhang, D.; Shi, W. Formation mechanism and geometric influence of tip clearance vortex structure around hydrofoil. J. Zhejiang Uni. (Eng. Sci.) 2020, 54, 2344–2355. [Google Scholar]
- Wu, H.; Miorini, R.L.; Tan, D.; Katz, J. Turbulence within the tip-leakage vortex of an axial waterjet pump. AIAA J 2012, 50, 2574–2587. [Google Scholar] [CrossRef]
- Wu, H.; Miorini, R.L.; Katz, J. Measurements of the tip leakage vortex structures and turbulence in the meridional plane of an axial water-jet pump. Exp. Fluids 2011, 50, 989–1003. [Google Scholar] [CrossRef]
- Wu, H.; Tan, D.; Miorini, R.L.; Katz, J. Three-dimensional flow structures and associated turbulence in the tip region of a waterjet pump rotor blade. Exp. Fluids 2011, 51, 1721–1737. [Google Scholar] [CrossRef]
- Dreyer, M. Mind the Gap: Tip Leakage Vortex Dynamics and Cavitation in the Axial Turbines. Ph.D. Thesis, Swiss Federal Institute of Technology in Lausanne (EPFL), Lausanne, Switzerland, 2015. [Google Scholar]
- Decaix, J.; Dreyer, M.; Balarac, G.; Farhat, M.; Münch, C. RANS computations of a confined cavitating tip-leakage vortex. Eur. J. Mech. B-Fluid 2018, 67, 198–210. [Google Scholar] [CrossRef] [Green Version]
- Dreyer, M.; Decaix, J.; Münch-Alligné, C.; Farhat, M. Mind the gap: A new insight into the tip leakage vortex using stereo-PIV. Exp. Fluids 2014, 55, 1849. [Google Scholar] [CrossRef]
- Giuni, M.; Green, R.B. Vortex formation on squared and rounded tip. Aerosp. Sci. Technol. 2013, 29, 191–199. [Google Scholar] [CrossRef] [Green Version]
- Laborde, R.; Chantrel, P.; Mory, M. Tip clearance and tip vortex cavitation in an axial flow pump. J. Fluids Eng. 1997, 119, 680–685. [Google Scholar] [CrossRef]
- Zhang, H.; Wang, J.; Zhang, D.; Shi, W.; Zang, J. Numerical Analysis of the Effect of Cavitation on the Tip Leakage Vortex in an Axial-Flow Pump. J. Mar. Sci. Eng. 2021, 9, 775. [Google Scholar] [CrossRef]
- Chen, H.Y.; Bai, X.R.; Long, X.P.; Ji, B.; Farhat, M. Large eddy simulation of the tip-leakage cavitating flow with an insight on how cavitation influences vorticity and turbulence. Appl. Math. Model 2019, 77, 788–809. [Google Scholar] [CrossRef]
- Zhao, Y.; Wang, G.; Jiang, Y.; Huang, B. Numerical analysis of developed tip leakage cavitating flows using a new transport-based model. Int. Commun. Heat Mass Transf. 2016, 78, 39–47. [Google Scholar] [CrossRef]
- Guo, Q.; Huang, X.; Qiu, B. Numerical investigation of the blade tip leakage vortex cavitation in a waterjet pump. Ocean Eng. 2019, 187, 106170. [Google Scholar] [CrossRef]
- Lee, H.; Park, K.; Choi, H. Experimental investigation of tip-leakage flow in an axial flow fan at various flow rates. J. Mec. Sci. Tec. 2019, 33, 1271–1278. [Google Scholar] [CrossRef]
- Zhang, D.; Shi, W.; van Esch, B.; Shi, L.; Dubuisson, M. Numerical and experimental investigation of tip leakage vortex trajectory and dynamics in an axial flow pump. Comput. Fluids 2015, 112, 61–71. [Google Scholar] [CrossRef]
- Zhang, H.; Zuo, F.; Zhang, D.; Shi, W. Formation and Evolution Mechanism of Tip Leakage Vortex in Axial Flow Pump and Vortex Cavitation Analysis. Trans. Chin. Soc. Agr. Mach. 2020, 52, 157–167. [Google Scholar]
- Shi, L.; Zhang, D.; Jin, Y.; Shi, W.; van Esch, B.P.M. A study on tip leakage vortex dynamics and cavitation in axial-flow pump. Fluid Dyn. Res. 2017, 49, 035504. [Google Scholar] [CrossRef]
- Zhang, D.; Shi, W.; Pan, D.; Dubuisson, M. Numerical and Experimental Investigation of Tip Leakage Vortex Cavitation Patterns and Mechanisms in an Axial Flow Pump. J. Fluids Eng. Trans. ASME 2015, 137, 121103. [Google Scholar] [CrossRef]
- Tan, D.Y.; Miorini, R.L.; Keller, J.; Katz, J. Flow Visualization Using Cavitation Within Blade Passage of an Axial Waterjet Pump Rotor. In Proceedings of the ASME 2012 Fluids Engineering Summer Meeting, Rio Grande, PR, USA, 8–12 July 2012. [Google Scholar]
- Shen, X.; Zhang, D.; Xu, B.; Jin, Y.; Shi, W.; Esch, B. Experimental investigation of the transient patterns and pressure evolution of tip leakage vortex and induced-vortices cavitation in an axial flflow pump. J. Fluid Eng. 2020, 142, 101206. [Google Scholar]
- ANSYS, Inc. ANSYS CFX-Solver Theory Guide, Release 17.1; SAS IP, Inc.: Canonsburg, PA, USA, 2016. [Google Scholar]
- Menter, F.R. Review of the shear-stress transport turbulence model experience from an industrial perspective. Int. J comput. Fluid. D. 2009, 23, 305–316. [Google Scholar] [CrossRef]
- Heydari, M.; Sadat-Hosseini, H. Analysis of propeller wake field and vortical structures using k-Omega SST Method. Ocean Eng. 2020, 204, 107247. [Google Scholar] [CrossRef]
- Geng, L.; Escaler, X. Assessment of RANS turbulence models and Zwart cavitation model empirical coefficients for the simulation of unsteady cloud cavitation. Eng. Appl. Comp. Fluid Mech. 2020, 14, 151–167. [Google Scholar] [CrossRef]
- Zwart, P.; Gerber, A.G.; Belamri, T. A two-phase model for predicting cavitation dynamics. In Proceedings of the ICMF 2014 International Conference on Multiphase Flow, Yokohama, Japan, 30 May–3 June 2004; p. 152. [Google Scholar]
- Bai, X.; Cheng, H.; Ji, B.; Long, X.; Qian, Z.; Peng, X. Comparative Study of different vortex identification methods in a tip-leakage cavitating flow. Ocean Eng. 2020, 207, 107373. [Google Scholar] [CrossRef]
- Liu, C.Q.; Gao, Y.S.; Tian, S.L.; Dong, X.R. Rortex-A new vortex vector definition and vorticity tensor and vector decompositions. Phys. Fluids 2018, 30, 12. [Google Scholar] [CrossRef] [Green Version]
- Liu, Y.; Tan, L. Method of C groove on vortex suppression and energy performance improvement for a NACA0009 hydrofoil with tip clearance in tidal energy. Energy 2018, 155, 448–461. [Google Scholar] [CrossRef]
Publisher’s Note: MDPI stays neutral with regard to jurisdictional claims in published maps and institutional affiliations. |
© 2022 by the authors. Licensee MDPI, Basel, Switzerland. This article is an open access article distributed under the terms and conditions of the Creative Commons Attribution (CC BY) license (https://creativecommons.org/licenses/by/4.0/).