1. Introduction
To simulate reactive supersonic flows,
rhoCentralRfFoam has been presented as a suitable solver for reactive Euler equations. This solver is derived from
rhoCentralFoam, the OpenFOAM solver for density-based compressible flows [
1], and has been tested, validated, and updated in several works [
2,
3,
4,
5]. In its current version, the solver employs a third-order, three-stage Strong Stability Preserving Runge–Kutta (SSPRK) scheme [
6] for the discretization of the transient term, along with a second-order central-upwind Kurganov–Noelle–Petrova (KNP) scheme [
7] for the convective term. It also incorporates the first-order operator splitting technique, implemented in the native OpenFOAM chemical solvers and called OpenFOAM splitting in [
8].
There are multiple density-based solvers for the reactive Euler equations. These include the following:
detonationFoam, a centered solver derived from
rhoCentralFoam, which utilizes an approximate Riemann solver of the Harten–Lax–van Leer (HLL) type [
9], incorporating contact discontinuity (C) [
10] and pressure correction (P), known as HLLC-P [
11], adaptive mesh refinement, and dynamic load balancing [
12];
reactingPimpleCentralFoam, a hybrid solver combining the semi-implicit PIMPLE algorithm with centered Kurganov–Tadmor schemes [
13]; and
blastFoam, a library and solver oriented to highly compressible flows, for both single-phase and multiphase, designed for simulations of high-energy detonations, shock waves, and explosive safety problems. The latter implements approximate Riemann schemes (HLL, HLLC, and HLLC-P) and Runge–Kutta and SSPRK time integration methods up to the fourth order [
14].
The solver
RSDFoam takes into account nonlinearities in the equation of state, advanced thermodynamic functions, and chemical kinetics through Cantera, utilizing
blastFoam as its core for solving the flow field [
15]. There is also
CDSFoam, based on
deepFlame, which incorporates the
blastFoam and
detonationFoam flow schemes, in addition to the HLLC-LM scheme (HLL with Low-Mach correction [
16]) for spatial discretization. This solver employs third-order SSPRK time integration and Cantera’s CVODE solver, along with dynamic load balancing (DLB). On the other hand,
CTreactingFoam couples OpenFOAM with Cantera and uses Strang splitting operator separation as well as well-balanced splitting schemes for species integration, while
EBIdnsFoam implements a fully implicit second-order time discretization, fourth-order spatial convergence, and efficient chemical treatment with Cantera and CVODE [
17].
All of these solvers have been validated through comparisons with analytical solutions (such as Chapman–Jouguet, Zeldovich–von Neumann–Döring, or Rankine–Hugoniot solutions [
18]), computational benchmarks (including Cantera [
19], Adaptive Simulation of Unsteady Reacting Flow (A-SURF) [
20], and Radiation Adaptive Grid Eulerian (RAGE) [
21]), and/or experimental data available in the literature. However, this validation process requires well-established reference cases, which are not always readily available. Factors contributing to this limitation include restricted access to benchmarks, challenges in accurately reproducing reference cases, uncertainties in extracting data from scientific articles, and the absence of exact solutions for complex phenomena, particularly in detonation and combustion studies.
Several works in the literature, while not explicitly proposing or developing an intrinsic validation method, provide concepts and tools closely related to this idea. Some studies have examined the use of global physical properties, such as the integral conservation of mass, momentum, and energy, as indicators of a simulation’s consistency. One notable example is [
22], which evaluates the performance of a numerical solver by comparing the total masses per phase at two different time points in a cavitation–condensation system with a phase transition.
Similarly, ref. [
23] examines the performance of simulations conducted with
FireFOAM by performing a global analysis of mass and energy conservation principles. This study employs approximate general expressions and, in some cases, global coefficients for the terms that comprise the governing equations. On the other hand, ref. [
24] assesses the numerical performance of a proprietary pressure-based solver developed outside the OpenFOAM environment, focusing on the analysis of compressible interfacial flows. This research quantifies the relative conservation error associated with each fundamental equation—mass, momentum, and energy—by simplifying the analysis with periodic boundary conditions. This approach allows the study to focus on a direct comparison of the quantities integrated over the entire domain at each time step against their initial values.
Ref. [
25] develops a solver based on OpenFOAM that employs Arbitrary Lagrangian–Eulerian (ALE) schemes [
26] and supports dynamic meshes with topological changes. The solver also implements second-order temporal schemes, specifically the Second-Order Backward Euler (SOBE) and Crank–Nicolson methods [
27]. Similar to previous work, the principle of mass conservation is evaluated by considering only the total mass difference between the initial and final states of the domain. This simplification in the error calculation method arises solely from the nature of the problem, and a detailed derivation of a general expression is not provided.
This work proposes an alternative strategy that is self-contained within the simulation results, which can serve as an a posteriori verification tool or be easily integrated into the solver’s workflow. It involves verifying compliance with global conservation principles by formulating each conservation or balance equation in integral form. This methodology provides a straightforward, rapid, and independent approach to evaluating the performance of a numerical solver on relevant problems, thereby eliminating the need for more complex external validation methods.
However, in the presence of shocks or discontinuities, numerical solutions are only approximations to weak solutions of the governing equations [
28,
29]. In this context, verifying compliance with the conservation principles ensures the consistency of the solver by adequately representing a weak solution to the equations under study. Nevertheless, to reinforce such consistency through physical plausibility, it is pertinent to complement the proposed methodology with minimal external validation that allows comparing the results obtained with values reported in the reference literature.
2. Methodology
Any fluid system can be described using balance equations that follow a general form applicable to different physical variables [
30,
31]:
where
is a physical property per unit volume,
is the velocity at which this property is transported in space, and
is a function representing sources or sinks due to internal or external processes.
The proposed methodology for evaluating the quality of numerical simulations consists of applying the integral form of the balance Equation (
1) to the entire control volume. To do this, Equation (
1) is integrated into the following volume:
When analyzing a fixed control volume over time, we can apply Gauss’s divergence theorem:
where
denotes the outward-facing unit normal vector of the control volume, such that a positive flux represents a net outflow of the quantity
across its boundary, while a negative flux corresponds to a net inflow [
32].
If the boundary
is divided into
N portions
over which the field
is constant or evaluated at a given point, and it is also defined as follows:
then, Equation (
3) can be written as follows:
In Equation (
5), the balance equation has been rearranged so that the time term is isolated on the left-hand side, while the convection and source terms are grouped on the right-hand side, according to the line method [
28]. Integrating both sides over time,
Then, the integral balance equation is obtained as follows:
The last equation expresses that the amount of within the volume V at a time t is equal to its initial quantity, adjusted by the net amount that has crossed the boundary (either leaving or entering), plus the total accumulation generated by internal sources acting within the volume during the considered time interval.
Each term in (
7) is defined as follows:
The proposed methodology is implemented along with a numerical integration scheme to evaluate each component in Equation (
8). In this study, we utilized Simpson’s 3/8 rule due to its stability and accuracy, which helps maintain adequate control over errors that may arise during the post-processing of the results.
Since the objective of this methodology is to numerically verify compliance with conservation laws, the conservation law expressed in Equation (
2) is assumed to be formally exact in its continuous form. Therefore, any deviation observed in the numerical evaluation using the proposed methodology is attributed to the combined effects of spatial discretization, temporal integration, and post-processing errors, rather than to a failure of the conservation principle itself.
2.1. Reactive Euler Equations
The reactive Euler equations describe the balance within a differential element by taking into account the changes occurring inside the differential volume, the changes at the boundaries of that volume, and the contributions generated by sources of the conservative variable due to chemical action. Mathematically, this set of equations is expressed as a system of partial differential equations:
is the state variable vector,
is the convective flow vector, and
is the source vector. Which can be written as follows:
where
is the fluid density,
are the velocity components in the
directions, respectively,
E is the total energy per unit mass,
p is the pressure,
is the mass fraction of chemical species
k,
is the rate of energy generation or consumption due to chemical reactions, and
is the rate of production or consumption of chemical species
k. A detailed explanation of the terms
and
will be provided later.
2.2. Constitutive Model
The reactive Euler equations, by themselves, constitute an under-determined system. For this to be closed and solvable, it is necessary to complement the set with a constitutive equation of state. If we assume that the reactive mixture is composed of
N gaseous species that behave as ideal gases, the equation of state can be expressed as follows:
where
T is the temperature,
is the molecular mass of species
k,
is the average molecular mass of the mixture, and
is the universal gas constant.
The temperature dependence of the standard-state thermodynamic properties is expressed by polynomials of the form given by [
33]:
where
,
, and
represent, respectively, the molar specific heat at constant pressure, the molar enthalpy, and the molar entropy of species
k in the standard state. The species-specific coefficients
are obtained from thermodynamic data, such as those provided by the
CHEMKIN [
33] database. These coefficients correspond to the NASA polynomial approximation, which represents the temperature dependence of thermodynamic properties (specific heats, enthalpy, and entropy) over a relevant temperature range. By definition, they are empirical fitting parameters derived from experimental or high-fidelity data and have no direct physical meaning.
For ideal gases, the values of molar specific heats, as well as enthalpies and internal energies, are independent of pressure; therefore, they coincide with their respective values in the standard state. Conversely, entropy depends on pressure. Therefore, the pressure contribution must be added to the standard state values to obtain the actual values. Thus,
where
is the mole fraction of species
k, and
is the standard state reference pressure.
The average molar thermodynamic properties of the mixture are obtained as a weighted average by the mole fraction, and the specific properties are calculated by dividing these quantities by the average molecular mass of the mixture:
Once the thermodynamic properties of the mixture have been established, we evaluate the source terms in the species and energy equations.
Consider
I elementary reactions, reversible or irreversible, involving
K chemical species, which can be written as follows:
where
and
are, respectively, the stoichiometric coefficients of reactants and products in reaction
i, and
represents the species
k.
The production or consumption rate of species
k, denoted by
, is expressed as the sum of the contributions from all reactions in which that species participates:
The velocity
for reaction
i is given by the difference between the forward and reverse rates, such that
where
represents the molar concentration of species
k, and
and
are the forward and reverse rate constants of reaction
i. When reaction
i involves a third body, which is often the case in dissociation or recombination processes, the right side of Equation (
17) must be multiplied by the effective molar concentration of the third body. This effective concentration is calculated as a weighted average of the molar concentrations of the species present, where the weights are the efficiency coefficients of the third body. These coefficients are greater than zero for species that significantly favor the reaction and equal to zero for those that do not participate as a third body. The expression is as follows:
where
denotes the efficiency coefficient of species
k as a third body in reaction
i.
The forward rate constants for reactions
i are assumed to verify the Arrhenius law:
where
is the pre-exponential factor,
the temperature exponent, and
the activation energy. These three parameters must be specified for each reaction.
The backward rate constants
are related to the forward rate constants by the equilibrium constants
, which can be expressed in terms of standard thermodynamic properties:
where the equilibrium constant as a function of pressure,
, is as follows:
Knowing the production or consumption rate of each species and its standard specific enthalpy of formation at the reference temperature, it is possible to calculate the heat released by combustion using the following expression:
where
is the standard specific enthalpy of formation at
K of species
and
is the rate of creation or consumption of the same species.
These models are fundamental for assessing how the thermodynamic properties of the mixture change, as well as how the source terms for the species and energy equations evolve during the combustion process.
2.3. Error Metrics
To quantitatively assess the accuracy of calculating compliance with the global conservation principles outlined in the proposed strategy, the error metrics used are defined below.
The conservation residual, or error committed in complying with the conservation principle, is defined by the following equation:
corresponds to the estimated value of obtained from the numerical solution.
Similarly, the relative error is defined as follows:
and the percentage relative error results as follows:
To accurately assess the overall error associated with a given mesh refinement level in a simulation, the L
2 norm of the error is defined as follows:
where
M denotes the total number of samples used in computing the norm. From these metrics, it is possible to accurately and directly quantify the deviations in the numerical solution from the expected global conservation.
2.4. Minimum Complementary External Validation
To ensure the physical plausibility of the results and verify their consistency with findings in the specialized literature, an additional minimum external validation is incorporated. For this purpose, two representative magnitudes of detonation dynamics are analyzed: the induction time associated with the ignition of the reactive mixture and the temporal evolution of the pressure peak.
3. Results
In this section, we present the conservation balances for mass, momentum, energy, and species. To develop this task, we study the ignition by a strong-configuration shock wave reflection.
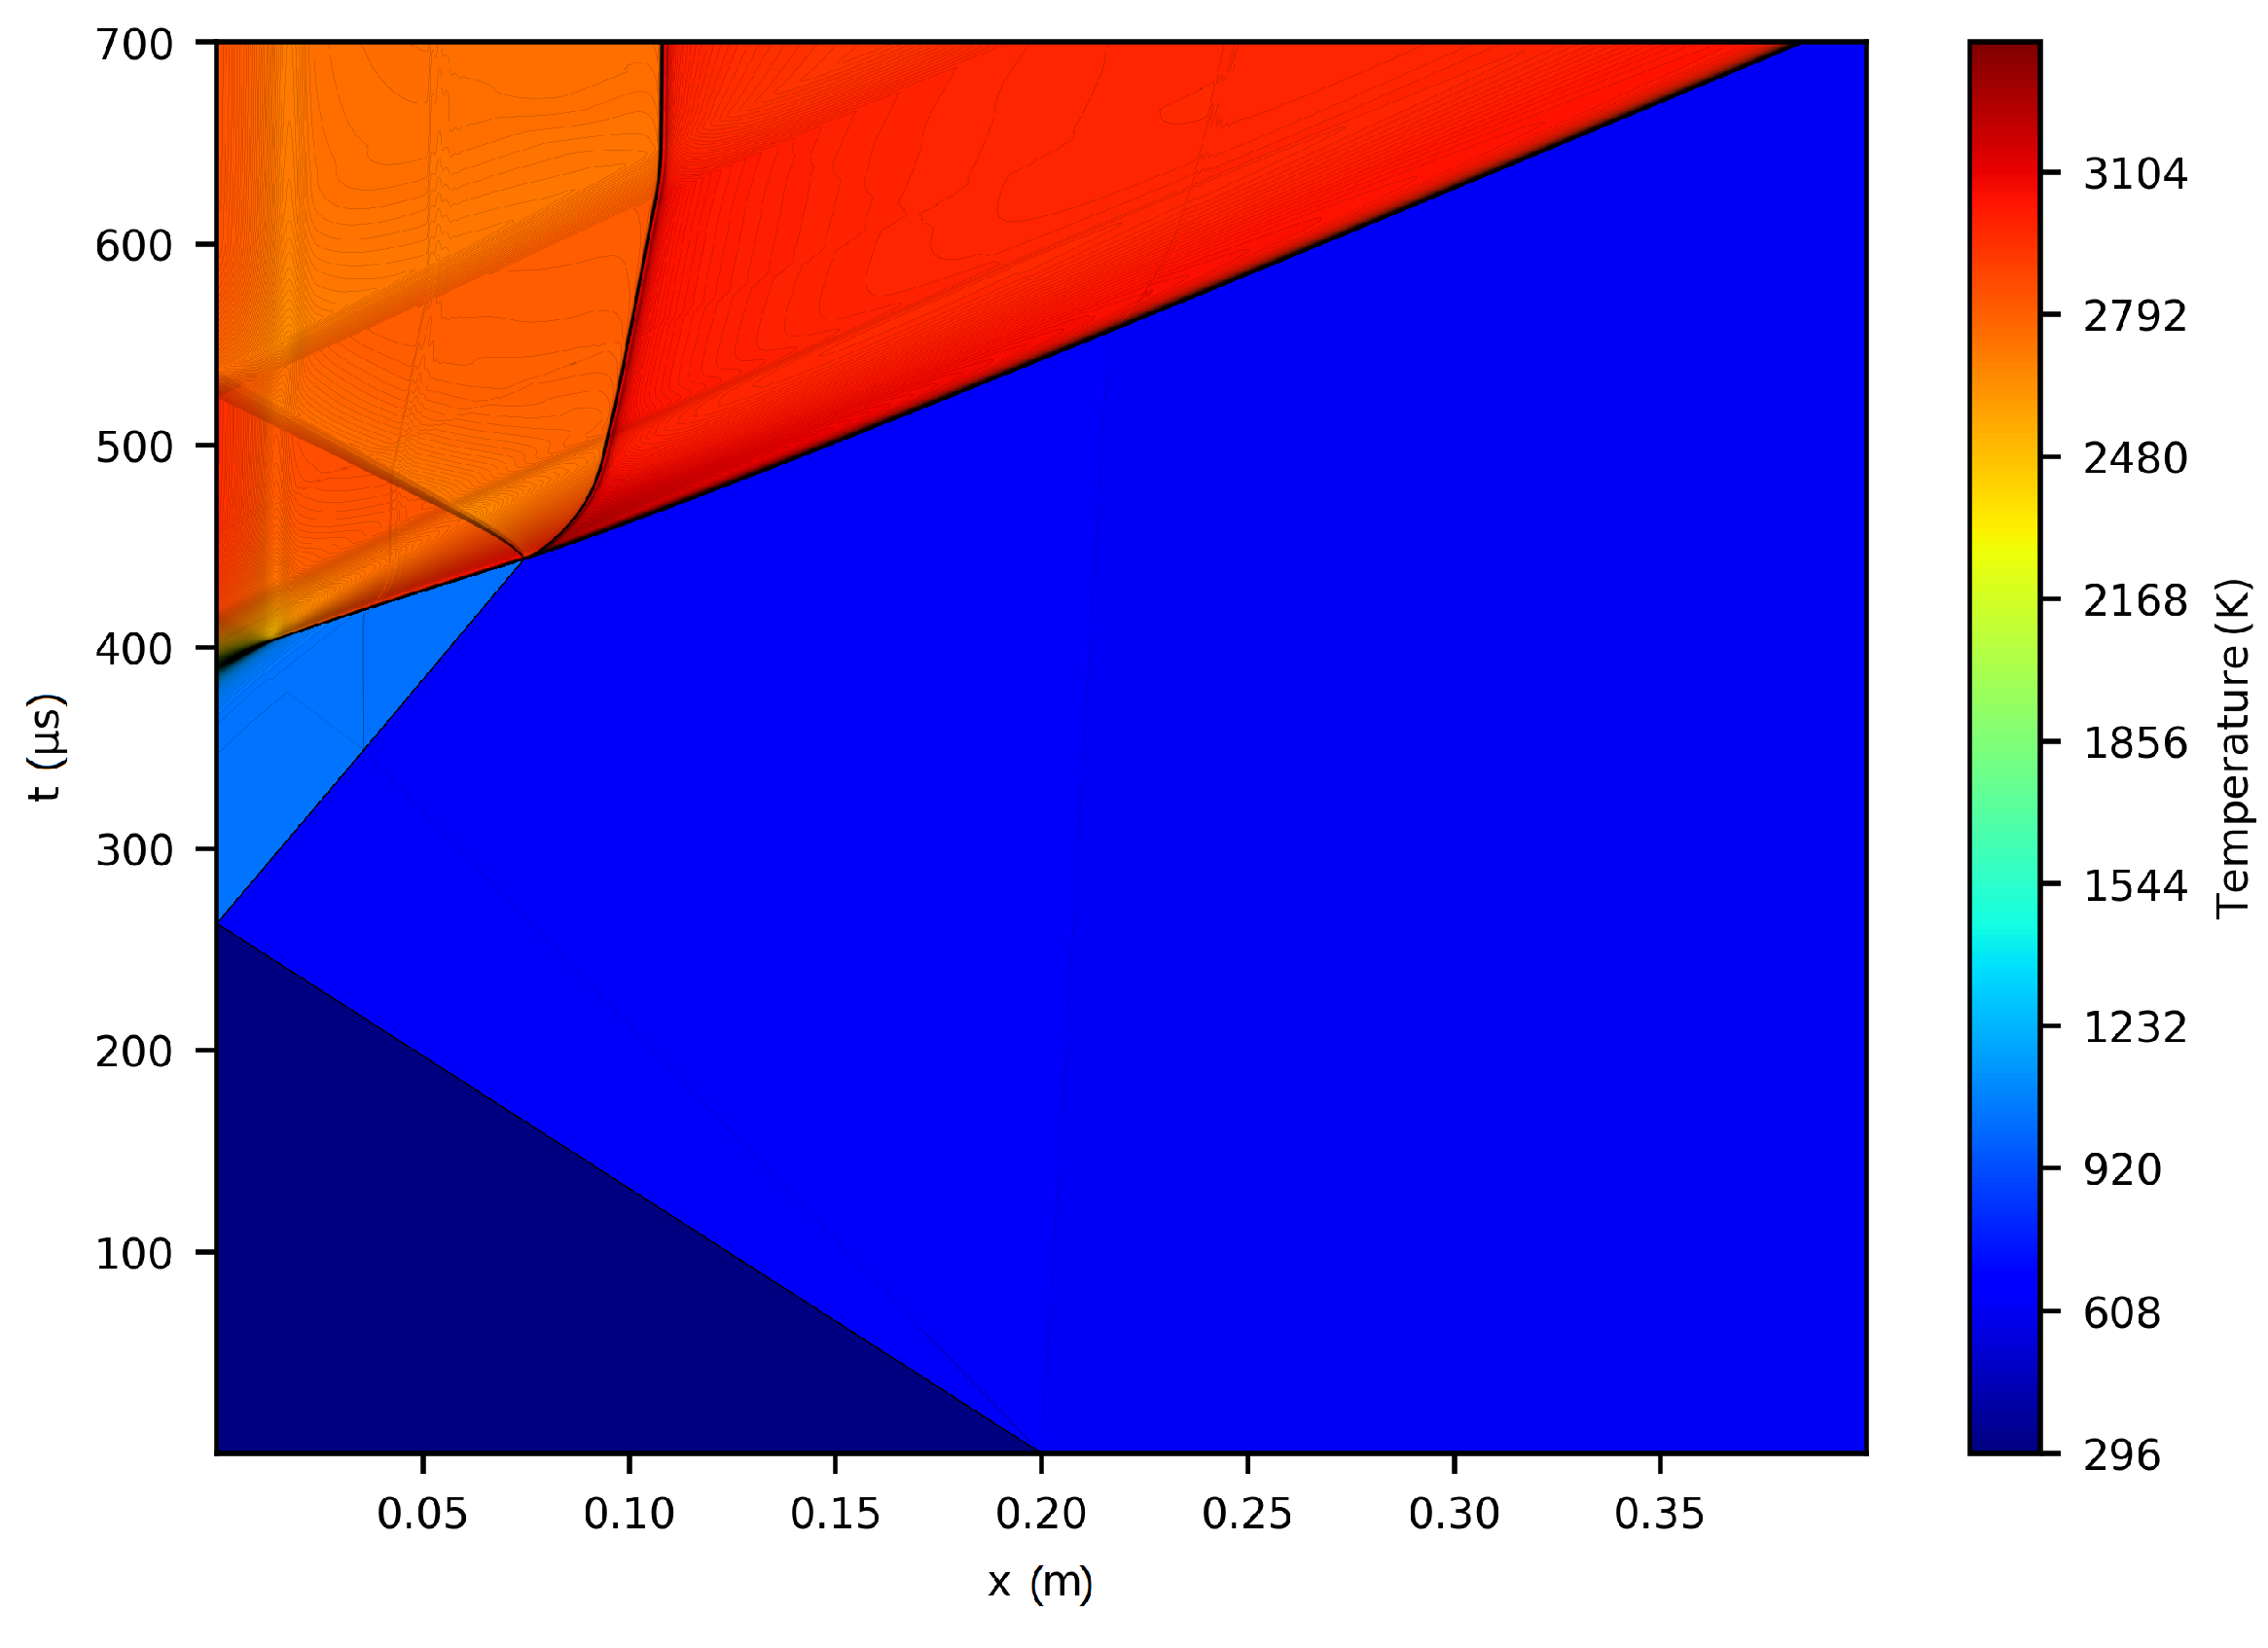
Figure 1 depicts the physical representation of the phenomenon under study. It displays the temperature contour lines obtained from the numerical simulation in a position versus time diagram.
The maximum relative deviation serves as a measure of the maximum error in conserved quantities that have non-zero values at the initial time, including mass, momentum, energy, and the partial masses of , , and . Additionally, for all analyzed variables, relative error is used as a common metric to thoroughly assess the solver’s performance in adhering to the conservation principles.
A brief scaling study is presented, focusing on the spatiotemporal refinement of the computational mesh.
3.1. Ignition by Strong-Regime Shock Wave Reflection
To evaluate the numerical performance of
rhoCentralRfFoam using the integral conservation principles over the entire control volume, as well as the physical plausibility in the numerical results construction, we have selected, as our test case, a strong-configuration shock wave reflection ignition simulation [
34]. Specifically, the initial discontinuity is positioned
from the reflecting wall, and the initial conditions are outlined in
Table 1.
The simulation was conducted over a spatial domain of and a time domain of μs. We utilized a mesh consisting of 64,000 elements and maintained a maximum Courant number of 0.05 to prevent the introduction of numerical noise, given the high density of the mesh.
For calculating inter-cell fluxes, we applied the
vanAlbada TVD limiter to all interpolated fields within the KNP discretization framework, which ensures that shock waves are sharply captured while avoiding unphysical oscillations. Additionally, we evaluated detailed chemical kinetics using the Oran kinetic model, as described in [
34].
The simulation was conducted using the rhoCentralRfFoam solver on the OpenFOAM platform, utilizing 192 computing cores. A total of 13,269,731 time steps were executed, with a runtime of 34.9 h and a wall-clock time of 35.8 h, resulting in an average duration of approximately 0.009722 s per step. The total CPU consumption reached 6881.2 h. To ensure numerical stability and minimize errors associated with discontinuities, the time step was dynamically adjusted at each iteration according to standard OpenFOAM methodology, which enforced a maximum Courant number of 0.05. This conservative approach helped control the overshoot and undershoot effects that are common with high-order schemes in regions with steep gradients, as well as effectively manage the stiffness caused by the system’s source terms.
An external validation was carried out to ensure that the solution obtained with
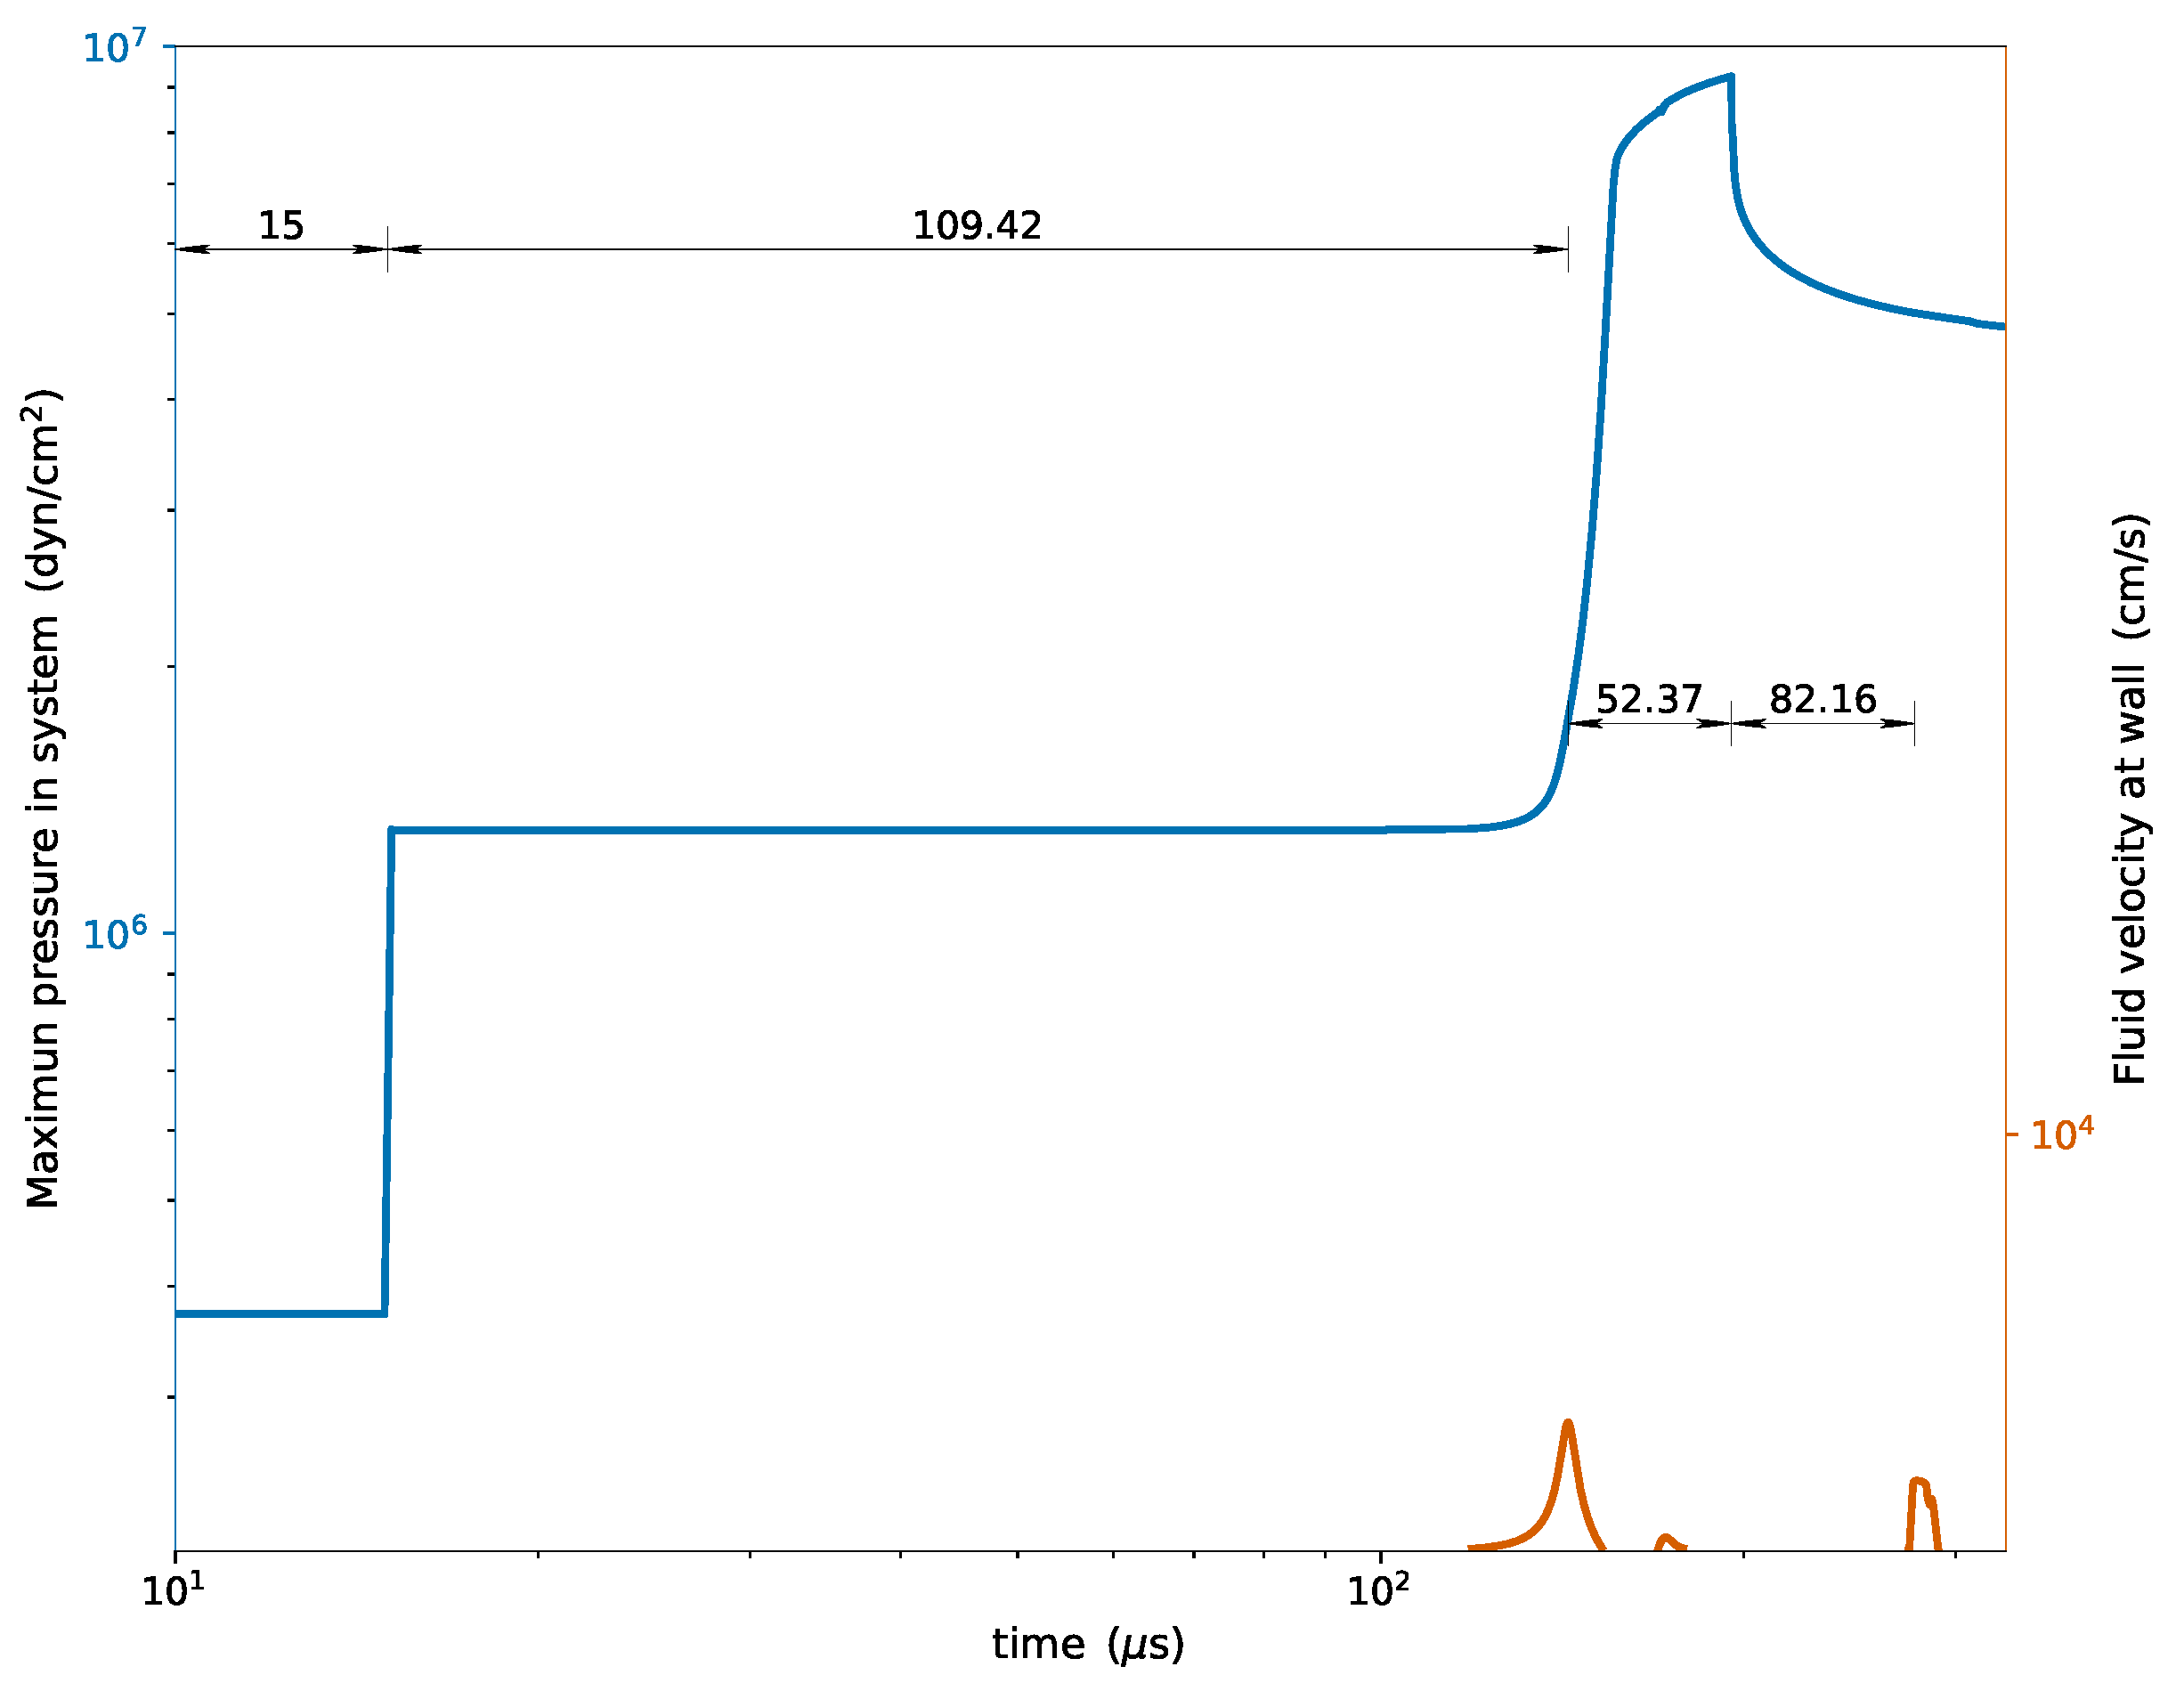
rhoCentralRfFoam corresponds to references available in the literature. This validation involved comparing the maximum pressures recorded throughout the simulation and the velocity at 1 mm from the reflecting wall (see
Figure 2) with the values reported in [
34,
35].
In the figure, the reflection time coincides with 15 μs indicated in [
34]. We carried out this implementation to maintain consistency due to the lack of definition of the position of the initial discontinuity in that reference. The induction time obtained in our simulation with
rhoCentralRfFoam was
μs, in close agreement with the
μs reported by Oran et al. [
34] and the
μs indicated by Im et al. [
35].
Regarding the detonation establishment time from the reaction (
μs according to
Figure 2), and the reactive expansion fan reflection time from the formation of the detonation (
μs in the same figure), the deviations with respect to Oran’s results are
and
, respectively; while compared to Im’s results the differences are
and
.
Due to the one-dimensional nature of the analyzed problem and the constant cross-sectional hexahedral shape of the entire control volume, the volume integrals outlined in the methodology section can be simplified. They can be expressed as products of one-dimensional integrals and the constant cross-sectional area. Consequently, the numerical results presented below will be expressed in the units of .
3.2. Convergence Study
To verify that numerical errors decrease with spatiotemporal mesh refinement, we conducted a convergence study using three simulations with varying spatial resolutions: 6000, 18,000, and 54,000 elements. It is important to note that while the refinement was explicitly applied to the spatial domain, it also included a refinement in the temporal aspect, given the relationship between these two scales through the CFL (Courant–Friedrichs–Lewy) number.
For each simulation, the time evolutions of the residuals of the conserved variables were recorded, to which the L
2 norm was applied according to Equation (
26), to obtain an integral measure of the error for each refinement level
N. The results related to the conservation principles of mass, momentum, energy, and the partial masses of the species
,
and
are presented in
Figure 3a, In contrast, the results concerning the partial masses of the product species are shown in
Figure 3b.
The analysis presented in
Figure 3a,b confirms that all the examined variables exhibit convergent behavior. Specifically, the conservation equations for mass, momentum, energy, and the partial mass of oxygen converge at a rate close to 1. The partial masses of species such as
,
,
,
, and
also demonstrate convergence, although their rates differ slightly from the theoretical order of 1. In contrast, for the partial masses of
,
, and
, while a significant reduction in error with increasing elements is not observed, the error remains bounded and small across all considered meshes. Collectively, these results enhance our confidence in the accuracy of the predictions made by the solver.
3.3. Mass
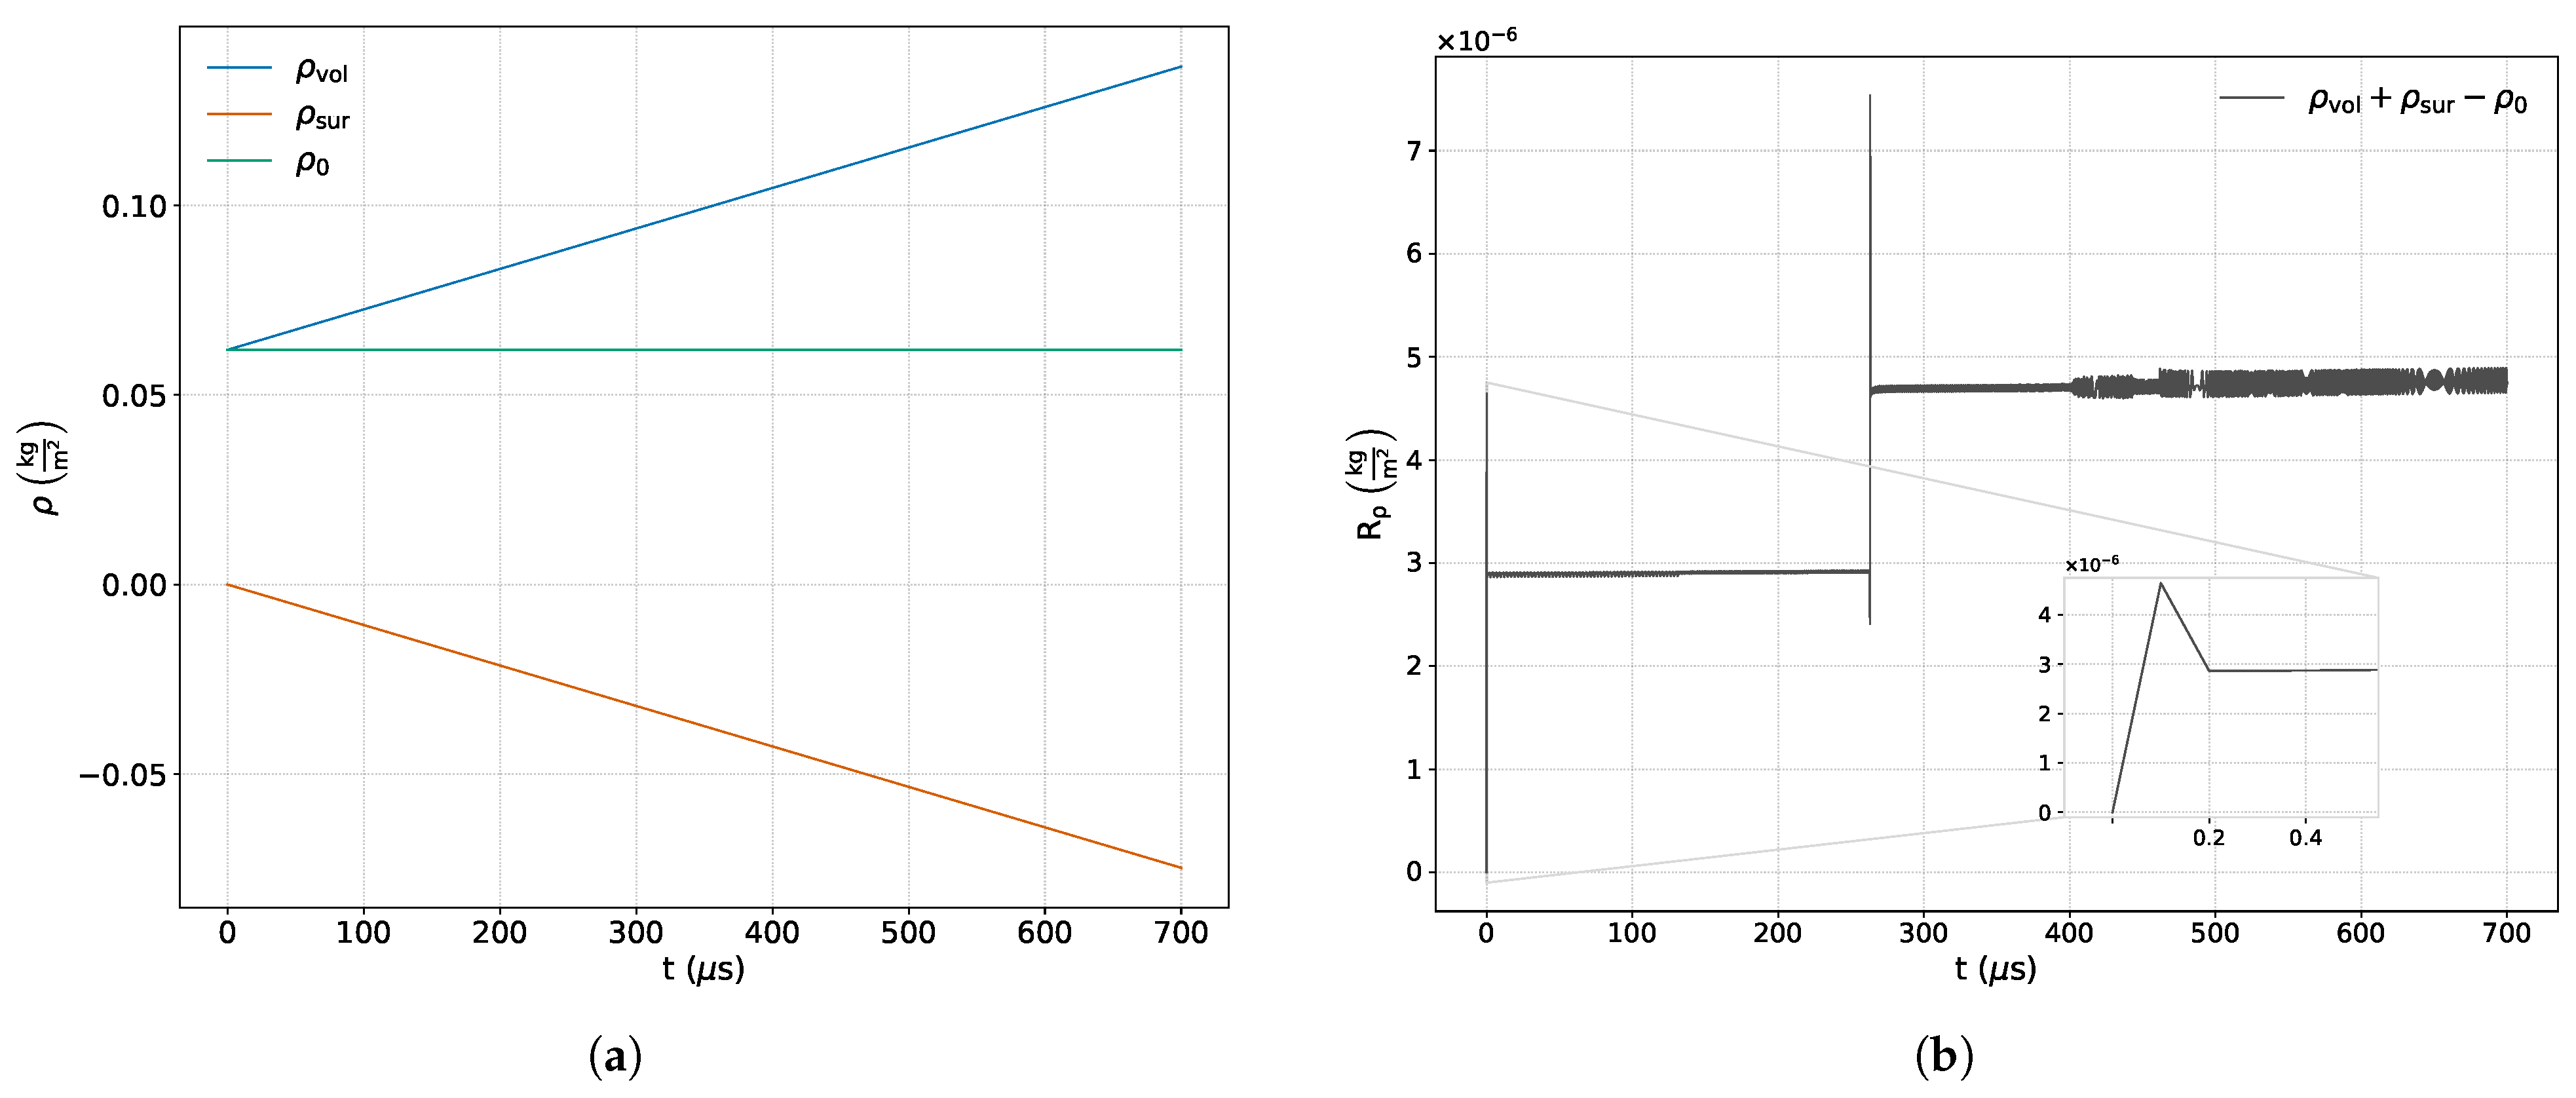
Figure 4a shows the time variation of each term that makes up the integral expression of the mass conservation equation.
Figure 4b presents the sum of all the aforementioned terms, along with a zoom-in displaying the variation in numerical error at the beginning of the simulation.
The nature of the mass conservation equation establishes a balance between its constituent terms: the net mass crossing the boundaries of the control volume (surface contribution,
) translates into an equivalent increase in the mass contained within it (volumetric contribution,
). This behavior is confirmed in
Figure 4a, where the temporal variations of the surface and volumetric terms balance each other in accordance with the fact that the equation does not include an external source term that contradicts this principle.
On the other hand, the analysis of
Figure 4b enables the evaluation of the cumulative deviation observed in the mass balance, which accounts not only for the discretization errors inherent to the implemented numerical schemes, but also for the additional discrepancies introduced by the post-processing methodology.
It is observed that the solution is sensitive to the initial conditions of the simulation and to the reflection event of the shock wave incident on the reflecting wall.
The small discontinuity observed during the first time step arises from the start-up transient associated with the initialization of the Riemann problem. At
, the discontinuity between the left and right states is resolved by the reconstruction scheme, which employs bounded gradients computed from the initial field. Although this field represents the exact physical state of the problem, its numerical representation does not accurately capture the flow dynamics, thereby generating an initial numerical transient that rapidly decays over time, as shown in the inset of
Figure 4b. The secondary jump observed in the mass conservation residual corresponds to the reflection of the incident shock wave at the rigid boundary. At this point, the abrupt reversal of the velocity field, along with the sudden increase in pressure, density, and temperature, induces extremely steep gradients in the cells adjacent to the wall. Under these conditions, the limiter must readjust to the emergence of a new physical discontinuity emanating from the boundary, resulting in a transient imbalance in mass fluxes and producing the observed jump. Once the reflected front stabilizes, the limiter operates in a quasi-steady regime around the discontinuity. This effect, being purely numerical in nature, quickly attenuates as the reflected flow approaches its steady state, which is also evident in the momentum field response shown in the inset of
Figure 5b.
The maximum deviation computed for this principle was relative to its initial value. This deviation results from the cumulative effects of finite-precision arithmetic, numerical truncation, and errors introduced during post-processing. In density-based solvers such as rhoCentralRfFoam, strict mass conservation is achieved only when all face fluxes are perfectly antisymmetric and time integration is exact. In practice, however, interpolation and time discretization introduce truncation errors of order and , respectively. Additionally, the computation of the continuity equation is affected by the solutions of the remaining governing equations due to the segregated nature of the algorithm, while the proposed methodology introduces an additional source of error, as reflected in the conservation residual. Despite these contributions, the cumulative effect leads to a maximum deviation of only , indicating that—although the residual is influenced by multiple error sources—mass conservation remains within acceptable bounds and does not compromise the overall mass balance or the fidelity of the proposed approach. Finally, a moderate but limited increase in the amplitude of the continuity residual oscillations is observed during the time interval in which chemical activity occurs.
3.4. Momentum
Figure 5a shows the temporal evolution of each term that makes up the integral formulation of the linear momentum conservation. On the other hand,
Figure 5b displays the sum of all the previous ones, as well as a zoom-in showing the variation in numerical error when the incident shock wave is reflected off the reflective wall.
This principle includes a source term associated with pressure forces, which can be treated jointly with the convective term but does not share the same physical nature as the latter. Therefore, it is expected that both the time variation of momentum across the boundaries of the control volume, as well as that stored within it, are influenced by the mechanisms that cause pressure changes at these boundaries, as can be observed from the breaks in the
and
curves in
Figure 5a. Three notable events can be identified that modify the pressure at the boundaries: the first occurs at approximately
μs and corresponds to the reflection of the incident shock wave at the left boundary; the second, around
μs, is associated with the ignition of the reactive mixture and the subsequent pressure increase from the reflecting boundary; finally, the third, around
μs, is linked to the reflection of the reactive expansion fan generated by the interaction between the reactive wave and the incident wave, as shown in
Figure 1.
Figure 5b shows that instabilities appear at the beginning of the simulation and the reflection process. These instabilities are analogous to those presented in
Figure 4b, as they arise from the same numerical mechanism previously discussed in the context of the mass conservation equation.
Note that, although the effect of chemistry manifests itself as larger amplitude oscillations in the numerical error, these remain limited. There are no visible discontinuities in the zone of chemical activity that would allow them to be correlated with the chemical breakpoints mentioned above.
The numerical error associated with the momentum balance, similarly to that of the mass balance, reflects the accumulation of discrepancies introduced during the spatial discretization, time integration, and post-processing stages. Nevertheless, its magnitude remains limited, with a maximum deviation of relative to its initial value. This confirms the proper conservation of momentum and indicates that the contributions of the implemented methodology to this residual do not compromise the overall accuracy of the balance.
3.5. Energy
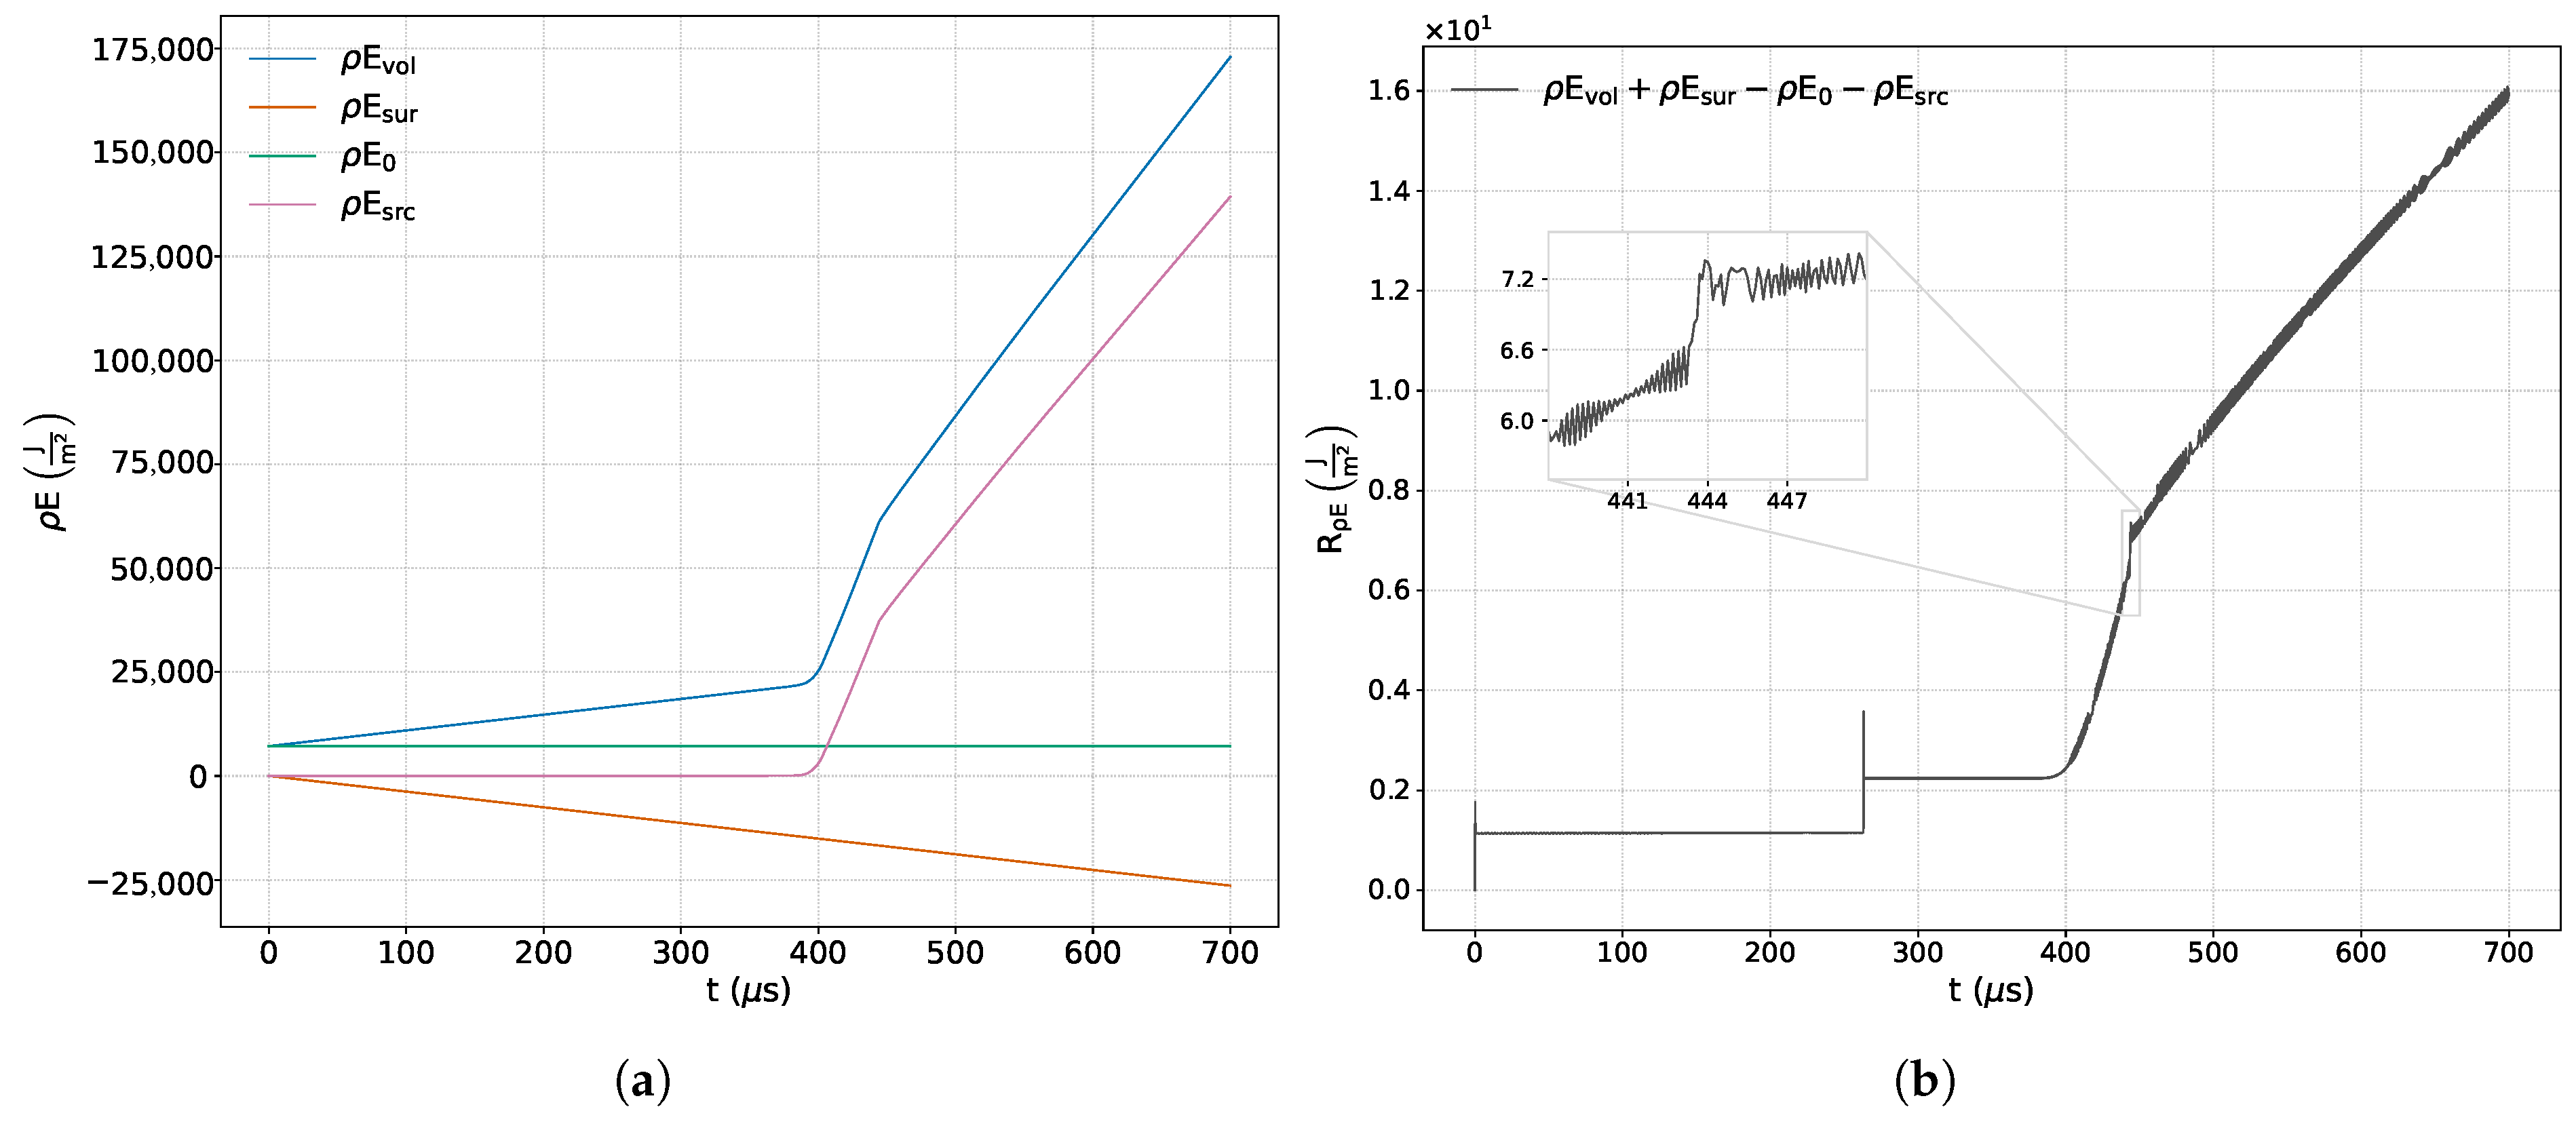
Figure 6a,b illustrate the time evolution of the terms involved in the integral balance of the energy conservation principle, as well as the sum of these terms, together with a zoom-in showing the variation in the numerical error in the time interval in which the detonation wave is generated.
In
Figure 6a, we observe that the net energy input through the boundaries of the control volume occurs at a constant rate throughout the simulation. This behavior contrasts with that observed in the momentum balance, indicating that there are no surface mechanisms modifying energy conservation other than a net input at a constant rate. This occurs because the source term in this equation does not take the form of a gradient of a scalar field or the divergence of a vector field; rather, it only reflects internal events within the control volume. The figure also highlights two distinct events: the first, occurring around
μs, corresponds to the ignition of the fuel mixture near the reflecting wall; the second, noted around
μs, is associated with the formation of the detonation wave, which results from the interaction between the reaction wave and the reflected shock, as illustrated in
Figure 1.
Figure 6b shows that the numerical error in solving the energy equation presents instabilities at the initial moments of the simulation, during the reflection of the incident wave (for the same reason already discussed in relation to the conservation of mass), and at the stage of chemical evolution, characterized by oscillatory behavior of limited amplitude around a mean value. The figure also displays the significant influence of the chemical source term on this variable, which exhibits a maximum deviation of
from its initial value.
Chemical activity contributes to a progressive increase in numerical error, arising both from the decoupling and linearization of the chemical source term (via operator splitting), and from the increasing stiffness of the energy equation due to the rapid heat release during the reaction. As a result, chemical effects induce a sustained growth in the energy conservation residual, which imposes a limitation on the maximum simulation time in order to keep numerical errors within acceptable bounds. The maximum deviation observed reflects the combined influence of multiple error sources and, even under these conditions, remains within the expected relative range for the simulated time span. This confirms the correct conservation of energy and demonstrates that the implemented methodology does not significantly compromise the overall accuracy of the energy balance.
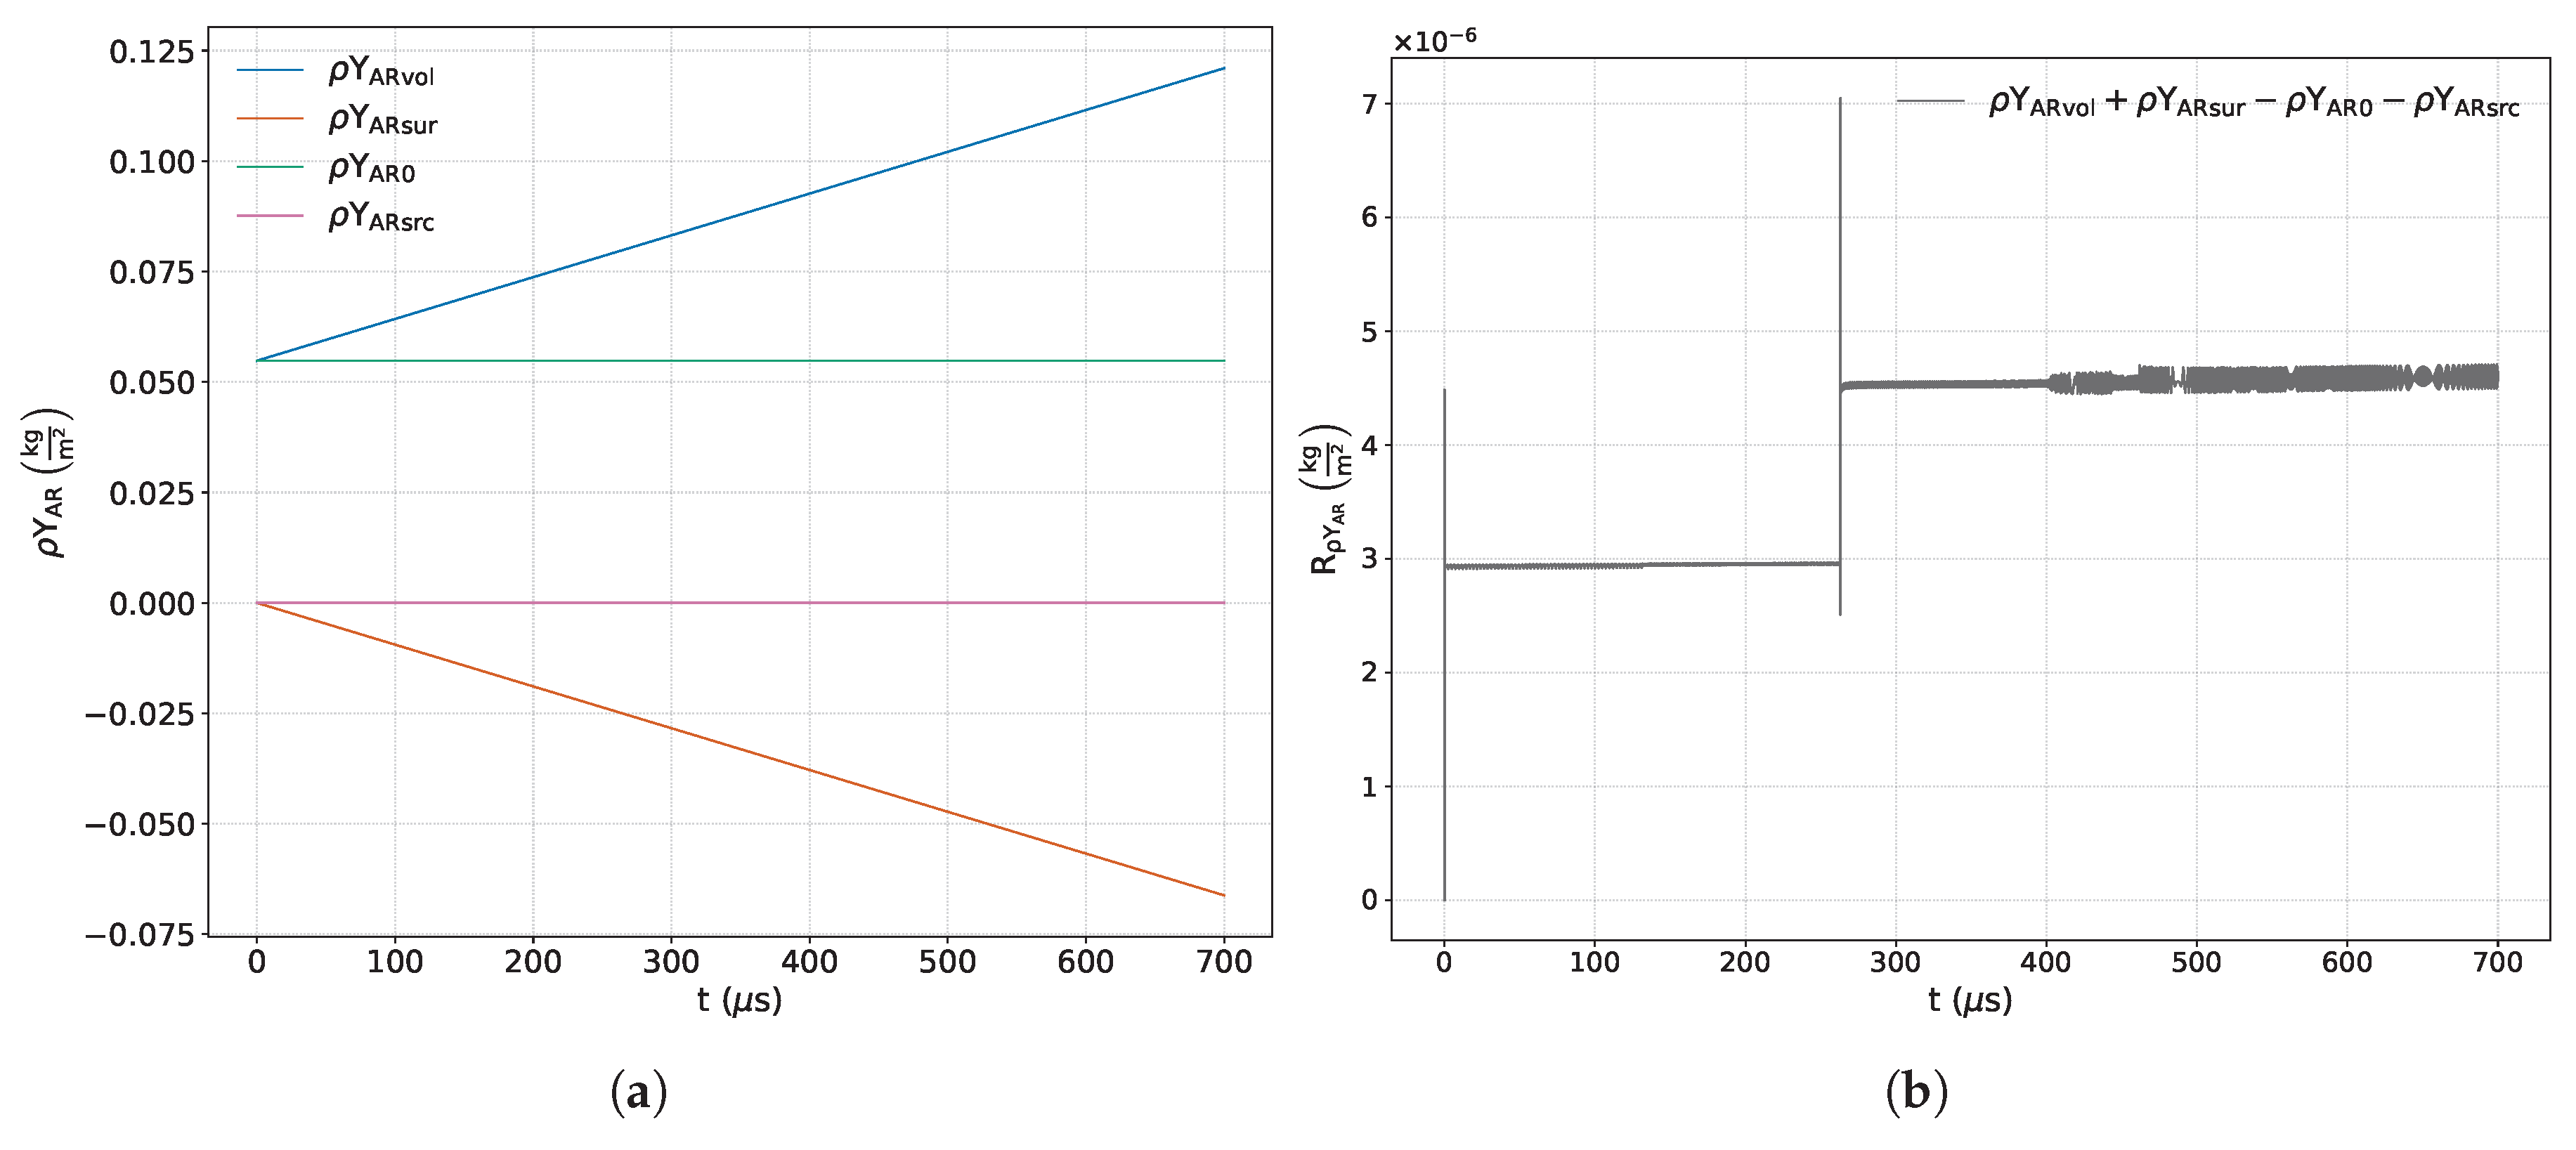
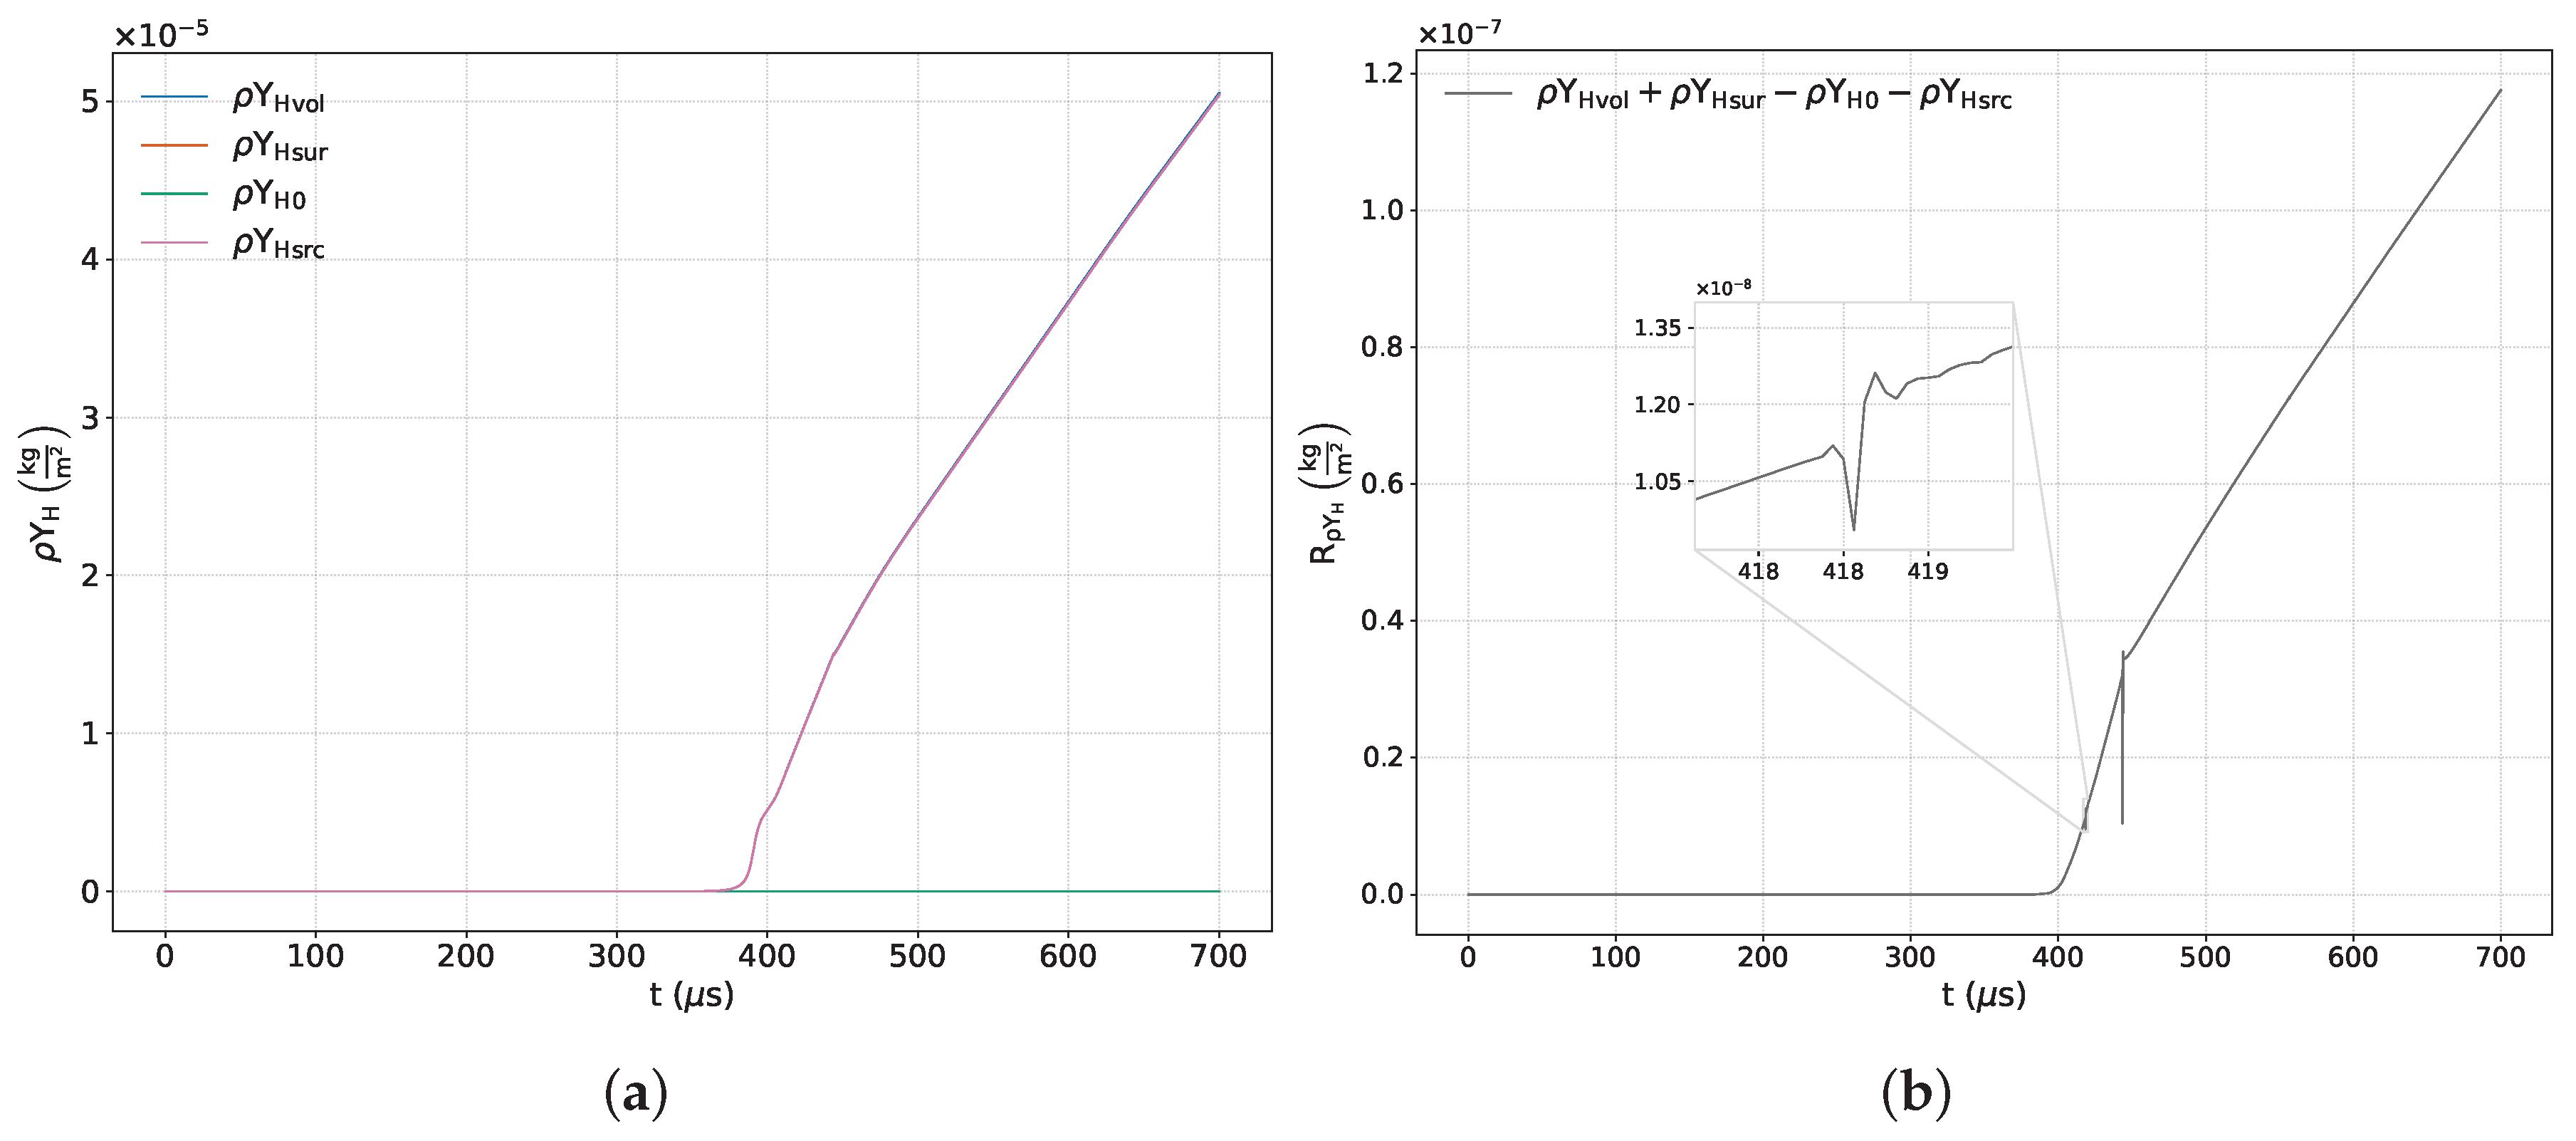
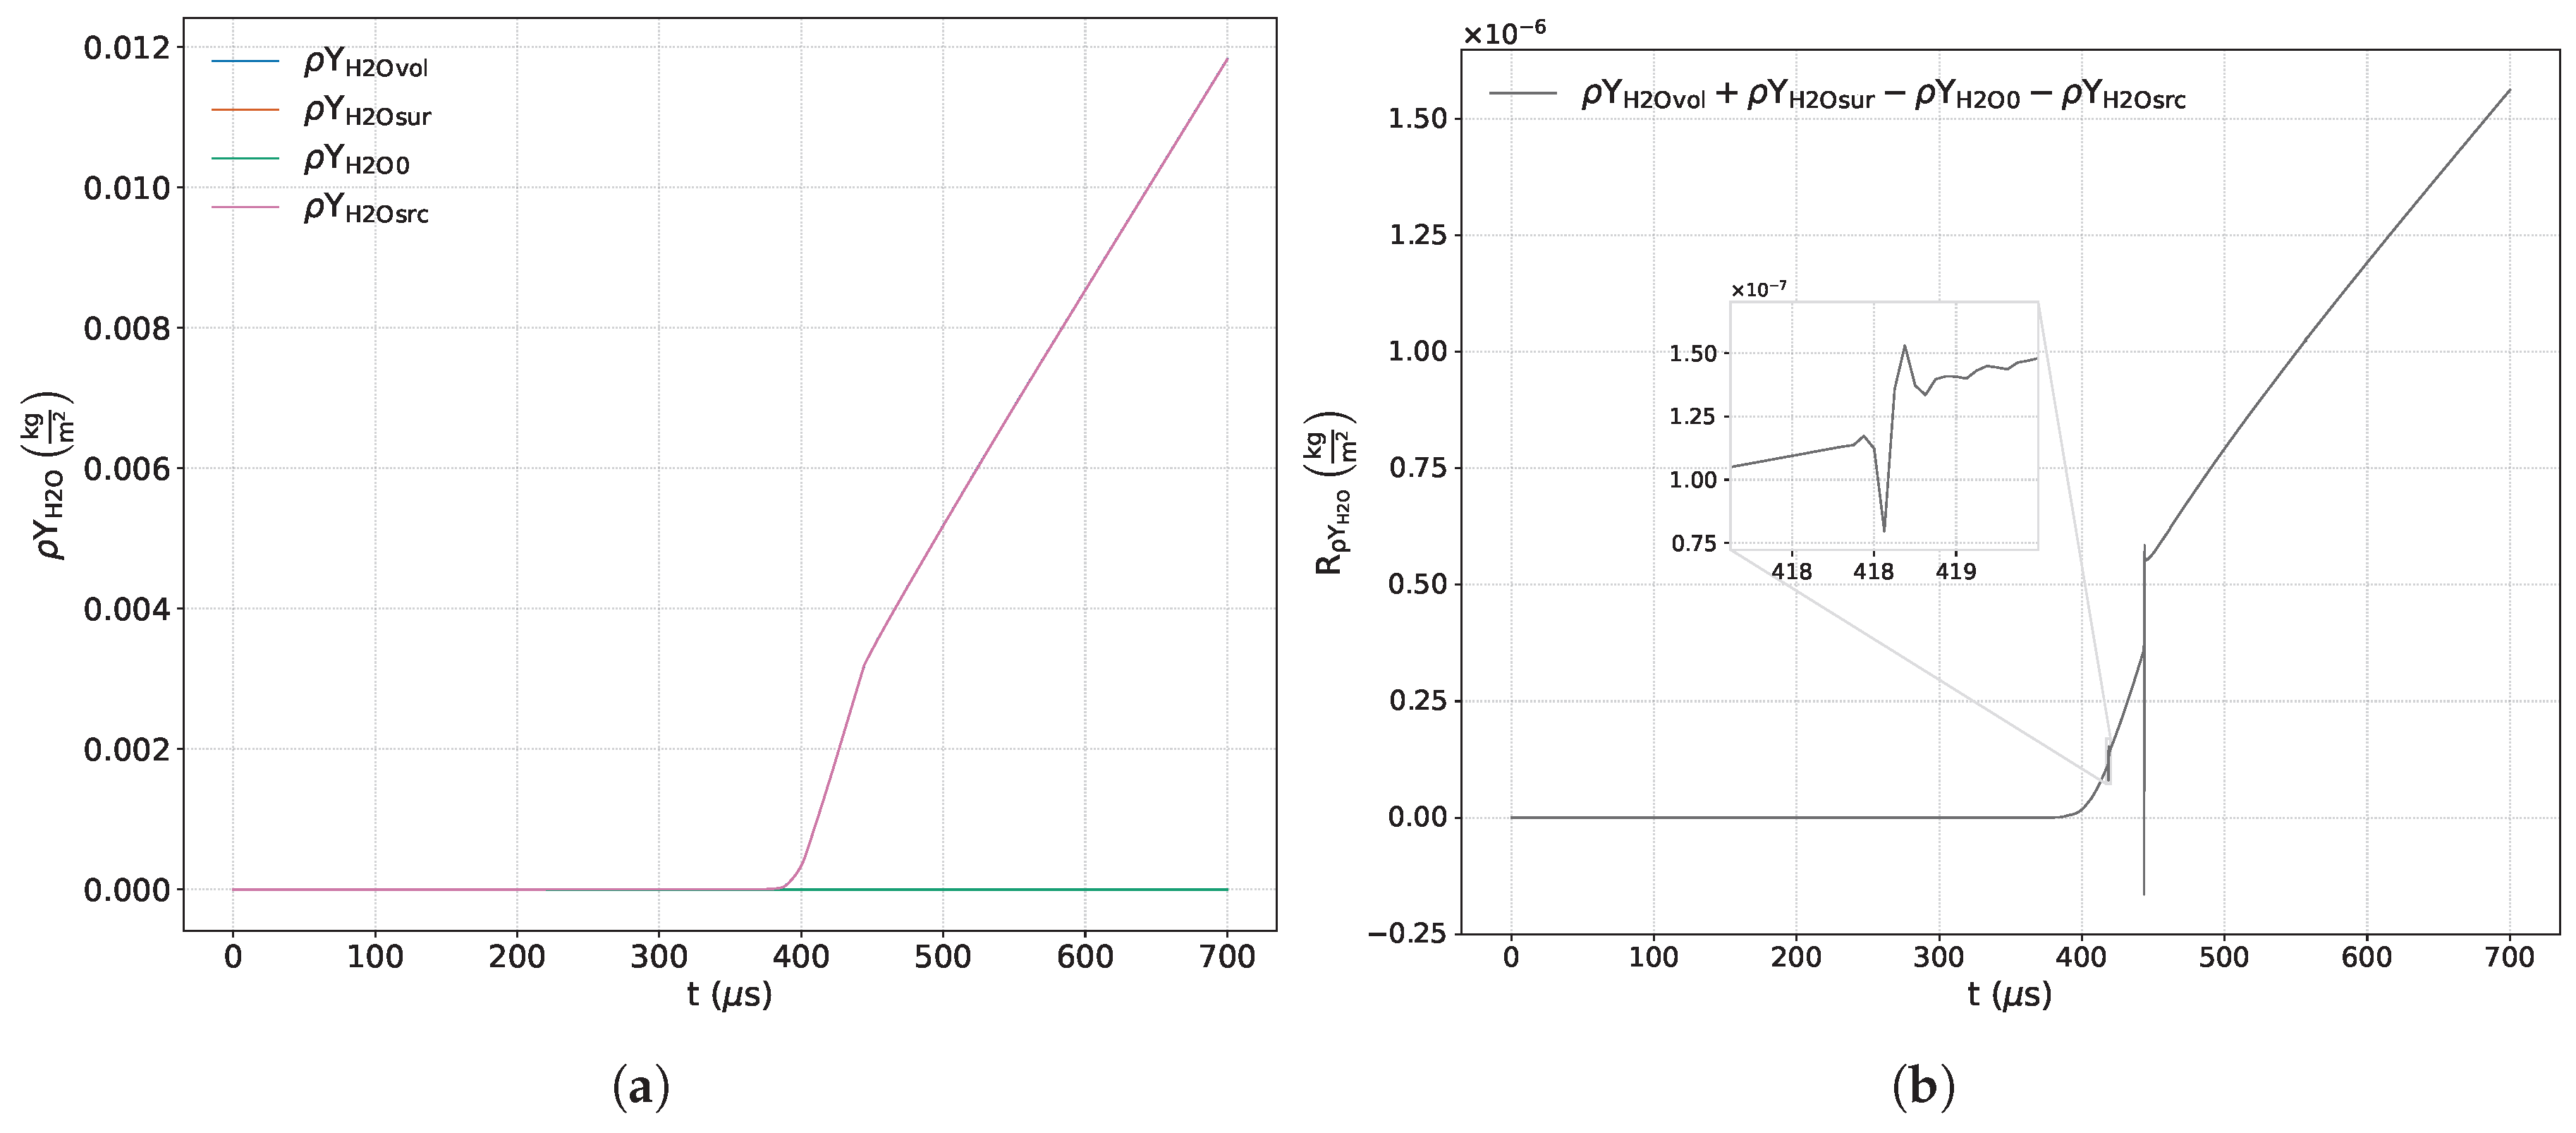
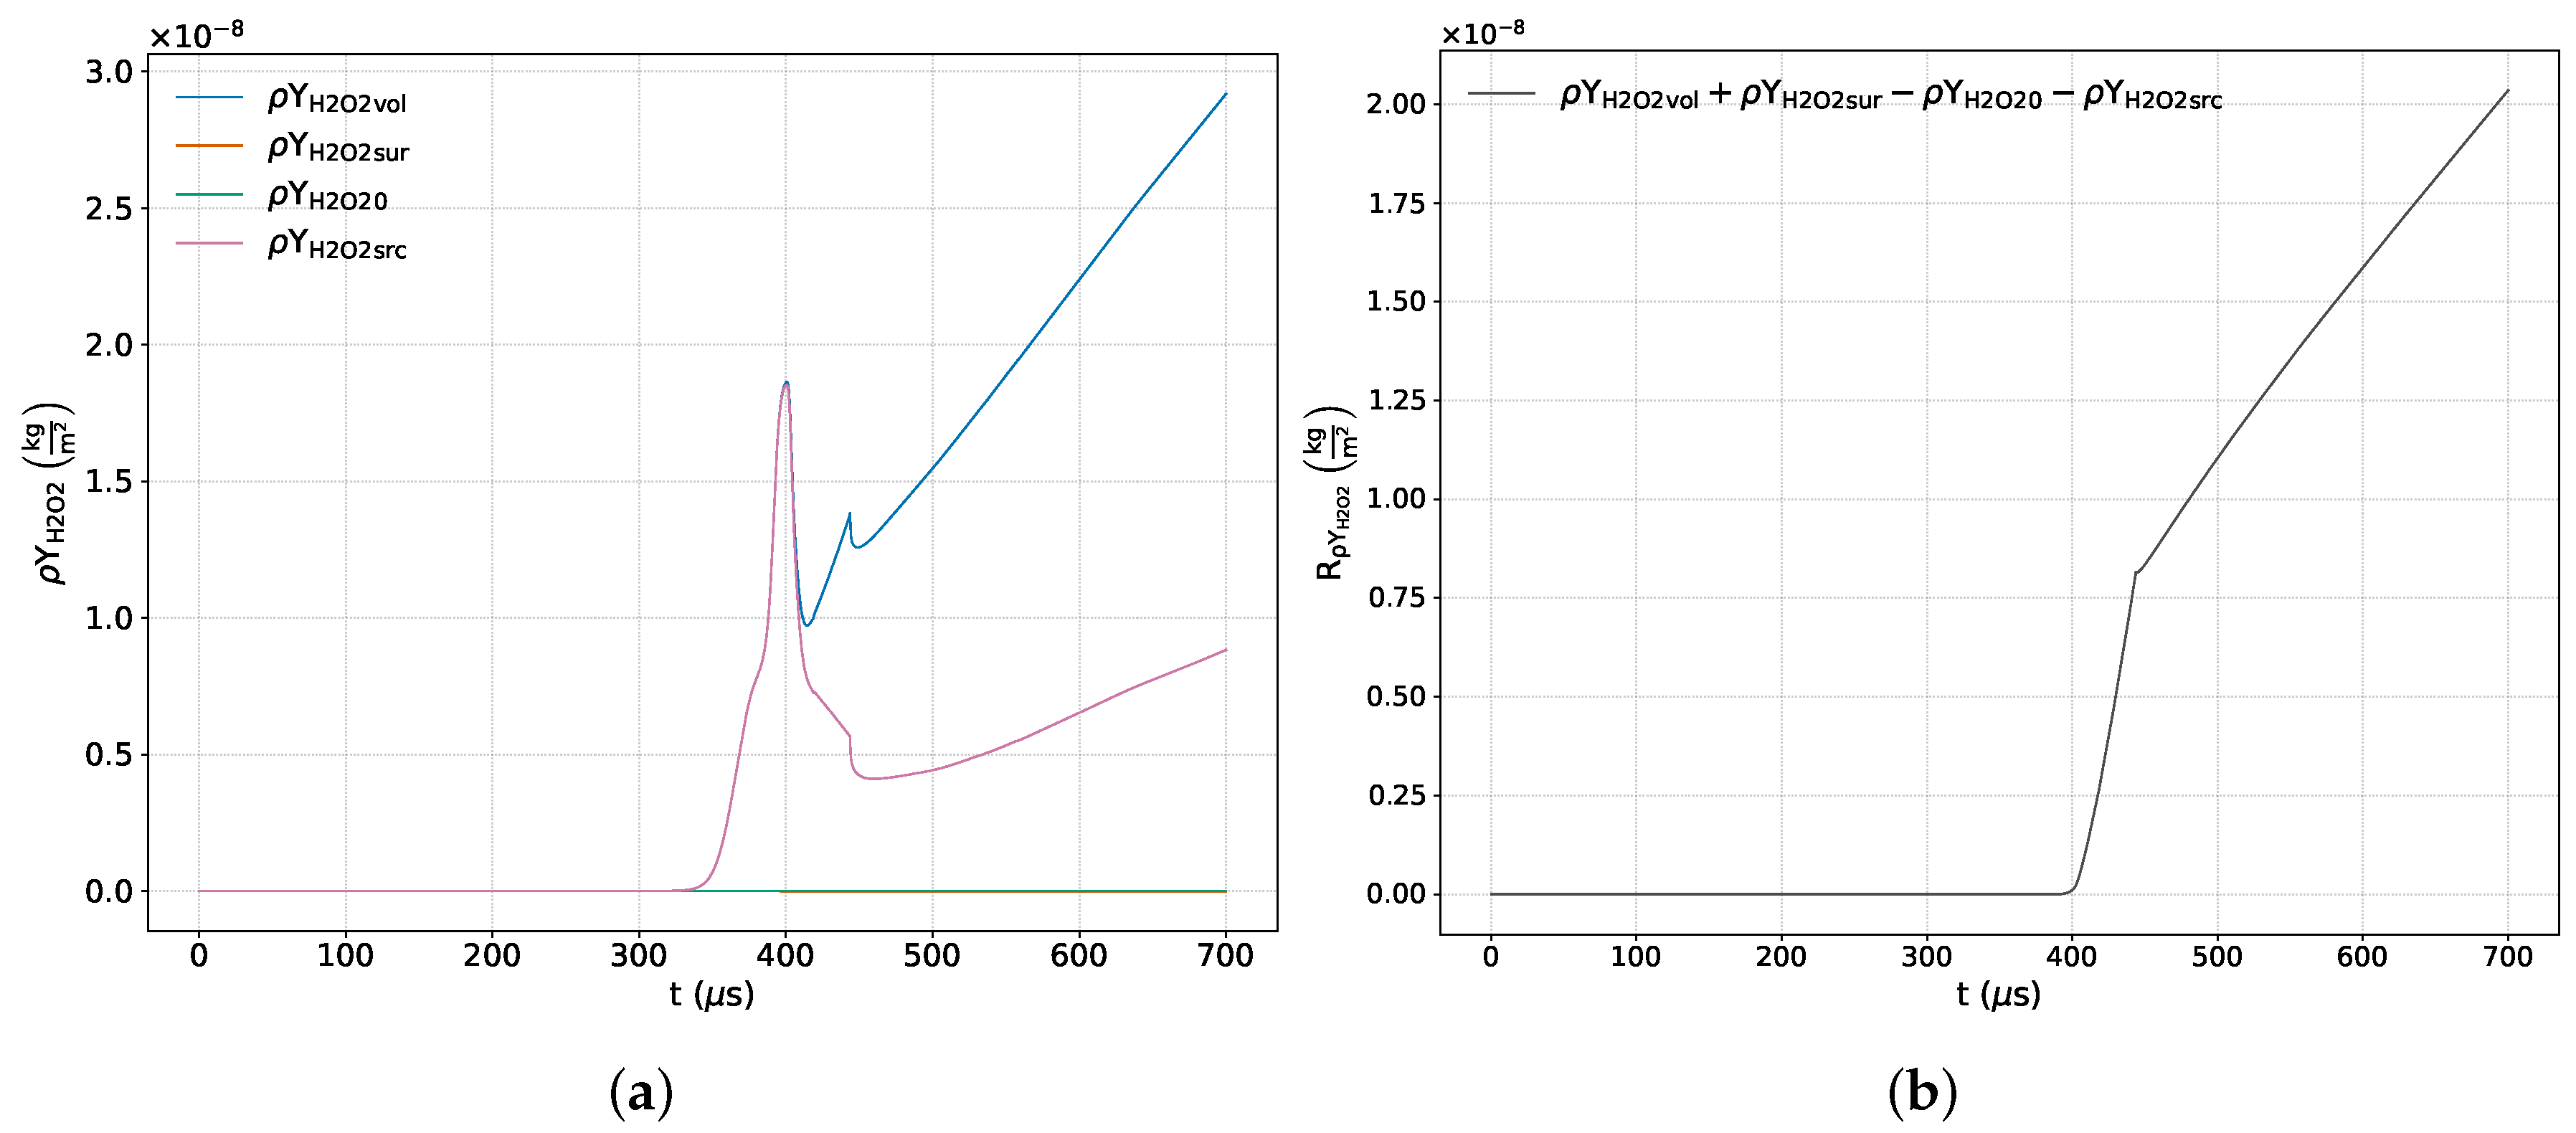
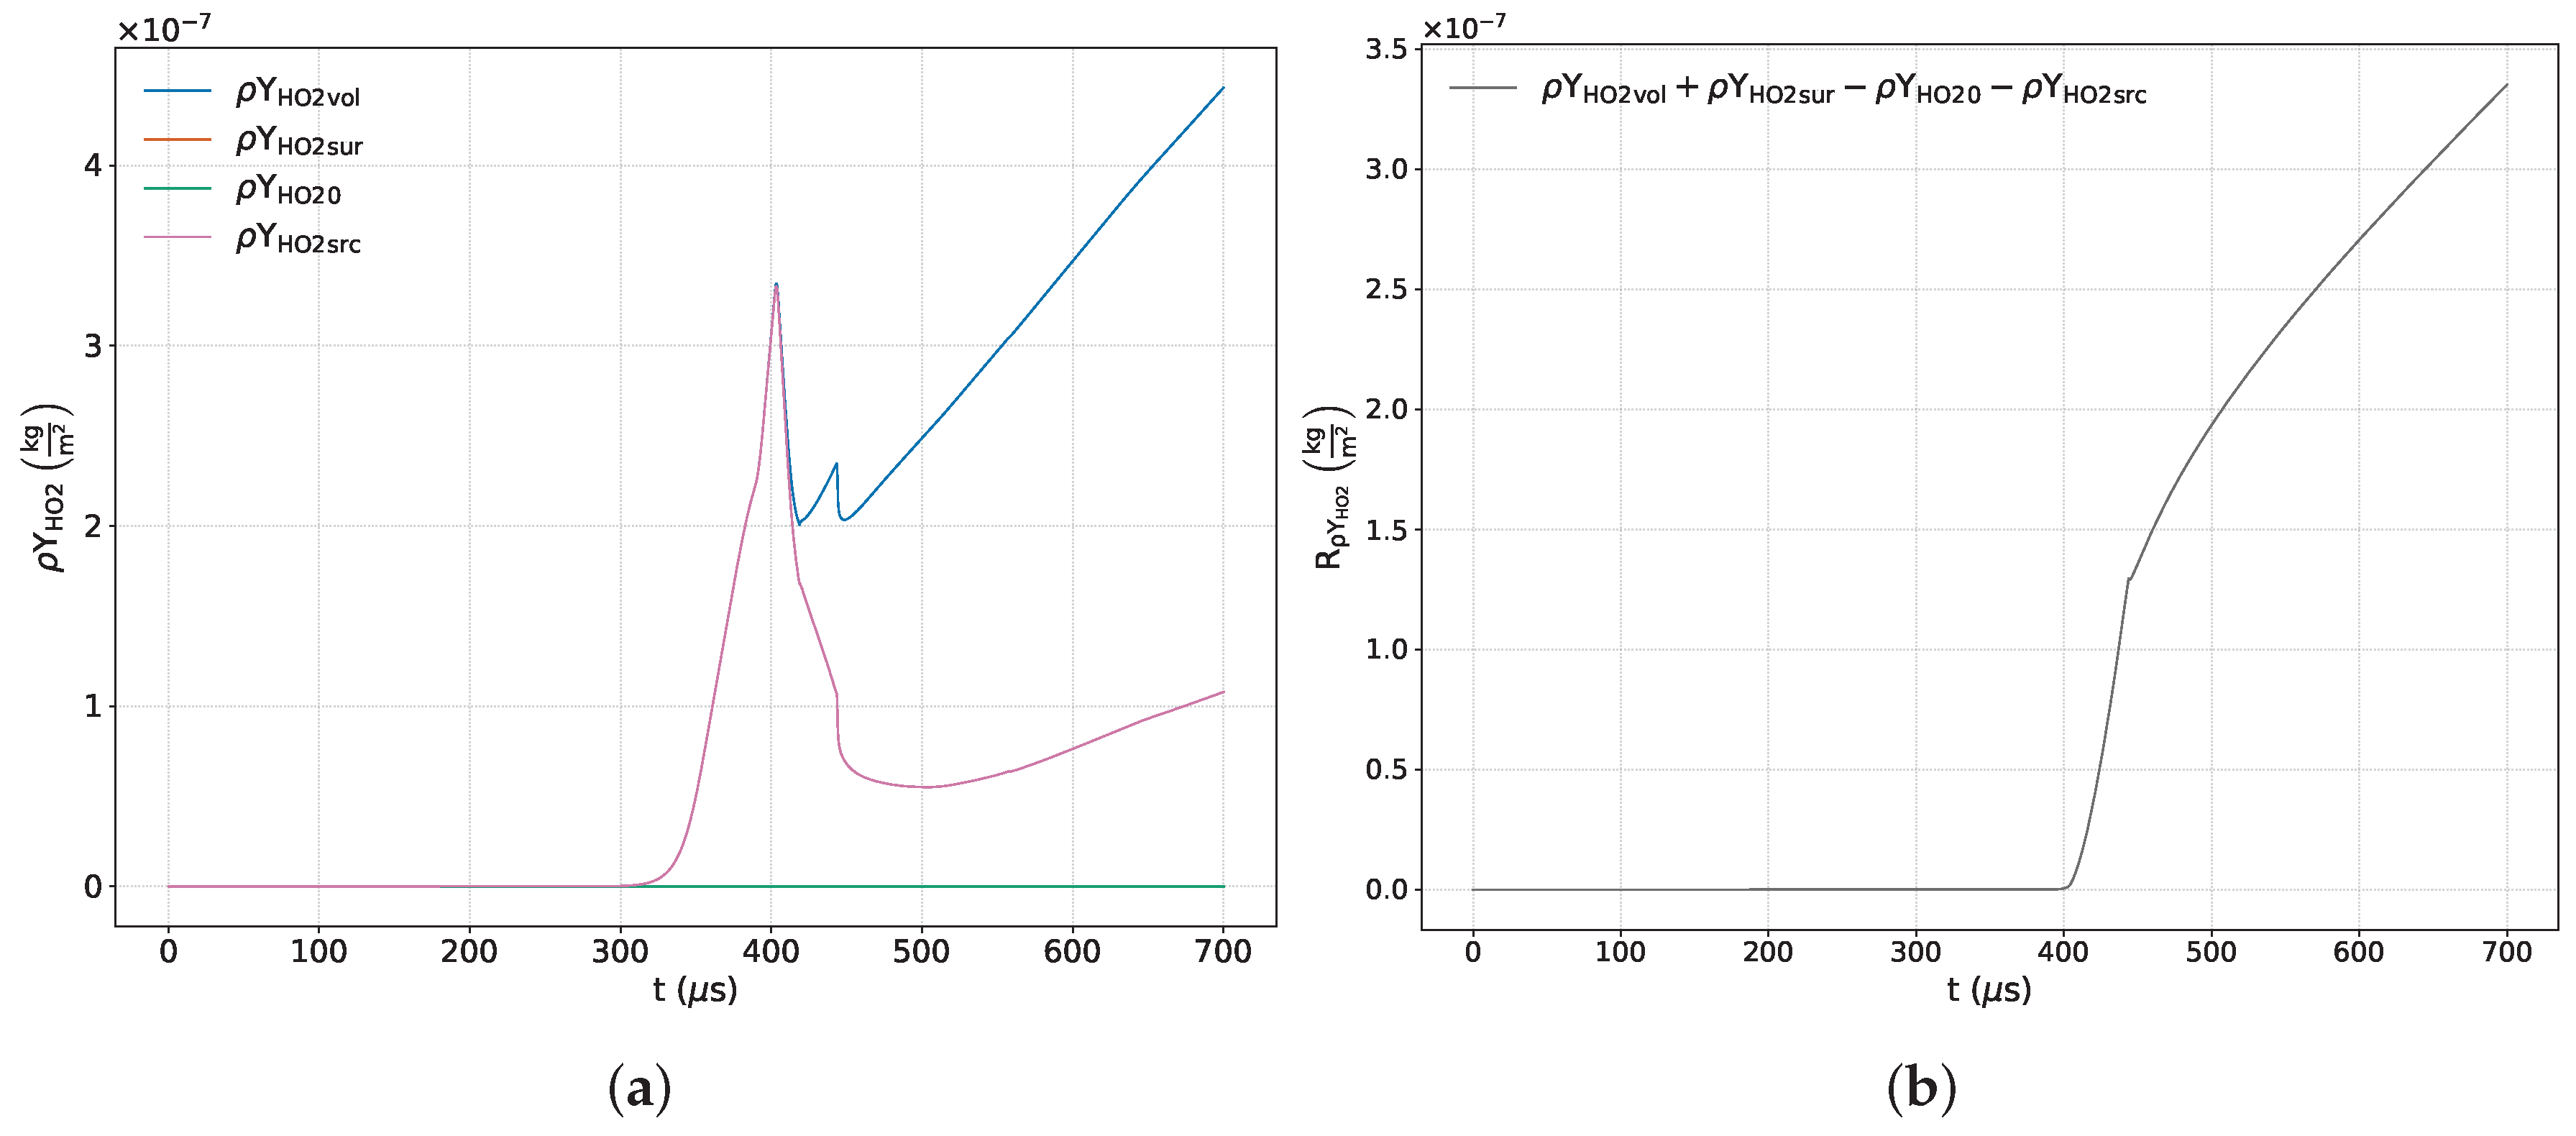
3.6. Species
Figure 7a,
Figure 8a,
Figure 9a,
Figure 10a,
Figure 11a,
Figure 12a,
Figure 13a,
Figure 14a and
Figure 15a show the time variations of each term included in the respective balance equation for the species
,
,
,
,
,
,
,
, and
.
Figure 7b,
Figure 8b,
Figure 9b,
Figure 10b,
Figure 11b,
Figure 12b,
Figure 13b,
Figure 14b and
Figure 15b exhibit the sum of the terms corresponding to each of the previous equations. Some of these images include a zoom-in of the curve that highlights areas of interest where there is a significant variation in numerical error.
From the analysis of the main reactive species (
and
,
Figure 7a and
Figure 8a), the coexistence of two mechanisms that actively modify the quantity of these species within the control volume is observed: on the one hand, the fluid-dynamic mechanism, represented by the net entry of fresh mixture through the boundaries; and on the other, the chemical mechanism, associated with the consumption of the reactants. Initially, the fluid-dynamic contribution dominates until, as the simulation progresses, the chemical mechanism becomes predominant. From the evolution of the volumetric term, we can estimate the instant at which both mechanisms are balanced. This can be obtained by searching for the maximum of the time variation or the instant in which the entry velocity from the edges equals the chemical consumption velocity. For both species, this instant occurs around
μs. From
Figure 7b and
Figure 8b, we can observe instabilities of the associated numerical error at the start of the simulation, the reflection process on the reflecting wall, (as highlighted previously in the analysis of the continuity principle), and the formation of the detonation wave. A smaller magnitude jump linked to a secondary interaction between the contact discontinuity and the reaction wave is also identified around
μs, as seen in
Figure 1. The numerical error, resulting from the combined effect of several numerical contributions, reaches maximum deviations of
for hydrogen and
for oxygen. In the time interval dominated by chemical activity, the temporal evolution of the residues of these species is characterized by limited oscillations around a mean value.
The inert species
exhibits a net growth within the volume due exclusively to transport from the edges, since the source term is zero, as observed in
Figure 9a. Its numerical error (
Figure 9b) shows instability at the outset of the numerical simulation and the reflection process (similar to the conservation of mass). Also, it is affected by chemistry, with an limited increase in the amplitude of oscillations in the zone of chemical activity. The maximum recorded deviation, encompassing the cumulative effect of various numerical sources, is
relative to the initial value.
The main product species,
,
,
, and
, as well as the secondary product species,
and
, change exclusively due to chemical action since both the net surface contribution as well as their initial mass concentration are identically zero (see
Figure 10a,
Figure 11a,
Figure 12a,
Figure 13a,
Figure 14a and
Figure 15a). The evolution of the numerical errors associated with the main product species shows sensitivity to the formation of the detonation wave (around
μs) and the interaction of the contact discontinuity with the reaction wave (around
μs), as shown in
Figure 1. In all cases, the numerical error increases over time (see
Figure 10b,
Figure 11b,
Figure 12b and
Figure 13b).
Finally, the minor product species
and
(
Figure 14a and
Figure 15a) adequately satisfy the conservation principle only up to approximately
μs, after which a loss of conservation is observed. This behavior is attributed to the fact that the conservation residuals for these variables—resulting from the combined influence of various numerical sources, including those related to the solver and post-processing—are of the same order of magnitude as the species’ concentrations. As demonstrated above, this residual is no longer bounded in the presence of chemical activity.
Figure 14b and
Figure 15b confirm that the errors associated with these species match the order of magnitude of their numerical fractions, inevitably leading to their loss of conservation.
For all reactive species with a non-zero source term within the chemical activity zone, a sustained increase or decrease in the respective conservation residual is observed. As noted above, this behavior is attributed to the decoupling and linearization of the source term implemented in the solver, as well as to the increasing stiffness of the governing equations as chemical activity progresses.
4. Conclusions
In this work, we present a simple methodology that allows the evaluation and quantification of the numerical error associated with solving a system of conservation laws, using only internal information from the simulation itself. The methodology was applied to the solver of high-speed chemically active flows rhoCentralRfFoam, obtaining, under pre-established configuration conditions, maximum relative errors of less than for the most sensitive thermomechanical variable (energy), and relative errors of less than for the most compromised chemical species in the reactive mixture (). It should be emphasized that the numerical error quantified using this methodology encompasses not only contributions inherent to spatial discretization and time integration but also an additional component arising from the post-processing procedure itself. Although the errors introduced during this stage have not been analyzed in detail, their impact was minimized through the use of high-order numerical integration schemes, a densely populated computational grid, and very small output time intervals. Consequently, the reported numerical error reflects the combined effect of the solver’s intrinsic numerical behavior and the uncertainties inherent to the evaluation methodology. Nonetheless, these uncertainties do not affect the identification of physical and numerical phenomena nor compromise the balance among the terms constituting the respective conservation laws. These results confirm the reliability of the proposed methodology and validate the correct functioning of the solver under the reference conditions, providing a preliminary quantitative indicator of simulation quality based solely on the available results.
Regarding the product species, we observed that the main species, defined as those whose proportion is comparable to that of the reactive species, adequately verify their respective conservation principles. On the other hand, the secondary product species ( and ), characterized by being present in much smaller quantities compared to the fractions of the reactive species, show imbalances in the fulfillment of their balance equations once the chemical process has begun. We attribute this anomalous behavior to the fact that the mass fractions with which these species participate in the description of the flow are of the same order of magnitude as the numerical errors introduced by the solver when the chemical mechanisms are activated.
The proposed methodology also allows us to observe that all conservation principles involving an explicit non-zero source term exhibit a numerical error that grows monotonically from the onset of chemical activity. This behavior represents a significant limitation on the achievable simulation time, as it restricts the use of the solver to a time interval within which the accumulated error remains below an acceptable threshold. This process is directly related to the explicit scheme employed by the solver for each of these equations, as well as to the decoupling and linearization of the chemical source term. As chemical processes begin to develop, the source term that models the chemical influence on the flow becomes progressively more rigid compared to the convective term. It generates stability problems and reduces the conservation property in the equations. This occurs because the default time integrator is unable to handle the rigidity of the chemical term adequately.
