An Exponentiated Inverse Exponential Distribution Properties and Applications
Abstract
1. Introduction
2. Derivation, Discussion, and Statistical Properties
2.1. Shapes
2.2. A Comparison of Inverse Distributions
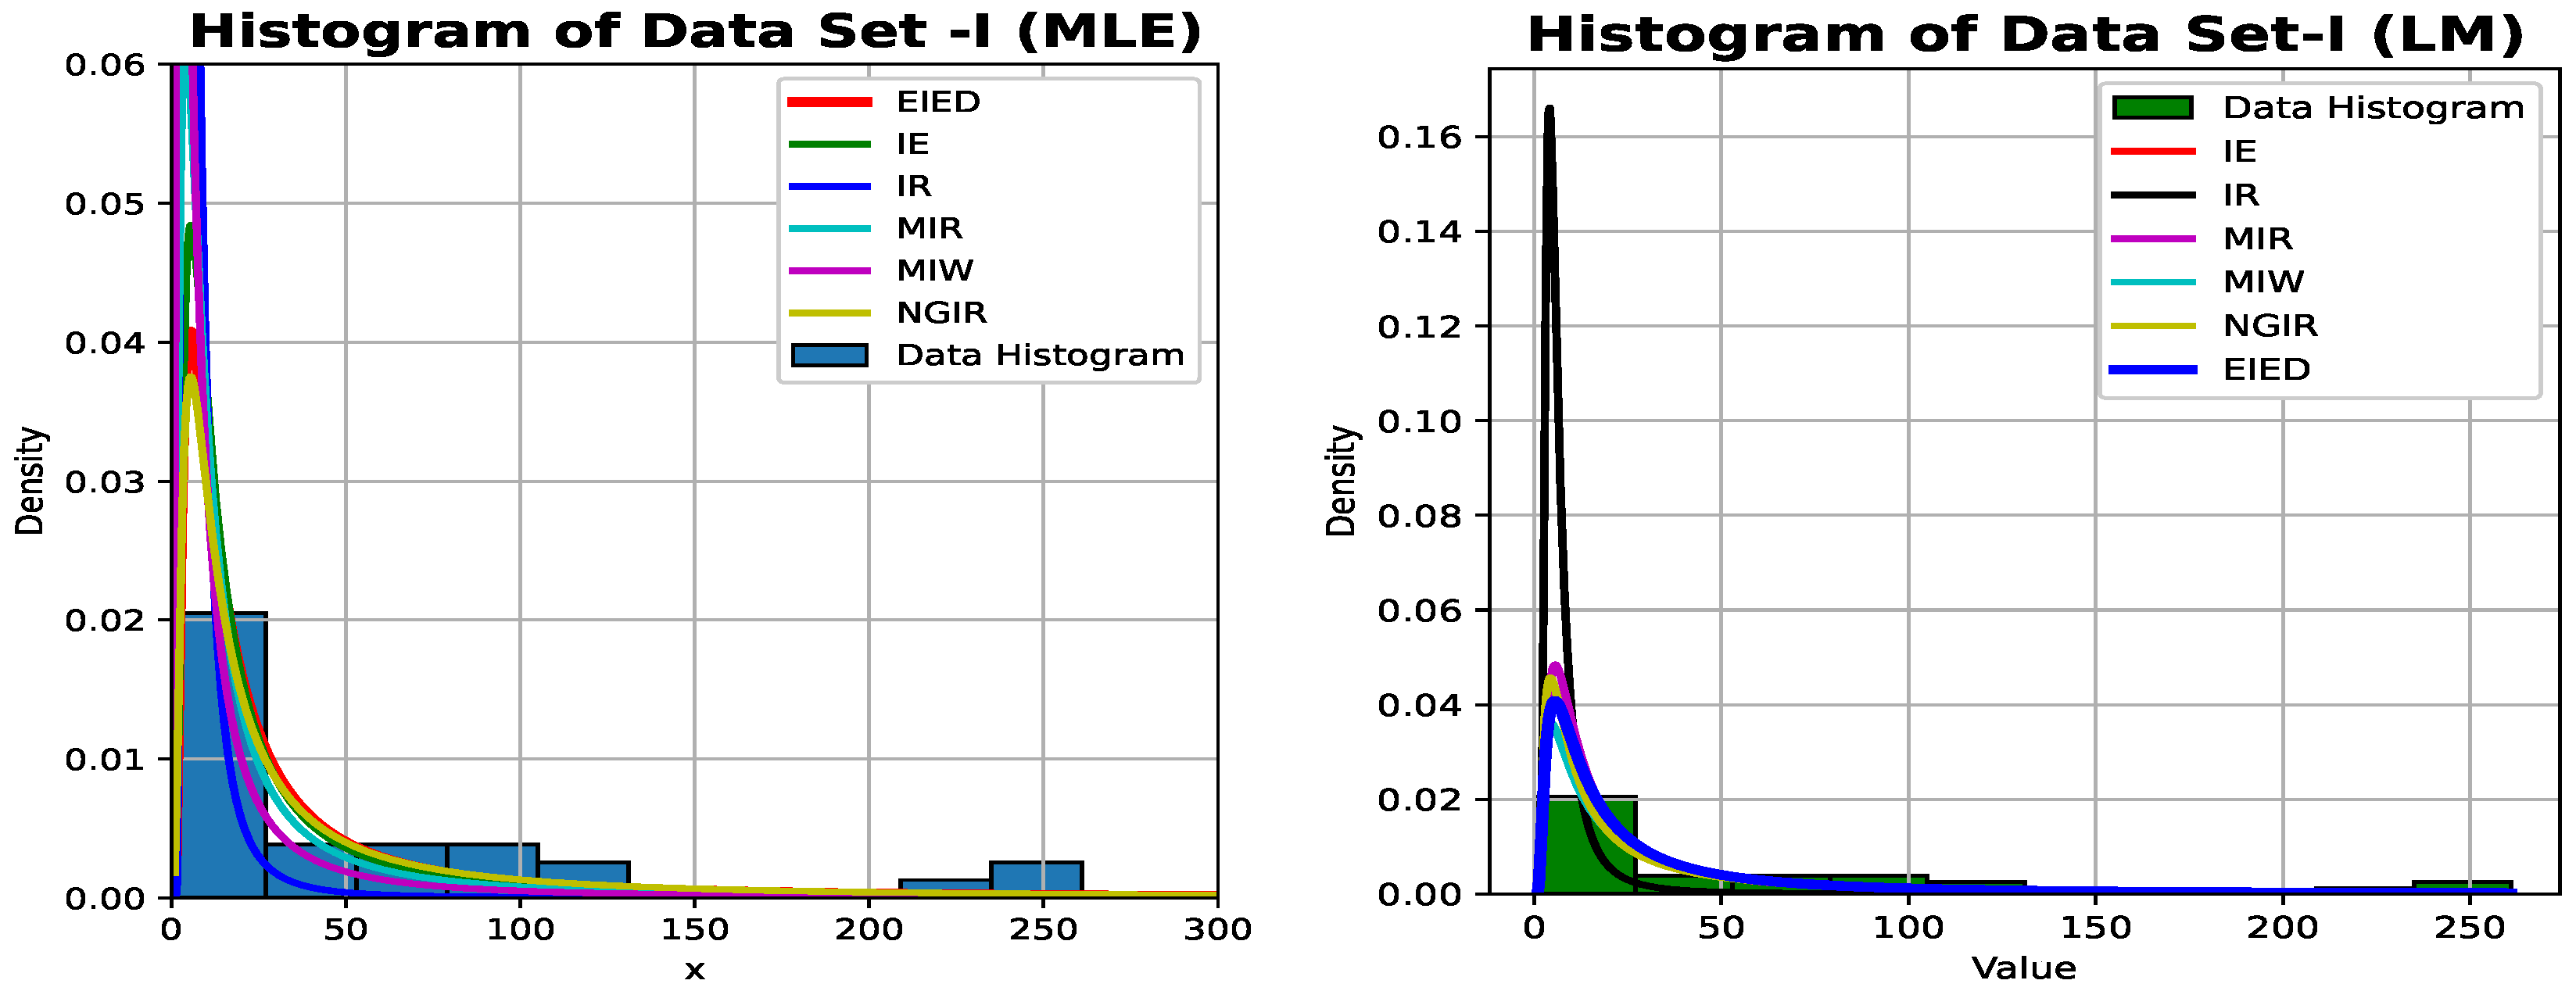
- The IE distribution is characterized by a rapid rise from the origin to a single, sharp peak, followed by a gradual, polynomial decay. The term dominates for a larger x, dictating the rate of decay. The scale parameter controls the location of the peak; a larger shifts the peak to the right.
- The IR distribution has a very sharp peak close to the origin, even more pronounced than the IE. Its decay is governed by . The cubic term and the exponential term cause it to vanish much faster than the IE as x increases.
- MIR is the exponentiated version of the IR distribution, with adding flexibility to the shape of the IR. When , it reduces to the standard IR. For , the peak shifts rightward, flattening and widening, which models data less concentrated near zero than the IR. For , the peak’s height and sharpness increase, making the distribution more concentrated near the origin.
- MIW offers high flexibility due to its additional shape parameter , which influences the core Weibull shape independent of . The polynomial decay rate is determined by , while the exponential term can significantly alter the tail behavior depending on . The parameter provides further flexibility on top of this base shape.
- The key innovation of NGIR is its additive structure in the exponent: . This form allows it to blend characteristics of the IE and IR families seamlessly. The parameter acts as an exponentiation parameter, adding flexibility around this new baseline. The distribution can mimic IE (by setting ), MIR (by setting ), or any hybrid thereof, resulting in a highly versatile range of shapes.
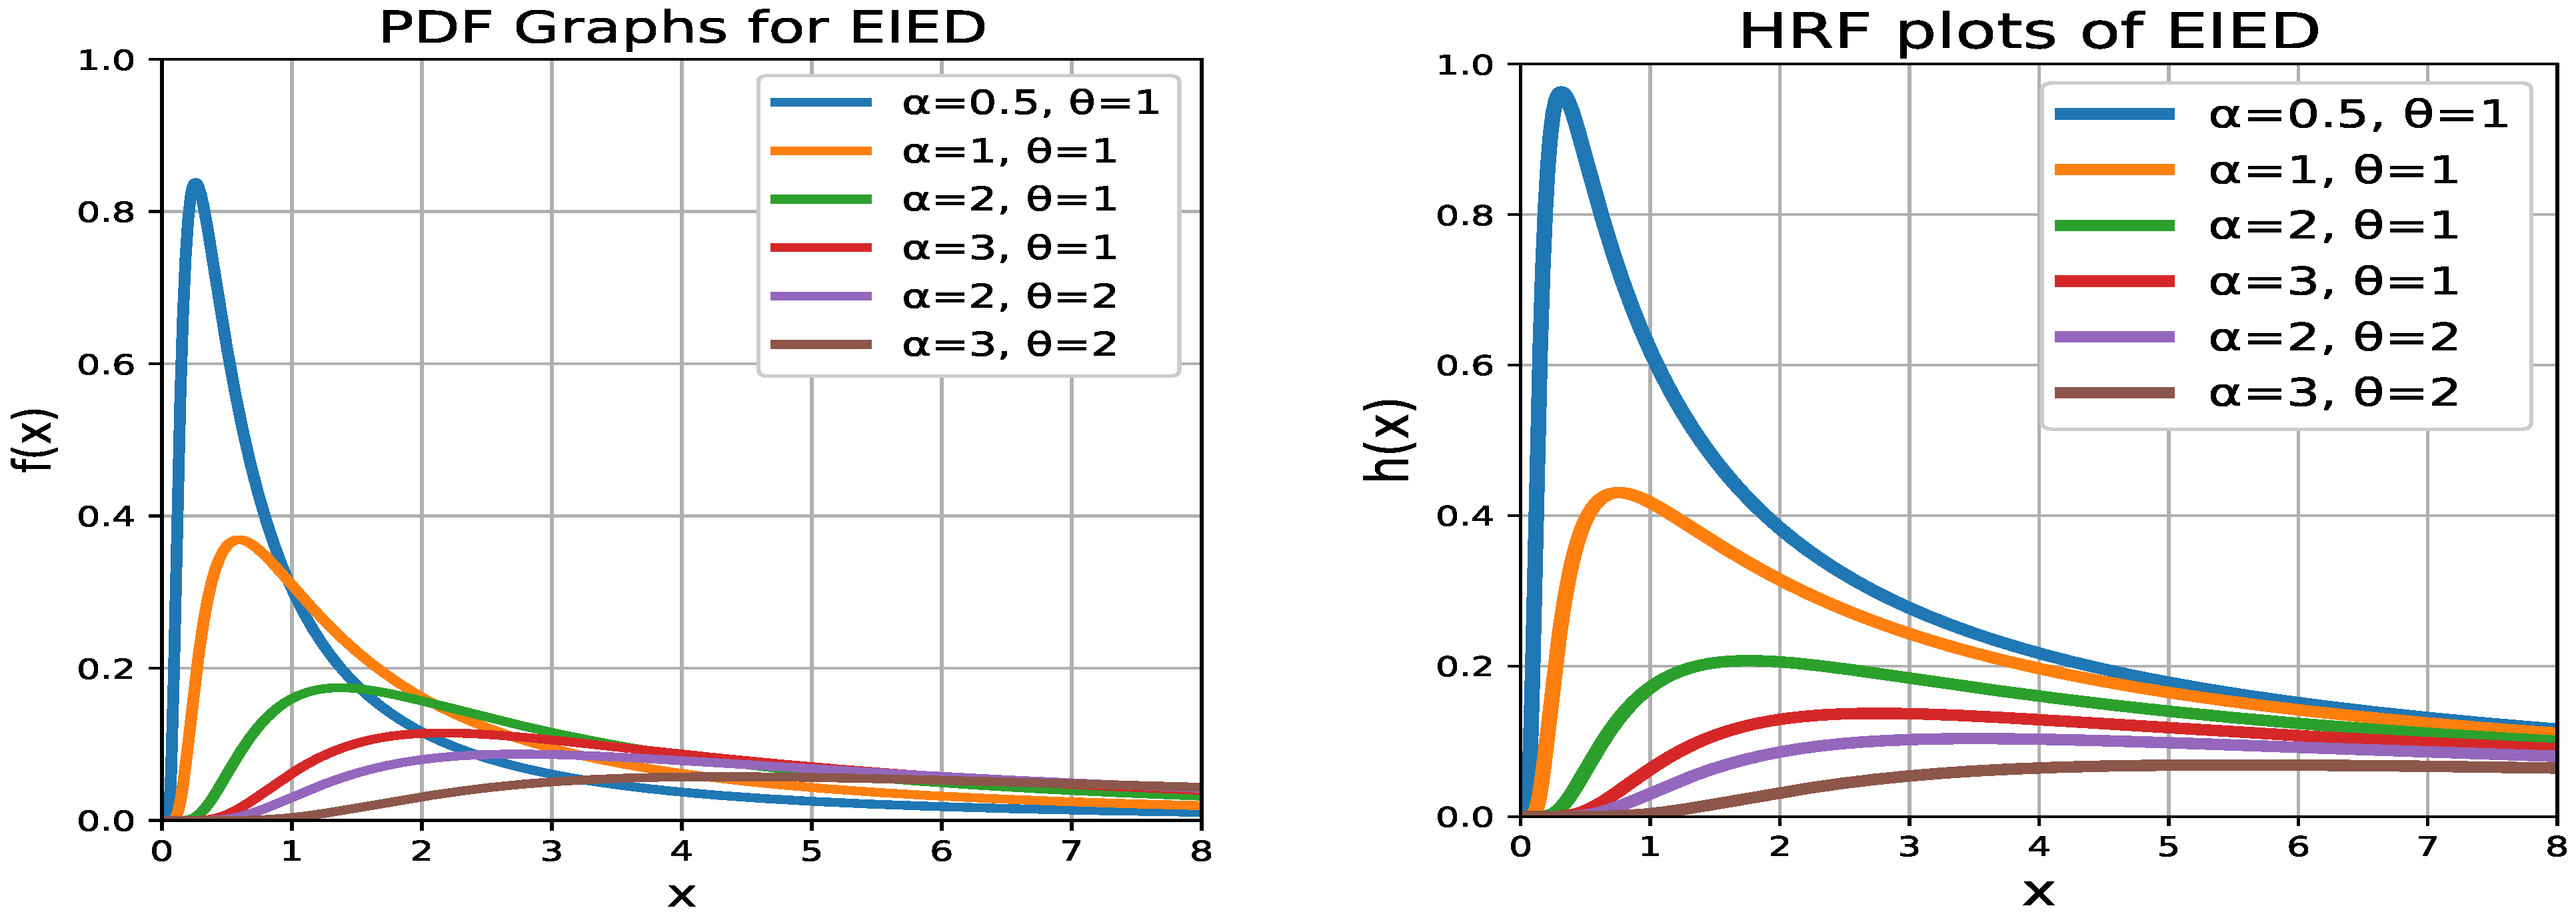
- EIED is a flexible extension of IE. The new shape parameter “stretches” the baseline IE distribution. When , it reduces to the standard IE. For , the PDF shifts to the right, with the peak becoming lower and wider, allocating more probability mass to a larger x. Conversely, when , the PDF becomes more concentrated near zero, producing a higher, sharper peak.
2.2.1. Common Characteristics of Inverse Distributions
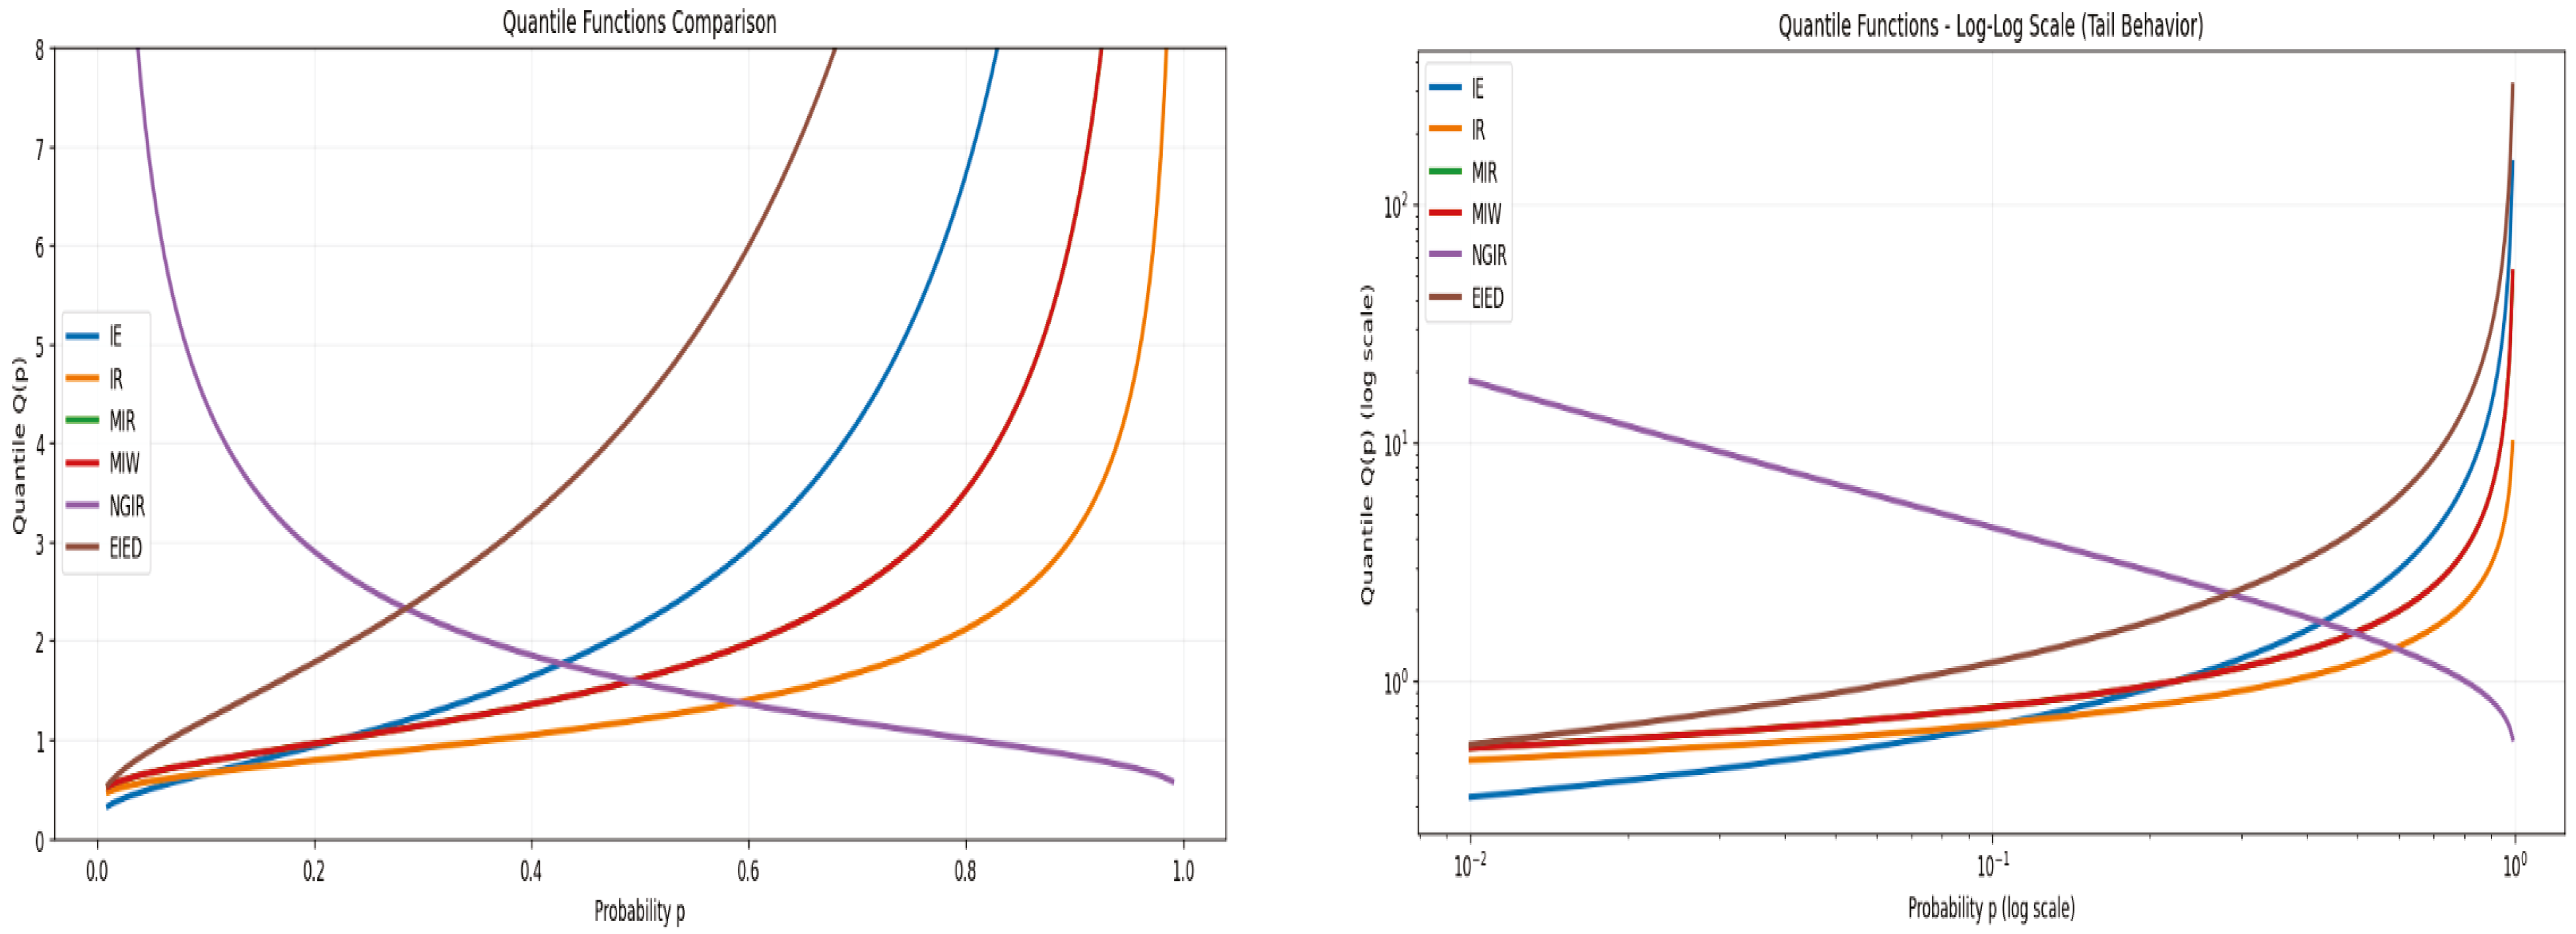
- Tail behavior of inverse distributions: However, not all inverse distributions have tails of equal heaviness. The “weight” of the tail is determined by the rate of polynomial decay: distributions such as IE, EIED, and NGIR exhibit the heaviest tails, as their survival functions decay at the slowest rate, with . Lighter yet still heavy tails are observed in the IR and MIR distributions, where the survival function decays as . Consequently, an extreme value is less likely to be observed from an IR distribution than from an IE distribution with a comparable scale.
- Tail weight hierarchy: The MIW distribution is unique in allowing the tail weight to be tuned via its shape parameter . Depending on , its tail can be heavier than IR (), similar to IR (), or lighter () while still belonging to the heavy-tailed family. For example, when , the survival function behaves as , making its tail lighter than that of IR but still heavier than any exponential-tailed distribution. So, the hierarchy of tail weight among these heavy-tailed models generally follows IE, EIED, NGIR > MIW with IR, MIR > MIW with .
2.2.2. Comparison and Conclusions
2.3. Identifiability of EIED
2.4. Quantile Function
2.5. Mean Deviation
2.6. Information Generating Function
2.7. Conditional Moments
2.8. Lorenz Curves
2.9. Entropy
3. Characterization
Laplace and Mellin Transformation
4. Parameter Estimation Methods
4.1. Maximum Likelihood Estimation
4.2. Simulation Study
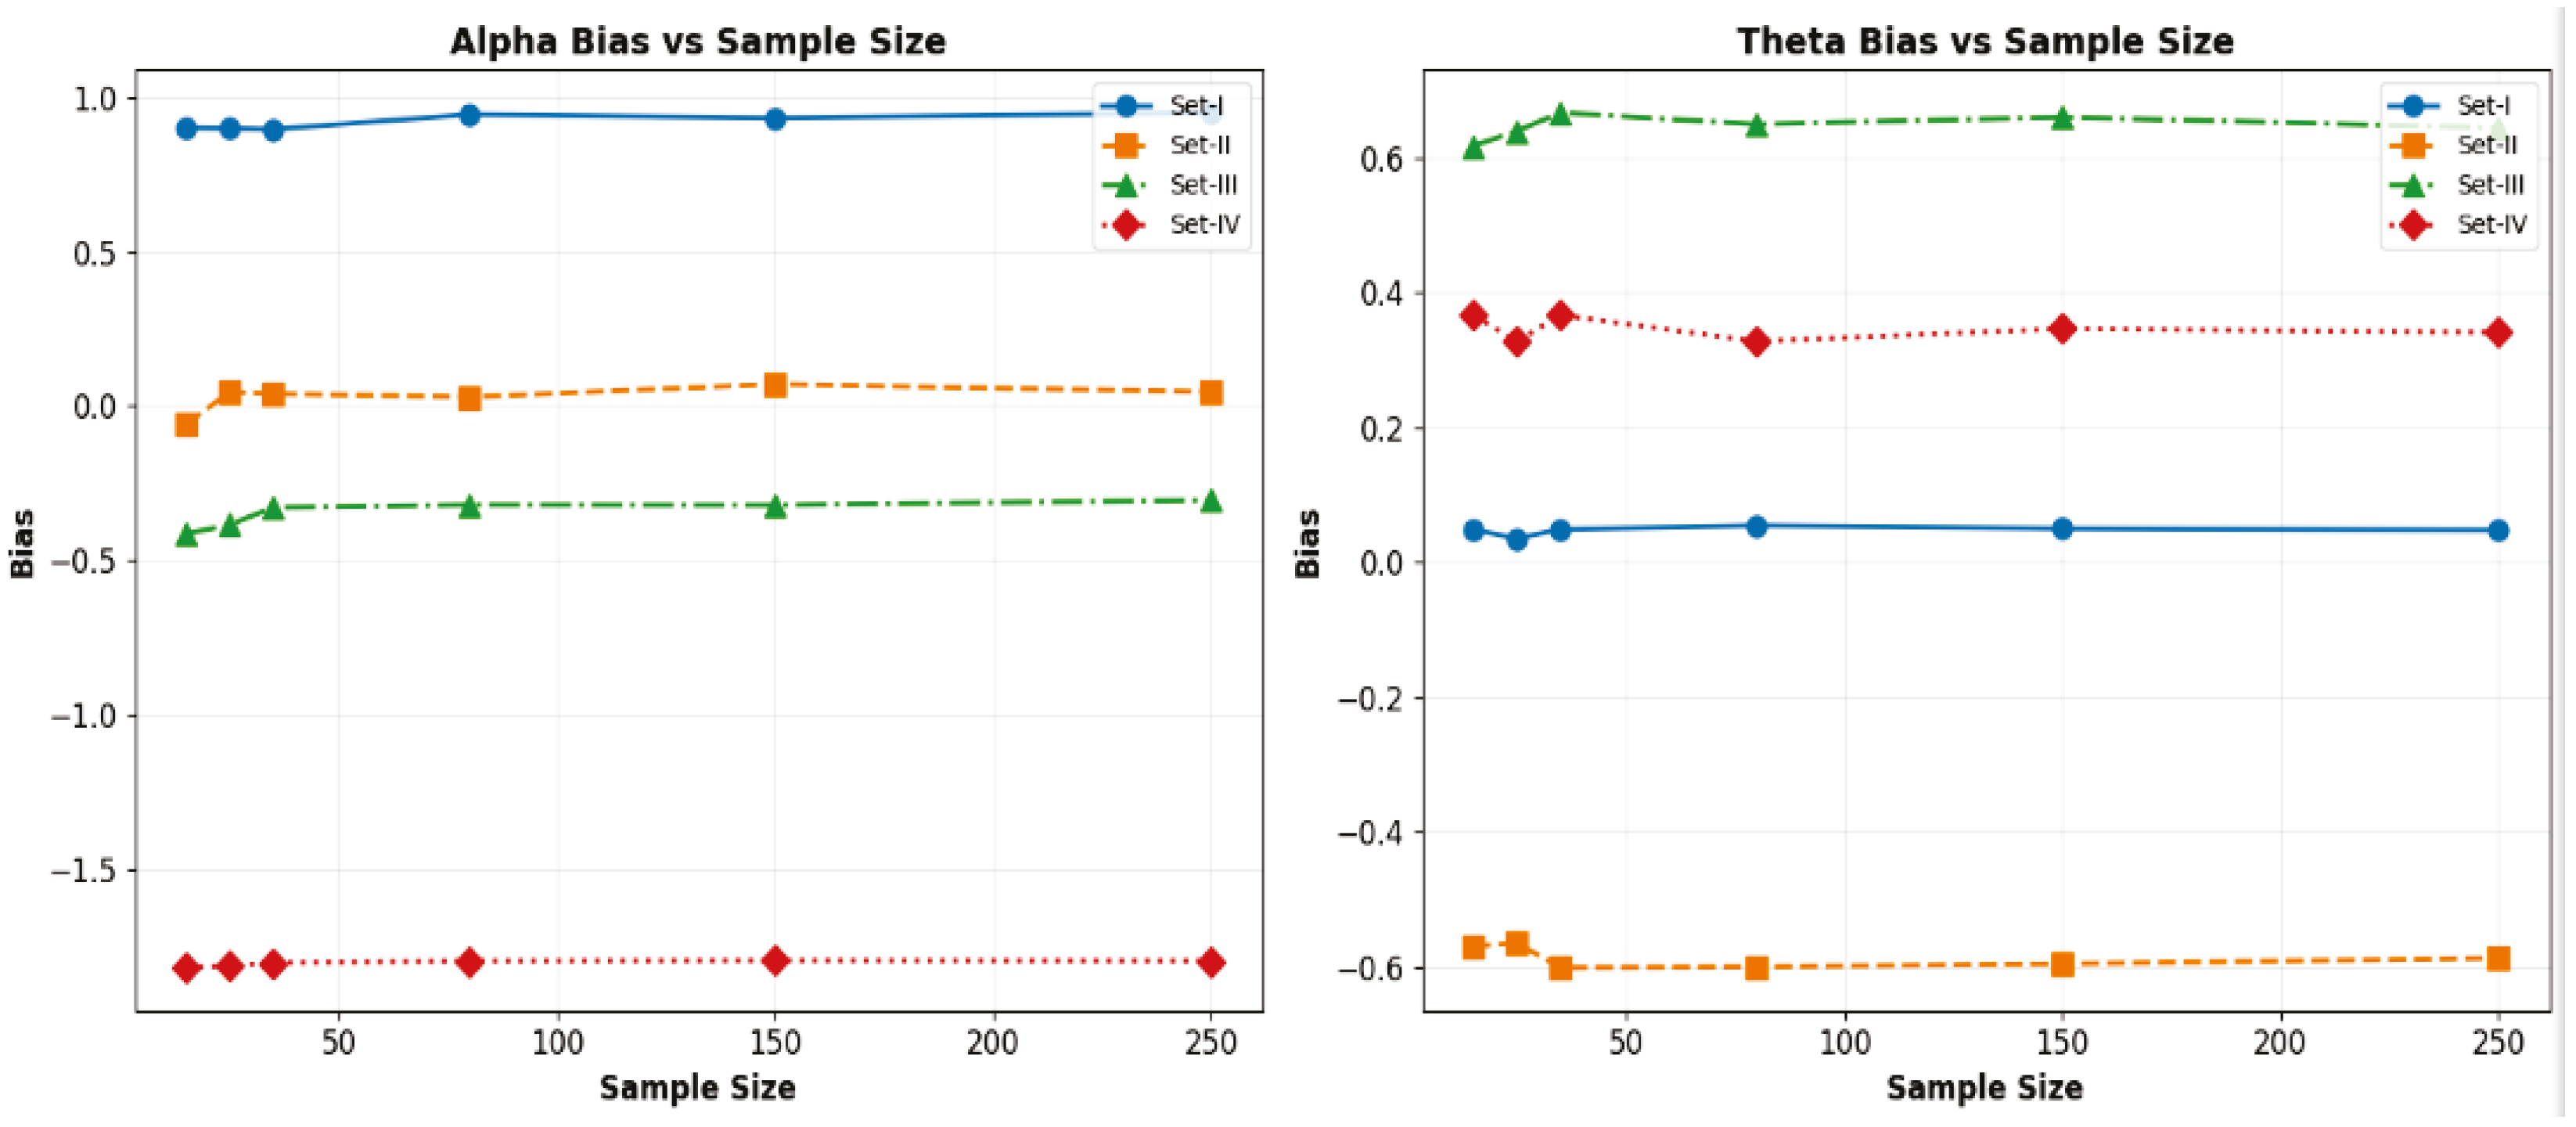
- Average bias of the simulated estimates:where are the MLEs of EIED.
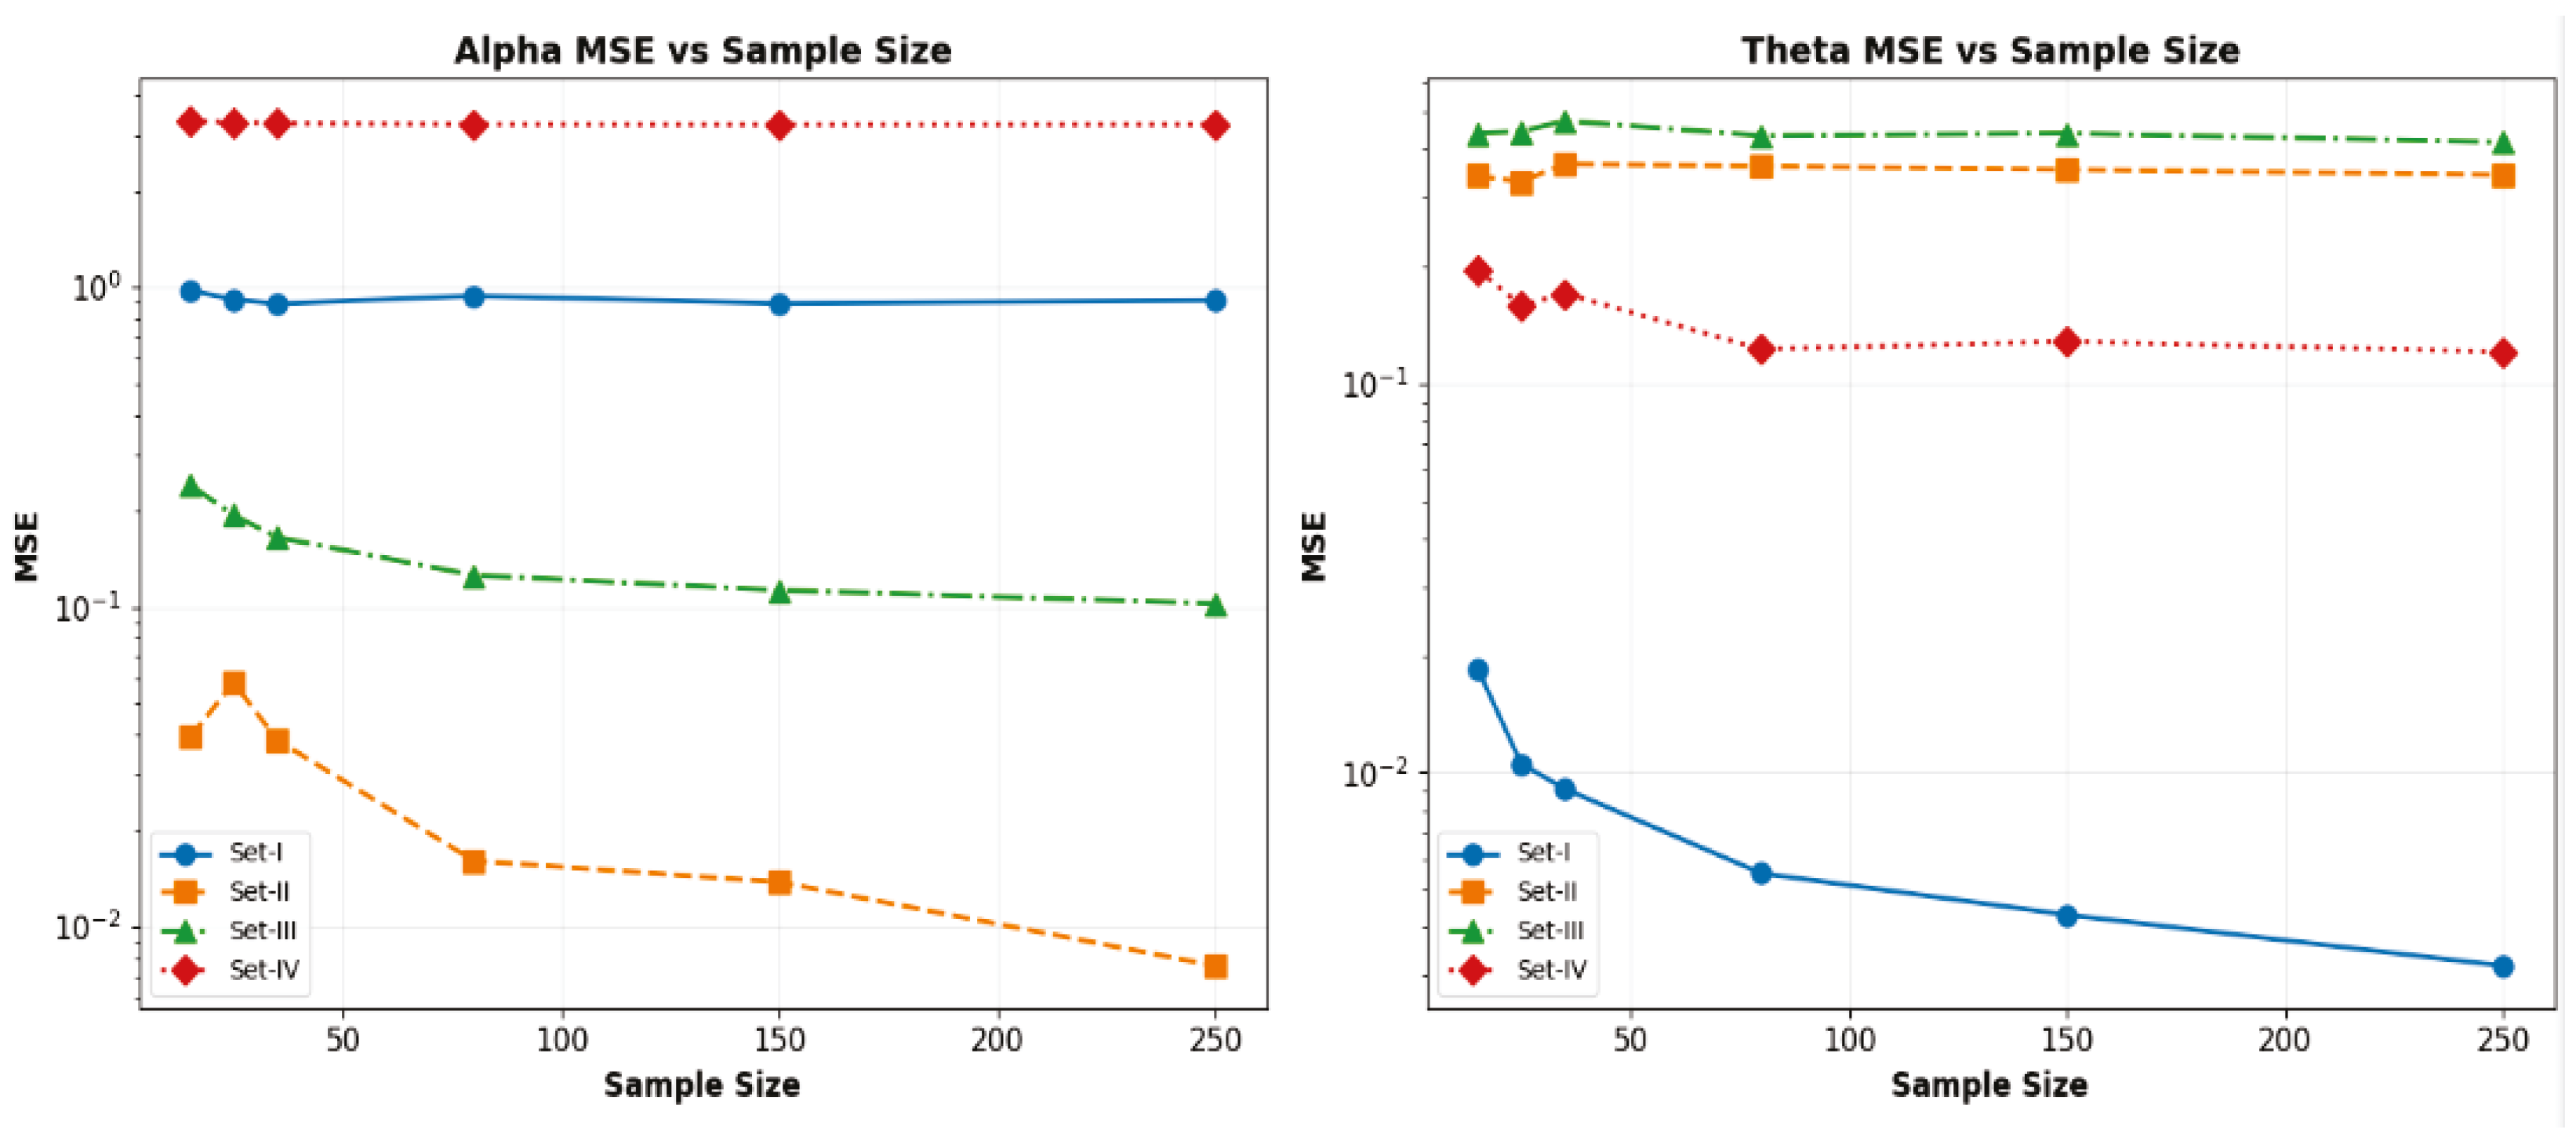
- Average mean square error (MSE) of the simulated estimates:
4.3. Discussion About Simulation Study
4.4. Bayes Estimation Method (BEM)
4.5. L-Moments Method
4.5.1. Probability Weighted Moments (PWMs)
4.5.2. Numerical Implementation Strategy
5. Materials and Methods
Real Data Illustration
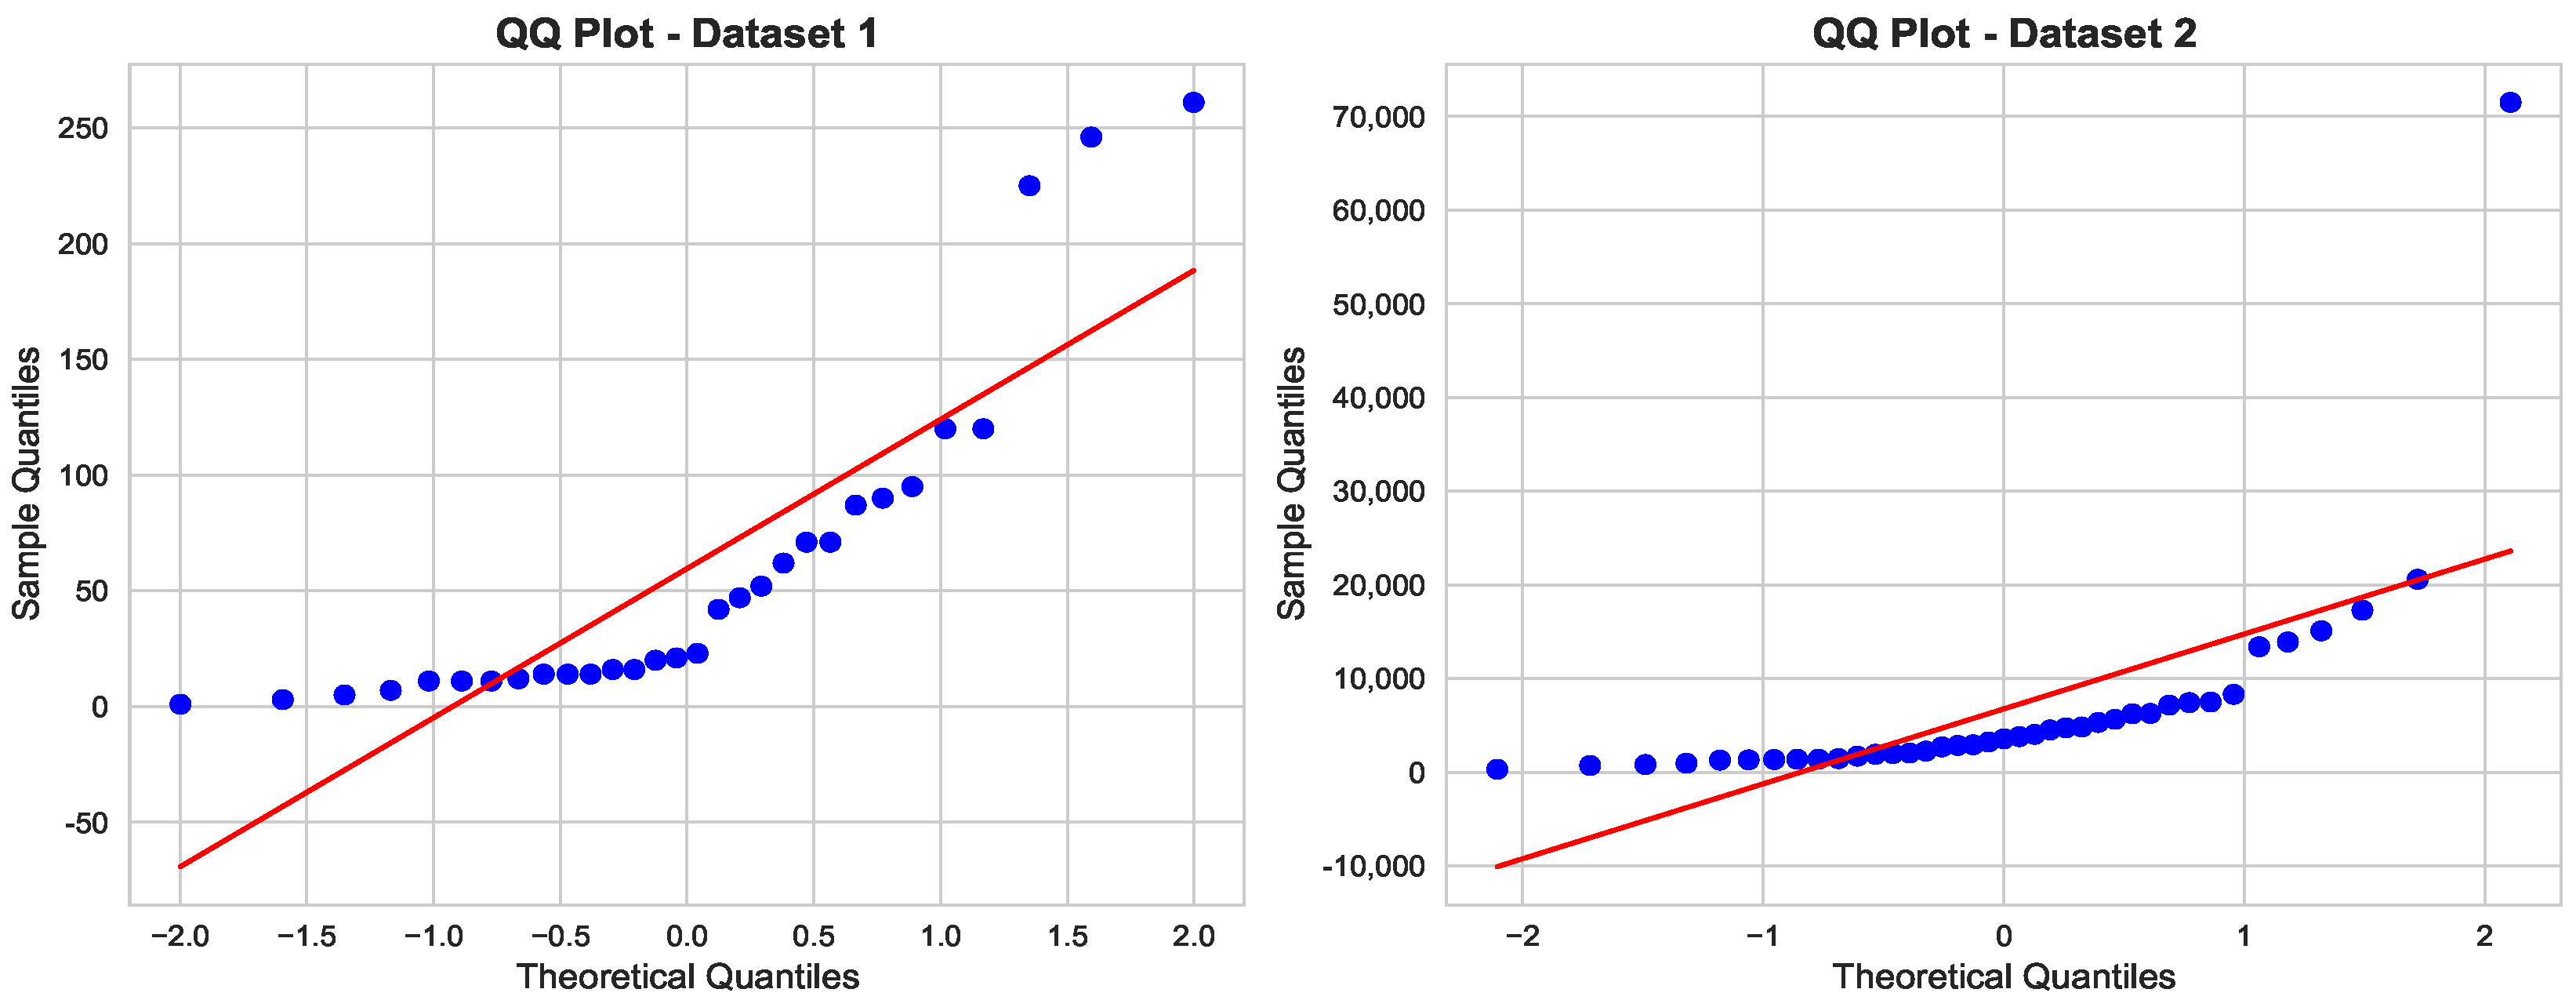
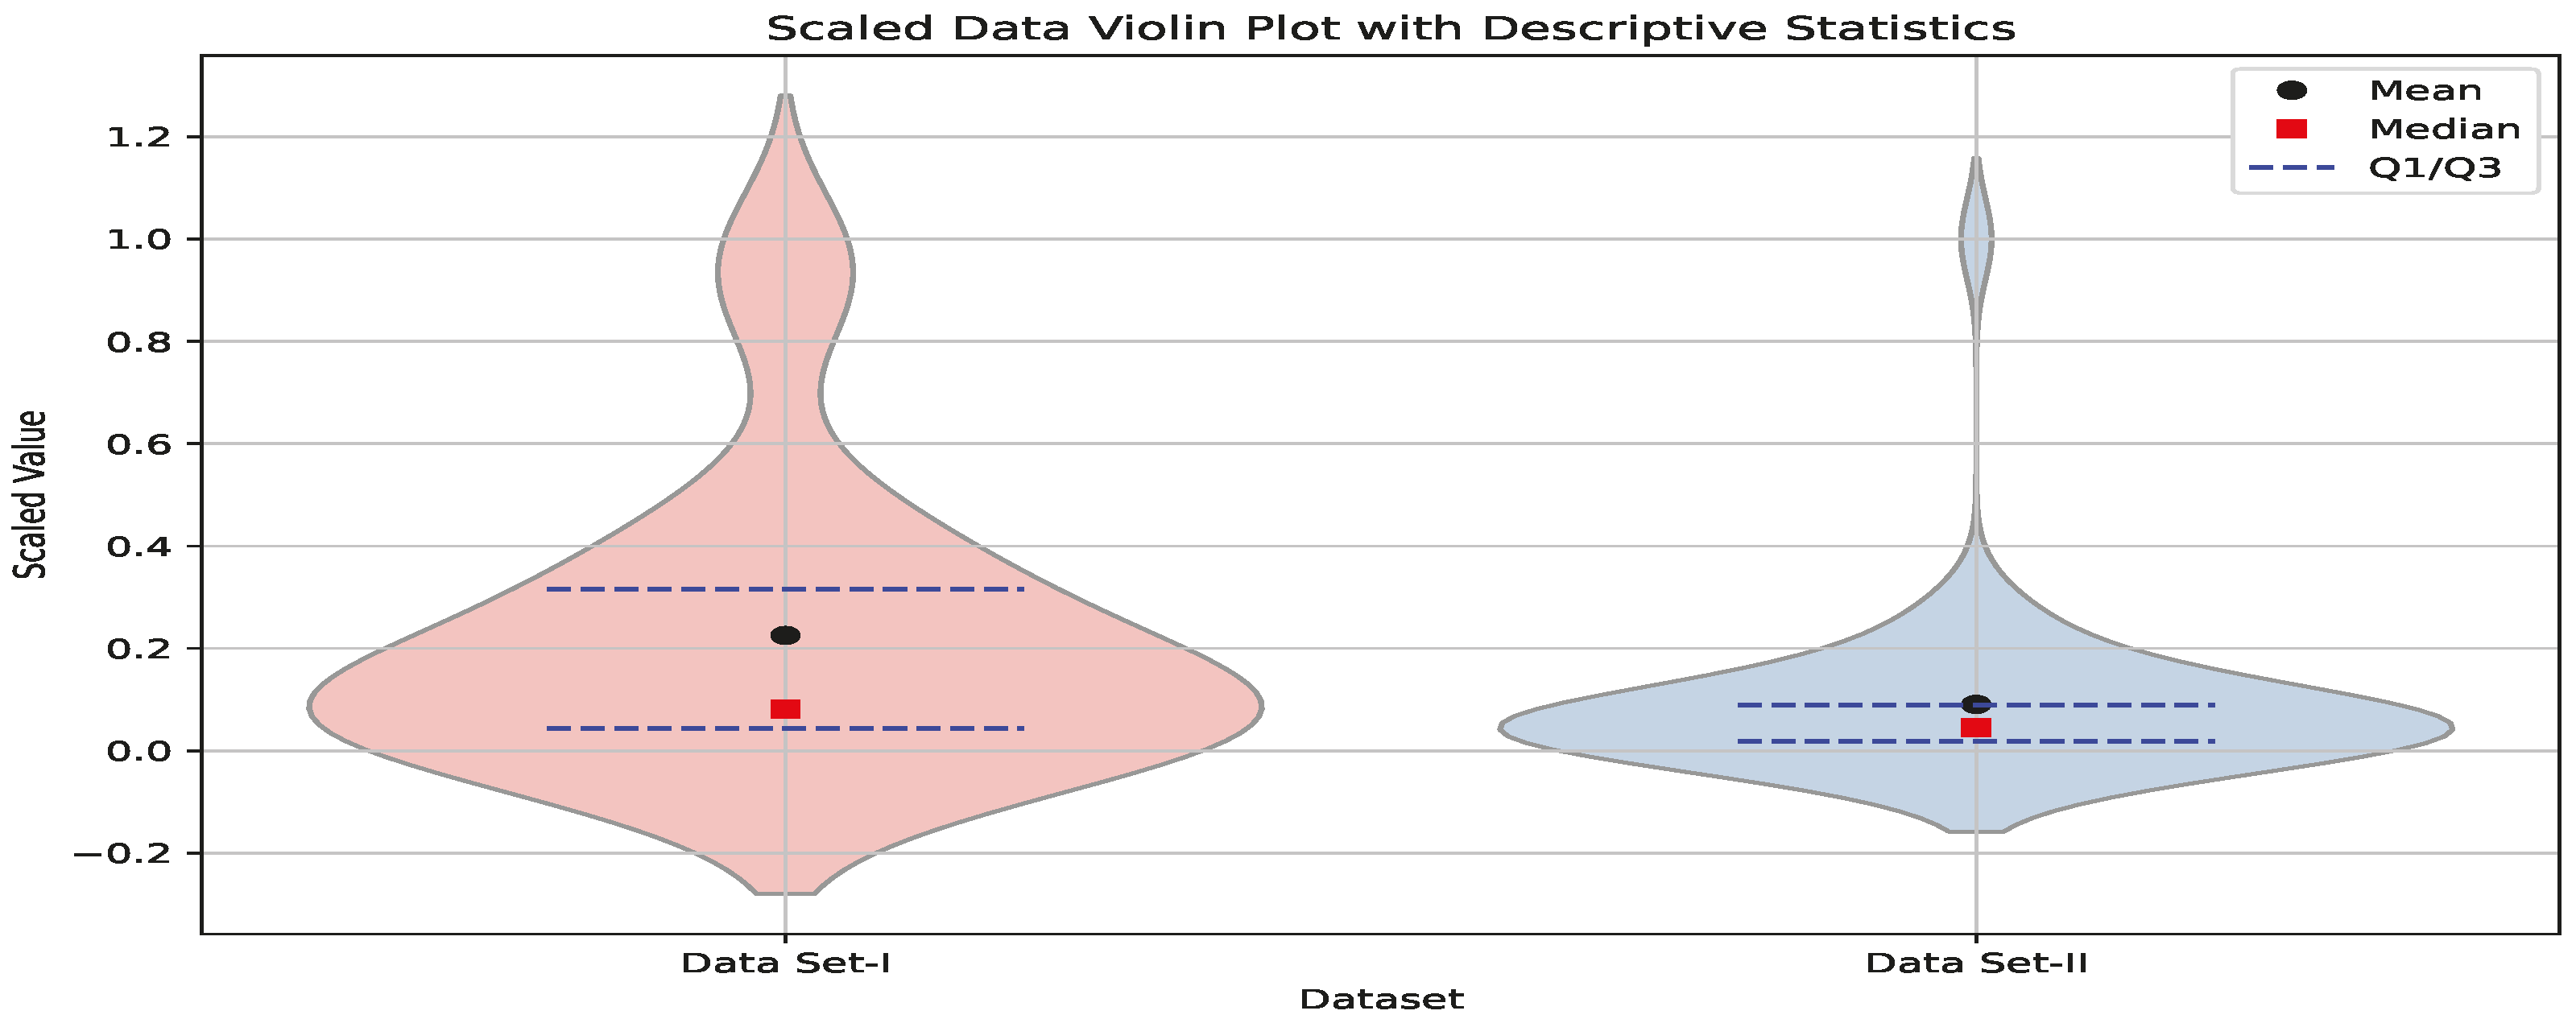
6. The Datasets and Their Properties
Data Analysis and Interpretation
7. Conclusions
Author Contributions
Funding
Data Availability Statement
Conflicts of Interest
Appendix A
| Distribution | Parameters | CDF, |
|---|---|---|
| Inverted Exponential (IE) | ||
| Inverse Rayleigh (IR) | ||
| Modified Inverse Rayleigh (MIR) | ||
| Modified Inverse Weibull (MIW) | , | |
| New Generalized Inverse Rayleigh (NGIR) | , | |
| Exponentiated Inverse Exponential (EIED) |
| Distribution | Tail Asymptotics as | Tail Classification |
|---|---|---|
| Inverted Exponential (IE) | ∼ | Heavy Tail (Polynomial decay: ) |
| Inverse Rayleigh (IR) | ∼ | Heavy Tail (Polynomial decay: ) |
| Exponentiated Inverse Exponential (EIED) | ∼ | Heavy Tail (Polynomial decay: ) |
| Modified Inverse Rayleigh (MIR) | ∼ | Heavy Tail (Polynomial decay: ) |
| Modified Inverse Weibull (MIW) | ∼ | Heavy Tail for (Polynomial decay: ). |
| New Generalized Inverse Rayleigh (NGIR) | ∼ | Heavy Tail (Polynomial decay: ) |
| Distribution | HRF Shape | Flexibility | Key Feature |
|---|---|---|---|
| IE/IR | Fixed Unimodal | Low | Baseline models with no shape flexibility. |
| EIED/MIR | Flexible Unimodal | Medium | Shape parameter modulates the peak of the baseline (IE/IR) HRF. |
| MIW | Highly Flexible Unimodal | Very High | Shape-driven flexibility. Parameter controls the core HRF form (sharpness), and provides additional modulation. |
| NGIR | Structurally Flexible Unimodal | Highest | Additive-structure flexibility. Can mimic or blend the HRFs of IE and IR families, offering a unique class of shapes. |
| Distribution | Params | Tail Behavior | Hazard Shape | Flexibility | Key Feature |
|---|---|---|---|---|---|
| IE | Heaviest (∼) | Unimodal | Low | Baseline heavy-tail model | |
| IR | Heavy (∼) | Unimodal | Low | Faster decay than IE | |
| EIED | Heaviest (∼) | Flexible Unimodal | Medium | Generalized IE with shape parameter | |
| MIR | Heavy (∼) | Flexible Unimodal | Medium | Generalized IR with shape parameters | |
| MIW | Tunable (∼) | Highly Flexible | Very High | controls decay rate | |
| NGIR | Heaviest (∼) | Structurally Flexible | Highest | Additive IE + IR structure |
| Percentile | IE | IR | MIR | MIW | NGIR | EIED |
|---|---|---|---|---|---|---|
| 0.010 | 0.326 | 0.466 | 0.523 | 0.523 | 18.218 | 0.543 |
| 0.050 | 0.501 | 0.578 | 0.667 | 0.667 | 6.711 | 0.890 |
| 0.250 | 1.082 | 0.849 | 1.049 | 1.049 | 2.523 | 2.093 |
| 0.500 | 2.164 | 1.201 | 1.615 | 1.615 | 1.572 | 4.365 |
| 0.750 | 5.214 | 1.864 | 2.926 | 2.926 | 1.089 | 10.793 |
| 0.950 | 29.244 | 4.415 | 11.450 | 11.450 | 0.724 | 61.475 |
| 0.990 | 149.249 | 9.975 | 51.675 | 51.675 | 0.576 | 314.602 |
| Distribution | Q (0.5) | Q (0.95)/Q (0.5) | Tail Behavior |
|---|---|---|---|
| IE | 2.164 | 13.513 | Extremely Heavy |
| IR | 1.201 | 3.676 | Very Heavy |
| MIR | 1.615 | 7.091 | Extremely Heavy |
| MIW | 1.615 | 7.091 | Extremely Heavy |
| NGIR | 1.572 | 0.461 | Light |
| EIED | 4.365 | 14.083 | Extremely Heavy |
| # | Mean | Variance | SD | Skewness | Excess Kurtosis | ||
|---|---|---|---|---|---|---|---|
| 1 | 2.3232 | 0.8968 | 7.12097 | 77.5462 | 8.8060 | 2.3160 | 5.6638 |
| 2 | 2.5728 | 1.6614 | 10.2649 | 113.9059 | 10.6727 | 1.5707 | 2.0641 |
| 3 | 2.4041 | 1.1842 | 8.4460 | 92.4471 | 9.6149 | 1.9727 | 3.8239 |
| 4 | 2.3173 | 1.3527 | 8.8619 | 97.3116 | 9.8647 | 1.8743 | 3.3534 |
| 5 | 2.1355 | 0.5282 | 4.8845 | 52.4677 | 7.2435 | 3.1107 | 11.1252 |
| 6 | 2.4688 | 1.4265 | 9.3922 | 103.3717 | 10.1672 | 1.7567 | 2.8264 |
| 7 | 2.1564 | 1.4181 | 8.7384 | 96.0523 | 9.8006 | 1.9011 | 3.4768 |
| 8 | 2.8377 | 1.4254 | 10.0401 | 110.8446 | 10.5283 | 1.6201 | 2.2608 |
| 9 | 2.9455 | 1.9156 | 11.4945 | 130.2045 | 11.4107 | 1.3198 | 1.1711 |
| 10 | 2.0752 | 1.5227 | 8.8744 | 97.7259 | 9.8856 | 1.8687 | 3.3244 |
| 11 | 2.6876 | 1.0393 | 8.3812 | 91.4885 | 9.5650 | 1.9908 | 3.9155 |
| 12 | 2.2933 | 1.1555 | 8.1266 | 88.9077 | 9.4291 | 2.0493 | 4.2064 |
| 13 | 2.3521 | 1.5464 | 9.5261 | 105.0885 | 10.2513 | 1.7263 | 2.6943 |
| 14 | 2.8884 | 0.5903 | 6.3574 | 68.7010 | 8.2886 | 2.5535 | 7.1228 |
| 15 | 1.6066 | 1.5002 | 7.6546 | 84.3299 | 9.1831 | 2.1596 | 4.7773 |
| 16 | 1.6307 | 1.5060 | 7.7362 | 85.2261 | 9.2318 | 2.1387 | 4.6655 |
| 17 | 1.5303 | 0.8156 | 5.1759 | 56.1959 | 7.4964 | 2.9712 | 10.0381 |
| 18 | 2.7489 | 0.6934 | 6.7854 | 73.5397 | 8.5755 | 2.4184 | 6.2757 |
| 19 | 2.6672 | 0.9731 | 8.0618 | 87.8859 | 9.3747 | 2.0690 | 4.3108 |
| 20 | 2.8050 | 1.0456 | 8.6024 | 93.9250 | 9.6915 | 1.9391 | 3.6637 |
| 21 | 2.9679 | 1.3553 | 10.0241 | 110.5388 | 10.5137 | 1.6244 | 2.2789 |
| 22 | 2.6987 | 1.1579 | 8.8765 | 97.1469 | 9.8563 | 1.8745 | 3.3575 |
| 23 | 2.1922 | 1.9826 | 10.2993 | 114.8250 | 10.7156 | 1.5599 | 2.0176 |
| 24 | 2.6708 | 0.6531 | 6.4360 | 69.6740 | 8.3471 | 2.5262 | 6.9471 |
| 25 | 1.6774 | 0.8133 | 5.4869 | 59.6109 | 7.7208 | 2.8480 | 9.1289 |
| 26 | 2.4599 | 0.7420 | 6.6020 | 71.6408 | 8.4641 | 2.4718 | 6.6029 |
| 27 | 1.7150 | 1.4797 | 7.8850 | 86.8047 | 9.3169 | 2.1020 | 4.4721 |
| 28 | 2.9170 | 0.8800 | 8.0267 | 87.3372 | 9.3454 | 2.0798 | 4.3681 |
| 29 | 2.2828 | 1.1995 | 8.2669 | 90.5135 | 9.5139 | 2.0146 | 4.0310 |
| 30 | 2.1220 | 0.8666 | 6.6122 | 71.9780 | 8.4840 | 2.4646 | 6.5557 |
| # | t | Mean | Variance | SD | Skewness | Ex. Kurtosis | ||
|---|---|---|---|---|---|---|---|---|
| 1 | 2.0488 | 0.8968 | 0.7385 | −0.16295 | 0.01497 | 0.12234 | −0.78352 | −0.06462 |
| 2 | 2.2152 | 1.6614 | 0.6656 | −0.10367 | 0.00685 | 0.08274 | −0.99566 | 0.57050 |
| 3 | 2.1028 | 1.1842 | 1.4845 | −0.36290 | 0.07099 | 0.26643 | −0.71456 | −0.23260 |
| 4 | 2.0449 | 1.3527 | 0.7073 | −0.13361 | 0.01063 | 0.10311 | −0.87699 | 0.19719 |
| 5 | 1.9237 | 0.5282 | 0.7949 | −0.21531 | 0.02375 | 0.15411 | −0.63506 | −0.41110 |
| 6 | 2.1459 | 1.4265 | 1.0531 | −0.21620 | 0.02713 | 0.16472 | −0.83250 | 0.06758 |
| 7 | 1.9376 | 1.4181 | 1.7315 | −0.44379 | 0.10385 | 0.32226 | −0.67813 | −0.31952 |
| 8 | 2.3918 | 1.4254 | 0.6457 | −0.09898 | 0.00630 | 0.07936 | −1.01106 | 0.61958 |
| 9 | 2.4637 | 1.9156 | 1.7569 | −0.34908 | 0.07192 | 0.26818 | −0.86220 | 0.15293 |
| 10 | 1.8834 | 1.5227 | 0.6441 | −0.12108 | 0.00869 | 0.09321 | −0.87079 | 0.18357 |
| 11 | 2.2917 | 1.0393 | 1.9647 | −0.50930 | 0.13511 | 0.36757 | −0.66571 | −0.33647 |
| 12 | 2.0289 | 1.1555 | 1.2030 | −0.28638 | 0.04477 | 0.21159 | −0.73267 | −0.19194 |
| 13 | 2.0680 | 1.5464 | 1.9651 | −0.48745 | 0.12720 | 0.35665 | −0.70351 | −0.25886 |
| 14 | 2.4256 | 0.5903 | 1.4073 | −0.37666 | 0.07233 | 0.26895 | −0.63494 | −0.39891 |
| 15 | 1.5710 | 1.5002 | 1.6089 | −0.46407 | 0.10717 | 0.32737 | −0.58176 | −0.53226 |
| 16 | 1.5871 | 1.5060 | 0.5588 | −0.12006 | 0.00802 | 0.08955 | −0.76792 | −0.09166 |
| 17 | 1.5202 | 0.8156 | 0.9242 | −0.27594 | 0.03724 | 0.19298 | −0.55456 | −0.58597 |
| 18 | 2.3326 | 0.6934 | 0.6803 | −0.14392 | 0.01191 | 0.10914 | −0.81883 | 0.03191 |
| 19 | 2.2782 | 0.9731 | 0.9442 | −0.20249 | 0.02344 | 0.15310 | −0.80879 | 0.00440 |
| 20 | 2.3700 | 1.0456 | 0.6781 | −0.12232 | 0.00913 | 0.09556 | −0.91844 | 0.31856 |
| 21 | 2.4786 | 1.3553 | 0.9770 | −0.17693 | 0.01912 | 0.13827 | −0.91964 | 0.32205 |
| 22 | 2.2992 | 1.1579 | 1.1214 | −0.23874 | 0.03269 | 0.18079 | −0.81403 | 0.01861 |
| 23 | 1.9615 | 1.9826 | 0.5962 | −0.09157 | 0.00533 | 0.07300 | −0.99474 | 0.57382 |
| 24 | 2.2805 | 0.6531 | 1.5387 | −0.42347 | 0.09020 | 0.30034 | −0.61351 | −0.44488 |
| 25 | 1.6183 | 0.8133 | 1.3499 | −0.41401 | 0.08238 | 0.28701 | −0.53478 | −0.61380 |
| 26 | 2.1399 | 0.7420 | 0.8981 | −0.21493 | 0.02515 | 0.15859 | −0.73046 | −0.19448 |
| 27 | 1.6434 | 1.4797 | 1.2849 | −0.34236 | 0.06053 | 0.24602 | −0.63957 | −0.41152 |
| 28 | 2.4447 | 0.8799 | 0.6409 | −0.11784 | 0.00843 | 0.09183 | −0.90965 | 0.29164 |
| 29 | 2.0218 | 1.1995 | 1.3639 | −0.33343 | 0.05995 | 0.24485 | −0.71380 | −0.23654 |
| 30 | 1.9147 | 0.8666 | 1.8939 | −0.55936 | 0.15219 | 0.39011 | −0.55968 | −0.55629 |
| Data | Sample Size | Mean | Median | Standard Deviation | Skewness | Kurtosis | |
|---|---|---|---|---|---|---|---|
| I | 30 | 59.6 | 220 | 71.8848 | 1.6936 | 4.9667 | 0.3409 |
| II | 39 | 6771.1 | 3570.0 | 11695.7 | 4.5580 | 25.4436 | 0.1791 |
| Distribution | KS | p-Value | |||||
|---|---|---|---|---|---|---|---|
| EIED | 7.1983 | 1.2268 | — | 1.9946 | 0.3365 | 0.2467 | 0.1214 |
| IE | 11.1798 | — | — | 3.1823 | 0.5352 | 0.2880 | 0.0440 |
| IR | 24.279 | — | — | 38.3314 | 3.7244 | 0.6442 | 0.0000 |
| MIR | −2.2858 | 8.7051 | — | 5.2181 | 0.9516 | 0.3355 | 0.0112 |
| MIW | 3.2770 | 5.2043 | 12.2292 | 11.3970 | 1.9531 | 0.4491 | 0.00018 |
| NGIR | −4.6530 | 11.4821 | 0.7741 | 4.2349 | 0.8514 | 0.3482 | 0.0075 |
| Distribution | KS | p-Value | |||||
|---|---|---|---|---|---|---|---|
| EIED | 7.1984 | 1.2268 | — | 1.6443 | 0.2764 | 0.1917 | 0.1933 |
| IE | 11.1799 | — | — | 2.8222 | 0.4862 | 0.2330 | 0.0648 |
| IR | 24.279 | — | — | 44.2636 | 5.0044 | 0.6442 | 0.0000 |
| MIR | 0.0000 | 11.1799 | — | 2.8222 | 0.4861 | 0.2330 | 0.0648 |
| MIW | 6.9712 | 0.0000 | 0.7240 | 0.7857 | 0.1060 | 0.1594 | 0.3890 |
| NGIR | 0.0000 | 8.1239 | 0.6493 | 56.5120 | 8.8751 | 0.9998 | 0.0000 |
| Distribution | AIC | AICC | BIC | HQIC | CAIC | |
|---|---|---|---|---|---|---|
| EIED | 156.401 | 316.803 | 317.247 | 319.605 | 317.699 | 321.605 |
| IE | 159.062 | 320.124 | 320.267 | 321.525 | 320.572 | 322.525 |
| IR | 215.745 | 433.491 | 433.634 | 434.892 | 433.939 | 435.892 |
| MIR | 158.767 | 321.534 | 321.979 | 324.337 | 322.431 | 326.337 |
| MIW | 157.082 | 320.160 | 321.083 | 324.364 | 321.505 | 327.364 |
| NGIR | 155.367 | 316.734 | 317.657 | 320.938 | 318.079 | 323.938 |
| Distribution | AIC | AICC | BIC | HQIC | CAIC | |
|---|---|---|---|---|---|---|
| EIED | 156.4013 | 316.803 | 319.605 | 317.232 | 317.694 | 321.605 |
| IE | 159.0620 | 320.124 | 321.525 | 320.267 | 320.570 | 322.525 |
| IR | 215.7455 | 433.491 | 434.892 | 433.634 | 433.937 | 435.892 |
| MIR | 159.0620 | 322.124 | 324.927 | 322.553 | 323.016 | 326.927 |
| MIW | 155.5140 | 317.029 | 317.952 | 321.232 | 318.374 | 324.232 |
| NGIR | 157.1929 | 320.386 | 324.589 | 321.243 | 321.724 | 327.589 |
| Distribution | KS | p-Value | |||||
|---|---|---|---|---|---|---|---|
| EIED | 295.445 | 4.8414 | — | 0.3969 | 0.0490 | 0.0866 | 0.9318 |
| IE | 2166.26 | — | — | 0.4018 | 0.0496 | 0.0867 | 0.9313 |
| IR | — | — | 15.7237 | 2.1976 | 0.3802 | 0.00002 | |
| MIR | −204,920.00 | 2391.75 | — | 0.4074 | 0.0494 | 0.0937 | 0.8827 |
| MIW | 2266.27 | 133.637 | 1.0151 | 0.4039 | 0.0501 | 0.0867 | 0.9317 |
| NGIR | 10.9061 | 2400.88 | 1.1718 | 0.3976 | 0.0579 | 0.0870 | 0.9316 |
| Distribution | KS | p-Value | |||||
|---|---|---|---|---|---|---|---|
| EIED | 535.8348 | 2.7982 | — | 0.3954 | 0.0494 | 0.0874 | 0.9011 |
| IE | 2165.8754 | — | — | 0.3993 | 0.0497 | 0.0864 | 0.9085 |
| IR | — | — | 30.6670 | 4.3344 | 0.4881 | 0.0000 | |
| MIR | — | 0.7755 | 0.0516 | 0.0974 | 0.8182 | ||
| MIW | 2166.5067 | 57.9821 | 0.3955 | 0.0496 | 0.0863 | 0.9092 | |
| NGIR | 1 | 102.4034 | 13.1862 | 1.0000 | 0.0000 |
| Distribution | AIC | AICC | BIC | HQIC | CAIC | |
|---|---|---|---|---|---|---|
| EIED | 377.735 | 759.469 | 759.803 | 762.797 | 760.663 | 764.797 |
| IE | 380.110 | 762.221 | 762.329 | 763.884 | 762.818 | 764.884 |
| IR | 404.562 | 811.124 | 811.232 | 812.787 | 811.721 | 813.787 |
| MIR | 377.815 | 759.630 | 759.963 | 762.957 | 760.824 | 764.957 |
| MIW | 377.987 | 759.974 | 760.307 | 763.301 | 761.167 | 765.301 |
| NGIR | 377.743 | 761.485 | 762.171 | 766.476 | 763.276 | 769.476 |
| Distribution | AIC | AICC | BIC | HQIC | CAIC | |
|---|---|---|---|---|---|---|
| EIED | 377.2174 | 758.435 | 758.768 | 761.762 | 759.629 | 763.762 |
| IE | 377.9945 | 757.989 | 758.097 | 759.653 | 758.586 | 760.653 |
| IR | 411.7900 | 825.580 | 825.688 | 827.244 | 826.177 | 828.244 |
| MIR | NaN | NaN | NaN | NaN | NaN | NaN |
| MIW | 376.2611 | 758.522 | 759.208 | 763.513 | 760.313 | 766.513 |
| NGIR | NaN | NaN | NaN | NaN | NaN | NaN |
- Set I:
- –
- Parameter’s estimation:
- –
- The variance–covariance matrices of MLEs:
- –
- Standard error of MLEs: (0.7752, 49.4974)
- –
- The variance–covariance matrices of LM:
- –
- Standard error of LM: (0.7752, 49.4974)
- Set II:
- –
- Parameter’s estimation:
- –
- The variance–covariance matrices of MLEs:
- –
- Standard error of MLEs: (0.2239,1.4072)
- –
- The variance–covariance matrices of LMs:
- –
- Standard error of LMs: (0.4480, 91.6521)
- Simulation results by MLE.
- Simulation results by BEM.
- Simulation results by LMM.
| Set | n | True Values | Bias | MSE | |||
|---|---|---|---|---|---|---|---|
| I | 15 | 0.03 | 0.45 | 115.59 | −0.02 | 68,073.18 | 0.26 |
| 25 | 0.03 | 0.45 | 62.45 | 0.02 | 35,067.67 | 0.20 | |
| 35 | 0.03 | 0.45 | 33.61 | 0.06 | 17,363.00 | 0.16 | |
| 80 | 0.03 | 0.45 | 2.00 | 0.16 | 552.57 | 0.16 | |
| 150 | 0.03 | 0.45 | 0.77 | 0.10 | 55.53 | 0.13 | |
| 250 | 0.03 | 0.45 | 0.46 | 0.04 | 0.31 | 0.10 | |
| II | 15 | 0.55 | 1.30 | 320.98 | −0.84 | 239,154.92 | 1.18 |
| 25 | 0.55 | 1.30 | 237.20 | −0.85 | 163,812.72 | 1.07 | |
| 35 | 0.55 | 1.30 | 170.13 | −0.82 | 111,226.98 | 0.93 | |
| 80 | 0.55 | 1.30 | 56.87 | −0.69 | 33,165.21 | 1.09 | |
| 150 | 0.55 | 1.30 | 10.83 | −0.69 | 5584.57 | 0.61 | |
| 250 | 0.55 | 1.30 | 3.00 | −0.74 | 1449.74 | 0.66 | |
| III | 15 | 1.05 | 0.53 | 369.18 | −0.12 | 265,312.35 | 0.56 |
| 25 | 1.05 | 0.53 | 329.36 | −0.23 | 218,134.41 | 0.39 | |
| 35 | 1.05 | 0.53 | 289.84 | −0.27 | 185,121.38 | 0.31 | |
| 80 | 1.05 | 0.53 | 236.11 | −0.39 | 132,010.61 | 0.21 | |
| 150 | 1.05 | 0.53 | 158.07 | −0.42 | 75,627.76 | 0.20 | |
| 250 | 1.05 | 0.53 | 117.91 | −0.44 | 53,535.76 | 0.20 | |
| IV | 15 | 1.98 | 2.32 | 499.83 | −1.96 | 430,620.09 | 4.21 |
| 25 | 1.98 | 2.32 | 377.62 | −1.95 | 313,489.56 | 4.07 | |
| 35 | 1.98 | 2.32 | 341.30 | −1.98 | 258,241.51 | 4.14 | |
| 80 | 1.98 | 2.32 | 231.77 | −2.02 | 162,926.81 | 4.20 | |
| 150 | 1.98 | 2.32 | 128.90 | −2.03 | 65,642.77 | 4.22 | |
| 250 | 1.98 | 2.32 | 84.34 | −2.04 | 33,810.68 | 4.21 | |
| Set | n | True Values | Bias | MSE | |||
|---|---|---|---|---|---|---|---|
| Set I | 15 | 0.03 | 0.45 | 1.1969 | 0.4502 | 1.8025 | 0.9255 |
| 25 | 0.03 | 0.45 | 1.0497 | 0.4325 | 1.5528 | 0.7441 | |
| 35 | 0.03 | 0.45 | 0.9068 | 0.6738 | 1.0132 | 1.4492 | |
| 80 | 0.03 | 0.45 | 0.7671 | 0.9862 | 0.7603 | 3.6325 | |
| 150 | 0.03 | 0.45 | 0.2938 | 2.8512 | 0.1318 | 11.7355 | |
| 250 | 0.03 | 0.45 | 0.5132 | 2.9340 | 0.4552 | 15.9645 | |
| Set II | 15 | 0.55 | 1.3 | 0.1578 | −0.3474 | 0.1708 | 0.5802 |
| 25 | 0.55 | 1.3 | 0.3885 | −0.5949 | 0.5360 | 0.5757 | |
| 35 | 0.55 | 1.3 | 0.3138 | −0.6141 | 0.1852 | 0.5276 | |
| 80 | 0.55 | 1.3 | 0.5867 | −0.8226 | 0.5190 | 0.7763 | |
| 150 | 0.55 | 1.3 | 0.5488 | −0.9023 | 0.3871 | 0.8278 | |
| 250 | 0.55 | 1.3 | 0.5981 | −0.9479 | 0.3914 | 0.9044 | |
| Set III | 15 | 1.05 | 0.53 | −0.8145 | 3.1208 | 0.8799 | 15.2454 |
| 25 | 1.05 | 0.53 | −1.0032 | 4.2477 | 1.0064 | 18.5637 | |
| 35 | 1.05 | 0.53 | −1.0036 | 4.7701 | 1.0072 | 23.5752 | |
| 80 | 1.05 | 0.53 | −1.0061 | 5.6222 | 1.0122 | 32.2936 | |
| 150 | 1.05 | 0.53 | −1.0052 | 5.5591 | 1.0105 | 31.0864 | |
| 250 | 1.05 | 0.53 | −1.0065 | 6.0023 | 1.0131 | 36.3424 | |
| Set IV | 15 | 1.98 | 2.32 | −0.5571 | −1.7028 | 0.4847 | 2.9378 |
| 25 | 1.98 | 2.32 | −0.3428 | −1.7972 | 0.4904 | 3.2823 | |
| 35 | 1.98 | 2.32 | −0.1122 | −1.8860 | 0.2734 | 3.5768 | |
| 80 | 1.98 | 2.32 | −0.3685 | −1.8503 | 0.2516 | 3.4424 | |
| 150 | 1.98 | 2.32 | 0.1532 | −1.9426 | 0.5937 | 3.8018 | |
| 250 | 1.98 | 2.32 | 0.2057 | −2.9981 | 0.2618 | 4.0030 | |
| Parameter_Set | Sample_Size | True Values | Bias | MSE | |||
|---|---|---|---|---|---|---|---|
| Set I | 15 | 0.03 | 0.45 | 0.8279 | 0.0545 | 0.8226 | 0.0190 |
| 25 | 0.03 | 0.45 | 0.8888 | 0.0458 | 0.9128 | 0.0126 | |
| 35 | 0.03 | 0.45 | 0.9120 | 0.0488 | 0.9221 | 0.0093 | |
| 80 | 0.03 | 0.45 | 0.9419 | 0.0488 | 0.9369 | 0.0056 | |
| 150 | 0.03 | 0.45 | 0.9477 | 0.0508 | 0.9264 | 0.0044 | |
| 250 | 0.03 | 0.45 | 0.9584 | 0.0518 | 0.9325 | 0.0037 | |
| Set II | 15 | 0.55 | 1.3 | −0.0320 | −0.5876 | 0.04995 | 0.3663 |
| 25 | 0.55 | 1.3 | 0.0193 | −0.5864 | 0.0436 | 0.3562 | |
| 35 | 0.55 | 1.3 | 0.0256 | −0.5933 | 0.0363 | 0.3604 | |
| 80 | 0.55 | 1.3 | 0.0479 | −0.5906 | 0.0176 | 0.3523 | |
| 150 | 0.55 | 1.3 | 0.0567 | −0.5902 | 0.0125 | 0.3505 | |
| 250 | 0.55 | 1.3 | 0.0541 | −0.5909 | 0.0083 | 0.3504 | |
| Set III | 15 | 1.05 | 0.53 | −0.3904 | 0.6607 | 0.2503 | 0.5107 |
| 25 | 1.05 | 0.53 | −0.3642 | 0.6527 | 0.1893 | 0.4693 | |
| 35 | 1.05 | 0.53 | −0.3366 | 0.6568 | 0.1617 | 0.4631 | |
| 80 | 1.05 | 0.53 | −0.3286 | 0.6538 | 0.1315 | 0.4403 | |
| 150 | 1.05 | 0.53 | −0.3066 | 0.6533 | 0.1083 | 0.4332 | |
| 250 | 1.05 | 0.53 | −0.3089 | 0.6530 | 0.1039 | 0.4309 | |
| Set IV | 15 | 1.98 | 2.32 | −1.8156 | 0.3549 | 3.3027 | 0.2071 |
| 25 | 1.98 | 2.32 | −1.8097 | 0.3518 | 3.2788 | 0.1712 | |
| 35 | 1.98 | 2.32 | −1.8028 | 0.3515 | 3.2535 | 0.1590 | |
| 80 | 1.98 | 2.32 | −1.8001 | 0.3547 | 3.2418 | 0.1404 | |
| 150 | 1.98 | 2.32 | −1.7992 | 0.3524 | 3.2378 | 0.1329 | |
| 250 | 1.98 | 2.32 | −1.7978 | 0.3472 | 3.2324 | 0.1257 | |
References
- Akinsete, A.; Famoye, F.; Lee, C. The beta-Pareto distribution. Statistics 2008, 42, 547–563. [Google Scholar] [CrossRef]
- Gupta, R.C.; Gupta, R.D.; Gupta, P.L. Modeling failure time data by Lehman alternatives. Commun. Stat.-Theory Methods 1998, 27, 887–904. [Google Scholar] [CrossRef]
- Nassar, M.; Alzaatreh, A.; Mead, M.; Abo-Kasem, O. Alpha Power Weibull Distribution: Properties and Applications. Commun. Stat.-Theory Methods 2017, 46, 10236–10252. [Google Scholar] [CrossRef]
- Nadarajah, S.; Kotz, S. The Exponentiated Type Distributions. Acta Appl. Math. 2006, 92, 97–111. [Google Scholar] [CrossRef]
- Nadarajah, S. The exponentiated Gumbel distribution with climate application. Environmetrics 2006, 17, 13–23. [Google Scholar] [CrossRef]
- Al-Babtain, A.A.; Elbatal, I.; Chesneau, C.; Jamal, F. The Topp-Leone Odd Burr XII-G Family of Distributions: Theory, Characterization, and Applications to Industry and Flood Data. Ann. Data Sci. 2023, 10, 723–747. [Google Scholar]
- Hassan, A.S.; Nassr, S.G.; Elsehamy, S.A. A New Generalization of the Exponentiated Inverted Weibull Distribution with Applications to Engineering and Medical Data. J. Appl. Stat. 2022, 49, 4099–4120. [Google Scholar]
- Korkmaz, M.Ç.; Yousof, H.M.; Hamedani, G.G. The Exponentiated Burr XII-Poisson Distribution with Applications to Lifetime Data. Commun. Stat.-Simul. Comput. 2022, 51, 6552–6571. [Google Scholar]
- Elbatal, I.; Hiba, M.Z. Exponentiated Generalized Inverse Weibull Distribution. Appl. Math. Sci. 2014, 8, 3997–4012. [Google Scholar] [CrossRef]
- Kumar, D.; Singh, U.; Singh, S.K. A New Distribution Using Sine Function-Its Application To Bladder Cancer Patients Data. J. Stat. Appl. Probab. Nat. Sci. Publ. Corp 2015, 4, 417. [Google Scholar]
- Kumar, D.; Singh, U.; Singh, U. Lifetime Distribution: Derived from some Minimum Guarantee Distribution. Sohag J. Math. 2017, 4, 7–11. [Google Scholar] [CrossRef]
- Chesneau, C.; Bakouch, H. A New Cumulative Distribution Function Based on m Existing Ones; HAL: Bangalore, India, 2017. [Google Scholar]
- Christophe, C.; Hassan, S.B.; Hussain, T. A New Class of Probability Distributions via Cosine and Sine Functions with Applications. Communications in Statistics, Simulation and Computation; Taylor & Francis: Abingdon, UK, 2018; pp. 1–14. [Google Scholar]
- Kumar, D.; Singh, U.; Singh, S.K.; Mukherjee, S. The New Probability Distribution: An Aspect to a Life Time Distribution. Math. Sci. Lett. 2017, 6, 35–42. [Google Scholar] [CrossRef]
- Nasir, A.; Yousof, H.M.; Jamal, F.; Korkmaz, M.Ç. The exponentiated Burr XII power series distribution: Properties and applications. Stats 2018, 2, 15–31. [Google Scholar] [CrossRef]
- Schiff, J.L. The Laplace Transform: Theory and Applications; Springer: New York, NY, USA, 1999. [Google Scholar]
- Folland, G.B. Real Analysis: Modern Techniques and Their Applications; John Wiley & Sons: Hoboken, NJ, USA, 1999. [Google Scholar]
- Erdelyi, A.; Magnus, W.; Oberhettinger, F.; Tricomi, F. Tables of Integral Transforms; McGraw-Hill: New York, NY, USA, 1954; Volume 1. [Google Scholar]
- Kanwal, R.P. Generalized Functions: Theory and Technique, 2nd ed.; Springer Science + Business Media: New York, NY, USA, 2004. [Google Scholar]
- Ablowitz, M.J.; Fokas, A.S. Complex Variables: Introduction and Applications, 2nd ed.; Cambridge University Press: Cambridge, UK, 2003. [Google Scholar]
- Brychkov, Y.A.; Prudnikov, A.P. Integral transforms of generalized functions. J. Sov. Math. 1986, 34, 1630–1655. [Google Scholar] [CrossRef]
- Debnath, L.; Bhatta, D. Integral Transforms and Their Applications; Chapman and Hall/CRC: Boca Raton, FL, USA, 2016. [Google Scholar]
- Khan, M.S.; King, R. New generalized inverse Weibull distribution for lifetime modeling. Commun. Stat. Appl. Methods 2016, 23, 147–161. [Google Scholar] [CrossRef]






Disclaimer/Publisher’s Note: The statements, opinions and data contained in all publications are solely those of the individual author(s) and contributor(s) and not of MDPI and/or the editor(s). MDPI and/or the editor(s) disclaim responsibility for any injury to people or property resulting from any ideas, methods, instructions or products referred to in the content. |
© 2025 by the authors. Licensee MDPI, Basel, Switzerland. This article is an open access article distributed under the terms and conditions of the Creative Commons Attribution (CC BY) license (https://creativecommons.org/licenses/by/4.0/).
Share and Cite
Mushtaq, A.; Hussain, T.; Shakil, M.; Ahsanullah, M.; Kibria, B.M.G. An Exponentiated Inverse Exponential Distribution Properties and Applications. Axioms 2025, 14, 753. https://doi.org/10.3390/axioms14100753
Mushtaq A, Hussain T, Shakil M, Ahsanullah M, Kibria BMG. An Exponentiated Inverse Exponential Distribution Properties and Applications. Axioms. 2025; 14(10):753. https://doi.org/10.3390/axioms14100753
Chicago/Turabian StyleMushtaq, Aroosa, Tassaddaq Hussain, Mohammad Shakil, Mohammad Ahsanullah, and Bhuiyan Mohammad Golam Kibria. 2025. "An Exponentiated Inverse Exponential Distribution Properties and Applications" Axioms 14, no. 10: 753. https://doi.org/10.3390/axioms14100753
APA StyleMushtaq, A., Hussain, T., Shakil, M., Ahsanullah, M., & Kibria, B. M. G. (2025). An Exponentiated Inverse Exponential Distribution Properties and Applications. Axioms, 14(10), 753. https://doi.org/10.3390/axioms14100753


