Abstract
The Zika virus, known for its potential to induce neurological conditions such as microcephaly when transmitted vertically from infected mothers to infants, has sparked widespread concerns globally. Motivated by this, we propose an optimal control problem for the prevention of vertical Zika transmission. The novelty of this study lies in its consideration of time-dependent control functions, namely, insecticide spraying and personal protective measures taken to safeguard pregnant women from infected mosquitoes. New results provide a way to minimize the number of infected pregnant women through the implementation of control strategies while simultaneously reducing both the associated costs of control measures and the mosquito population, resulting in a decline in microcephaly cases.
MSC:
49M05; 92D30
1. Introduction
Zika virus is a mosquito-borne disease mainly transmitted to humans through the bite of female mosquitoes Aedes aegypti. It presents a serious threat to public health due to its vertical transmission from pregnant women to their babies, potentially resulting in heightened occurrences of neurological disorders like microcephaly [1,2]. In February 2016, the World Health Organization (WHO) declared Zika-related microcephaly a Public Health Emergency of International Concern (PHEIC), confirming the causal link between the Zika virus and congenital malformations. The PHEIC was declared to have concluded by the WHO in November of the same year. Despite a global decline in cases of Zika virus disease from 2017 onwards, transmission continues at low levels in various countries across the Americas and other endemic regions [3].
Mathematical modeling of infectious diseases is not only an important tool in understanding the dynamics of the disease but also contributes to the process of taking necessary measures to prevent disease transmission [4,5,6]. Researchers have examined the vertical transmission of Zika as well as the development of microcephaly in newborn babies (for example, [7,8,9]). Additionally, controlled mathematical models to identify the crucial characteristics causing the transmission may be more effective in predicting the future course of the epidemic and preventing transmission [10,11,12,13]. Therefore, various perspectives on optimal control strategies for Zika transmission dynamics have been discussed in the literature [7,8,14,15,16].
Our study proposes an optimal control problem for the prevention of vertical Zika transmission, which is a significant public health concern. Moreover, the proposed optimal control problem differs from all the others found in the literature on Zika transmission. Indeed, we consider the uncontrolled Zika transmission model in Brazil [9] and introduce time-dependent control functions representing personal protection and insecticide spraying. The objective is to minimize the number of infected pregnant women through the implementation of control strategies while simultaneously reducing the associated costs of these control measures.
This paper is organized as follows: in Section 2, we introduce the uncontrolled Zika model; in Section 3, we formulate the optimal control problem and derive the optimality system using the Pontryagin maximum principle; in Section 4, our focus is on conducting numerical simulations to showcase the impacts of optimal control strategies; and finally, we conclude with Section 5.
2. Uncontrolled Zika Model
In this section, we recall the main assumptions of the mathematical model for the spread of Zika virus as proposed in [9]. The model considers women as the population under study. The total women population, given by N, is subdivided into four mutually exclusive compartments, according to disease status: susceptible pregnant women (S); infected pregnant women (I); women who gave birth to babies without a neurological disorder (W); and women who gave birth to babies with a neurological disorder due to microcephaly (M).
As for the mosquitoes population, there are four state variables related to the (female) mosquitoes: , which corresponds to the aquatic phase, which includes the egg, larva, and pupa stages; , for the mosquitoes that might contract the disease (susceptible); , for the mosquitoes that are infected but are not able to transmit the Zika virus to humans (exposed); and , for the mosquitoes capable of transmitting the Zika virus to humans (infected).
The following assumptions are considered in our model:
- (A.1)
- There is no immigration of infected humans;
- (A.2)
- The total human populations N is constant;
- (A.3)
- The coefficient of transmission of Zika virus is constant and does not vary with seasons;
- (A.4)
- After giving birth, pregnant women are no longer pregnant and they leave the population under study at a rate equal to the rate of humans birth;
- (A.5)
- Death is neglected, as the period of pregnancy is much smaller than the mean humans lifespan;
- (A.6)
- There is no resistant phase for the mosquito due to its short lifetime.
Note that male mosquitoes are not considered in this study because they do not bite humans and consequently they do not influence the dynamics of the disease. The differential system that describes the model is composed of pregnant women and women who gave birth:
where is the total population (women), with . The parameter denotes the new pregnant women per week, stands for the fraction of susceptible pregnant women that become infected, B is the average daily biting (per day), represents the transmission probability from infected mosquitoes (per bite), is the rate at which susceptible pregnant women S give birth (in weeks), is the rate at which infected pregnant women I give birth (in weeks), is the natural death rate for pregnant women, and denotes the fraction of infected pregnant women I that give birth to babies with a neurological disorder due to microcephaly. The above system (1) is coupled with the dynamics of the mosquitoes:
where parameter represents the transmission probability from infected humans (per bite), stands for the number of eggs at each deposit per capita (per day), is the natural mortality rate of larvae (per day), is the maturation rate from larvae to adult (per day), represents the extrinsic incubation period (in days), denotes the average lifespan of adult mosquitoes (in days), and K is the maximal capacity of larvae. See Table 1 for the description of the state variables and parameters of the Zika model (1)–(2).

The positivity and boundedness of solutions, as well as the existence and stability analysis of both disease-free and endemic equilibria, were studied in [9]. Additionally, the basic reproduction number and its sensitivity was also analyzed in [9]. Considering the data collected by the WHO between 4 February 2016 and 10 November 2016 in Brazil, the authors of [9] concluded that the parameters most sensitive to interventions are B and . Hence, to mitigate the transmission of the Zika virus, it is imperative to implement control measures aimed at reducing the number of daily mosquito bites, B, and the transmission probability from the infected mosquitoes, . Furthermore, the fraction , representing susceptible pregnant women (S) who contract the virus, exhibits a sensitivity index very close to . This underscores the critical importance of preventive measures aimed at safeguarding susceptible pregnant women from infection.
These conclusions encourage us to pursue the identification of optimal strategies for mitigating the transmission of the Zika virus. In the upcoming section, we address this by introducing an optimal control problem.
3. Optimal Control Problem
In this section, we formulate an optimal control problem for Zika transmission. Our objective is to minimize the number of infected pregnant women, reduce the mosquito population, and minimize the cost associated with the implementation of the control measures.
According to the Centers for Disease Control and Prevention, the best way to prevent Zika is to be protected from mosquito bites [17]. Moreover, everyone, including pregnant and breastfeeding women, should take steps to prevent mosquito bites [17]. When used as directed, EPA-registered insect repellents are proven safe and effective, even for pregnant and breastfeeding women. Taking this into account, we propose a controlled model by introducing in the Zika model (1)–(2) two control functions and . The control represents protective clothing, insect repellent, and bed-nets to protect pregnant women from infected mosquitoes; while control refers to the insecticide spray applied to the mosquito population. The dynamical control system for Zika transmission that we propose is then given by
The set U of admissible control functions is defined by
Our objective is twofold: first, to minimize the incidence of Zika virus infection among pregnant women, thereby reducing the risk of microcephaly in newborns; second, to decrease the mosquito population responsible for transmission. Achieving these goals involves implementing preventative measures while optimizing budget allocation to minimize costs. To achieve this, we consider the objective functional of the optimal control problem as follows:
where the weight coefficients and are the weights for infected pregnant women and the mosquito population, respectively. Also, the coefficients and are measures of the cost of preventive interventions related to the controls and , respectively.
The optimal control problem consists of determining
associated with an admissible control pair on the time interval , satisfying (3), given initial conditions , , , and and minimizing the objective functional (4), i.e.,
where is the set of admissible trajectories. We achieve the necessary optimality conditions with the help of Pontryagin’s maximum principle (PMP) [18]. Note that the existence of optimal controls is ensured by the convexity of the integrand of the objective functional (4) with regard to the control functions and the fact that the control system (3) satisfies a Lipschitz condition with respect to the state variables , and [19,20].
Theorem 1.
Proof.
Using PMP [18], we obtain the necessary optimality conditions (6)–(8) that an optimal solution must provide. We introduce the Hamiltonian to form the necessary optimality conditions:
We consider the following equations based on the Hamiltonian to obtain the necessary optimality conditions of the problem:
- State equations:
- Adjoint equations:subject to transversality conditions , ;
- Minimality condition:
We enforce these conditions to the Hamiltonian and see that the state Equation (10) correspond to the dynamical system (3); we obtain the costate system (6)–(7) from the costate Equation (11) and transversality conditions; while we obtain the control functions (8) from the minimality condition (12) of the PMP [18]. The proof is complete. □
4. Numerical Simulations: Case Study in Brazil
In this section, we solve numerically the suggested optimal control problem, defined by (3)–(5). For this, we use the fourth-order Runge–Kutta method (see, e.g., [21] for details). We consider the real data publicly available at the WHO, considered in [9], of the confirmed cases of Zika in Brazil between 4 February 2016 and 10 November 2016. According to [9], we consider as initial values = 2,180,686 ( is the number of newborns corresponding to the simulation period) and the number of births in the period, , , and for the human female populations, and , and for the mosquitoes populations. We obtain numerical simulations for a final time (weeks). Also, the parameters of the model (3) are listed in Table 2 (see [9]), and the maximum value of the control is assumed to be .
In Figure 1 and Figure 2, graphical representations depict the transmission dynamics of Zika within women and mosquito populations, with and without implementation of control measures. These visualizations illustrate the efficacy of control measures in averting cases of microcephaly by diminishing the count of infected pregnant women and eradicating the mosquito population responsible for Zika transmission. In Figure 3 and Figure 4, we observe that employing the suggested combination of control measures robustly hampers Zika transmission. The mosquito population is essentially eradicated by the 10th week through the implementation of insecticide spraying control measures. Furthermore, the combined effect of both control measures resulted in a notable reduction in infection cases in pregnant women by the 10th week. A comparison of the control strategies reveals that the two control strategies are the most effective. However, the results also demonstrate that the spraying insecticide measure has a notable impact. Lastly, in Figure 5, while control remains in effect during all time window, control ceases to be effective around the 40th week due to its near-complete elimination of the mosquito population. Additionally, Figure 6, Figure 7, Figure 8, Figure 9, Figure 10 and Figure 11 show comparative results of control strategies, considering different weight coefficients. As illustrated in Figure 6 and Figure 7, an increase in the weight coefficients of the two control strategies is associated with a rise in the number of babies born with microcephaly. This phenomenon occurs concurrently with no discernible impact on the mosquito population. As shown in Figure 8, this phenomenon can be attributed to the diminished rate of exertion associated with the protective measure control in response to an elevated weight coefficient. Although a similar scenario would be expected for only one control strategy, it affects only the behavior of the spraying insecticide control rather than the behavior of the controlled system (see Figure 9, Figure 10 and Figure 11). As a result, it reveals that in all cases, the two control strategies are the most robust for vertical Zika transmission.
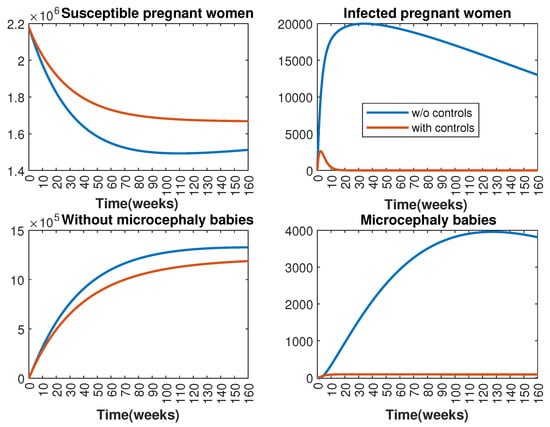
Figure 1.
Effect of control strategies on women population, with and without controls. (Top left): susceptible pregnant women S; (Top right): infected pregnant women I; (Bottom left): women who gave birth to babies without microcephaly W; (Bottom right): women who gave birth to babies with microcephaly M.
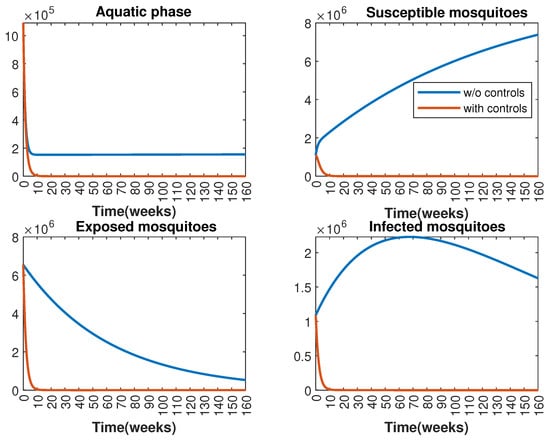
Figure 2.
Effect of control strategies on mosquitoes, with and without controls. (Top left): mosquitoes in the aquatic phase ; (Top right): susceptible mosquitoes ; (Bottom left): exposed mosquitoes ; (Bottom right): infected mosquitoes .
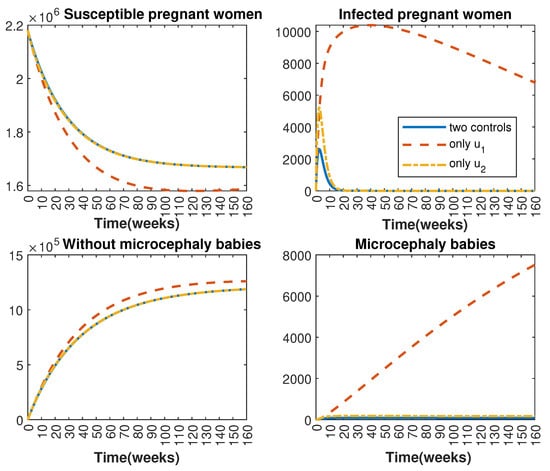
Figure 3.
Comparative impact of the control strategies on women population, considering both controls and one single control or . (Top left): susceptible pregnant women S; (Top right): infected pregnant women I; (Bottom left): women who gave birth to babies without microcephaly W; (Bottom right): women who gave birth to babies with microcephaly M.
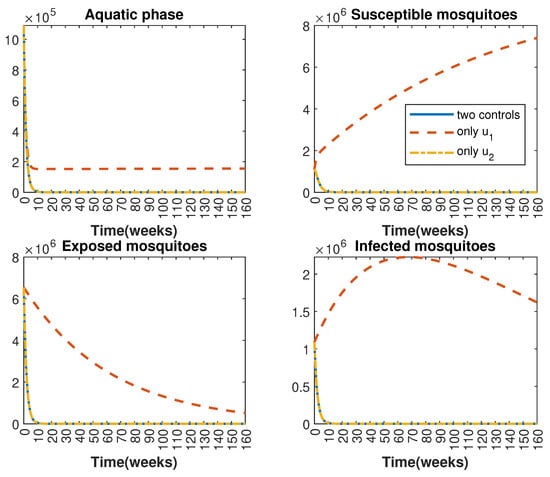
Figure 4.
Comparative impact of the control strategies on mosquitoes, considering both controls and one single control or . (Top left): mosquitoes in the aquatic phase ; (Top right): susceptible mosquitoes ; (Bottom left): exposed mosquitoes ; (Bottom right): infected mosquitoes .
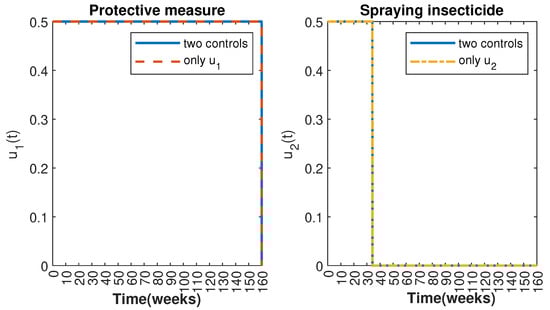
Figure 5.
Control strategies and .
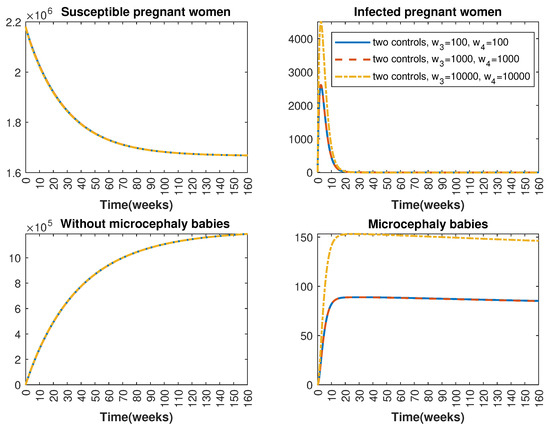
Figure 6.
Comparative impact of control strategies with different weight coefficients on women population, considering two controls. (Top left): susceptible pregnant women S; (Top right): infected pregnant women I; (Bottom left): women who gave birth to babies without microcephaly W; (Bottom right): women who gave birth to babies with microcephaly M.
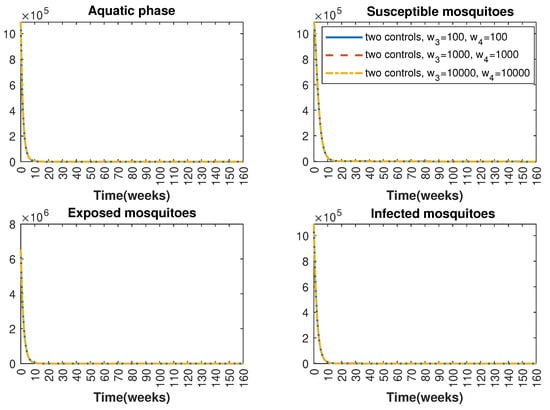
Figure 7.
Comparative impact of control strategies with different weight coefficients on mosquitoes, considering two controls. (Top left): mosquitoes in the aquatic phase ; (Top right): susceptible mosquitoes ; (Bottom left): exposed mosquitoes ; (Bottom right): infected mosquitoes .
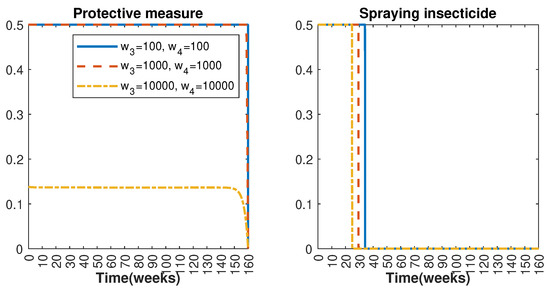
Figure 8.
Control strategies and with weight coefficients and with .
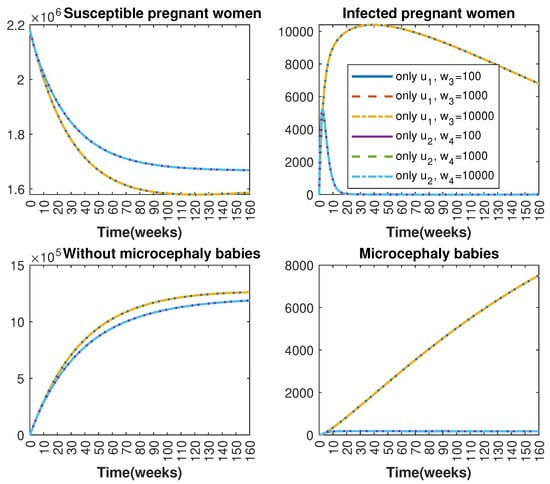
Figure 9.
Comparative impact of control strategies with different weight coefficients on women population, considering one single control or . (Top left): susceptible pregnant women S; (Top right): infected pregnant women I; (Bottom left): women who gave birth to babies without microcephaly W; (Bottom right): women who gave birth to babies with microcephaly M.
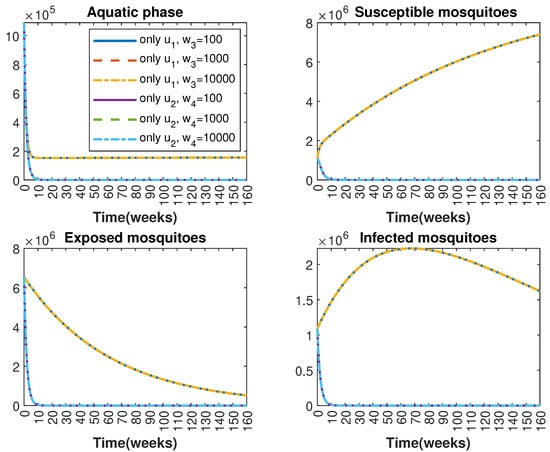
Figure 10.
Comparative impact of control strategies with different weight coefficients on mosquitoes, considering one single control or . (Top left): mosquitoes in the aquatic phase ; (Top right): susceptible mosquitoes ; (Bottom left): exposed mosquitoes ; (Bottom right): infected mosquitoes .
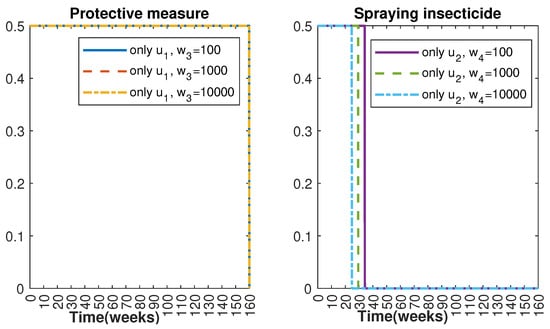
Figure 11.
Control strategy with and (); control strategy with and ().
5. Conclusions
In this study, we have proposed control strategies aimed at thwarting the transmission of Zika virus, known for precipitating neurological disorders like microcephaly. For this purpose, an optimal control problem has been formulated for a model representing the vertical transmission of the Zika virus from infected mothers to infants in Brazil. Our primary objective has been to curtail the incidence of infection among pregnant women and diminish the mosquito population, all while ensuring cost-effectiveness in implementing these strategies. The optimal control problem has been solved via Pontryagin’s maximum principle. Finally, the numerical results have been obtained using the fourth-order Runge–Kutta method with the help of the MATLAB (2021b) numeric computing environment. Through numerical simulations, we have demonstrated that the adoption of these control measures has led to a consistent reduction in the count of infected pregnant women from the outset of the intervention, consequently resulting in a decline in cases of microcephaly.
Author Contributions
Conceptualization, C.J.S. and D.F.M.T.; methodology, D.Y., C.J.S. and D.F.M.T.; software, D.Y.; validation, C.J.S. and D.F.M.T.; formal analysis, D.Y., C.J.S. and D.F.M.T.; investigation, D.Y., C.J.S. and D.F.M.T.; writing—original draft preparation, D.Y., C.J.S. and D.F.M.T.; writing—review and editing, D.Y., C.J.S. and D.F.M.T.; visualization, D.Y.; supervision, D.F.M.T. All authors have read and agreed to the published version of the manuscript.
Funding
This research was funded by Funda ção para a Ciência e a Tecnologia (FCT), grant numbers: UIDB/04106/2020 (https://doi.org/10.54499/UIDB/04106/2020) and UIDP/04106/2020 (https://doi.org/10.54499/UIDP/04106/2020); and project Mathematical Modelling of Multiscale Control Systems: Applications to Human Diseases (CoSysM3), reference 2022.03091.PTDC (https://doi.org/10.54499/2022.03091.PTDC).
Data Availability Statement
Data are contained within the article.
Acknowledgments
D.Y. is grateful to the 2211/A General Domestic Doctoral Scholarship supported by TUBITAK and an Erasmus+ Grant. The authors would like to sincerely thank the two referees for contributing to the initially submitted version with several constructive questions, comments, and suggestions.
Conflicts of Interest
The authors declare no conflicts of interest.
References
- Kindhauser, M.K.; Allen, T.; Frank, V.; Santhana, R.S.; Dye, C. Zika: The origin and spread of a mosquito-borne virus. Bull. World Health Organ. 2016, 94, 675–686. [Google Scholar] [CrossRef] [PubMed]
- World Health Organization. World Health Organization: Fact Sheets About Vector-Borne Diseases. Available online: https://www.who.int/news-room/feature-stories/detail/the-history-of-zika-virus (accessed on 4 November 2024).
- World Health Organization. Zika Virus, Key Facts. Available online: https://www.who.int/news-room/fact-sheets/detail/zika-virus (accessed on 4 November 2024).
- Almeida, R.; Brito da Cruz, A.M.; Martins, N.; Monteiro, M.T.T. An epidemiological MSEIR model described by the Caputo fractional derivative. Int. J. Dyn. Control 2019, 7, 776–784. [Google Scholar] [CrossRef]
- Lemos-Paião, A.P.; Maurer, H.; Silva, C.J.; Torres, D.F.M. A SIQRB delayed model for cholera and optimal control treatment. Math. Model. Nat. Phenom. 2022, 17, 25. [Google Scholar] [CrossRef]
- Yapışkan, D.; Yurtoğlu, M.; Avcı, D.; Eroğlu, B.B.; Bonyah, E. A Novel Model for Monkeypox Disease: System Analysis and Optimal Preventive Strategies. Iran. J. Sci. 2023, 5, 1–13. [Google Scholar]
- Agusto, F.B.; Bewick, S.; Fagan, W.F. Mathematical model of Zika virus with vertical transmission. Infect. Dis. Model. 2017, 2, 244–267. [Google Scholar] [CrossRef] [PubMed]
- Shah, N.H.; Patel, Z.A.; Yeolekar, B.M. Preventions and controls on congenital transmissions of Zika: Mathematical analysis. Appl. Math. 2017, 8, 500–519. [Google Scholar] [CrossRef][Green Version]
- Ndaïrou, F.; Area, I.; Nieto, J.J.; Silva, C.J.; Torres, D.F.M. Mathematical modeling of Zika disease in pregnant women and newborns with microcephaly in Brazil. Math. Meth. Appl. Sci. 2018, 41, 8929–8941. [Google Scholar] [CrossRef]
- Ghaffari, P.; Silva, C.J.; Torres, D.F.M. Mathematical Models and Optimal Control in Mosquito Transmitted Diseases. In Bio-mathematics, Statistics, and Nano-Technologies: Mosquito Control Strategies; Ghaffari, P., Ed.; Chapman and Hall/CRC: Boca Raton, FL, USA, 2023; pp. 143–156. [Google Scholar]
- Eroğlu, B.B.; Yapışkan, D. Optimal Strategies to Prevent COVID-19 from Becoming a Pandemic. In Mathematical Modeling and Intelligent Control for Combating Pandemics; Springer Optimization and Its Applications; Hammouch, Z., Lahby, M., Baleanu, D., Eds.; Springer: Cham, Switzerland, 2023; pp. 39–55. [Google Scholar]
- Esmaili, S.; Eslahchi, M.R.; Torres, D.F.M. Optimal control for a nonlinear stochastic PDE model of cancer growth. Optimization 2024, 73, 2745–2789. [Google Scholar] [CrossRef]
- Yapışkan, D.; Eroğlu, B.B.İ. Fractional optimal control of a generalized SIR epidemic model with vaccination and treatment. In Fractional Dynamics in Natural Phenomena and Advanced Technologies; Baleanu, D., Hristov, J., Eds.; Cambridge Scholars Publishing: Cambridge, MA, USA, 2024; pp. 131–150. [Google Scholar]
- Wang, X.; Shen, M.; Xiao, Y.; Rong, L. Optimal control and cost-effectiveness analysis of a Zika virus infection model with comprehensive interventions. Appl. Math. Comput. 2019, 359, 165–185. [Google Scholar] [CrossRef]
- Okyere, E.; Olaniyi, S.; Bonyah, E. Analysis of Zika virus dynamics with sexual transmission route using multiple optimal controls. Sci. Afr. 2020, 9, e00532. [Google Scholar] [CrossRef]
- Ali, A.; Iqbal, Q.; Asamoah, J.K.K.; Islam, S. Mathematical modeling for the transmission potential of Zika virus with optimal control strategies. Eur. Phys. J. Plus 2022, 137, 146. [Google Scholar] [CrossRef]
- Centers for Disease Control and Prevention. Available online: https://www.cdc.gov/zika/prevention/index.html (accessed on 4 November 2024).
- Pontryagin, L.; Boltyanskii, V.; Gramkrelidze, R.; Mischenko, E. The Mathematical Theory of Optimal Processes; Wiley Interscience: Hoboken, NJ, USA, 1962. [Google Scholar]
- Fleming, W.H.; Rishel, R.W. Deterministic and Stochastic Optimal Control; Springer: New York, NY, USA, 1975. [Google Scholar]
- Cesari, L. Optimization—Theory and Applications: Problems with Ordinary Differential Equations; Springer: New York, NY, USA, 1983. [Google Scholar]
- Lenhart, S.; Workman, J.T. Optimal Control Applied to Biological Models; Chapman & Hall/CRC: Boca Raton, FL, USA, 2007. [Google Scholar]
- Rodrigues, H.S.; Monteiro, M.T.T.; Torres, D.F.M.; Zinober, A. Dengue disease, basic reproduction number and control. Int. J. Comput. Math. 2012, 89, 334–346. [Google Scholar] [CrossRef]


Disclaimer/Publisher’s Note: The statements, opinions and data contained in all publications are solely those of the individual author(s) and contributor(s) and not of MDPI and/or the editor(s). MDPI and/or the editor(s) disclaim responsibility for any injury to people or property resulting from any ideas, methods, instructions or products referred to in the content. |
© 2024 by the authors. Licensee MDPI, Basel, Switzerland. This article is an open access article distributed under the terms and conditions of the Creative Commons Attribution (CC BY) license (https://creativecommons.org/licenses/by/4.0/).