Article

Hybrid Quantum Genetic Algorithm with Fuzzy Adaptive Rotation Angle for Efficient Placement of Unmanned Aerial Vehicles in Natural Disaster Areas

by
Enrique Ballinas
1,
Oscar Montiel
1,*,
Anabel Martínez-Vargas
2 and
Gabriela Rodríguez-Cortés
2
1
Instituto Politécnico Nacional-CITEDI, 1310 Instituto Politécnico Nacional Ave., Nueva Tijuana, Tijuana 22430, Baja California, Mexico
2
Research, Innovation and Graduate Department, Universidad Politécnica de Pachuca, Carretera Pachuca-Cd. Sahagún km 20, Zempoala 43830, Hidalgo, Mexico
*
Author to whom correspondence should be addressed.
Axioms 2024, 13(1), 48; https://doi.org/10.3390/axioms13010048
Submission received: 25 November 2023 / Revised: 10 January 2024 / Accepted: 11 January 2024 / Published: 13 January 2024
(This article belongs to the Special Issue Applications of Quantum Computing in Artificial Intelligence)

Abstract

:
A Hybrid Quantum Genetic Algorithm with Fuzzy Adaptive Rotation Angle (HQGAFARA) is introduced in this work to determine the optimal placements for Unmanned Aerial Vehicles (UAVs) aimed at maximizing coverage in disaster-stricken areas. The HQGAFARA is a hybrid quantum fuzzy meta-heuristic that uses the Deutsch–Jozsa quantum circuit to generate quantum populations synergistically working as haploid recombination and mutation operators that take advantage of quantum entanglement, providing exploitative and explorative features to produce new individuals. In place of the conventional lookup table or mathematical equation, we introduced a fuzzy heuristic to adapt the rotation angle employed in quantum gates. The hybrid nature of this algorithm becomes evident through its utilization of both classical and quantum computing components. Experimental evaluations were conducted using two distinct test sets. The first set, termed the “best case”, represents conditions that are the most favorable for determining the UAV positions, while the second set, the “worst-case”, simulates highly challenging conditions for locating the UAV positions, thereby posing a significant test for the proposed algorithm. We carried out statistical comparative analyses, assessing the HQGAFARA against other hybrid quantum algorithms that employ different rotation angles and against the classical genetic algorithm. The experimental results demonstrated that the HQGAFARA performed comparably, if not better, to the classical genetic algorithm regarding precision. Furthermore, quantum algorithms showcased their computational prowess in experiments related to the convergence time.

1. Introduction

Natural disasters are generally unplanned events that can cause significant losses and, unfortunately, take the lives of thousands of people. Every year, a hurricane, flooding, volcanic eruption, earthquake, or tropical cyclone unleashes its fury and damages some parts of the planet. For example, in 2014, hurricane Odile affected the peninsula of Baja California Sur in Mexico. Although authorities noted that no deaths were registered, at least 239,000 people were left without electricity, representing 90% of the state’s population [1]. In 2015, a devastating earthquake struck Nepal (India) with a magnitude of 7.8 Mw (moment magnitude scale), resulting in over 8700 casualties. This event marked the deadliest earthquake in Nepal since the 8.4 Mw mega-quake of 1934 [2]. The aftermath left hundreds of thousands of Nepalese homeless, and entire villages were flattened. In 2017, Hurricane Maria, boasting wind speeds of 250 km per hour, wreaked havoc in Puerto Rico. The estimated death toll varied between 793 and 8498 victims, with total economic losses reaching approximately US $92 billion  [3]. In 2018, an earthquake occurred 70 km north of Palu, Indonesia. In the aftermath of the earthquake, a devastating tsunami damaged several areas around Palu Bay [4]. In 2021, Haiti registered a magnitude 7.2 earthquake that resulted in approximately 2248 deaths and a total damage cost of around US $1.6 billion [5]. About 60,000 people die in a natural disaster annually [6]. Hence, it is imperative to keep communication systems active to keep people alive and avoid more people dying.
Recently, the use of UAVs as aerial base stations (BSs) has received significant attention due to their low cost, high mobility, cost-effectiveness, and flexible deployment [7,8]. The use of UAVs as aerial BSs to obtain a maximum coverage area in disaster zones has been explored in the last few years. Due to the many possible configurations for locating UAVs, this problem is considered an NP-hard problem [9].
One of the approaches to finding strategic locations for UAVs in disaster zones is meta-heuristics; these algorithms can deal with the above problem, since they can generate high-quality solutions for complex optimization problems [10]. For example, the work in [11] presents a genetic algorithm to locate UAVs in disaster zones. It compares two different representations: binary and floating-point. The experimental results showed that the binary representation performed better. Another similar study using a (1+1) evolution strategy (ES) is shown in [12]. The authors conducted experiments to verify the ES’s performance by varying the number of channels. They concluded that a mobile user perceives less destructive interference as the number of channels per UAV increases. In contrast, the authors in [13] proposed an approximation algorithm based on a Tabu search for positioning UAVs in a disaster zone, such that the throughput is maximized. The results show that strategically placing UAVs can achieve an average throughput improvement of 26%. Work in [14] maximized the area coverage with a given number of UAVs in a post-disaster flood. The authors assumed that the area was obstacle-free. A Particle Swarm Optimization algorithm was used to solve the optimization problem. The results suggest that when the flight height of the UAV is above 120 m, coverage is enhanced by 34% in comparison with a flight height of 100 m. In [15], a hybrid meta-heuristic was introduced to optimize emergency logistics during a disaster. The authors amalgamated two algorithms, Discrete Particle Swarm Optimization (DPSO) and Harris Hawks Optimization (HHO), to address the problem. The outcomes showcased superior accuracy, favoring the hybrid meta-heuristic over other meta-heuristic approaches.
Consequently, the authors in [16] used UAVs to provide coverage when the communications infrastructure is damaged due to a natural disaster. Four multi-objective optimization algorithms were implemented to optimize the placement of available UAVs to provide quality service (QoS) requirements while minimizing energy consumption and maximizing the number of covered targets. An aerial mesh network (AMN) based on IEEE 802.11g technology was used in its optimization model. This technology works in the 2.4 GHz frequency band with a network range of a few meters. Therefore, to provide coverage in extensive affected areas, the number of UAVs may be increased considerably, which conflicts with the constrained number of UAVs that the first responders may have. In contrast, the work presented in [17] optimized UAV locations to maximize the coverage of the emergency first responders (EFRs) while considering the UAV flight time constraint. Nevertheless, in a natural disaster scenario, it is also essential to consider communication services for affected people so that they can ask for help from EFRs, and consequently, EFRs may be aware. Regarding the phenomena that impact the wireless network’s performance, the authors only considered path loss. However, in the design of a wireless network, it is necessary to consider the interference experienced by other EFRs or UAVs, since interference severely deteriorates the quality of a signal. If interference is not considered, it could interrupt the communication services of the EFRs. An emergency network assisted by UAVs was presented by [18]. This network uses the combination of a genetic algorithm and a heuristic approach to optimize the deployment of the minimum number of UAVs required to ensure connectivity for points of interest (POIs) in regions with a high population density. It is important to note that this approach does not consider the presence of first responders within these POIs. The results indicate that the proposed strategy effectively covers all designated POIs. However, the omission of first responders within the POIs implies that individuals in distress in these areas might not be able to access help from stationed first responders. A genetic algorithm was used to optimize the UAVs’ locations in a disaster scenario in [19]. It designs a heterogeneous public safety communication (PSC) network based on LTE-Advanced mobile technology. The UAVs are used as unmanned aerial base stations (UABs) to improve the spectral efficiency (SE) by applying the cell range expansion (CRE) parameter and enhanced intercell interference coordination (eICIC). The potential gains of the SE give the QoS. The results show the network’s performance with different path-loss models and network parameters. Although the results show the suitability of the study, a large number of UAVs are required to provide coverage. In [20], a k-means algorithm is used to find the location of a UAV to minimize the average outage probability in a disaster scenario. The k-means algorithm creates clusters of users according to their positions. Each cluster has a cluster head and cluster members. The nodes use device-to-device (D2D) communication, including multi-hop, to improve the cellular downlink performance. However, it introduces additional delays in the packets delivered. In addition, the network considers just one UAV. In this case, if the UAV fails, the possibility of service continuity may be affected. The service continuity in an emergency scenario may be the difference between the life and death of the people. Therefore, the use of several UAVs could ensure service continuity.
The works mentioned above present classical meta-heuristics to find strategic locations for UAVs. Classical meta-heuristics are algorithms that are implemented in classical computers. These algorithms have demonstrated effectiveness in solving this kind of NP-hard problem. However, we hypothesize that goodness could be improved using a quantum algorithm.
Quantum computing has very interesting properties, such as superposition, quantum entanglement, and quantum parallelism. All of these characteristics make quantum computing a powerful methodology for solving optimization problems. Evolutionary algorithms are meta-heuristics that evolve a set of solutions (population) using operators based on biological evolution. Additionally, they can take advantage of quantum computing properties to solve NP-hard problems, for example, the Knapsack Problem (KP) [21], the Traveling Salesman Problem (TSP) [22], and the problem of finding strategic locations for UAVs to maximize the network coverage [11].
Many studies on evolutionary quantum computing and UAVs primarily focus on the design of path planning. The objective of the path planning task is to find the optimal route from an initial point to a final point, avoiding obstacles [23,24]. In [25], a quantum-behavior-based enhanced fruit fly optimization algorithm (QFOA) for UAV path planning is shown. The QFOA aims to accelerate algorithm convergence and avoid local optimality by incorporating quantum theory into the fruit fly optimization algorithm (FOA). The experimental results demonstrate a better searching ability, stability, and robustness than the FOA. Another swarm intelligence optimization algorithm for solving a UAV path planning problem was proposed in [26]. Here, the authors implemented an adaptive operator and combined the properties of quantum computing with the pigeon-inspired optimization algorithm (PIO) to create a quantum-behaving pigeon-inspired optimization algorithm (QPIO). The adaptive operator improved the global convergence speed of the QPIO. The comparison results indicate that the QPIO performs better than the PSO and the PIO regarding the accuracy and convergence.
A quantum-entanglement pigeon-inspired optimization algorithm for UAV path planning was proposed in [27]; the natural behavior of homing pigeons served as the inspiration for the PIO algorithm. When the PIO was combined with quantum entanglement properties, its convergence velocity and robustness improved. The above was compared with classical evolutionary algorithms. Finally, in [28], a quantum genetic algorithm was used to provide a practical solution for distributed task allocation in an unknown environment with a large-scale network of UAVs. The simulation results demonstrate the superior performance of the proposed methodology compared with that of the NSGA-II.
The results presented by quantum algorithms have demonstrated superiority regarding their accuracy and robustness compared with classical algorithms solving UAV path planning problems [25,26,27,28] Although path planning problems are not the main objective of this paper, this kind of problem is classified as NP-hard [29] just like the problem addressed here. Therefore, quantum algorithms have the potential to solve NP-hard problems efficiently.
This work presents three contributions to the state-of-the-art technology:
1.
We introduce the first algorithm that is capable of running on a quantum computer, efficiently addressing the challenge of locating UAVs in disaster zones.
2.
To enhance the performance of our HQGAFARA (Hybrid Quantum Genetic Algorithm with Fuzzy Adaptive Rotation Angle), we incorporate fuzzy logic, a technique that effectively manages uncertainties in complex mathematical models. Implementing a fuzzy adaptive rotation angle enables flexible manipulation of the quantum gate rotation angle. In contrast, using an adaptive rotation angle based on a mathematical equation restricts qubit-state rotation to a single direction.
3.
Our approach integrates a quantum recombination operator based on the Deutsch–Jozsa circuit. This addition endows the algorithm with quantum advantages, including quantum parallelism, entanglement, and quantum haploid recombination and mutation, which all synergistically enhance its capabilities. These attributes are unattainable with classical computing methods.
The organization of this paper is as follows: Section 2 shows the main theoretical concepts involved in this paper. Section 3 depicts the structure of the proposed HQGAFARA to locate the strategic positions of UAVs in an affected area. Section 4 presents the experiments and results obtained when implementing HQGAFARA in the IBM Qiskit simulator. Finally, Section 5 contains the findings, and we give some directions for future work.

2. Theoretical Framework

Quantum computing is a field that leverages principles from quantum mechanics, including quantum entanglement, superposition, and quantum parallelism, to formulate quantum algorithms. These quantum characteristics enable quantum computers to process information millions of times faster than the most powerful supercomputer in the world [30,31]. Considering the characteristics above, the design of quantum algorithms is becoming increasingly attractive.
At present, quantum bits (qubits) are very noisy, generating inaccurate results. This noise imposes some restrictions on the application of quantum algorithms in real applications, such as a limited number of physical qubits available for developing algorithms, quantum circuit depth, decoherence of information, and the loss of qubit states due to the propagation time. The above-mentioned restrictions are part of the noisy intermediate-scale quantum (NISQ) era [32].
A method used to decrease the coherency lost in quantum computations is the use of hybrid quantum programming, which uses classical and quantum calculations to perform a programming task. The classical computer will submit a job to the quantum computer to perform algorithmic tasks; the results are returned to the classical computer. The classical computer will create quantum circuits, which are sent again as a job to the quantum computer. This process is repeated until a termination criterion is satisfied.
Quantum-inspired algorithms are methods that were developed when quantum computers were not available. Therefore, the first attempts were executed on classical computers. Although they use some quantum mechanics principles, such as superposition and quantum entanglement, they cannot exploit these quantum characteristics. In the literature, most quantum-inspired algorithms address path-planning problems (see Section 1). Compared with classical algorithms, our approach offers the previously mentioned quantum advantages.

2.1. Quantum Computing

A classical computer uses bits to store information, whereas a quantum computer uses quantum bits or qubits. A qubit is a unit of information described in a two-dimensional Hilbert space [33]. Mathematically, a qubit, say | ψ , is represented as a matrix of the complex numbers c 0 and c 1 ,
| ψ = c 0 | 0 + c 1 | 1 c 0 c 1
where | c 0 | 2 + | c 1 | 2 = 1 . Thus, | c 0 | 2 and | c 1 | 2 represent the probability of finding the qubit after being measured in the states |0〉 and |1〉, respectively [33,34]. Quantum systems use the Dirac notation to describe their states. For each “ket” | ψ , there is a corresponding “bra” ψ | ; both are dual, that is,
ψ | = c 0 * 0 | + c 1 * 1 | = ( c 0 * c 1 * ) .
A qubit is always in the superposition state. This is the ability to exist simultaneously in more than one location or, mathematically speaking, to be in two different basis states, in our case, the computational basis | 0 , | 1 . Similarly, a quantum register of n-qubits can be found in superpositions in any of the possible 2 n states | 00 0 , | 00 1 , , | 11 1 . In general, the state of a quantum register of two qubits is represented as
| ψ = c 0 | 00 + c 1 | 01 + c 2 | 10 + c 3 | 11
where | c 0 | 2 + | c 1 | 2 + | c 2 | 2 + | c 3 | 2 = 1 . This means that we can handle many bit strings in a single quantum register.
The general form used to represent a quantum register of n-qubits is
| ψ = c 0 | 00 0 + c 1 | 00 1 + + c 2 n 1 | 11 1 = i = 0 2 n 1 c i | i ,
where i = 0 2 n 1 | c i | 2 = 1 and |i〉 represent the eigenstates of the computational base whose bit values are equivalent to the decimal number expressed in base notation 2.

2.2. Quantum Inspired Algorithms

In 1996, quantum mechanics concepts were introduced in [35] to develop more efficient quantum evolutionary methods. Their primary goal was to compare the performances of classical and quantum-inspired algorithms in solving the Traveling Salesman Problem (TSP). The experiments showcased the superiority of the quantum-inspired algorithm in terms of both the convergence rate and the final results compared to the classical algorithm. Another analogous proposal was put forth in [36], where the authors recognized the potential of a quantum algorithm for addressing NP-hard problems.
The two pioneering works in evolutionary quantum computing are the Genetic Quantum Algorithm (GQA) [37] and the Quantum-Inspired Evolutionary Algorithm (QEA) [38]. The GQA is based on the concepts and principles of quantum mechanics, such as superposition and entanglement. The 0–1 Knapsack Problem (0–1 KP) was employed to assess the GQA’s performance. The results illustrated the efficacy and applicability of the GQA for solving the 0–1 KP [37]. All experiments were conducted on a classical computer.
Quantum genetic algorithms have excellent global searchability due to the population’s diversity caused by its probabilistic representation of superposed information. This capability causes the quantum handling of information to surpass conventional representation, storage, and handling. For example, for problems requiring only one quantum register of 32 qubits, a classical computer would need 4,294,967,296 memory registers to handle the same quantity of information, which is significant.
The QEA is the improved version of the GQA. The QEA was also designed to solve the 0–1 KP. The process of finding the optimal solution is similar to that used in the GQA. The main difference between both proposals is the migration concept introduced by the QEA. This process induces a variation in the probabilities of quantum chromosomes [39].
The interaction between quantum computing and evolutionary computation can be described in three ways [40]: The first is known as the Evolutionary-Designed Quantum Algorithm (EDQA). In this case, we use genetic programming to create new algorithms. The second approach is the Quantum Evolutionary Algorithm (QEA). The QEA was designed to develop evolutionary algorithms for quantum computers. Lastly, a Quantum-Inspired Evolutionary Algorithm (QIEA) is presented. The QIEA uses some quantum mechanics concepts to create evolutionary methods for implementation on classical computers. The Quantum-Inspired Acromyrmex Evolutionary Algorithm is a novel methodology proposed in this category [41]. Nowadays, various companies, including Google [42], IBM [43], and D-wave [44], have developed quantum computers with the goal of achieving quantum supremacy. Quantum supremacy entails the ability of a quantum computer to solve a problem in seconds or minutes, whereas a classical computer would require years to accomplish the same task.
At present, we are in the noisy intermediate-scale quantum (NISQ) era, which is characterized by imperfect control over the qubits because of the noise, introducing errors that play an essential role in the results. The most viable option so far is to combine classical computing components with quantum computing, i.e., to design hybrid algorithms [32,45]. These classic elements perform several tasks, such as data preparation, parameter selection, post-processing, and analysis, and play specific but powerful roles in the acceleration or co-processing of certain problems.

2.3. The Deutsch–Jozsa Algorithm

The physicist David Deutsch introduced a quantum algorithm that predicts quantum supremacy over classical computers. This quantum algorithm is the Deutsch algorithm and can solve a problem faster than a classic algorithm. The problem is as follows: Let x be a binary number of n bits, and f ( x ) be a function that generates a single output value (0 or 1) for each value of x. In advance, it is known that the function can only have two states: constant, if f ( x ) returns the same value for all n inputs, or balanced, if f ( x ) generates half of the outputs with a value (for example, 0) and the other half with a different value (for example, 1) [46]. Deutsch and Richard Jozsa presented improvements to the original algorithm, obtaining the Deutsch–Jozsa algorithm [47]. In this algorithm, f ( x ) is a “black box” function (also called an Oracle), which always provides the correct value to a given input value x. By calling the Oracle, we can determine whether f ( x ) is constant or balanced; this quantum algorithm requires only one call to provide the correct answer independently of the input size. On the other side, a classical computer would need to call the Oracle 2 n 1 + 1 times using classical programming [46,48,49,50]; thus, the number of times that the Oracle is called grows exponentially as the input (bit string) becomes more extensive. Therefore, the quantum computer provides exponential acceleration. Figure 1 shows the Deutsch–Jozsa circuit that implements this algorithm. The circuit comprises Hadamard gates and an Oracle-based on C-NOT quantum gates represented by U f . The C-NOT gates operate with two qubits: a control qubit and a target qubit. In the figure, the last qubit (from top to bottom) is the target qubit; the rest are control qubits. In this case, the target qubit should be in state one (|1〉) to provide a phase kickback to the information presented to this Oracle; otherwise, a Pauli-X gate should be added to this input.
Figure 1 shows the structure of the Deutsch–Jozsa quantum circuit. The process used to evaluate the x inputs, where x = x 1 , x 2 , , x n , is as follows: first, we need to set n qubits in z-basis states according to | ψ 0 = | 0 n | 1 , where n is the number of qubits. Next, we apply Hadamard gates to each of the qubits to set them in a superposition state, as shown in | ψ 1 = 1 2 n + 1 x = 0 2 n 1 | x ( | 0 | 1 ) . The Oracle works as follows: U f ( | x n | y ) = | x n | y f ( x ) , where | y = | = | 0 | 1 2 , and for each x, the value of f ( x ) can be 0 or 1. Therefore, by applying the quantum Oracle to | ψ 1 , we have
| ψ 2 = 1 2 n + 1 x = 0 2 n 1 | x ( | f ( x ) | 1 f ( x ) ) = 1 2 n + 1 x = 0 2 n 1 | x ( | | 0 | 1 ) .
At this point, quantum entanglement has been achieved. Here, we do not need to measure the last qubit; hence, we apply Hadamard gates to control the qubits to obtain Equation (6), where x · y is given by x 0 y 0 x 1 y 1 x n 1 y n 1 :
| ψ 3 = 1 2 n x = 0 2 n 1 ( 1 ) f ( x ) y = 0 2 n 1 ( 1 ) x · y | y = 1 2 n y = 0 2 n 1 x = 0 2 n 1 ( 1 ) f ( x ) ( 1 ) x · y | y .
The last step is to measure the control qubits. Note that the probability used to measure a zero state is | 0 n = | 1 2 n x = 0 2 n 1 ( 1 ) f ( x ) | 2 .
HQGAFARA uses the Deutsch–Jozsa circuit as a quantum operator that mimics haploid recombination and performs mutations. Using this circuit, we found that convergence to optimal values could be improved without sacrificing exploratory features.

2.4. Disaster Zone Model

Approximately 60,000 people die due to natural disasters each year, representing 0.1% of global deaths [6]. Often, these fatalities are a result of communication systems collapsing during a natural disaster. It is crucial for emergency services to be well-prepared to respond immediately and prevent further losses of lives. One potential solution is to equip first responders with UAVs that can be temporarily deployed as airborne base stations, connecting victims and emergency personnel. Identifying strategic locations for deploying UAVs in the affected area is essential to cover as many mobile users (MUs) as possible within the disaster zone. UAVs function as LTE access points that facilitate information routing through the network.
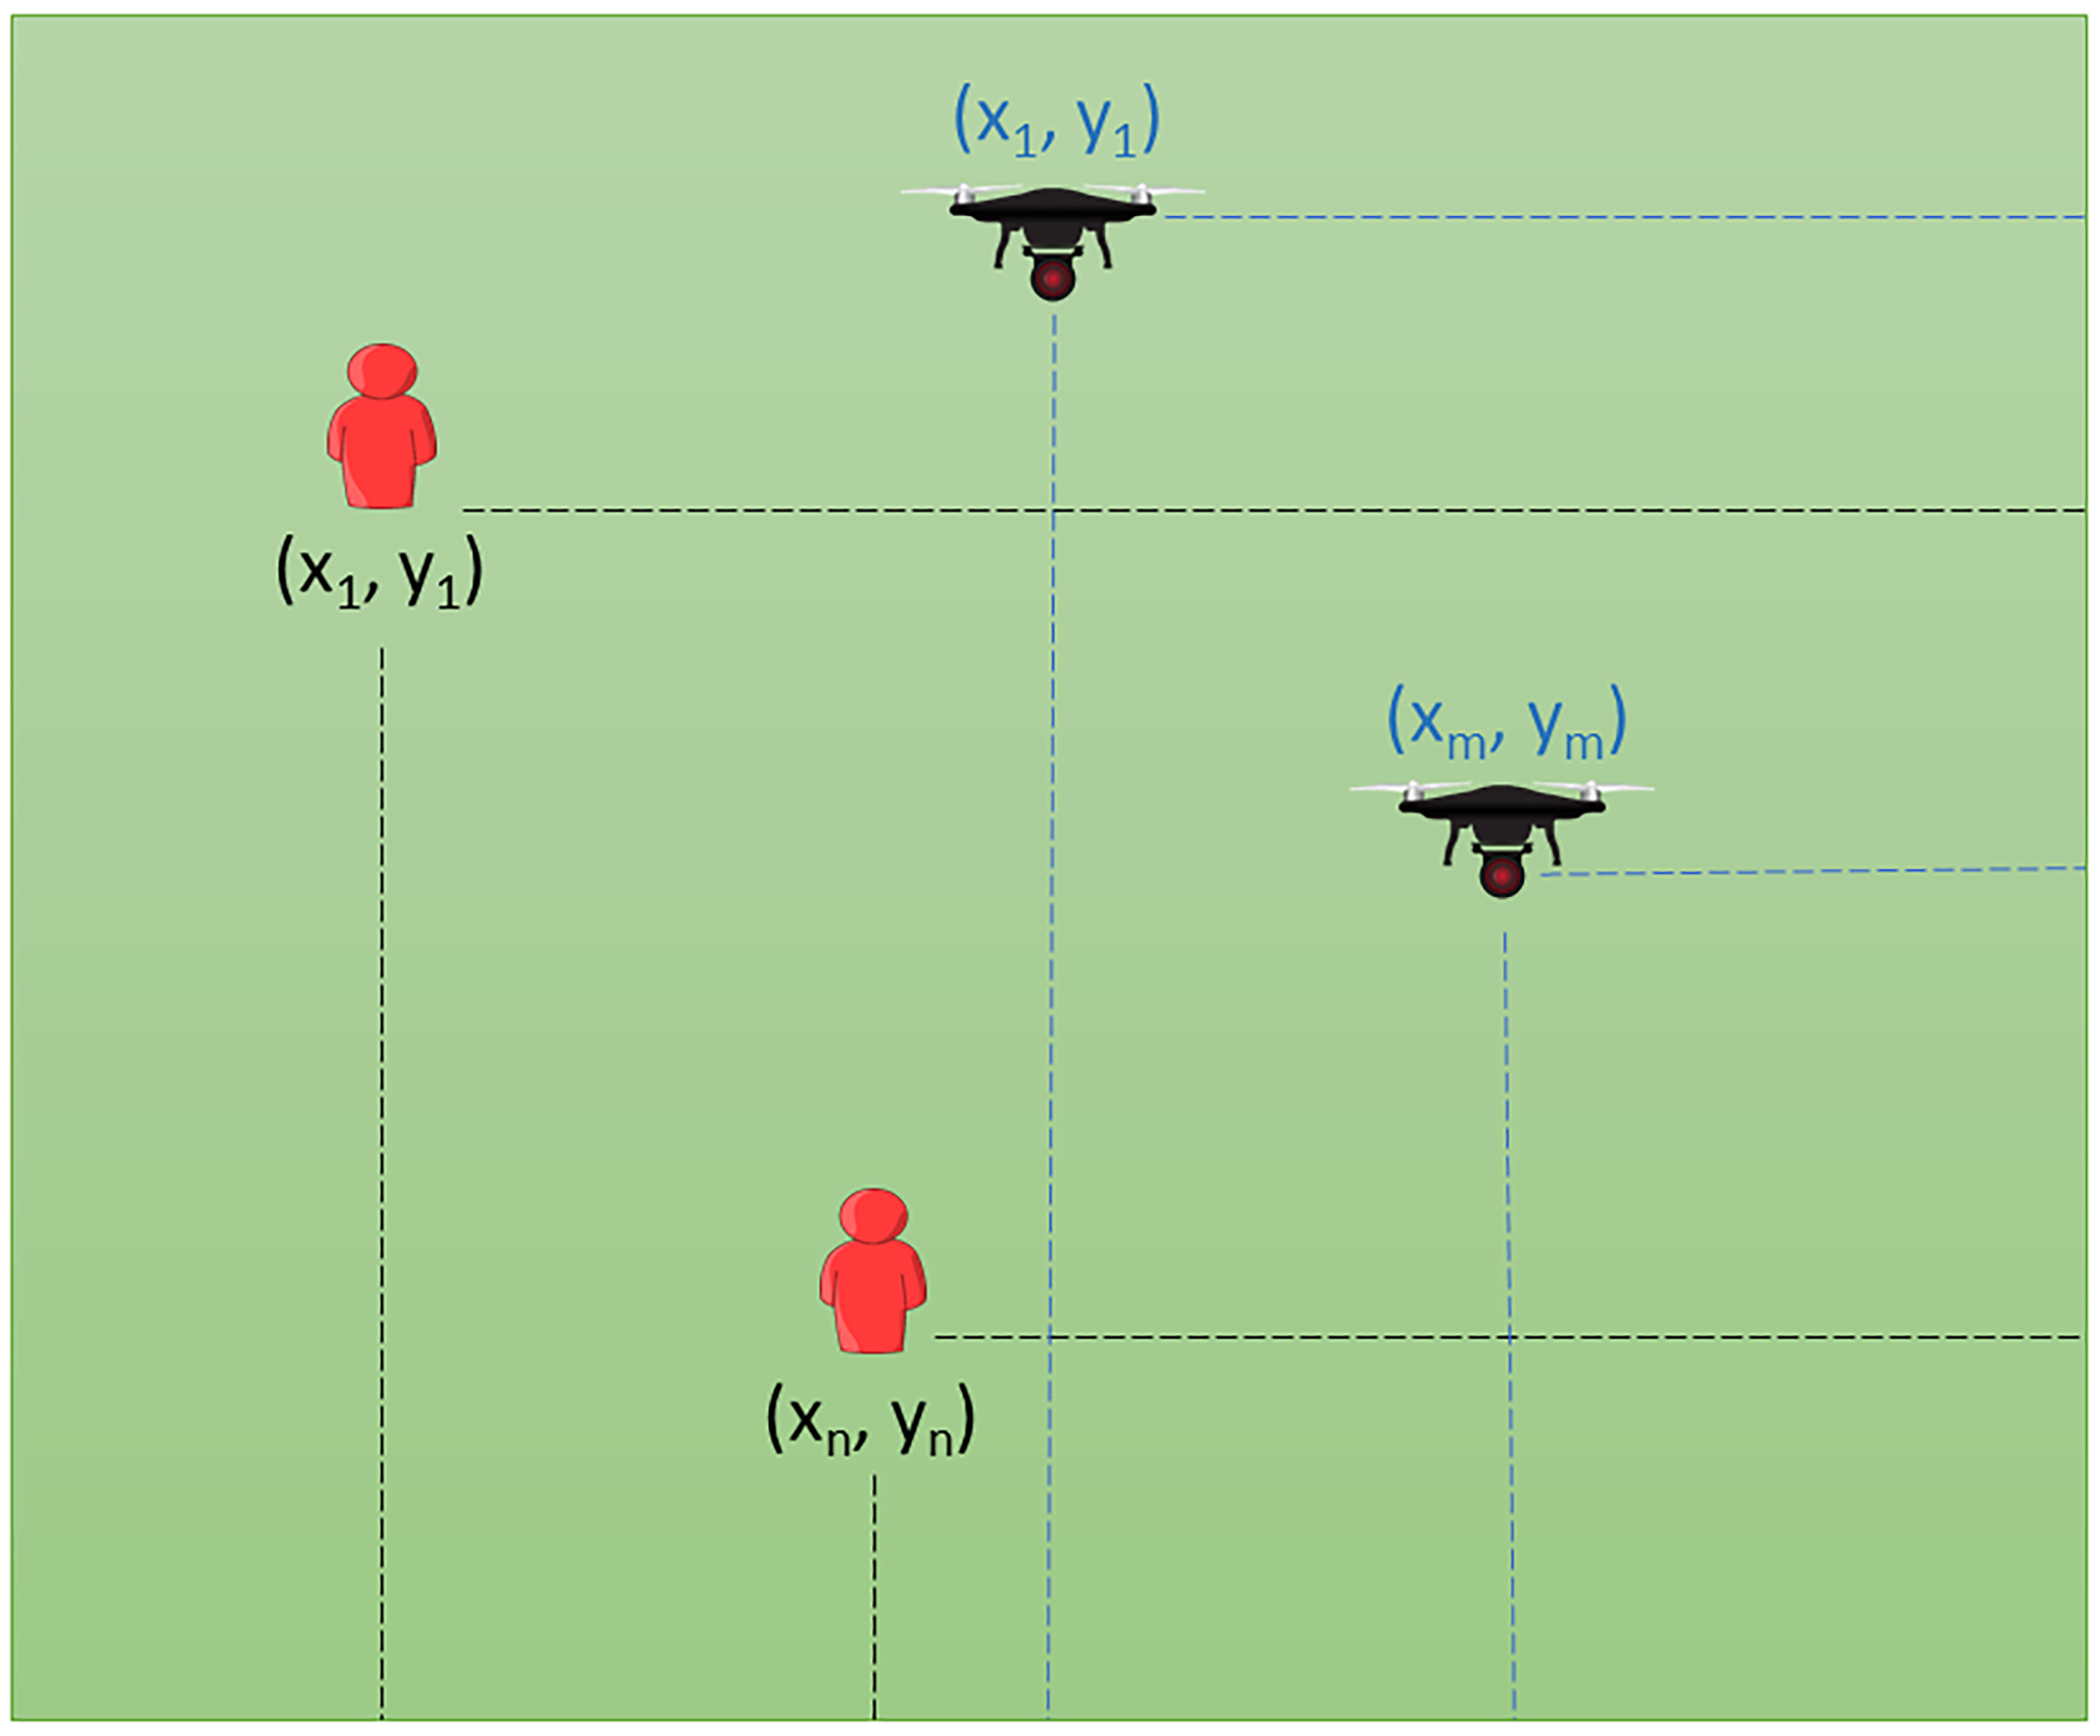
Figure 2 visually portrays the scenario developed for the simulation in this study. The simulated area affected by the natural disaster is outlined as a two-dimensional space confined within L × L m 2  [12]; it is limited by [ X m a x , X m a x ] and [ Y m a x , Y m a x ], with its origin at (0, 0). The set of UAVs is M = { ( x 1 , y 1 ) , , ( x m , y m ) }, where ( x i , y i ) is the Cartesian coordinate of a UAV. i is the index of the set of UAVs, ranging from 1 to m, where m = M . The set of MUs is N = { ( x 1 , y 1 ) , , ( x n , y n ) }, where ( x j , y j ) is the Cartesian coordinate of a MU. j is the index of the set of MUs, ranging from 0 to n, where n = N  [12].

2.5. Objective Function and Restrictions

Given several MUs with known locations, the objective function in (7) aims to find UAVs’ locations to maximize the network coverage, as follows [11,12]:
Maximize C = v / n .
In this context, v represents the specific count of MUs covered by the UAVs, while n denotes the total number of MUs within the affected area ( n 0 ). Let us consider a hypothetical scenario involving an emergency rescue team equipped with a fleet of four UAVs, tasked with managing a total of 400 MUs (n) in the disaster area. Within this fleet, only 120 MUs (v) are effectively covered by the deployed UAVs. The coverage metric (C) can be computed as the ratio of covered MUs to the total nymber available, resulting in a value of C = 0.3 or 30 percent. This implies that, by utilizing the available four UAVs, the rescue team can effectively attend to 30 percent of the individuals requiring assistance on the ground. The optimal coverage value, denoted by 1, signifies a scenario where 100% of the MUs are encompassed within the UAVs’ coverage area. This benchmark represents complete coverage, indicating the ideal state where all individuals in need are reached by the UAVs.
We apply the Hata propagation model for urban areas and an operation frequency f c of 700 MHz to calculate the path loss. The path loss L p between the i-th UAV and the j-th MU is given by
L p ( ( x i , y i ) , ( x j , y j ) ) ( d B ) = A + B log 10 ( d ( ( x i , y i ) , ( x j , y j ) ) )
where A and B are constants. d ( ( x i , y i ) , ( x j , y j ) ) is the distance between the Cartesian coordinates of the i-th UAV and the Cartesian coordinates of the j-th MU.
This paper considers the quality of service (QoS) in a signal-to-interference ratio (SIR), which indicates how much interference a MU perceives when a set of MUs is transmitted over the same channel.
The SIR in the j-th MU is given by [12]:
S I R ( x j , y j ) ( d B ) = P t x ( x i , y i ) + L p ( ( x i , y i ) , ( x j , y j ) ) I
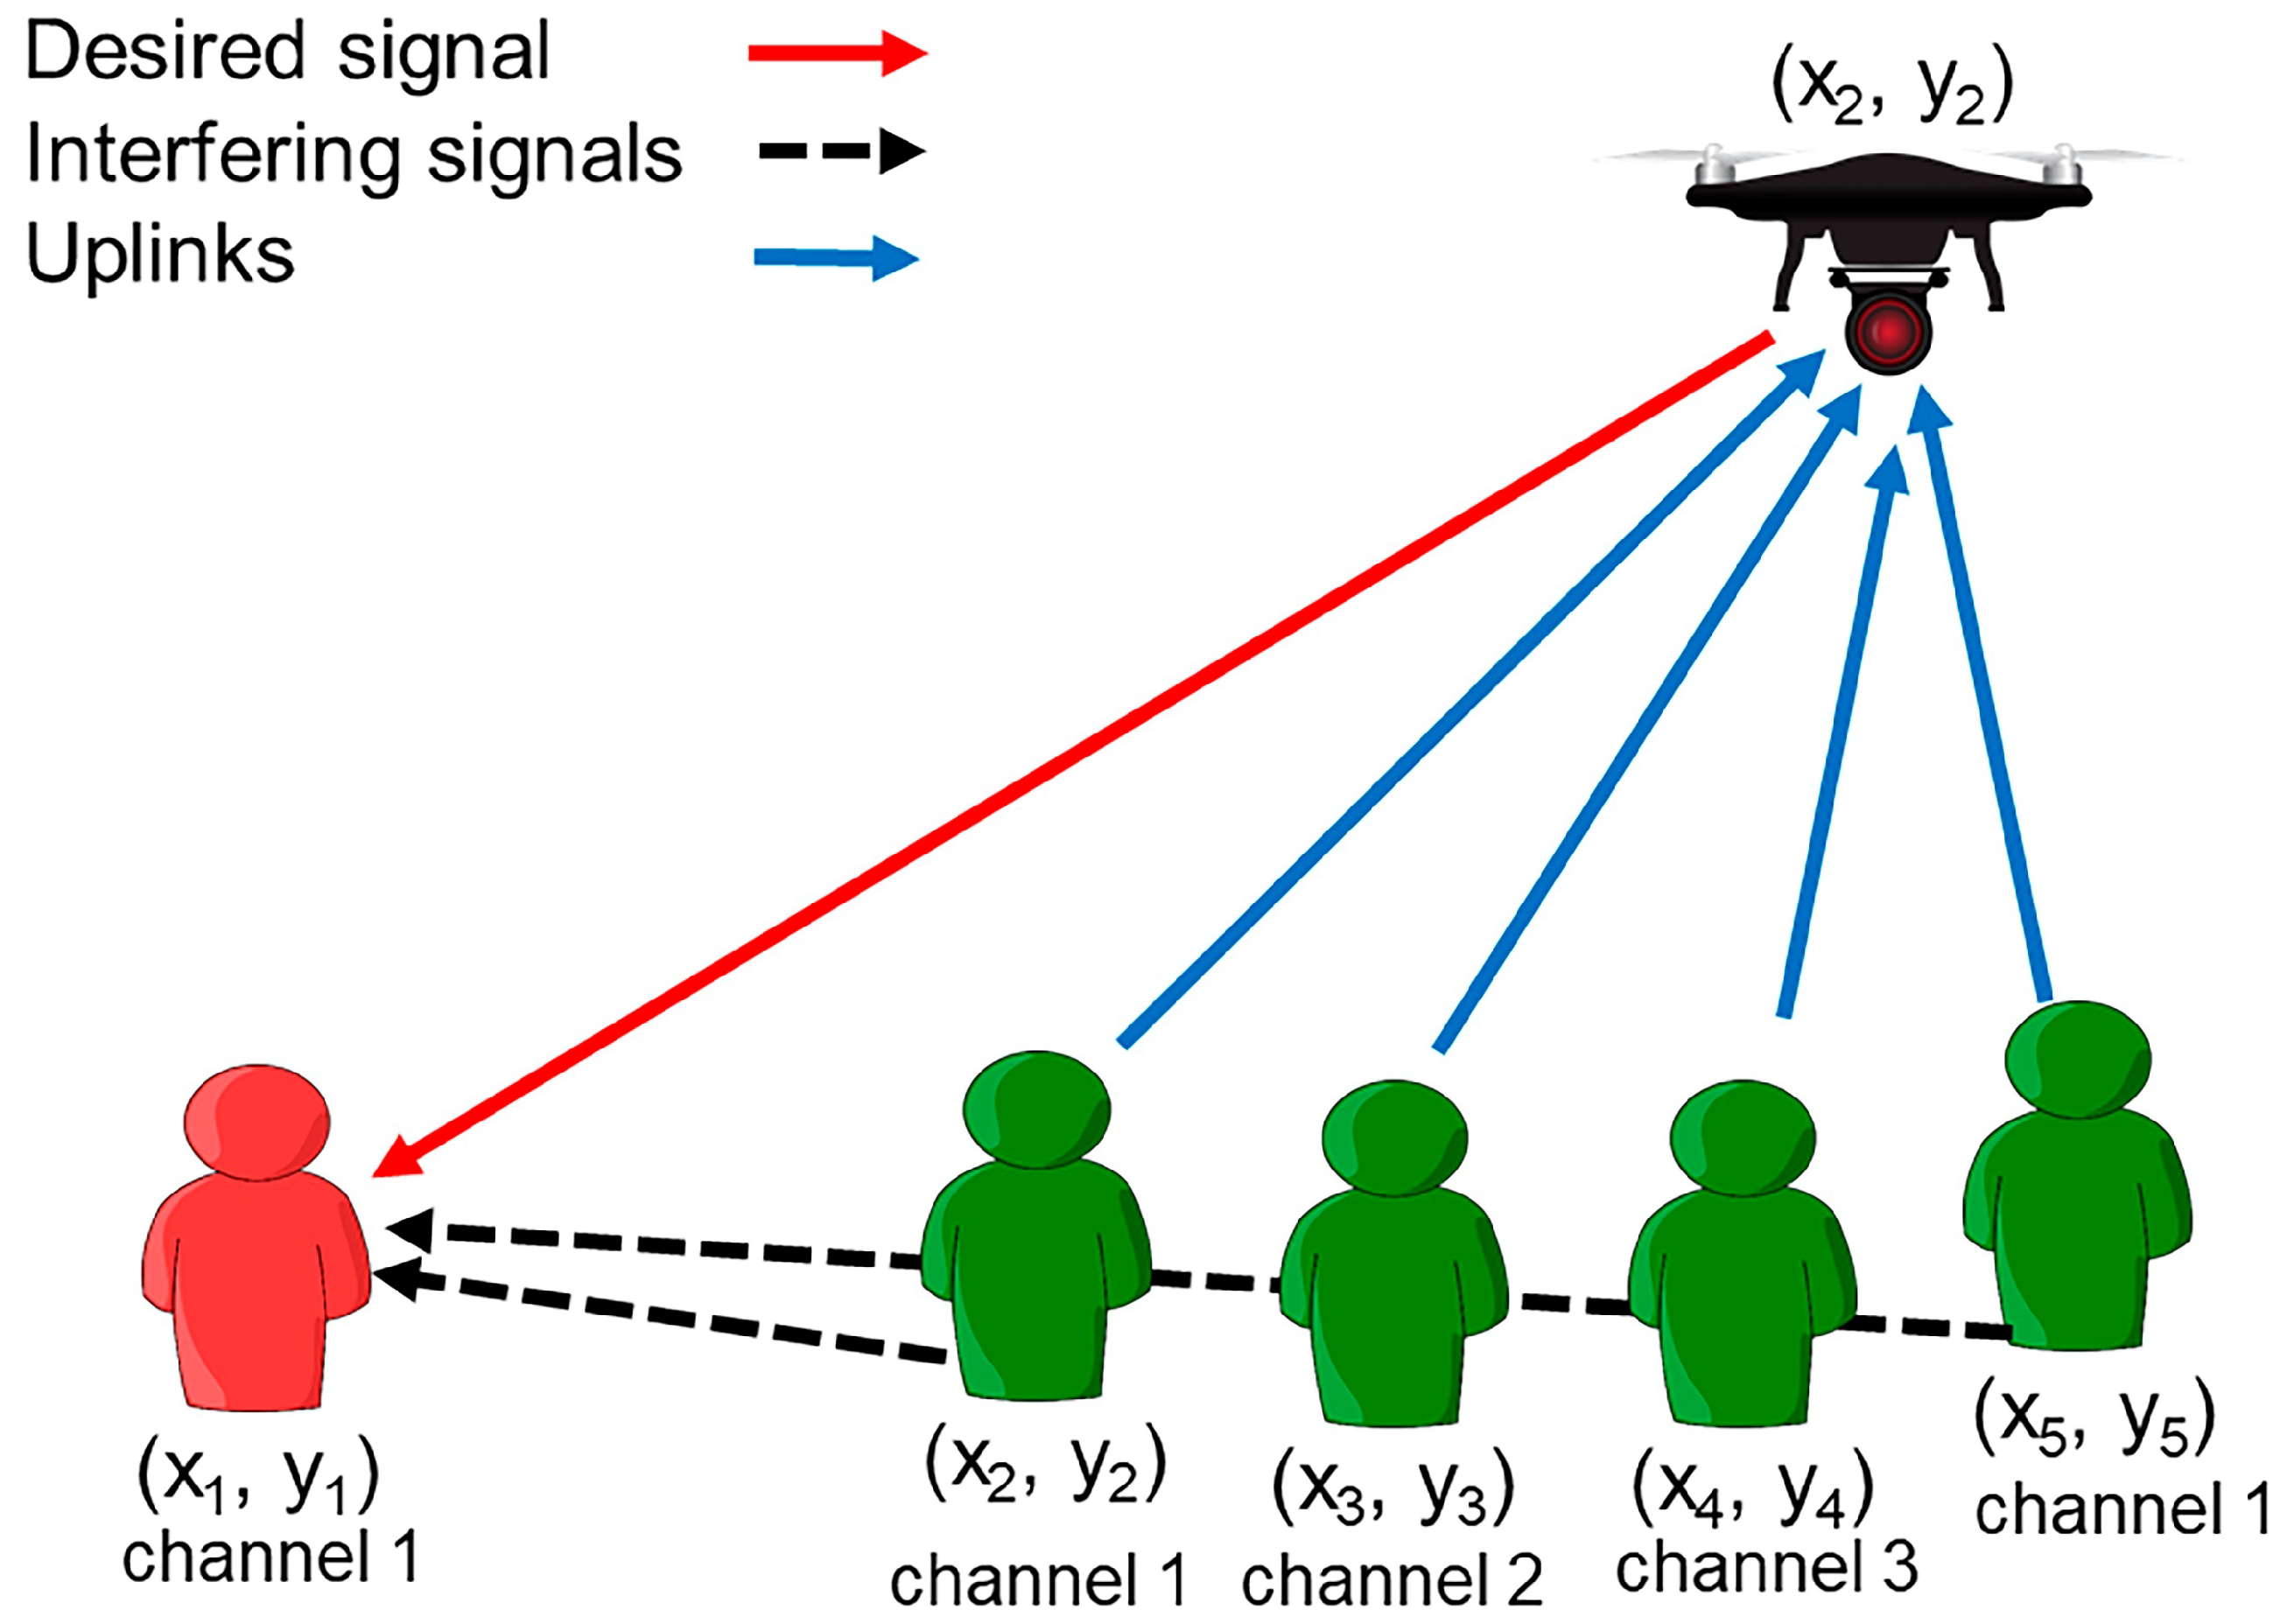
where P t x ( x i , y i ) is the transmission power of the i-th UAV. L p ( ( x i , y i ) , ( x j , y j ) ) is the path loss from the i-th UAV to the j-th MU in the desired signal (see Figure 3). I is the total interference and is given by
I = k K P t x ( x k , y k ) d ( ( x k , y k ) , ( x j , y j ) ) δ
where P t x ( x k , y k ) is the transmission power of the k-th MU interferer. k refers to the MU transmitting on the identical channel as the j-th MU within the desired signal, as depicted in Figure 3. The above strategy is referred to as spectrum sharing [51]. The variable k falls within the range of 0 k K , where K represents the set of MUs transmitting on the same channel. This set is commonly known as the set of interferers. The term d ( ( x k , y k ) , ( x j , y j ) ) denotes the Euclidean distance between the k-th interferer and the j-th MU. The parameter δ represents the attenuation factor, taking a value between 2 and 4.
Figure 3 depicts the SIR in the j-th MU in the desired signal. The interferers are ( x 2 , y 2 ) and ( x 5 , y 5 ), since they transmit over the same channel as ( x 1 , y 1 ) .
The association between the j-th MU and the i-th UAV occurs based on adherence to the following constraints [12]:
d ( ( x i , y i ) , ( x j , y j ) ) 2000 m ,
L p ( ( x i , y i ) , ( x j , y j ) ) 120 dB ,
S I R ( x j , y j ) 3 dB ,
N j M i N j M l l i .
The condition described in (11) indicates the inclusion of the j-th MU within the coverage area of the i-th UAV. Consequently, the equation stated in (12) governs the permissible path loss between the i-th UAV and the j-th MU, ensuring it remains within the predefined threshold value. The thresholds, defined in Equations (11) and (12), are derived from exhausted simulations aimed at mitigating interference. Moreover, Equation (13) stipulates that successful voice transmission is contingent upon maintaining the SIR above 3 dB at the j-th MU. Finally, Equation (14) delineates the sole association of the j-th MU with the i-th UAV, where 0 < l m , 0 < i m , and 0 j n .

3. Materials and Methods

An HQGAFARA to locate UAVs to maximize coverage in disaster zones is presented in this section. The HQGAFARA uses a Deutsch–Jozsa circuit (see Figure 1) and quantum rotation gates as a quantum operator to update the quantum population. The Deutsch–Jozsa circuit works similarly to the recombination operator used in classical evolutionary algorithms; quantum rotation gates with adaptive rotation angles refine the final solutions to improve the convergence of the HQGAFARA.

Hybrid Quantum Genetic Algorithm with Fuzzy Adaptive Rotation Angle

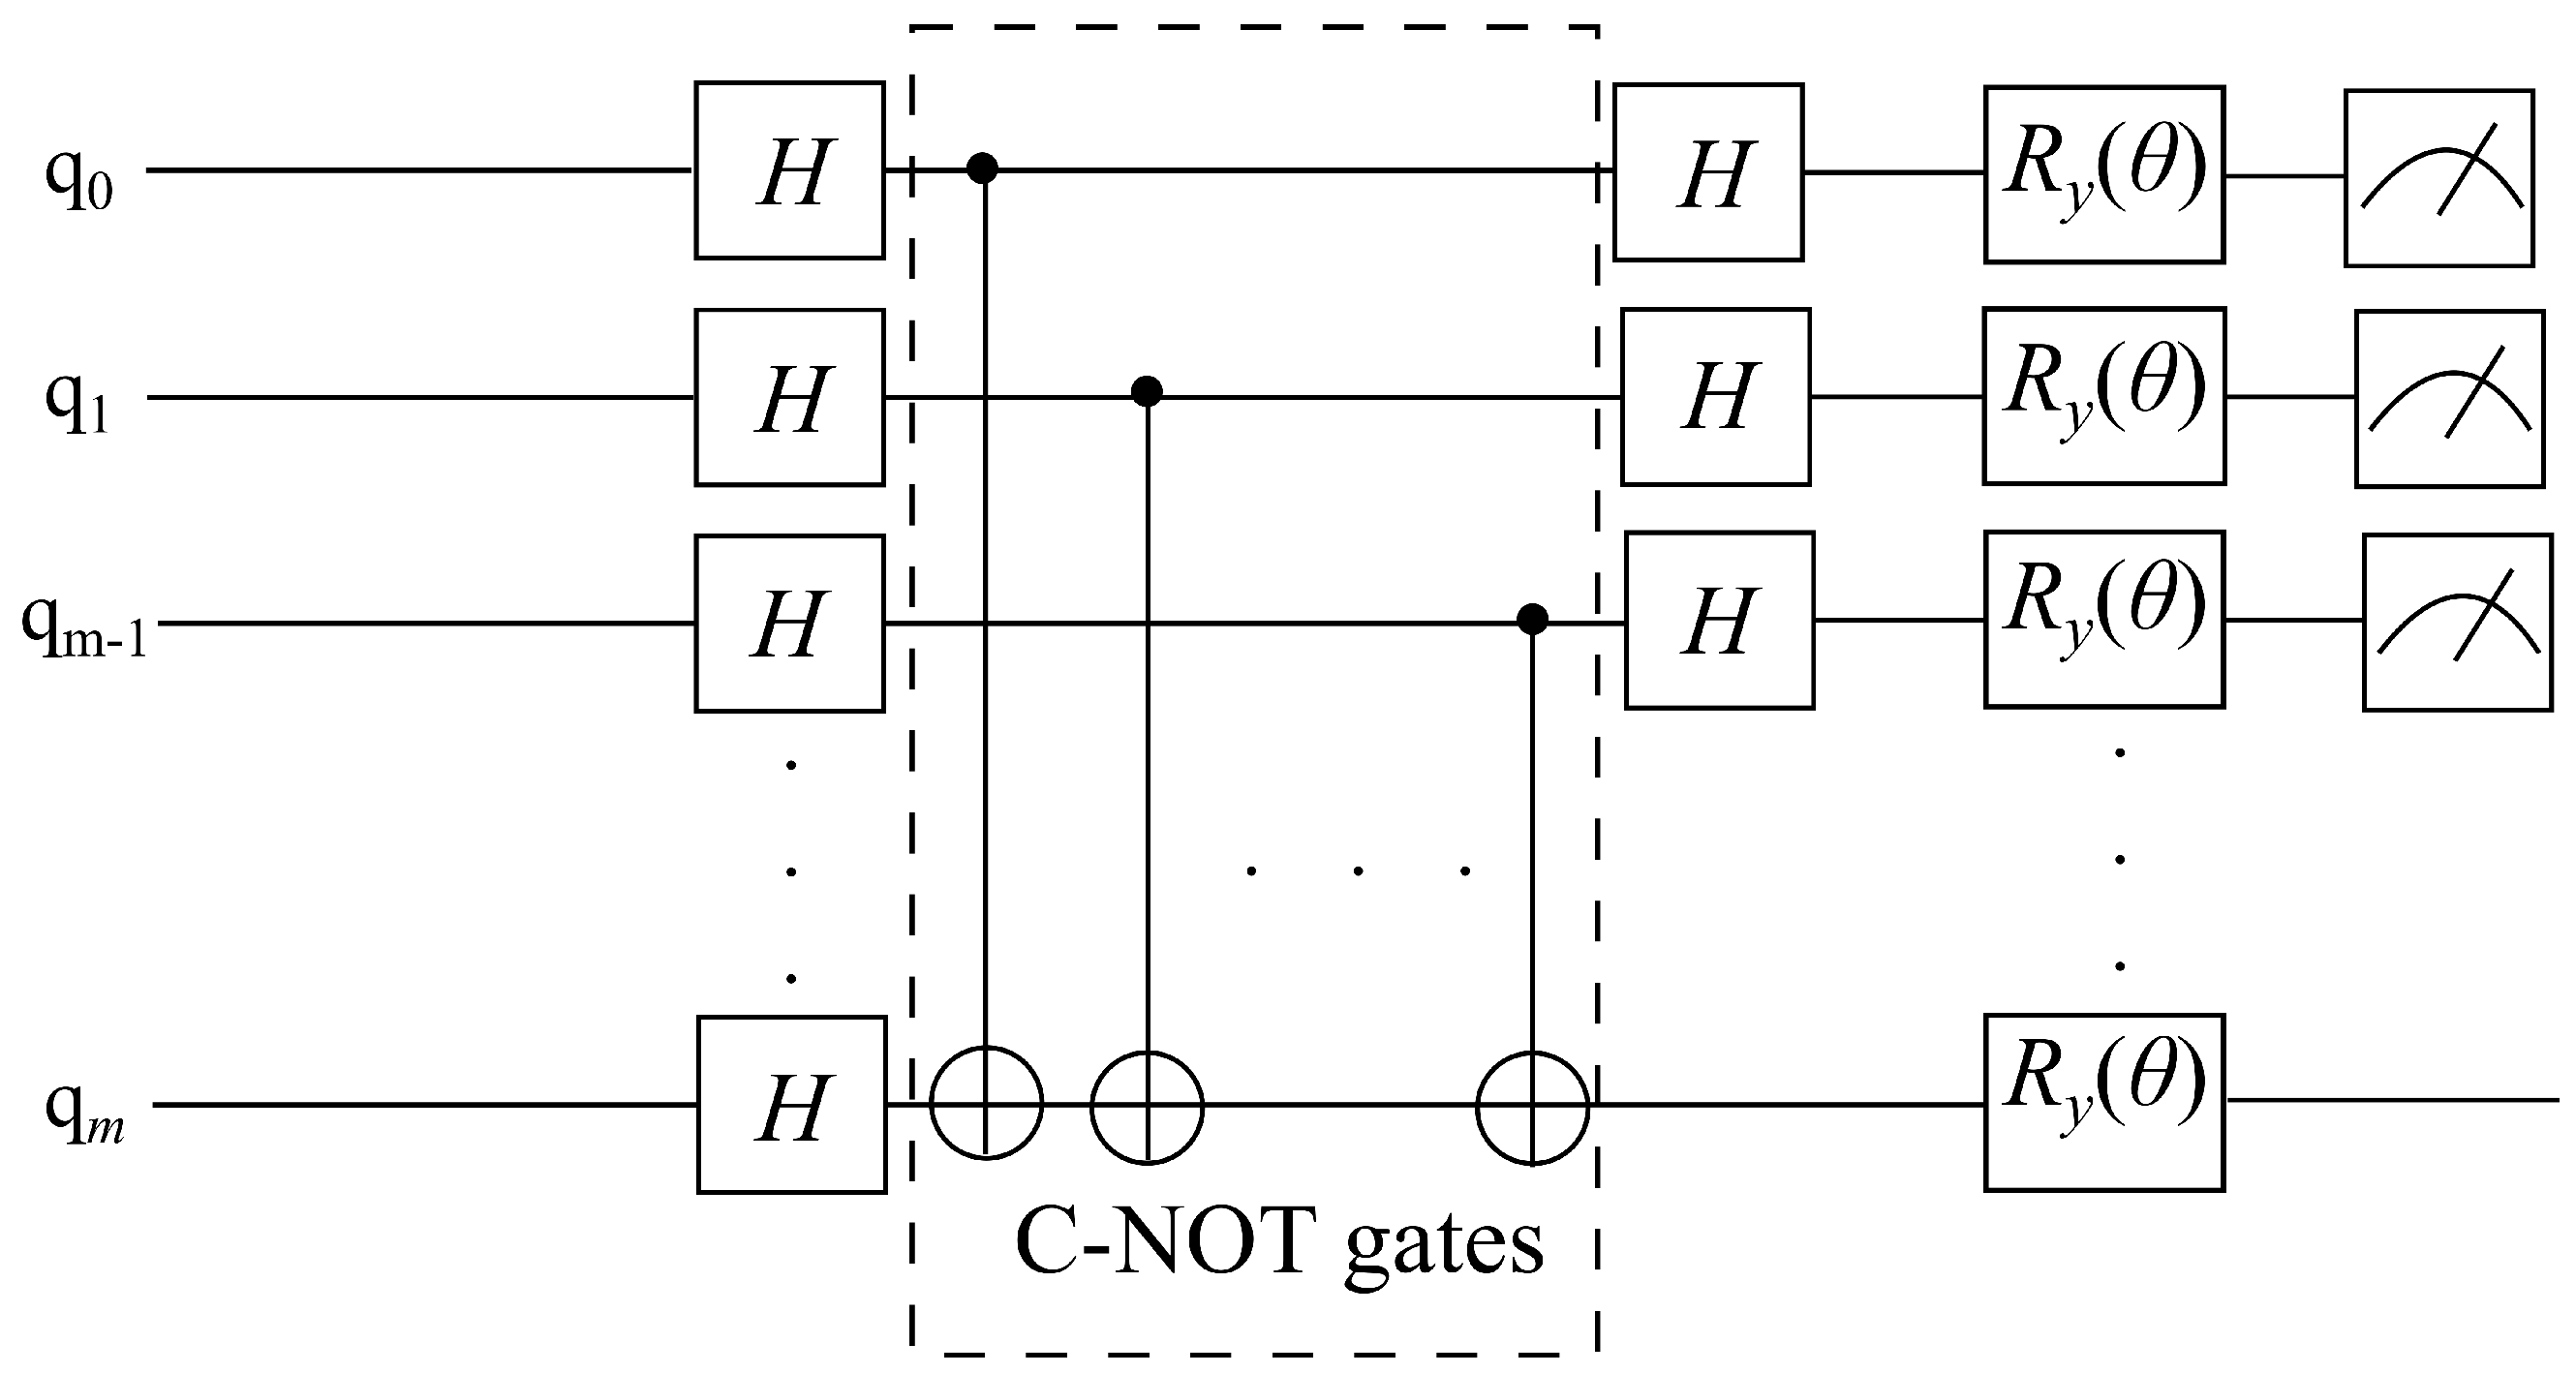
The quantum circuit of the HQGAFARA is presented in Figure 4. This quantum circuit uses one of the main characteristics of quantum algorithms, quantum parallelism. With a single Oracle query, we can determine the state of 2 n possible configurations [48,49,50]. All experiments were executed on the IBM Qiskit quantum simulator.
The following quantum gates were used to design the quantum circuit shown in Figure 4: qubit q m is an ancillary qubit that controls the C-NOT (Controlled NOT) gates. This qubit should be in state one (|1〉). The C-NOT gates generate entanglement between the qubits; these gates are part of the Oracle. This Oracle is the same as that shown in Figure 1. Hadamard gates are used to place the qubits in the superposition state. Finally, the rotation gates ( R y ( θ ) ) are used to generate new quantum individuals which, in turn, are measured to update the classical population.
The length of a quantum circuit is defined as the count of quantum gates (quantum operations) within the circuit when represented as a sequence of operations. Essentially, it gauges the depth of the circuit, indicating the number of computational steps or operations necessary to execute the quantum algorithm. A shorter length typically suggests a more efficient or less complex quantum circuit. As such, it stands as a key characteristic reflecting the complexity of a quantum circuit [46].
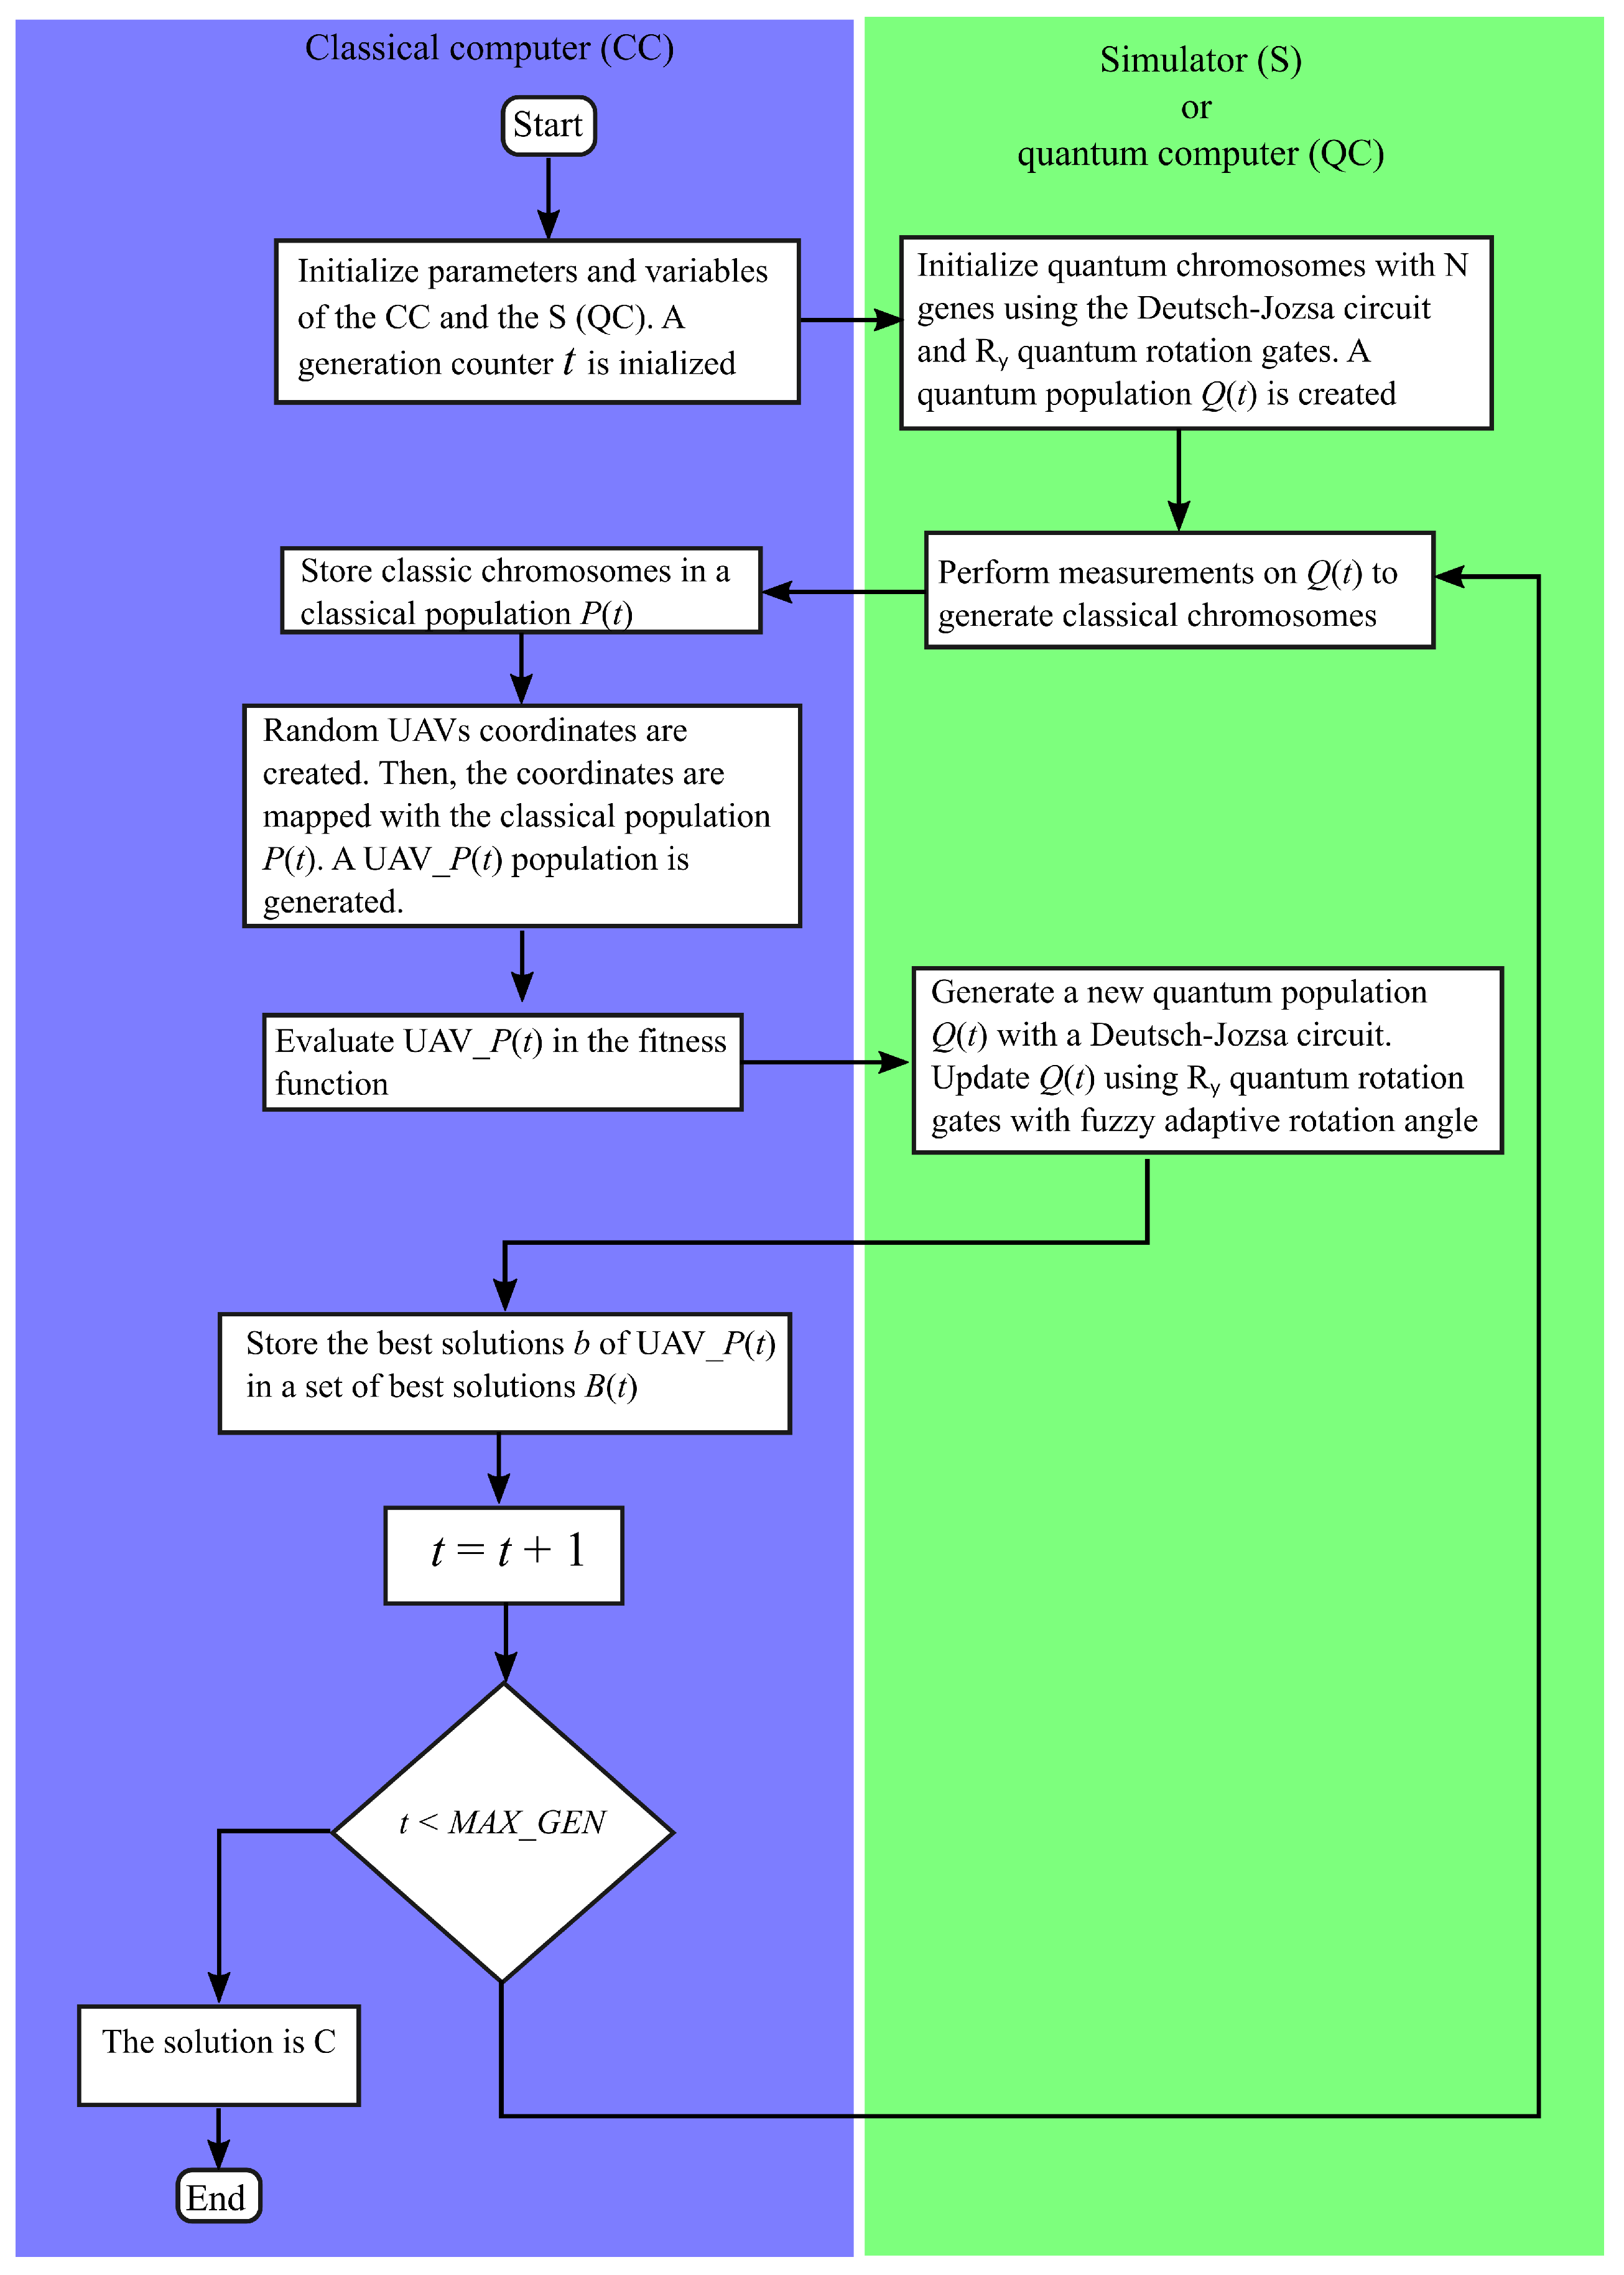
Figure 5 depicts the behavior of the HQGAFARA in a block diagram. On the left are the steps executed by the classical computer (CC); the steps that the quantum computer (QC) runs are shown on the right side. In the CC, the HQGAFARA imports the user’s coordinates and transmission channels and configures the number of users, UAVs, and available channels, the amounts of UAV transmission power and user transmission power, and the maximum number of generations. Also, a classical population P ( t ) is created; then, P ( t ) is mapped with the UAVs’ coordinates and evaluated in the fitness function. Finally, the best solutions are stored as a set of best solutions B ( t ) . The quantum population Q ( t ) is created, measured, and updated using the Deutsch–Jozsa circuit and R y rotation gates in the simulator or QC. A fuzzy adaptive rotation angle is implemented on the R y gate for the updated step.
Algorithm 1 describes the implementation of our HQGAFARA to locate UAVs to maximize coverage in disaster zones. The inputs of HQGAFARA are the parameters of the problem, the maximal number of generations M A X _ G E N , and the number n of quantum chromosomes. For the experiments, a single quantum chromosome was used. The output of the proposed algorithm is the maximum coverage C given by the UAVs. Like its evolutionary counterparts, the HQGAFARA begins by initializing a generation counter t. Step 3 creates the scenario by locating N mobile users in the affected area. Two areas of 100 and 900 km 2 were created for the experiments.
Algorithm 1 Hybrid Quantum Genetic Algorithm with Fuzzy Adaptive Rotation Angle
Require: The number p of quantum chromosomes, the maximal number of generations M A X _ G E N , the total number of mobile users N, the total number of UAVs M
Ensure: Maximum coverage C as shown in Equation (7)
  Begin
   t 0 ;
  Randomly generate the positions of N
  Initialize Q ( t ) using a Deutsch–Jozsa circuit and R y quantum rotation gates
  while  t < M A X _ G E N  do
    Measure Q ( t ) using Equation (19) to generate P ( t )
    Map P ( t ) with random UAVs’ coordinates. A UAV_ P ( t ) population is created
    Evaluate UAV_ P ( t ) using the fitness function in Equation (7)
    Generate the new population Q ( t ) using the Deutsch–Jozsa circuit
    Update Q ( t ) using R y quantum rotation gates with a fuzzy adaptive rotation angle
    Store the best solution b of UAV_ P ( t ) in B ( t )
     t = t + 1
  End
In step 4 of Algorithm 1, a set of quantum chromosomes, i.e., an initial quantum population Q ( t ) = [ | Ψ 1 t , | Ψ 2 t , , | Ψ p t ] is defined, where p is the size of the population and t is the generation number. A quantum chromosome is defined as follows:
| Ψ i t = | ψ i , 0 t | ψ i , 1 t | ψ i , m t
where m is the number of qubits and i = 1 , 2 , , p . In this case, | ψ i , 0 t = α i , 0 + β i , 0 , | ψ i , 1 t = α i , 1 + β i , 1 , …, | ψ i , m t = α i , m + β i , m , where | α | 2 + | β | 2 = 1 . Thus, | α | 2 and | β | 2 represent the probabilities of finding the qubit after being measured in states |0〉 and |1〉, respectively. The length of a qubit string is the same as the number of UAVs. In Figure 4, q 0 = | ψ i , 0 t , q 1 = | ψ i , 1 t , , q m = | ψ i , m t . For each quantum chromosome | Ψ i , the following operations are performed (see Figure 4): First, we apply a Pauli-X gate to our target qubit (last qubit, from top to bottom), as follows: X | 0 | 1 . Then, we apply Hadamard gates to all qubits
| Ψ i t = H m 1 2 m q m = 0 2 m 1 | q m 1 2 ( | 0 | 1 ) ,
and afterward, we apply the Oracle
U f 1 2 m q m = 0 2 m 1 ( 1 ) f ( q m ) | q m 1 2 ( | 0 | 1 ) .
Finally, in the last stage, we apply Hadamard gates again
H m 1 1 2 m q m = 0 2 m 1 ( 1 ) f ( q m ) ( H H H ) m | q m 1 2 ( | 0 | 1 ) .
The results obtained in Equation (18) are implemented in R y quantum rotation gates; because initial rotation angles of R y gates are zero, there is no effect on the results mentioned above.
Step 5 of Algorithm 1 is a whole loop that will finish when the maximum number of generations M A X _ G E N is reached. In step 6, the quantum population Q ( t ) is measured (observed) to generate the classical population (0 and 1) according to | ψ = α | 0 + β | 1 . In quantum mechanics, we characterize an observable using a Hermitian operator featuring a spectral decomposition O = λ i P i , where λ i denotes the distinct eigenvalues of the operator O, i depicts any given state, and P i are the projectors associated with the eigenspaces of O. The spectral decomposition breaks down the operator O in terms of its eigenvalues and associated projectors. A projector is the probability of transitioning to an eigenvector and is characterized by idempotence and orthogonality and collectively sums to the identity P i = I  [52]. By applying Born’s rule, the probability of measuring λ i is computed as follows: P ( λ i ) = ψ | P i | ψ  [53]. Then, we can calculate the post-measured state | ψ using
| ψ = P i | ψ ψ | P i | ψ .
In step 7 of Algorithm 1, we generate random UAVs’ coordinates M = { ( x 1 , y 1 ) , , ( x m , y m ) }; these coordinates simulate the positions of UAVs in the disaster zone. Then, we create a UAV_ P ( t ) population associating each UAV position ( x m , y m ) with a classical chromosome of P ( t ) , as shown in Figure 6. In UAV_ P ( t ) (see Figure 6), the bits with a value of 1 denote that the m t h UAV is selected, and a bit with a value of 0 means that it is not.
The UAV_ P ( t ) population is evaluated in the fitness function (step 8), as shown in Algorithm 2. The algorithm presented above was proposed in [11].
The inputs of Algorithm 2 are the number of mobile users N and the number of UAVs M. The output is the maximum coverage C. Algorithm 2 initializes the UAV counter m (step 2); this counter indicates the index of a determined UAV. Step 3 is a whole loop that will finish after all of the UAVs have been verified. In step 4, the mobile users’ counter n is initialized. The next step (step 5) is a conditional that verifies whether a UAV is selected ( U m = 1 ) or not ( U m = 0 ); if the conditional is true, i.e., U m = 1 , the Algorithm 2 continues in step 6 and verifies whether the n t h M U (associated mobile user) is not related to any UAV U m . If this is fulfilled, we continue in step 8 to calculate the Euclidean distance d n m between U m and M U n . If d n m complies with the constraints in Equation (11), then we must calculate the path loss L p n m (step 10). If L p n m satisfies the condition presented in Equation (12), then we proceed to calculate the SIR (step 12) of M U n . If the SIR of a M U n complies with the constraints of Equation (13), then the M U n is associated with the U m (step 14). Finally, the associated users M U n that the U m covers are added to obtain the value V. Then, the fitness value C (see Equation (7)) is determined.
Algorithm 2 Fitness function used to evaluate UAV_ P ( t )
Require:  Number of mobile users N, number of UAVs M
Ensure:   Maximum coverage C as shown in Equation (7)
1:  Begin
2:   m = 0
3:  while  m < M   do
4:         n = 0
5:        if  U m = 1  then
6:              while  n < N  do
7:                    if  M U n = 0  then
8:                        Compute the Euclidean distance d n m between U m and M U n
9:                        if  d n m 2  then
10:                            Compute the pathloss L p n m
11:                            if  L p n m < 120 d B  then
12:                                Compute the SIR of the M U n
13:                                if  S I R n 3 d B  then
14:                                     Associate M U n with U m
15:                   n = n + 1
16:         Add the associated M U n
17:          m = m + 1
18:  Calculate C
19:  End
Once the objective function has been calculated, the best solution b is stored in a set of best solutions B ( t ) (step 11, Algorithm 1). Next, Algorithm 1 generates a new quantum population Q ( t ) (step 9) with a Deutsch–Jozsa circuit and updates (step 10) with R y ( θ ) quantum rotation gates with a fuzzy adaptive rotation angle. The Deutsch–Jozsa circuit operates analogously to a classical recombination operator. The R y ( θ ) rotation gate improves the output of the Deutsch–Jozsa circuit. The j-th qubit value ( α j , β j ) is updated as
α j β j = cos ( θ j ) sin ( θ j ) sin ( θ j ) cos ( θ j ) α j β j .
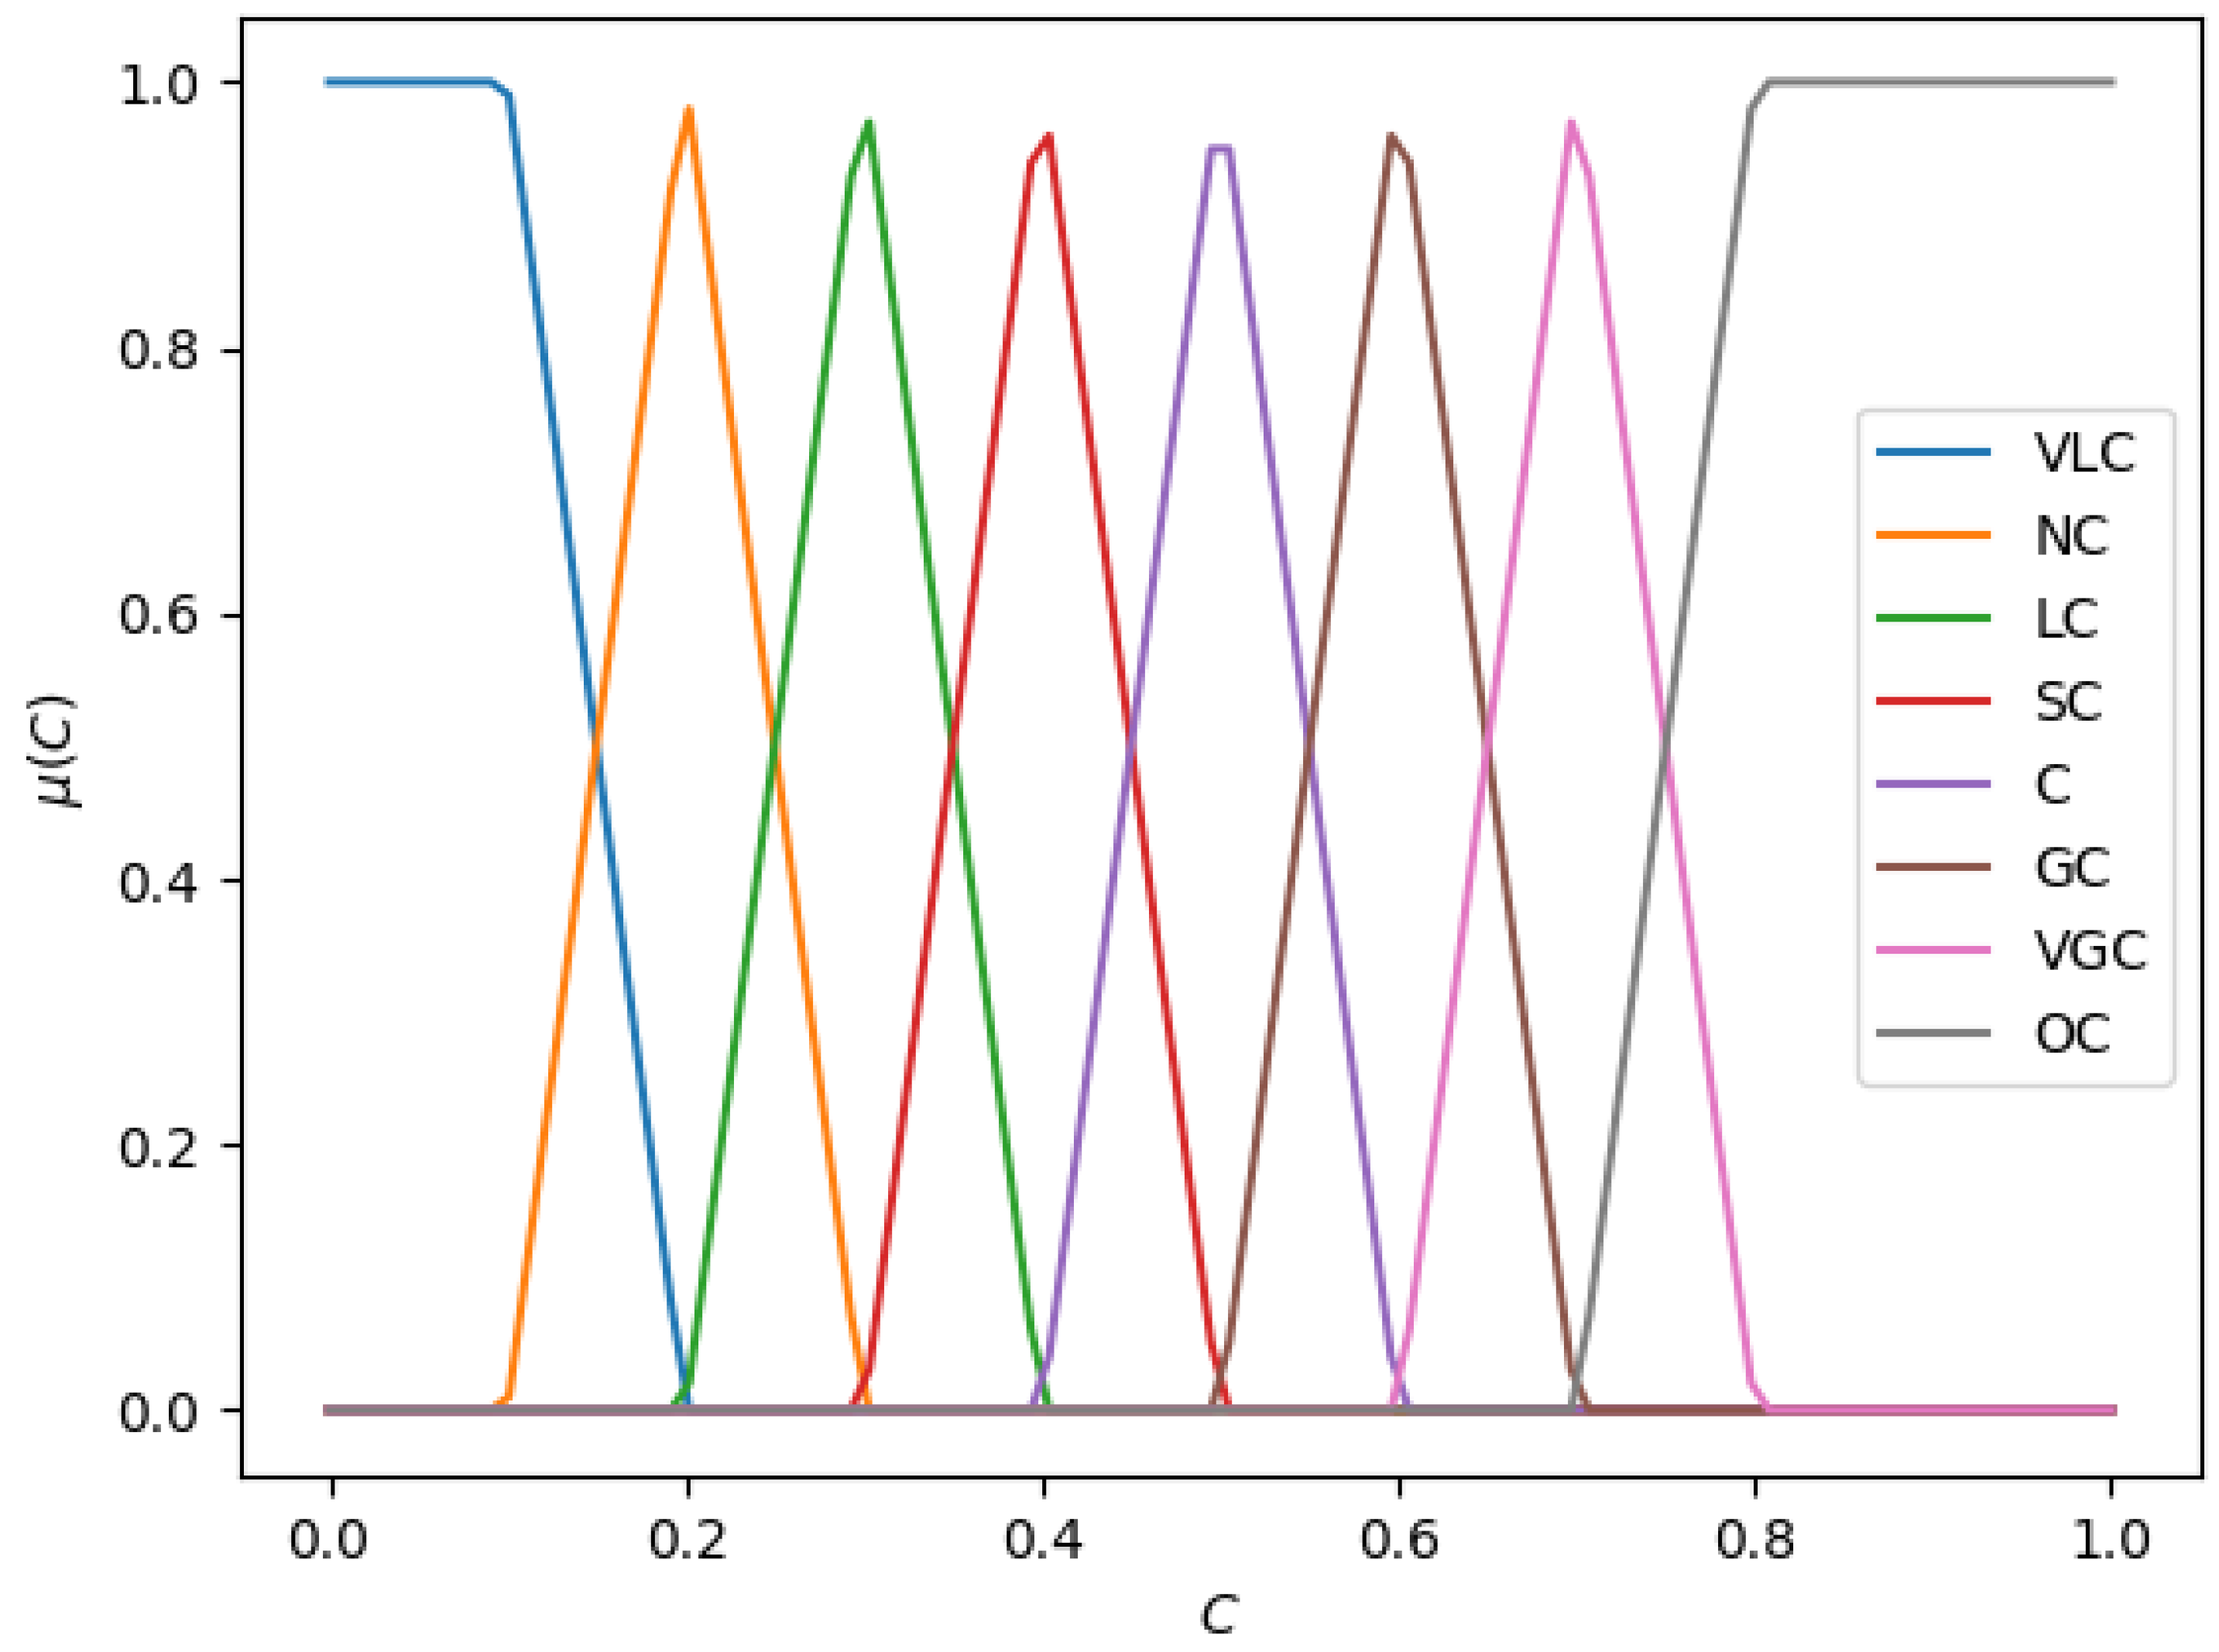
To determine the rotation angle of the quantum gate R y ( θ ) , a Fuzzy Inference System (FIS) was designed. There is one input and one output in the FIS. The membership functions (MFs) of the input and the output are shown in Figure 7 and Figure 8, respectively. The input variable is the coverage (C) percentage, calculated by the fitness function. Here are eight linguistic terms: VLC, NC, LC, SC, C, GC, VGC, and OC. The percentage is used to measure the universe of discourse of the input, where zero represents 0% and one represents 100%, respectively.
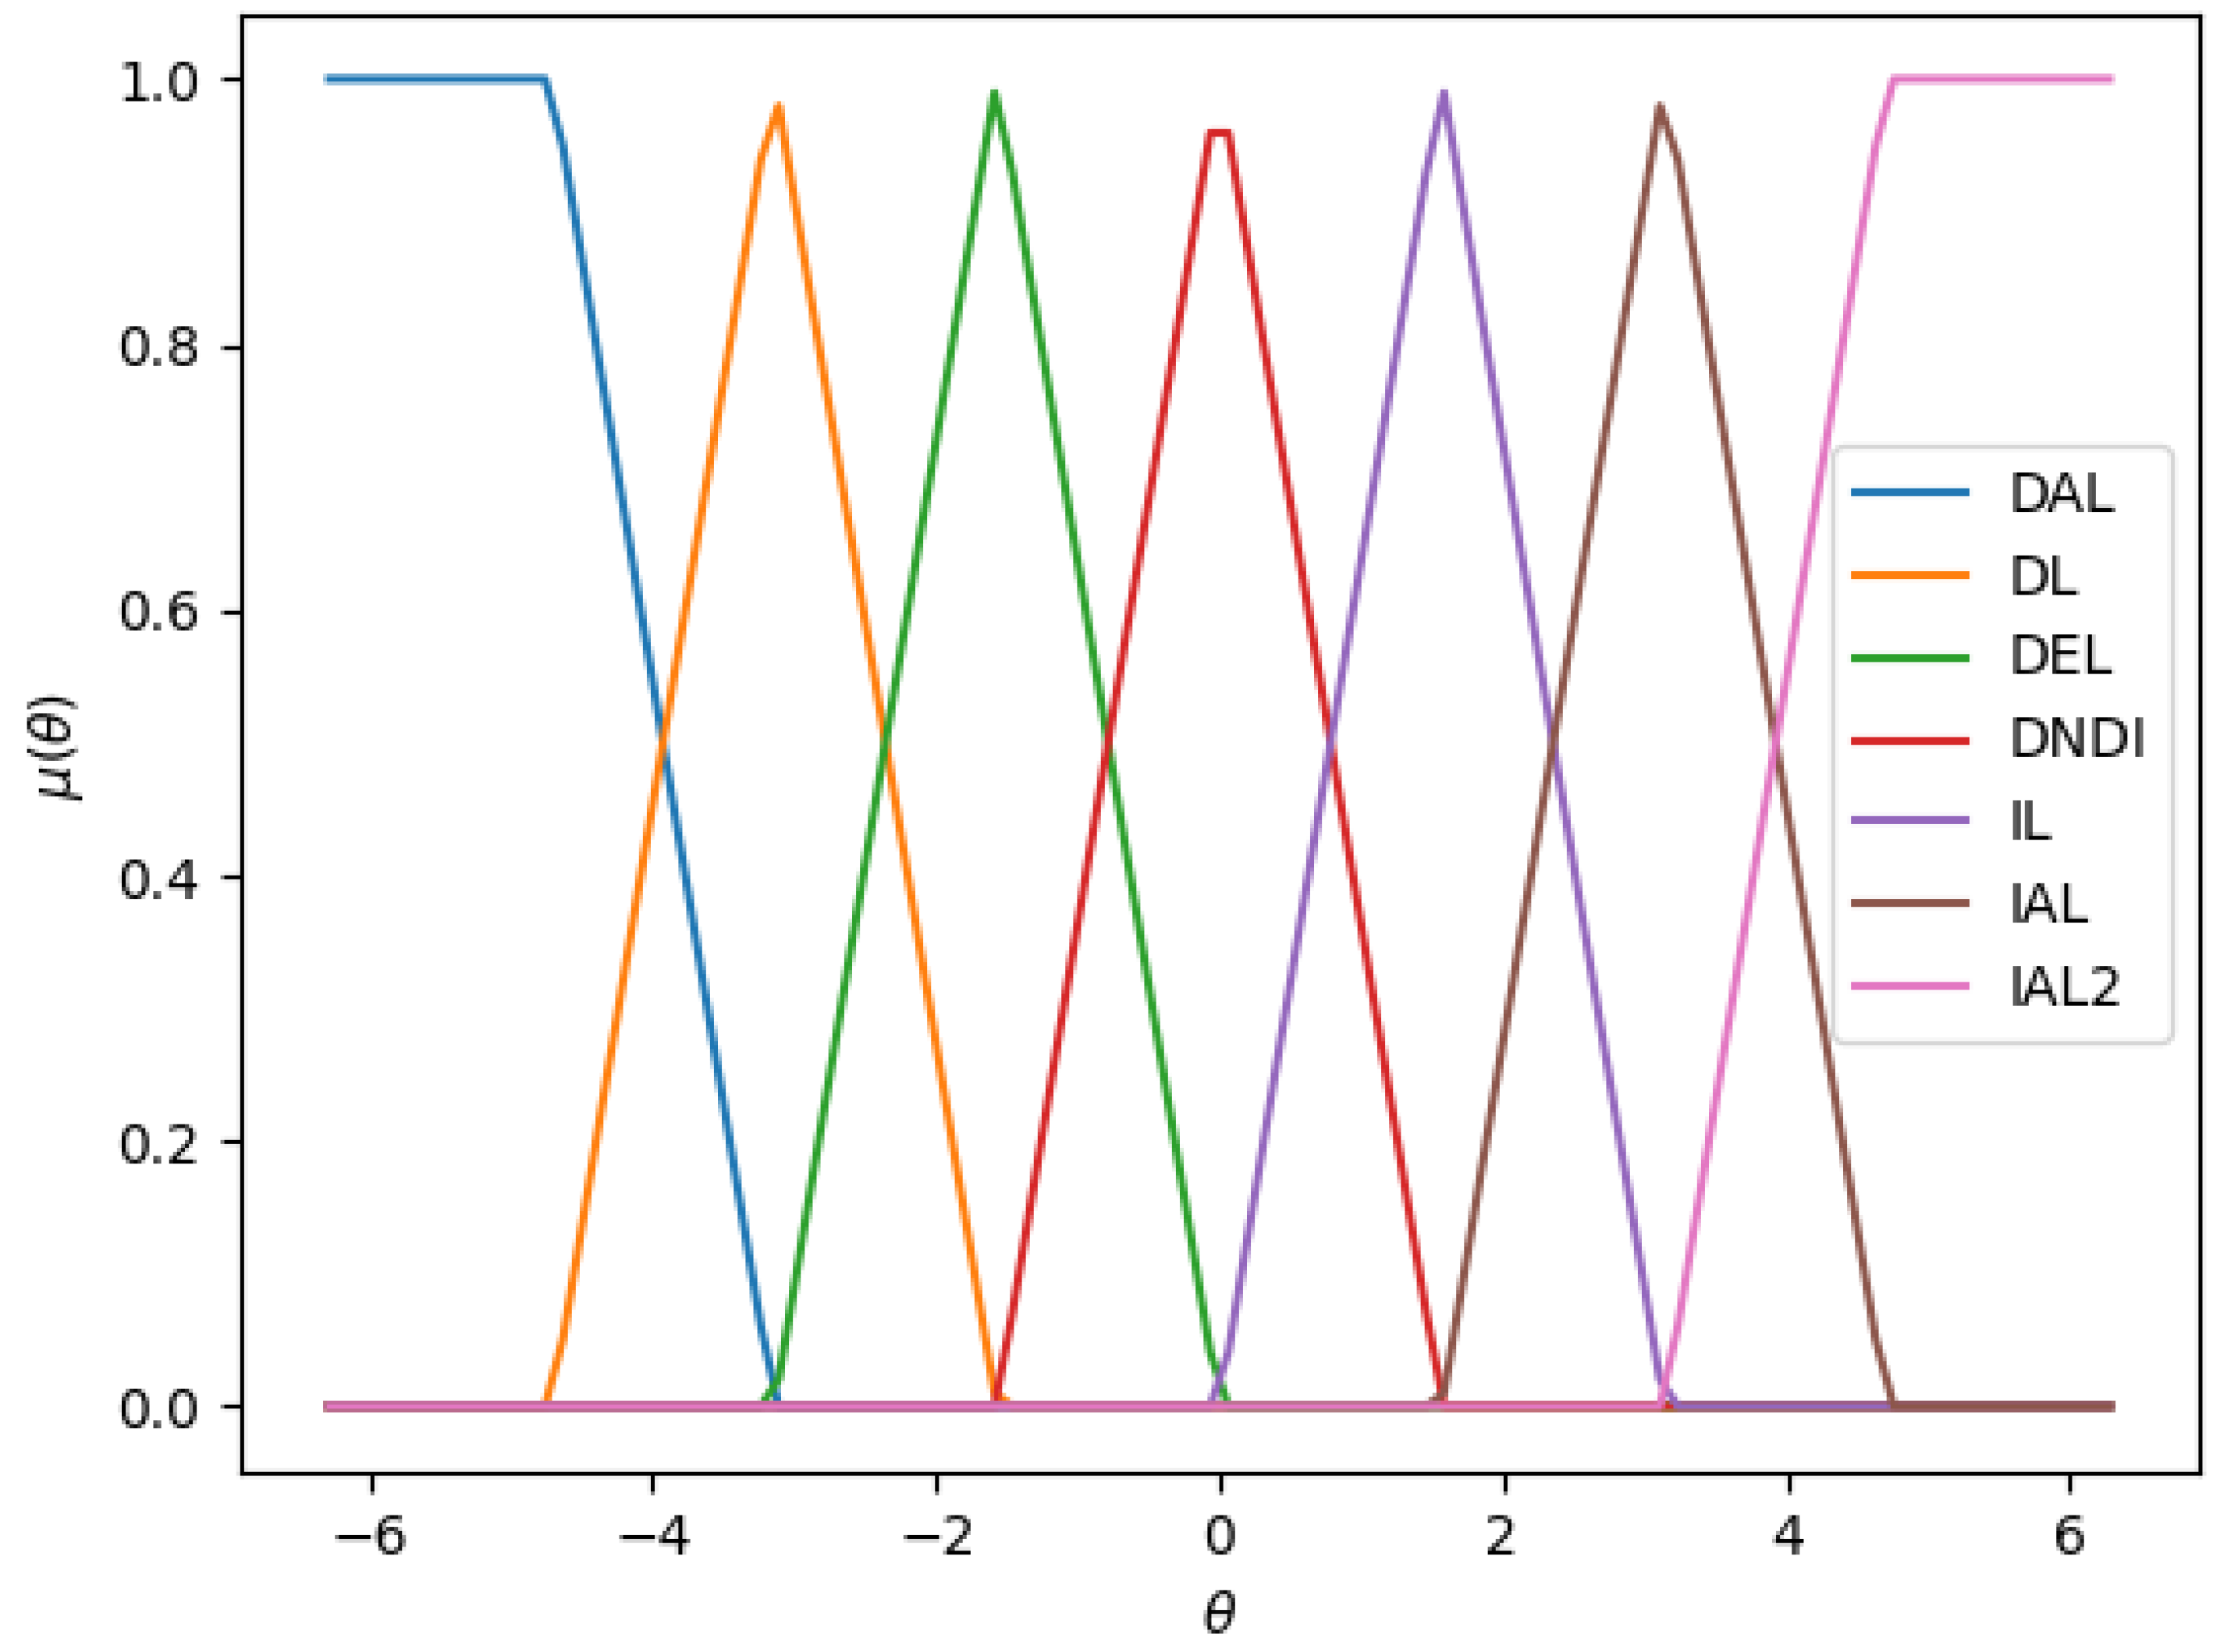
Figure 8 depicts the FIS output. The output variable is the rotational angle θ used in the quantum rotational gate R y ( θ ) . In Figure 8, there are seven linguistic terms: DAL, DL, DEL, DNDI, IL, IAL, and IAL2. Radians are used to measure the universe of discourse of the output, from 2 π (−6) to 2 π (6).
Table 1 shows the types and parameter values of the MFs. Table 2 describes the FIS fuzzy rules. Here, the letters presented in bold are the inputs (C), and the others are the outputs ( θ ). For instance, if C is LC (Low Coverage), then θ is IL (Increase a Little). For the inputs, VLC, NC, LC, SC, and C mean very low coverage, no coverage, low coverage, small coverage, and coverage, respectively. GC, VGC, and OC represent good coverage, very good coverage, and optimal coverage, respectively. For the outputs, IAL2, IAL, IL, DEL, DL, and DNDI are increase a lot 2; increase a lot; increase a little; decrease a little; decrease a lot; and do not decrease or increase. The differences between IAL2 and IAL are the type of membership function and the range.

4. Results

We designed three sets of experiments to determine the performance of our proposed HQGAFARA and its contributions compared with different versions of the HQGAARA and a classical genetic algorithm. We analyzed the overall performance and performed statistical tests for the convergence time, accuracy, and precision. The three sets of experiments were divided into two cases:
  • Case 1: The worst-case scenario where the UAVs had only one transmission channel to provide connectivity to mobile users.
  • Case 2: The best case scenario is that the UAVs had more than one transmission channel to assist the affected area.
In both cases, experiments with five (M = 5), ten (M = 10), and twenty (M = 20) UAVs were carried out; also, a total of 500 mobile users (N= 500) in the disaster area were used. In the three sets of experiments, 30 runs with 1000 generations were performed.
Table 3 presents the values used to design the emergency network. These parameters were obtained from [11]. Here, the transmission power of a mobile user is represented by P T n , and the transmission power of each UAV is P T m . The altitudes of a UAV U m and a mobile user M U n are the values that lead to lower path losses. Lastly, the frequency that is expected to be used by Public Safety Communications (PSC) to provide LTE broadband communications is represented by f c [54].
The first set of experiments aims to determine the overall performance of the quantum and the classical algorithms. For the best case scenario (Case 2), five transmission channels were used. Table 4 presents the comparison results of different versions of HQGAARA and the classical genetic algorithm (GA) using five, ten, and twenty UAVs within the affected area. In Table 4, the first column corresponds to the number of UAVs in the disaster area. The second column lists the name of the algorithm used. The third, fourth, and fifth columns show the best, mean, and worst solutions obtained using the algorithm. The sixth and seventh columns show each algorithm’s standard deviation and confidence interval. In the experiments with five and ten UAVs, the affected area was 100 km 2 ; therefore, the covered areas per UAV were 20 and 10 km 2 , respectively. With twenty UAVs (M = 20) the covered area per UAV would be 5 km 2 ; this covered area is too small for each UAV considering the parameters shown in Table 3. To test the performance of the algorithms, we decided to increase the affected area in the experiments with 20 UAVs from 100 to 900 km 2 . The application of the Hata propagation model restricts considerations solely to man-made structures, neglecting the analysis of the terrain profile between the transmitter and receiver. In scenarios where natural obstacles, such as hills, intersect with the transmission path, the model fails to incorporate the resultant shadowing effects on signal propagation.
The key distinction between HQGAARA- θ 1 and HQGAARA- θ 2 lies in the maximal rotation angle θ m a x and the minimal rotation angle θ m i n applied to the quantum rotation gate R y ( θ ) . Broadly speaking, HQGAARA- θ 1 utilizes a range between θ m i n = 2 π and θ m a x = 0 , while HQGAARA- θ 2 employs θ m i n = 1.5 π and θ m a x = 0 . To determine the optimal rotation angle, HQGAFARA employs a fuzzy inference system. This is different from the approaches used in HQGAARA- θ 1 and HQGAARA- θ 2 , which rely on mathematical equations. The fuzzy system’s universe of discourse spans from 2 π to 2 π . Table 5 presents the average of the most suitable rotation angles for each quantum algorithm. For the GA, a tournament selection operator was employed, a two-point crossover operator was used in the recombination process, and a bit-flip mutation operator was applied. In all experiments, a population of 100 chromosomes, a recombination rate of 0.5, and a mutation rate of 0.1 were consistently used.
In Table 4, the GA generated the highest-quality solution with five (M = 5) and ten (M = 10) UAVs, outperforming quantum algorithms. The results presented in the columns Best, Mean, and Worst represent the best, mean, and worst solutions, respectively. For instance, in the Best column, the GA with five UAVs ( M = 5 ) achieved a coverage level of 0.36, signifying that only 36% of the mobile users (MUs) are covered by this particular set of UAVs.
When employing five UAVs (refer to Table 4), the best solutions from quantum algorithms are, on average, 1.6% less effective than those generated by the GA. However, the quantum algorithms consistently delivered superior results in terms of mean and worst solutions. All the quantum meta-heuristics produced higher-quality solutions for the mean and worst values compared to the GA, with improvements of 1.4% and 8.2%, respectively. Also, their standard deviation (Std) was notably better, being 48% smaller than its classical counterpart. The results of experiments with ten UAVs are quite similar to those shown with five UAVs. The best solutions from the GA are 4.4% higher than those from quantum algorithms. However, in terms of the mean and worst solutions, quantum algorithms yield higher values, surpassing those of the GA by 2.4% and 6.8%, respectively. Additionally, the precision of the quantum algorithms is superior, as evidenced by a standard deviation (Std) that is 55.2% smaller than that of the GA. Transitioning to experiments involving 20 UAVs, the outcomes deviate from those previously detailed. In these scenarios, HQGAARA- θ 1 and HQGAFARA exhibit more favorable solutions than the Genetic Algorithm (GA) in terms of both the best (1% higher) and mean (2% higher) values (see the Best and Mean columns in Table 4). For the worst and Std solutions, all quantum algorithms showed better results than the GA; these results were 14.6% and 56.5% higher than those of the classical algorithm, respectively. The difference between the results shown with five and ten UAVs and the results with 20 UAVs is the search space generated by the algorithms; the GA creates a search space of 100 chromosomes (possible solutions), whereas all quantum algorithms generate a search space of 2 M (where M = 20 is the number of UAVs) possible solutions. This number of solutions increases the possibility of finding the optimal value. This characteristic is called superposition, and it is one of the most significant properties of quantum computing. Concerning confidence intervals (CI), all quantum algorithms show lower values than the GA. A small confidence interval in quantum algorithms indicates that the real value is more precise than the confidence interval in a GA. A confidence value of 99% was used.
Table 6 presents the experimental results of quantum algorithms and the classical algorithm in the worst-case scenario (Case 1) with five, ten, and twenty UAVs. The columns labeled Best, Mean, and Worst convey the same information as presented in Table 4. Here, we use a single transmission channel. The results with five UAVs ( M = 5 ) show the effect of the number of transmission channels on the area covered by UAVs. HQGAARA- θ 2 , HQGAFARA, and GA cover one transmission channel of about 17.2% (0.172). If we increase the number of transmission channels as in the best-case scenario (see Table 4), the maximum coverage area increases too. This occurs because mobile users are distributed among the assigned channels, causing less interference, which allows more mobile users to connect with the UAVs. As seen in the table, hybrid quantum algorithms have higher mean values than the GA; this demonstrates better accuracy in locating UAVs in a disaster zone. Furthermore, the quantum algorithms have a smaller standard deviation than the GA, showing better precision.
The second set of experiments focused on analyzing the statistical performance of quantum and classical algorithms. The experiments aim to determine if statistical differences exist between quantum and classical algorithms regarding accuracy and precision. Therefore, hypothesis tests were performed using the data for the worst-case and best-case scenarios with five, ten, and twenty UAVs. For every scenario, we ran three experiments, the first with five UAVs (M = 5), the second with ten UAVs (M = 10), and the third with twenty (M = 20) UAVs. In conclusion, six experiments represented in the Table 7, Table 8, Table 9, Table 10, Table 11 and Table 12 were run in this set of experiments.
The following procedure was used to determine which hypothesis test should be applied in each scenario, parametric or non-parametric.
1.
Perform the Shapiro–Wilk test to determine if the results have a normal distribution (H0 equals True) or not. Afterward, a parametric or non-parametric test should be applied. A significant level of α = 0.01 was used in all experiments, meaning that the probability of rejecting the H0 hypothesis when it is true is 0.01. Table 7, Table 8, Table 9, Table 10, Table 11, Table 12, Table 13, Table 14, Table 15, Table 16 and Table 17 show these results. The variables N and W in the tables mentioned above represent the number of samples and the statistical value in the Shapiro–Wilk test, respectively.
2.
At this point, three possible cases are considered.
(a)
All results obtained by the Shapiro–Wilk test are true (H0 is True); this means that the results presented by the algorithms have a normal distribution. We use a parametric Welch t-student test with α = 0.001 .
(b)
All the results obtained by the Shapiro–Wilk test are false (H0 is False); this means the results presented by the algorithms have a non-normal distribution. Here, we use a non-parametric Wilcoxon signed ranks test with α = 0.001 .
(c)
Some results have a normal distribution, while others do not. In this case, we perform a Bootstrapping procedure to convert non-normally distributed data into a normal distribution. Then, we can apply a Welch t-student test. These results are shown in tables, with a ”boots” label next to the algorithm name.
Table 7, Table 8 and Table 9 present the statistical tests of the hypothesis using five, ten, and twenty UAVs in the best-case scenario. The GA was compared with three quantum algorithms. Here, we can see that the degrees of freedom (d.o.f.) are different in each algorithm. To calculate the d.o.f., the standard deviation and the number of samples (N) in each algorithm were considered. Although the scenario is the same (best-case), the number of UAVs affects the standard deviation result. The Shapiro–Wilk test demonstrated that all algorithms had a normal distribution (H0 = true); therefore, a parametric test was performed. The results presented in the three tables showed that no significant difference exists between classical and quantum algorithms, since the hypothesis H0 was confirmed (true) in each algorithm. However, in the mean and Std solutions from Table 4, all the quantum algorithms showed better solutions for situations with five, ten, and twenty UAVs. In the best-case scenario, quantum algorithms performed better in terms of accuracy and precision. If we only compare quantum algorithms, HQGAARA- θ 1 is the algorithm with the best accuracy.
Table 10, Table 11 and Table 12 present the statistical results regarding the accuracy and precision in the worst-case scenario. Here, the hypothesis tests in the three tables indicate that no significant difference exists between classical genetic algorithms and quantum algorithms. However, Table 6 showed that quantum algorithms outperform the GA in the mean and Std solutions, exhibiting better accuracy and precision, respectively. Furthermore, quantum algorithms have lower confidence intervals (CI), demonstrating more accurate results than their classical counterpart. In summary, both tests (best and worst case) indicate that there is no significant difference between a classical algorithm and quantum algorithms regarding the accuracy and precision, but previous results shown in Table 4 and Table 6 demonstrate the superiority of quantum algorithms in this set of experiments.
Table 13, Table 14 and Table 15 present the statistical results regarding the convergence time in the best-case scenario with five, ten, and twenty UAVs, respectively. A Wilcoxon signed ranks test was used to determine the statistical results in Table 13 since hypothesis H0 in the Shapiro–Wilk test for each algorithm was false. Statistical results demonstrated no significant difference between the GA and quantum algorithms. However, the mean solutions presented in Table 13 exhibit a lower convergence time, favoring the classical GA instead of quantum algorithms. These results are due to the size of the GA population. Since quantum algorithms have a population of 32 possible solutions, 2 5 , where five is the number of UAVs and qubits used by each algorithm. While the GA uses a population of 100 classical chromosomes, it has a clear advantage in the search space for finding the best solutions compared to quantum algorithms.
Table 14 shows the statistical test regarding the convergence time in the best-case scenario with 10 UAVs. Here, the results obtained in the Shapiro–Wilk test demonstrate that all algorithms have a normal distribution; therefore, a Welch t-student test should be applied. The parametric test indicated no significant difference between the two quantum algorithms (HQGAARA- θ 1 _boots and HQGAFARA) and the GA. However, between HQGAARA- θ 2 _boots and GA, hypothesis H0 is false, meaning that there is a significant difference between these two algorithms. The difference favors the quantum algorithm, since it takes fewer generations (198) to reach the optimal value. In this experimental test, it is possible to see how the number of qubits affects the quantum algorithm’s performance. With 10 UAVs, the quantum algorithm initializes its quantum chromosome (quantum register) with 1024 possible solutions ( 2 10 ), since one UAV is equal to one qubit in each quantum algorithm. This number of qubits increases the probability of finding the optimal value. Quantum algorithms have an advantage over the GA, since the GA has a population of 100 chromosomes in all experiments. However, HQGAARA- θ 2 _boots is the only algorithm with a lower mean generation than the GA. The range in the rotation angle θ is responsible for this result.
The Shapiro–Wilk test from Table 15 indicates that all algorithms have a normal distribution. Therefore, a parametric Welch t-student test was applied. In this experiment, the power of quantum computing is shown since, with 20 UAVs (20 qubits per quantum algorithm), the quantum register of each quantum algorithm has 1,048,576 ( 2 20 ) possible solutions, compared with the 100 possible solutions (classical chromosomes) generated by the GA. Therefore, to find an optimal solution in the same search space, the GA needs a population of 1,048,576 chromosomes, increasing the execution time of the algorithm, since the GA has an exponential computational complexity [55].
Table 16, Table 17 and Table 18 show the statistical tests regarding the convergence time in the worst-case scenario with five, ten, and twenty UAVs, respectively. Table 16 describes the Shapiro–Wilk tests of the GA and quantum algorithms. The results indicate that all algorithms have a normal data distribution. Therefore, a Welch t-student was applied. The statistical test shows a significant difference between quantum algorithms and the GA regarding the convergence time. The difference favors the GA, since it takes fewer generations (on average) to reach the optimal value than with quantum algorithms. Here, the number of transmission channels and UAVs affects the quantum algorithms’ performance. With five UAVs, the search space for each quantum algorithm is equal to 32 ( 2 5 ) possible solutions. The GA, on the other hand, has a population of 100 chromosomes (possible solutions), making it three times more likely that a better solution can be obtained in fewer generations than quantum algorithms. Additionally, the number of transmission channels affects both algorithms’ convergence times. A single transmission channel increases the interference between mobile users and UAVs, causing the signal-to-interference ratio (SIR) to decrease, causing inefficient communication.
The results presented in Table 17 are quite similar to those shown in Table 14. The main differences are the numbers of transmission channels and UAVs. The results shown in Table 17 indicate that no significant difference exists between HQGAARA- θ 1 _boots and GA and HQGAFARA and GA. Regarding HQGAARA- θ 2 _boots, the Welch t-student test shows a significant difference compared with the GA. The results favor the quantum algorithm. Here, the transmission channel’s number does not affect the statistical results, since the statistical results are the same in the best-case scenario (see Table 14). These results show the robustness of quantum algorithms compared with the GA, because the number of transmission channels does not impact quantum algorithms’ performance in terms of placing UAVs efficiently in natural disaster areas.
The results presented in Table 18 strongly demonstrate the power of quantum algorithms compared to the GA, as presented in the best-case experiments regarding the convergence time (see Table 15). Quantum algorithms have shown better performances regarding the precision and accuracy. Furthermore, regarding convergence times with 20 UAVs, the statistical results indicate the need for fewer generations to find the most suitable values to solve the problem addressed in this paper. These results reaffirm the main advantage of quantum algorithms over classical ones, the superposition state. In this state, quantum algorithms create a larger search space than classical algorithms. They use even fewer qubits (bits) than classical algorithms, generating better solutions and decreasing convergence times.

5. Discussion

A Hybrid Quantum Genetic Algorithm with Fuzzy Adaptive Rotation Angle (HQGAFARA) was presented in this study to position UAVs to maximize coverage in a disaster zone strategically. Several experiments were conducted to evaluate the performance of the quantum algorithm. Additionally, comparisons were made between two hybrid quantum genetic algorithms utilizing different rotation angles and a classical Genetic Algorithm (GA). Each study case involved two different scenarios, namely the best-case and worst-case scenarios, with three different numbers of UAVs. The experiments were conducted as follows: a best-case scenario with five, ten, and twenty UAVs and a worst-case scenario with five, ten, and twenty UAVs. This proposal introduces three significant contributions to the existing state-of-the-art method, all of which have been statistically demonstrated. These contributions are as follows:
1.
The inclusion of the Deutsch–Jozsa quantum circuit within quantum meta-heuristics. This circuit was employed to generate new individuals mimicking a haploid recombination and the mutation operation. This expedited the evolutionary process by leveraging the superposition to generate new individuals, a concept that is applicable to solve various problems.
2.
A novel fuzzy operator was introduced to adapt the rotation angle effectively. The proposal yielded better average results compared to existing methods, particularly in the worst-case experiments, where the conditions challenged the efficiency and robustness of the algorithms.
3.
The introduction of a novel meta-heuristic named HQGAFARA, which was statistically proven to outperform the classical GA.
The experimental results underscore the superiority of quantum algorithms over the GA. In terms of the accuracy, the quantum algorithms outperformed the GA in the best-case scenario with five, ten, and twenty UAVs by 1.3%, 2.3%, and 0.4%, respectively. Furthermore, quantum algorithms exhibited an average standard deviation that was 53% smaller than the GA in terms of the precision. Similar results were observed for the worst-case scenario. The statistical analysis concerning the convergence time highlights the computational power of quantum algorithms as the number of qubits (UAVs) increases. These results led to the conclusion that combining the Deutsch–Jozsa quantum algorithm and the fuzzy adaptive rotation angles enhances the exploitative characteristics of the quantum algorithm while preserving diversity in the search process.
Comparing quantum algorithms alone, it is evident that, in most experimental tests, HQGAARA- θ 1 is the algorithm that yields the best results. However, our proposed HQGAFARA demonstrates superior average solutions in the worst-case scenario.
Certain limitations are encountered when developing quantum circuits using the IBM Qiskit simulator. Firstly, there is a constraint on the number of qubits that the simulator can use, which is essential for covering larger areas with more UAVs. The ibmq_qasm_simulator used in this study supports a maximum of 32 qubits, allowing for the generation (the location) of 32 UAVs. While the IBM Qiskit framework offers simulators with more qubits, these simulators do not support the quantum gates used in the Deutsch–Jozsa circuit implemented in this work. Moreover, the limitations of the current state of quantum technology in the NISQ era restrict the number of available qubits and the depth of quantum circuits.
Another limitation lies in the testing of the quantum algorithm on a quantum computer, as IBM has recently imposed limitations on its use. Additionally, the processing time required for the simulator to produce results presents a significant hurdle.
Despite these limitations, implementing hybrid quantum algorithms has emerged as the most promising and viable approach for solving NP-hard problems, such as the one addressed in this study.
In our forthcoming research efforts, we aim to evaluate our quantum proposal in more expansive geographical areas while concurrently increasing the number of UAVs (referred to as qubits) to enhance the scope of our coverage.This undertaking will require access to an IBM Qiskit quantum simulator with a larger qubit count or a quantum computer suitably equipped with the necessary qubits. Furthermore, we intend to craft or implement a specialized quantum circuit that leverages the existing quantum gates integrated into the updated IBM quantum framework as part of our recombination process. Finally, we will refine our hybrid quantum algorithm to determine the optimal path between the UAV and the previously identified strategic position. This entails a fusion of path planning and strategic positioning in disaster zones.

Author Contributions

Conceptualization, E.B., O.M., A.M.-V. and G.R.-C.; Formal analysis, E.B.; Funding acquisition, O.M.; Investigation, E.B., O.M., A.M.-V. and G.R.-C.; Methodology, E.B., O.M., A.M.-V. and G.R.-C.; Project administration, O.M. and A.M.-V.; Resources, O.M. and A.M.-V.; Software, E.B. and G.R.-C.; Supervision, O.M. and A.M.-V.; Validation, O.M. and A.M.-V.; Visualization, E.B.; Writing—original draft, E.B. and G.R.-C.; Writing—review and editing, O.M. and A.M.-V. All authors have read and agreed to the published version of the manuscript.

Funding

This research was funded by the Instituto Politécnico Nacional under Grant Number SIP20230104. We also thank the Comisión de Fomento y Apoyo Académico del IPN (COFAA) and the Mexican National Council of Humanity Science and Technology (CONAHCYT) for supporting our research activities.

Data Availability Statement

The data is available upon request to the authors.

Acknowledgments

We express our gratitude to the Universidad Politécnica de Pachuca (UPP) for the hospitality extended during a research stay which significantly contributed to the development of this paper.

Conflicts of Interest

The authors declare no conflicts of interest. The funders had no role in the design of the study; in the collection, analyses, or interpretation of data; in the writing of the manuscript; or in the decision to publish the results.

Abbreviations

The following abbreviations are used in this manuscript:
CCoverage
GAGenetic algorithm
HQGAFARAHybrid Quantum Genetic Algorithm with Fuzzy Adaptive Rotation Angle
UAVUnmanned Aerial Vehicle
GQAGenetic Quantum Algorithms
KPKnapsack Problem
QEAQuantum Evolutionary Algorithm
NISQNoisy Intermediate-Scale Quantum
MUMobile Users
SIRSignal-to-Interference Ratio

References

  1. Cangialosi, J.P.; Kimberlain, T.B. Hurricane Odile (EP152014). In National Hurricane Center Tropical Cyclone Report; National Hurricane Center: Miami, FL, USA, 2015. [Google Scholar]
  2. Sapkota, S.N.; Bollinger, L.; Perrier, F. Fatality rates of the Mw~8.2, 1934, Bihar–Nepal earthquake and comparison with the April 2015 Gorkha earthquake. Earth Planets Space 2016, 68, 40. [Google Scholar] [CrossRef]
  3. Yabe, T.; Ukkusuri, S.V.C.; Rao, P.S. Mobile phone data reveals the importance of pre-disaster inter-city social ties for recovery after Hurricane Maria. Appl. Netw. Sci. 2019, 4, 98. [Google Scholar] [CrossRef]
  4. Nakata, K.; Katsumata, A.; Muhari, A. Submarine landslide source models consistent with multiple tsunami records of the 2018 Palu tsunami, Sulawesi, Indonesia. Earth Planets Space 2020, 72, 44. [Google Scholar] [CrossRef]
  5. Cavallo, E.A.; Giles-Aĺvarez, L.; Powell, A. Estimating the Potential Economic Impact of Haiti’s 2021 Earthquake; Inter-American Development Bank: Washington, DC, USA, 2021; p. 11. [Google Scholar] [CrossRef]
  6. Ritchie, H.; Roser, M. Natural Disasters. Our World in Data. 2014. Available online: https://ourworldindata.org/natural-disasters (accessed on 1 March 2023).
  7. Sambo, Y.A.; Klaine, P.V.; Nadas, J.P.B.; Imran, M.A. Energy Minimization UAV Trajectory Design for Delay-Tolerant Emergency Communication. In Proceedings of the 2019 IEEE International Conference on Communications Workshops (ICC Workshops), Shanghai, China, 20–24 May 2019; pp. 1–6. [Google Scholar] [CrossRef]
  8. Huang, D.; Cui, M.; Zhang, G.; Chu, X.; Lin, F. Trajectory optimization and resource allocation for UAV base stations under in-band backhaul constraint. EURASIP J. Wirel. Commun. Netw. 2020, 2020, 83. [Google Scholar] [CrossRef]
  9. Zheng, Y.J.; Chen, S.Y.; Ling, H.F. Evolutionary optimization for disaster relief operations: A survey. Appl. Soft Comput. 2015, 27, 553–566. [Google Scholar] [CrossRef]
  10. Talbi, E. Metaheuristics: From Design to Implementation; Wiley Series on Parallel and Distributed Computing; Wiley: Hoboken, NJ, USA, 2009. [Google Scholar]
  11. Martínez-Vargas, A.; Rodríguez-Cortés, G.L.; Montiel-Ross, O. Comparative Representations of a Genetic Algorithm to Locate Unmanned Aerial Vehicles in Disaster Zones. Eng. Lett. 2019, 27, 374–384. [Google Scholar]
  12. Rodríguez-Cortés, G.L.; Martínez-Vargas, A.; Montiel-Ross, O.H.; Cosío-León, M.; Martínez, D.M. Deployment of Unmanned Aerial Vehicles for Maximum Coverage in Emergency Scenarios Using the (1+1) Evolution Strategy with One-Fifth Success Rule. In Proceedings of the 2021 Mexican International Conference on Computer Science (ENC), Morelia, Mexico, 9–11 August 2021; pp. 1–7. [Google Scholar] [CrossRef]
  13. ur Rahman, S.; Kim, G.H.; Cho, Y.Z.; Khan, A. Positioning of UAVs for throughput maximization in software-defined disaster area UAV communication networks. J. Commun. Netw. 2018, 20, 452–463. [Google Scholar] [CrossRef]
  14. Munawar, H.S.; Hammad, A.W.; Waller, S.T. Disaster Region Coverage Using Drones: Maximum Area Coverage and Minimum Resource Utilisation. Drones 2022, 6, 96. [Google Scholar] [CrossRef]
  15. Yan, T.; Lu, F.; Wang, S.; Wang, L.; Bi, H. A hybrid metaheuristic algorithm for the multi-objective location-routing problem in the early post-disaster stage. J. Ind. Manag. Optim. 2023, 19, 4663–4691. [Google Scholar] [CrossRef]
  16. Gupta, M.; Varma, S. Optimal placement of UAVs of an aerial mesh network in an emergency situation. J. Ambient. Intell. Humaniz. Comput. 2020, 12, 343–358. [Google Scholar] [CrossRef]
  17. Peer, M.; Bohara, V.A.; Srivastava, A. Multi-UAV placement strategy for disaster-resilient communication network. In Proceedings of the 2020 IEEE 92nd Vehicular Technology Conference (VTC2020-Fall), Victoria, BC, Canada, 18 November–16 December 2020; pp. 1–7. [Google Scholar]
  18. Liu, G.; Shakhatreh, H.; Khreishah, A.; Guo, X.; Ansari, N. Efficient deployment of UAVs for maximum wireless coverage using genetic algorithm. In Proceedings of the 2018 IEEE 39th Sarnoff Symposium, Newark, NJ, USA, 24–25 September 2018; pp. 1–6. [Google Scholar]
  19. Kumbhar, A.; Güvenç, I.; Singh, S.; Tuncer, A. Exploiting LTE-Advanced HetNets and FeICIC for UAV-assisted public safety communications. IEEE Access 2017, 6, 783–796. [Google Scholar] [CrossRef]
  20. Hassan, A.; Ahmad, R.; Ahmed, W.; Magarini, M.; Alam, M.M. Managing Critical Nodes in UAV assisted Disaster Networks. In Proceedings of the 2020 17th Biennial Baltic Electronics Conference (BEC), Tallinn, Estonia, 6–8 October 2020; IEEE: Piscataway, NJ, USA, 2020; pp. 1–5. [Google Scholar]
  21. Lai, X.; Hao, J.; Yue, D.; Gao, H. A Diversification-based Quantum Particle Swarm Optimization Algorithm for the Multidimensional Knapsack Problem. In Proceedings of the 2018 5th IEEE International Conference on Cloud Computing and Intelligence Systems (CCIS), Nanjing, China, 23–25 November 2018; pp. 315–319. [Google Scholar] [CrossRef]
  22. Pradhan, K.; Basu, S.; Thakur, K.; Maity, S.; Maiti, M. Imprecise modified solid green traveling purchaser problem for substitute items using quantum-inspired genetic algorithm. Comput. Ind. Eng. 2020, 147, 106578. [Google Scholar] [CrossRef]
  23. Galceran, E.; Carreras, M. A survey on coverage path planning for robotics. Robot. Auton. Syst. 2013, 61, 1258–1276. [Google Scholar] [CrossRef]
  24. LaValle, S. Planning Algorithms; Cambridge University Press: Cambridge, MA, USA, 2006. [Google Scholar]
  25. Zhang, X.; Xia, S.; Li, X. Quantum Behavior-Based Enhanced Fruit Fly Optimization Algorithm with Application to UAV Path Planning. Int. J. Comput. Intell. Syst. 2020, 13, 1315–1331. [Google Scholar] [CrossRef]
  26. Hu, C.; Xia, Y.; Zhang, J. Adaptive Operator Quantum-Behaved Pigeon-Inspired Optimization Algorithm with Application to UAV Path Planning. Algorithms 2019, 12, 3. [Google Scholar] [CrossRef]
  27. Li, S.; Deng, Y. Quantum-entanglement pigeon-inspired optimization for unmanned aerial vehicle path planning. Aircr. Eng. Aerosp. Technol. 2019, 91, 171–181. [Google Scholar] [CrossRef]
  28. Mousavi, S.; Afghah, F.; Ashdown, J.D.; Turck, K. Use of a quantum genetic algorithm for coalition formation in large-scale UAV networks. Ad Hoc Netw. 2019, 87, 26–36. [Google Scholar] [CrossRef]
  29. Michalewicz, Z. Genetic Algorithms + Data Structures = Evolution Programs; Springer: Berlin/Heidelberg, Germany, 1992. [Google Scholar]
  30. Wu, Y.; Bao, W.S.; Cao, S.; Chen, F.; Chen, M.C.; Chen, X.; Chung, T.H.; Deng, H.; Du, Y.; Fan, D.; et al. Strong Quantum Computational Advantage Using a Superconducting Quantum Processor. Phys. Rev. Lett. 2021, 127, 180501. [Google Scholar] [CrossRef]
  31. Zhong, H.S.; Deng, Y.H.; Qin, J.; Wang, H.; Chen, M.C.; Peng, L.C.; Luo, Y.H.; Wu, D.; Gong, S.Q.; Su, H.; et al. Phase-Programmable Gaussian Boson Sampling Using Stimulated Squeezed Light. Phys. Rev. Lett. 2021, 127, 180502. [Google Scholar] [CrossRef]
  32. Preskill, J. Quantum Computing in the NISQ era and beyond. Quantum 2018, 2, 79. [Google Scholar] [CrossRef]
  33. Yanofsky, N.; Manucci, M. Quantum Computing for Computer Scientists; Cambridge University Press: Cambridge, UK, 2008. [Google Scholar]
  34. Zhang, G.; Jin, W.; Li, N. An Improved Quantum Genetic Algorithm and Its Application. In Rough Sets, Fuzzy Sets, Data Mining, and Granular Computing. RSFDGrC 2003. Lecture Notes in Computer Science; Wang, G., Liu, Q., Yao, Y., Skowron, A., Eds.; Springer: Berlin/Heidelberg, Germany, 2003; Volume 2639. [Google Scholar] [CrossRef]
  35. Narayanan, A.; Moore, M. Quantum-Inspired Genetic Algorithms. In Proceedings of the IEEE International Conference on Evolutionary Computation, Nagoya, Japan, 20–22 May 1996; pp. 61–66. [Google Scholar] [CrossRef]
  36. Narayanan, A. Quantum computing for beginners. In Proceedings of the 1999 Congress on Evolutionary Computation-CEC99, Washington, DC, USA, 6–9 July 1999; (Cat. No. 99TH8406). Volume 3, pp. 2231–2238. [Google Scholar]
  37. Han, K.-H.; Kim, J.-H. Genetic quantum algorithm and its application to combinatorial optimization problem. In Proceedings of the 2000 Congress on Evolutionary Computation CEC00 (Cat. No.00TH8512), La Jolla, CA, USA, 16–19 July 2000; Volume 2, pp. 1354–1360. [Google Scholar]
  38. Han, K.-H.; Kim, J.-H. Quantum-inspired evolutionary algorithm for a class of combinatorial optimization. IEEE Trans. Evol. Comput. 2002, 6, 580–593. [Google Scholar] [CrossRef]
  39. Montiel Ross, O.H. A Review of Quantum-Inspired Metaheuristics: Going From Classical Computers to Real Quantum Computers. IEEE Access 2020, 8, 814–838. [Google Scholar] [CrossRef]
  40. Zhang, G. Quantum-inspired evolutionary algorithms: A survey and empirical study. J. Heuristics 2011, 17, 303–351. [Google Scholar] [CrossRef]
  41. Montiel Ross, O.; Rubio, Y.; Olvera, C.; Rivera, A. Quantum-Inspired Acromyrmex Evolutionary Algorithm. Sci. Rep. 2019, 9. [Google Scholar] [CrossRef]
  42. Arute, F.; Arya, K.; Babbush, R.; Bacon, D.; Bardin, J.C.; Barends, R.; Biswas, R.; Boixo, S.; Brandao, F.G.S.L.; Buell, D.A.; et al. Quantum Supremacy using a Programmable Superconducting Processor. Nature 2019, 574, 505–510. [Google Scholar] [CrossRef]
  43. Pednault, E.; Gunnels, J.A.; Nannicini, G.; Horesh, L.; Wisnieff, R. Leveraging Secondary Storage to Simulate Deep 54-qubit Sycamore Circuits. arXiv 2019. [Google Scholar]
  44. King, J.; Yarkoni, S.; Raymond, J.; Ozfidan, I.; King, A.D.; Nevisi, M.M.; Hilton, J.P.; McGeoch, C.C. Quantum Annealing amid Local Ruggedness and Global Frustration. arXiv 2017. [Google Scholar] [CrossRef]
  45. Hirzel, T. Building the Quantum Stack for the NISQ Era. Available online: https://www.hpcwire.com/2020/08/24/building-the-quantum-stack-for-the-nisq-era/ (accessed on 12 January 2023).
  46. Williams, C. Explorations in Quantum Computing; Springer: London, UK, 2011. [Google Scholar]
  47. Deutsch, D.; Jozsa, R. Rapid solution of problems by quantum computation. Proc. R. Soc. London Ser. A Math. Phys. Sci. 1992, 439, 553–558. [Google Scholar]
  48. Cao, Z.; Uhlmann, J.; Liu, L. Analysis of Deutsch-Jozsa Quantum Algorithm. IACR Cryptol. EPrint Arch. 2018, 2018, 249. [Google Scholar]
  49. Johansson, N.; Larsson, J.A. Efficient classical simulation of the Deutsch–Jozsa and Simon’s algorithms. Quantum Inf. Process. 2017, 16, 233. [Google Scholar] [CrossRef]
  50. Paredes López, M.; Meneses Viveros, A.; Morales-Luna, G. Algoritmo cuántico de Deutsch y Jozsa en GAMA. Rev. Mex. Física 2018, 64, 181–189. [Google Scholar] [CrossRef]
  51. Martínez-Vargas, A.; Andrade, Á.G. Deployment analysis and optimization of heterogeneous networks under the spectrum underlay strategy. EURASIP J. Wirel. Commun. Netw. 2015, 2015, 55. [Google Scholar] [CrossRef]
  52. Wittek, P. 3-Quantum Mechanics. In Quantum Machine Learning; Wittek, P., Ed.; Academic Press: Boston, MA, USA, 2014; pp. 25–39. [Google Scholar] [CrossRef]
  53. Rubio, Y.; Olvera, C.; Montiel, O. Quantum-inspired evolutionary algorithms on ibm quantum experience. Eng. Lett. 2021, 29, 1573–1584. [Google Scholar]
  54. Kumbhar, A.; Koohifar, F.; Güvenç, I.; Mueller, B. A Survey on Legacy and Emerging Technologies for Public Safety Communications. IEEE Commun. Surv. Tutor. 2017, 19, 97–124. [Google Scholar] [CrossRef]
  55. Zhou, Z.H.; Yu, Y.; Qian, C. Evolutionary Learning: Advances in Theories and Algorithms, 1st ed.; Springer Publishing Company, Incorporated: Berlin/Heidelberg, Germany, 2019. [Google Scholar]
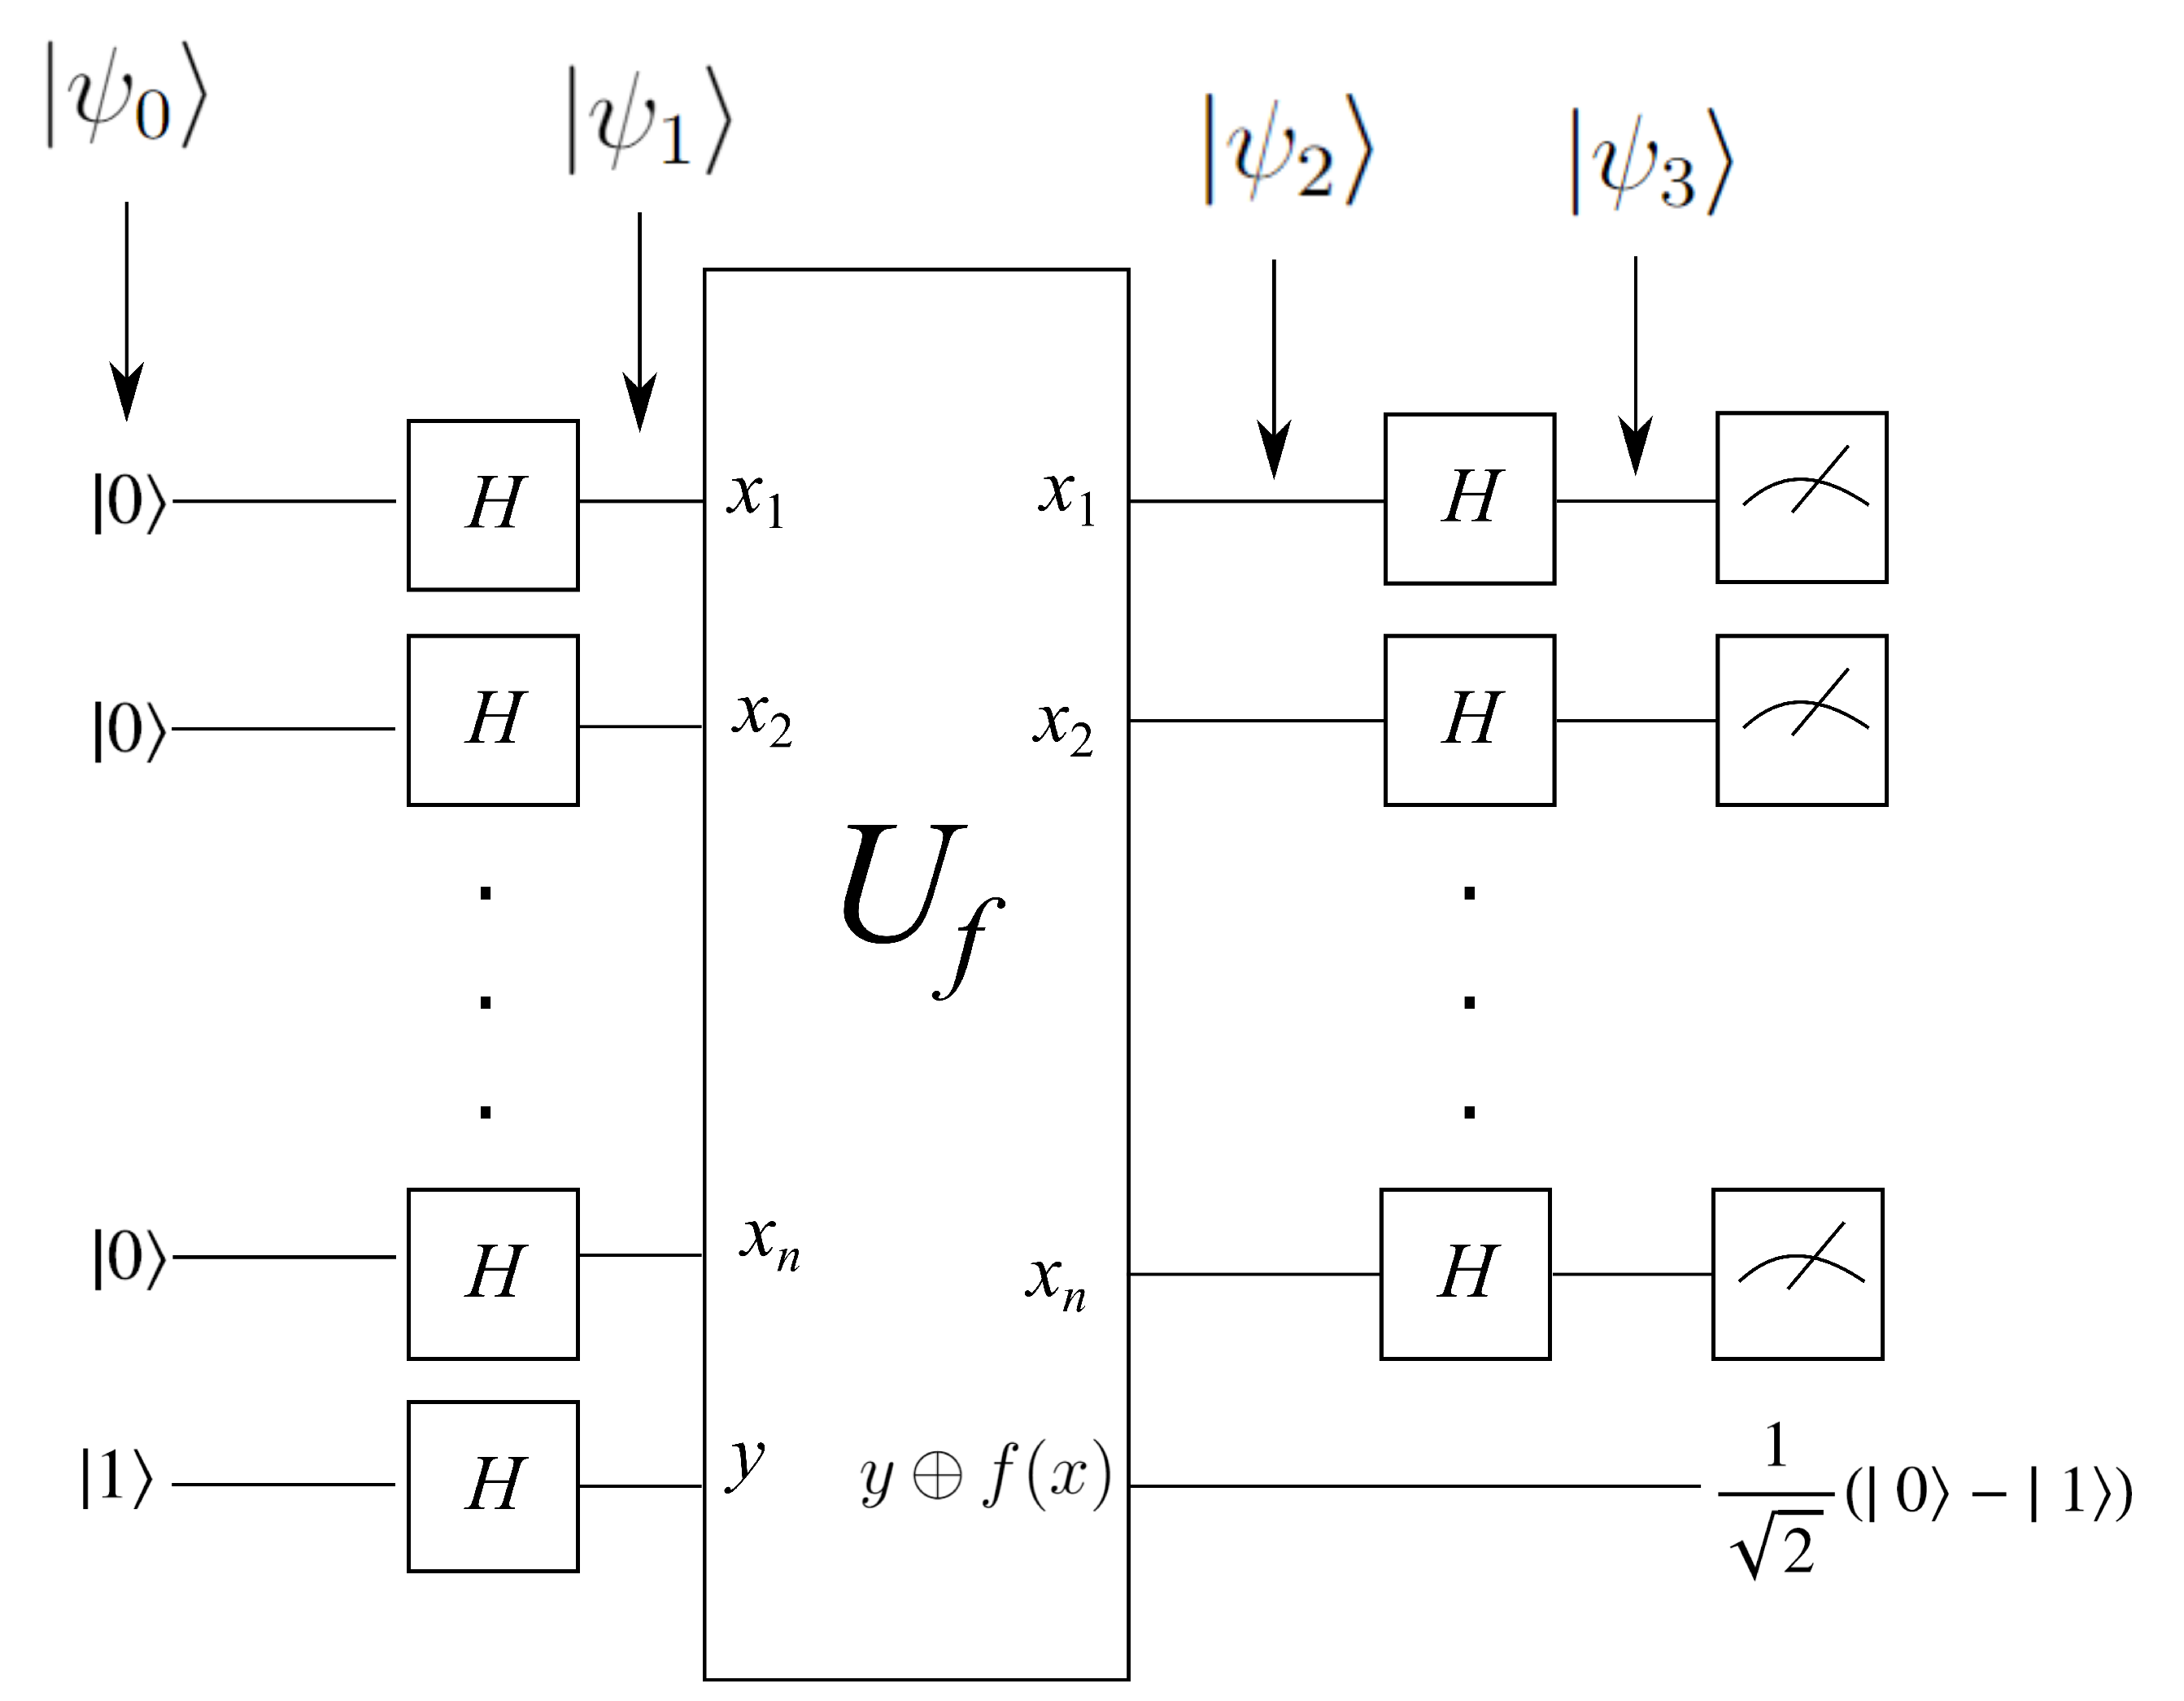
Figure 1. Quantum circuit implementing the Deutsch–Jozsa algorithm. U f represents the Oracle (black-box) or the f ( x ) function. The Oracle can handle x inputs of n-bits string ( | 0 , | 0 , , | 1 ), and it returns a single output, 0 or 1.
Axioms 13 00048 g001
Figure 2. The figure illustrates the arrangement of UAVs and MUs in the simulation scenario, highlighting the coexistence of n MUs and m UAVs.
Axioms 13 00048 g002
Figure 3. This figure illustrates the signal-to-interference ratio (SIR) calculation for the j-th mobile user (MU) within the desired signal. The interferers, located at ( x 2 , y 2 ) and ( x 5 , y 5 ), share the same channel as the transmitter at ( x 1 , y 1 ) .
Axioms 13 00048 g003
Figure 4. Quantum circuit of the HQGAFARA implemented in the IBM Qiskit environment to solve the problem of locating UAVs in disaster zones. In the figure, the Oracle is represented by a square dotted line.
Axioms 13 00048 g004
Figure 5. Hybrid quantum genetic algorithm. The classical computer’s steps are illustrated on the left side, while the steps executed by the quantum computer or quantum simulator are depicted on the right side. In the figure, UAV_ P ( t ) denotes the classic population after being mapped with the classic population, and M A X _ G E N signifies the maximum number of generations. Mobile users are represented by MUs. C represents the maximal number of MUs covered by the set of UAVs.
Axioms 13 00048 g005
Figure 6. Mapping UAV coordinates to the conventional population P ( t ) . The upper part (zeros and ones) illustrates the classical population P ( t ) , while the lower segment portrays the UAV positions stored in M. Here, U m signifies the correspondence between a gene in P ( t ) and a UAV coordinate in M. A UAV_ P ( t ) population is established.
Axioms 13 00048 g006
Figure 7. Membership functions of the fuzzy inference system input in the HQGAFARA. The horizontal axis depicts the coverage (C) percentage given by the set of UAVs. The vertical axis μ ( C ) represents the coverage percentage membership for a given fuzzy set.
Axioms 13 00048 g007
Figure 8. Membership functions of the fuzzy inference system output in the HQGAFARA. The horizontal axis θ depicts the rotational angle for the quantum rotational gate R y ( θ ) . The vertical axis μ ( θ ) represents the rotational angle membership for a given fuzzy set.
Axioms 13 00048 g008
Table 1. Linguistic input and output variables and terms for the FIS. In the first column, the variable name represents the input (C) and output ( θ ) of the fuzzy system; in the second column, the term name is the name assigned to each membership function; in the third column, the type represents the shape of the membership functions; and finally, in the last column, the parameter depicts the range of the universe of discourse for each membership function.
Variable NameTerm NameTypeParameters
CVLCTrapezoidal[0, 0, 0.1, 0.2]
CNCTriangular[0.1, 0.2, 0.3]
CLCTriangular[0.2, 0.3, 0.4]
CSCTriangular[0.3, 0.4, 0.5]
CCTriangular[0.4, 0.5, 0.6]
CGCTriangular[0.5, 0.6, 0.7]
CVGCTriangular[0.6, 0.7, 0.8]
COCTrapezoidal[0.7, 0.8, 1, 1]
θ DALTrapezoidal[−2 π , −2 π , −3 π /2, − π ]
θ DLTriangular[−3 π /2, − π , − π /2]
θ DELTriangular[− π , − π /2, 0]
θ DNDITriangular[− π /2, 0 , π /2]
θ ILTriangular[0, π /2, π ]
θ IALTriangular[ π /2, π , 3 π /2]
θ IAL2Trapezoidal[ π , 3 π /2, 2 π , 2 π ]
Table 2. Fuzzy rule matrix of the FIS.
VLCNCLCSCCGCVGCOC
IAL2IALILDELDLDELDNDIDNDI
Table 3. Parameters used in the emergency LTE mobile network.
ParameterValues
M U n transmit power P T n 24 dBm
U m transmit power P T m 73 dBm
Altitude of U m 150 m
Height of M U n 1.5 m
Frequency f c 700 MHz
Table 4. Experimental results for the best-case scenario. M represents the number of UAVs in the affected area, and CI represents the confidence interval. The best results are presented in bold.
MAlgorithmBestMeanWorstStdCI
5GA0.360.330.2961.47 × 10 2 6.92 × 10 3
HQGAARA- θ 1 0.3560.3380.3286.65 × 10 3 3.13 × 10 3
HQGAARA- θ 2 0.3580.3360.3228.78 × 10 3 4.13 × 10 3
HQGAFARA0.3480.330.3187.48 × 10 3 3.52 × 10 3
10GA0.6040.5390.4962.64 × 10 2 1.24 × 10 2
HQGAARA- θ 1 0.5780.5560.5321.22 × 10 2 5.74 × 10 3
HQGAARA- θ 2 0.5820.5510.5321.37 × 10 2 6.46 × 10 3
HQGAFARA0.5720.5500.5329.62 × 10 3 4.52 × 10 3
20GA0.5340.4570.365.06 × 10 2 2.38 × 10 2
HQGAARA- θ 1 0.5380.4700.4222.46 × 10 2 1.16 × 10 2
HQGAARA- θ 2 0.490.4470.4161.70 × 10 2 8.01 × 10 3
HQGAFARA0.5380.4620.4262.44 × 10 2 1.15 × 10 2
Table 5. Average of the most suitable rotation angles for each quantum algorithm. M depicts the number of UAVs in the affected area. Best case and worst case represent the average rotation angles for the best case and worst case scenarios, respectively.
MAlgorithmBest CaseWorst Case
5HQGAARA- θ 1 ( 7 / 10 ) π π
HQGAARA- θ 2 ( 5 / 10 ) π ( 7 / 10 ) π
HQGAFARA ( 12 / 10 ) π ( 15 / 10 ) π
10HQGAARA- θ 1 ( 9 / 10 ) π ( 8 / 10 ) π
HQGAARA- θ 2 ( 3 / 10 ) π ( 3 / 10 ) π
HQGAFARA ( 1 / 10 ) π ( 16 / 10 ) π
20HQGAARA- θ 1 ( 11 / 10 ) π π
HQGAARA- θ 2 ( 2 / 10 ) π ( 2 / 10 ) π
HQGAFARA ( 3 / 10 ) π ( 16 / 10 ) π
Table 6. Experimental results for the worst-case scenario. M represents the number of UAVs in the affected area, and CI represents the confident interval. The best results are presented in bold.
MAlgorithmBestMeanWorstStdCI
5GA0.1740.1550.1427.27 × 10 3 3.42 × 10 3
HQGAARA- θ 1 0.1680.1600.1523.82 × 10 3 1.80 × 10 3
HQGAARA- θ 2 0.170.1590.1486.23 × 10 3 2.93 × 10 3
HQGAFARA0.1720.1600.1545.31 × 10 3 2.50 × 10 3
10GA0.2660.2460.221.20 × 10 2 5.66 × 10 3
HQGAARA- θ 1 0.2680.2530.2426.11 × 10 3 2.88 × 10 3
HQGAARA- θ 2 0.2740.2530.2387.54 × 10 3 3.55 × 10 3
HQGAFARA0.2640.2530.2425.42 × 10 3 2.55 × 10 3
20GA0.2460.2070.1562.50 × 10 2 1.18 × 10 2
HQGAARA- θ 1 0.2560.2140.1981.24 × 10 2 5.82 × 10 3
HQGAARA- θ 2 0.2380.2080.191.03 × 10 2 4.86 × 10 3
HQGAFARA0.2440.2060.191.20 × 10 2 5.62 × 10 3
Table 7. Statistical test regarding the accuracy and precision in the best-case scenario with five UAVs. α represents the significance level value; d.o.f. means the degrees of freedom.
Shapiro–Wilk test ( α = 0.01)
AlgorithmsGAHQGAARA- θ 1 HQGAARA- θ 2 HQGAFARA
N30303030
W0.9780.9600.9640.942
Critical value0.90.90.90.9
p-value0.7580.3030.3980.101
Hypothesis H0TrueTrueTrueTrue
Welch t-student test ( α = 0.001)
AlgorithmsGAHQGAARA- θ 1 HQGAARA- θ 2 HQGAFARA
d.o.f. 404743
t-value −2.830−2.038−0.045
Critical value 3.5513.5153.538
Hypothesis H0 TrueTrueTrue
Table 8. Statistical test regarding the accuracy and precision in the best-case scenario with 10 UAVs. α represents the significance level value; d.o.f. means the degrees of freedom.
Shapiro–Wilk test ( α = 0.01)
AlgorithmsGAHQGAARA- θ 1 HQGAARA- θ 2 HQGAFARA
N30303030
W0.9700.9730.9400.972
Critical value0.90.90.90.9
p-value0.5330.6270.0890.583
Hypothesis H0TrueTrueTrueTrue
Welch t-student test ( α = 0.001)
AlgorithmsGAHQGAARA- θ 1 HQGAARA- θ 2 HQGAFARA
d.o.f. 414437
t-value −3.150−2.257−2.169
Critical value 3.5513.5263.574
Hypothesis H0 TrueTrueTrue
Table 9. Statistical test regarding the accuracy and precision in the best-case scenario with 20 UAVs. α represents the significance level value; d.o.f. means the degrees of freedom.
Shapiro–Wilk test ( α = 0.01)
AlgorithmsGAHQGAARA- θ 1 HQGAARA- θ 2 HQGAFARA_boots
N30303030
W0.9500.9650.9640.986
Critical value0.90.90.90.9
p-value0.1710.4080.3860.953
Hypothesis H0TrueTrueTrueTrue
Welch t-student test ( α = 0.001)
AlgorithmsGAHQGAARA- θ 1 HQGAARA- θ 2 HQGAFARA_boots
d.o.f. 423529
t-value −1.2841.011−0.741
Critical value 3.5383.5913.659
Hypothesis H0 TrueTrueTrue
Table 10. Statistical test regarding the accuracy and precision in the worst-case scenario with five UAVs. α represents the significance level value; d.o.f. means the degrees of freedom.
Shapiro–Wilk test ( α = 0.01)
AlgorithmsGAHQGAARA- θ 1 HQGAARA- θ 2 HQGAFARA
N30303030
W0.9620.9550.9620.849
Critical value0.90.90.90.9
p-value0.3560.2230.3470.0006
Hypothesis H0TrueTrueTrueTrue
Welch t-student test ( α = 0.001)
AlgorithmsGAHQGAARA- θ 1 HQGAARA- θ 2 HQGAFARA
d.o.f. 445753
t-value −3.512−2.441−3.365
Critical value 3.5263.463.496
Hypothesis H0 TrueTrueTrue
Table 11. Statistical test regarding the accuracy and precision in the worst-case scenario with 10 UAVs. α represents the significance level value; d.o.f. means the degrees of freedom.
Shapiro–Wilk test ( α = 0.01)
AlgorithmsGAHQGAARA- θ 1 HQGAARA- θ 2 HQGAFARA
N30303030
W0.9720.9740.9450.972
Critical value0.90.90.90.9
p-value0.6010.6550.1250.598
Hypothesis H0TrueTrueTrueTrue
Welch t-student test ( α = 0.001)
AlgorithmsGAHQGAARA- θ 1 HQGAARA- θ 2 HQGAFARA
d.o.f. 434940
t-value −2.970−2.771−3.262
Critical value 3.5263.4963.551
Hypothesis H0 TrueTrueTrue
Table 12. Statistical test regarding the accuracy and precision in the worst-case scenario with 20 UAVs. α represents the significance level value; d.o.f. means the degrees of freedom.
Shapiro–Wilk test ( α = 0.01)
AlgorithmsGAHQGAARA- θ 1 _bootsHQGAARA- θ 2 HQGAFARA_boots
N30303030
W0.9520.9670.9300.968
Critical value0.90.90.90.9
p-value0.1940.4680.0510.480
Hypothesis H0TrueTrueTrueTrue
Welch t-student test ( α = 0.001)
AlgorithmsGAHQGAARA- θ 1 _bootsHQGAARA- θ 2 HQGAFARA_boots
d.o.f. 293929
t-value −1.541−0.2330.057
Critical value 3.6593.5583.659
Hypothesis H0 TrueTrueTrue
Table 13. Statistical test regarding the convergence time in the best-case scenario with five UAVs. α represents the significance level value; R+ and R- mean the sum of positive and negative ranks, respectively; W is the statistical value generated by the non-parametric test.
Shapiro–Wilk test ( α = 0.01)
AlgorithmsGAHQGAARA- θ 1 HQGAARA- θ 2 HQGAFARA
Mean233346310449
N30303030
W0.7230.8200.7730.901
Critical value0.90.90.90.9
p-value3.39 × 10 6 1.55 × 10 4 2.16 × 10 5 8.83 × 10 3
Hypothesis H0FalseFalseFalseFalse
Wilcoxon signed ranks test ( α = 0.001)
AlgorithmsGAHQGAARA- θ 1 HQGAARA- θ 2 HQGAFARA
N 303030
W 174.5186.5102.5
Critical value 787878
R+ 174.5186.5102.5
R- 290.5278.5362.5
p-value 2.37 × 10 1 3.49 × 10 1 6.19 × 10 3
Hypothesis H0 TrueTrueTrue
Table 14. Statistical test regarding the convergence time in the best-case scenario with 10 UAVs. α represents the significance level value; d.o.f. means the degrees of freedom.
Shapiro–Wilk test ( α = 0.01)
AlgorithmsGAHQGAARA- θ 1 _bootsHQGAARA- θ 2 _bootsHQGAFARA
Mean368470198556
N30303030
W0.9590.9800.9060.950
Critical value0.90.90.90.9
p-value0.2870.8280.0110.167
Hypothesis H0TrueTrueTrueTrue
Welch t-student test ( α = 0.001)
AlgorithmsGAHQGAARA- θ 1 _bootsHQGAARA- θ 2 _bootsHQGAFARA
d.o.f. 363457
t-value −2.5704.369−3.342
Critical value 3.5823.6013.46
Hypothesis H0 TrueFalseTrue
Table 15. Statistical test regarding the convergence time in the best-case scenario with 20 UAVs. α represents the significance level value; d.o.f. means the degrees of freedom.
Shapiro–Wilk test ( α = 0.01)
AlgorithmsGA-bootsHQGAARA- θ 1 _bootsHQGAARA- θ 2 HQGAFARA
Mean851458163464
N30303030
W0.9800.9490.9730.948
Critical value0.8170.1630.90.9
p-value8.17 × 10 1 0.16250.6180.148
Hypothesis H0TrueTrueTrueTrue
Welch t-student test ( α = 0.001)
AlgorithmsGA-bootsHQGAARA- θ 1 _bootsHQGAARA- θ 2 HQGAFARA
d.o.f. 483830
t-value 42.63853.4787.882
Critical value 3.5053.5663.646
Hypothesis H0 FalseFalseFalse
Table 16. Statistical test regarding the convergence time in the worst-case scenario with five UAVs. α represents the significance level value; d.o.f. means the degrees of freedom.
Shapiro–Wilk test ( α = 0.01)
AlgorithmsGA_bootsHQGAARA- θ 1 _bootsHQGAARA- θ 2 _bootsHQGAFARA
Mean211490449500
N30303030
W0.9640.9490.9590.962
Critical value0.90.90.90.9
p-value0.3981.58 × 10 1 2.94 × 10 1 3.47 × 10 1
Hypothesis H0TrueTrueTrueTrue
Welch t-student test ( α = 0.001)
AlgorithmsGA_bootsHQGAARA- θ 1 _bootsHQGAARA- θ 2 _bootsHQGAFARA
d.o.f. 403530
t-value −23.451−14.840−6.385
Critical value 3.5513.5913.646
Hypothesis H0 FalseFalseFalse
Table 17. Statistical test regarding the convergence time in the worst-case scenario with 10 UAVs. α represents the significance level value; d.o.f. means the degrees of freedom.
Shapiro–Wilk test ( α = 0.01)
AlgorithmsGAHQGAARA- θ 1 _bootsHQGAARA- θ 2 _bootsHQGAFARA
Mean391424202502
N30303030
W0.9160.9480.9640.953
Critical value0.90.90.90.9
p-value2.11 × 10 2 1.46 × 10 1 3.87 × 10 1 2.08 × 10 1
Hypothesis H0TrueTrueTrueTrue
Welch t-student test ( α = 0.001)
AlgorithmsGAHQGAARA- θ 1 _bootsHQGAARA- θ 2 _bootsHQGAFARA
d.o.f. 373154
t-value −0.7704.753−1.692
critical value 3.5743.6333.496
Hypothesis H0 TrueFalseTrue
Table 18. Statistical test regarding the convergence time in the worst-case scenario with 20 UAVs. α represents the significance level value; d.o.f. means the degrees of freedom.
Shapiro–Wilk test (α = 0.01)
AlgorithmsGA-bootsHQGAARA- θ 1 _bootsHQGAARA- θ 2 HQGA-Fuzzy
Mean846522148498
N30303030
W0.9110.9790.9650.972
Critical value0.90.90.90.9
p-value1.61 × 10 2 8.00 × 10 1 4.23 × 10 1 5.95 × 10 1
Hypothesis H0TrueTrueTrueTrue
Welch t-student test ( α = 0.001)
AlgorithmsGA-bootsHQGAARA- θ 1 _bootsHQGAARA- θ 2 HQGA-Fuzzy
d.o.f. 353429
t-value 27.00652.3067.413
Critical value 3.5913.6013.659
Hypothesis H0 FalseFalseFalse
Disclaimer/Publisher’s Note: The statements, opinions and data contained in all publications are solely those of the individual author(s) and contributor(s) and not of MDPI and/or the editor(s). MDPI and/or the editor(s) disclaim responsibility for any injury to people or property resulting from any ideas, methods, instructions or products referred to in the content.