Article

A Sketch-Based Fine-Grained Proportional Integral Queue Management Method

1
School of Internet of Things, Nanjing University of Posts and Telecommunications, Nanjing 210003, China
2
School of Computer Science, Nanjing Audit University, Nanjing 211815, China
*
Author to whom correspondence should be addressed.
Axioms 2023, 12(9), 814; https://doi.org/10.3390/axioms12090814
Submission received: 22 July 2023 / Revised: 17 August 2023 / Accepted: 19 August 2023 / Published: 24 August 2023

Abstract

:
The phenomenon “bufferbloat” occurs when the buffers of the network intermediary nodes fill up, causing long queuing delays. This has a significant negative impact on the quality of service of network applications, particularly those that are sensitive to time delay. Many active queue management (AQM) algorithms have been proposed to overcome this problem. Those AQMs attempt to maintain minimal queuing delays and good throughput by purposefully dropping packets at network intermediary nodes. However, the existing AQM algorithms mostly drop packets randomly based on a certain metric such as queue length or queuing delay, which fails to achieve fine-grained differentiation of data streams. In this paper, we propose a fine-grained sketch-based proportional integral queue management algorithm S-PIE, which uses an additional measurement structure Sketch for packet frequency share judgment based on the existing PIE algorithm for the fine-grained differentiation between data streams and adjust the drop policy for a differentiated packet drop. Experimental results on the NS-3 simulation platform show that the S-PIE algorithm achieves lower average queue length and RTT and higher fairness than PIE, RED, and CoDel algorithms while maintaining a similar throughput performance, maintaining network availability and stability, and improving network quality of service.

1. Introduction

Facing 2030+, with the full emergence and digital development of 6G networks and the continuous convergence of advanced technologies, such as mobile communications, cloud computing, big data, IoT, and artificial intelligence, the research on low-latency and high-reliability networks has received extensive attention. For example, modern technologies such as telemedicine and real-time VR require both perfect network connectivity and low-latency performance support. Traditional transmission control protocol (TCP) congestion control technology has gradually failed to meet growing transmission demands [1]. Moreover, to avoid packet loss, network devices tend to deploy large buffers, which can cause severe bufferbloat problems [2], increase queuing latency, and reduce the user-perceived Internet speed, especially for latency-sensitive applications that can significantly degrade their performance.
The active queue management (AQM) algorithm is considered an effective solution for improving bufferbloats. Unlike the traditional FIFO approach, the AQM algorithm alleviates network congestion by actively dropping packets in advance of the queue overflow. In the case of a high service volume, the AQM algorithm can provide orderly message forwarding and manage the scheduling of messages in the queue before the queue is full, which ensures the throughput and stability of network transmission and improves the quality of service of the network. Various AQM algorithms have been proposed in recent years, mainly random early detection (RED) [3], BLUE [4], controlled delay (CoDel) [5], proportional integral controller enhanced (PIE) [6], etc. However, these existing AQM algorithms drop data packets frequently and randomly in order to guarantee certain metrics, such as buffer queue length, queuing delay, etc., resulting in some TCP flows with weaker transmission capacity and lower bandwidth utilization being more impaired. The research goal of this study is to perform the fine-grained identification of data streams on the basis of guaranteeing the stability and throughput of data streams.
To address the problem that the existing AQM algorithm cannot identify the network congestion status and distinguish the packet drop at a fine-grained level, this paper introduces the traffic measurement method into the traditional AQM algorithm PIE and proposes a Sketch-based proportional integral queue management algorithm S-PIE. The Sketch helps to find out which packets are in “large flows”, i.e., which flows are congestion-causing flows, to decide which packets are more likely to be dropped, to reduce the bandwidth pressure when congestion is likely to occur, and to maintain better fairness. S-PIE has the following main features: (1) the Sketch structure is used to map and store the message information, and then the frequency of transmission of the current message in a certain time period can be obtained by querying the index of the Sketch, and to determine whether the packet corresponding to that data stream has a high traffic volume, so as to execute a differential drop policy; (2) the algorithm has lightweight characteristics, querying the frequency values of corresponding messages through Sketch and calculating the frequency of different data streams forwarded by the weighted averaging method, which has better robustness; (3) S-PIE can improve fairness between data flows and reduce queuing latency while maintaining throughput.
The remainder of this paper is organized as follows. Section 2 describes the related work, including the active queue management algorithm used in this study and some related research advances. Section 3 presents the design of the proposed S-PIE algorithm. Section 4 presents an experimental and performance comparison that analyzes and compares the experimental results of the S-PIE algorithm with those of other classical AQM algorithms in different scenarios. Finally, Section 5 summarizes the research results and discusses the future work.

2. Related Works

Queue management methods play an important role in data transfer by effectively improving data transfer performance and ensuring fairness and reliability among streams as much as possible. These can be divided into early passive queue management and active queue management, which have evolved rapidly in recent years.
Passive queue management (PQM) is similar to the traditional “DropTail”. Generally, the router sets a maximum value for the queue in this algorithm. When the queue length reaches the threshold, the next packets are dropped indiscriminately until the queue length returns to the threshold [7]. With the increase in network traffic and the development of network architecture, passive queue management problems of full queues, slow storage deadlocks, and global synchronization are becoming more common [8]. Based on this, active queue management (AQM) algorithms have been proposed, which actively drop packets in router buffers before congestion occurs and send congestion feedback information to the source to effectively reduce or avoid congestion; they have become mainstream queue management methods in the industry and academia.
Floyd and Jacobson et al. proposed the RED [3], which is mainly based on the average length of the queue to determine whether packets are dropped or not, but the RED algorithm is very sensitive to parameter configuration and network state, which can lead to the synchronization of multiple TCPs under specific network load conditions, easily causing problems such as queue oscillation, reduced throughput, and increased delay jitter, as well as difficulties in parameter adjustment in the actual network deployment.
In response to the lag problem caused by AQM algorithms that use the average queue length as a measure of network congestion, researchers have proposed some new AQM algorithms, such as BLUE [4], which adjusts the packet marking drop probability by link idle and buffer overflow conditions and manages congestion by using packet drop events and link idle events. Although the BLUE algorithm can accomplish congestion control using a small queue cache, it still suffers from parameter setting problems, especially when the number of TCP connections changes drastically, which makes the set parameters invalid and causes the queue to fluctuate drastically between packet drop and low-utilization states.
Nichols and Jacobson et al. proposed CoDel [5] for the bufferbloat problem to determine network congestion based on the packet delay in the queue, where packets are set a timestamp when they enter the queue, and then packet drop is judged based on the packet sojourn time in the queue. The FqCoDel [9] algorithm is the derivative version of CoDel and can effectively solve the bufferbloat problem by preprocessing different data streams and then entering the queues in different states controlled by CoDel. COBALT(the CoDel and BLUE Alternate algorithm) [10] is currently used in Linux4.19. When there is no response flow, COBALT significantly reduces the queue waiting time.
Modeling the system is the basis for exploring the problems of automatic control theory. A well-known nonlinear TCP/AQM model designed based on fluid theory was proposed by Hollot et al. [11] and has been used ever since. Hakkı et al. designed a PI controller based on the TCP/AQM network model [12] to provide feedback control on network congestion in AQM. The PIE [6] algorithm is also based on the controller and was proposed based on the bufferbloat problem, which combines the advantages of the easy implementation of RED and CoDel, using the rate of packets out of the queue to calculate the packet drop probability and then randomizing packet drop based on the moving trend of the delay. The parameters of the PIE algorithm are self-adjusting and can be based on the current average queuing delay without the need to perform additional processing for each packet, thus, incurring very little overhead and being easy to implement in the hardware and software.
In the context of data center networks, ref. [13] proposed the delay control-based congestion control algorithm DX, which uses control theory to effectively reduce the queuing delay in the network while maintaining a high network throughput and ensuring good stability of the system. Pan C et al. [14] reconfigure the packet drop policy model based on the average queue-length change rate, effectively mitigating the delay jitter problem generated by network traffic changes. Another AQM technique [15] uses a semi-Markov decision process to estimate the probability of dropping an arriving packet before it enters the buffer but requires manual setting of the target delay for various network types. Jakub Szyguła et al. [16] proposed an adaptive mechanism, multiplicative increase/reduction (MID), which minimizes the queuing delay by eliminating queues generated by AQM that depend on fixed targets, thereby achieving lower latency and jitter. Sanjeev Patel et al. proposed ALTDROP [17], a random-drop adaptive queue management algorithm based on the average queue-size change rate, which can achieve better throughput in the presence of network congestion.
Yuliang Li et al. 2019 proposed high precision congestion control (HPCC) [18], which uses in-network telemetry (INT) to obtain accurate link load information and precisely control traffic. By dealing with the problems of delayed INT information and overreaction to INT information during congestion, HPCC can simultaneously achieve the three properties of ultralow latency, high bandwidth, and stability. Szyguła et al. [19] used machine learning to create a model that replicates the behavior of the AQM mechanism, proposed a neural network-based AQM mechanism, and demonstrated its effectiveness. Refs. [20,21] also proposed AQM algorithms based on neural networks. In the literature [22,23], a mechanism based on neural network decision-making for selecting AQM parameters is proposed, utilizing a reinforcement learning approach. The literature [24] presents an improved AQM algorithm based on long short-term memory (LSTM) networks, leveraging LSTM’s characteristics to predict and compensate for network delays, exhibiting good responsiveness in dynamic networks. In recent years, active queue management algorithms based on fuzzy logic control [25,26] and optimization theory [27,28] have been proposed.
These AQM algorithms are designed for specific performance or specific scenarios of the network, determine the network state according to a scheme, and then apply the same drop policy to packets indiscriminately to relieve congestion, although they lack fine-grained differentiation between data streams and are unable to meet the performance requirements of both low latency and high fairness. Therefore, this paper proposes a Sketch-based proportional integral queue-management method based on the PIE algorithm, which first calculates the departure rate of packets in the queue buffer and the queue length, calculates the packet drop probability p based on this, and then uses the Sketch structure to judge the frequency count percentage of packets to identify large flows and makes targeted modifications to the packet drop probability of large flows in order to quickly alleviate network congestion based on a differentiated packet drop policy to ensure fairness among data flows, maintain network availability and stability, and improve the quality of service of the network.

3. System Model

This section details the algorithmic idea of the Sketch-based fine-grained proportional integral queue-management algorithm S-PIE that is proposed in this paper. As shown in Figure 1, S-PIE adds a Sketch-based traffic statistics module to PIE, uses the Sketch measurement structure to assist in mapping the frequency of packets passing through the queue, and evaluates the data flows that account for a larger proportion of the queue, that is, large flows, based on the frequency of current packet occurrences. Then, the drop policy of the original queue-management method PIE is adjusted to achieve a fine-grained queue-management policy. The architecture of S-PIE is divided into a traffic statistics part and a queue-management part, which are described in detail below.

3.1. Traffic Statistics

The flow statistics part of the S-PIE is mainly implemented using the measurement structure Sketch [29]. Sketch is a lightweight data structure that maps packet information arriving into a two-dimensional array by means of key-value pairs. A more accurate evaluation of the message frequency is achieved with a small time–space overhead. Thus, our goal is to introduce the measurement structure Sketch into the queue-management algorithm, use the frequency counting function of the Sketch structure to identify large flows, implement a discriminatory packet drop policy based on rapid network congestion relief, ensure fairness among data flows, and maintain the availability of the network. Typical Sketch has count-min Sketch (CM Sketch) [30], conservative update Sketch (CU sketch) [31], count Sketch (C Sketch) [32], etc.

3.1.1. Sketch Structure

A Sketch consists of a two-dimensional array of counters and a set of hash functions that map items to the array, as shown in Figure 2, where the width of the two-dimensional array is w, the depth is d, and the d hash functions h 1 , h 2 , …, h d are independent of each other [33]. An item is processed by mapping it to each row and incrementing the counters to which it was mapped. When a packet arrives, it is mapped and stored in the form of ( k e y , v a l u e ), where the k e y field can be the attribute information in the packet header, such as a five-tuple (source/destination IP, source/destination port, transport layer protocol), the v a l u e field can be the number of occurrences of the flow or the size of the flow.

3.1.2. Basic Operations

The execution process of the traffic statistics module used by Sketch as the S-PIE algorithm is divided into three steps: item mapping, hash table update, and result query.
(1)
Item mapping: when a packet arrives, it is mapped to store the count in the form of ( k e y , v a l u e ). where k e y uniquely represents the data stream from which the packet came, and v a l u e is used to count the packet frequency value of that stream in a two-dimensional array.
(2)
Hash table update: during the execution of the algorithm, the arrival of new packets ( k e y , v a l u e ), d a separate hash function that does the same for k e y is calculated separately and the count operation is updated for the counter in the corresponding hash table. For example, the hash function h with index value i updates the counter, as shown in Equation (1). When the data stream to be calculated is passed and updated, statistics on the frequency of occurrence of the inserted data can be obtained.
c o u n t i , h i k e y i + = value i 1 , 2 , 3 d
(3)
Result query: the Sketch query for packet occurrence frequency estimation. However, because collisions are predicted, the number was potentially incremented by occurrences of other items that were mapped to the same position. Given a collection of counters having the desired count plus noise, the best estimate of the true count of the desired item is to choose the smallest count of Mincount of these counters [30], as shown in Equation (2).
query ( k e y i ) = Mincount [ i , h i ( k e y i ) ]

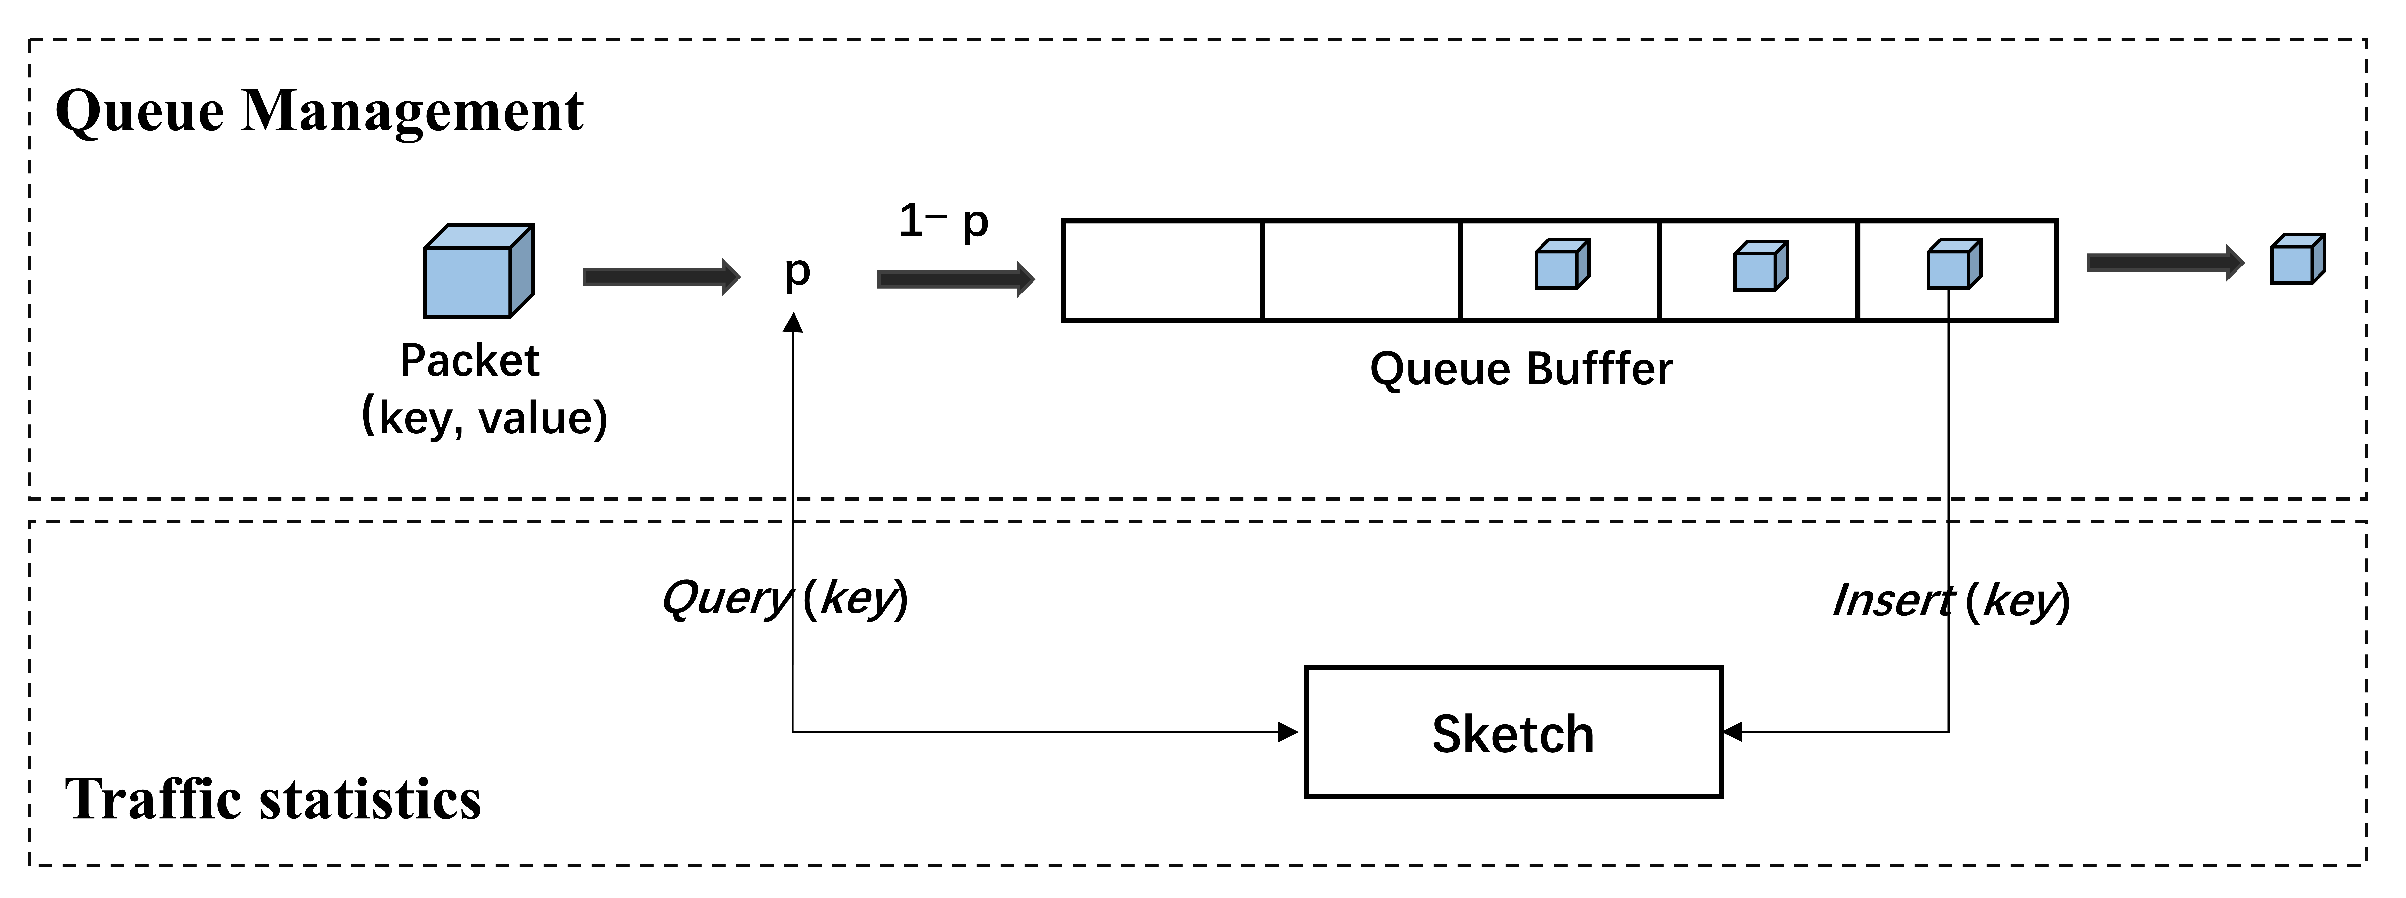
3.2. Queue Management

Based on the PIE algorithm, the queue management part of the S-PIE algorithm adds a Sketch-based traffic statistics module, which is mainly divided into: adding Sketch’s insertion operation and frequency counting function before leaving the queue, adding Sketch’s query operation when judging packet drop before entering the queue, and adjusting packet drop conditions to realize a differentiated packet drop policy. The specific process is as follows.
  • Dequeue: after the packet is queued, the function I n s e r t ( ) of Sketch is called to calculate the mapping position of the packet based on the hash function in the form of ( k e y , v a l u e ). The bucket corresponding to the value is selected for updating, that is, the v a l u e is added to the v a l u e of the packet, and Sketch’s total mapped packet counter m _ c o u n t is updated. After the packet is out of queue, the drop probability is calculated and updated periodically according to the function C a l c u l a t e P ( ) , as shown in Equation (3), according to the working mode of PIE, where p _ o l d is the packet drop probability obtained in the previous calculation cycle. d e l _ c u r and d e l _ o l d denote the current queuing delay and the last estimate of the queuing delay, respectively, and d e l _ r e f denotes the reference value of the delay. α and β are two adjustment parameters. The parameter α determines how the deviation of the d e l _ c u r from the d e l _ r e f affects the drop probability; the parameter β makes an additional adjustment to the drop probability depending on whether the trend of the delay change is increasing or decreasing. d e l _ c u r is calculated as in Equation (4), where q _ l e n is the current queue length and d q _ r a t e _ a v g is the calculated average departure rate, as in Equations (5) and (6), where d q _ c o u n t indicates the number of packets left since the last measurement, and ε is the average parameter. In addition, to prevent short, non-persistent packet bursts that lead to empty queues and render the off-queue rate measurement less accurate, the algorithm sets a threshold value that reduces the off-queue rate d q _ r a t e when the queue length exceeds the threshold value. The flow of the S-PIE algorithm is shown in Algorithm 1.
    p = p _ o l d + α d e l _ o l d d e l _ r e f + β d e l _ c u r d e l _ o l d
    d e l c u r = q _ l e n d q r a t e a ν g
    d q r a t e = d q c o u n t d q t i m e
    d q _ r a t e _ a v g = 1 ε d q _ r a t e _ a v g ( o l d ) + ε d q _ r a t e
  • Enqueue: before the packets enter the queue, it first judges whether the queue is full, and if it is full, the packets are dropped directly. If the queue is not full, the current network state is judged according to the d e l _ c u r obtained when the packets are out of the queue, and if d e l _ c u r < d e l _ r e f /3, the network is considered to be in a relatively uncongested state, and the packets are dropped probabilistically according to the calculated probability p. Otherwise, the network is considered to be in a relatively congested state, and the function Q u e r y ( ) of Sketch is called to obtain the frequency of new packets appearing in the current phase m _ r e s , as shown in Equation (7). The percentage of data stream k corresponding to this packet appearing in the queue at the same time was calculated, as shown in Equation (8), where m _ c o u n t is the total number of packets mapped in Sketch, i.e., the total number of packets passing through the intermediate nodes of the network in the current time period. Then, the threshold G T h r e s h o l d is calculated using Equation (9) when the percentage of the stream occupying the router cache space reaches the set threshold G T h r e s h o l d , i.e., when the packet percentage of a stream exceeds the weighted average queue percentage, the stream is judged to be a large stream and the packet is dropped. Otherwise, the flow corresponding to the packet is considered to be a small flow and is allowed to enter the queue. The flow of the S-PIE algorithm is shown in Algorithm 2.
    m _ r e s = Q u e r y ( k e y )
    G k = m _ r e s m _ c o u n t
    G T h r e s h o l d = i = 1 n m _ r e s G κ i = 1 n m _ r e s
Algorithm 1 DoDequeue for S-PIE
1: if q _ l e n > q _ t h r e s h o l d  then
2:     CalculateP() for t i m e _ u p d a t e ;
3: whileT > T t h r e s h o l d  do
4:     ClearMemory;
Algorithm 2 DoEnqueue for S-PIE
  1:
for each arriving packet p k t  do
  2:
     if queue is full then
  3:
         drop p k t ;
  4:
     else if  d e l _ c u r < d e l _ r e f /3 then
  5:
         drop p k t with p;
  6:
         Enqueue( p k t ) with 1-p;
  7:
         Sketch ->Insert( p k t );
  8:
          m _ c o u n t ++;
  9:
     else
10:
          m _ r e s = Sketch->Query( p k t );
11:
          G k = m _ r e s / m _ c o u n t ;
12:
         if  G k < G t h r e s h o l d  then
13:
            drop p k t ;
14:
         else
15:
            Enqueue( p k t );
16:
            Sketch -> Insert( p k t );
17:
             m _ c o u n t ++;

4. Experimental Evaluation

The experimental operating platform is the NS-3.27 network simulation platform and uses Ubuntu16.04. NS-3.27 is an open computer network simulation environment based on a discrete-event simulation that supports a wide range of network technologies, including wired and wireless networks, protocol stacks, routing, traffic control, congestion control, network topologies, etc., making it possible to simulate a variety of network scenarios and applications [34].

4.1. Simulation Scenario Setup

4.1.1. Network Topology

The experiments in this study used the NS-3 simulation platform with a dumbbell topology model, and the network topology is shown in Figure 3. S 1 to S n represent a certain number of packet senders and R 1 to R n represent a certain number of packet receivers. Routing nodes Router1 and Router2 form a bottleneck link. The sender sends messages using an ON/OFF model. In the experiments, the TCP protocol congestion control algorithm NewReno was deployed uniformly on the sender side, and the AQM algorithm was implemented in the router Router1 queue. In the specific simulation experiments, this paper mainly uses two simulation scenarios, Scenario 1 makes a clear distinction between sending packets on the sender side, with half of the senders delivering a large amount of data to simulate a “large flow” and half of the senders delivering a small amount of data to simulate a “small flow”. Scenario 2 does not differentiate between senders but sends random packets to simulate a general scenario. The detailed parameters are listed in Table 1.
Scenario 1: Set 100 nodes on the sender side, the packet rate of S 1 to S n ( 1 n 50 ) is set to 1 Mbps, and the packet rate of S 1 to S n ( 51 n 100 ) is set to 50 Mbps. This scenario is implemented to simulate a scenario where the data flows from S 1 to S n ( 1 n 50 ) are “small flow” and the data flows from S 1 to S n ( 51 n 100 ) are “large flow”.
Scenario 2: Set 100 nodes on the sender side, and the packet rate of S 1 S n is set to 10 Mbps. This scenario implements a simulation of random data flow deployment.

4.1.2. Evaluation Metrics

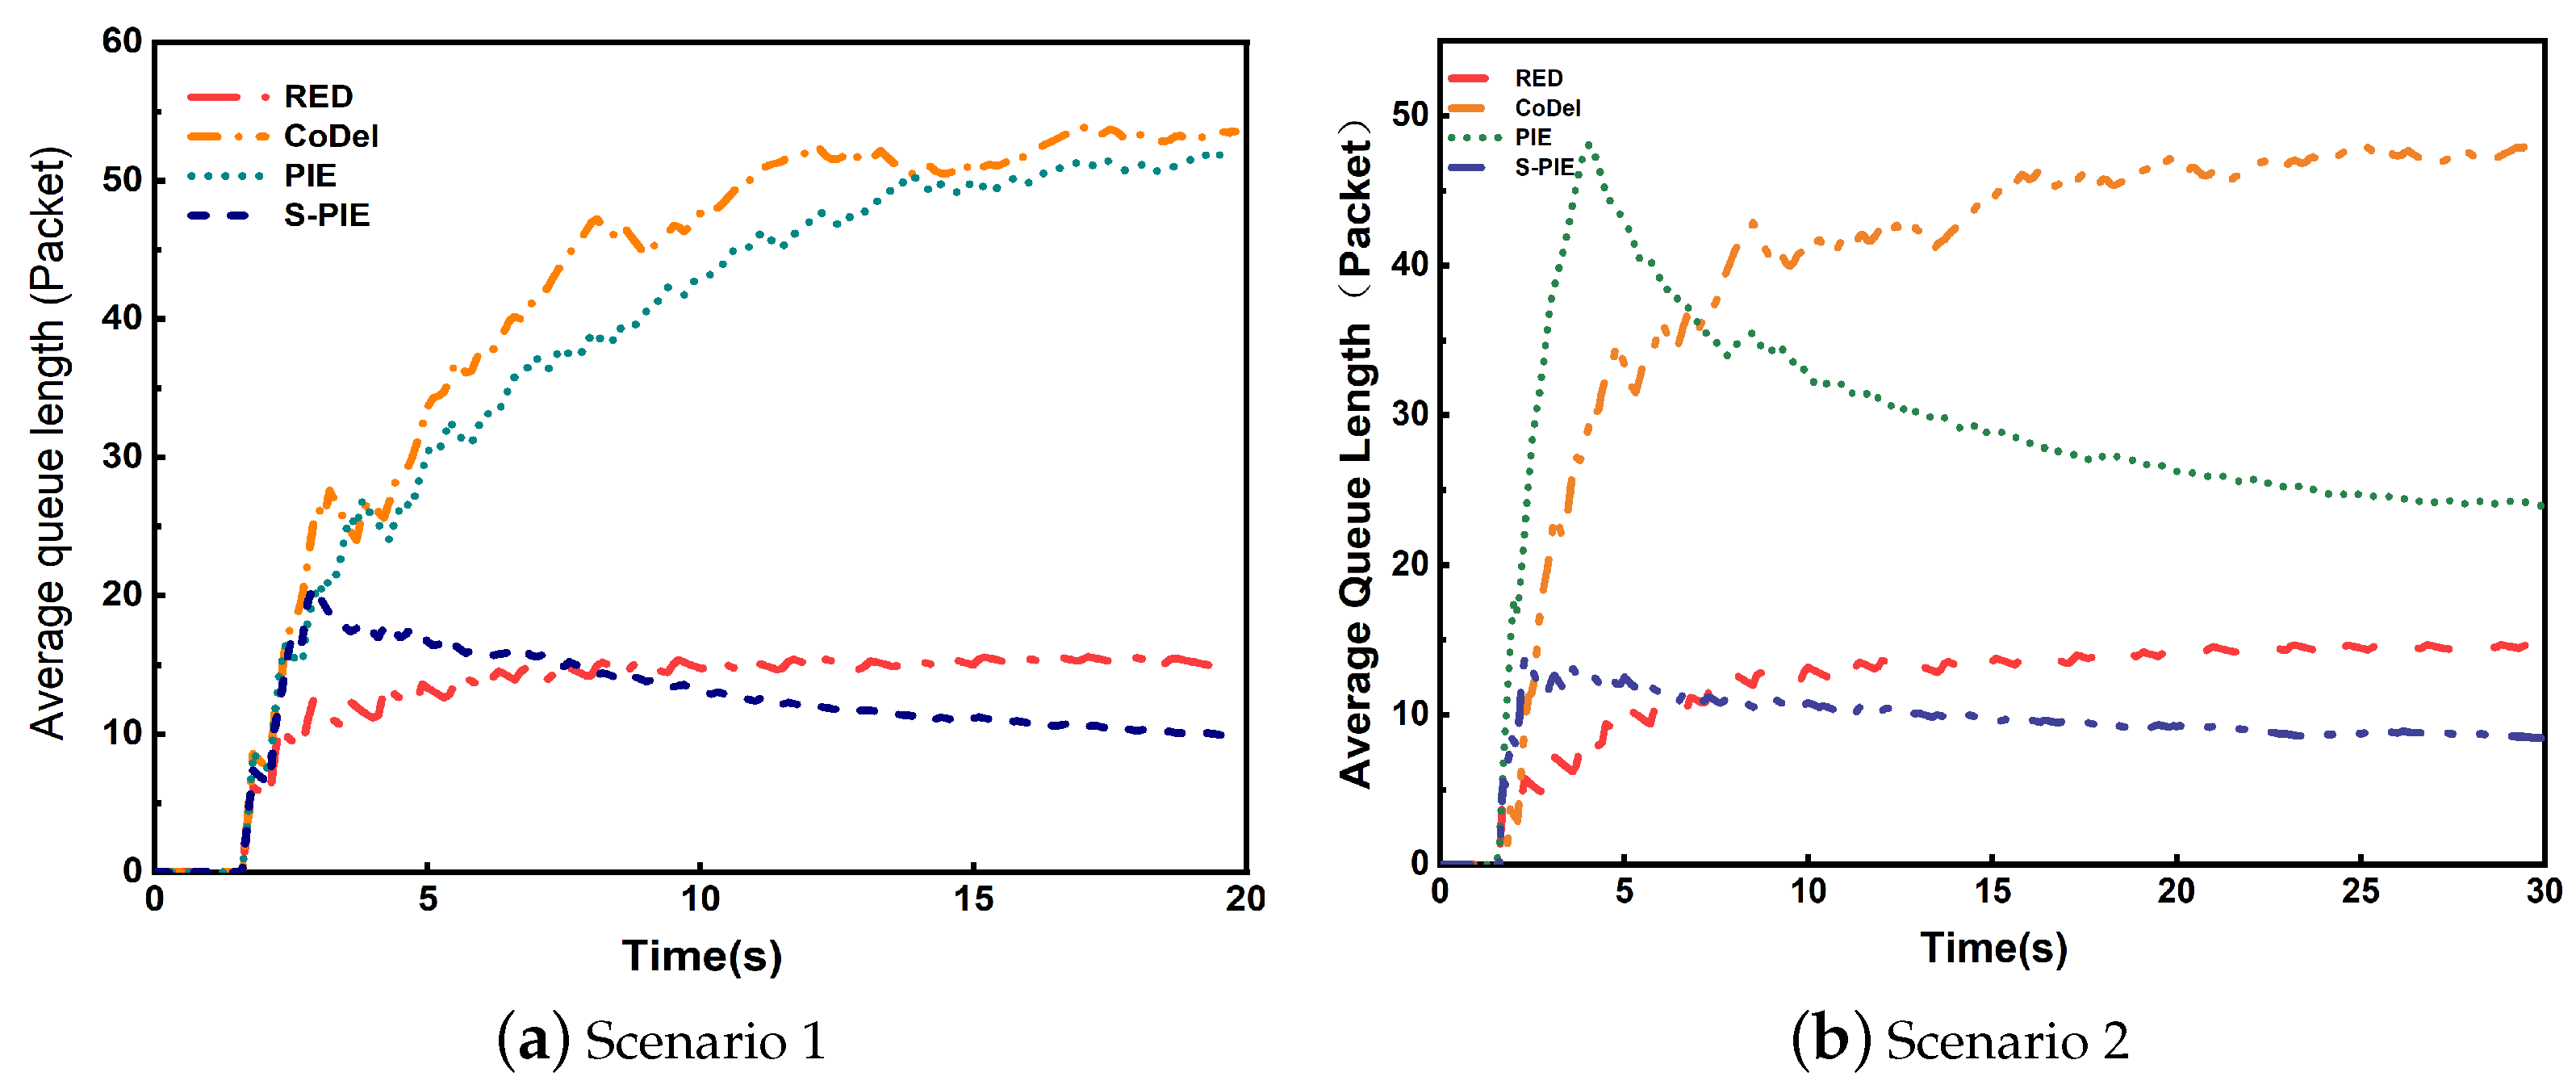
  • Average queue length: this is a crucial indicator to determine how well network congestion is addressed. The degree of queue fullness and the likelihood of network congestion increase with the average queue-length value. Network congestion is significantly decreased if the AQM algorithm is used for early packet drops.
    m = m _ p t c ( n T i m e s T i m e )
    n e w _ q A v g = q W n P k t + o l d _ q A v g 1 q W m
    where m _ p t c represents the packet time constant, n T i m e represents the current time, s T i m e represents the start time of the idle period, n e w _ q A v g and o l d _ q A v g represent the average queue length, q W represents the queue weight of the current queue sample, and n P k t represents the number of packets entering the queue within a period of time.
  • RTT: RTT (round-trip time) indicates the time elapsed from the time a packet is sent by the sender to the time an ACK of that packet is received, and the time measured by RTT includes the transmission time, queuing time, and processing time. Transmission delay refers to the time the packet is used on the link, excluding the waiting time in the device buffer, whereas queuing delay refers to the waiting time of the packet in the device buffer. Therefore, if in the same network, the difference in the RTT of different packets is mainly determined by the queuing delay, which is related to the queue length of the buffer. However, maximizing throughput and minimizing RTT may be orthogonal. High throughput implies utilizing as much link bandwidth as possible, which may increase the queue length and, thus, cause delays.
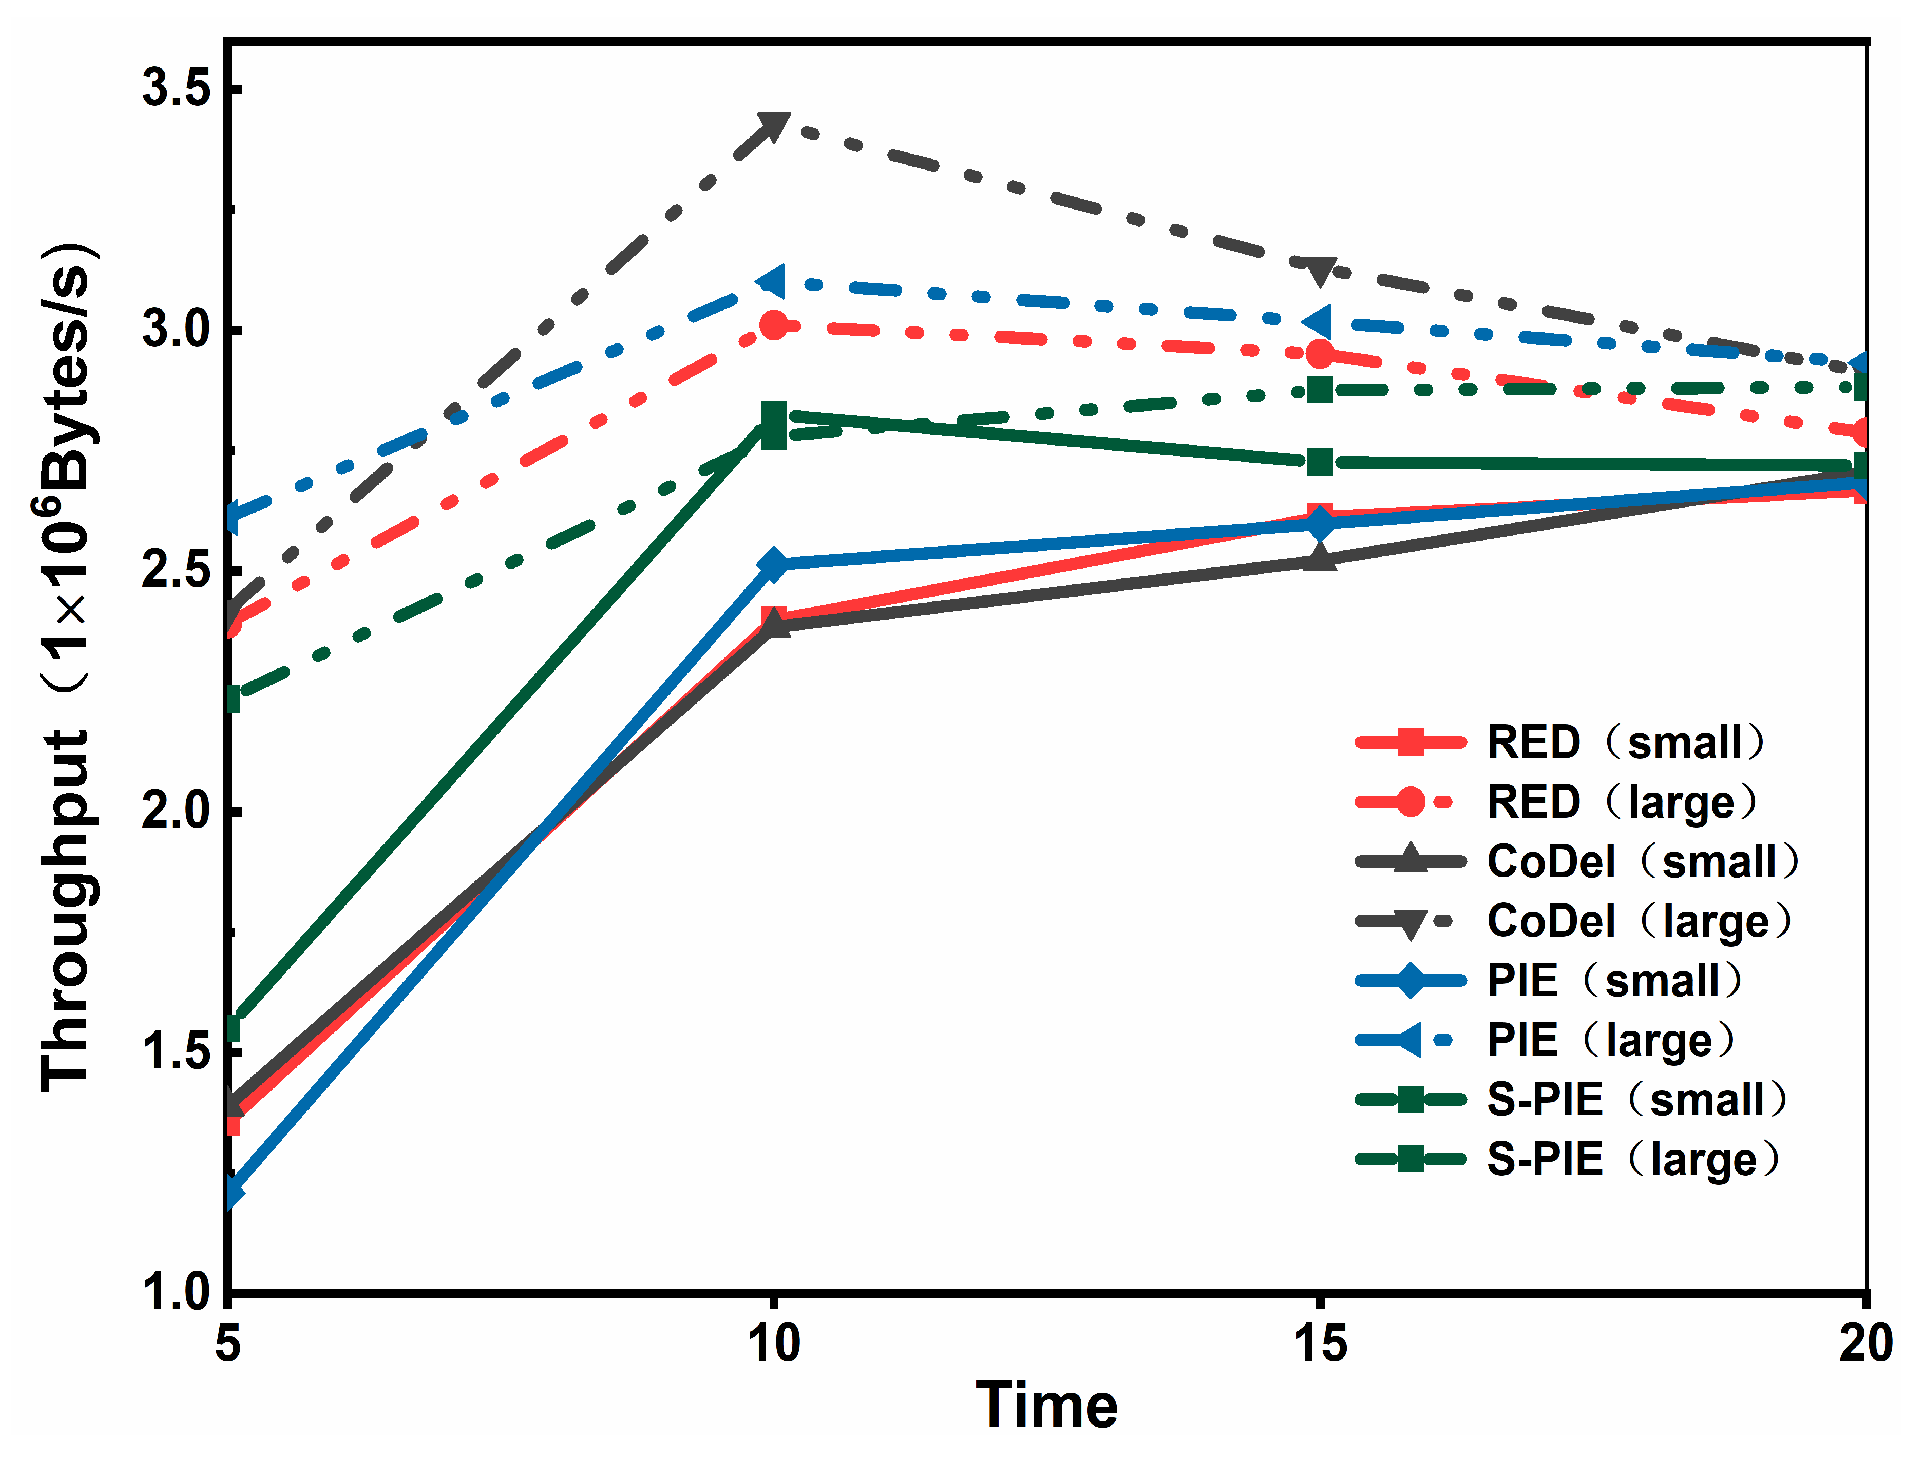
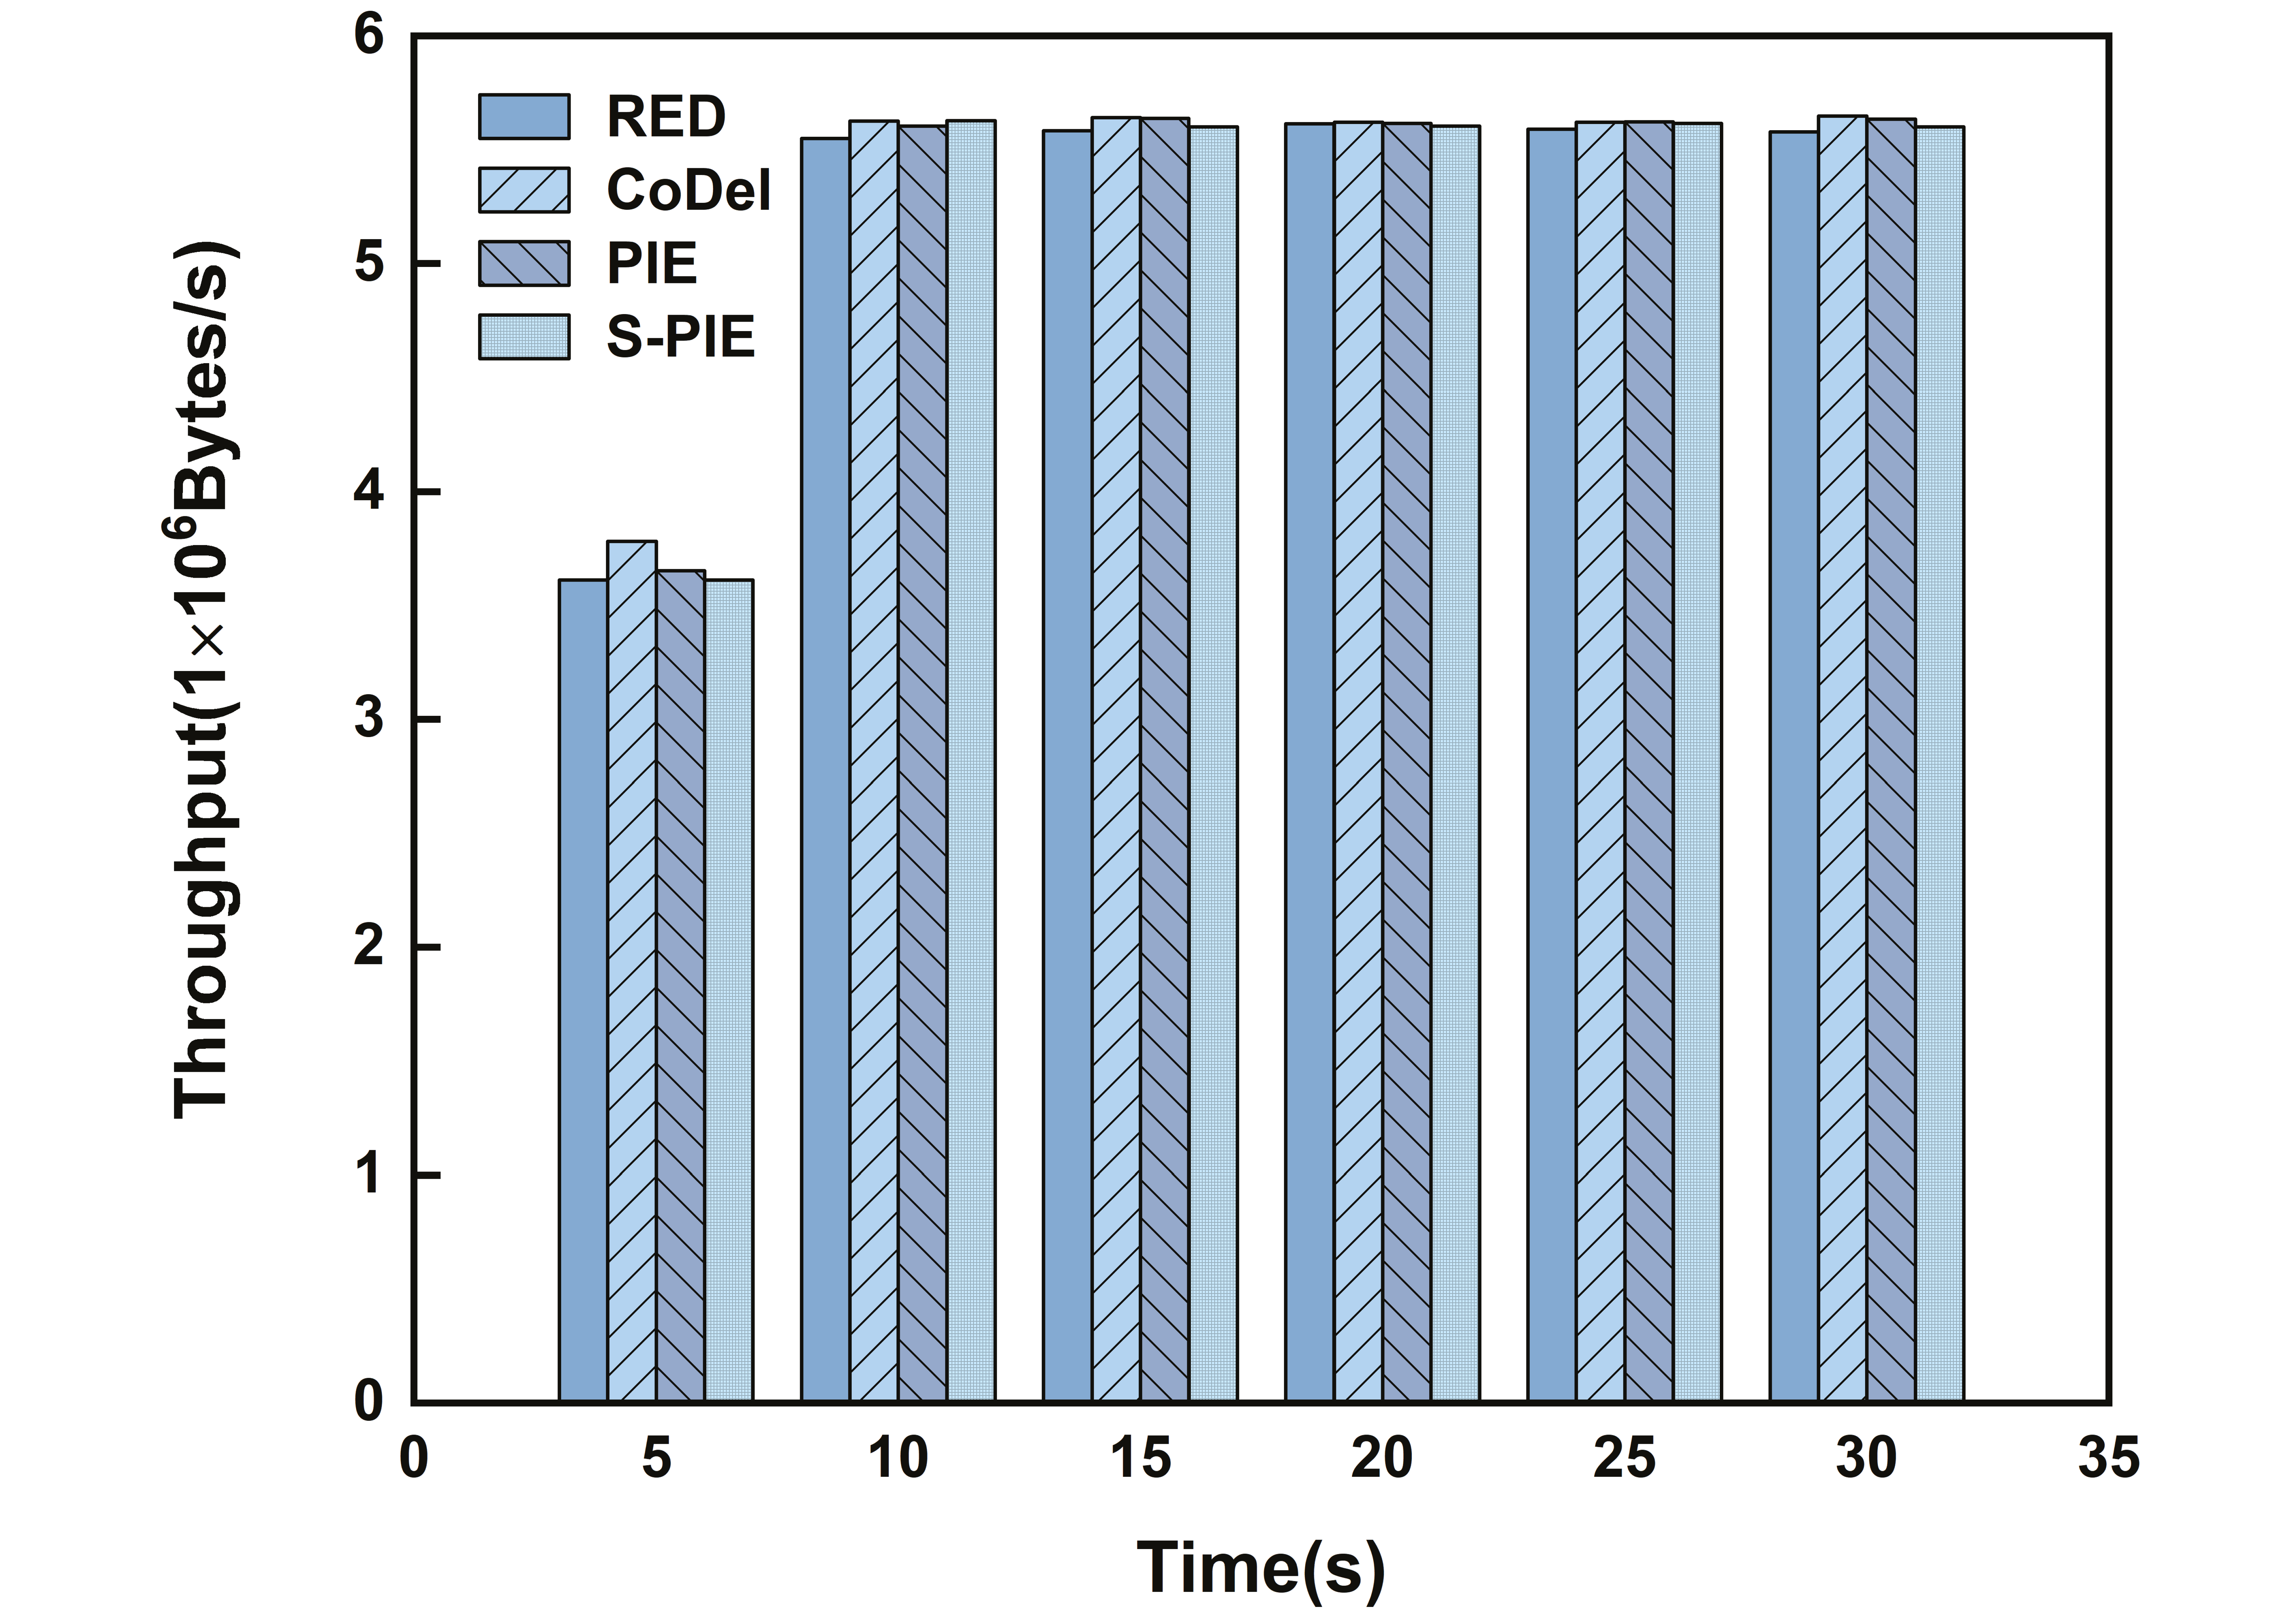
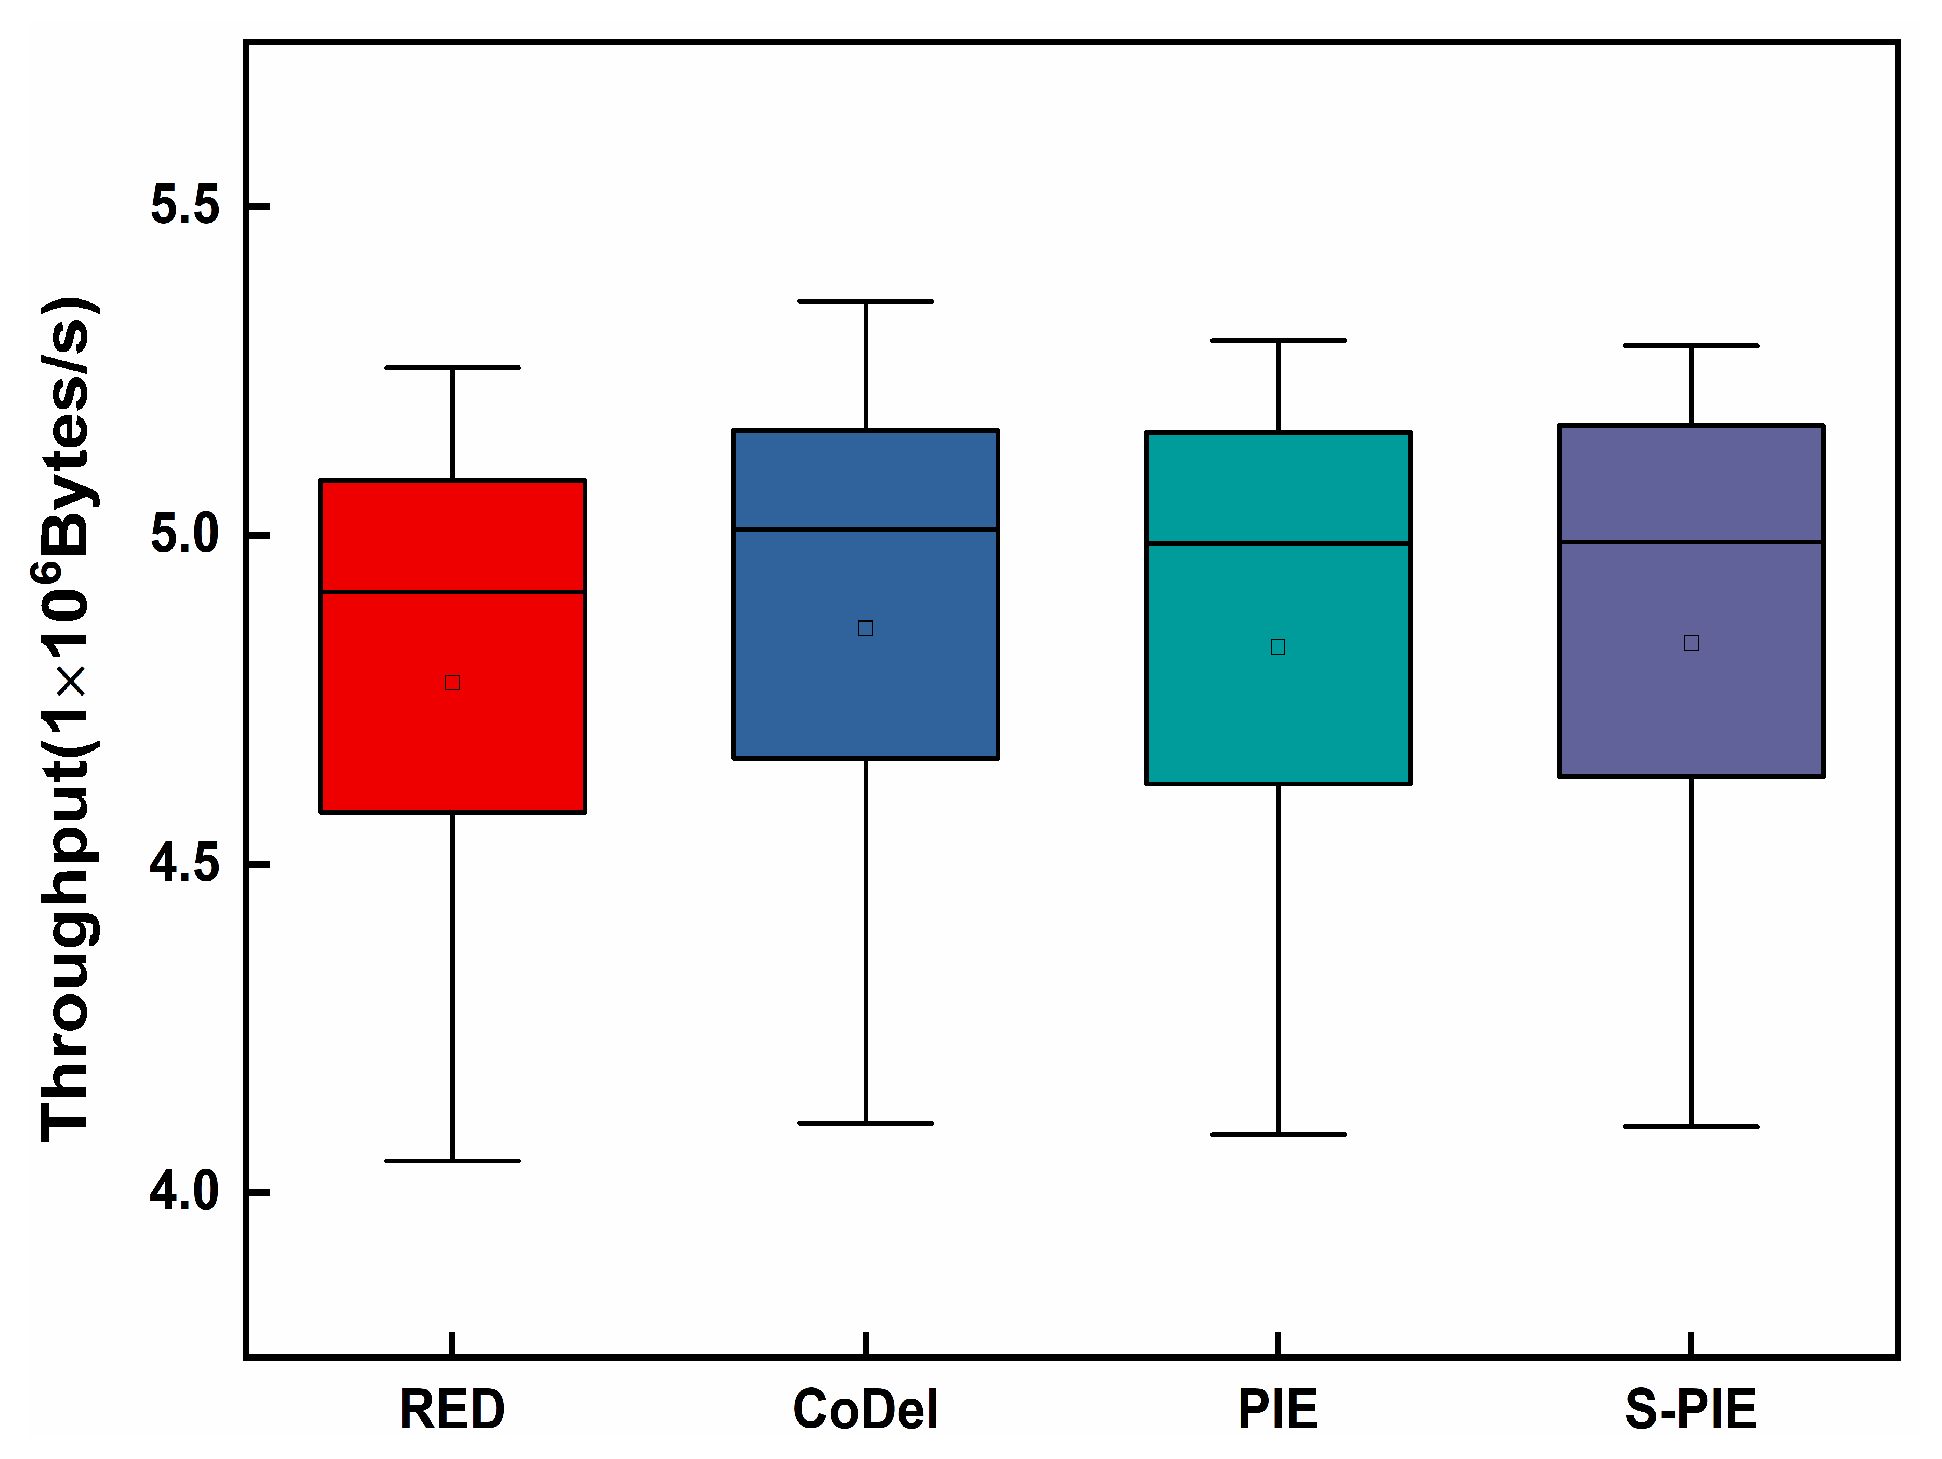
  • Throughput: it is the maximum number of data packets received in a given period. The better the link performance, the higher the throughput.
    T h r o u g h p u t = N T
    where N denotes the number of packets received by all destination nodes over a period of time, and T denotes the time period.
  • Fairness index: Fairness between data streams implies that data streams passing through the bottleneck link can share bandwidth resources equally. The fairness index is used to reflect the fairness between the data streams in this case. The range of the fairness index is [0, 1], as shown in Equation (13); the higher the fairness index, the better the fairness [35].
    F a i r n e s s I n d e x = t h i 2 n t h i 2
    where t h i represents the throughput of each flow.
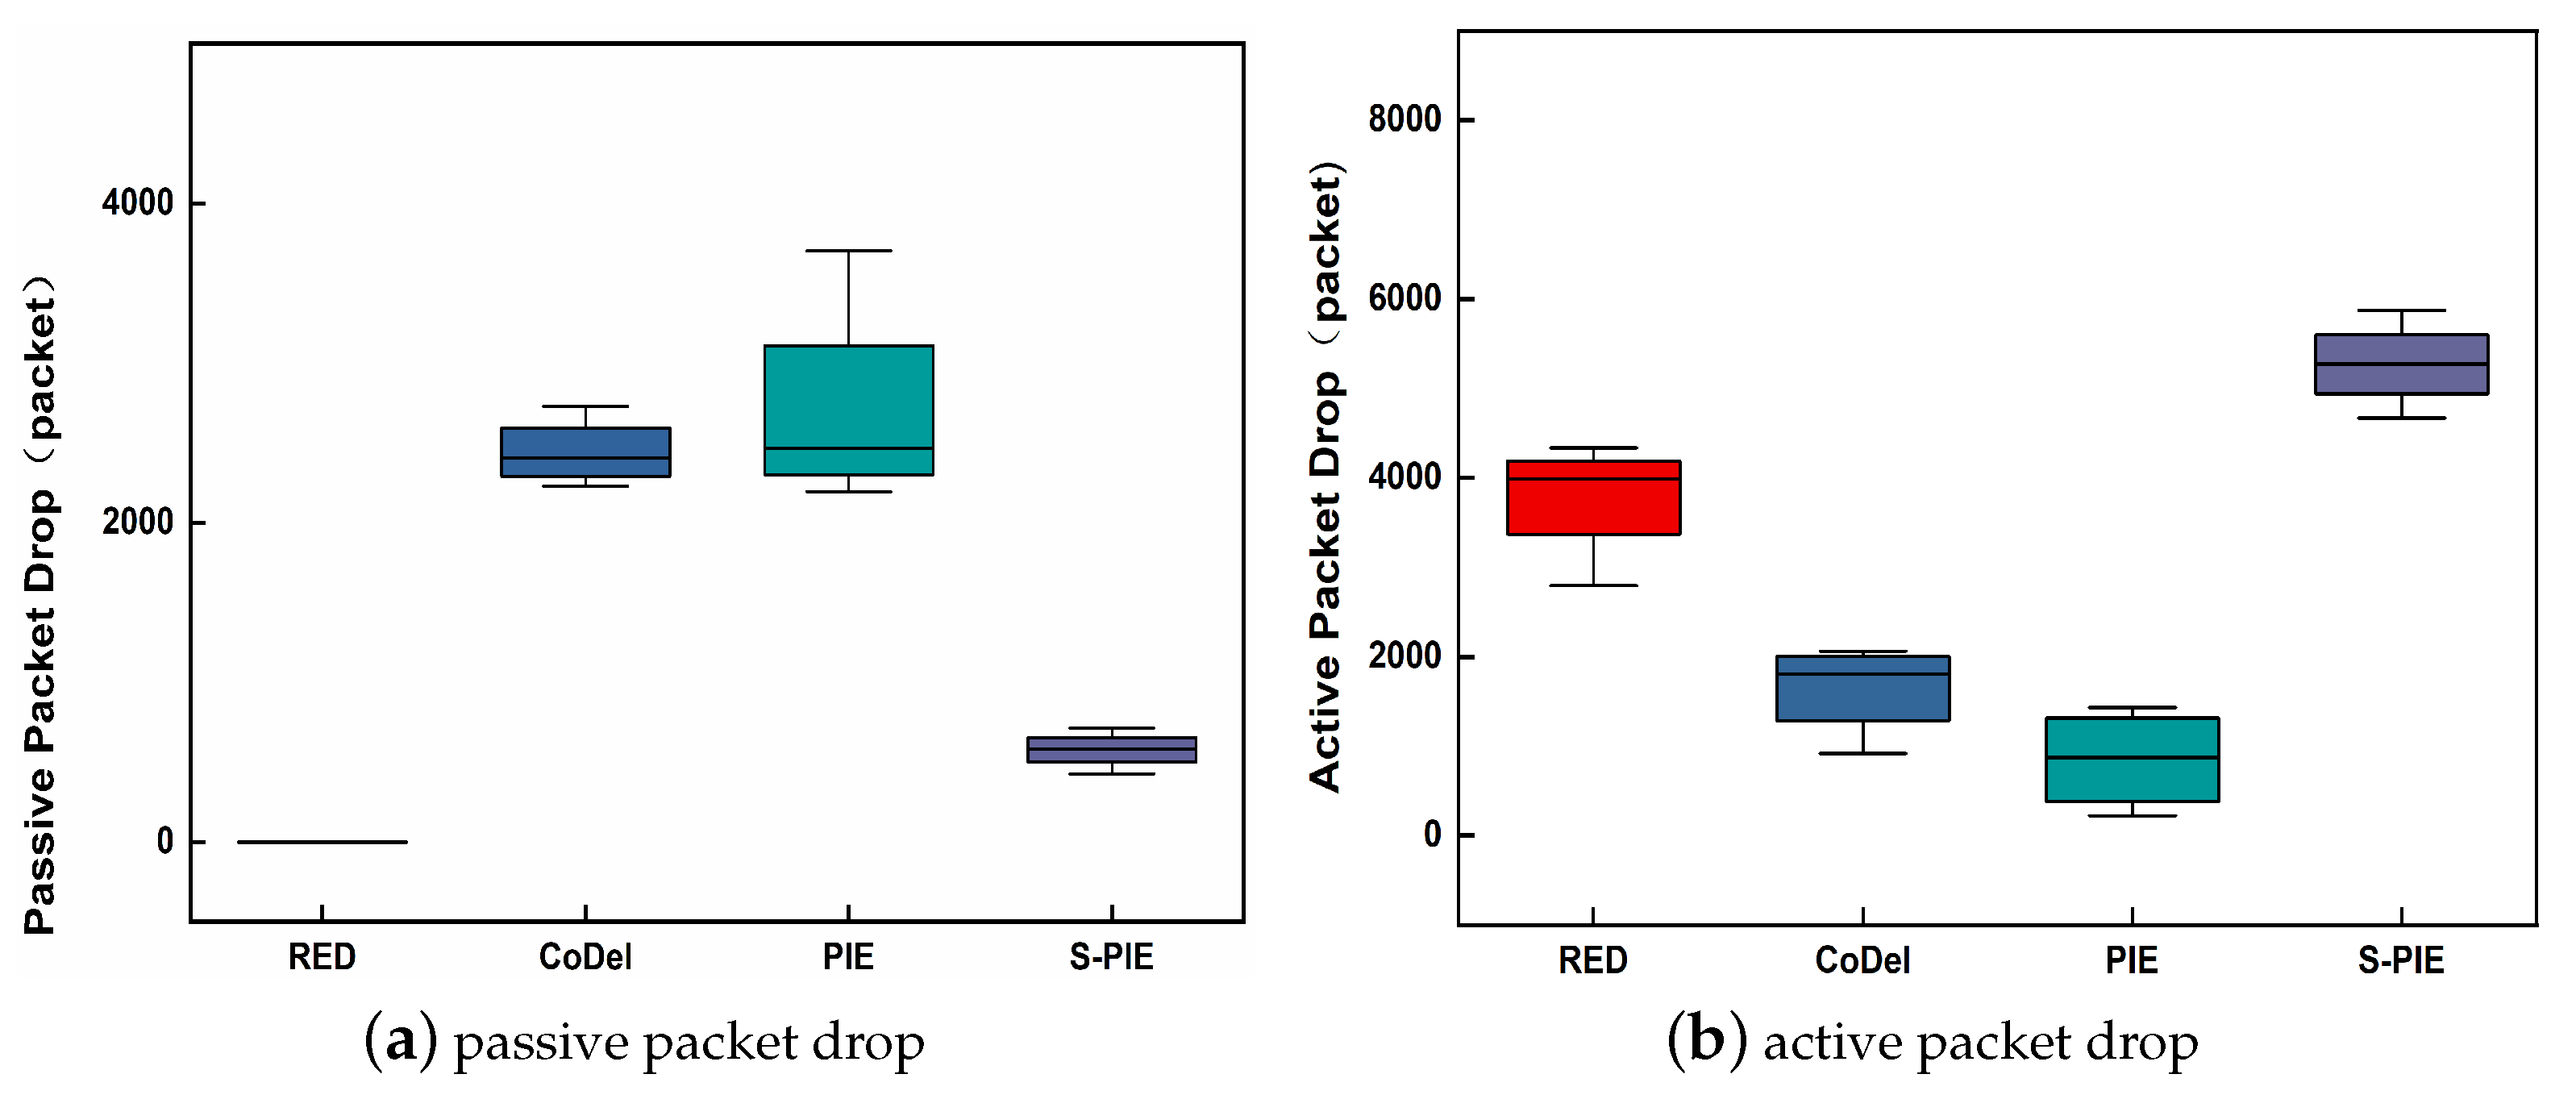
  • Packet drop: active and passive packet drops are two types of packet drops. Active packet drop is the process of identifying and dropping packets before network congestion occurs, using the AQM algorithm. The buffer overflows and must be dropped in the case of passive packet drop. The more active packets that are dropped, the better the performance in predicting network congestion.

4.2. Analysis of Simulation Results

(1)
Average queue length and RTT
Maintaining a short average queue length helps to reduce the queuing time of packets forwarded to the route waiting time, which can effectively alleviate the “bufferbloat” problem.
Figure 4a,b show the average queue lengths of the four algorithms for Scenario 1 and Scenario 2, respectively. From the figures, it can be seen that S-PIE is able to maintain a shorter average queue length than the classical algorithms RED, CoDel, and PIE under the same network environment. During the 20-s simulation period in Scenario 1, the average queue lengths for RED, CoDel, PIE, and S-PIE were measured approximately at 15.08, 53.78, 51.52, and 9.94 packets, respectively. In contrast to the RED, CoDel, and PIE algorithms, the S-PIE algorithm demonstrated significant reductions in average queue length, achieving approximately 34.12%, 81.51%, and 62.23% reductions, respectively. In Scenario 2, throughout the simulation duration, the average queue lengths for RED, CoDel, PIE, and S-PIE were observed to be 14.01, 43.81, 27.97, and 10.66 packets, respectively. In comparison to the RED, CoDel, and PIE algorithms, the S-PIE algorithm exhibited substantial reductions in average queue length, achieving approximately 23.91%, 75.67%, and 61.89% reductions, respectively. Moreover, the average queue length of PIE and CoDel showed a surge when the simulation experiment was carried out for 2 s, during which a large number of data streams came in on the link, and the processing of such burst data streams by PIE and CoDel was flawed, resulting in a possible surge of the queue. The average queue length of the RED and S-PIE algorithms always maintained a more stable state. The core idea of the RED algorithm is to calculate the packet drop rate using the average queue length, which is able to maintain a shorter average queue length than CoDel and PIE. As the experiment proceeds, the S-PIE algorithm starts to gradually decrease and is lower than the average captain of the RED algorithm, indicating that the differentiated packet drop strategy used by the S-PIE algorithm can quickly relieve network congestion, maintain a lower average queue length, and effectively reduce delay.
The average queue length represents the backlog level of the queue, which directly affects the packet queuing waiting time in the buffer, that is, it directly affects queue delay. Figure 5a,b show the RTT of the monitored packets in the two scenarios, respectively. As can be seen from the figure, although S-PIE adds the Sketch-based traffic statistics module and the specific operation adds the insertion operation of Sketch after the packet is queued and the query operation of Sketch before queuing, S-PIE still shows a better RTT performance. In Scenario 1, during the simulation of RED, CoDel, PIE, and S-PIE, the RTT values achieved were 81.34, 85.97, 85.51, and 80.68 ms, respectively. It is noteworthy that S-PIE demonstrated a reduction of 0.08%, 6.15%, and 5.65% in average RTT compared to RED, CoDel, and PIE, respectively. Moving on to Scenario 2, the average RTT values for these four algorithms were measured at 81.84, 85.53, 87.05, and 80.95 ms. Impressively, S-PIE exhibited a decrease of 1.09%, 5.36%, and 7.01% in average RTT compared to RED, CoDel, and PIE, respectively. Moreover, in networks 0–2 s, when packets arrive in large numbers, the packet RTTs of RED, CoDel, and PIE have large peaks and fluctuations, whereas S-PIE is more stable.
(2)
Throughput
Throughput refers to the number of packets received at the receiving end per unit time, and a higher throughput represents the actual transmission capability of the link. In the throughput comparison experiment, we first considered Scenario 1, where there is a significant difference in traffic distribution, and whether the link can allocate reasonable resources for small traffic. Then, by comparing the performance of the average queue length, we found that S-PIE can maintain a shorter average queue length, so we want to test whether S-PIE will cause excessive throughput performance drop in this case.
Figure 6 shows a comparison of the four algorithms in Scenario 1 in terms of throughput at different time periods. Scenario 1 makes a clear distinction between traffic, with 50 nodes simulating sending large flows and 50 nodes simulating sending small flows. As can be seen from the figure, at the 5-s mark, the cumulative bandwidth allocation for large and small flows stands approximately at 40.35, 41.78, 41.33, and 41.18 Mbps for the RED, CoDel, PIE, and S-PIE algorithms, respectively. After the simulation time reaches 5 s, the link utilization reached approximately 80%. Combined with the average queue-length situation in Figure 4a, the network reaches a congested state, and the RED, CoDel, and PIE algorithms have a clear difference in throughput between large and small traffic in this scenario; that is, large flows take up more bandwidth. S-PIE gradually approached the throughput of small flows to the throughput of large flows after 5 s, i.e., a more equitable bandwidth utilization was achieved between large and small flows.
Figure 7 shows a comparison of the throughput of the four algorithms under Scenario 2 for different time periods. In the beginning 0–5 s, the link utilization was still low, and the throughput grew and stabilized as the simulation time was normal, and the sender continued to send packets. Figure 8 shows the average throughput comparison of the four algorithms for multiple experiments. As can be seen from the figure, the S-PIE algorithm maintains a throughput performance similar to the other three AQM algorithms under the same network environment. Combined with the average queue-length implementation in Figure 4b, it is shown that S-PIE can maintain a shorter average buffer queue length with essentially no reduction in algorithm throughput; that is, it can achieve a lower queue delay.
(3)
Fairness
Fairness refers to the fairness of the different flows in a network. The AQM algorithm should guarantee fairness between different flows to avoid some flows taking up too many network resources and affecting other flows.
Figure 9a shows a comparison of the fairness of the four algorithms under Scenario 1. As can be seen from the figure, the fairness of each algorithm gradually improves as the network stabilizes. When there is a significant difference in the size of the data streams, the original classical algorithms RED, CoDel, and PIE all show poor fairness performance. Among these, PIE has the worst fairness in this scenario, and RED can achieve relatively better fairness. The S-PIE algorithm can achieve a higher fairness. In Scenario 1, at the 5-s mark, which represents the period of maximal network instability and diminished fairness across all algorithms, the fairness indices for RED, CoDel, PIE, and S-PIE are recorded approximately as 0.67, 0.64, 0.52, and 0.86, respectively. Amidst this context of comparatively reduced fairness indices, the S-PIE algorithm achieves enhancements of approximately 28.90%, 33.74%, and 63.68% relative to the RED, CoDel, and PIE algorithms, respectively. As illustrated in Figure 9a, within Scenario 1, the RED, CoDel, PIE, and S-PIE algorithms demonstrate network stability by the 20-s mark, concurrently showcasing optimized fairness indices of approximately 0.97, 0.94, 0.92, and 0.99, respectively. In comparison to the RED, CoDel, and PIE algorithms, the fairness index of the S-PIE algorithm was elevated by approximately 2.07%, 4.78%, and 7.17%, respectively. Combined with the comparison of the throughput performance, it can be seen that under Scenario 1, large flows occupy most of the bandwidth, and small flows are bandwidth-constrained. In the case of congestion, the original active queue management algorithms RED, CoDel, and PIE choose to adopt the same packet-drop policy for small and large flows, that is, small flows are dropped with the same drop probability as large flows, so small flows are more affected, making the bandwidth occupation less bandwidth consumption and lower throughput. On the other hand, the S-PIE algorithm drops large flows punitively when the network becomes congested, thus, effectively alleviating the bandwidth resource-sharing problem on bottleneck links and ensuring fairness among data flows.
Figure 9b shows a comparison of the fairness of the algorithms under Scenario 2. As can be seen from the figure, similar to Scenario 1, the fairness indices of all four algorithms exhibit an increasing trend as the simulation time increases. However, compared to Scenario 1, which clearly distinguishes between large and small flows, each algorithm in Scenario 2 exhibits a higher fairness performance than in Scenario 1. Similarly, as depicted in Figure 9b, under the conditions of Scenario 2, the average fairness indices for the entire simulation period are measured approximately at 0.91, 0.89, 0.87, and 0.94 for the RED, CoDel, PIE, and S-PIE algorithms, respectively. Relative to the RED, CoDel, and PIE algorithms, the fairness of the S-PIE algorithm was elevated by approximately 2.51%, 5.16%, and 8.20%. By comparing the fairness indices of active queue-management algorithms in different network congestion environments, it was demonstrated that the packet drop strategy of S-PIE can effectively alleviate network congestion and ensure higher fairness among data flows.
(4)
Packet drop
Figure 10a,b show the passive and active packet drops for each of the four active queuing algorithms, respectively. A proactive packet drop means that when the number of packets in the network exceeds the processing capacity of the network and, thus, causes network congestion, packets are dropped proactively to relieve congestion. On the other hand, passive packet drop is a reactive strategy. When a passive packet drop occurs, the buffer of the network node is full, and the network is in a state of extreme congestion. Excessive passive packet drops can lead to unstable data transmission and degradation of the network performance; therefore, it is important to reduce passive packet drops.
From Figure 10a, it can be observed that S-PIE reduces the passive packet drop significantly compared to PIE by approximately 83.41%. There is no passive packet drop in RED because RED actively drops packets based on judging the average queue length with respect to the threshold value, and packets are dropped when the average captain exceeds the set maximum threshold value. Therefore, in this experimental scenario, RED’s captain basically does not exceed the maximum number of packets allowed in the buffer and, thus, does not generate passive packet loss. Figure 10b shows the active packet drop of each algorithm, which illustrates that each AQM algorithm identifies the extent of network congestion leading to an autonomous packet drop. As can be seen from the figure, in the presence of network congestion, combined with the previous comparison of throughput and average queue-length performance, S-PIE can better predict congestion for active packet drops and penalize packet drops for large flows to maintain fairness among data flows and effectively mitigate congestion.

5. Conclusions

In this study, we propose a fine-grained proportional integral queue management method, S-PIE, based on Sketch. S-PIE can count the frequency of the corresponding flow of packets through the Sketch module and determine whether the flow is a large flow according to the frequency statistics, so as to perform differential packet drop to ensure fairness, and the memory cleaning module can prevent Sketch memory overflow. The experimental results show that the S-PIE algorithm achieves a lower average queue length, RTT, and higher fairness while maintaining a similar throughput performance compared to the original algorithms RED, CoDel, and PIE. The S-PIE framework implements a differential packet drop policy to ensure the fairness of data flows, maintain network availability and stability, and improve network quality of service by maintaining shorter queue lengths. In the future, we will continue to study the S-PIE algorithm in more complex real network environments (rather than simulated experimental environments) to increase its generality, and new developments related to Sketch can help us further improve the performance of the S-PIE algorithm.

Author Contributions

Conceptualization, H.Z. and H.S.; methodology, H.Z. and G.H.; writing—original draft preparation, H.S. and Y.J.; writing—review and editing, L.Z. and Y.L. All authors have read and agreed to the published version of the manuscript.

Funding

This research was funded by the National Natural Science Foundation of China (Grant No. 62272237, 52105553, 71801123) and the Key Projects of Natural Science Research in Jiangsu Provincial Colleges and Universities under Grant 22KJA520005.

Data Availability Statement

Not applicable.

Conflicts of Interest

The authors declare no conflict of interest.

References

  1. Xie, C.; Hu, H.; Liu, Y. Shared Bottleneck Detection for Multipath Transmission in High Latency Satellite Network. In Proceedings of the IEEE 7th International Conference on Computer Science and Network Technology (ICCSNT), Dalian, China, 19–20 October 2019; pp. 38–42. [Google Scholar] [CrossRef]
  2. Cerf, V.G. Bufferbloat and other Internet challenges. IEEE Internet Comput. 2014, 18, 80. [Google Scholar] [CrossRef]
  3. Floyd, S.; Jacobson, V. Random early detection gateways for congestion avoidance. IEEE ACM Trans. Netw. 1993, 1, 397–413. [Google Scholar] [CrossRef]
  4. Feng, W.C.; Shin, K.G.; Kandlur, D.D.; Saha, D. The BLUE active queue management algorithms. IEEE ACM Trans. Netw. 2002, 10, 513–528. [Google Scholar] [CrossRef]
  5. Nichols, K.; Jacobson, V.; McGregor, A.; Iyengar, J. Controlled Delay Active Queue Management. Available online: https://www.rfc-editor.org/rfc/rfc8289.html (accessed on 3 July 2023).
  6. Pan, R.; Natarajan, P.; Piglione, C.; Prabhu, M.S.; Subramanian, V.; Baker, F.; VerSteeg, B. PIE: A lightweight control scheme to address the bufferbloat problem. In Proceedings of the IEEE 14th International Conference on High Performance Switching and Routing (HPSR), Taipei, Taiwan, 8–11 July 2013; pp. 148–155. [Google Scholar] [CrossRef]
  7. Chawla, J.; Kumari, S. Performance Evaluation of DropTail and Random Early Detection. IRJET 2016, 3, 721–727. [Google Scholar]
  8. Zhang, L.; Shenker, S.; Clark, D.D. Observations on the dynamics of a congestion control algorithm: The effects of two-way traffic. In Proceedings of the conference on Communications architecture & protocols, Zürich, Switzerland, 3–6 September 1991; pp. 133–147. [Google Scholar] [CrossRef]
  9. Hoeiland-Joergensen, T.; McKenney, P.; Taht, D.; Gettys, J.; Dumazet, E. The fLow Queue Codel Packet Scheduler and Active Queue Management Algorithm. Available online: https://www.rfc-editor.org/rfc/rfc8290.html (accessed on 3 July 2023).
  10. Palmei, J.; Gupta, S.; Imputato, P.; Morton, J.; Tahiliani, M.P.; Avallone, S.; Täht, D. Design and evaluation of COBALT queue discipline. In Proceedings of the 2019 IEEE International Symposium on Local and Metropolitan Area Networks (LANMAN), Paris, France, 1–3 July 2019; pp. 1–6. [Google Scholar] [CrossRef]
  11. Hollot, C.V.; Chait, Y. Nonlinear stability analysis for a class of TCP/AQM networks. In Proceedings of the 40th IEEE Conference on Decision and Control (Cat. No. 01CH37228), Orlando, FL, USA, 4–7 December 2001; pp. 2309–2314. [Google Scholar] [CrossRef]
  12. Ünal, H.U.; Melchor-Aguilar, D.; Üstebay, D.; Niculescu, S.I.; Özbay, H. Comparison of PI controllers designed for the delay model of TCP/AQM networks. Comput. Commun. 2013, 36, 1225–1234. [Google Scholar] [CrossRef]
  13. Jiang, W.; Li, H.; Peng, L.; Wu, J.; Ruan, C.; Wang, J. Analysis and improvement of the latency-based congestion control algorithm DX. FCGS 2021, 123, 206–218. [Google Scholar] [CrossRef]
  14. Pan, C.; Zhang, S.; Zhao, C.; Shi, H.; Kong, Z.; Cui, X. A novel active queue management algorithm based on average queue length change rate. IEEE Access 2022, 10, 75558–75570. [Google Scholar] [CrossRef]
  15. Kar, S.; Alt, B.; Koeppl, H.; Rizk, A. PAQMAN: A principled approach to active queue management. arXiv 2022, arXiv:2202.10352. [Google Scholar] [CrossRef]
  16. Hu, S.; Sun, J. An Active Queue Management Mechanism for Minimizing Queueing Delay. In Proceedings of the 33rd Chinese Control and Decision Conference (CCDC), Kunming, China, 22–24 May 2021; pp. 612–617. [Google Scholar] [CrossRef]
  17. Patel, S.; Gupta, A.; Singh, M.; Nikhil, N.; Sharma, V. A new active queue management algorithm: Altdrop. In Proceedings of the 2018 International Conference on Advances in Computing, Communication Control and Networking (ICACCCN), Greater Noida, India, 12–13 October 2018; pp. 124–127. [Google Scholar] [CrossRef]
  18. Li, Y.; Miao, R.; Liu, H.H.; Zhuang, Y.; Feng, F.; Tang, L.; Yu, M. HPCC: High precision congestion control. In Proceedings of the ACM Special Interest Group on Data Communication, Beijing, China, 19–23 August 2019; pp. 44–58. [Google Scholar] [CrossRef]
  19. Szyguła, J.; Domański, A.; Domańska, J.; Marek, D.; Filus, K.; Mendla, S. Supervised learning of neural networks for active queue management in the internet. Sensors 2021, 21, 4979. [Google Scholar] [CrossRef] [PubMed]
  20. Gumus, F.; Yiltas-Kaplan, D. Congestion Prediction System with Artificial Neural Networks. Int. J. Interdiscip. Telecommun. Netw. 2020, 12, 28–43. [Google Scholar] [CrossRef]
  21. Wang, K.; Liu, Y.; Liu, X.; Jing, Y.; Dimirovski, G.M. Study on TCP/AQM network congestion with adaptive neural network and barrier Lyapunov function. Neurocomputing 2019, 363, 27–34. [Google Scholar] [CrossRef]
  22. Kim, M.; Jaseemuddin, M.; Anpalagan, A. Deep reinforcement learning based active queue management for iot networks. J. Netw. Syst. Manag. 2021, 29, 34. [Google Scholar] [CrossRef]
  23. Szyguła, J.; Domański, A.; Domańska, J.; Czachórski, T.; Marek, D.; Klamka, J. AQM Mechanism with Neuron Tuning Parameters. In Proceedings of the Asian Conference on Intelligent Information and Database Systems, Phuket, Thailand, 23–26 March 2020; pp. 299–311. [Google Scholar] [CrossRef]
  24. Hu, M.; Mukaidani, H. Nonlinear model predictive congestion control based on lstm for active queue management in tcp network. In Proceedings of the 2019 12th Asian Control Conference (ASCC), Kitakyushu-shi, Japan, 9–12 June 2019; pp. 710–715. [Google Scholar]
  25. Abualhaj, M.M.; Al-Tahrawi, M.M.; Hussein, A.H.; Al-Khatib, S.N. Fuzzy-logic based active queue management using performance metrics mapping into multi-congestion indicators. CIT 2021, 21, 29–44. [Google Scholar] [CrossRef]
  26. Wang, K.; Liu, Y.; Liu, X.; Jing, Y.; Zhang, S. Adaptive fuzzy funnel congestion control for TCP/AQM network. ISA Trans. 2019, 95, 11–17. [Google Scholar] [CrossRef] [PubMed]
  27. Singh, P.; Gupta, A.K.; Singh, R. Improved priority-based data aggregation congestion control protocol. Mod. Phys. Lett. B 2020, 34, 2050029. [Google Scholar] [CrossRef]
  28. Pandey, D.; Kushwaha, V. An exploratory study of congestion control techniques in wireless sensor networks. Comput. Commun. 2020, 157, 257–283. [Google Scholar] [CrossRef]
  29. Babcock, B.; Babu, S.; Datar, M.; Motwani, R.; Widom, J. Models and issues in data stream systems. In Proceedings of the Twenty-First ACM SIGMOD-SIGACT-SIGART Symposium on Principles of Database Systems, Madison, WI, USA, 3–5 June 2002; pp. 1–16. [Google Scholar] [CrossRef]
  30. Cormode, G.; Muthukrishnan, S. An improved data stream summary: The count-min sketch and its applications. J. Algorithms 2005, 55, 58–75. [Google Scholar] [CrossRef]
  31. Estan, C.; Varghese, G. New directions in traffic measurement and accounting. In Proceedings of the 2002 Conference on Applications, Technologies, Architectures, and Protocols for Computer Communications, Pittsburgh, PA, USA, 19–23 August 2002; pp. 323–336. [Google Scholar] [CrossRef]
  32. Charikar, M.; Chen, K.; Farach-Colton, M. Finding frequent items in data streams. In Proceedings of the International Colloquium on Automata, Languages, and Programming, Málaga, Spain, 8–13 July 2002; pp. 693–703. [Google Scholar] [CrossRef]
  33. Cormode, G. Data sketching. Commun. ACM 2017, 60, 48–55. [Google Scholar] [CrossRef]
  34. Campanile, L.; Gribaudo, M.; Iacono, M.; Marulli, F.; Mastroianni, M. Computer network simulation with ns-3: A systematic literature review. Electronics 2020, 9, 272. [Google Scholar] [CrossRef]
  35. Jain, R.K.; Chiu, D.M.W.; Hawe, W.R. A Quantitative Measure of Fairness and Discrimination; Eastern Research Laboratory, Digital Equipment Corporation: Hudson, MA, USA, 1984. [Google Scholar]
Figure 1. S-PIE algorithm architecture.
Axioms 12 00814 g001
Figure 2. The data structure of Sketch.
Axioms 12 00814 g002
Figure 3. The data structure of Sketch.
Axioms 12 00814 g003
Figure 4. Comparison of average queue length in different scenarios.
Axioms 12 00814 g004
Figure 5. Comparison of RTT in different scenarios.
Axioms 12 00814 g005
Figure 6. Comparison of throughput by time period (Scenario 1).
Axioms 12 00814 g006
Figure 7. Comparison of throughput by time period (Scenario 2).
Axioms 12 00814 g007
Figure 8. Comparison of throughput of multiple experiments (Scenario 2).
Axioms 12 00814 g008
Figure 9. Comparison of the fairness index in different scenarios.
Axioms 12 00814 g009
Figure 10. Comparison of packet drops (Scenario 2).
Axioms 12 00814 g010
Table 1. Detailed parameters.
ParametersValue
LeafLink Bandwidth100 Mbps
BottleneckLink50 Mbps
LeafLink Delay5 ms
BottleneckLink Delay20 ms
Active Sender100
Maxsize50 p
Disclaimer/Publisher’s Note: The statements, opinions and data contained in all publications are solely those of the individual author(s) and contributor(s) and not of MDPI and/or the editor(s). MDPI and/or the editor(s) disclaim responsibility for any injury to people or property resulting from any ideas, methods, instructions or products referred to in the content.

