Abstract
Reverse engineering plays an important role in the manufacturing and automobile industries in designing complicated spare parts, reducing actual production time, and allowing for multiple redesign possibilities, including shape alterations, different materials, and changes to other significant parameters of the component. Using reverse engineering methodology, damaged gears can be identified and modeled meticulously. Influential parameters can be obtained in the shortest time. Because most of the time it is impossible to solve gear-related inverse equations mathematically, metaheuristic methods can be used to reverse-engineer gears. This paper presents a methodology based on measurement over balls and span measurement along with evolutionary optimization techniques to determine the geometry of a pure involute of a cylindrical helical gear. Advanced optimization techniques, i.e., Grey Wolf Optimization, Whale Optimization, Particle Swarm Optimization, and Genetic Algorithm, were applied for the considered reverse engineering case, and the effectiveness and accuracy of the proposed algorithms were compared. Confirmatory calculations and experiments reveal the remarkable efficiency of Grey Wolf Optimization and Particle Swarm Optimization techniques in the reverse engineering of helical gears compared to other techniques and in obtaining influential gear design parameters.
1. Introduction
Widely exploited in almost all engineering fields, reverse engineering (RE) is an approach that consists of digitizing a real component to create a numerical or virtual model [1]. This numerical or virtual model can also be emulated in presenting a Digital Twin. The Digital Twin, which started to be used recently, is a new concept for describing a new wave in modeling and simulation. While the use of simulation tools was previously restricted to design stages, nowadays different types of simulation tools are used in testing, validation, or optimization that can be referred to as Digital Twin [2]. This technology is an emerging concept that has become the center of attention in industry, particularly in the manufacturing industry. The Digital Twin is best described as the effortless integration of data between a physical and virtual machine in either direction [3]. Digital Twin has been widely used in different industries, especially manufacturing, to monitor performance, optimize progress, simulate results, and predict potential errors. This technique also plays various roles within the whole product lifecycle from design, manufacturing, delivery, use, and end of life. With the growing demands of individualized products and implementation of Industry 4.0, Digital Twin can provide an effective solution for future product design, development, and innovation [4]. Generally, RE can be defined as a principled process that extracts design information from a product. Hence, components in various industries, including engineering, medical, defense systems, software, consumer electronics, etc., can be reverse-engineered comprehensively. Chikofsky and Cross introduced RE as “the process which analyzes a certain system to identify the systems” parts and their relationships and to create alternatives of the system in another form or at a higher level of abstraction [5]. In addition, the definition of RE in mechanical design is to “commence the redesign process where a product is observed, disassembled, analyzed, tested, and documented in terms of its functionality, form, physical principles, manufacturability, and assemble-ability.
In recent years, traditional approaches to designing, manufacturing, and constructing mechanical components and systems have been abolished. In other words, state-of-the-art methods in design and manufacturing have provided some outstanding benefits, including production preparation time decline, outstanding precision, etc., that completely change the quality of the product [6]. Nowadays, the implementation of RE is in manufacturing three-dimensional digital models of different mechanically damaged or broken components [7]. Lippmann et al. used RE for the verification of physical designs in nanoscale technologies [8]. RE is used in various fields, especially mechanics, such as composites, aerospace industries, energy plants, turbines, internal combustion components, etc.
One of the most prevalent applications of RE is redesigning and manufacturing gears with a high-precision involute widely used in the automobile industry. Modeling machine components, especially gears, with parametric or non-parametric RE methods is becoming more popular before producing samples using rapid prototype processes [9,10]. Numerous studies have been conducted on the redesign, modeling, and manufacturing of various types of gears through RE. Shamekhi et al. used RE to redesign and optimize the gear ratio and corresponding teeth number of the gears of an automatic transmission system. They proposed an accurate and efficient model to find optimum design parameters [11]. Verim et al. redesigned a damaged motor cam gear by the 3D scanning method. They evaluated the geometric values of the damaged model and the prototyped one. They reported acceptable deviations between the RE model and the actual component [12]. Dubravcik et al. made a 3D model of a damaged gear wheel using scanning and rapid prototyping. They compared and identified the new gear wheel’s proportions and geometry with the original point cloud of the damaged gear. The results revealed good compliance between the original and RE-made gear [9]. Palkahas worked on the reconstruction of gears using RE and 3D printing methods. He reported that the final component’s quality is highly related to the use of appropriate methods, software, hardware, and material [6]. Baehr et al. used machine learning for structural characterization in the RE domain [13].
The design of gears has a rather complex procedure involving numerous design parameters and factors. Finding an optimal or near-optimal solution for this complexity turns it into a challenging demand. There are plenty of studies in which different optimization algorithms, such as the Genetic Algorithm (GA) [14], Simulated Annealing (SA) [15], Response Surface Methodology (RSM) [16], Particle Swarm Optimization (PSO) [17], Grey Wolf Optimization (GWO), Whale Optimization Algorithm (WOA) [18], etc., have been implemented for the design optimization of gears. Xia et al. have used PSO combined with GA to optimize the operational quality of power shift transmission. The simulation and test results showed that the proposed control strategy effectively avoids the power cycle when shifting and consequently improves shift quality [19]. Artony has proposed a deterministic approach to solve simulation-based, multi-objective gear design optimization problems in the presence of general nonlinear constraints on the design variables. He has declared that, although developed with gear optimization in mind, it is broader in scope and should be tested in other computer-assisted engineering optimization problems [20]. Rai et al. used a Real-Coded Genetic Algorithm (RCGA) to achieve optimal helical gear design. They minimized the volume of a helical gear by increasing the profile shift coefficient as a design factor and other parameters such as the module, face width, and number of teeth using RCGA [21]. Mendi et al. investigated the difference between the dimensional optimization of motion and force-transmitting components of a gearbox performed by the genetic algorithm and analytical method. The results illustrated that GA is a considerably better and more reliable method to obtain minimum gear volume [22].
Because of the drawbacks of the commonly performed research in the field of RE of gears, there is an urgent demand to carry out an extensive investigation to determine accurate gear design parameters using relevant measurements such as over-ball measurements. For instance, in the reviewed case study, the matter of RE for a single gear has not been investigated. In the studies dealing with this issue, parameters such as outside diameter and root diameter are considered known input parameters in the RE process. These practices pose an excessive error in the obtained design parameters. On the other hand, current industrially applicable gear design software requires initial design parameters such as the pressure angle and module to initiate the RE process. This problem adversely affects the accuracy of calculated design parameters. In industry, to replace a damaged gear wheel, it is commonplace to get its CAD model using scanning techniques. Many factors affect 3D scanning processes. One of them is the reflective ability of the parts’ surfaces. Such inaccuracies and incompetence are mainly of the tooth systems because of uncontrolled laser ray scattering and incorrect scanning [10]. Therefore, a systematic methodology is needed to solve the RE problem of gears more comprehensively. However, the major requirement that has to be satisfied for successful gear RE is the modeling of the system at hand as accurately as possible [23].
Due to the complexities governing the calculations of input gear parameters, a new methodology was proposed in the current study to reverse-engineer gears using evolutionary optimization techniques. A number of commonly used metaheuristic optimization methods with successful applications reported in engineering optimization problems, such as GWO, WOA, PSO, and GA, were applied to solve the introduced RE problem. The stability, convergence speed, and accuracy of the mentioned algorithms were compared and evaluated. The paper has the following sections. A brief theoretical background of gear calculations is presented in Section 2. The proposed methodology and optimization techniques are explained in Section 3. Section 4 describes the remarkable results of the study. The conclusion is presented in Section 5.
2. Theoretical Background of Gear Calculations
The accurate design of gears requires considerable effort in calculating the relevant gear geometry to fulfil the essential requirements of operational characteristics such as load capacity, reliability, and gear size, which directly affect the quality of power transmission. The independent variables that define a gear are the number of teeth , normal module , normal pressure angle , addendum modification , and helix angle . Knowing the parameters mentioned, the involute form of a gear flank can be determined. The other dependent variables, including outside diameter, root diameter, and face width, are usually determined based on transmission load, which can be manipulated by the designer through design limitations and requirements [24]. The parameters that directly relate to the gear flank involute form and the parameters that do not have such a relationship are listed in Table 1.

Table 1.
Division of the geometrical characteristics of gears.
One of the most important parameters that greatly impacts the gear design characteristics, load capacity of the gear, and backlash of engaged gears is tooth thickness. Normal tooth thickness can be calculated as follows:
There are direct and indirect methods for measuring tooth thickness, including chordal thickness measurement (), span measurement (), and over-ball measurement (). Among these methods, span and over-ball measurements are more industrially applicable because of their higher measurement precision and the comparatively lower equipment involved in the measurement process [25]. A schematic view of span and ball measurements is illustrated in Figure 1.
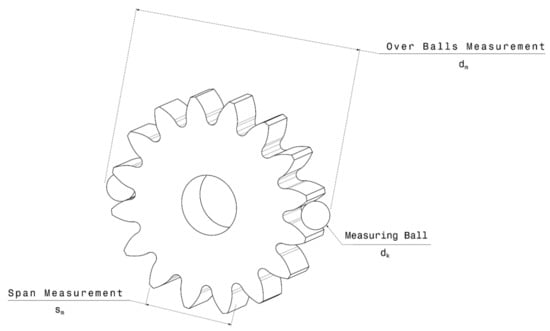
Figure 1.
A schematic view of span measurement and over-balls measurement for a gear.
The value for based on the aforementioned input parameters can be calculated as follows [24]:
in which is the number of spanned teeth. The function is calculated according to Equation (3).
The parameter is obtained as follows:
in which is the diameter of the measuring ball, and is the pressure angle at the center of the measuring ball, which can be calculated according to Equation (5) [24].
In Equation (5), is the transverse pressure angle and is defined as below:
Consequently, the value of is calculated as Equation (7) [24]:
3. Materials and Methods
The design of gears has become more of a necessity than ever before. In particular, gear design optimization and transmission accuracy have attracted more attention [26]. One of the most frequently used techniques in gear design is RE methods. These methods are necessary for remodeling or measuring damaged or non-damaged gears. RE also enables the design of complex mechanical components, effectively reducing production time and relevant prototyping costs. Using RE methods, damaged gear components can be calculated and modeled in a short time, and obtained models can be produced economically in a comparably short period [26].
3.1. Reverse Engineering of Cylindrical Helical Gear
When designing a new set of gears, there are many alternatives in the gear parameters selection. Therefore, the designer can freely choose among the various options. However, RE imposes a considerable challenge to the gear designer since the main problem is characterizing a previously manufactured gear whose geometry is unknown.
With a valid reference for the design, the designer must extract the exact geometry of the redesigned gear. For the completion of the RE of a cylindrical helical gear, it is obligatory to determine the number of teeth , normal module , normal pressure angle , addendum modification , and helix angle . According to Equations (2)–(7), identifying the primary gear input parameters based on measurements obtained from and is impossible to solve these equations. This arises from the complex calculations governing the relations between gear input parameters and measured output characteristics. So, there is a great need to use novel methods in the RE of gears to obtain influential input parameters. Because of the inability of existing computational and mathematical methods to analytically solve these equations, it seems that applying modern evolutionary optimization algorithms can be a good choice to obtain gear design parameters in the RE process.
Inspired by natural processes, these techniques can optimize a function or find the answer to a complex equation in a logical period and with relatively high precision.
3.2. Problem Description and Solving Method
3.2.1. Objective Function
The general constrained problem considered in the present research was expressed as:
The objective function to find input design parameters was set as follows:
Since, in the present study, three values for and one value for are measured, Equation (9) can be rewritten as:
in which and are practically measured span and over-balls measurements, respectively. According to Equation (8), it can be concluded that the defined objective function is the resulting error of the selected design parameters and measured values. Therefore, the minimum possible value for can lead to the exact input gear design parameters. In this way, the present investigation strived to substitute an unsolvable series of complicated equations with an optimization problem to discover the answers by exploiting evolutionary optimization algorithms.
3.2.2. Methodology
Figure 2 presents a schematic framework that integrates the described RE technique with evolutionary optimization algorithms. The raw measured data are fed into the optimization unit to minimize the defined objective function. After the termination of the optimization algorithm, based on measured values and formulas, the optimum results are gained.
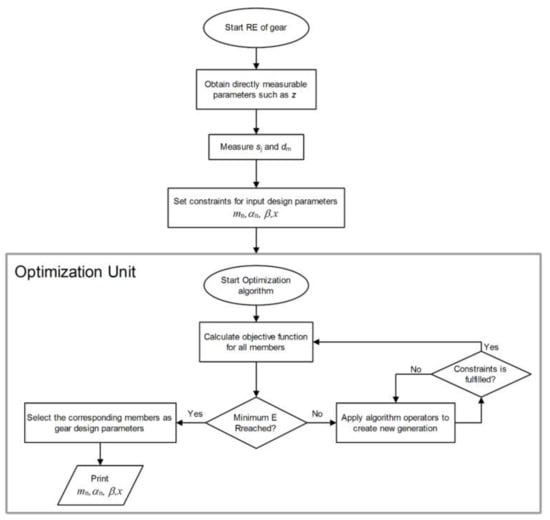
Figure 2.
Flowchart of the proposed RE of gear framework.
Several termination conditions can be used to terminate the algorithm and obtain calculated optimum results. However, two are more frequently used for the problems under consideration, including the maximum number of function evaluations and minimum specific error. The former is suitable for computationally demanding problems when only a limited number of function evaluations is allowed. At the same time, the latter specifies that the optimization is terminated when the minimum desired error is reached [20].
Relatively high accuracy is required to determine the parameters in this research. Therefore, the algorithm is terminated in two modes, after a definite number of function evaluations and after reaching a predefined error. The minimum value for the cost function, , reflects the resolution of searching for optimum answers in the space of all possible answers. The proposed algorithmic framework is illustrated by the pseudocode in Figure 3, which summarizes the methodology discussed.
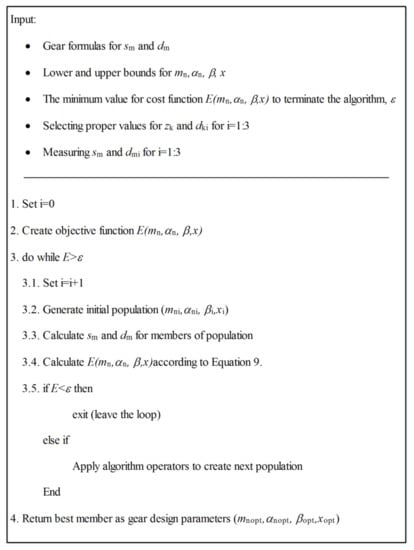
Figure 3.
Pseudocode of the proposed algorithmic framework.
3.2.3. Evolutionary Optimization Algorithms
Although they have been used widely in various design problems, conventional optimization methods impose some serious difficulties on the matter; accordingly, to have a slow convergence speed, these methods may be stuck in the local optimum point. Furthermore, when the objective function or constraints cannot be stated functionally explicit in the input parameters, it is hard to utilize these methods to solve the given problem. Consequently, some novel methods, quite often inspired by nature, such as GA, PSO, SA, etc., are applied to solve complex optimization problems [22]. In this research, an investigation was carried out to find the design parameters of a gear based on performed measurements. The proposed algorithms were GWO, WOA, PSO, and GA, which were used under similar conditions and objective functions. The population size was set to 40 for all of the algorithms. The primary population was created as uniformly as possible within the search space. The results of the methods above were compared, and their competencies to solve the problem were evaluated.
Metaheuristic methods have been proved to be a powerful technique to solve complex optimization problems. The majority of them consider a set of parameters that must be tuned before the triggering of the algorithm or during the process and are based on multiple runs of the metaheuristic algorithm [27]. During each iteration, significantly worse configurations are removed, and new configurations are formed through crossover and mutation. Each of the presented methods has its own features as well as advantages and disadvantages [28].
A good setup of these parameter values can result in a better and effective application of the optimization process. This job can be carried out by trial-and-error methodology [29] or by intelligent tuning methods [27]. In this regard, various tuning methods have been presented such as CRS [28], F-Race [30], Revac [31], and ParamILS [32]. Control parameters for selected optimization algorithms in this research were selected based on a trial-and-error approach.
Grey Wolf Optimization Algorithm: GWO is a metaheuristic optimization algorithm that imitates the intelligent foraging behavior of grey wolves when hunting prey. Strictly following their social hierarchy, grey wolves are divided into 4 groups from top to bottom. The top group which makes decisions during hunting is called α. The next level belongs to wolves who help as deputy chiefs in the group. The α wolves are replaced by ones after dying or becoming inefficient as leaders. In the third level are δ wolves, which act as hunters and scouts of the group. The last level in the established hierarchy is occupied by the weakest members, titled wolves. When hunting, all types of wolves are organized according to decisions made by α wolves to identify, follow the prey, encircle it, and finally attack it. In this optimization algorithm, , , and indicate the members with fitness from high to low, in that order [33].
The simulation of wolves’ behavior when hunting includes encircling and catching the prey. The mathematical description of encircling the prey can be expressed as follows:
in which and act as coefficient vectors. determines the position of the prey or global answer. The vector describes the current position of the wolves; the new position of , , and wolves in the tth iteration would be determined by . The values for and can be calculated as below:
where and are random vectors varying in the range of [0, 1], and is the convergence vector value changing linearly in [0, 2].
In the next step, the hunting process starts with wolves as the leaders and wolves as the hunting contributors. Mathematically simulated hunting assumes that , , and individuals have better information about the location of prey. Therefore, all individuals update their positions according to the below equations:
At the ones where the prey stops, the wolves attack. Mathematically, this happens when . Unless the attack is delayed until finding a better position or answer [34], the schematic position update of members in the GWO algorithm is illustrated in Figure 4. The population size is set to 40.
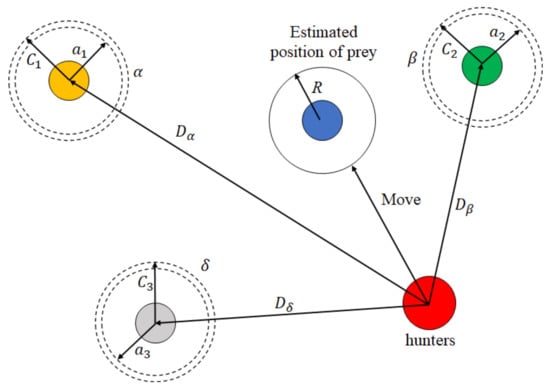
Figure 4.
Position update in GWO.
Whale Optimization Algorithm: Introduced by Mirjalili et al., WOA is a swarm optimization method inspired by the hunting behavior of humpback whales. The hunting process involves searching, encircling the prey, and finally attacking to catch it [35]. The relatively easy implementation of the algorithm and its configuration with fewer parameters are the advantages of this optimization technique. The prey is the answer to the optimization problem that must be determined during the WOA process [36]. The hunting of humpback whales is illustrated in Figure 5. The movement of randomly created whales toward the prey or leader whale is shown in Figure 5a. The encircling process of the prey by the whales and their spiral movement while emitting bubbles to surround the prey is illustrated in Figure 5b,c, respectively [37].
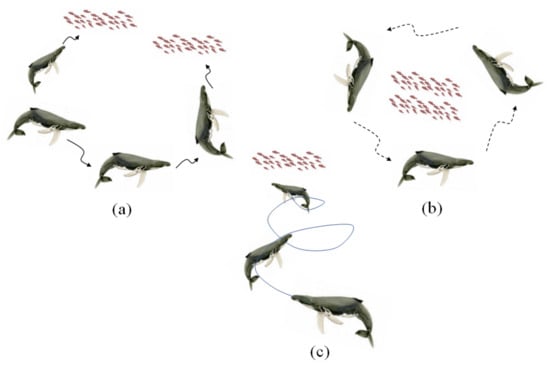
Figure 5.
Hunting process of humpback whales: (a) movement of whales in a random direction or toward leader; (b) encircling process after finding the prey; (c) reaching the prey in spiral route.
First, a group of whales or members is created randomly to search for the prey or answer in the search space. This stage can be expressed mathematically as follows:
in which and act as coefficient vectors. determines the position of whales in tth iteration. The values for and can be obtained as follows:
In these equations, is a vector selected randomly in [0,1]. The maximum number of permissible iterations is , and is the convergence vector value which decreases linearly from 2 to 0 by increasing the number of iterations.
After having found the prey, the whales move closer to the prey. The mathematical formula of this shrinkage mechanism can be expressed as follows:
It must be added that if , determines the member with the best fitness value. Therefore, will update the position of members automatically to encircle the prey. In the final step, the whales catch their prey, start to move in a spiral route, and simultaneously narrow the siege [38]. This process is illustrated in Figure 6.
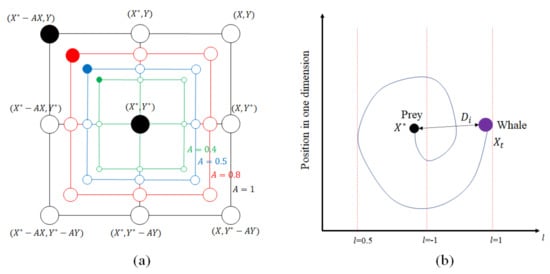
Figure 6.
Search mechanism and whales’ movement in WOA: (a) shrinking encircling process; (b) position update in the spiral way.
Figure 6a demonstrates a probable number of positions such as (X,Y), which can be achieved by the current global optimum (X*,Y*) in any determined way. The spiral way to narrow the encirclement is shown in Figure 6b [37]. This behavior can be mathematically expressed as below:
in which determines the shape of the spiral route, and is a random value in the range of [0, 1] [39]. The population size is set to 40.
Particle Swarm Optimization: Nature-inspired metaheuristic optimization algorithms have recently been extensively utilized to optimize various manufacturing problems [40]. PSO has gained a special place among these algorithms because of its simplicity in programming and solving relatively complex functions [41].
Introduced by Eberhart and Kennedy in 1995 [42], PSO is a population-based optimization algorithm which comprises several particles representing a probable solution to the defined optimization problem. The goal of these particles in the algorithm is to find the answer by improving their positions [43].
Particles have a fitness factor, which determines the ability of each particle to solve the optimization problem, and a velocity factor which affects the movement direction of a particle in the course of iterations and can be mathematically obtained as follows:
where and stand for the position and velocity of particle in dimensional space, respectively. and , respectively, give the best position of particle i and other particles in the population until generation t. Inertia weight factor w adjusts the dynamic behavior of particles. Parameters rand1 and rand2 are random variables in the range of [0, 1], c1 is the determined cognitive factor, and c2 is the preferred social factor of each particle. The positions of particles are updated considering the calculated velocity:
in which and are a new position and previous position of particle i. The updating process of particles’ positions is illustrated in Figure 7.
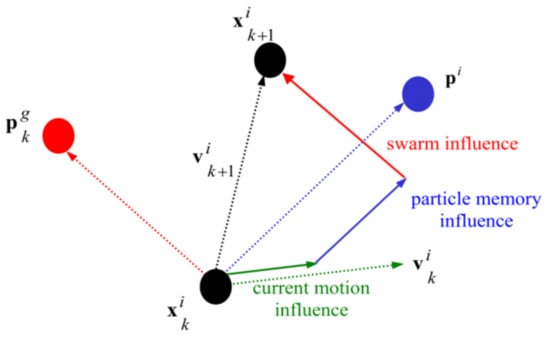
Figure 7.
Updating the position of particles in PSO.
The optimization process terminates when the best answer is found, or the desired iteration is reached. The parameter configuration selected in the PSO implementation process in the research is shown in Table 2. The data were selected based on a trial-and-error method to reach the minimum possible error.

Table 2.
PSO parameter configuration.
Genetic Algorithm: As the most recognized subset of evolutionary algorithms, it mimics the biological evolution of organisms in nature. Having been utilized in various engineering problems, GA was initially developed and characterized by John Holland [44]. This naturally inspired optimization algorithm is structured on natural genetics and selection. It allows only the solutions to survive and produce successive generations with maximum fitness according to the defined optimization problem [45].
GA deals with a set of members or solutions in the total generated population. The solutions are ranked in the population based on their fitness values. The solutions placed at the top have more chance to participate in the reproduction of the next generations, and other solutions with lower fitness must be removed from the population, and new solutions can be generated. This happens by applying crossover and mutation operators to individuals. A sample of operators applied to a pair of parents to generate new offspring is illustrated in Figure 8.
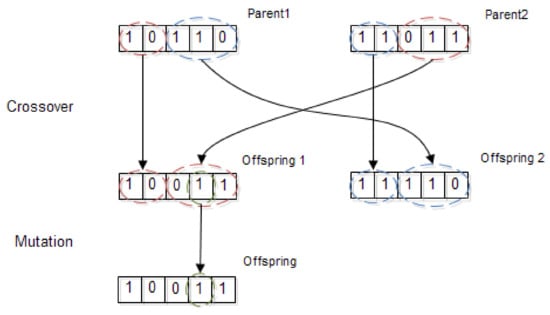
Figure 8.
Crossover and mutation operators in GA.
Parameter configurations of GA in this research are given in Table 3. These parameters were obtained through the trial-and-error method.

Table 3.
Parameter configuration of GA.
3.2.4. Experimental Methodology
For evaluating the proposed RE methodology of a sample gear, a helical gear related to the 1st forward movement gear of a Massey Ferguson 399 tractor’s gearbox was selected. The drawing specifications, including the input-independent design parameters of the selected transmission gear, are given in Table 4.

Table 4.
Input-independent design parameters of the selected gear.
The output measurable parameters of the gear, including values for span size and over-two-balls measurement, are listed in Table 5. The values were validated using special gear software. The measurements over two balls and span size using appropriate balls, a caliper, and a disc micrometer are demonstrated in Figure 9. To determine the form of involute, three values for with different balls were obtained. The smallest one fell below the pitch diameter of the gear, the medium one was closer to the pitch diameter, and the bigger pin diameter was used to encompass the involute area of the gear over the pitch diameter. Moreover, a span measurement was used to decrease the potential error of calculations and increase the precision of obtained results.

Table 5.
Measurements of the selected gear.
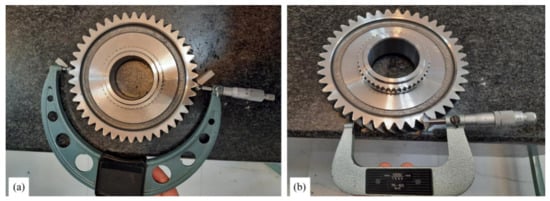
Figure 9.
Measuring of over two balls and span size.
Since is usually an integer value in the design process of gears, the value of this parameter is taken with no decimal while applying the optimization algorithm to find the valid answer in the search space. The rest of the parameters, including , , and , are considered with three decimal places.
The optimization is performed in two scenarios. In the first mode, the algorithm terminates after reaching 10,000 function evaluations. The algorithms continue in the latter until the minimum desired error of 0.005 is reached. This error value guarantees that the calculated input design parameters would be obtained with the highest possible accuracy and the least deviation from actual input parameters.
All evolutionary optimization algorithms were triggered in MATLAB software. The minimum and maximum values for design parameters in search space are given in Table 6. These limits have been selected according to widespread applications observed in the power transmission mechanisms used in the automotive industry.

Table 6.
The limit values of input design parameters in search space.
4. Results and Discussion
A computer equipped with Intel® core TM i7, 4.00 GHz CPU, and 16 GB RAM was selected to run algorithms in MATLAB® software, version 2020b. For optimization with the GA, function ga in MATLAB was used. For optimization with the PSO algorithm, Particle Swarm Optimization MATLAB Toolbox Version 1.0.0.0 was selected. For optimization with the GWO algorithm, Grey Wolf Optimizer MATLAB Toolbox Version 1.0 was utilized, and for optimization with WOA, Whale Optimization Algorithm MATLAB Toolbox Version 1.0 was applied. The population size for all algorithms was equal to perform a fair comparison of the accuracy and convergence speed of the algorithms. The performance of all optimization algorithms was submitted after 20 runs, and the run with the best result was selected in comparison with the efficiency of the algorithms. The parameter configurations for GA and PSO were discussed in the corresponding sections. GWO and WOA do not need any specific parameters [13]. As mentioned before, the RE problem was approached with two different scenarios. Concerning the first one, the efficiency of the algorithms in terms of their convergence speed was assessed by selecting a definite number of function evaluations for each algorithm to run. In the second scenario, the minimum error was selected as the final goal of optimization. Overall, the fastest algorithm to find optimum input design parameters will be determined in this case.
Scenario I: After performing 10,000 function evaluations, the algorithm’s performance in finding the best solution for the problem was evaluated. The results of the optimizations and the time elapsed for each algorithm to find its best solution are given in Table 7. While the PSO method presents the best solution, other algorithms offer different values for the problem. The best result for GWO was obtained after 8824 function evaluations within 549.8 s. This means that GWO is superior to other algorithms in terms of convergence speed and proximity to the best answer. The WOA, PSO, and GA algorithms followed in obtained accuracy with elapsed times of 736.4 s, 1122.3 s, and 2364.1 s, respectively.

Table 7.
Best solutions of the proposed algorithms for scenario I and relevant obtained input design parameters.
The values obtained by the algorithms given in Table 7 show that the error of PSO and WOA is 2.2% and 12.3% greater than the expected value of 0.003. This value is 41.9% for GA, which indicates the weakness of this method compared to the other swarm-based optimization techniques utilized in the present research. The error was calculated based on Equation (10) for the input design parameters for each algorithm and measured values. The obtained design parameters for each algorithm are also given in Table 7.
In Table 8, the statistical results of the performance of each algorithm in all the runs are summarized. The table contains the average number of function evaluations, elapsed computation times, and the deviation of obtained results.

Table 8.
Statistical results of the performance of each algorithm in all runs.
The values given in Table 8 reveal that the repeatability of the algorithms can differ drastically. While PSO and GWO demonstrate relatively stable repeatability, the other two algorithms have negligible values, attributed to their inadequate efficiency in the optimization process in the RE of gears.
Scenario II: In this case, all algorithms were expected to fulfill predefined error criteria. The aim was to compare the efficiency of the proposed algorithms in terms of their convergence speed in finding the best solution. The results of the optimizations, including the optimum design parameter, number of function evaluations, and time elapsed for each algorithm to find its best solutions, are given in Table 9. While PSO, GWO, and WOA reached the best solution with differences in the function evaluations and consequently the computation time, the best answer was not reached by all the runs for GA. The results show the superiority of swarm-based methods in optimizing complicated problems. GWO has the highest convergence speed and lowest number of function evaluations among the proposed swarm-based optimization methods. PSO and WOA are placed in the next levels with 127.4% and 228.7% more required time and a 26.2% and 178.1% higher number of function evaluations, respectively.

Table 9.
Best solutions of the proposed algorithms for scenario II and relevant obtained input design parameters.
The statistical results of the performance of each algorithm in all the runs are given in Table 10. In the table, each algorithm’s best, mean, and worst performance; average number of function evaluations; and average elapsed time to terminate the algorithms are given.

Table 10.
Statistical results of the performance of each algorithm in all runs.
According to the data given in Table 10, the GWO algorithm with the lowest standard deviation is superior to the other considered algorithms in terms of stability and robustness. In all performed runs, GWO showed relatively uniform performance in reaching the best solution. Furthermore, based on Table 10, GWO, with quite a short elapsed time, is the fastest algorithm compared to the others.
The convergence graphs by the considered algorithms are shown in Figure 10. The curves are derived from the best performance of each algorithm during the optimization run.
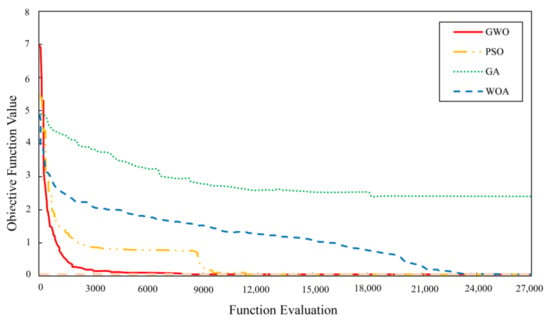
Figure 10.
The algorithms’ convergent curves reaching the minimum defined objective function for GWO, WOA, PSO, and GA.
All the methods except GA obtained the optimum input design parameters. GWO and PSO converge to the optimum values much more quickly than others without being stuck in the local minimum solution. However, the convergence speed of GWO is relatively higher than that of PSO. This method finds the optimum value in fewer function evaluations. The performance of WOA is relatively weak in this scenario. Being attached to a local minimum during the optimization progress requires more time and function evaluations for the WOA to reach the optimum value. Among the proposed optimization algorithm, GA has the lowest convergence performance. No optimum results were found in any of the runs for GA. Therefore, it can be concluded that GA is attached to the local optimum solution and cannot be considered as an appropriate algorithm for the defined problem.
To consider the average number of iterations in which the best results for each proposed algorithm are reached, boxplots for GWO, WOA, and PSO were generated and are shown in Figure 11. An illustrative comparison via the given boxplots demonstrates the superiority of GWO over the other two algorithms. Because of the poor performance of GA in finding optimum results, it has been omitted from the performance comparison.
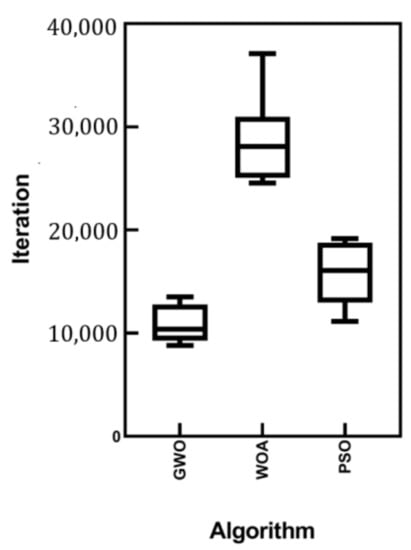
Figure 11.
Boxplots of the iterations for GWO, WOA and PSO.
A two-sample unpaired t-test was performed to test the hypothesis that the mean number of iterations for GWO is lower than the same for the WOA and PSO algorithms. t-tests are divided into two groups. The first group is an unpaired t-test, which can be used when the two groups under comparison are independent of each other, and the second is a paired t-test, which can be used when the two groups under comparison are dependent on each other. As the t-test is a parametric test, samples should meet certain preconditions, such as normality and equal variances. In other words, in order to reach a statistical conclusion about a sample mean with a t-distribution, certain conditions must be satisfied: the two samples under comparison must be independently sampled from the same population, satisfying the conditions of normality and equal variance. For checking the normality and equality of variance, a Shapiro–Wilk test and Levene’s test were utilized, respectively. According to the calculated Shapiro–Wilk test, the obtained p value is 0.193. Since the Shapiro–Wilk p value is greater than 0.05, it can be concluded that the samples satisfy the condition of normality. Moreover, the results of the Levene’s test show that the condition of equal variance is also met.
The results for the t-test are given in Table 11. It is obvious from the test results that the zero hypothesis is rejected, and it can be concluded that there will be a meaningful difference between the effectiveness and convergence speed of the optimization algorithms in terms of the mean number of iterations, as given in Table 11.

Table 11.
Two-sample t-test results for used algorithms based on iterations.
According to the performed t-tests, the hypothesis claiming the higher effectiveness of the GWO over WOA and PSO algorithms in reverse engineering using metaheuristic algorithms is confirmed.
5. Conclusions
This study proposes a new method for the RE of helical gears. This issue has been less addressed in previous studies in the literature. The main objective of the study was to find accurate gear design parameters of a helical gear, such as the normal module , normal pressure angle , addendum modification , and helix angle , using performed span and over-balls measurements. The relation between the input design parameters and relevant output measurable characteristics is obtainable with complex mathematical equations. Since it is impossible to mathematically solve the mentioned inverse equations, metaheuristic methods should be used. First, an objective function based on measurements and equations was defined. Then the defined problem was optimized by four different algorithms that have widespread use in engineering problems: GWO, WOA, PSO, and GA. The convergence speed and stability of the proposed methods were compared via statistical measures, and various indicators of the algorithms such as the convergence speed and number of function evaluations were examined. Finally, the following results were obtained:
- Based on the proposed methodology, accurate input parameters were reached. The validation of the obtained results was evaluated by the given equations.
- The performance of the algorithms was assessed in terms of the ability to reach the best solution, convergence speed, and stability. It was found that swarm-based optimization methods such as GWO and PSO are superior to the other considered algorithms such as GA.
For future work, applying the proposed methodology in the RE of other types of gears such as bevel gears and worm gears is suggested. Examining the other nature-inspired algorithms and recently published and advanced optimization methods in the RE of mechanical parts, especially gear components, is another field of research that could be considered extensively. Another vast area of research is applying the various discussed tuners in metaheuristics and their effect on the convergence speed of algorithms.
Author Contributions
Conceptualization, V.P., F.H. and S.K.; Methodology, V.P., F.H. and S.K.; Software, Validation, V.P., F.H. and S.K.; Formal Analysis, Investigation, V.P.; Data Curation, V.P.; Writing—Original Draft, V.P., F.H., S.K. and M.R.C.Q.; Writing—Review and Editing, V.P., F.H., S.K. and M.R.C.Q.; Visualization, V.P., F.H., S.K. and M.R.C.Q.; Supervising V.P. and M.R.C.Q. All authors have read and agreed to the published version of the manuscript.
Funding
This research received no external funding.
Data Availability Statement
Not applicable.
Conflicts of Interest
The authors declare no conflict of interest.
References
- Durupt, A.; Bricogne, M.; Remy, S.; Troussier, N.; Rowson, H.; Belkadi, F. An extended framework for knowledge modelling and reuse in reverse engineering projects. Proc. Inst. Mech. Eng. Part B J. Eng. Manuf. 2018, 233, 1377–1389. [Google Scholar] [CrossRef]
- Ayani, M.; Ganebäck, M.; Ng, A.H. Digital Twin: Applying emulation for machine reconditioning. Procedia CIRP 2018, 72, 243–248. [Google Scholar] [CrossRef]
- Fuller, A.; Fan, Z.; Day, C.; Barlow, C. Digital twin: Enabling technologies, challenges and open research. IEEE Access 2020, 8, 108952–108971. [Google Scholar] [CrossRef]
- Lo, C.; Chen, C.; Zhong, R.Y. A review of digital twin in product design and development. Adv. Eng. Informatics 2021, 48, 101297. [Google Scholar] [CrossRef]
- Kirk, P.; Silk, D.; Stumpf, M.P.H. Reverse engineering under uncertainty. In Uncertainty in Biology; Springer: Berlin/Heidelberg, Germany, 2016; pp. 15–32. [Google Scholar] [CrossRef]
- Palka, D. Use of Reverse Engineering and Additive Printing in the Reconstruction of Gears. Multidiscip. Asp. Prod. Eng. 2020, 3, 274–284. [Google Scholar] [CrossRef]
- Chintala, G.; Gudimetla, P. Optimum Material Evaluation for Gas Turbine Blade Using Reverse Engineering (RE) and FEA. Procedia Eng. 2014, 97, 1332–1340. [Google Scholar] [CrossRef]
- Lippmann, B.; Unverricht, N.; Singla, A.; Ludwig, M.; Werner, M.; Egger, P.; Kellermann, O. Verification of physical designs using an integrated reverse engineering flow for nanoscale technologies. Integration 2020, 71, 11–29. [Google Scholar] [CrossRef]
- Dúbravčík, M.; Kender, Š. Application of Reverse Engineering Techniques in Mechanics System Services. Procedia Eng. 2012, 48, 96–104. [Google Scholar] [CrossRef]
- Paulic, M.; Irgolic, T.; Balic, J.; Cus, F.; Cupar, A.; Brajlih, T.; Drstvensek, I. Reverse Engineering of Parts with Optical Scanning and Additive Manufacturing. Procedia Eng. 2014, 69, 795–803. [Google Scholar] [CrossRef]
- Shamekhi, A.H.; Bidgoly, A.; Noureiny, E.N. Optimization of the gear ratios in automatic transmission systems using an artificial neural network and a genetic algorithm. Proc. Inst. Mech. Eng. Part D J. Automob. Eng. 2014, 228, 1338–1343. [Google Scholar] [CrossRef]
- Verim, Ö; Yumurtaci, M. Application of reverse engineering approach on a damaged mechanical part. Int. Adv. Res. Eng. J. 2020, 4, 21–28. [Google Scholar] [CrossRef]
- Baehr, J.; Bernardini, A.; Sigl, G.; Schlichtmann, U. Machine learning and structural characteristics for reverse engineering. Integration 2020, 72, 1–12. [Google Scholar] [CrossRef]
- Jain, N.; Jain, V. Optimization of electro-chemical machining process parameters using genetic algorithms. Mach. Sci. Technol. 2007, 11, 235–258. [Google Scholar] [CrossRef]
- Zain, A.M.; Haron, H.; Sharif, S. Simulated annealing to estimate the optimal cutting conditions for minimizing surface roughness in end milling Ti-6Al-4V. Mach. Sci. Technol. 2010, 14, 43–62. [Google Scholar] [CrossRef]
- Kumar, A.; Kumar, V.; Kumar, J. Surface crack density and recast layer thickness analysis in WEDM process through response surface methodology. Mach. Sci. Technol. 2016, 20, 201–230. [Google Scholar] [CrossRef]
- Savsani, V.; Rao, R.; Vakharia, D. Optimal weight design of a gear train using particle swarm optimization and simulated annealing algorithms. Mech. Mach. Theory 2010, 45, 531–541. [Google Scholar] [CrossRef]
- Atila, Ü.; Dörterler, M.; Durgut, R.; Şahin, I. A comprehensive investigation into the performance of optimization methods in spur gear design. Eng. Optim. 2019, 52, 1052–1067. [Google Scholar] [CrossRef]
- Xia, G.; Chen, J.; Tang, X.; Zhao, L.; Sun, B. Shift quality optimization control of power shift transmission based on particle swarm optimization–genetic algorithm. Proc. Inst. Mech. Eng. Part D J. Automob. Eng. 2021, 236, 872–892. [Google Scholar] [CrossRef]
- Artoni, A. A methodology for simulation-based, multiobjective gear design optimization. Mech. Mach. Theory 2018, 133, 95–111. [Google Scholar] [CrossRef]
- Rai, P.; Agrawal, A.; Saini, M.L.; Jodder, C.; Barman, A.G. Volume optimization of helical gear with profile shift using real coded genetic algorithm. Procedia Comput. Sci. 2018, 133, 718–724. [Google Scholar] [CrossRef]
- Mendi, F.; Başkal, T.; Boran, K.; Boran, F.E. Optimization of module, shaft diameter and rolling bearing for spur gear through genetic algorithm. Expert Syst. Appl. 2010, 37, 8058–8064. [Google Scholar] [CrossRef]
- Usman, Y.O.; Odion, P.O.; Onibere, E.O.; Egwoh, A.Y. Gear Design Optimization Algorithms: A Review. J. Comput. Sci. Its Appl. 2020, 27. [Google Scholar] [CrossRef]
- Zhang, Q.; Kang, J.; Li, Q.; Lyu, S. The calculation and experiment for measurements over pins of the external helical gears with an odd number of teeth. Int. J. Precis. Eng. Manuf. 2012, 13, 2203–2208. [Google Scholar] [CrossRef]
- Litvin, F.L.; Hsiao, C.L.; Ziskind, M.D. Computerized overwire (ball) measurement of tooth thickness of worms, screws and gears. Mech. Mach. Theory 1998, 33, 851–877. [Google Scholar] [CrossRef]
- Feng, C.; Liang, J.; Gong, C.; Pai, W.; Liu, S. Repair volume extraction method for damaged parts in remanufacturing repair. Int. J. Adv. Manuf. Technol. 2018, 98, 1523–1536. [Google Scholar] [CrossRef]
- Montero, E.; Riff, M.C.; Neveu, B. A beginner’s guide to tuning methods. Appl. Soft Comput. 2014, 17, 39–51. [Google Scholar] [CrossRef]
- Veček, N.; Mernik, M.; Filipič, B.; Črepinšek, M. Parameter tuning with Chess Rating System (CRS-Tuning) for meta-heuristic algorithms. Inf. Sci. 2016, 372, 446–469. [Google Scholar] [CrossRef]
- Petridis, P.; Gounaris, A.; Torres, J. Spark parameter tuning via trial-and-error. In INNS Conference on Big Data; Springer: Berlin/Heidelberg, Germany, 2016; pp. 226–237. [Google Scholar] [CrossRef]
- Birattari, M. F-race for tuning metaheuristics. In Tuning Metaheuristics; Springer: Berlin/Heidelberg, Germany, 2009; pp. 85–115. [Google Scholar]
- Corazza, M.; di Tollo, G.; Fasano, G.; Pesenti, R. A novel hybrid PSO-based metaheuristic for costly portfolio selection problems. Ann. Oper. Res. 2021, 304, 109–137. [Google Scholar] [CrossRef]
- Gunawan, A.; Lau, H.C.; Wong, E. Real-World Parameter Tuning Using Factorial Design with Parameter Decomposition. In Advances in Metaheuristics; Springer: New York, NY, USA, 2013; Volume 53, pp. 37–59. [Google Scholar] [CrossRef]
- Qian, K.; Liu, X.; Wang, Y.; Yu, X.; Huang, B. Modified dual extended Kalman filters for SOC estimation and online parameter identification of lithium-ion battery via modified gray wolf optimizer. Proc. Inst. Mech. Eng. Part D J. Automob. Eng. 2021, 236, 1761–1774. [Google Scholar] [CrossRef]
- Dehghani, M.; Riahi-Madvar, H.; Hooshyaripor, F.; Mosavi, A.; Shamshirband, S.; Zavadskas, E.K.; Chau, K.-W. Prediction of Hydropower Generation Using Grey Wolf Optimization Adaptive Neuro-Fuzzy Inference System. Energies 2019, 12, 289. [Google Scholar] [CrossRef]
- Mirjalili, S.; Lewis, A. The whale optimization algorithm. Adv. Eng. Softw. 2016, 95, 51–67. [Google Scholar] [CrossRef]
- Yang, W.; Xia, K.; Fan, S.; Wang, L.; Li, T.; Zhang, J.; Feng, Y. A Multi-Strategy Whale Optimization Algorithm and Its Application. Eng. Appl. Artif. Intell. 2021, 108, 104558. [Google Scholar] [CrossRef]
- Wang, L.; Gu, L.; Tang, Y. Research on Alarm Reduction of Intrusion Detection System Based on Clustering and Whale Optimization Algorithm. Appl. Sci. 2021, 11, 11200. [Google Scholar] [CrossRef]
- Ding, C.; Zhao, M.; Lin, J.; Jiao, J. Multi-objective iterative optimization algorithm based optimal wavelet filter selection for multi-fault diagnosis of rolling element bearings. ISA Trans. 2018, 88, 199–215. [Google Scholar] [CrossRef]
- Kaveh, A.; Ghazaan, M.I. Enhanced whale optimization algorithm for sizing optimization of skeletal structures. Mech. Based Des. Struct. Mach. 2016, 45, 345–362. [Google Scholar] [CrossRef]
- Pourmostaghimi, V.; Zadshakoyan, M.; Khalilpourazary, S.; Badamchizadeh, M.A. A hybrid particle swarm optimization and recurrent dynamic neural network for multi-performance optimization of hard turning operation. Artif. Intell. Eng. Des. Anal. Manuf. 2022, 36, e28. [Google Scholar] [CrossRef]
- Pourmostaghimi, V.; Zadshakoyan, M. Designing and implementation of a novel online adaptive control with optimization technique in hard turning. Proc. Inst. Mech. Eng. Part I J. Syst. Control. Eng. 2020, 235, 652–663. [Google Scholar] [CrossRef]
- Kennedy, J.; Eberhart, R. Particle swarm optimization. In Proceedings of the ICNN’95-international Conference on Neural Networks, Perth, WA, Australia, 27 November–1 December 1995; Volume 4, pp. 1942–1948. [Google Scholar]
- Qazani, M.R.C.; Pourmostaghimi, V.; Moayyedian, M.; Pedrammehr, S. Estimation of tool–chip contact length using optimized machine learning in orthogonal cutting. Eng. Appl. Artif. Intell. 2022, 114, 105118. [Google Scholar] [CrossRef]
- Holland, J.H. Genetic algorithms. Sci. Am. 1992, 267, 66–73. [Google Scholar] [CrossRef]
- Zadshakoyan, M.; Pourmostaghimi, V. Metaheuristics in manufacturing: Predictive modeling of tool wear in machining using genetic programming. In Advancements in Applied Metaheuristic Computing; IGI Global: Hershey, PA, USA, 2018; pp. 118–142. [Google Scholar]
Disclaimer/Publisher’s Note: The statements, opinions and data contained in all publications are solely those of the individual author(s) and contributor(s) and not of MDPI and/or the editor(s). MDPI and/or the editor(s) disclaim responsibility for any injury to people or property resulting from any ideas, methods, instructions or products referred to in the content. |
© 2023 by the authors. Licensee MDPI, Basel, Switzerland. This article is an open access article distributed under the terms and conditions of the Creative Commons Attribution (CC BY) license (https://creativecommons.org/licenses/by/4.0/).