Article

Numerical Modeling of the Major Temporal Arcade Using BUMDA and Jacobi Polynomials

by
José Alfredo Soto-Álvarez
1,
Iván Cruz-Aceves
2,*,
Arturo Hernández-Aguirre
1,
Martha Alicia Hernández-González
3,
Luis Miguel López-Montero
3 and
Sergio Eduardo Solorio-Meza
4
1
Centre for Research in Mathematics A.C., Jalisco S/N, Col. Valenciana, Guanajuato 36000, Mexico
2
CONACYT-Centre for Research in Mathematics A.C., Jalisco S/N, Col. Valenciana, Guanajuato 36000, Mexico
3
High Speciality Medical Unit (UMAE), Specialities Hospital No. 1, Mexican Social Security Institute (IMSS), Leon 37320, Mexico
4
Department of Health Sciences, Universidad Tecnológica de México (UNITEC) Campus León, Leon 37200, Mexico
*
Author to whom correspondence should be addressed.
Axioms 2023, 12(2), 137; https://doi.org/10.3390/axioms12020137
Submission received: 4 December 2022 / Revised: 22 January 2023 / Accepted: 25 January 2023 / Published: 29 January 2023
(This article belongs to the Special Issue Applied Mathematics and Information Sciences)

Abstract

:
Within eye diseases, diabetic retinopathy and retinopathy of prematurity are considered one of the main causes of blindness in adults and children. In order to prevent the disease from reaching such an extreme, a timely diagnosis and effective treatment must be applied. Until now, the way to verify the state of the retina has been to make qualitative observations of fundus images, all carried out by an ophthalmological specialist; however, this is totally restricted to their experience, and some changes in the vascular structure of the retina could be omitted, in addition to the fact that very high resolution images would be needed to be able to detect significant changes. Accordingly, with the help of computational tools, this diagnostic/monitoring process can be improved. This paper presents a novel strategy for the modeling of the MTA by using an estimation of distribution algorithm (EDA) based on the probability density function in order to determine the coefficients and parameters ( α , β ) of a Jacobi polynomial series. A model using polynomials is the novel aspect of this work since in the literature there are no models of the MTA of this type, in addition to seeking to better cover the profile of the retinal vein. According to the experimental results, the proposed method presents the advantage to achieve superior performance in terms of the mean distance to the closest point (4.34 pixels), and the Hausdorff distance (14.43 pixels) with respect to different state-of-the-art methods of the numerical modeling of the retina, using the DRIVE database of retinal fundus images with a manual delineation of the MTA performed by an specialist.

1. Introduction

Blindness is a condition that can occur in a patient who, due to not having been treated promptly in the diagnosis of a disease such as diabetic retinopathy, experiences non-recoverable loss of vision. Specifically, this disease prevails mainly in industrialized countries, is prevalent in subjects between 20 and 64 years of age, and represents 10% of new cases of annual blindness [1,2,3]. In addition to diabetic retinopathy, which only adults present, there is also a very important type that affects infants: retinopathy of prematurity (ROP). This is the main cause of childhood blindness worldwide; the diagnosis and treatment must be timely because its evolution occurs in an accelerated manner within the first 8 to 12 weeks after the birth of the infant [4].
Both diseases are the result of damage of the blood vessels of the tissue located in the back of the eye, that is, in the retina. In order to carry out a diagnosis, it is necessary to obtain a set of fundus images, which must be examined by an physician expert in ophthalmology. However, this restricts the diagnosis to the experience acquired by the specialist, that is, it becomes qualitative. From fundus images, it is possible to carry out a quantitative analysis of the vascular structure of the retina, which is helpful to the specialist who can use the technique both for the diagnosis of the pathology and for its follow-up throughout the treatment.
A great challenge that arises next is that the detection of small changes in the structure of the retinal veins is a challenging task; for this, the images taken of the patient would be required to have a very high resolution. However, using computational tools that process medical images is a way to deal with this problem, which would result in a support tool for specialists when giving a diagnosis.
On the other hand, the major temporal arcade (MTA) is the thickest branch present in retinal fundus images. Structural changes in this vein have been identified by detailed analysis; these include tortuosity, change in thickness, and the angle of insertion, characteristics that have emerged as sequelae in both diabetic retinopathy and ROP [5,6,7,8]. Likewise, when there are changes in the opening of the MTA, this is understood as an important indicator of the structural integrity of the macular region [8,9].
A complementary technique that can be used to help both the diagnosis and the monitoring of the disease throughout its treatment is obtaining a simple mathematical expression that allows one to model the MTA. Currently in the literature, there are some works that have addressed modeling. Oloumi et al. [10,11] proposed two different methods based on a parabolic modeling of the MTA; one consists of a single parabola and the second of two parabolas, one for each branch extending from the optic nerve head. In both two works, the well-known strategy of the Hough transform was used for detecting the parabolic shape of the MTA. The objective of their work was to quantify changes in the opening of the MTA associated with diabetic retinopathy as well as to measure the angle of the arch, which showed significant differences when models obtained from images of healthy subjects were compared with patients diagnosed with diabetic retinopathy. As mentioned, one of the most used techniques for curve detection in images is the Hough transform [12]. Unfortunately, the computational time of the Hough transform makes it unfeasible to used in clinical practice. In this way, with the aim of reducing the analysis time, new techniques have been explored. Valdez et al. [13] proposed a method for the detection of MTA in fundus images. This consisted of hybridization by combining the UMDA algorithm with simulated annealing (SA), which allowed one to guide the search to promising regions. A segmented image was used as an objective function, being weighted with the pixel according to the distance to the parabola vertex.
More recently, Giacinti et al. [14] proposed parabolic modeling; however, this was done using the evolutionary univariate marginal distribution algorithm (UMDA). This model yielded an average accuracy value of 0.85 compared to the ground-truth of the trace performed by an ophthalmologist. Alvarado et al. [15] carried out a numerical modeling of the MTA using second-order spline curves. However, it has the disadvantage that in some images the modeling fails since the method is very sensitive to the automatic location of the control points of the spline, making this a characteristic to improve in the technique, in addition to the fact that only five control points are used to generate the second-order spline.
In this paper, a novel method based on Jacobi polynomials and the Boltzmann univariate marginal distribution algorithm (BUMDA) for the numerical modeling of the MTA is proposed. The method determines the optimal coefficients that build a linear combination of polynomials up to fourth order, in addition to determining the value of the parameters ( α , β ) . The efficiency of the method was quantified using two measures: the mean distance to the closest point (MDCP) and the Hausdorff distance. The results obtained were contrasted with those presented in the works mentioned above.
In this paper, a robust method for the detection and modeling of the MTA in fundus images is presented. The algorithm follows a BUMDA strategy, building multiple MTA models from pixels data of the blood-vessel segmented retinal image. Implementing a model using polynomials is the novel aspect of this work since in the literature there are no models of the MTA of this type, in addition to seeking to better cover the profile of the retinal vein. Each model consists of a Jacobi polynomial curve with the ability to consider both symmetric and asymmetric scenarios. To choose the best MTA model, the method considers the two smallest measures of the MDCP and the Hausdorff distance.
The contributions of this work are summarized as follows:
  • A modeling strategy addressing both symmetric and asymmetric scenarios is presented to improve the MTA characterization.
  • A BUMDA scheme together with Jacobi polynomials with the purpose of improve the modeling of the MTA.
  • A set of MTA manual delineations for the benchmark DRIVE dataset has been released for scientific purposes
The rest of this paper is organized as follows. In Section 2, the database of the MTA images, a description of the Jacobi polynomials, and the BUMDA algorithm are detailed. In Section 3, the proposed method is presented in addition to the MTA segmentation and the evaluation metrics. Section 4 shows the experimental results and the discussion. Finally, in Section 5, the most relevant conclusions of the work are presented.

2. Materials and Methods

The DRIVE database [16] of 40 retinal fundus images was used in experiments. Since this database is used for blood vessel segmentation, the specific delineation of the MTA was performed by an ophthalmologist (Dr. Luis M. López-Montero).

2.1. Database of the MTA Images

Each image used is in RGB 8-bits format with size 565 × 584 pixels. The DRIVE database consists of 40 retinal fundus images, 20 images of training, and 20 images of testing; this database is publicly available and is used mainly for blood-vessel segmentation. In this paper, the database was only used for the detection of the MTA; the training and testing sets of retinal fundus images were specifically outlined to work with the major temporal arcade. This images were performed by an ophthalmological specialist (Dr. Luis M. López-Montero) from the highly specialized medical unit (UMAE) T1-León.

2.2. Jacobi Polynomials

The Jacobi polynomials [17], expressed as J n ( α , β ) ( x ) , are an important class of orthogonal polynomials. They are orthogonal with respect to the weight w ( x ) = 1 x α 1 + x β on 1 , 1 , with the restriction α , β > 1 :
1 1 J n ( α , β ) ( x ) J m ( α , β ) ( x ) 1 x α 1 + x β d x = 2 α + β + 1 2 n + α + β + 1 Γ ( n + α + 1 ) Γ ( n + β + 1 ) Γ ( n + α + β + 1 ) δ n , m ,
being Γ ( x ) the gamma function.
The Jacobi polynomials J n ( α , β ) ( x ) are the solution for the Sturm–Liouville equation:
1 x 2 y ( x ) + β α α + β + 2 x y ( x ) + n n + α + β + 1 y ( x ) = 0 .
Each Jacobi polynomial can be obtained through the Rodrigues formula:
J n α , β ( x ) = ( 1 ) n 2 n n ! 1 x α 1 + x β d n d x n 1 x α 1 + x β 1 x 2 n .
For the calculation of the k-th derivative, it can be obtained by:
d k d x k J n ( α , β ) ( x ) = Γ α + β + n + 1 + k 2 k Γ α + β + n + 1 J n k ( α + k , β + k ) ( x ) .

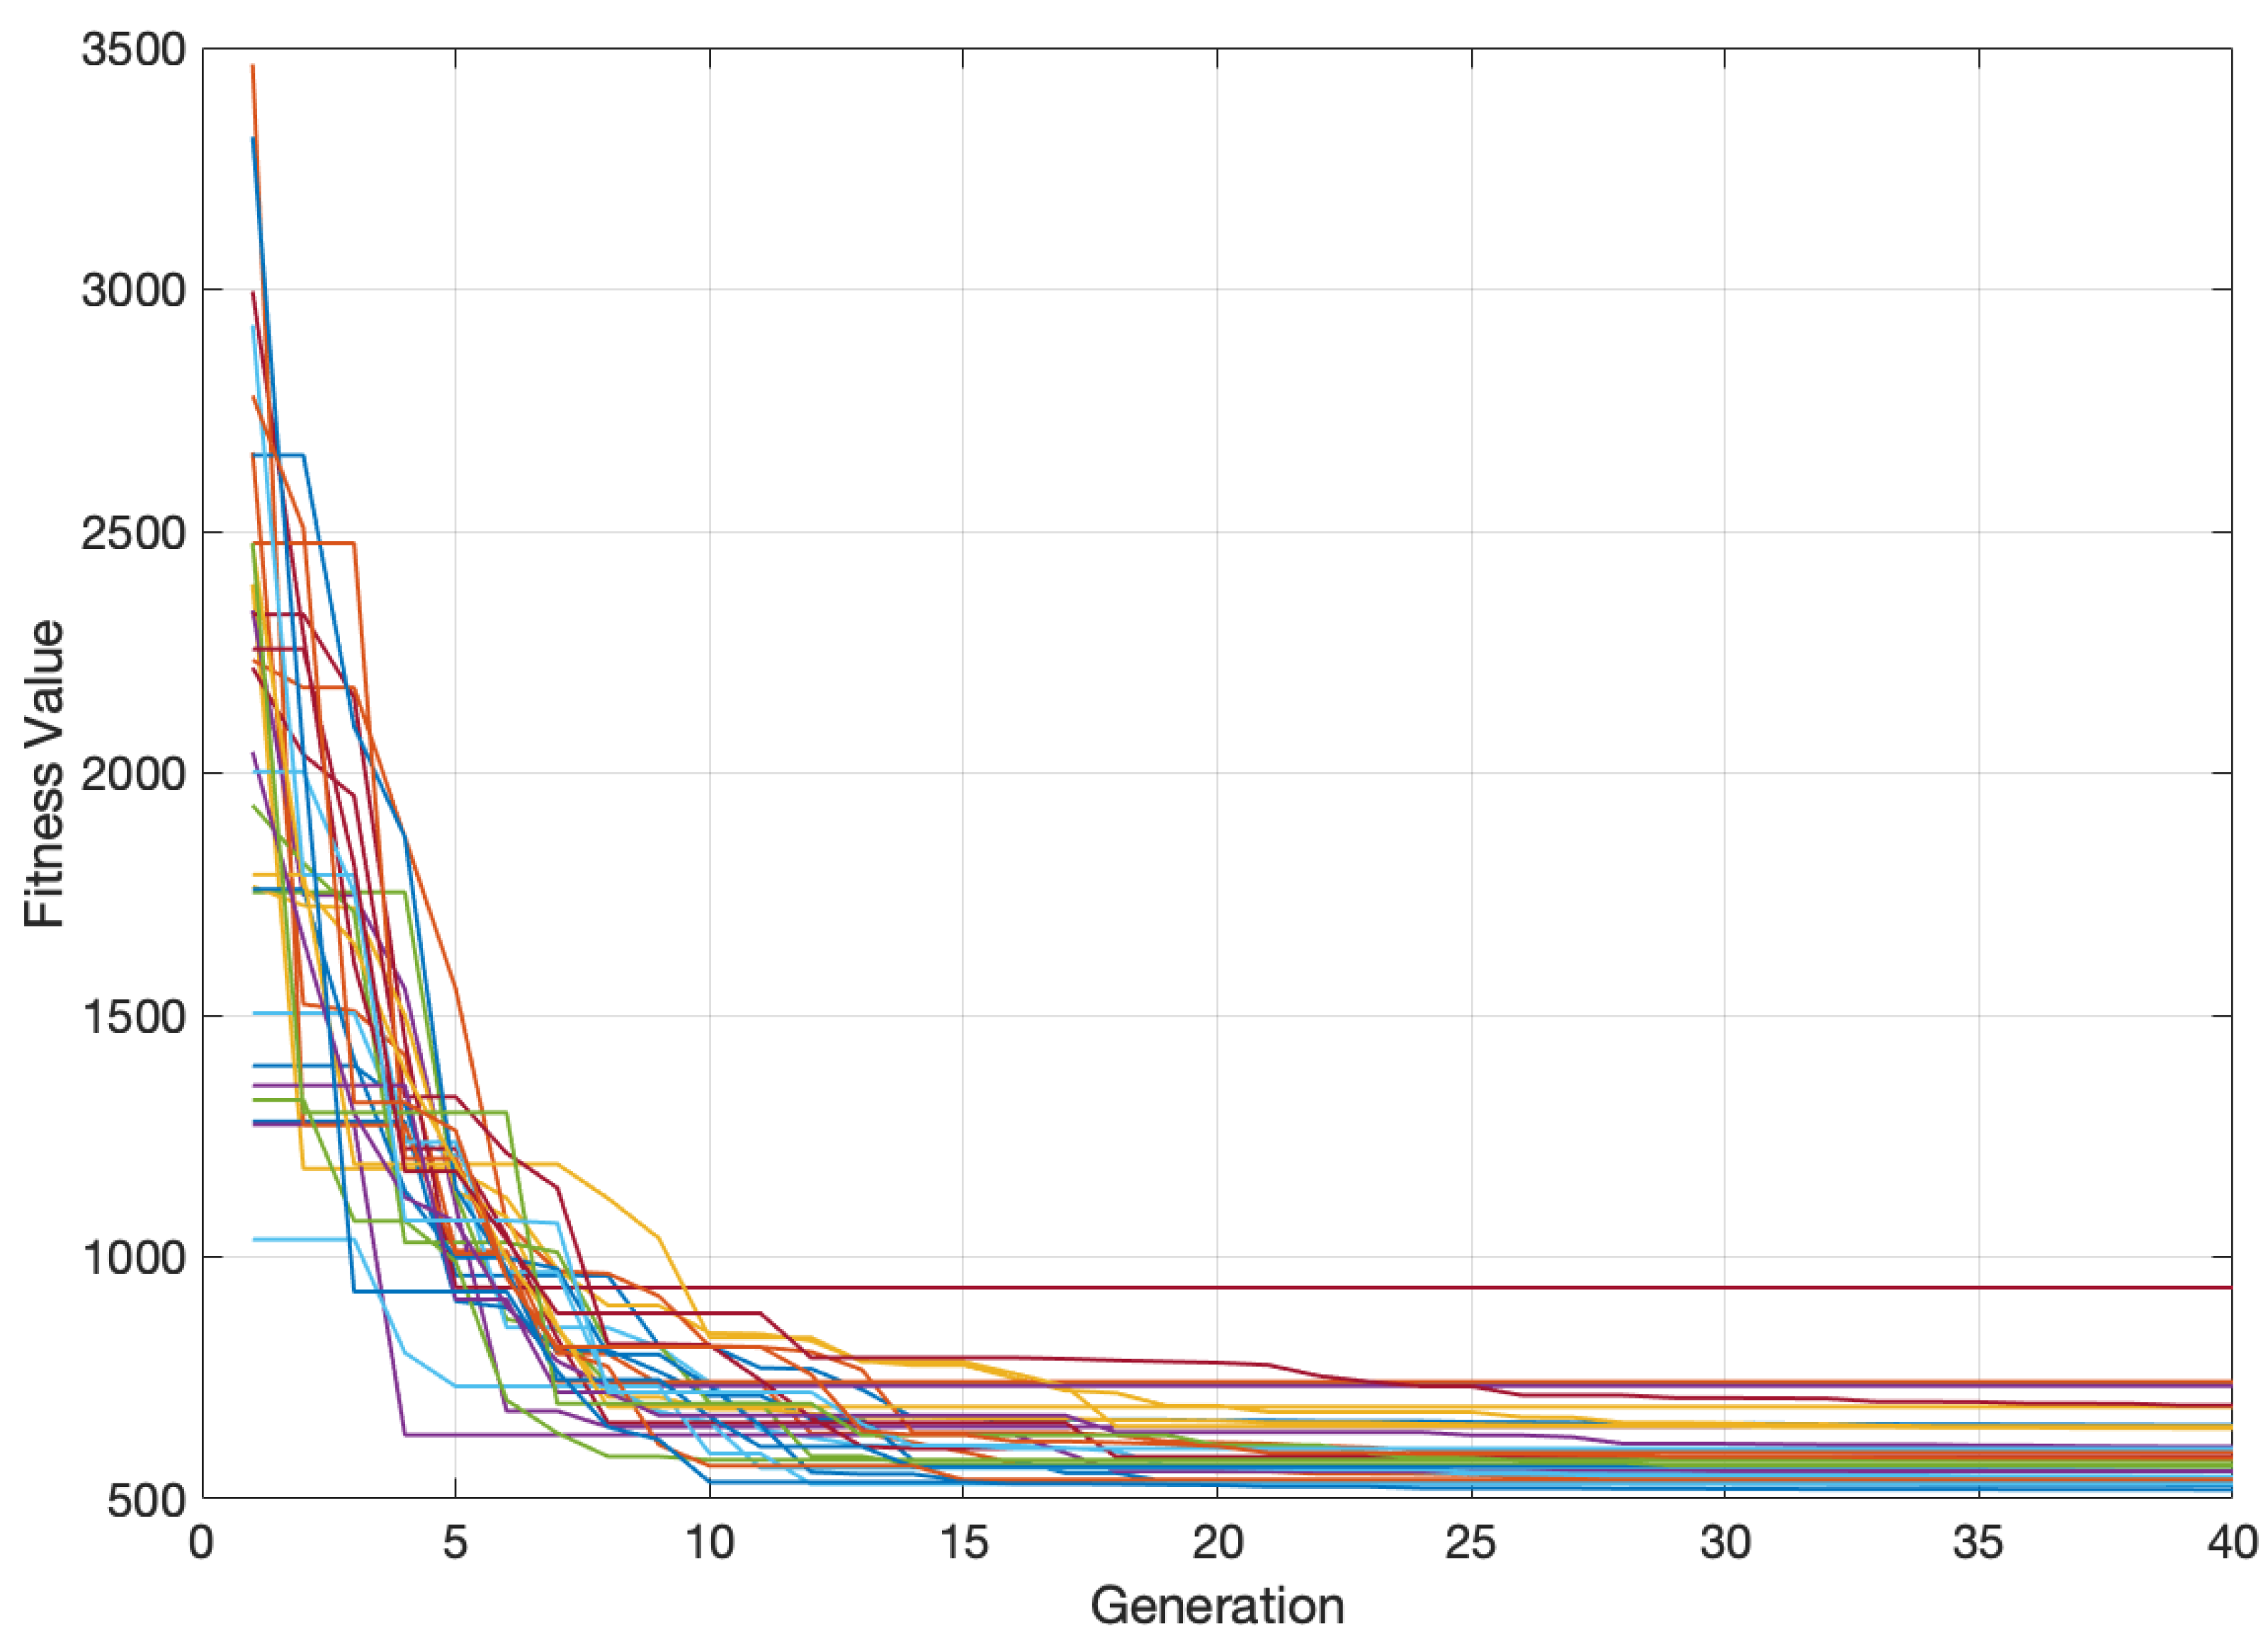
2.3. Boltzmann Univariate Marginal Distribution Algorithm (BUMDA)

In the search for the solution to an optimization problem, computational techniques emerge as immediate strategies to be implemented. In order for these solutions to be found in a reasonable amount of time, metaheuristic algorithms become the most appropriate. In particular, the estimation of distribution algorithms (EDAs) builds probabilistic models that are iteratively refined with the intention of obtaining better solutions for an objective problem. Let us bear in mind that maintaining probabilistic models is more complicated than simply applying evolutionary operators to a population; however, these models allow EDAs to adapt to the structure of the problem, giving them an advantage over other metaheuristics [18].
In the last decade, attention has been paid to the Boltzmann Probability Density Function (Boltzmann-PDF) [19] to the point of making it the probabilistic model of EDAs [20]. The Boltzmann-PDF emerged in the 19th century, in the area of physics for the field of statistical mechanics, as a way to model the distribution of particles in their energy states
P x = P ( x , β ) = 1 Z e β g ( x ) ,
where Z is a normalization parameter known as “partition function”, and g ( x ) is the energy of the states x and β = 1 T , with T the temperature of the system. Equation (5) shows that there is a greater probability of the particles occupying the states of lower energy than those of higher energy, and that it is less probable that they occupy more energetic states. Thus, by coupling this Boltzmann-PDF to an EDA, the minimization of an “energy” function will be sought through stochastic optimizations.
So far it can be inferred that it is simply enough to use the said PDF to solve any optimization problem through an EDA. However, a significant problem arises: it is impossible to generate new possible solutions through the Boltzmann distribution since it lacks parameters such as the mean and standard deviation. However, this problem can be addressed by approximating the Boltzmann distribution to a Gaussian distribution, which is defined as
Q x = Q ( x ; μ , ν ) = 1 2 π ν exp 1 2 x μ 2 ν .
That approximation is carried out by minimizing a measure of divergence between the two PDFs with respect to the parameters of interest, which in this case would be those of the Gaussian μ , ν = σ 2 . The divergence measure to be used is the Kullback–Liebler divergence (KL-divergence), which is given by the following equation:
D K L ( Q , P ) = x Q x log Q x P x d x .
Then, a mathematical analysis associated with a minimization process and taking into account the considerations as in [20] must be carried out, and selection operators that are Boltzmann-based ( μ , ν ) can be obtained that will allow numerical calculations to be made for the mean and standard deviation,
μ j g ( x j ) x j j g ( x j ) ,
and
ν j g ( x j ) x j μ 2 1 + j g ( x j ) .
Once the selection operators have been determined, it will be possible to estimate new individuals in subsequent generations during the evolutionary process. The steps to be followed by the BUMDA are shown in the following Algorithm 1.
Algorithm 1 MTA numerical modeling by BUMDA
Input:Population Size, Generations
Output: P b e s t
1:
Initialize Population (randomly real numbers)
2:
Evaluate Population            ▹ Obtain fitness values
3:
Sort fitness values
4:
Elite Selection            ▹ Best individual is extracted
5:
forgen 2 to Generationsdo
6:
    Compute the approximations to μ and ν
7:
    Generate a New Population, ( n 1 individuals) keeping the elite value from the last generation
8:
    Evaluate Population
9:
    Sort fitness values (Obtain New Best Fitness)
10:
    if New Best Fitness is better than Best Fitness then
11:
        Upload Best Solution
12:
    end if
13:
end for
14:
return P b e s t

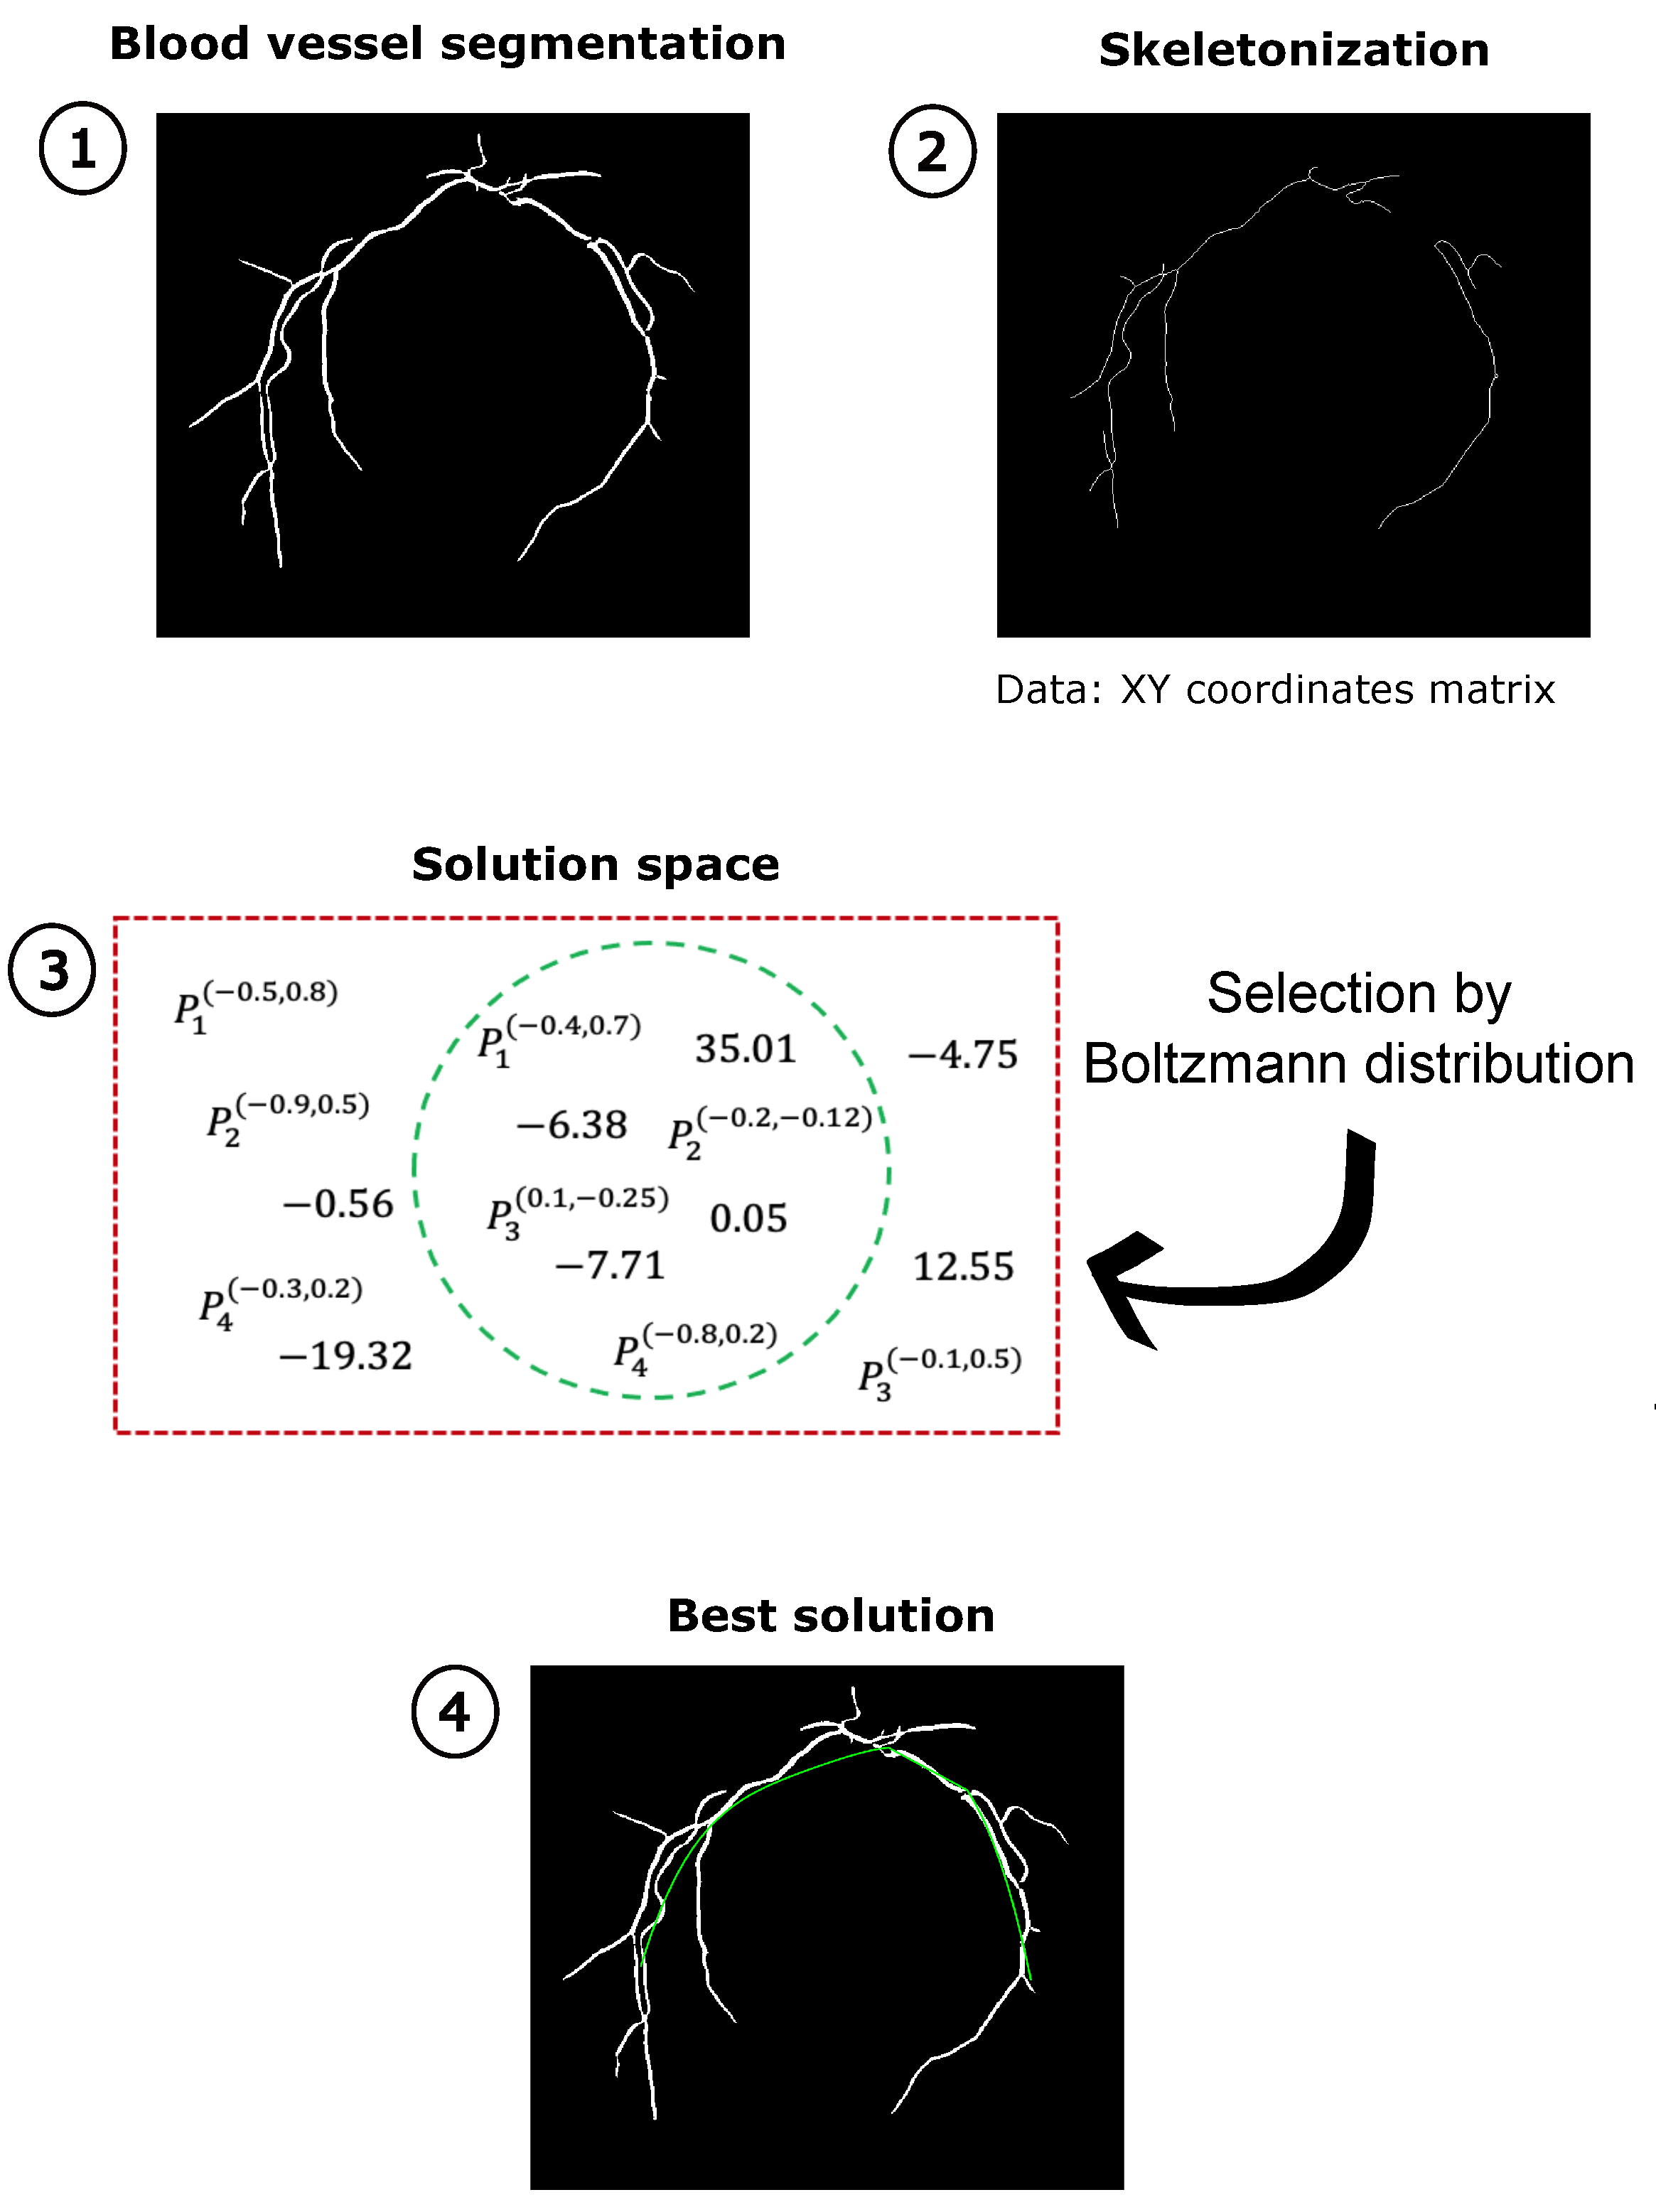
3. Proposed Method for the Numerical Modeling of the MTA

In order to improve the previous numerical modelings of the MTA, it is proposed to use a polynomial fit by means of a linear combination of Jacobi polynomials [21] because, throughout history, polynomials in general are considered adequate functions to carry out fit of data sets [22,23,24].

3.1. MTA Segmentation

To perform the numerical modeling of the MTA, a binary segmentation step is required in order to extract the thickest vessel from the background image. In this step, the multiscale Gaussian matched filter (MGMF) [25] was applied on the set of retinal fundus images since it presents suitable results in multiscale blood vessel segmentation. The method is governed by the four parameters σ , κ , L, T, and the neural network architecture. The main idea of the method is to approximate blood vessels by using a Gaussian profile as a matching template. This template is formed by a Gaussian curve, which can be defined as follows:
G ( x , y ) = e x p x 2 + y 2 2 σ 2 ,
where σ controls the width of the vessel-like structures, L and T are the length and width of the template, and κ is the number of oriented filters. In the present work, the MGMF parameters were experimentally determined as s i g m a = [ 1.8 , 2.2 ] , L = 13 , T = 15 , κ = 12 , and the neural network was designed with 2 hidden layers with 3 and 8 hidden neurons, respectively.

3.2. BUMDA and Jacobi Polynomials

A linear combination of the first four Jacobi polynomials has been proposed to build the curve that models the MTA. The general expression for the fit function is given as
f ( x ; α , β ) = C 0 + C 1 J 1 ( α , β ) ( x ) + C 2 J 2 ( α , β ) ( x ) + C 3 J 3 ( α , β ) ( x ) + C 4 J 4 ( α , β ) ( x ) = C 0 + i = 1 4 C i J i ( α , β ) ( x ) ,
where J i ( α , β ) is the i-th Jacobi polynomial, C i the coefficients associated with each of them, and α , β > 1 . The search space for the coefficients that accompany each polynomial in the general fit function was established in an interval of 200 , 200 . Likewise, the parameters α , β had a search space in the interval ( 1 , 1 ] .
The decision to take only the first four polynomials to generate the fit curve was based on the fact that in previous papers the fit was made using a second degree curve so that when performing several experiments it was observed that a good fit was obtained through curves generated by a fourth order function, that is, using only the first four polynomials.
Both, the set of coefficients C i and the parameters ( α , β ) were determined using the BUMDA algorithm since it has fast convergence and its computational cost is low. A brief description of the operation of this type of algorithm is given below.
The BUMDA algorithm optimizes seven parameters: five coefficients corresponding to the polynomial series and the two parameters associated with the determination of the specific Jacobi polynomial.
The proposed method consists of the following steps: (1) the blood vessel segmentation of the retinal fundus image; (2) the skeletonization and extraction of the parameters of interest; (3) the construction of the numerical model of the MTA from the extracted parameter and the evolutionary algorithm; and (4) demonstrating the best solution. Figure 1 shows a general scheme of the methodology proposed in this work to obtain the adjustment function for the MTA.

3.3. Evaluation Measures

Once the stop criteria are achieved (i.e., an optimal solution has been found), it is necessary to analyze how close it is to the original data set; for this, two measures are used—the mean distance to the closest point (MDCP) and the Hausdorff distance—since they have been commonly used in literature to solve this problem.
MDCP calculates the average of the distances from each point (coordinate) of the set obtained by the algorithm with respect to the original data set; this is mathematically expressed as
M D C P ( A , B ) = 1 N i = 1 N D C P ( a i , B ) ,
where N is the cardinality of the obtained set and DCP is the distance to the closest point, which is calculated as
D C P ( a i , B ) = m i n | | a i b j | | .
On the other hand, the Hausdorff distance performs a calculation very similar to the MDCP. The way in which the DCP is calculated is exactly the same; the change now occurs in the fact that an average is not calculated, but rather the maximum value of the DCP is taken.
H ( A , B ) = m a x D C P ( a i , B ) .
Small values in both metrics ensure that the model generated by the algorithm at the end of the evolutionary process is good enough.
The proposed method can be seen in summary form in Algorithm 2.
Algorithm 2 Proposed Method
Input:Fundus Image
Output:Best MTA fit
1:
Load fundus image
2:
Perform MTA segmentation
3:
Skeletonization of the image to choose principal pixels
4:
Execution of BUMDA-Jacobi Algorithm         ▹ Algorithm 1
5:
Calculation of evaluation measures      ▹ MDCP and Hausdorff Distance
6:
ReturnBest MTA fit

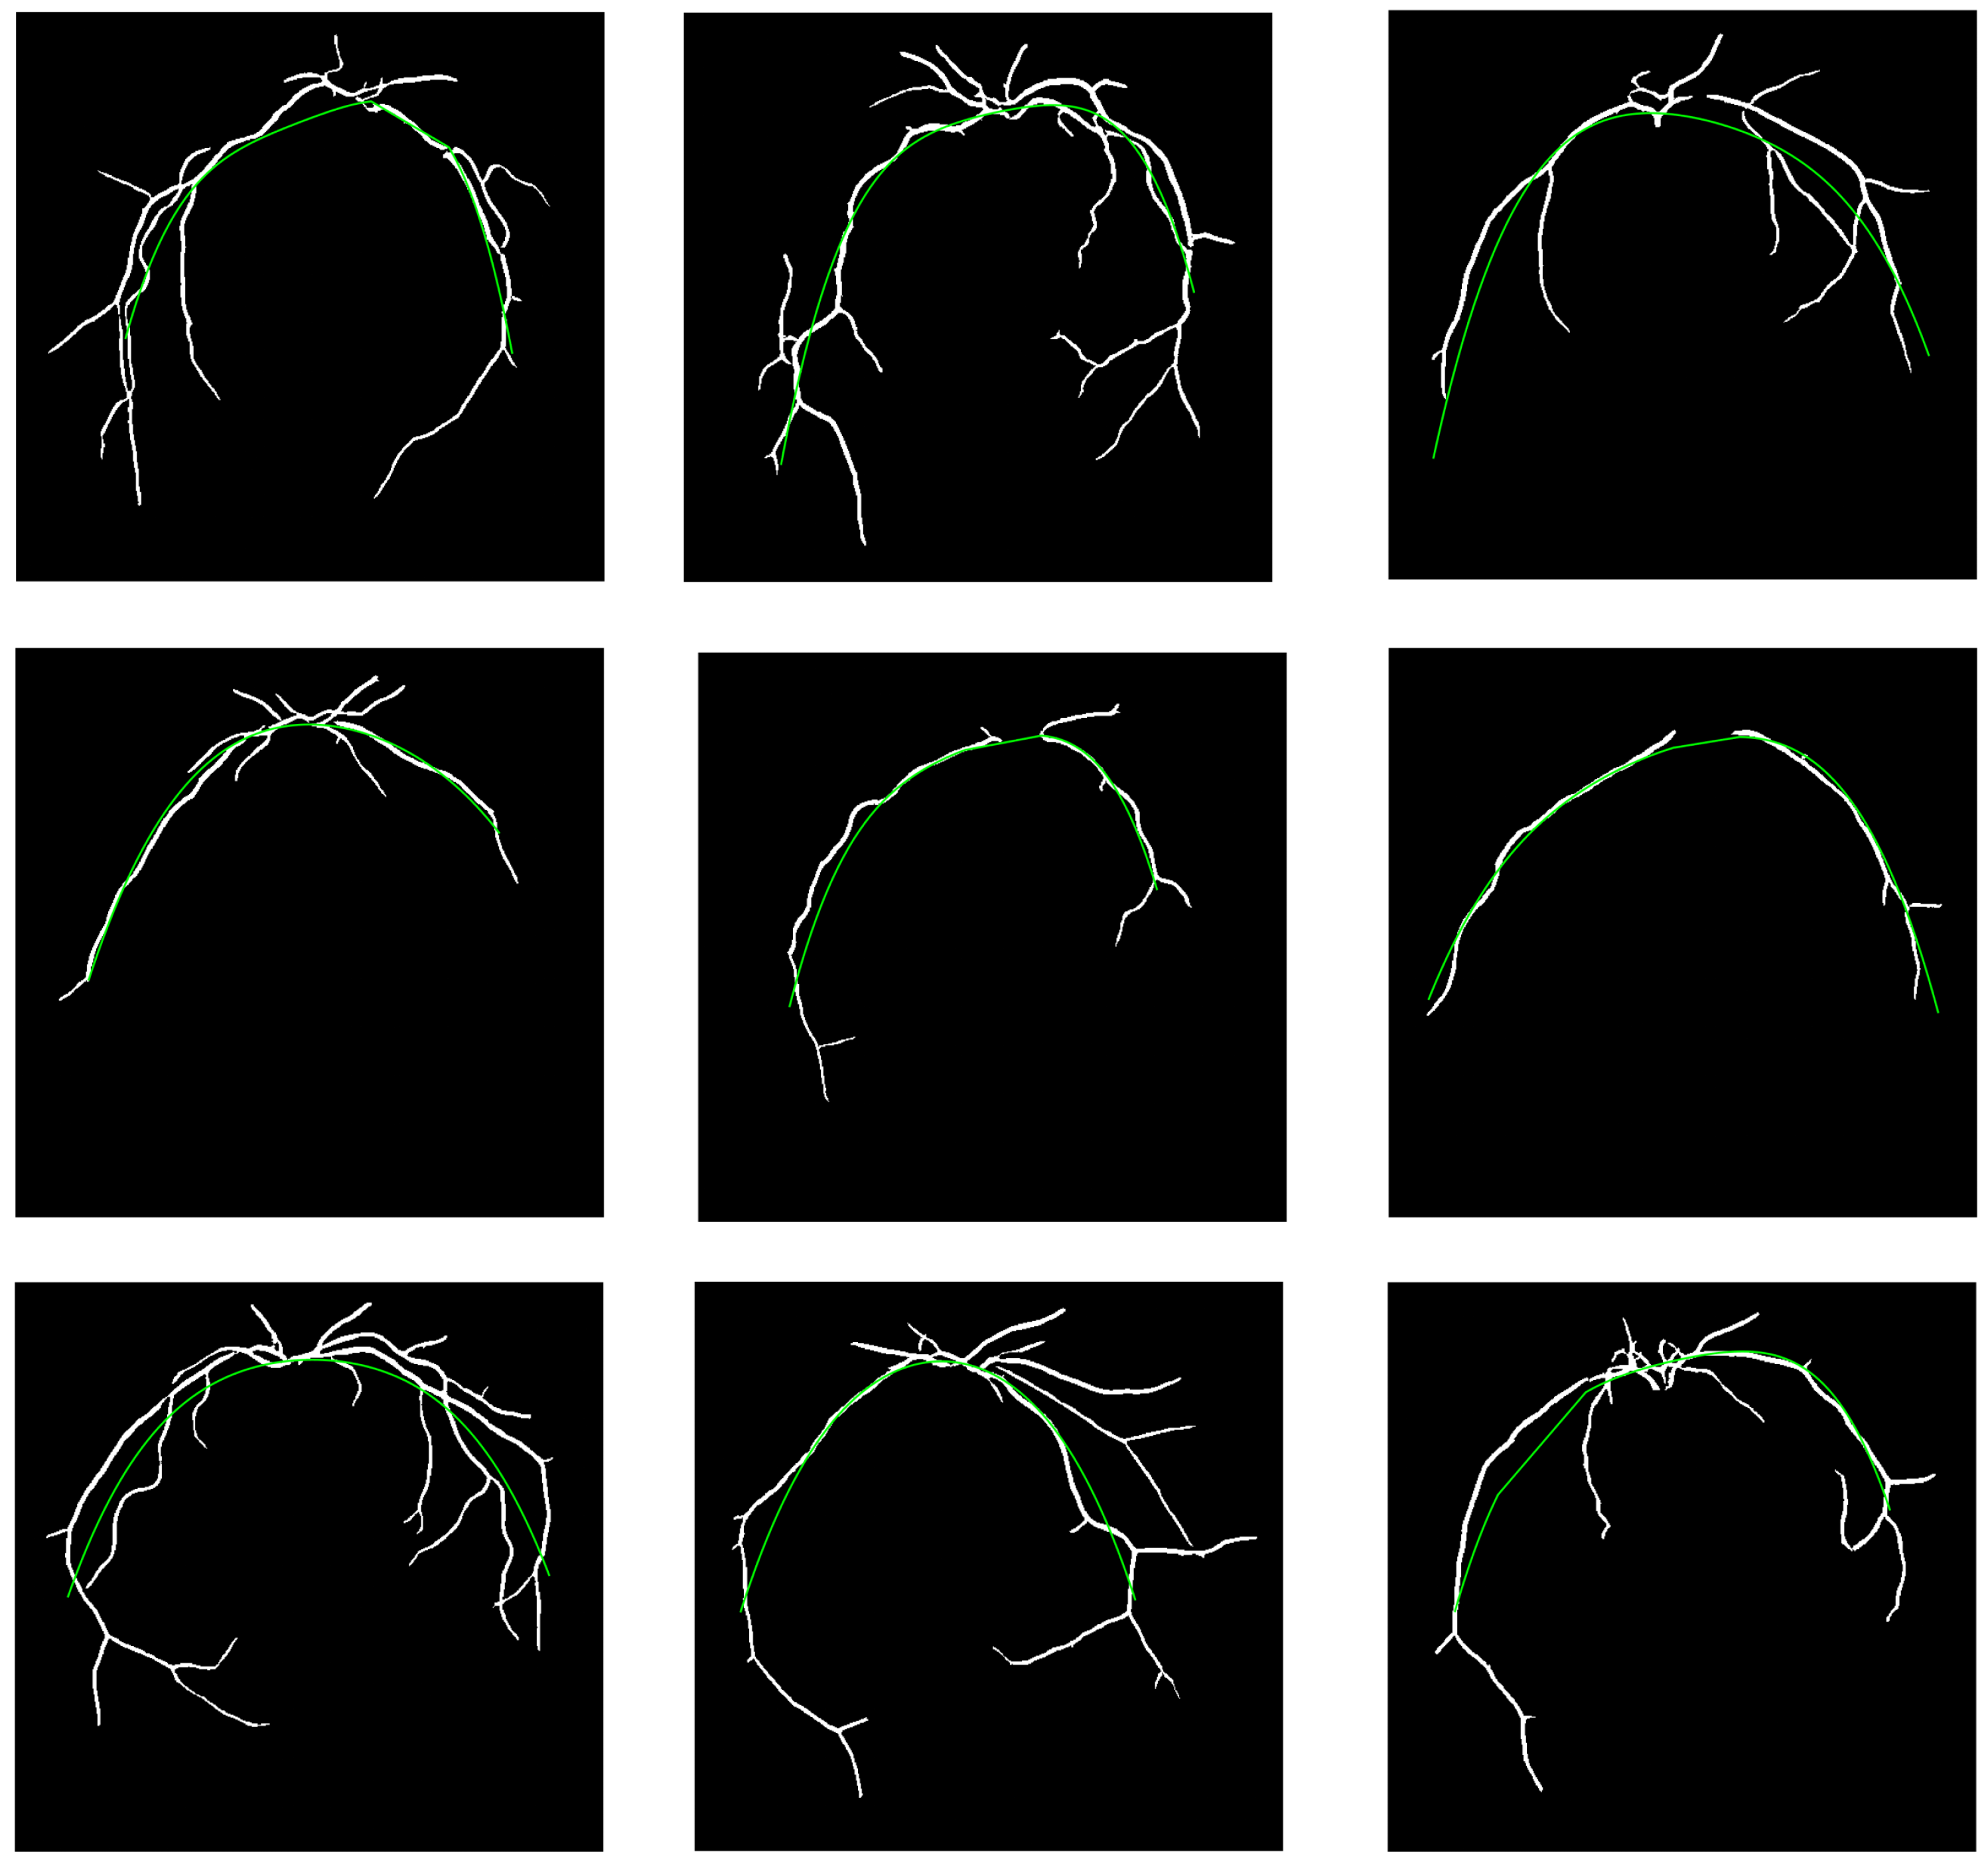
4. Experimental Results and Discussion

The BUMDA-Jacobi algorithm was coded and executed in MATLAB® R2021b running on MacOS Catalina. The experiments were carried out with Intel®CoreTMi5-45706SM CPU @ 2.9–3.6 GHz, and 16 GB RAM. For each of the twenty testing images in the DRIVE database, thirty runs were performed with the intention of obtaining enough information for subsequent statistical analysis. Based on several experiments carried out, the starting configuration of the algorithm was set to 200 individuals in the population and 40 generations of evolution.
In Table 1, the mean, median, variance, and maximum and minimum values of the results obtained for the MDCP, the Hausdorff distance, and the execution time of the thirty executions of the best solution found by the BUMDA are reported.
Regarding convergence, Figure 2 shows the behavior of each of the 30 executions for the MTA modeling. It can be seen that the optimal result is reached below generation 40.
For the distance values, Table 2 shows the results obtained from the best fit for the MDCP and the Hausdorff distance together with the values reported in the literature.
Table 3 shows the execution time used by each method; it is observed that the UMDA + SA method is the one that requires the least time during its execution; however, the BUMDA method is less than two seconds above it, unlike the two others where the time required is much longer.
Table 4 shows a comparison of the evaluation measures results of the existing methods in the literature and the proposed method. The first column shows the compared method; in the second and third column, values for differences between the existing method and the proposed method are calculated. The results for the weighted-RANSAC method are the closest to those of the proposed method, having a better result in the MDCP value, with 0.11 px less. However, there is 1.69 px more for the Hausdorff distance.
In Table 5, the difference in the execution time between the proposed method and the methods in the literature is presented. Regarding the general Hough method, since its execution time is calculated per pixel, the total time is high compared to the other methods. The negative value shown by the UMDA+SA method indicates this method is 1.72 s faster than the proposed method.
Figure 3 shows a subset of retinal fundus images overlapping the outline with the numerical modeling. In each image, the MTA appears in white, and its best fit is represented in green. Table 6 shows the polynomial series together with their coefficients for each image of Figure 3.
The proposed method seeks to generate a numerical model that best fits the set of pixels that make up the major temporal arcade in fundus images. Using a BUMDA-type evolutionary algorithm, the coefficients and parameters associated with a linear combination of the first four Jacobi polynomials were optimized. From the previous works that have addressed this problem, the values of the MDCP and the Hausdorff distance have been used to verify how good the model obtained is. The results generated for the proposed method produce values of 22.94 and 79.53 pixels, respectively, below for the fastest state-of-the-art method. Although the results for the measures values between the proposed method and the weighted-RANSAC are very similar, the execution time is 6.53 s faster for the BUMDA proposed.
On the other hand, the proposed method reaches convergence quickly, and as can be seen in Figure 3, the model found is quite close to the MTA. Another important factor to consider is the time used to generate the model; the proposed method requires an average of 3.44 s, a particularly short time considering that one seeks to apply the method in the clinic to patients during a consultation.
Knowing the functional expression for adjustment allows some type of mathematical analysis to be carried out in such a way that more information can be extracted to help with the diagnosis and monitoring of the type of eye disease presented by the subject whose fundus images have been analyzed by the proposed method.

5. Conclusions

In this paper, the modeling of the Major Temporal Arcade in fundus images was carried out using an evolutionary algorithm strategy with a linear combination of the first four Jacobi polynomials. Here lies the novelty of this paper since the numerical modeling of the MTA using any kind of polynomial has not been addressed in the literature. The proposed method consists of using a BUMDA algorithm for the determination of the five coefficients of the polynomial series, in addition to the two parameters ( α , β ) associated with each polynomial. Once the parameters were determined, the fit function obtained was evaluated using two measures (the mean distance to the closest point (MDCP) and the Hausdorff distance) in order to verify how close the fit was to the delineation made by the expert. The results obtained were compared with four models from the literature. In the first instance, the proposed method generated numerical models for the MTA in a very short time, only 3.4 s. Although the UMDA+SA method remained the fastest, the difference with the proposed method was only 1.76 s; nevertheless the MDCP and Hausdorff distance values were 22.94 and 79.53 pixels, respectively, higher than the proposed method. Additionally, analyzing the results for the measurements of the MDCP and the Hausdorff distance allowed for the verification of the high closeness of the numerical model generated by the proposed method with respect to the original data set. With the proposed method, it was possible to generate a good numerical model to be able to describe in the best possible way the profile described by the MTA. For all of the above, the BUMDA method for polynomial adjustment by Jacobi polynomials can be considered as a support tool for the ophthalmologist for the diagnosis and treatment of diseases associated with diabetic retinopathy and ROP.

Author Contributions

Conceptualization, J.A.S.-Á., I.C.-A.; Formal Analysis, J.A.S.-Á., I.C.-A.; Investigation, I.C.-A., A.H.-A.; Supervision, M.A.H.-G., L.M.L.-M.; Validation, S.E.S.-M. All authors have read and agreed to the published version of the manuscript.

Funding

This research received no external funding.

Informed Consent Statement

Not applicable.

Data Availability Statement

Not applicable.

Acknowledgments

The authors thank CONACYT for the supporting granted for the post-doctoral stay carried out by the author José Alfredo Soto-Álvarez.

Conflicts of Interest

The authors declare no conflict of interest.

Abbreviations

The following abbreviations are used in this manuscript:
MTAMajor Temporal Arcade
EDAEstimation of Distribution Algorithm
ROPRetinopathy of Prematurity
MDCPMean Distance to the Closest Point
RGBRed, Green, Blue
BUMDABoltzmann Univariate Marginal Distribution Algorithm
PDFProbability Density Function
KLKullback–Liebler
DCPDistance to the Closest Point

References

  1. Rodríguez-Villalobos, Á.J.; Alvarado-Carrillo, D.E.; Cruz-Aceves, I.; Castellón-Lomelí, C.I.; López-Montero, L.M.; Hernández-González, M.A.; Giacinti, D.J. Estudio de la vida real sobre el modelado numérico de las arcadas temporales superiores e inferiores en imágenes de fondo de retina. Nova Sci. 2022, 14. [Google Scholar] [CrossRef]
  2. Teus, M.A.; Arranz-Márquez, E.; López-Guajardo, L.; Jiménez-Parras, R. Fondo de ojo. An. PediatrÍA Contin. 2007, 5, 163–166. [Google Scholar]
  3. Tenorio, G.; Ramírez-Sánchez, V. Retinopatía Diabética; conceptos actuales. Rev. MÉdica Del Hosp. Gen. MÉxico 2010, 73, 193–201. [Google Scholar]
  4. Oloumi, F.; Rangayyan, R.M.; Ells, A.L. Quantification of the changes in the openness of the major temporal arcade in retinal fundus images of preterm infants with plus disease. Investig. Ophthalmol. Vis. Sci. 2014, 55, 6728–6735. [Google Scholar] [CrossRef] [PubMed] [Green Version]
  5. Wilson, C.M.; Cocker, K.D.; Moseley, M.J.; Paterson, C.; Clay, S.T.; Schulenburg, W.E.; Mills, M.D.; Ells, A.L.; Parker, K.H.; Quinn, G.E.; et al. Computerized analysis of retinal vessel width and tortuosity in premature infants. Investig. Ophthalmol. Vis. Sci. 2008, 49, 3577–3585. [Google Scholar] [CrossRef] [PubMed]
  6. Wong, K.; Ng, J.; Ells, A.; Fielder, A.R.; Wilson, C.M. The temporal and nasal retinal arteriolar and venular angles in preterm infants. Br. J. Ophthalmol. 2011, 95, 1723–1727. [Google Scholar] [CrossRef] [PubMed] [Green Version]
  7. Oloumi, F.; Rangayyan, R.M.; Ells, A.L. Quantitative analysis of the major temporal arcade in retinal fundus images of preterm infants for detection of plus disease. In Proceedings of the IASTED International Conference on Signal and Image Processing, Wuxi, China, 8–10 July 2013; pp. 464–469. [Google Scholar]
  8. Oloumi, F.; Rangayyan, R.M.; Ells, A.L. Tracking the major temporal arcade in retinal fundus images. In Proceedings of the 2014 IEEE 27th Canadian Conference on Electrical and Computer Engineering (CCECE), Toronto, ON, Canada, 4–7 May 2014; pp. 1–5. [Google Scholar]
  9. Grewal, J.S.; Fielder, A.R. Sequelae of retinopathy of prematurity. Paediatr. Child Health 2012, 22, 19–24. [Google Scholar] [CrossRef]
  10. Oloumi, F.; Rangayyan, R.M.; Ells, A.L. Parabolic modeling of the major temporal arcade in retinal fundus images. IEEE Trans. Instrum. Meas. 2012, 61, 1825–1838. [Google Scholar] [CrossRef]
  11. Oloumi, F.; Rangayyan, R.M.; Ells, A.L. Computer-aided diagnosis of proliferative diabetic retinopathy via modeling of the major temporal arcade in retinal fundus images. J. Digit. Imaging 2013, 26, 1124–1130. [Google Scholar] [CrossRef] [PubMed] [Green Version]
  12. Ballard, D.H. Generalizing the Hough transform to detect arbitrary shapes. Pattern Recognit. 1981, 13, 111–122. [Google Scholar] [CrossRef] [Green Version]
  13. Valdez, S.I.; Espinoza-Perez, S.; Cervantes-Sanchez, F.; Cruz-Aceves, I. Hybridization of the Univariate Marginal Distribution Algorithm with Simulated Annealing for Parametric Parabola Detection. In Hybrid Metaheuristics for Image Analysis; Springer: Cham, Switzerland, 2018; pp. 163–186. [Google Scholar]
  14. Giacinti, D.J.; Cervantes Sánchez, F.; Cruz Aceves, I.; Hernández González, M.A.; López Montero, L.M. Determinación de la parábola de la vasculatura de la retina mediante un algoritmo computacional de segmentación. Nova Sci. 2019, 11. [Google Scholar] [CrossRef]
  15. Alvarado-Carrillo, D.E.; Cruz-Aceves, I.; Hernández-González, M.A.; López-Montero, L.M. Robust Detection and Modeling of the Major Temporal Arcade in Retinal Fundus Images. Mathematics 2022, 10, 1334. [Google Scholar] [CrossRef]
  16. Staal, J.; Abràmoff, M.D.; Niemeijer, M.; Viergever, M.A.; Van Ginneken, B. Ridge-based vessel segmentation in color images of the retina. IEEE Trans. Med. Imaging 2004, 23, 501–509. [Google Scholar] [CrossRef]
  17. Van Assche, W. Ordinary Special Functions. In Encyclopedia of Mathematical Physics; Springer: Berlin, Germany, 2006; pp. 637–645. [Google Scholar]
  18. Pelikan, M.; Hauschild, M.W.; Lobo, F.G. Estimation of distribution algorithms. In Springer Handbook of Computational Intelligence; Springer: Berlin, Germany, 2015; pp. 899–928. [Google Scholar]
  19. de Anda-Suárez, J.; Carpio-Valadez, J.M.; Puga-Soberanes, H.J.; Calzada-Ledesma, V.; Rojas-Domínguez, A.; Jeyakumar, S.; Espinal, A. Symmetric-approximation energy-based estimation of distribution (SEED): A continuous optimization algorithm. IEEE Access 2019, 7, 154859–154871. [Google Scholar] [CrossRef]
  20. Valdez, S.I.; Hernández, A.; Botello, S. A Boltzmann based estimation of distribution algorithm. Inf. Sci. 2013, 236, 126–137. [Google Scholar] [CrossRef]
  21. Szeg, G. Orthogonal Polynomials; American Mathematical Soc.: Washington, DC, USA, 1939; Volume 23. [Google Scholar]
  22. Choksi, B.; Venkitaraman, A.; Mali, S. Finding best fit for hand-drawn curves using polynomial regression. Int. J. Comput. Appl. 2017, 975, 8887. [Google Scholar] [CrossRef]
  23. Tong, Y.; Yu, L.; Li, S.; Liu, J.; Qin, H.; Li, W. Polynomial fitting algorithm based on neural network. ASP Trans. Pattern Recognit. Intell. Syst. 2021, 1, 32–39. [Google Scholar] [CrossRef]
  24. Ameer, S. Investigating Polynomial Fitting Schemes for Image Compression. 2009. Available online: http://hdl.handle.net/10012/4255 (accessed on 1 December 2022).
  25. Cruz-Aceves, I.; Cervantes-Sanchez, F.; Avila-Garcia, M. A Novel Multiscale Gaussian-Matched Filter Using Neural Networks for the Segmentation of X-Ray Coronary Angiograms. J. Healthc. Eng. 2018, 11, 5812059. [Google Scholar] [CrossRef] [PubMed]
Figure 1. MTA-modeling schematic diagram. (1) Segmentation of the MTA; (2) skeletonization performance and data acquisition; (3) execution of the BUMDA algorithm with Boltzmann-based selection operators to sample new solutions; and (4) solutions that best fit the MTA.
Axioms 12 00137 g001
Figure 2. Convergence profile for the 30 runs by the proposed method using the test set of 20 retinal fundus images.
Axioms 12 00137 g002
Figure 3. Numerical modeling on a subset of retinal fundus images.
Axioms 12 00137 g003
Table 1. Statistical values obtained from 30 runs by the proposed method using the test set of 20 retinal fundus images.
MDCP (px.)Hausdorff (px.)Time (s)
Mean7.5126.273.44
Median6.1721.293.43
Variance16.30190.910.001
Maximum21.3669.923.54
Minimum4.3414.433.4
Table 2. Mean Distance to the Closest Point and Hausdorff distance values for proposed method and the methods reported in the literature for several types of modeling approximation for MTA.
MethodMDCP (px.)Hausdorff (px.)
Mean ± Std.Mean ± Std.
General Hough 31.28 ± 0.00 64.49 ± 0.00
MIPAV 25.69 ± 0.00 59.91 ± 0.00
UMDA+SA 30.45 ± 12.94 105.8 ± 27.54
weigthed-RANSAC 7.40 ± 5.34 27.96 ± 17.66
Proposed Method 7.51 ± 4.1 26.27 ± 14.05
Table 3. Execution time comparison of the MTA detection and numerical modeling.
MethodExecution Time (s)
General Hough 4.7641 (per pixel)
MIPAV230
UMDA + SA 1.68
weighted-RANSAC 9.93
Proposed method 3.4
Table 4. Comparison table for MDCP and Hausdorff distance between the four methods in literature and proposed method.
Method ComparedMDCP (px.)Hausdorff (px.)
General Hough 23.77 38.22
MIPAV 18.18 33.64
UMDA + SA 22.94 79.53
weigthed-RANSAC 0.11 1.69
Table 5. Difference for the execution time between proposed method and literature methods.
Method ComparedExecution Time Difference (s)
General Houghvery high
MIPAV 226.6
UMDA + SA 1.72
weighted-RANSAC 6.54
Table 6. Fourth-order polynomial series for each MTA fit from images of Figure 3 (in order, left to right and upper to bottom).
Image ( α , β ) Polynomial Serie
01_test ( 0.6190 , 0.6274 ) 154.37 203.8 J 1 α , β + 139.89 J 2 α , β 22.28 J 3 α , β + 36.52 J 4 α , β
03_test ( 0.8510 , 0.7823 ) 138.51 134.27 J 1 α , β + 172.28 J 2 α , β + 2.54 J 3 α , β + 32.49 J 4 α , β
06_test ( 0.5412 , 0.9929 ) 148.23 6.32 J 1 α , β + 165.49 J 2 α , β 16.78 J 3 α , β + 16.07 J 4 α , β
07_test ( 0.9687 , 0.4990 ) 103.17 34.92 J 1 α , β + 125.34 J 2 α , β 15.44 J 3 α , β 3.98 J 4 α , β
09_test ( 0.9713 , 0.1148 ) 102.76 67.39 J 1 α , β + 114.92 J 2 α , β 5.16 J 3 α , β + 20.85 J 4 α , β
12_test ( 0.5027 , 0.4413 ) 139.96 + 5.90 J 1 α , β + 137.52 J 2 α , β + 32.75 J 3 α , β + 14.43 J 4 α , β
14_test ( 0.6905 , 0.9758 ) 134.44 8.25 J 1 α , β + 207.18 J 2 α , β + 6.35 J 3 α , β + 16.69 J 4 α , β
16_test ( 0.7432 , 0.6318 ) 141.09 11.64 J 1 α , β + 195.86 J 2 α , β 1.14 J 3 α , β + 8.98 J 4 α , β
17_test ( 0.9920 , 0.4718 ) 81.91 88.11 J 1 α , β + 159.60 J 2 α , β 1.82 J 3 α , β + 28.04 J 4 α , β
Disclaimer/Publisher’s Note: The statements, opinions and data contained in all publications are solely those of the individual author(s) and contributor(s) and not of MDPI and/or the editor(s). MDPI and/or the editor(s) disclaim responsibility for any injury to people or property resulting from any ideas, methods, instructions or products referred to in the content.

