Abstract
With the intensification of global competition and the increasing awareness of reducing energy consumption, sustainable supplier selection is crucial for establishing a solid cooperative relationship in sustainable supply chain management. This paper proposes a new framework that considers both the effective expression of uncertain information and the objective weights of decision makers to select sustainable suppliers. We first apply an interval-valued intuitionistic fuzzy set to express the information of decision makers. Moreover, this paper applies a plant growth simulation algorithm to aggregate decision makers’ information. Next, we adopt the similarity measure method to derive the target weight of each decision maker. Then, we apply the score function to rank the candidate sustainable suppliers. Finally, two practical cases are presented to verify the effectiveness of the proposed framework. The outcomes and comparative discussion show that the developed framework is efficient for sustainable supplier selection. Therefore, the proposed framework can be used to establish a solid cooperative relationship in the process of sustainable supply chain management.
Keywords:
energy consumption; interval-valued intuitionistic fuzzy sets; objective weights; supplier evaluation MSC:
03B52
1. Introduction
In 2020, the Chinese government declared that it will strengthen national ownership contributions and take stronger policy measures to strive to peak CO2 emissions by 2030 and achieve carbon neutrality by 2060 (Carbon Neutrality in China. http://chinaeucn.com/carbon-neutrality-china/ (accessed on 14 October 2022)), which is called the dual carbon strategy. The dual carbon strategy refers to a lifestyle that is green, environmentally friendly and low in carbon, and sustainable supply chain management (SSCM) is an effective way to achieve this goal [1,2,3,4]. Adopting a sustainable supply chain will benefit the company’s internal operations and enhance the positive perception of the company by customers, investors and the public. Sustainable supplier selection (SSS), which is in the process of SSCM, has become the primary issue to establish a solid cooperative relationship with the intensification of global competition [5]. Specifically, manufacturing companies have a large number of suppliers with varying levels of sophistication. If suppliers are not selected properly, it will have adverse effects on the company, such as disrupting production schedules, increasing inventory costs, delaying the delivery of parts or raw materials, causing shortages and defects, and delaying the delivery of finished products. When a company establishes a complete supplier management system, it can grasp the production situation and product price information of suppliers; obtain reasonable procurement prices and optimal services; ensure the quality and timely delivery of purchased materials; conduct a comprehensive evaluation of the supplier; even integrate suppliers into the production flow and establish long-term partnerships with suppliers to achieve optimal efficiency. In particular, with the outbreak of the Russia–Ukraine conflict, some multinational companies pay more attention to the security of the supply chain and accelerate the process of diversification of the global value chain. In addition, due to the globalization of supply chain development, it is more difficult and crucial for companies to choose a suitable supplier. If suppliers do not consider the logistics problems caused by the Russia–Ukraine conflict and the globalization of supply chain development, especially the reduction of logistics efficiency, this may have an extremely negative impact on the company’s operating efficiency, leading to problems such as capital chain breakage. To address these issues, many prominent scholars have used a number of methods to assess sustainable suppliers in the process [6,7,8,9,10,11].
During the SSS process, multiple experts need to work together and they also need to consider multiple attributes of the sustainable suppliers, which is known as Multiple Attribute Group Decision Making (MAGDM). The real reason is that a single decision maker (DM) tends to be extreme and one-sided in his or her consideration of issues. In addition, it is difficult for him/her to consider all aspects and details of an issue, especially in a complex supply chain. In addition, DMs always prefer to evaluate options with vague information rather than make a clear assessment [12,13]. Thus, fuzzy sets were applied to express the DMs’ uncertain judgments in the process of MAGDM [14] in the SSCM process, and the intuitionistic fuzzy sets (IFS) were extended by Atanassov [15] based on Zadeh’s fuzzy sets (FS) [14]. Some scholars have applied FS theory in dealing MAGDM problems [16,17]. More recently, Chen et al. [18] proposed the TOPSIS-DEMATEL, Zhou et al. [19] applied interval type-2 fuzzy sets in the SSCM process for SSS.
However, a number of important challenges remain in addressing SSS. For the first aspect, scholars have so far used methods that focus more on ranking sustainable supplier choices, but rarely consider the effective expression of information for DMs’ judgment [20,21]. For the second aspect, the aggregation process of DM information in the SSCM process also needs further improvement. For the third aspect, the assessment framework for SSS can also be improved. All of these aspects should be considered in the construction of the SSS assessment framework. Our main research questions (RQs) are shown below.
RQ 1: Considering the effective expression and the aggregation process of DMs’ information, which framework is more suitable for sustainable supplier selection?
RQ 2: How to construct a suitable framework to deal with SSS problems?
To address the above three aspects, this study proposes a new framework for SSS evaluation with the following characteristics. First, because interval-valued intuitionistic fuzzy set (IVIFS) is more reasonable in resolving imprecise facts or incomplete information [16,17,22], compared to FS and IFS. Therefore, we express the information of DM in the form of IVIFS for SSS. Second, we apply an effective algorithm called Plant Growth Simulation Algorithm (PGSA) in the process of aggregating the information of DMs. Then, we can derive the target weights for DMs based on the Euclidean distance between the information of each DM and the aggregated information. Finally, we can derive a weighted ideal decision based on PGSA. This leads to some new insights in SSS. On the one hand, the aggregation process can derive objective weights based on the information of the DMs, so the aggregated information is more objective. On the other hand, the PGSA in the aggregated information is validated for the number of intervals in the MAGDM problem [23,24]. From this perspective, the ideal matrix aggregated by PGSA is valid for SSS. Third, the proposed framework builds attribute systems by integrating the four pillars of SSS: logistics cost, logistics service quality, environmental management system, and social responsibility. These four pillars of SSS help ensure supply chain security, create a cost and service strategy under risk prevention, and improve logistics accessibility and resilience.
This paper is organized as follows. Section 2 presents a literature review of the important methods relevant to this study. Section 3 introduces the concept of IVIFS and describes the target weights for each DM. In addition, the aggregation method called PGSA is described in detail. In Section 4, we present PGSA based prioritization method for SSS and provide a case study to validate the advantages and merits of the method. In Section 5, we conclude our paper and summarize the priorities for further research.
2. Literature Review
The literature is divided into three subsections. In the first subsection, we summarize the important methods relevant to SSS. The second subsection discusses the application of IVIFS and PGSA in dealing with GDM problems. The third subsection highlights research gaps and our main contributions.
2.1. Sustainable Supplier Selection
Many scholars have proposed their frameworks to evaluate sustainable suppliers [7,10,25,26,27]. More recently, Arabsheybani et al. [6] applied MOORA and FMEA to evaluate sustainable suppliers’ risk. Li et al. [8] consider the randomness for SSS. Chen et al. [28] proposed that the aspect of quality levels is important in the process for evaluating sustainable suppliers, and they applied six sigma quality indices. Zhou et al. [19] considered the protection of environment and the social security, and their research framework considers various aspects such as economic indicators, environmental and social impacts. The authors in Nayeri et al. [29] designed a data-driven model considering the impact of COVID-19, they pointed out the importance of cost, quality, stability and pollution management indicators.
In the context of integrated decision-making models, Wu et al. [30] pointed out that current supplier selection studies suffer from information loss, weight bias and lack of psychometric analysis, which greatly weaken the accuracy of evaluation. To fill this gap, they proposed a new method for SSS in a mixed information environment. Rasmi et al. [31] proposed a multi-objective aggregate production planning model with consideration to sustainability of SSCM. With regard to the multi-criteria decision making (MCDM) model, Liu et al. [32] applied the MCDM model considering the impact of government policies and the cognitive limitations of the public, Song and Li [33] applied the MCDM model considering the issue of incomplete information expression and lack of information when making collective decisions among large groups. In addition, Pishchulov et al. [34] constructed a system of criteria and applied them in the SSS process. More recently, the multi-perspective multi-attribute decision making (MPMADM) framework is applied to select the optimal 3PRLP [35]. Different from the above study, our paper considers both the information expression and aggregation effectiveness, we propose a new framework for SSS evaluation based on IVIFS and PGSA.
2.2. Application of IVIFS and PGSA in GDM
IVIFS have been widely applied in GDM problems in the past decades [36]. In detail, Wei [37] proposed IVIFS to solve GDM problems. Xu [21] combined the application of IVIFS and the distance measure method to deal with GDM problems. Zhang and Pedrycz [38] developed a approach and they focused on the consistency under the environment of GDM. Tang et al. [20] focused on the additive consistency in the process of GDM. Wan and Dong [39] developed a three-phase method for GDM in the IVIFS environment. In conclusion, although many different approaches have been applied to solve the GDM problem in the IVIFS environment, the aggregation process of DM information needs further improvement, especially the process of deriving the objective weight of each DM needs further consideration.
In recent years, Chen et al. [40] introduced a new approach based on K-means clustering to overcome the limitations of the existing methods. Some other scholars applied PGSA to solve GDM problems, for instance, Li et al. [23] applied PGSA to solve GDM problems with interval numbers. Qiu and Li [24] proposed PGSA for MAGDM in the IVIFS environment. Qiu and Li [41] and Li and Zhang [42] proposed PGSA for aggregating interval neutrosophic sets (INSs). Liu and Wang [43] aggregated DMs’ information based on Steiner-Weber point and PGSA. Wang et al. [44] proposed a cross-efficiency intervals integrated ranking approach based on PGSA. Their research pointed out that PGSA is effective in dealing with GDM problems, especially when it is applied in aggregating information with interval numbers. The most relevant paper for our study is [45], they proposed PGSA and the continuous ordered weighted averaging (COWA) operator in group decision problems. Unlike them, this paper constructs a framework for sustainable supplier selection problems based on PGSA. We apply IVIFS to express the information of DMs in the process of GDM and present PGSA to aggregate the information of DMs. We construct an attribute system by integrating the four pillars of sustainable supplier evaluation: logistics service cost, logistics service quality, environmental management system, and supplier social responsibility. Our paper is helpful in ensuring supply chain security and logistics accessibility.
2.3. Contribution
Although many approaches have been applied to SSS in the process of SSCM, the effective expression of DMs’ judgment information needs to be further improved. In addition, determining the target weights for DMs in the process of SSS is critical, but few scholars consider aggregating the objective weights of DMs based on their judgment information both objective and reasonable. Moreover, with the outbreak of the Russia–Ukraine conflict and the dual carbon strategy, the evaluation framework for SSS should consider more aspects related to energy consumption and logistics service. To address the first issue in the process of SSS, IVIFS, which has been widely used for information expression, is applied to express the evaluation information of DMs. To address the second issue in the SSS process, PGSA is used to aggregate the judgment information of DMs, and the similarity measure method is used to derive the objective weights of DMs. In the next step, the weighted aggregated judgment information can be obtained by PGSA, which is effective in dealing with GDM problems. To solve the last problem in the process of SSS, we construct an attribute system by integrating the four pillars of sustainable supplier evaluation: logistics service cost, logistics service quality, environmental management system and suppliers’ social responsibility.
3. Preliminaries
In this section, we first introduce the concept of IVIFS. In the next step, we express the MAGDM problem for SSS in terms of IVIFSs. In the third part, we present the aggregation process and introduce the definition of PGSA. Finally, we propose the specific steps of the similarity measure method.
3.1. Interval-Valued Intuitionistic Fuzzy Set (IVIFS)
Definition 1
([14]). A fuzzy set (FS) in a finite set X is an object expressed as Equation (1) shows.
where is the membership function of , denoting the degree of membership of .
Definition 2
([22]). Let a non-empty set be a universe of discourse. Then where and denote the membership degree and the non-membership degree for any is called an IVIFS, and Equation (2) needs to be met.
Besides,
where
is the degree of indeterminacy of x to .
Definition 3
([24,46]). Suppose there are a group of DMs consider giving their preference degree of a MAGDM problem in form of IVIFSs. Let be a discrete set of m feasible alternatives, be the set of attributes, and be the weight vector of attributes where . Let be a group of experts/DMs, then the DM’ interval-valued intuitionistic fuzzy decision matrix is expressed as Equation (5) shows.
where the elements of are IVIFSs.
Definition 4
Definition 5
([37,47]). Let be an IVIFS, a score function S of an IVIFS can be represented as Equation (7) shows.
Let be an IVIFS, a score functionS, an accuracy function H of an IVIFS can be represented as Equation (8) shows.
To evaluate the degree of accuracy of the IVIFS where . The larger value of means the more accuracy of the IVIFS .
The order relation between two IVIFSs and .
- If , then
- If , then
- If , then
- −
- If , then
- −
- If , then
- −
- If , then
Definition 6
([48]). Let and be two arguments, then a normalized Euclidean distance of dimension n is a mapping , which has the following form
where and is the arguments of the A and B.
And a weighted Euclidean distance of dimension n is a mapping : that has an associated weighting with where . The definition of WED is shown in Equation (10).
3.2. The Minimum Euclidean Distance Model
We first convert the elements of the DM’s interval-valued intuitionistic preference relations into two-dimensional coordinates as follows.
Secondly, we can find the ideal point based on the following minimum Euclidean distance model.
Definition 7.
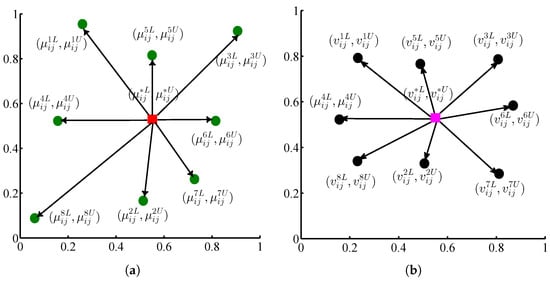
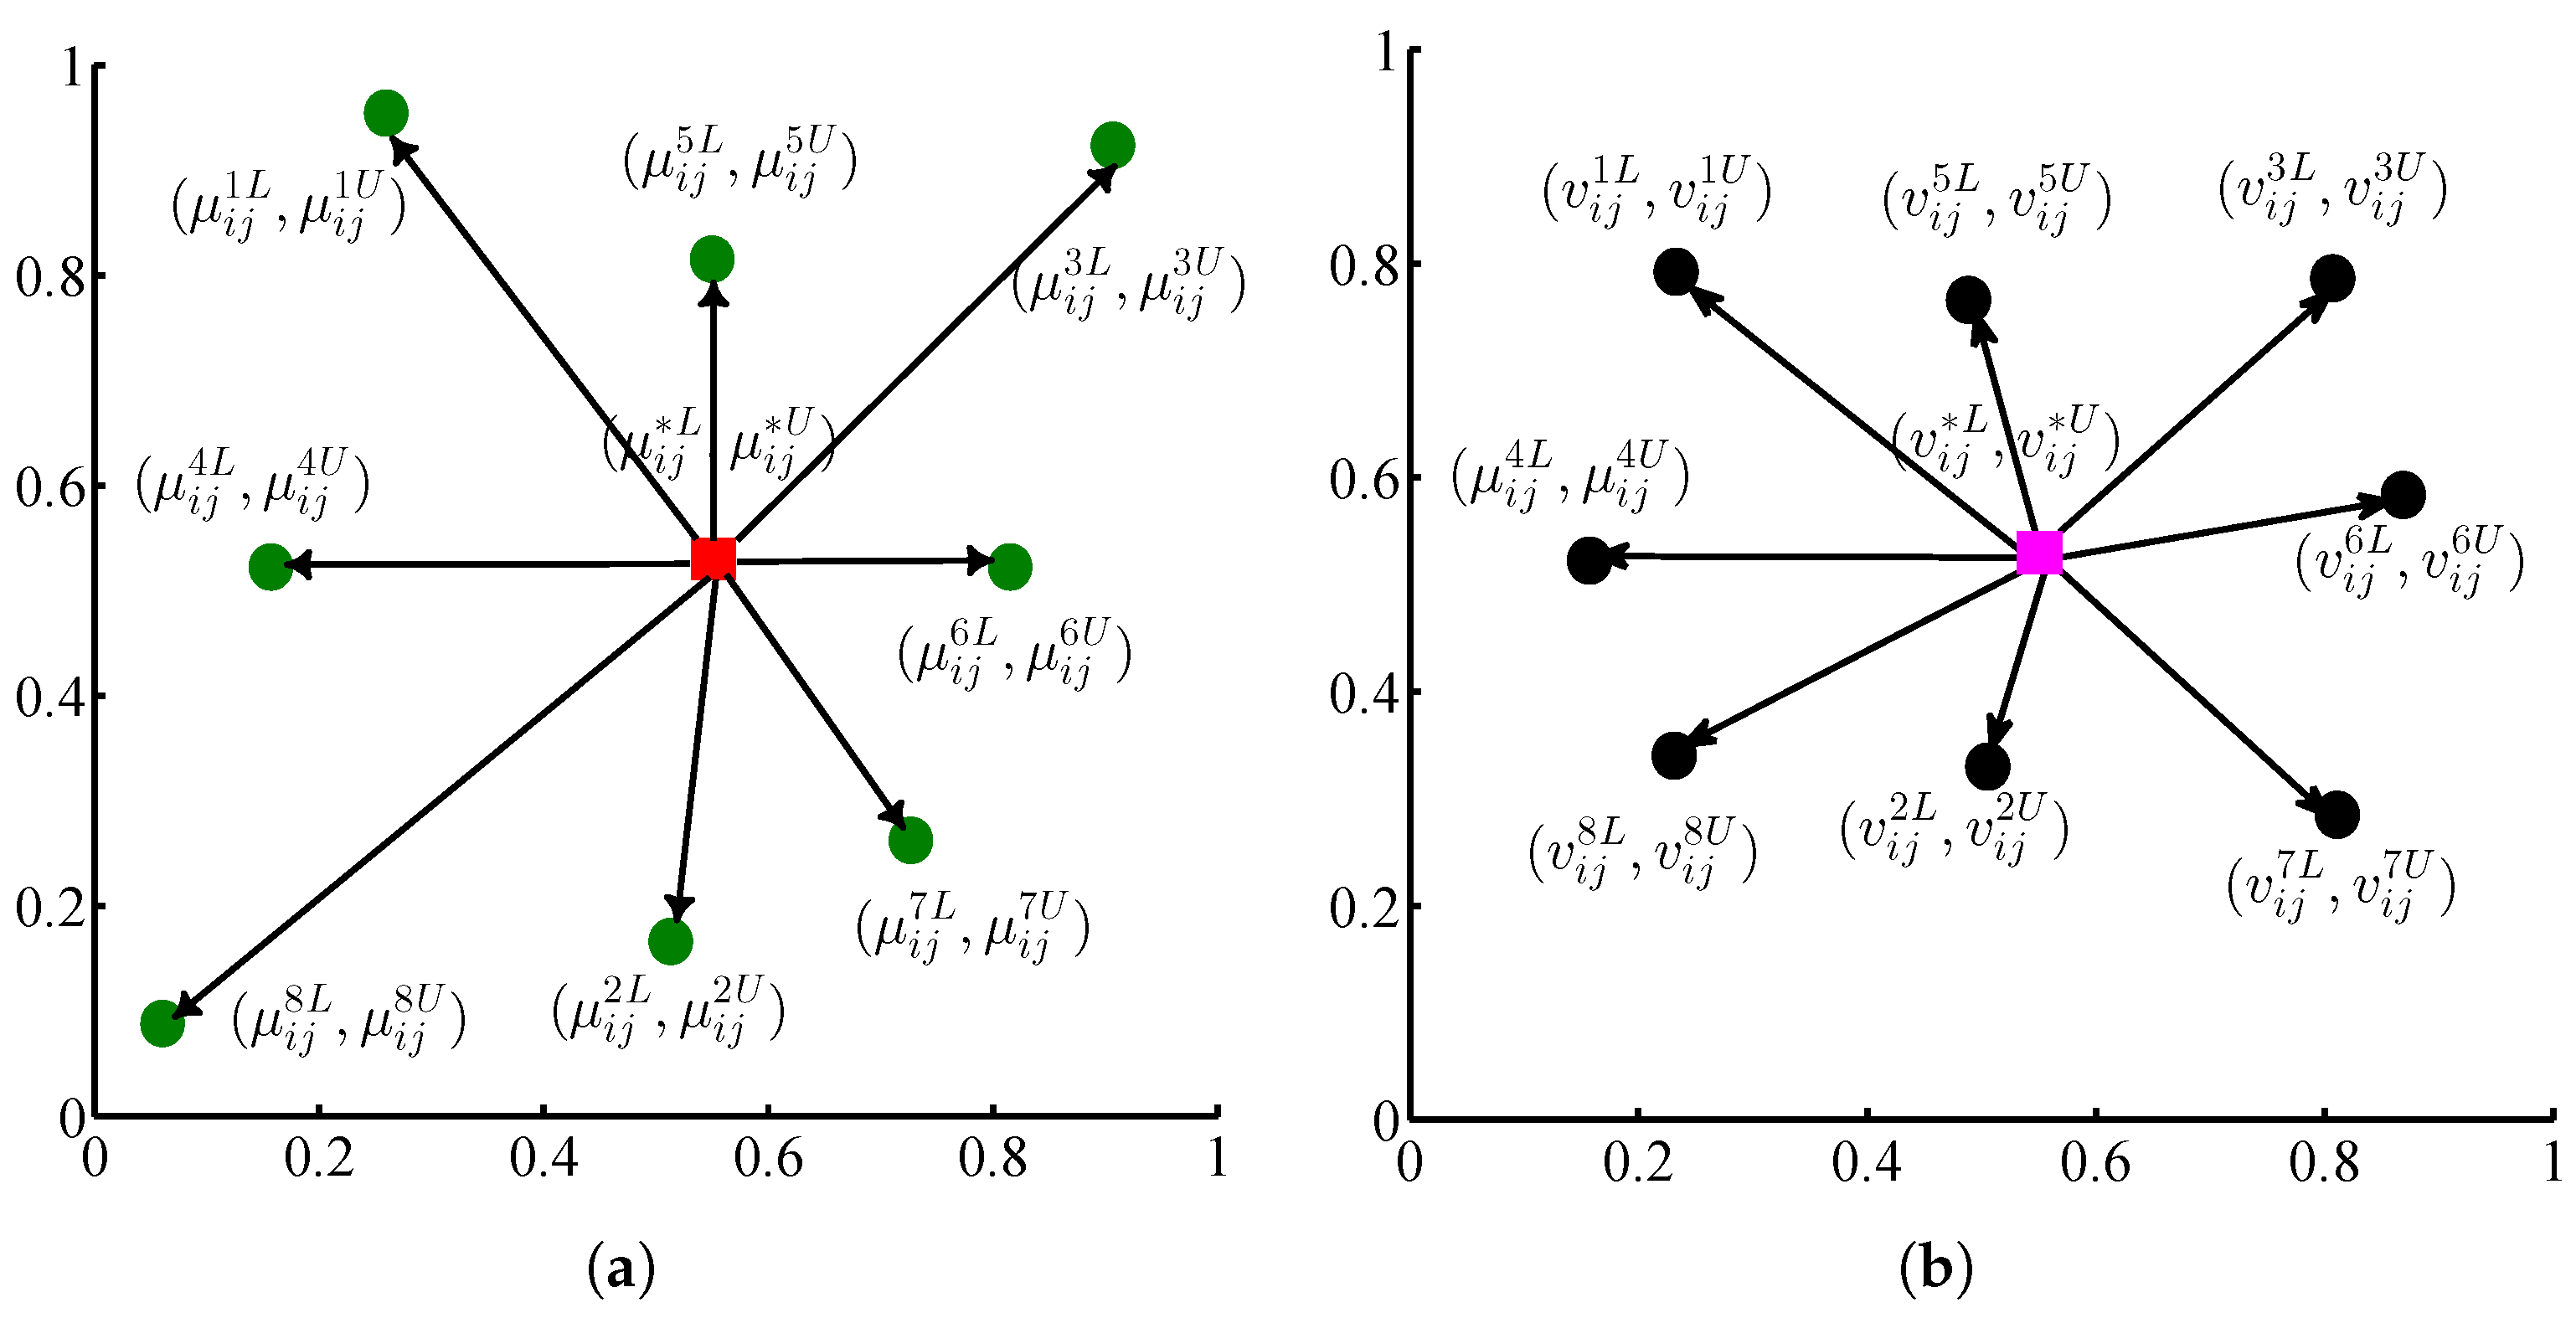
There are kpoints in a two-dimensional plane. If a point meets the following equation, it is called the ideal point (see Figure 1a). Among them, the circular points are the expert preference points to be aggregated, shown in green and black, and the square points are the good points of the aggregated expert pieces.
And if a point meets the following equation, it is also called the ideal point (see Figure 1b).
where .

Figure 1.
The ideal point. (a) ; (b) .
3.3. Plant Growth Simulation Algorithm (PGSA)
The goal in this paper is to get the optimal aggregated points and . There are p known points and we need to find which meet Equation (12) or Equation (14). In the same way, there are p known points and we need to find which meet Equation (13) or Equation (15).
This paper applies PGSA to derive the optimal interval-valued intuitionistic fuzzy decision matrix consist of the optimal aggregated points and . The detailed steps are shown below.
Step 1: Derive the original growing points (the original growing points in this study are selected as the given points in the decision matrix), L is the length of bounded closed box of . The plant growth process is shown in Figure 2 [23].

Figure 2.
The plant growth process [23].
Step 2: Calculate the growing probability as follow.
Step 3: Establish the probability space of each growing point and then derive the iterative growing points .
Step 4: In order to define the step length (the step length in this paper is set as and L is set as 1 in this paper), we allow the growing points to grow with , then we should replace the points with the new growth rally points based on the principle of the Sierpinski carpet, which is shown in Definition 8.
Definition 8

([23]). Sierpinski carpet is considered a box with bounded closed constraints. Suppose that the initial point grows in four directions in the bounded closed box, generating new branches. The angle of rotation between new branches is 90, namely, . The chart of sierpinski carpet is shown in Figure 3 [23].

Figure 3.
The chart of Sierpinski carpet [23].
Step 5: When the process produces no new growth points or the set number of iterations is reached, the computation is stopped. Otherwise, return to Step 2.
3.4. Deriving Objective Weights of DMs Based on the Similarity Measure Method
When the aggregated matrix are obtained, the similarity degree between and is defined as follows.
Furthermore, the objective weight of each DM is derived based on Equation (19).
where .
4. The PGSA Based Prioritization Method for SSS with IVIFSs
This section propose the prioritization process. In the first part, we first introduce the definition of the SSS problem. In the next part, we verify the effectiveness of our method through an example.
4.1. Procedures of the SSS Problem
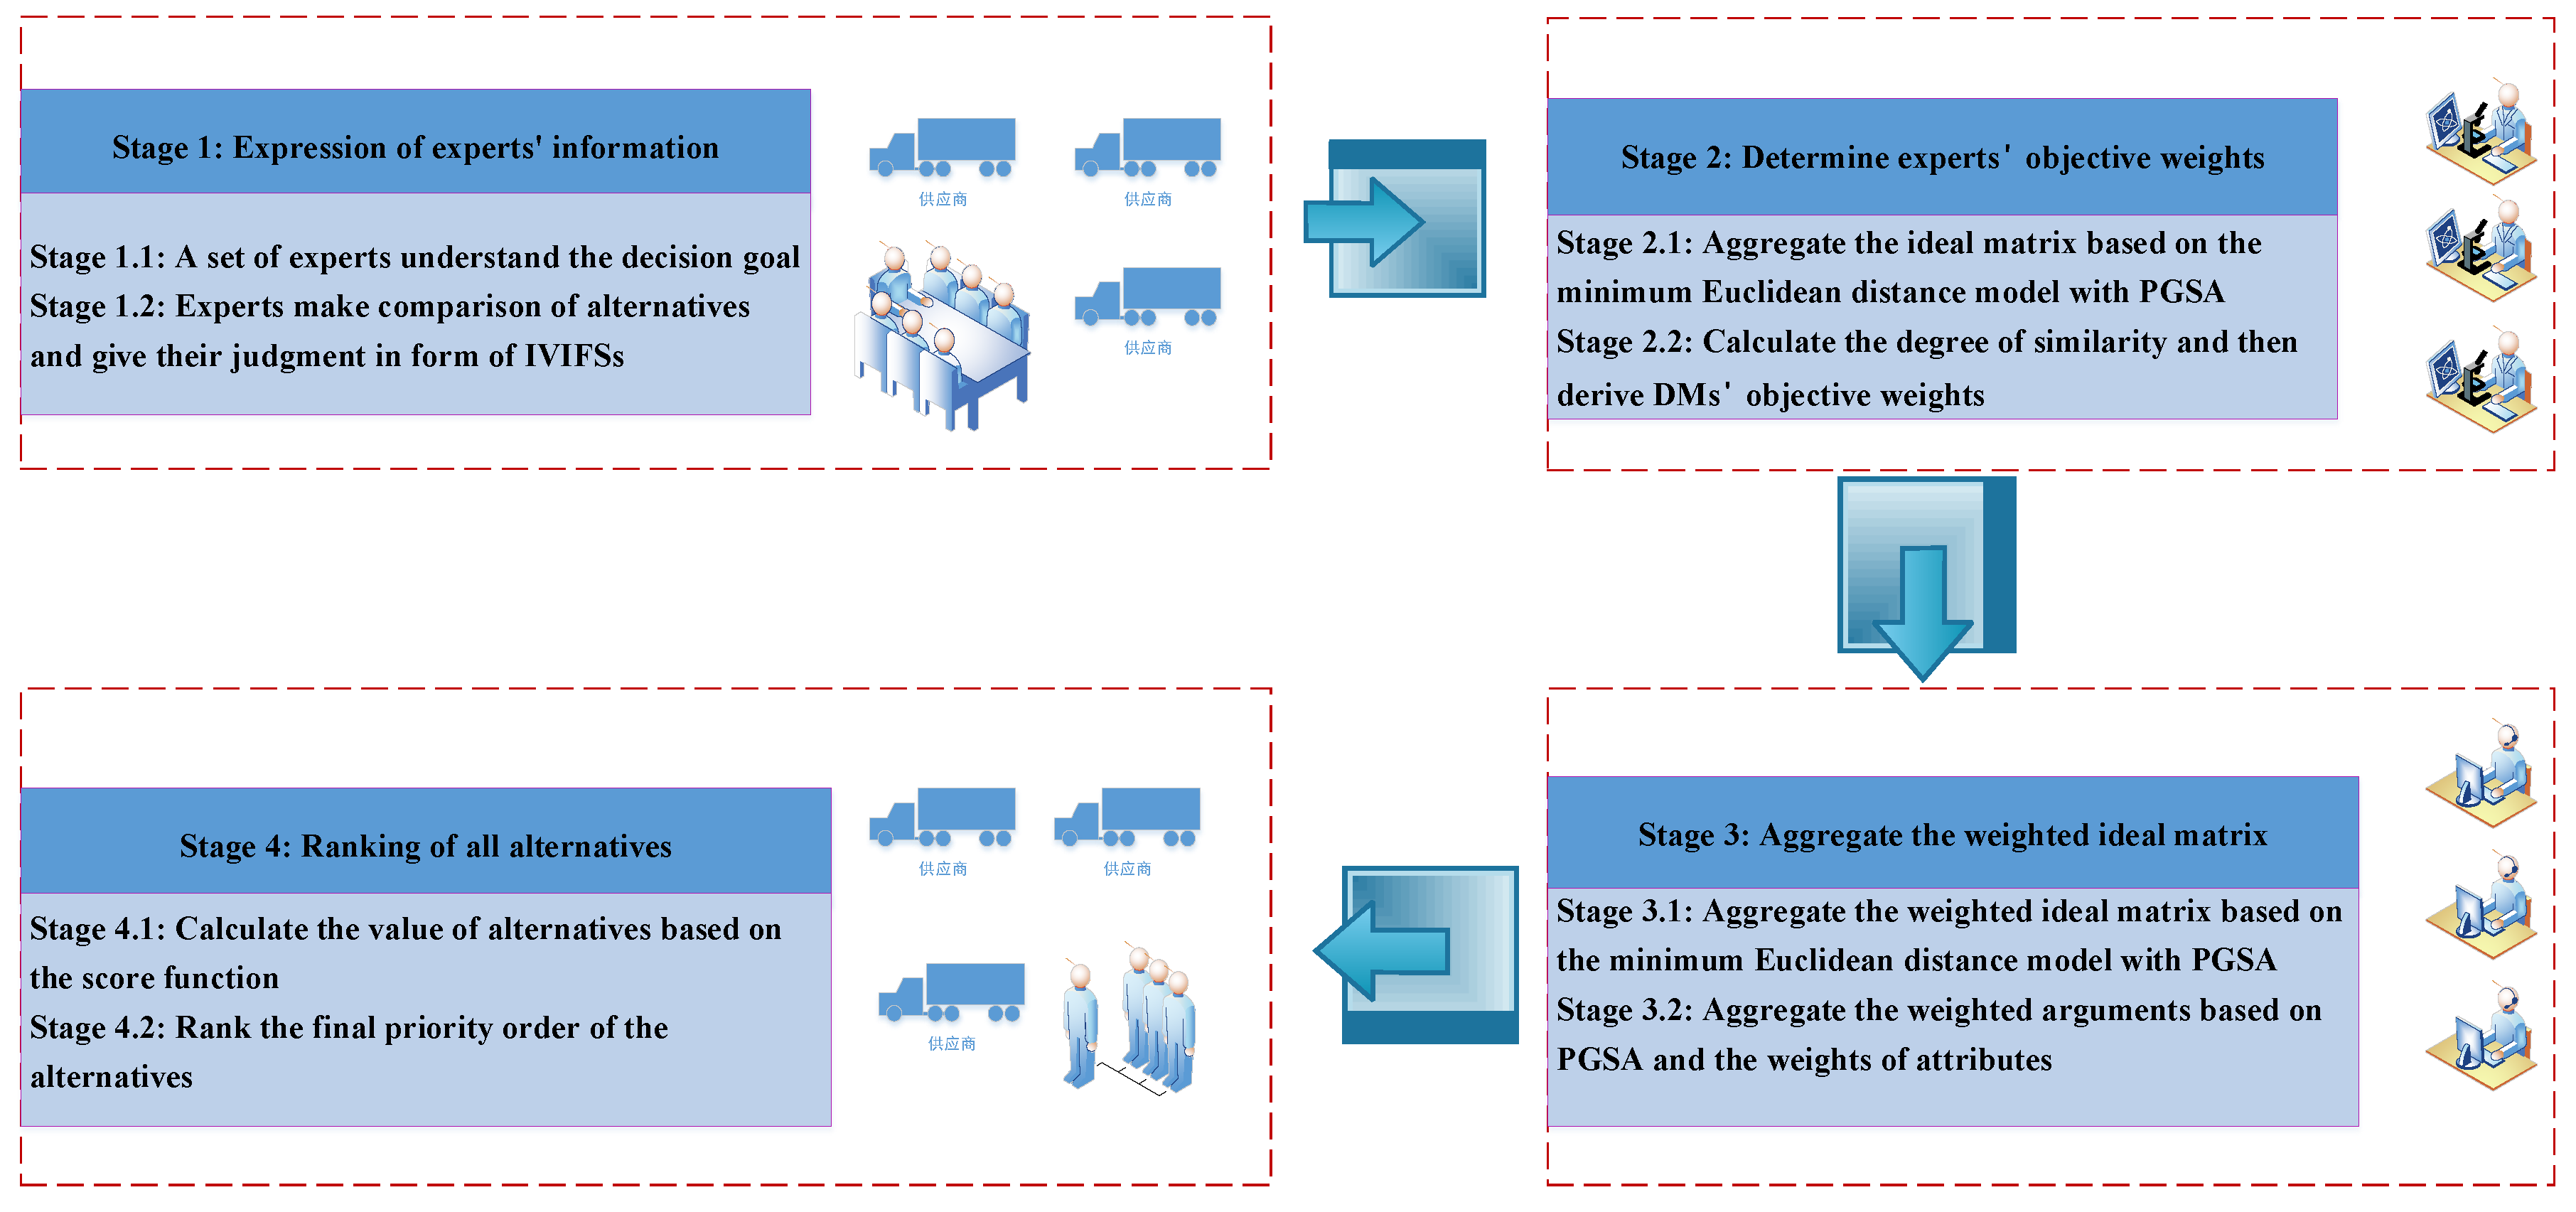
As sustainability continues to advance, more and more supply chain companies are focusing on sustainability when selecting suppliers. The specific steps are shown below.
Step 1. Expression of experts’ information.
Step 1.1. A group of experts understand the objectives of the problem.
Suppose there are m DMs consider giving their preference degree of a MAGDM problem in form of IVIFSs. Let be a discrete set of m feasible alternatives, be the set of attributes, and be the weight vector of attributes where . Let be a group of experts/DMs. Besides, the judgment information of the criteria in this paper is expressed in form of IVIFSs.
Step 1.2. Experts compare alternatives and provide their judgment in the form of IVIFS.
DMs first understand the decision objectives and then compare potential suppliers. Then the DMs use IVIFS to evaluate the potential suppliers based on their expertise and experience.
Step 2. Determine experts’ objective weights
DM’s judgment information is converted into two-dimensional coordinates and the model is constructed as shown in Equations (12)–(15).
Step 2.1. Aggregation of the ideal decision matrix based on PGSA
The ideal parameters are aggregated by applying PGSA, and an ideal decision matrix consisting of ideal IVIFS can be derived.
Step 2.2. Determine the objective weight of each DM
By calculating the similarity between the matrix of each DM and the ideal decision matrix, the objective weight of each DM can be obtained.
Step 3. Aggregate the weighted ideal decision matrix based on the PGSA
Step 3.1. PGSA is used to aggregate the weighted ideal decision matrix.
Step 3.2. Aggregation of the weighted attribute arguments based on the weights of the attributes.
PGSA is applied to aggregate the weighted attribute arguments based on the Euclidean distance model in Step 3.
Step 4. Rank the potential sustainable suppliers based on the score function
Step 4.1. We can calculate the collective total preference score of potential sustainable suppliers based on PGSA. The score of the collective total preference value is then obtained.
Step 4.1. Finally, the ranking of potential sustainable suppliers can be obtained.
The framework of the SSS problem with IVIFSs in this paper is shown in Figure 4.
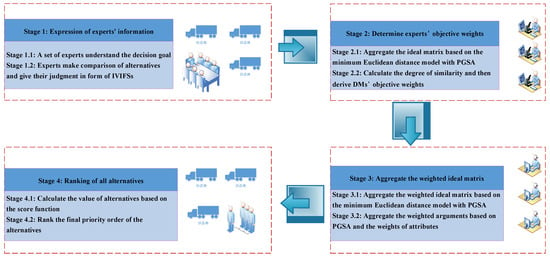
Figure 4.
The framework of the sustainable supplier selection.
4.2. Numerical Analysis and Application
Case study 1 [49] There is a well-known company in the market and would like to select a sustainable supplier. In addition, four suppliers in the market want to be considered. In order to improve the effectiveness of the supplier selection process, the company has carefully considered and decided to hire four experts to make a joint decision. As a result, a group of DMs were invited to comment on these four candidates . In order to assess the sustainability of the four of the four candidates, four evaluation attributes are considered as shown in Table 1.

Table 1.
The evaluation attributes of the problem.
Step 1. Three expects to understand the decision goal and then construct the framework of the proposed model. Then their information is gathered and The information of Expert 1 is shown in Table 2, the information of Expert 2 is shown in Table 3, and the information of Expert 3 is shown in Table 4.

Table 2.
The decision matrix given by Expert 1.

Table 3.
The decision matrix given by expert 2.

Table 4.
The decision matrix given by expert 3.
Step 2. We construct the minimum Euclidean distance model based on Equations (12)–(15).
Then we apply PGSA to aggregate the ideal matrix in Section 3.2, and the ideal matrix aggregated by PGSA is shown in Table 5.

Table 5.
The ideal matrix aggregated by PGSA.
Next, we determine the objective weight of each DM by calculating the degree of similarity between individual matrix and the ideal matrix. Specific results are shown below.
Step 3. In this step, we aggregate the weighted ideal matrix based on the PGSA as Table 6 shows.

Table 6.
The weighted ideal matrix aggregated by PGSA.
In this step, we aggregate the weighted attribute arguments based on the PGSA.
As the weight vectors of attributes are , we can get the weighted attribute arguments based on PGSA as follows.
, ,
,
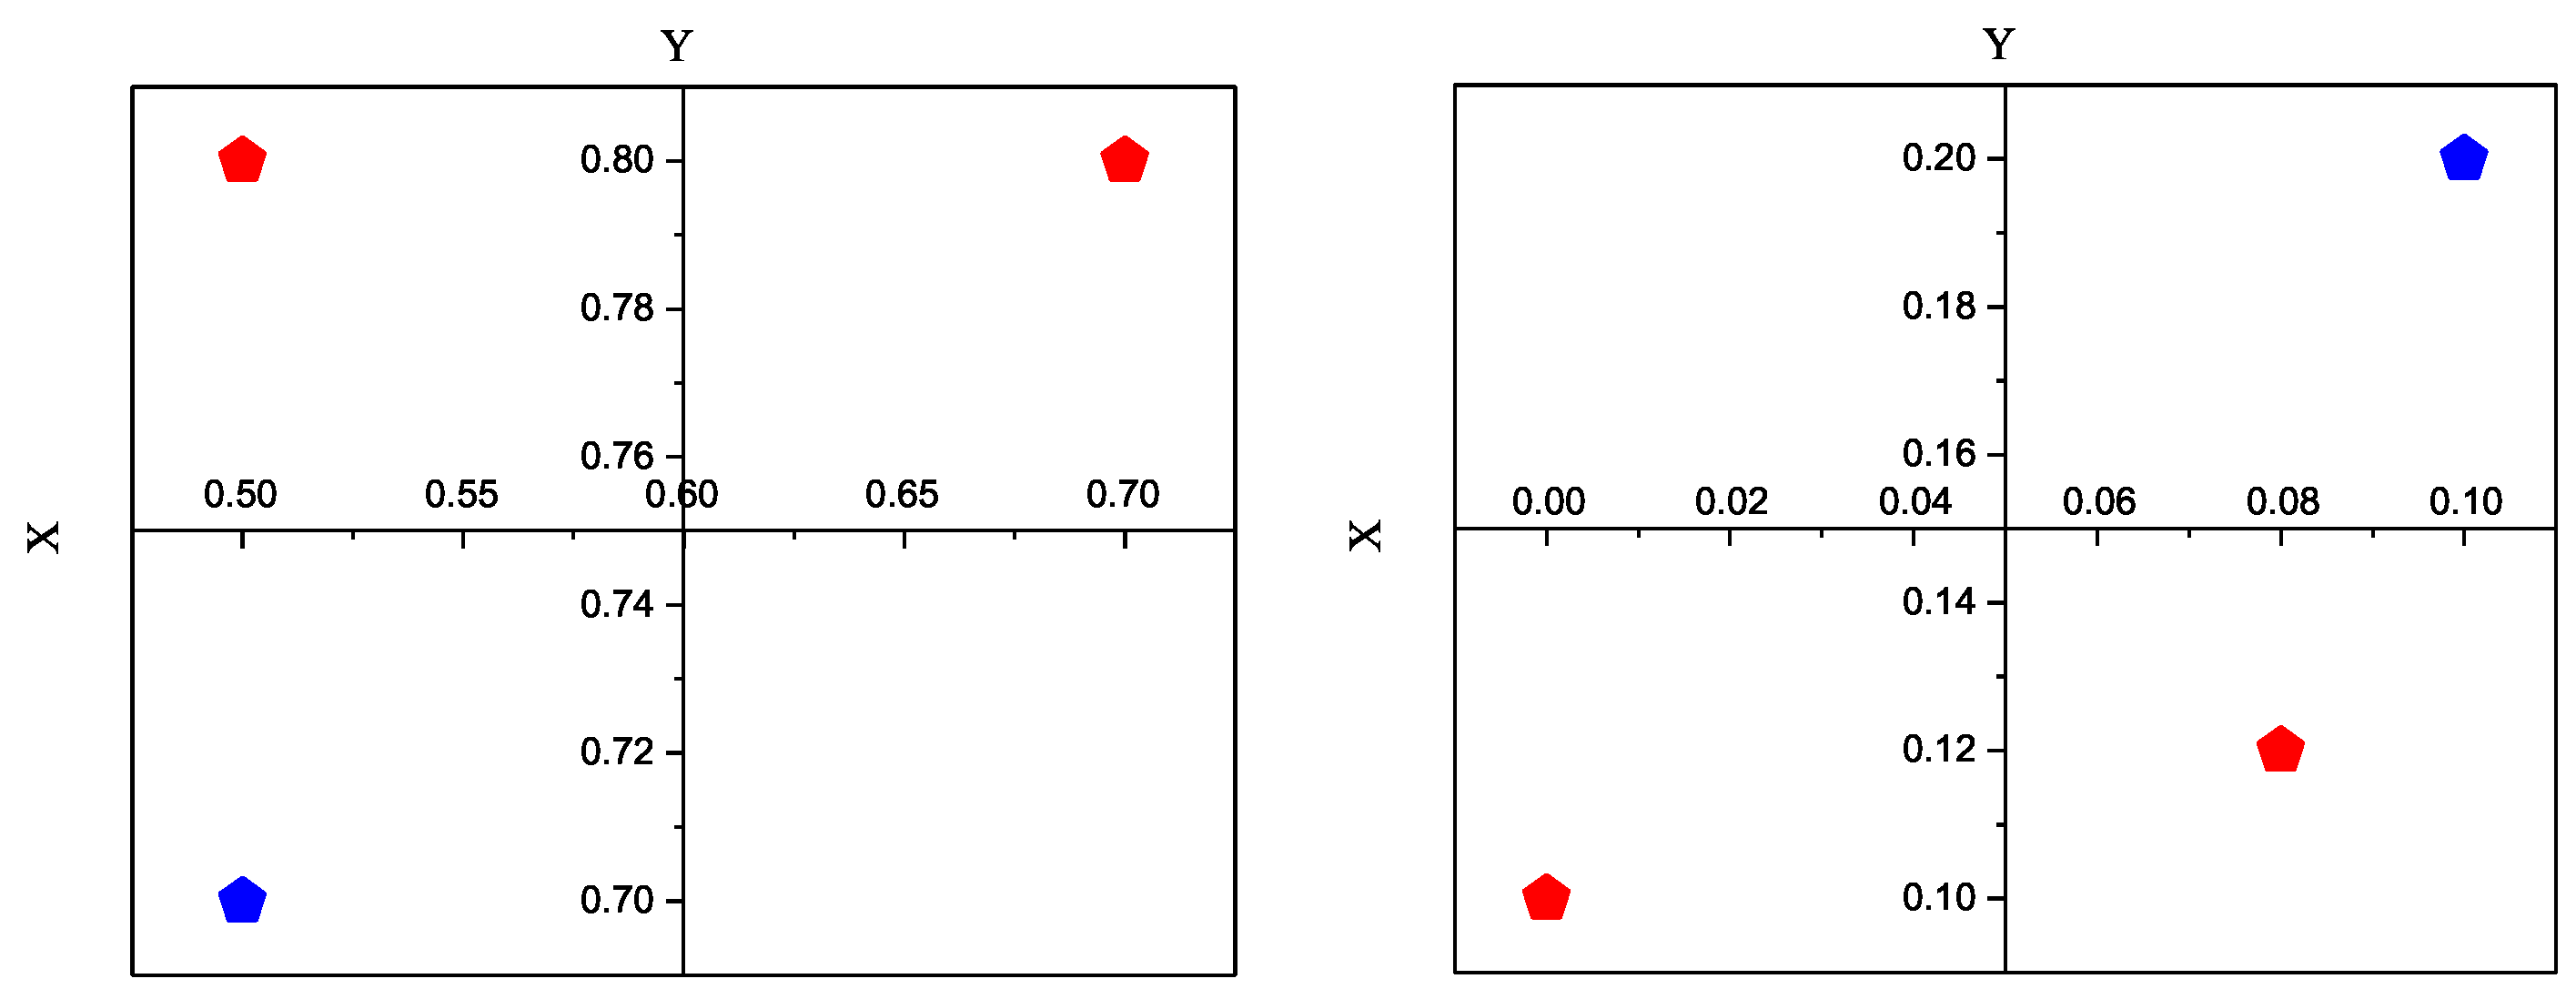
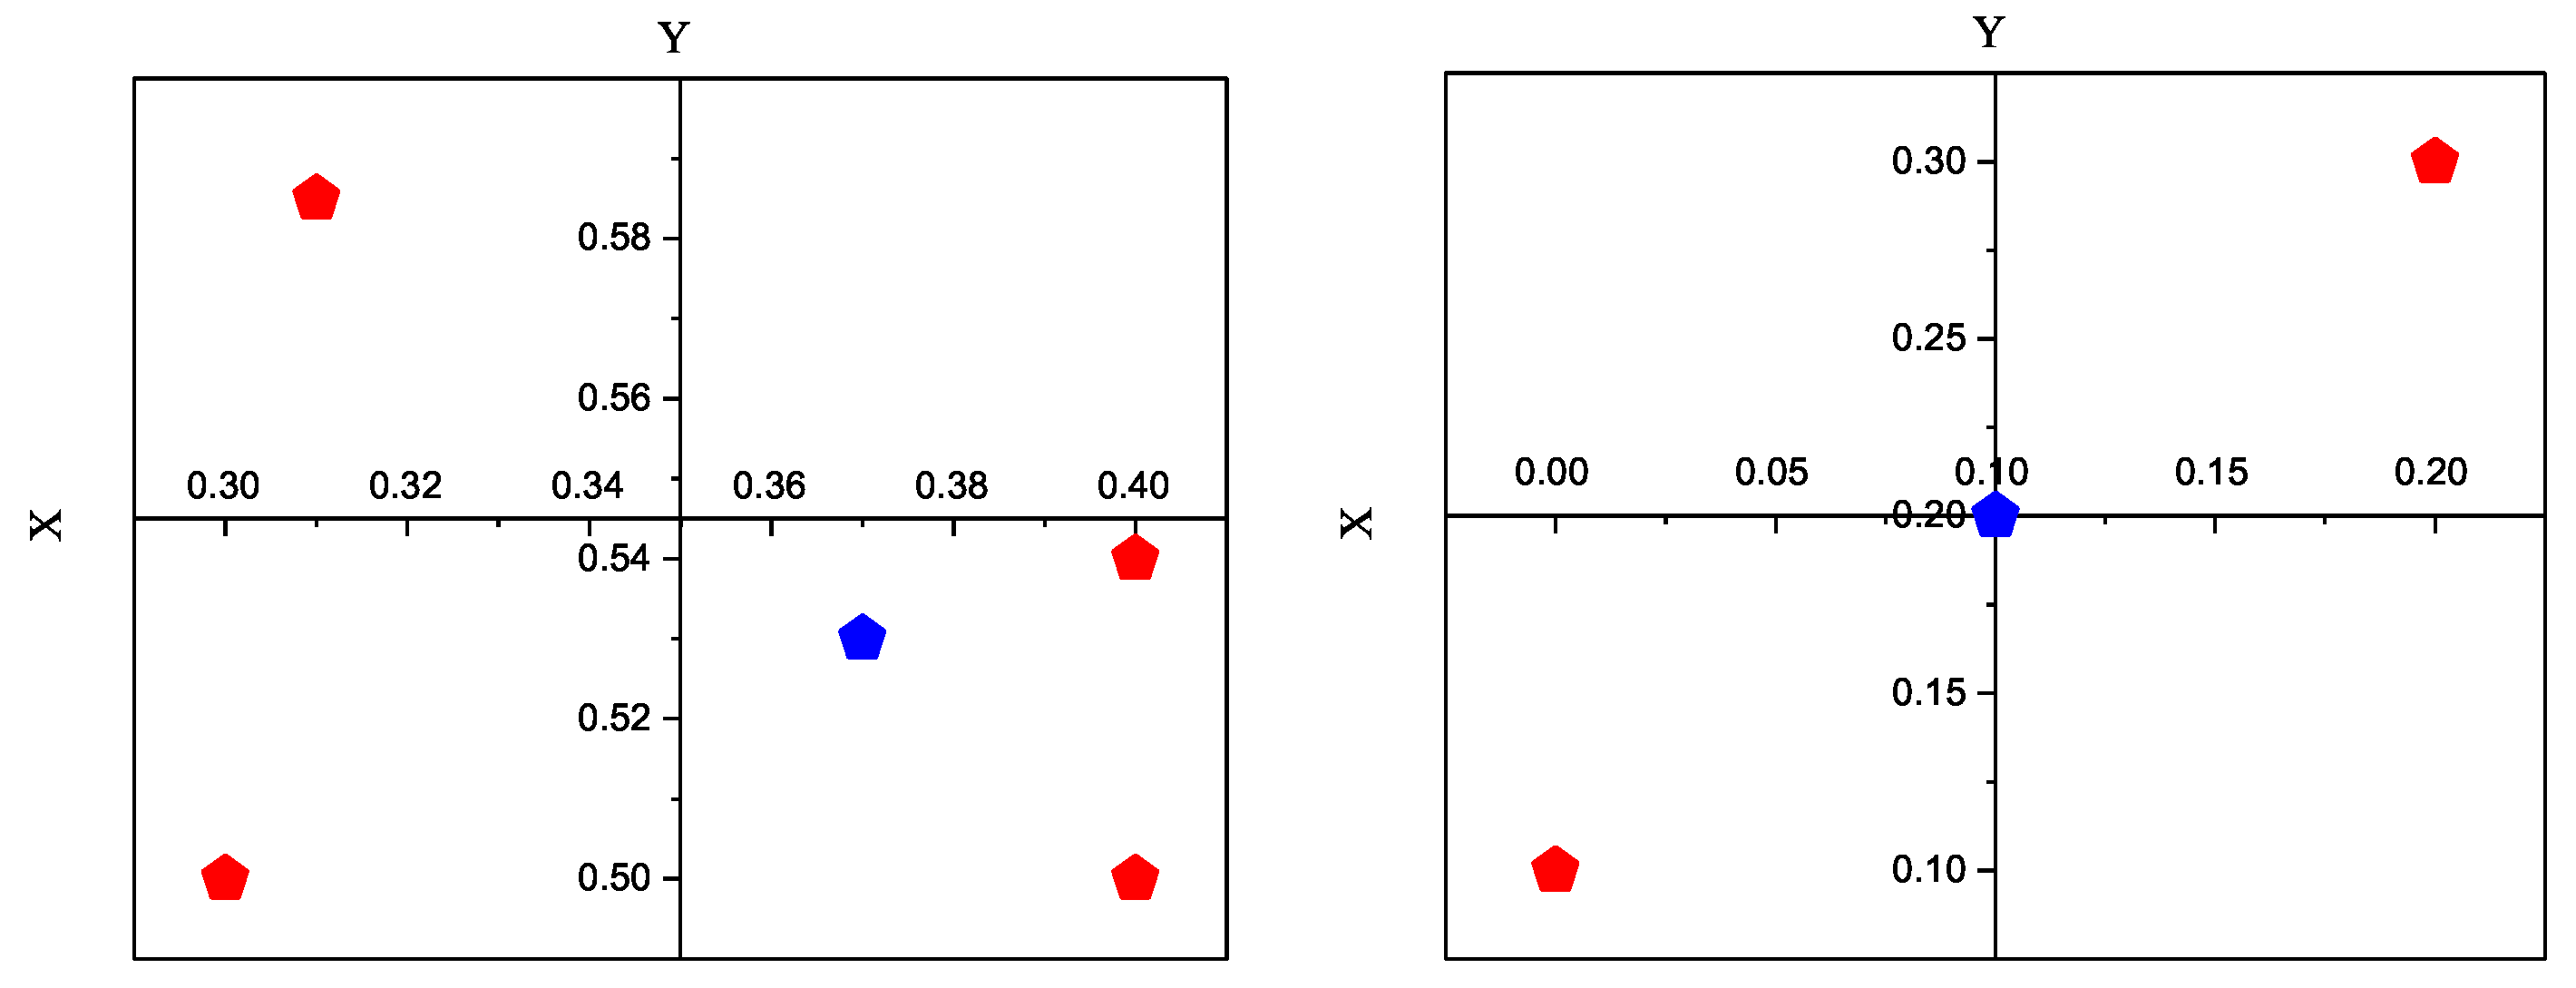
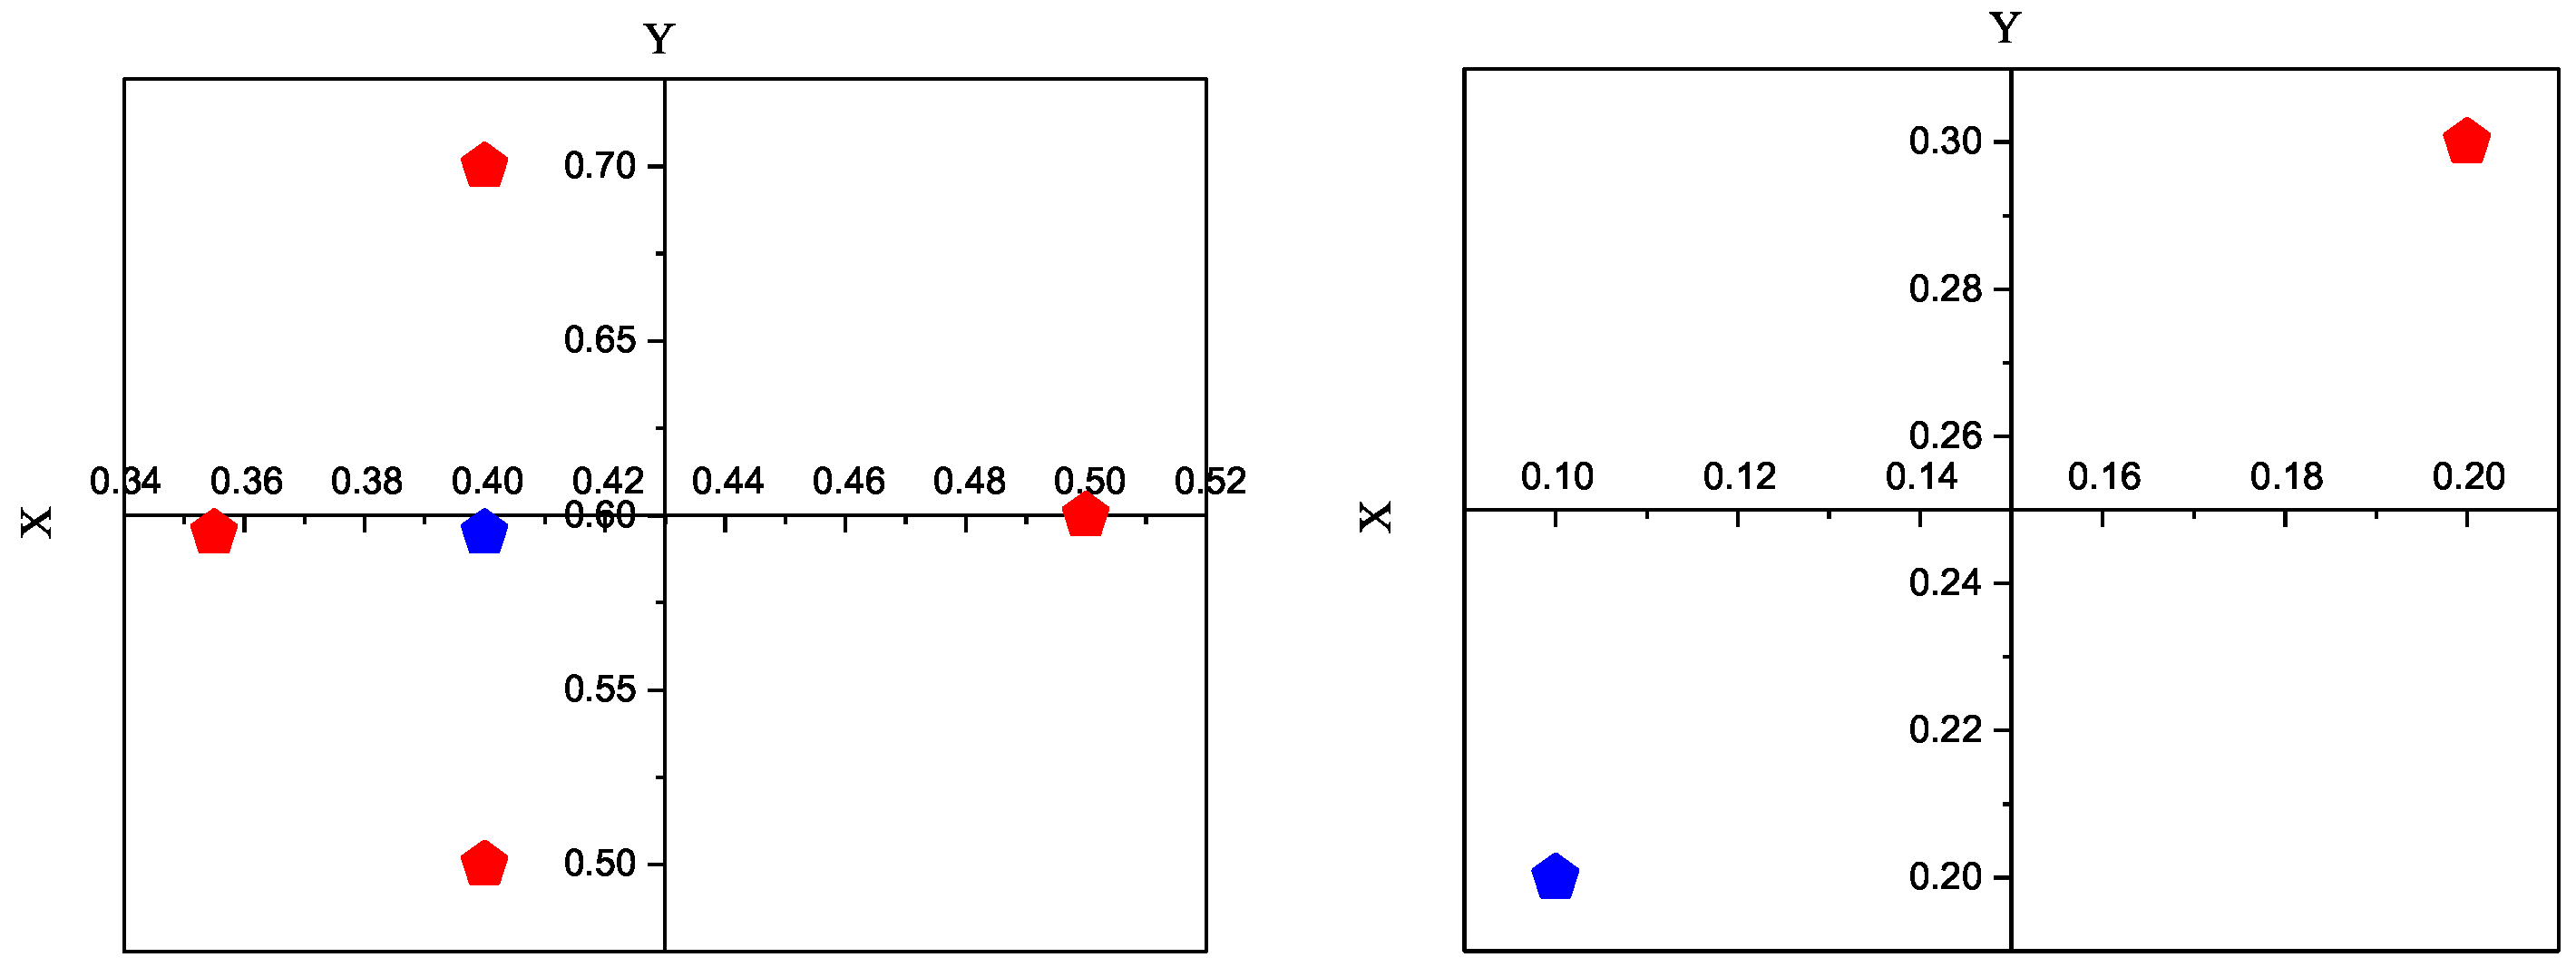
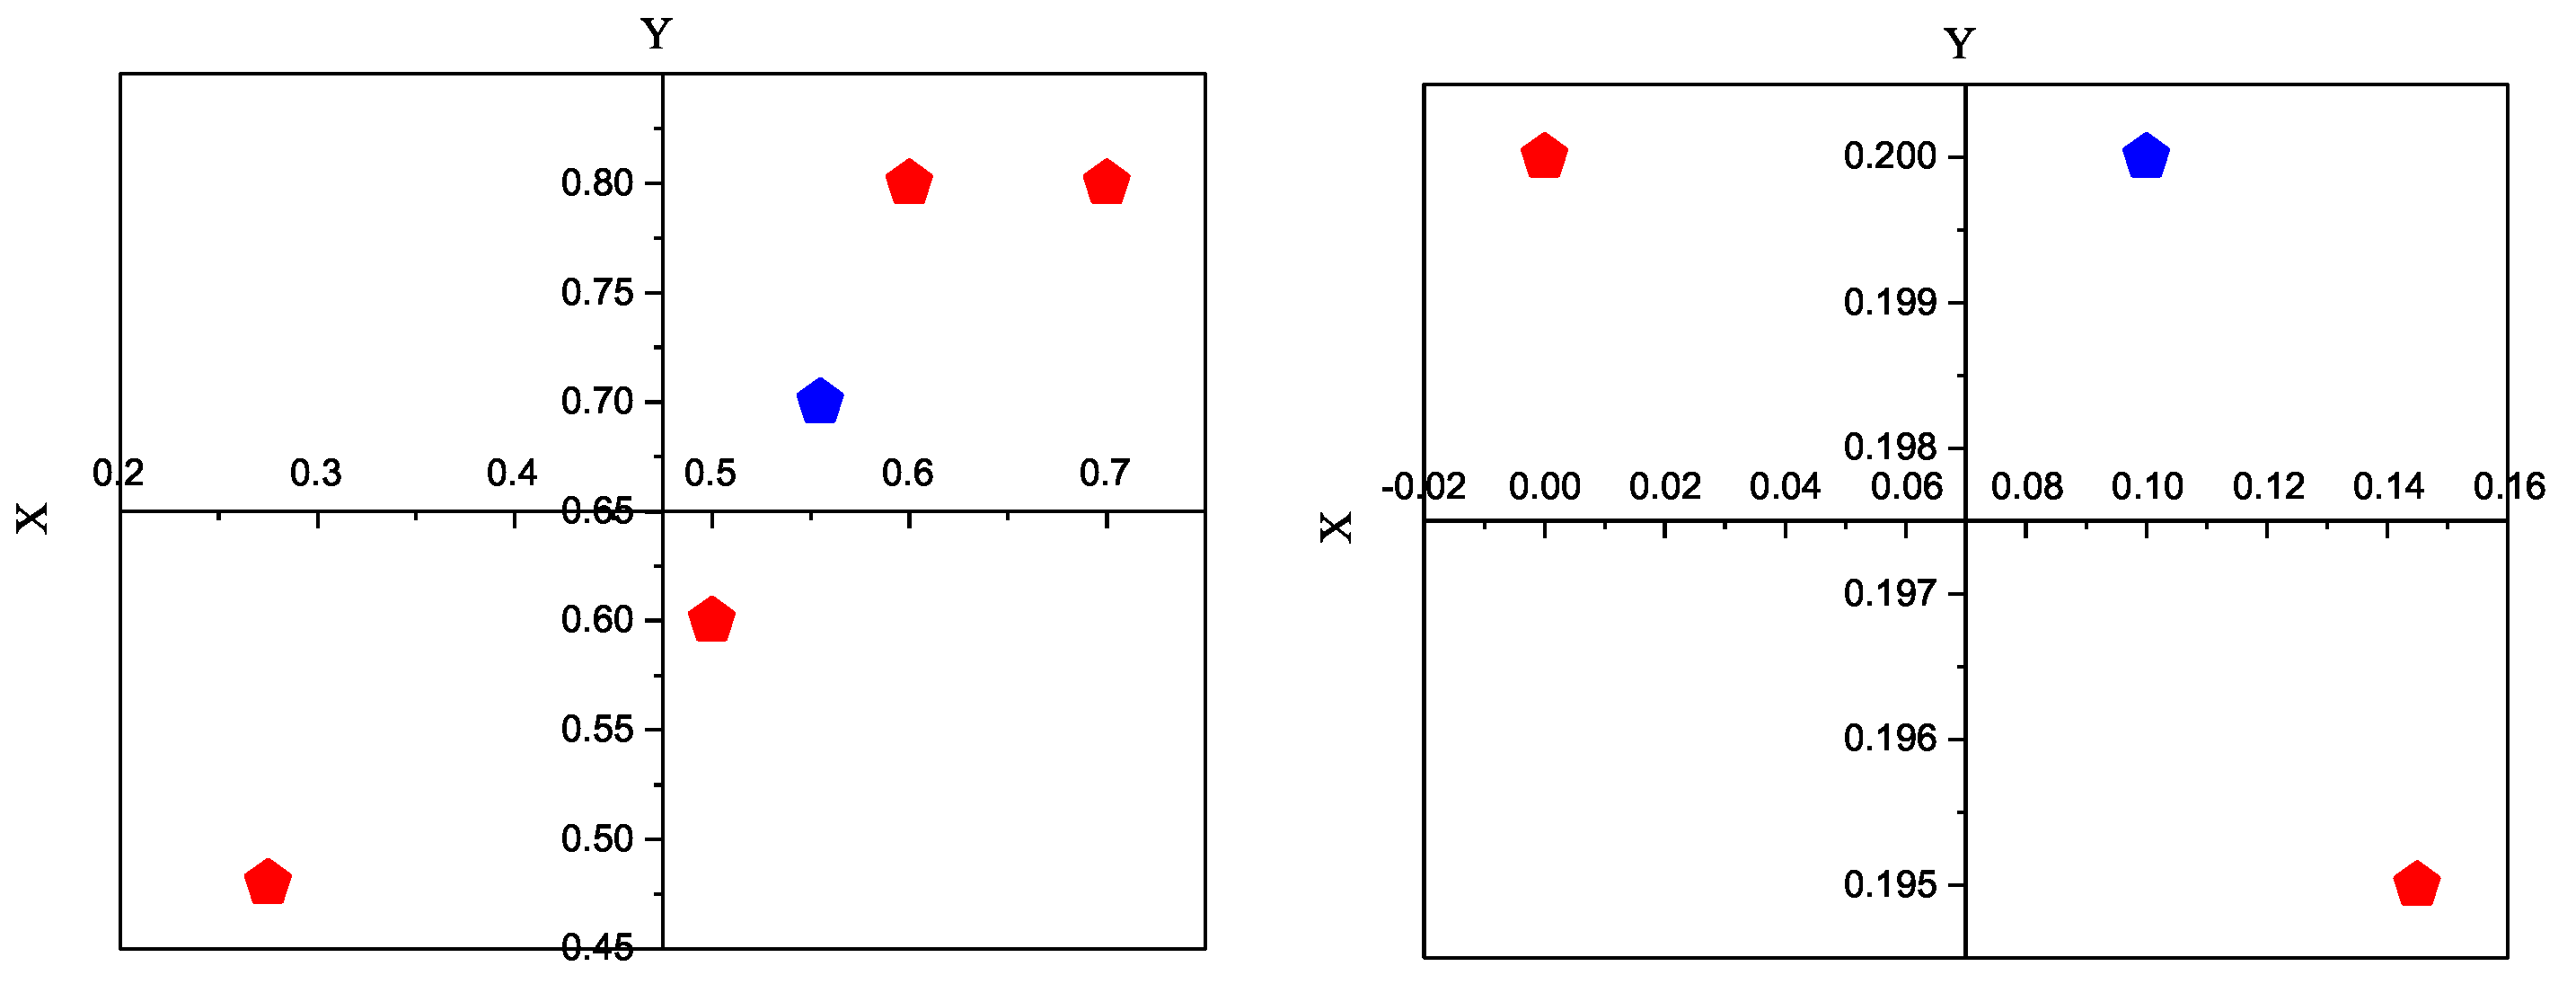
In Figure 5, Figure 6, Figure 7 and Figure 8, the aggregated attribute arguments are shown in blue and the original attribute arguments are shown in red.
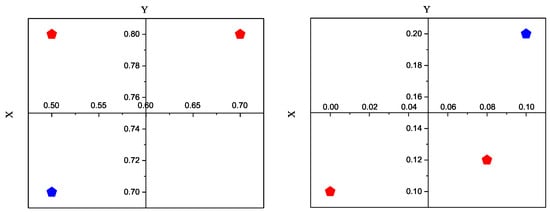
Figure 5.
The aggregated points of .
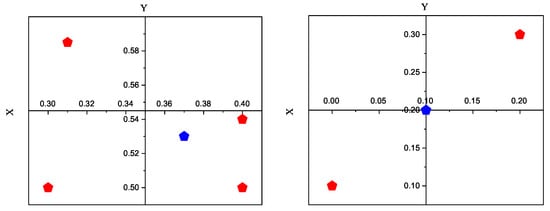
Figure 6.
The aggregated points of .
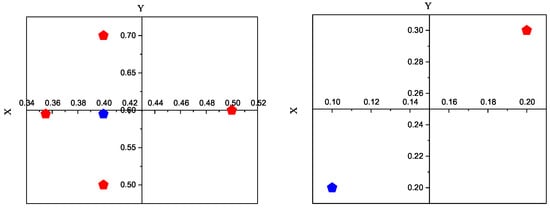
Figure 7.
The aggregated points of .
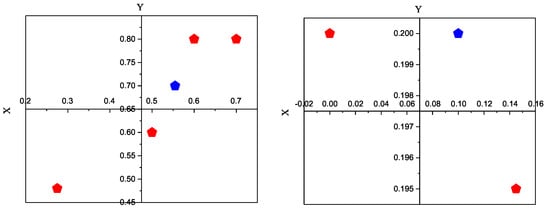
Figure 8.
The aggregated points of .
Step 4. In this step, we rank the potential sustainable suppliers based on the score function.
Thus the ranking in this paper is .
Case study 2 [50] Three criteria for 4 suppliers are considered in this problem, including the risk analysis (), the growth analysis () and the environmental impact analysis (). The decision matrix consisted of the interval-valued intuitionistic fuzzy information is given in Equation (23).
As the weights of are 0.35, 0.25 and 0.4, we can get the weighted attribute arguments based on PGSA as follows.
, ,
, .
In the next step, we rank the potential alternatives based on the score function.
.
4.3. Comparison and Discussion
In this section, we have compared the results of this paper with the derived results of Xu and Shen [49] and Nayagam et al. [50]. Specific comparison results of this paper and Xu and Shen [49] are shown in Table 7 and Table 8.

Table 7.
Comparison with Xu and Shen.

Table 8.
Comparison of the ranking results with Xu and Shen.
From Table 7 and Table 8, we can find the advantages of the proposed framework in this paper. First, from the perspective of weights, Xu & Shen re-determine the criterion weights based on and to reduce subjective arbitrariness, and this paper re-determine the objective weights of DMs based on the similarity measure method, so as to obtain the weighted aggregated result which is closer to the consensus. Specifically, Xu & Shen focused on the flexible adjustment of the weights of the evaluation criteria, and the parameters and are determined by the DMs in advance according to the requirements of the decision problem in practical applications, and in their paper, the weights of the DMs are the same. However, this paper pays attention to the objectivity of the weights of DMs, that is, the weights of DMs are derived from the distance to the aggregated result. Then the weighted aggregated result is closer to the consensus.
Second, from the point of view of criteria, Xu & Shen focused more on the company’s reputation and technical performance. This paper considers more aspects related to energy consumption and logistics service. In conclusion, Xu & Shen focused more on the economic factors of suppliers and this paper pays more attention to the environmental management system and social responsibility of suppliers, which is beneficial for reducing energy consumption, especially with the outbreak of the Russia–Ukraine conflict.
Third, this paper applies PGSA with minimizing Euclidean distance and IVIFS to evaluate the information of DMs. The evaluation information of DMs is the same, but the aggregation method is different. Xu & Shen’s method is a classical outranking selection method, which is modeled by binary outranking relations. In contrast, the PGSA method used in this paper is a method that has been widely used for aggregating individual information in GDMs, especially for aggregating information in the form of interval numbers [23,24,41,42].
Compare the results of this paper with the derived results by Nayagam et al. [50], we find that the ranking in this paper is , and the ranking in Nayagam et al. [50] is . Compared to Nayagam et al. [50], they use the weighted arithmetic average operator to aggregate the interval-valued intuitionistic fuzzy information. Unlike them, we use PGSA to aggregate the interval-valued intuitionistic fuzzy information. As PGSA is effective in dealing with GDM problems, especially when it is applied in aggregating information with interval numbers. It still has some limitations, e.g., it relies on the experience of the experts in choosing starting points and step sizes, inexperienced users often need to spend more time exploring.
5. Conclusions and Managerial Insights
5.1. Conclusions
With the outbreak of the Russia–Ukraine conflict and the goal of reducing energy consumption, SSS has become a primary issue in building strong partnerships in the face of increased global competition. Some multinational companies are paying more attention to supply chain security and accelerating the process of diversification of the global value chain. In addition, due to the globalization of supply chain development, it is more difficult and crucial for companies to choose a suitable supplier. If suppliers do not consider the logistics problems caused by the Russia–Ukraine conflict and the globalization of supply chain development, especially the reduction of logistics efficiency, it may have an extremely negative impact on the company’s operating efficiency, leading to problems such as capital chain breakage. However, traditional ranking methods have some weaknesses in the information representation and prioritization process of SSS in SSCM. To overcome these weaknesses and improve the traditional SSCM ranking framework, this paper proposes a new ranking framework based on IVIFS, similarity metrics and PGSA for expressing and ranking sustainable supplier candidates.
The main contributions can be summarized into three aspects. For the first aspect, the aggregation process can derive objective weights based on the judgment matrix of DMs, so the results of weighted aggregation are closer to the consensus of DMs. For the second aspect, since PGSA has been effectively validated in the interval number aggregation of DM information in the GDM problem, this paper applies PGSA to the information aggregation of DMs. For the third aspect, this paper considers more aspects of energy assumptions in the SSCM process, especially for logistics services, environmental management, and suppliers’ social responsibility. Overall, the selection of the best alternative based on this framework is more reasonable for sustainable suppliers in the SSCM process, which is conducive to reducing energy consumption.
5.2. Managerial Insights
The new ranking framework based on IVIFS and PGSA in this paper also has some practical contributions and managerial insights, which can be summarized as follows.
- (i)
- PGSA can be applied to aggregate information for experts when dealing with other GDM problems in reality. In fact, many problems need to be jointly evaluated by a group of experts. In this process, the aggregation of experts’ information to reach the level of consensus is very important. In this paper, we verify that PGSA is effective in aggregating experts’ information to reach the level of consensus.
- (ii)
- The new ranking framework based on IVIFS is effective in expressing judgmental information about DMs and can be applied to more practical cases, especially for SSS, which is beneficial to reduce energy consumption and achieve the goal of dual carbon strategy.
- (iii)
- The new ranking framework based on IVIFS and PGSA provides a new framework for evaluating supplier selection in sustainable supply chain management, especially in the representation and aggregation of fuzzy information sets, which has some theoretical value and is conducive to selecting more suitable suppliers, thereby improving sustainable supply chain management.
5.3. Future Research
Future research can be done in several ways. First, the weights of the attributes in the SSS process are given. However, the weights of the attributes may not be given and must be derived in some complex cases. Therefore, it is worth considering this case when the weights of the attributes are unknown. Second, the number of candidate vendors in this paper is small, and there are more candidate vendors in reality. Therefore, the proposed ranking framework can be extended to large-scale SSS problems. In addition, the PGSA can be further optimized and improved to make the process aggregation more effective.
Author Contributions
Conceptualization, J.L.; methodology, J.L. and W.W.; software, J.L.; validation, J.L.; formal analysis, J.L.; investigation, W.W.; resources, J.L.; data curation, J.L.; writing—original draft preparation, J.L.; writing—review and editing, W.W.; visualization, J.L.; supervision, W.W.; project administration, J.L.. All authors have read and agreed to the published version of the manuscript.
Funding
This Research was supported in part by the National Natural Science Foundation of China (No. 72302115); in part by the Natural Science Foundation of Jiangsu Province (No. BK20230901); the China Postdoctoral Science Foundation (No. 2023M731682); the Fundamental Research Funds for the Central Universities (No. 30922011203); and the General Project of Philosophy and Social Sciences Research in Colleges and Universities of Jiangsu Province (No. 2022SJYB0012).
Data Availability Statement
Not applicable.
Conflicts of Interest
The authors declare no conflict of interest.
References
- Büyüközkan, G. An integrated fuzzy multi-criteria group decision-making approach for green supplier evaluation. Int. J. Prod. Res. 2012, 50, 2892–2909. [Google Scholar] [CrossRef]
- Cheraghalipour, A.; Farsad, S. A bi-objective sustainable supplier selection and order allocation considering quantity discounts under disruption risks: A case study in plastic industry. Comput. Ind. Eng. 2018, 118, 237–250. [Google Scholar] [CrossRef]
- Lamming, R.; Hampson, J. The environment as a supply chain management issue. Br. J. Manag. 1996, 7, S45–S62. [Google Scholar] [CrossRef]
- Lin, R.-H. An integrated FANP–MOLP for supplier evaluation and order allocation. Appl. Math. Model. 2009, 33, 2730–2736. [Google Scholar] [CrossRef]
- Xu, Z.; Qin, J.; Liu, J.; Martinez, L. Sustainable supplier selection based on AHPSort II in interval type-2 fuzzy environment. Inf. Sci. 2019, 483, 273–293. [Google Scholar] [CrossRef]
- Amir, A.; Paydar, M.M.; Safaei, A.S. An integrated fuzzy MOORA method and FMEA technique for sustainable supplier selection considering quantity discounts and supplier’s risk. J. Clean. Prod. 2018, 190, 577–591. [Google Scholar]
- Büyüközkan, G.G. A novel fuzzy multi-criteria decision framework for sustainable supplier selection with incomplete information. Comput. Ind. 2011, 62, 164–174. [Google Scholar] [CrossRef]
- Li, J.; Fang, H.; Song, W. Sustainable supplier selection based on SSCM practices: A rough cloud TOPSIS approach. J. Clean. Prod. 2019, 222, 606–621. [Google Scholar] [CrossRef]
- Liu, C.; Rani, P.; Pachori, K. Sustainable circular supplier selection and evaluation in the manufacturing sector using pythagorean fuzzy edas approach. J. Enterp. Inf. Manag. 2022, 35, 1040–1066. [Google Scholar] [CrossRef]
- Qin, J.; Liu, X.; Pedrycz, W. An extended TODIM multi-criteria group decision making method for green supplier selection in interval type-2 fuzzy environment. Eur. J. Oper. Res. 2017, 258, 626–638. [Google Scholar] [CrossRef]
- Shang, Z.; Yang, X.; Barnes, D.; Wu, C. Supplier selection in sustainable supply chains: Using the integrated bwm, fuzzy shannon entropy, and fuzzy MULTIMOORA methods. Expert Syst. Appl. 2022, 195, 116567. [Google Scholar] [CrossRef]
- Durbach, I.; Stewart, T.J. Modeling uncertainty in multi-criteria decision analysis. Eur. J. Oper. Res. 2012, 223, 1–14. [Google Scholar] [CrossRef]
- Xu, Z.; Chen, J. Some models for deriving the priority weights from interval fuzzy preference relations. Eur. J. Oper. Res. 2008, 184, 266–280. [Google Scholar] [CrossRef]
- Zadeh, L. Fuzzy sets. Inf. Control 1965, 8, 338–353. [Google Scholar] [CrossRef]
- Krassimir, A. Intuitionistic fuzzy sets. Fuzzy Sets Syst. 1986, 20, 87–96. [Google Scholar]
- Chu, J.; Liu, X.; Wang, L.; Wang, Y. A group decision making approach based on newly defined additively consistent interval-valued intuitionistic preference relations. Int. J. Fuzzy Syst. 2018, 20, 1027–1046. [Google Scholar] [CrossRef]
- Zhang, Q.; Jiang, S.; Jia, B.; Luo, S. Some information measures for interval-valued intuitionistic fuzzy sets. Inf. Sci. 2010, 180, 5130–5145. [Google Scholar] [CrossRef]
- Chen, Z.; Ming, X.; Zhou, T.; Chang, Y. Sustainable supplier selection for smart supply chain considering internal and external uncertainty: An integrated rough-fuzzy approach. Appl. Soft Comput. 2020, 87, 106004. [Google Scholar] [CrossRef]
- Zhou, X.; Wang, Y.; Chai, J.; Wang, L.; Wang, S.; Lev, B. Sustainable supply chain evaluation: A dynamic double frontier network DEA model with interval type-2 fuzzy data. Inf. Sci. 2019, 504, 394–421. [Google Scholar] [CrossRef]
- Tang, J.; Meng, F.; Zhang, Y. Decision making with interval-valued intuitionistic fuzzy preference relations based on additive consistency analysis. Inf. Sci. 2018, 467, 115–134. [Google Scholar] [CrossRef]
- Xu, Z. A method based on distance measure for interval-valued intuitionistic fuzzy group decision making. Inf. Sci. 2010, 180, 181–190. [Google Scholar] [CrossRef]
- Krassimir, A.; Gargov, G. Interval valued intuitionistic fuzzy sets. Fuzzy Sets Syst. 1989, 31, 343–349. [Google Scholar]
- Li, L.; Xie, X.; Guo, R. Research on group decision making with interval numbers based on plant growth simulation algorithm. Kybernetes 2014, 43, 250–264. [Google Scholar] [CrossRef]
- Qiu, J.; Li, L. A new approach for multiple attribute group decision making with interval-valued intuitionistic fuzzy information. Appl. Soft Comput. 2017, 61, 111–121. [Google Scholar] [CrossRef]
- Cui, L.; Wu, H.; Dai, J. Modelling flexible decisions about sustainable supplier selection in multitier sustainable supply chain management. Int. J. Prod. Res. 2023, 61, 4603–4624. [Google Scholar] [CrossRef]
- Kusi-Sarpong, S.; Gupta, H.; Khan, S.A.; Jabbour, C.J.C.; Rehman, S.T.; Kusi-Sarpong, H. Sustainable supplier selection based on industry 4.0 initiatives within the context of circular economy implementation in supply chain operations. Prod. Plan. Control 2023, 34, 999–1019. [Google Scholar] [CrossRef]
- Luthra, S.; Govindan, K.; Kannan, D.; Mangla, S.K.; Garg, C.P. An integrated framework for sustainable supplier selection and evaluation in supply chains. J. Clean. Prod. 2017, 140, 1686–1698. [Google Scholar] [CrossRef]
- Chen, K.-S.; Wang, C.; Tan, K. Developing a fuzzy green supplier selection model using six sigma quality indices. Int. J. Prod. Econ. 2019, 212, 1–7. [Google Scholar] [CrossRef]
- Nayeri, S.; Khoei, M.A.; Rouhani-Tazangi, M.R.; GhanavatiNejad, M.; Rahmani, M.; Tirkolaee, E.B. A data-driven model for sustainable and resilient supplier selection and order allocation problem in a responsive supply chain: A case study of healthcare system. Eng. Appl. Artif. Intell. 2023, 124, 106511. [Google Scholar] [CrossRef]
- Wu, Y.; Ke, Y.; Xu, C.; Li, L. An integrated decision-making model for sustainable photovoltaic module supplier selection based on combined weight and cumulative prospect theory. Energy 2019, 181, 1235–1251. [Google Scholar] [CrossRef]
- Rasmi, S.A.B.; Kazan, C.; Türkay, M. A multi-criteria decision analysis to include environmental, social, and cultural issues in the sustainable aggregate production plans. Comput. Ind. Eng. 2019, 132, 348–360. [Google Scholar] [CrossRef]
- Liu, H.-C.; Quan, M.; Li, Z.; Wang, Z. A new integrated MCDM model for sustainable supplier selection under interval-valued intuitionistic uncertain linguistic environment. Inf. Sci. 2019, 486, 254–270. [Google Scholar] [CrossRef]
- Song, Y.; Li, G. A large-scale group decision-making with incomplete multi-granular probabilistic linguistic term sets and its application in sustainable supplier selection. J. Oper. Res. Soc. 2019, 70, 827–841. [Google Scholar] [CrossRef]
- Pishchulov, G.; Trautrims, A.; Chesney, T.; Gold, S.; Schwab, L. The voting analytic hierarchy process revisited: A revised method with application to sustainable supplier selection. Int. J. Prod. Econ. 2019, 211, 166–179. [Google Scholar] [CrossRef]
- Chen, Z.-S.; Zhang, X.; Govindan, K.; Wang, X.; Chin, K. Third-party reverse logistics provider selection: A computational semantic analysis-based multi-perspective multi-attribute decision-making approach. Expert Syst. Appl. 2021, 166, 114051. [Google Scholar] [CrossRef]
- Krishankumar, R.; Nimmagadda, S.S.; Mishra, A.R.; Pamucar, D.; Ravichandran, K.S.; Gandomi, A.H. An integrated decision model for cloud vendor selection using probabilistic linguistic information and unknown weights. Eng. Appl. Artif. Intell. 2022, 114, 105114. [Google Scholar] [CrossRef]
- Wei, G. Some induced geometric aggregation operators with intuitionistic fuzzy information and their application to group decision making. Appl. Soft Comput. 2010, 10, 423–431. [Google Scholar] [CrossRef]
- Zhang, Z.; Pedrycz, W. A consistency and consensus-based goal programming method for group decision-making with interval-valued intuitionistic multiplicative preference relations. IEEE Trans. Cybern. 2018, 49, 3640–3654. [Google Scholar] [CrossRef] [PubMed]
- Wan, S.; Dong, J. A three-phase method for group decision making with interval-valued intuitionistic fuzzy preference relations. In Decision Making Theories and Methods Based on Interval-Valued Intuitionistic Fuzzy Sets; Springer Nature: Berlin, Germany, 2020; pp. 243–270. [Google Scholar]
- Chen, Z.-S.; Zhang, X.; Pedrycz, W.; Wang, X.; Chin, K.; Martínez, L. K-means clustering for the aggregation of HFLTS possibility distributions: N-two-stage algorithmic paradigm. Knowl.-Based Syst. 2021, 227, 107230. [Google Scholar] [CrossRef]
- Qiu, J.; Li, L. A new approach for multiple attribute group decision-making based on interval neutrosophic sets. J. Intell. Fuzzy Syst. 2019, 36, 5929–5942. [Google Scholar] [CrossRef]
- Li, J.; Zhang, Y. A novel method for aggregating interval multiplicative comparison matrices and its application in ranking alternatives. J. Intell. Fuzzy Syst. 2018, 35, 3675–3684. [Google Scholar] [CrossRef]
- Liu, W.; Wang, Y. Research on the spatial optimal aggregation method of decision maker preference information based on steiner-weber point. Comput. Ind. Eng. 2022, 163, 107819. [Google Scholar] [CrossRef]
- Wang, Y.; Wu, D.; Qian, W.; Li, H. Cross-efficiency intervals integrated ranking approach based on the generalized fermat-torricelli point. Comput. Ind. Eng. 2021, 162, 107786. [Google Scholar] [CrossRef]
- Li, J.; Zhang, Y. A new method for interval fuzzy preference relations in group decision making based on plant growth simulation algorithm and cowa. J. Intell. Fuzzy Syst. 2019, 37, 4311–4323. [Google Scholar] [CrossRef]
- Zhang, X.; Xu, Z. Soft computing based on maximizing consensus and fuzzy TOPSIS approach to interval-valued intuitionistic fuzzy group decision making. Appl. Soft Comput. 2015, 26, 42–56. [Google Scholar] [CrossRef]
- Xu, Z. Methods for aggregating interval-valued intuitionistic fuzzy information and their application to decision making. Control Decis. 2007, 22, 215–219. [Google Scholar]
- Zeng, S. Some intuitionistic fuzzy weighted distance measures and their application to group decision making. Group Decis. Negot. 2013, 22, 281–298. [Google Scholar] [CrossRef]
- Xu, J.; Shen, F. A new outranking choice method for group decision making under Atanassov’s interval-valued intuitionistic fuzzy environment. Knowl.-Based Syst. 2014, 70, 177–188. [Google Scholar] [CrossRef]
- Nayagam, V.; Gomathi, L.; Muralikrishnan, S.; Sivaraman, G. Multi-criteria decision-making method based on interval-valued intuitionistic fuzzy sets. Expert Syst. Appl. 2011, 38, 1464–1467. [Google Scholar] [CrossRef]
Disclaimer/Publisher’s Note: The statements, opinions and data contained in all publications are solely those of the individual author(s) and contributor(s) and not of MDPI and/or the editor(s). MDPI and/or the editor(s) disclaim responsibility for any injury to people or property resulting from any ideas, methods, instructions or products referred to in the content. |
© 2023 by the authors. Licensee MDPI, Basel, Switzerland. This article is an open access article distributed under the terms and conditions of the Creative Commons Attribution (CC BY) license (https://creativecommons.org/licenses/by/4.0/).

