
Interval Type-3 Fuzzy Aggregation of Neural Networks for Multiple Time Series Prediction: The Case of Financial Forecasting


Abstract
:1. Introduction
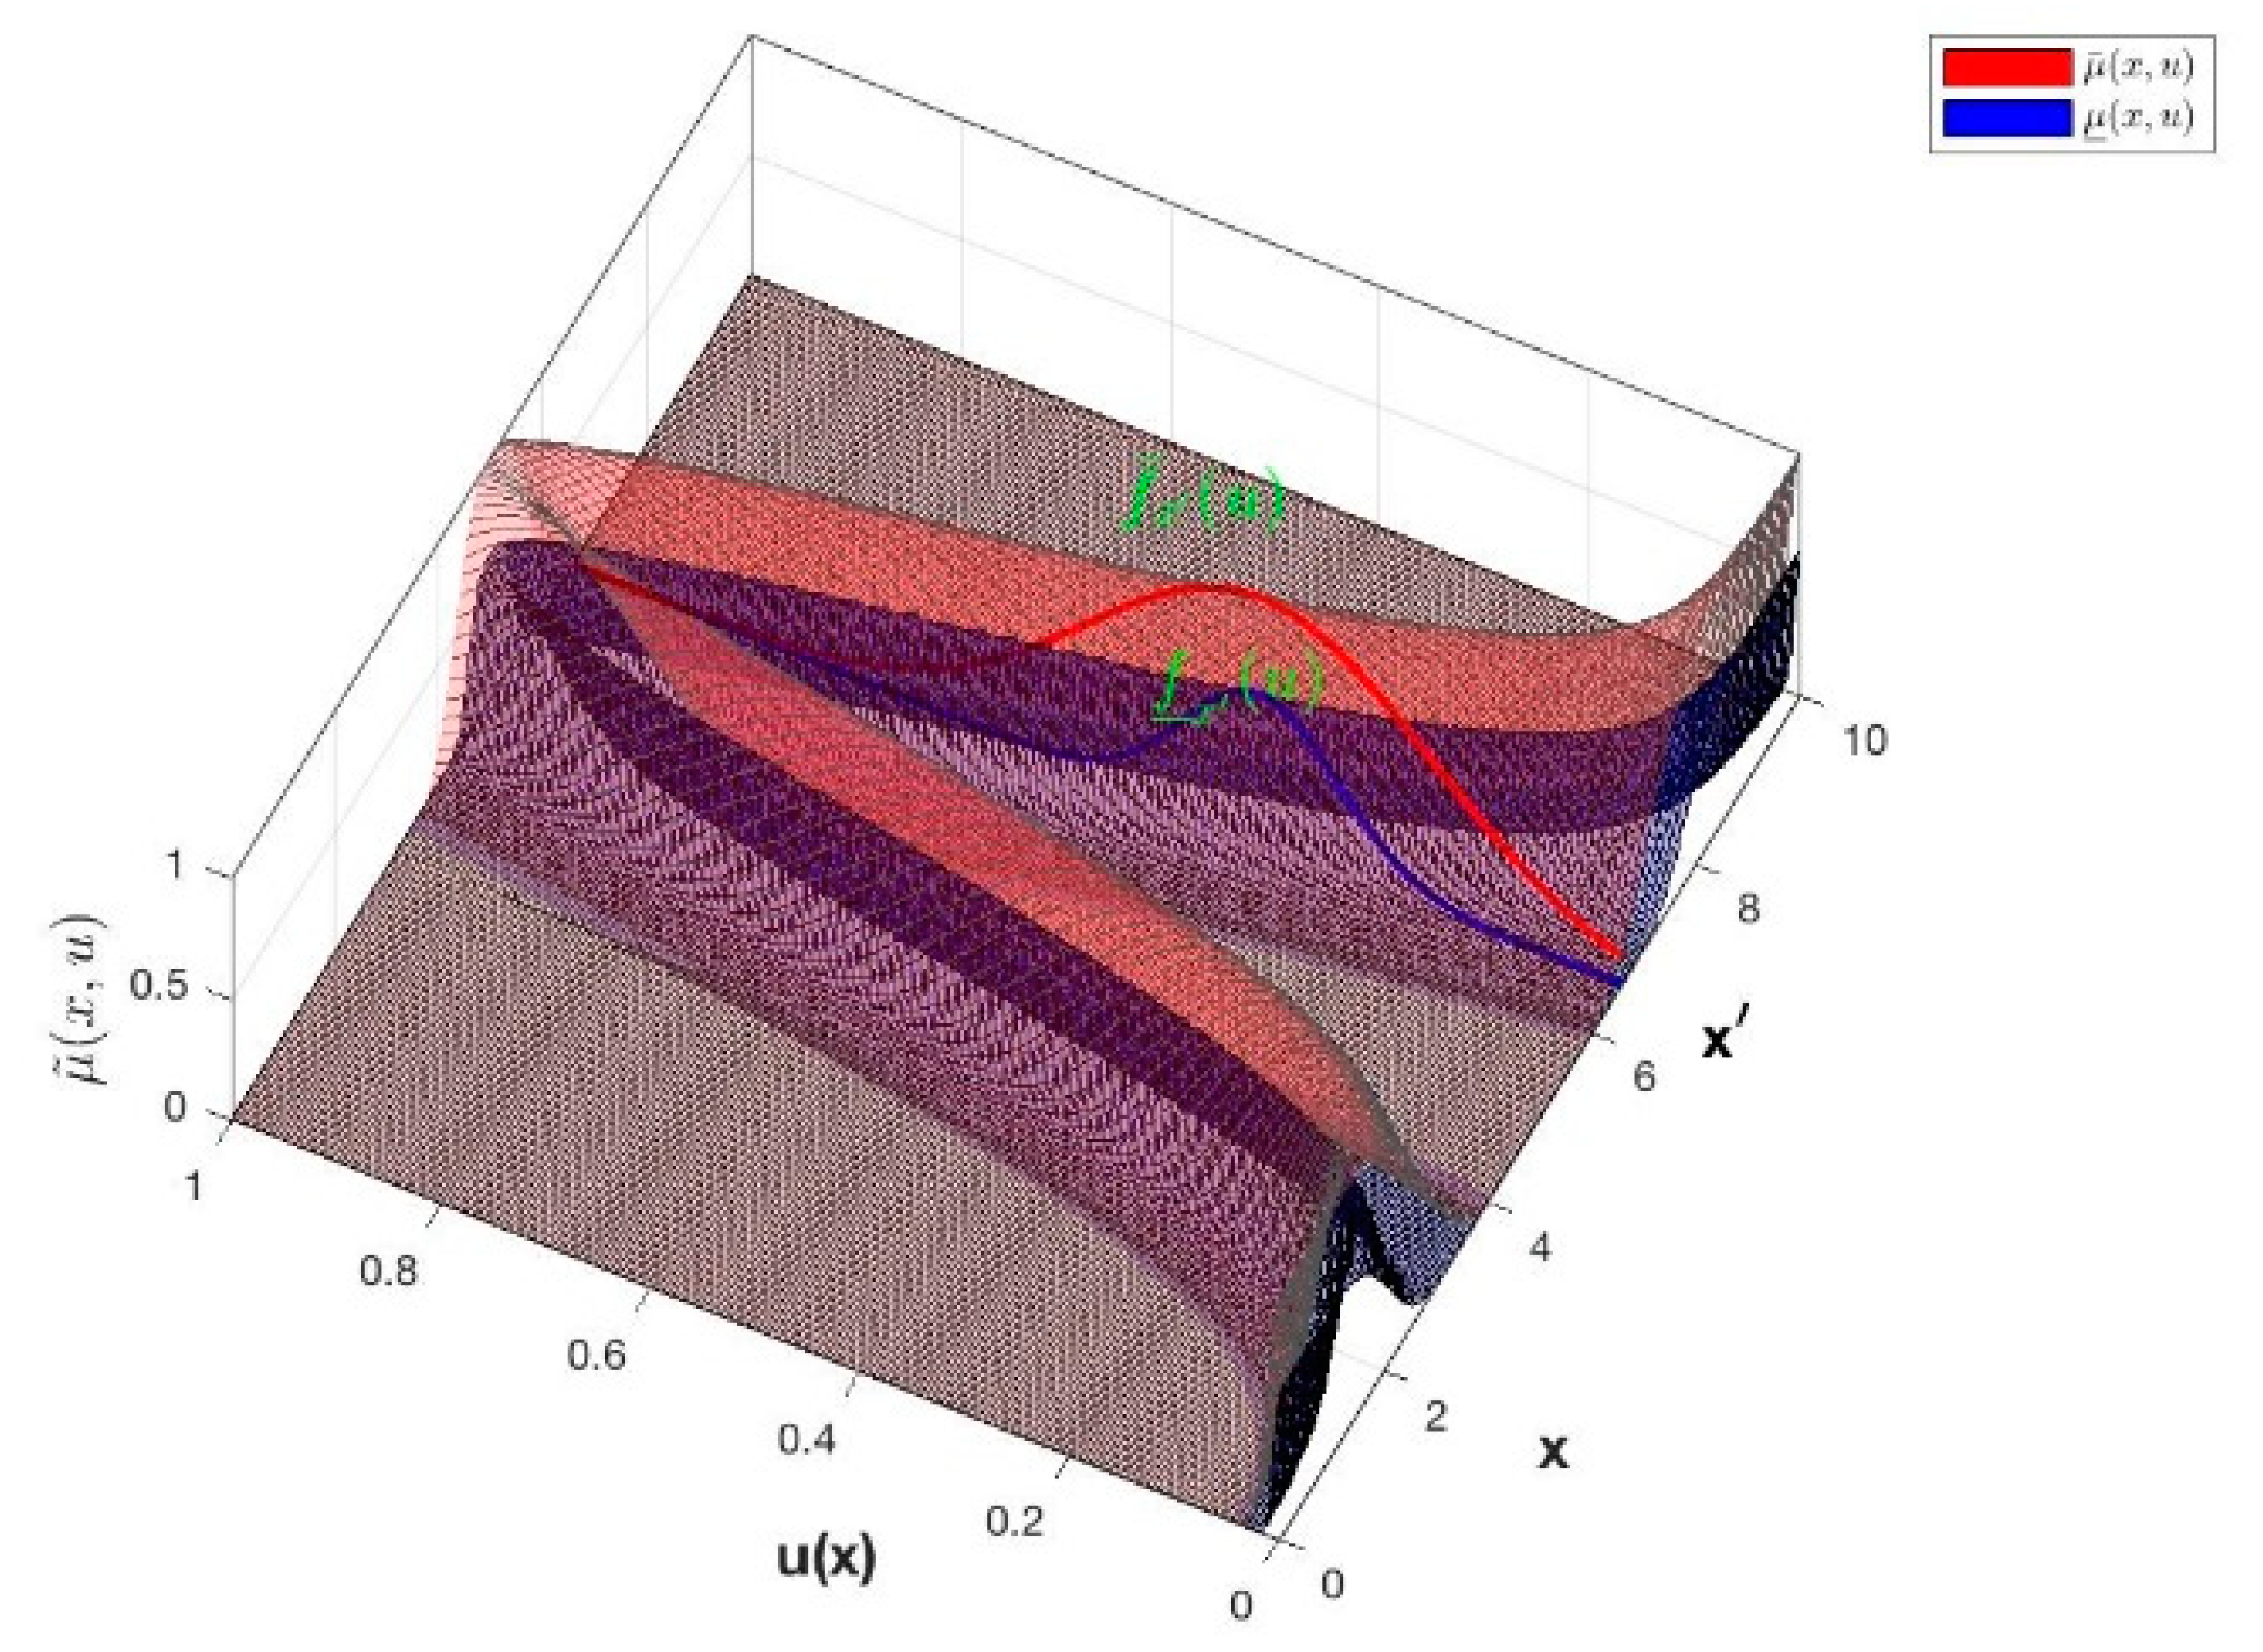
2. Interval Type-3 Fuzzy Logic
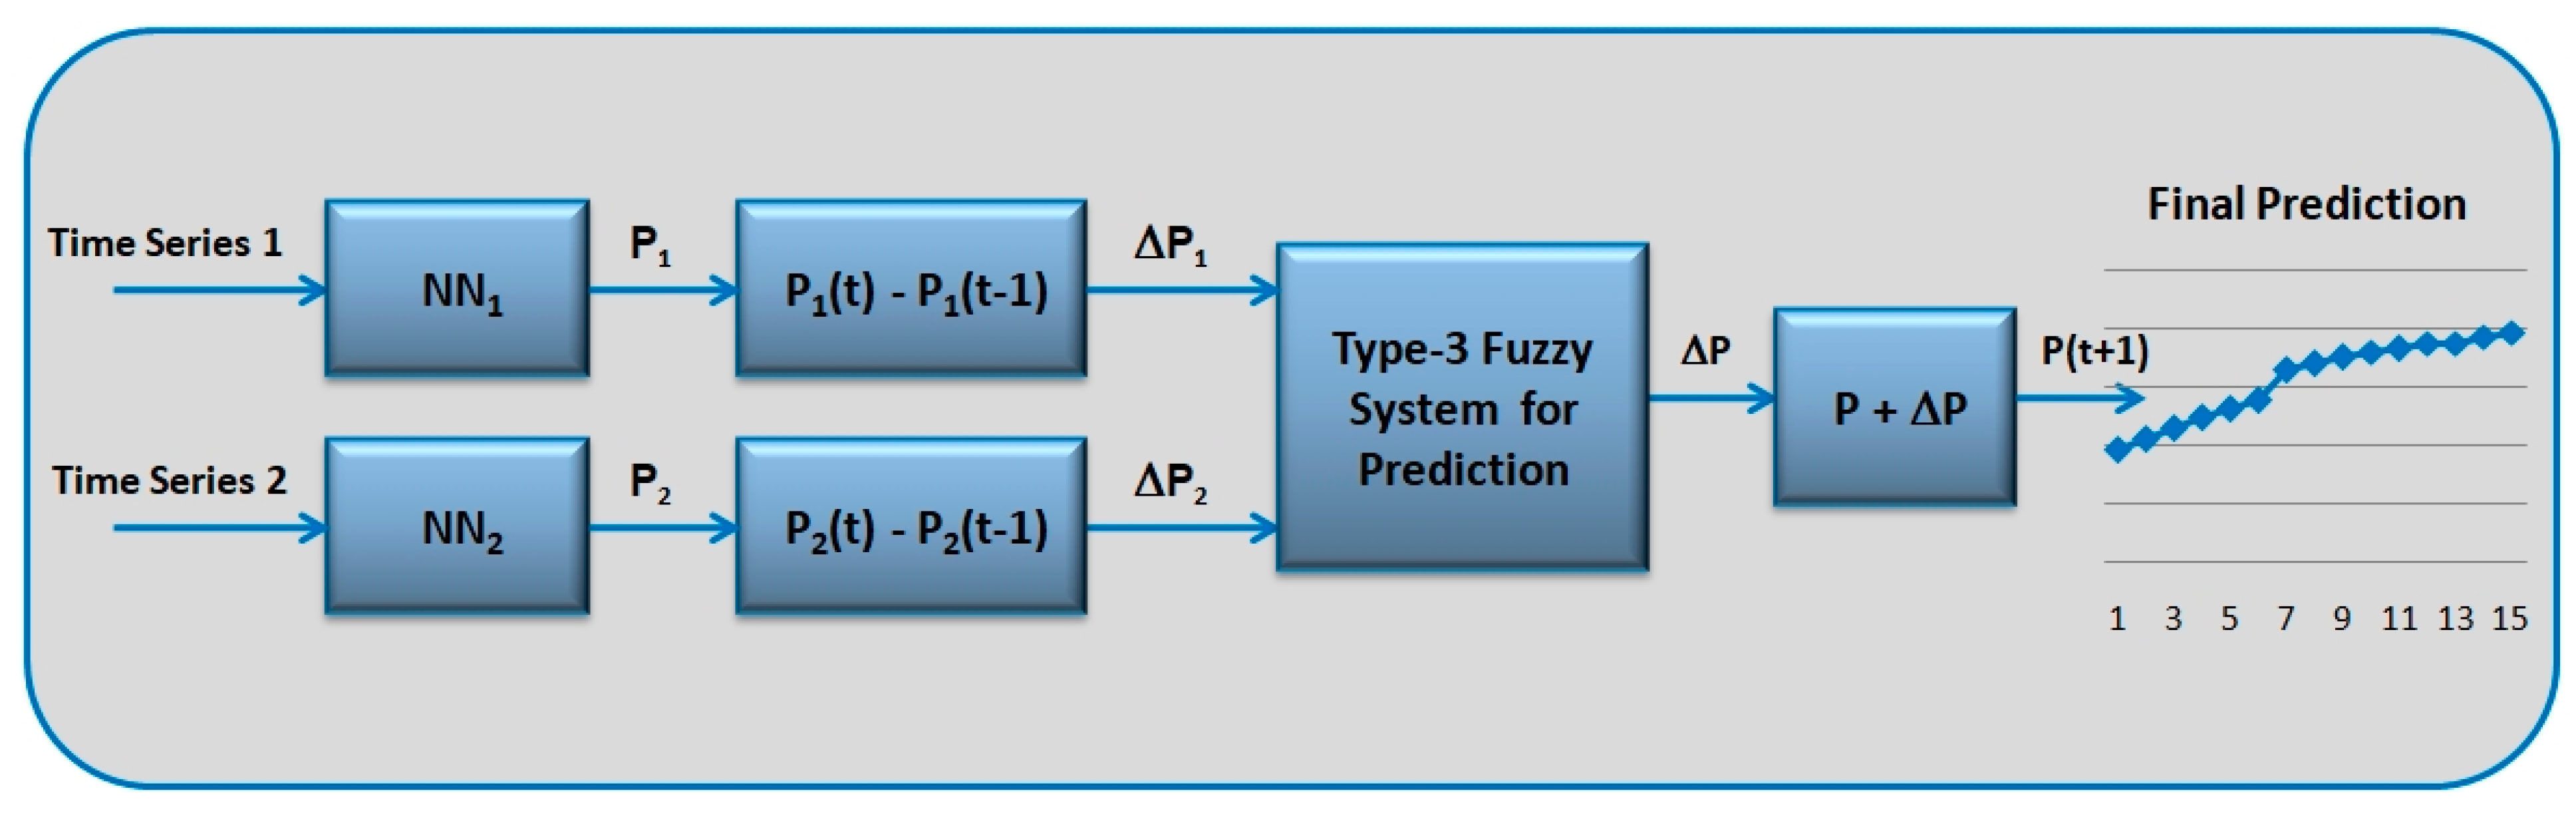
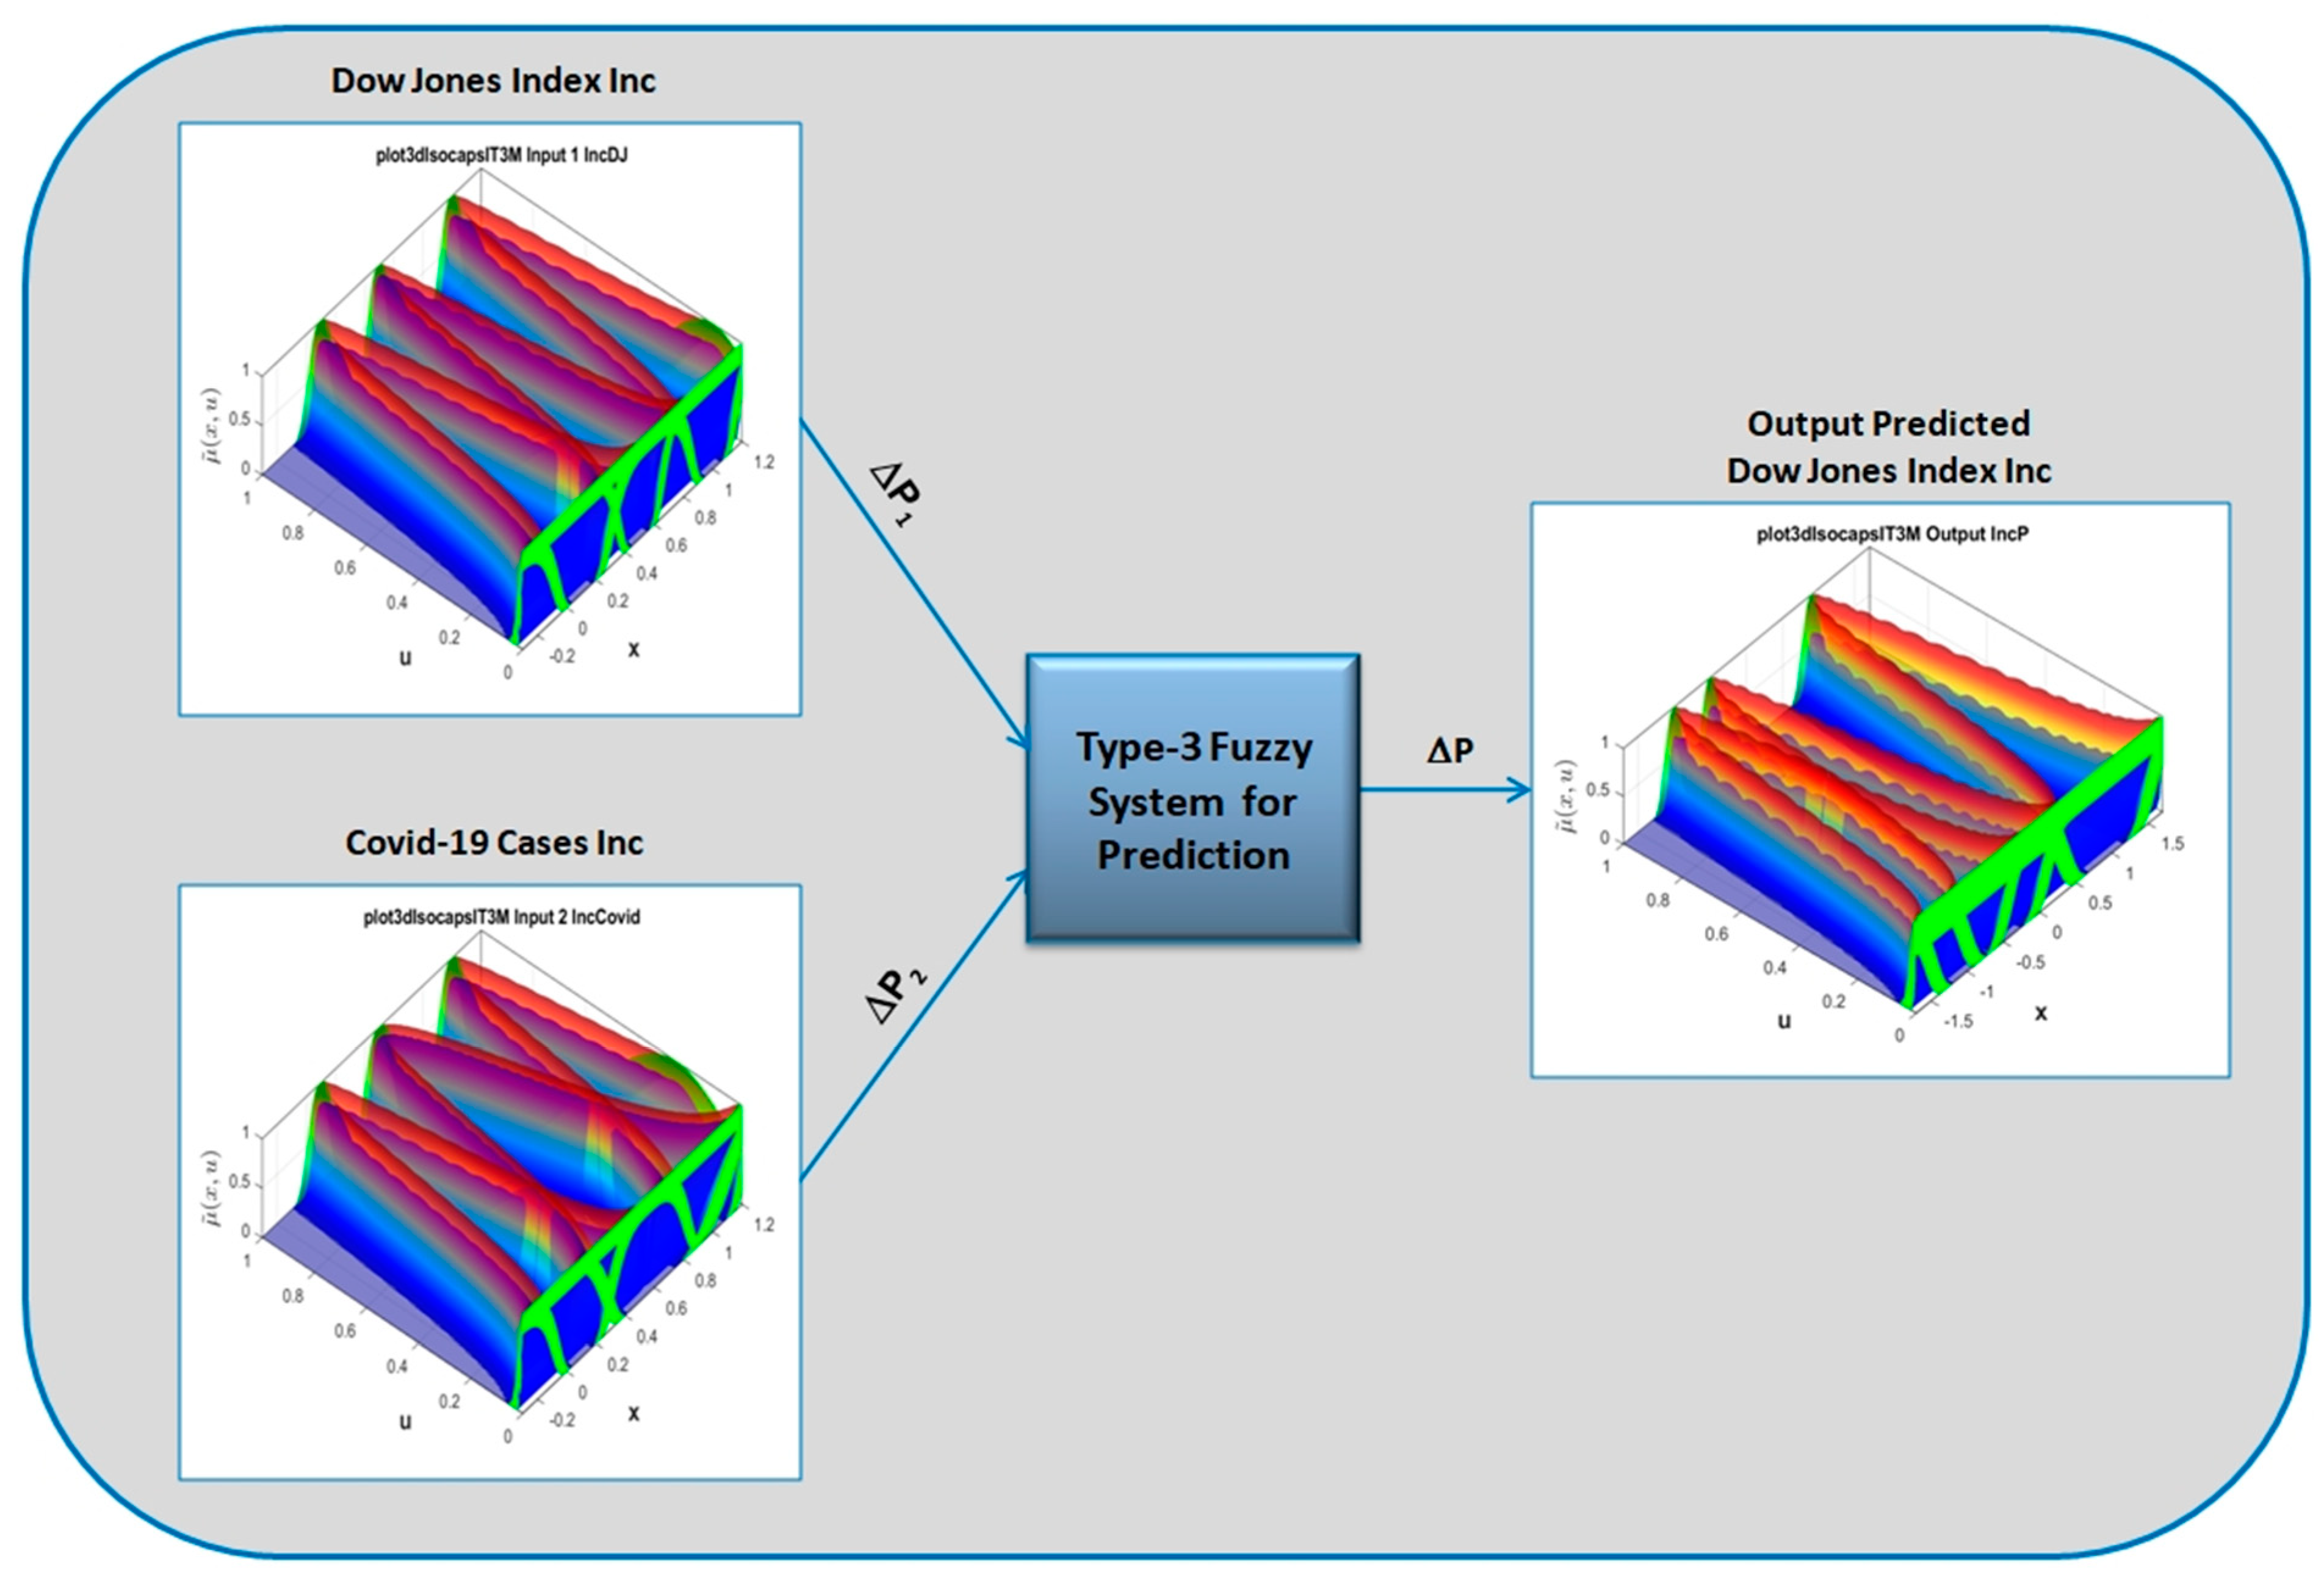
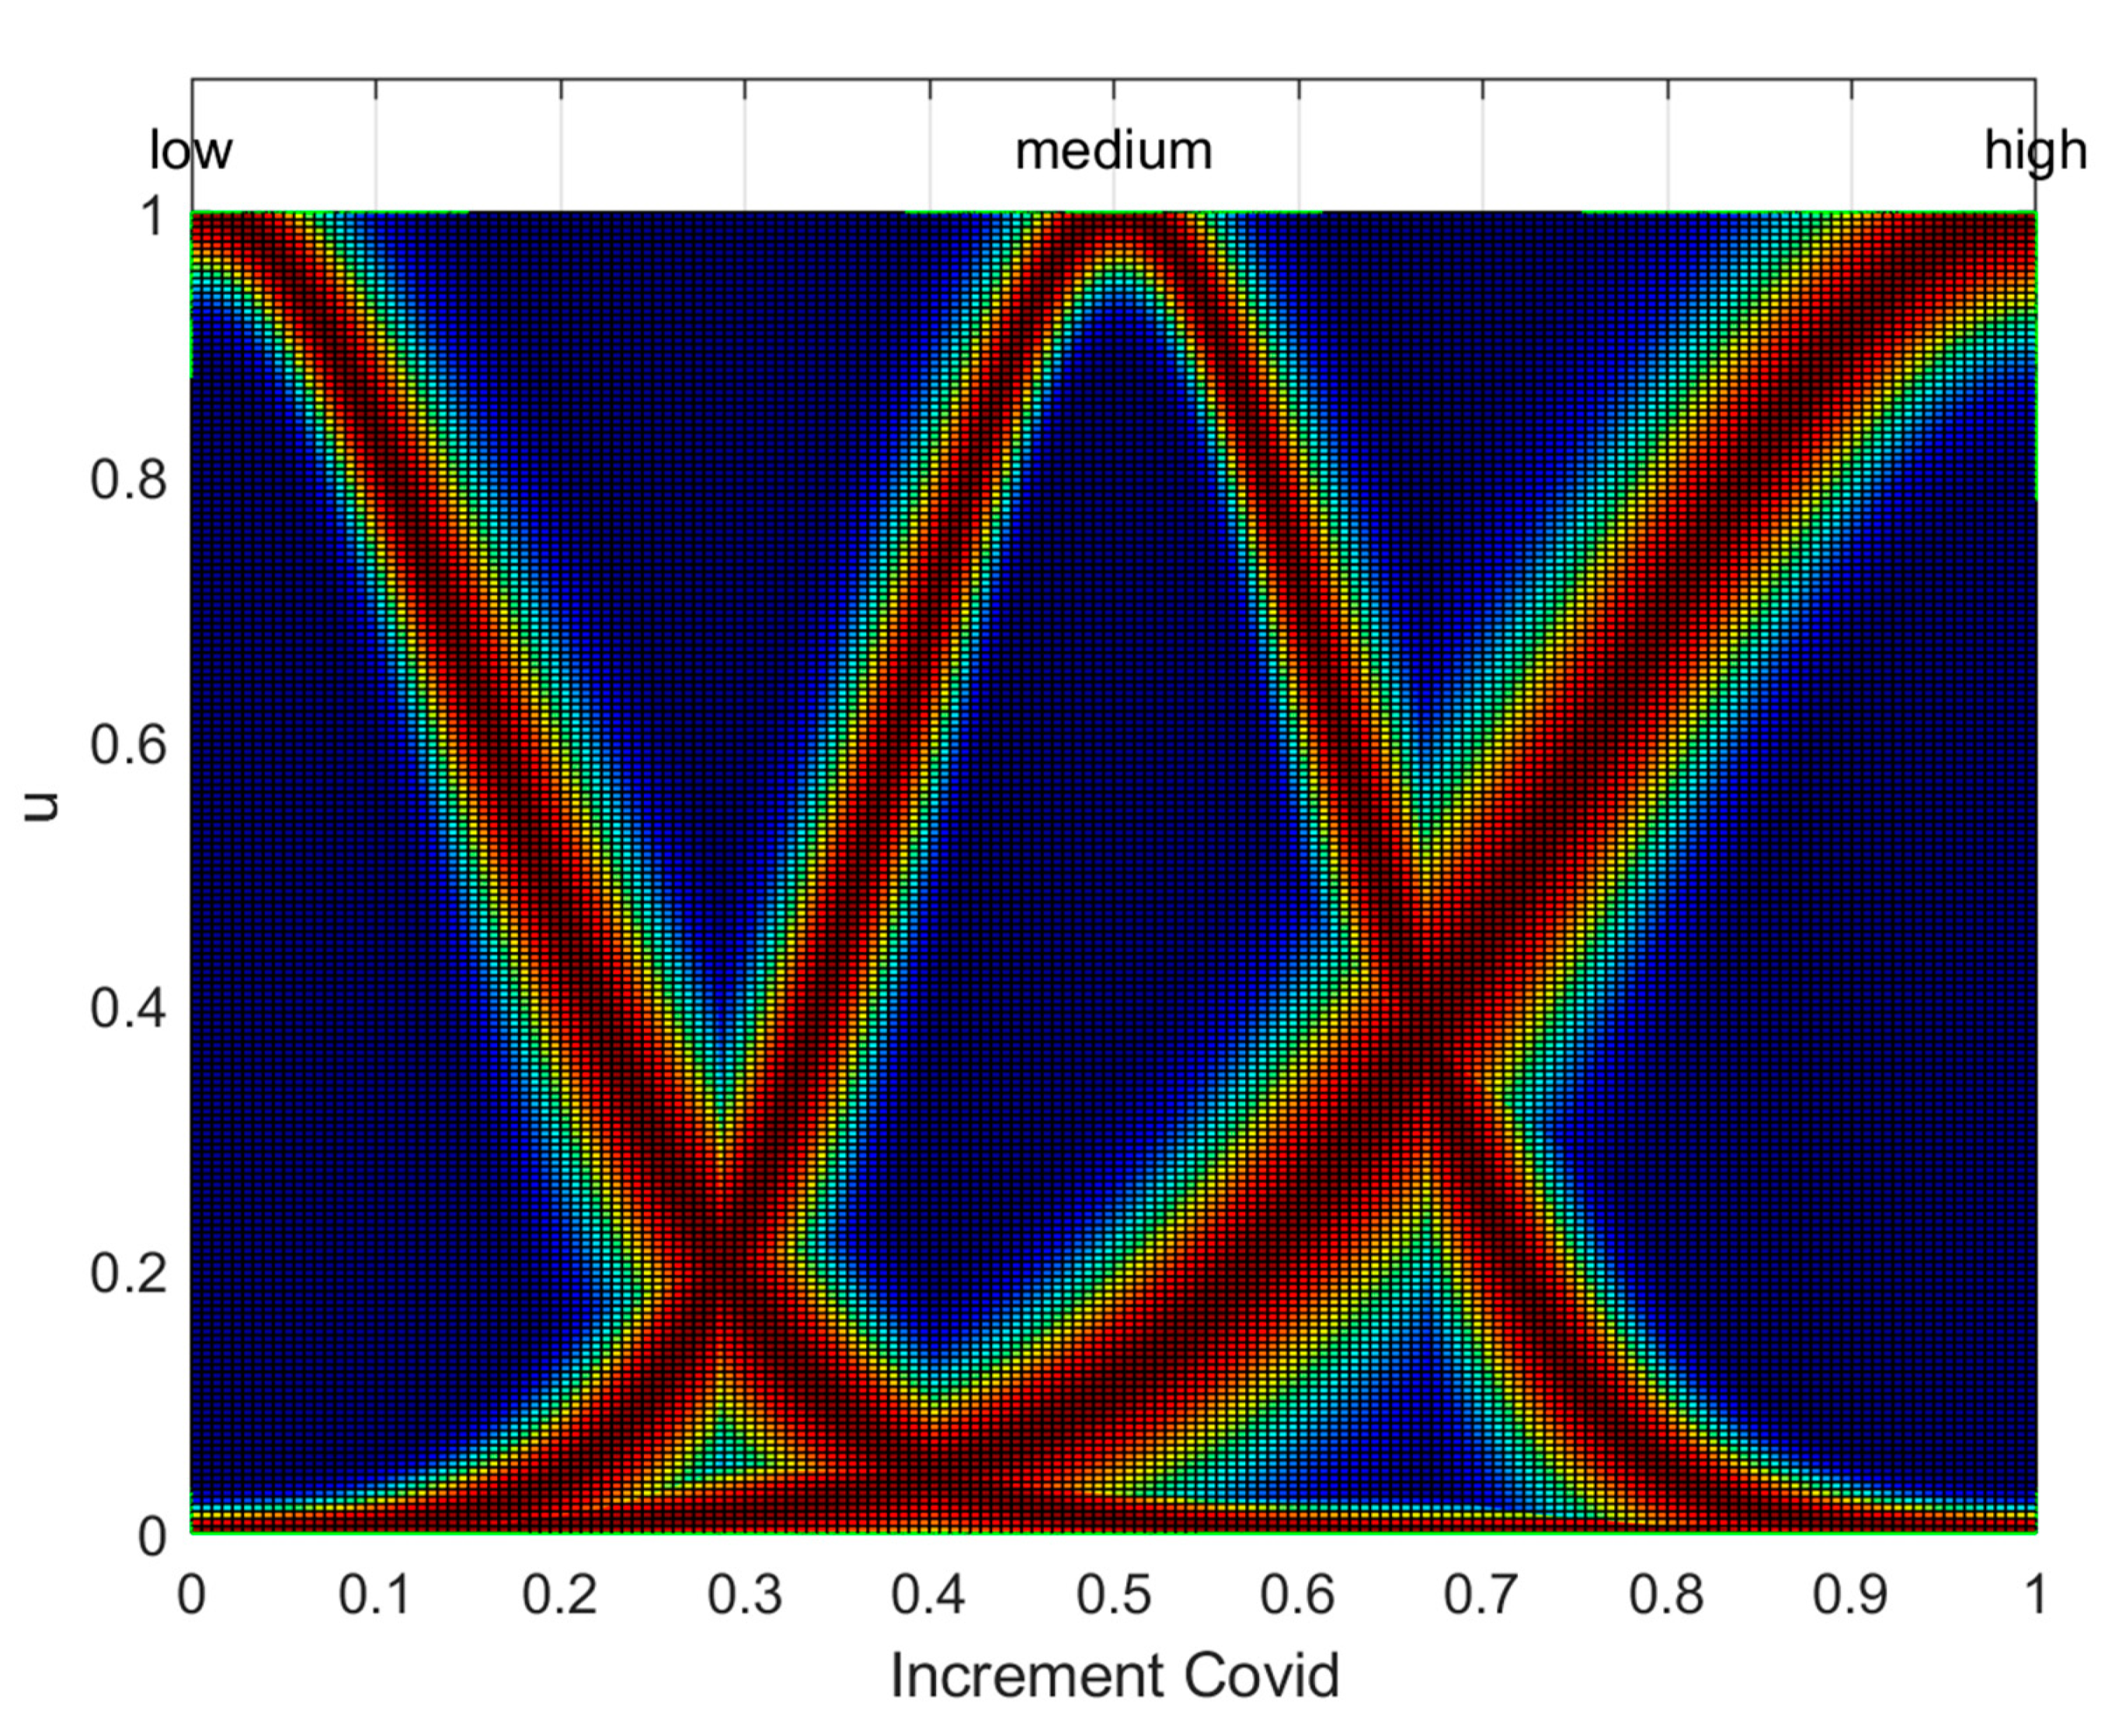
3. Proposed Method
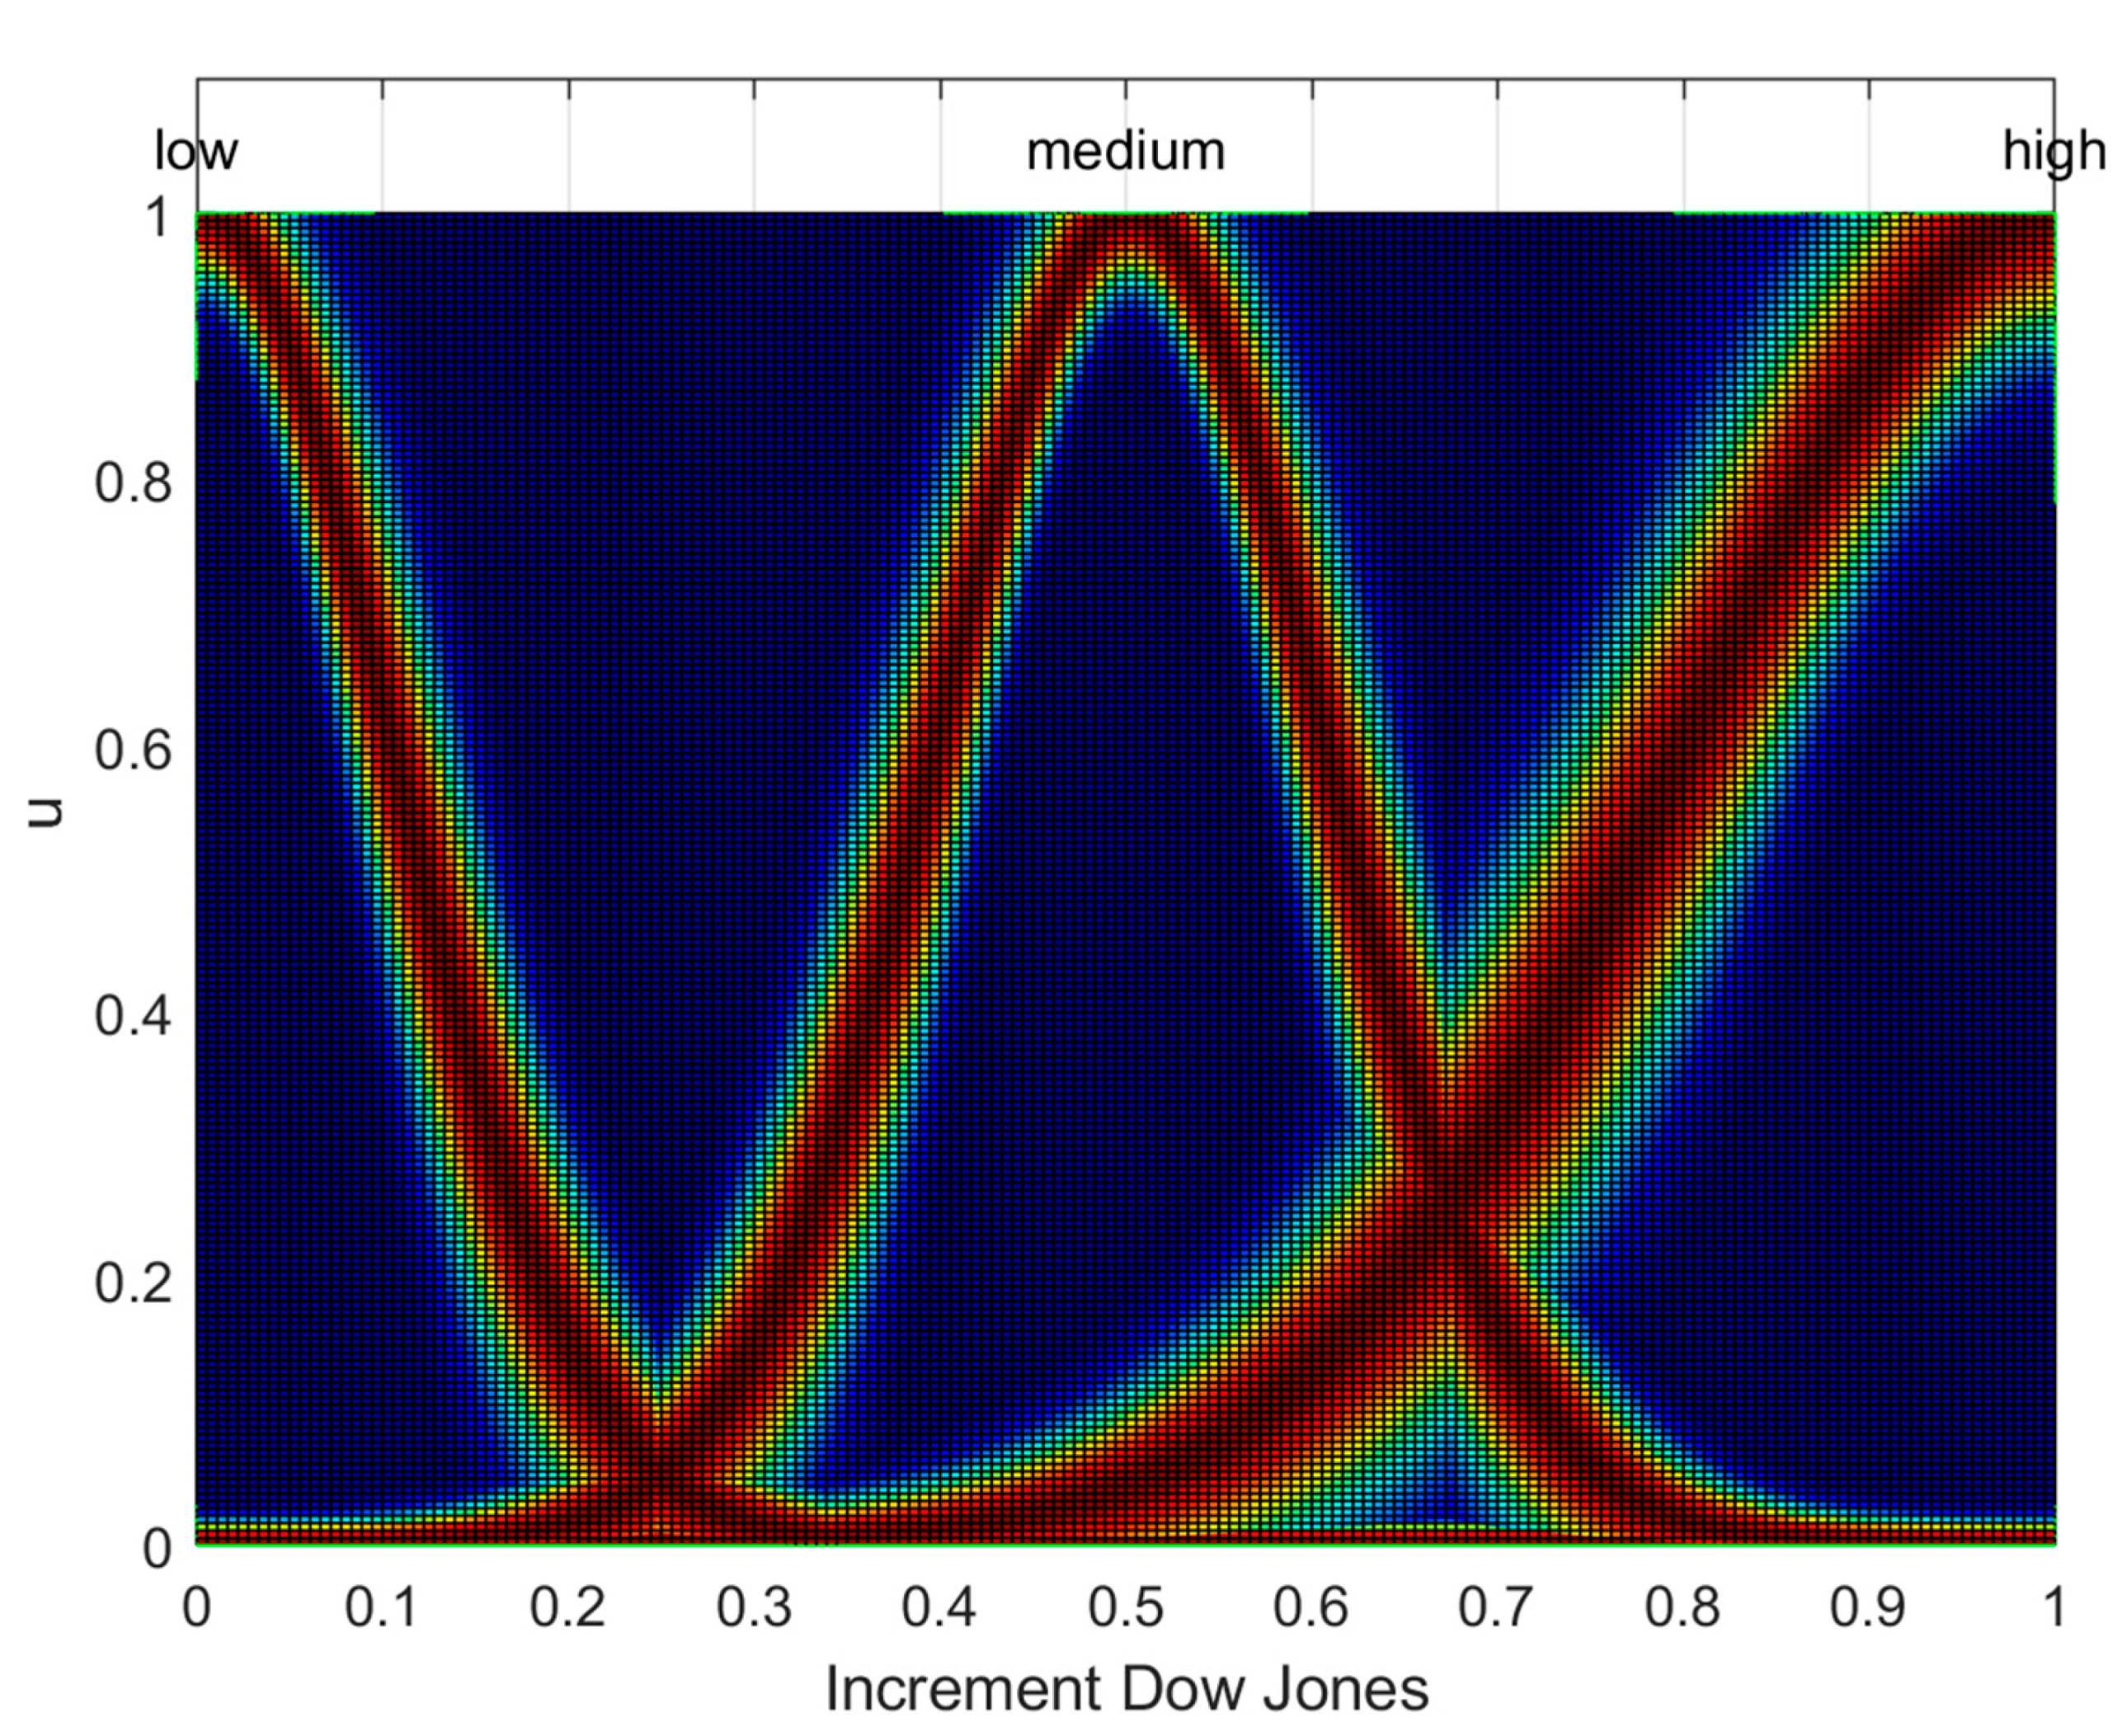
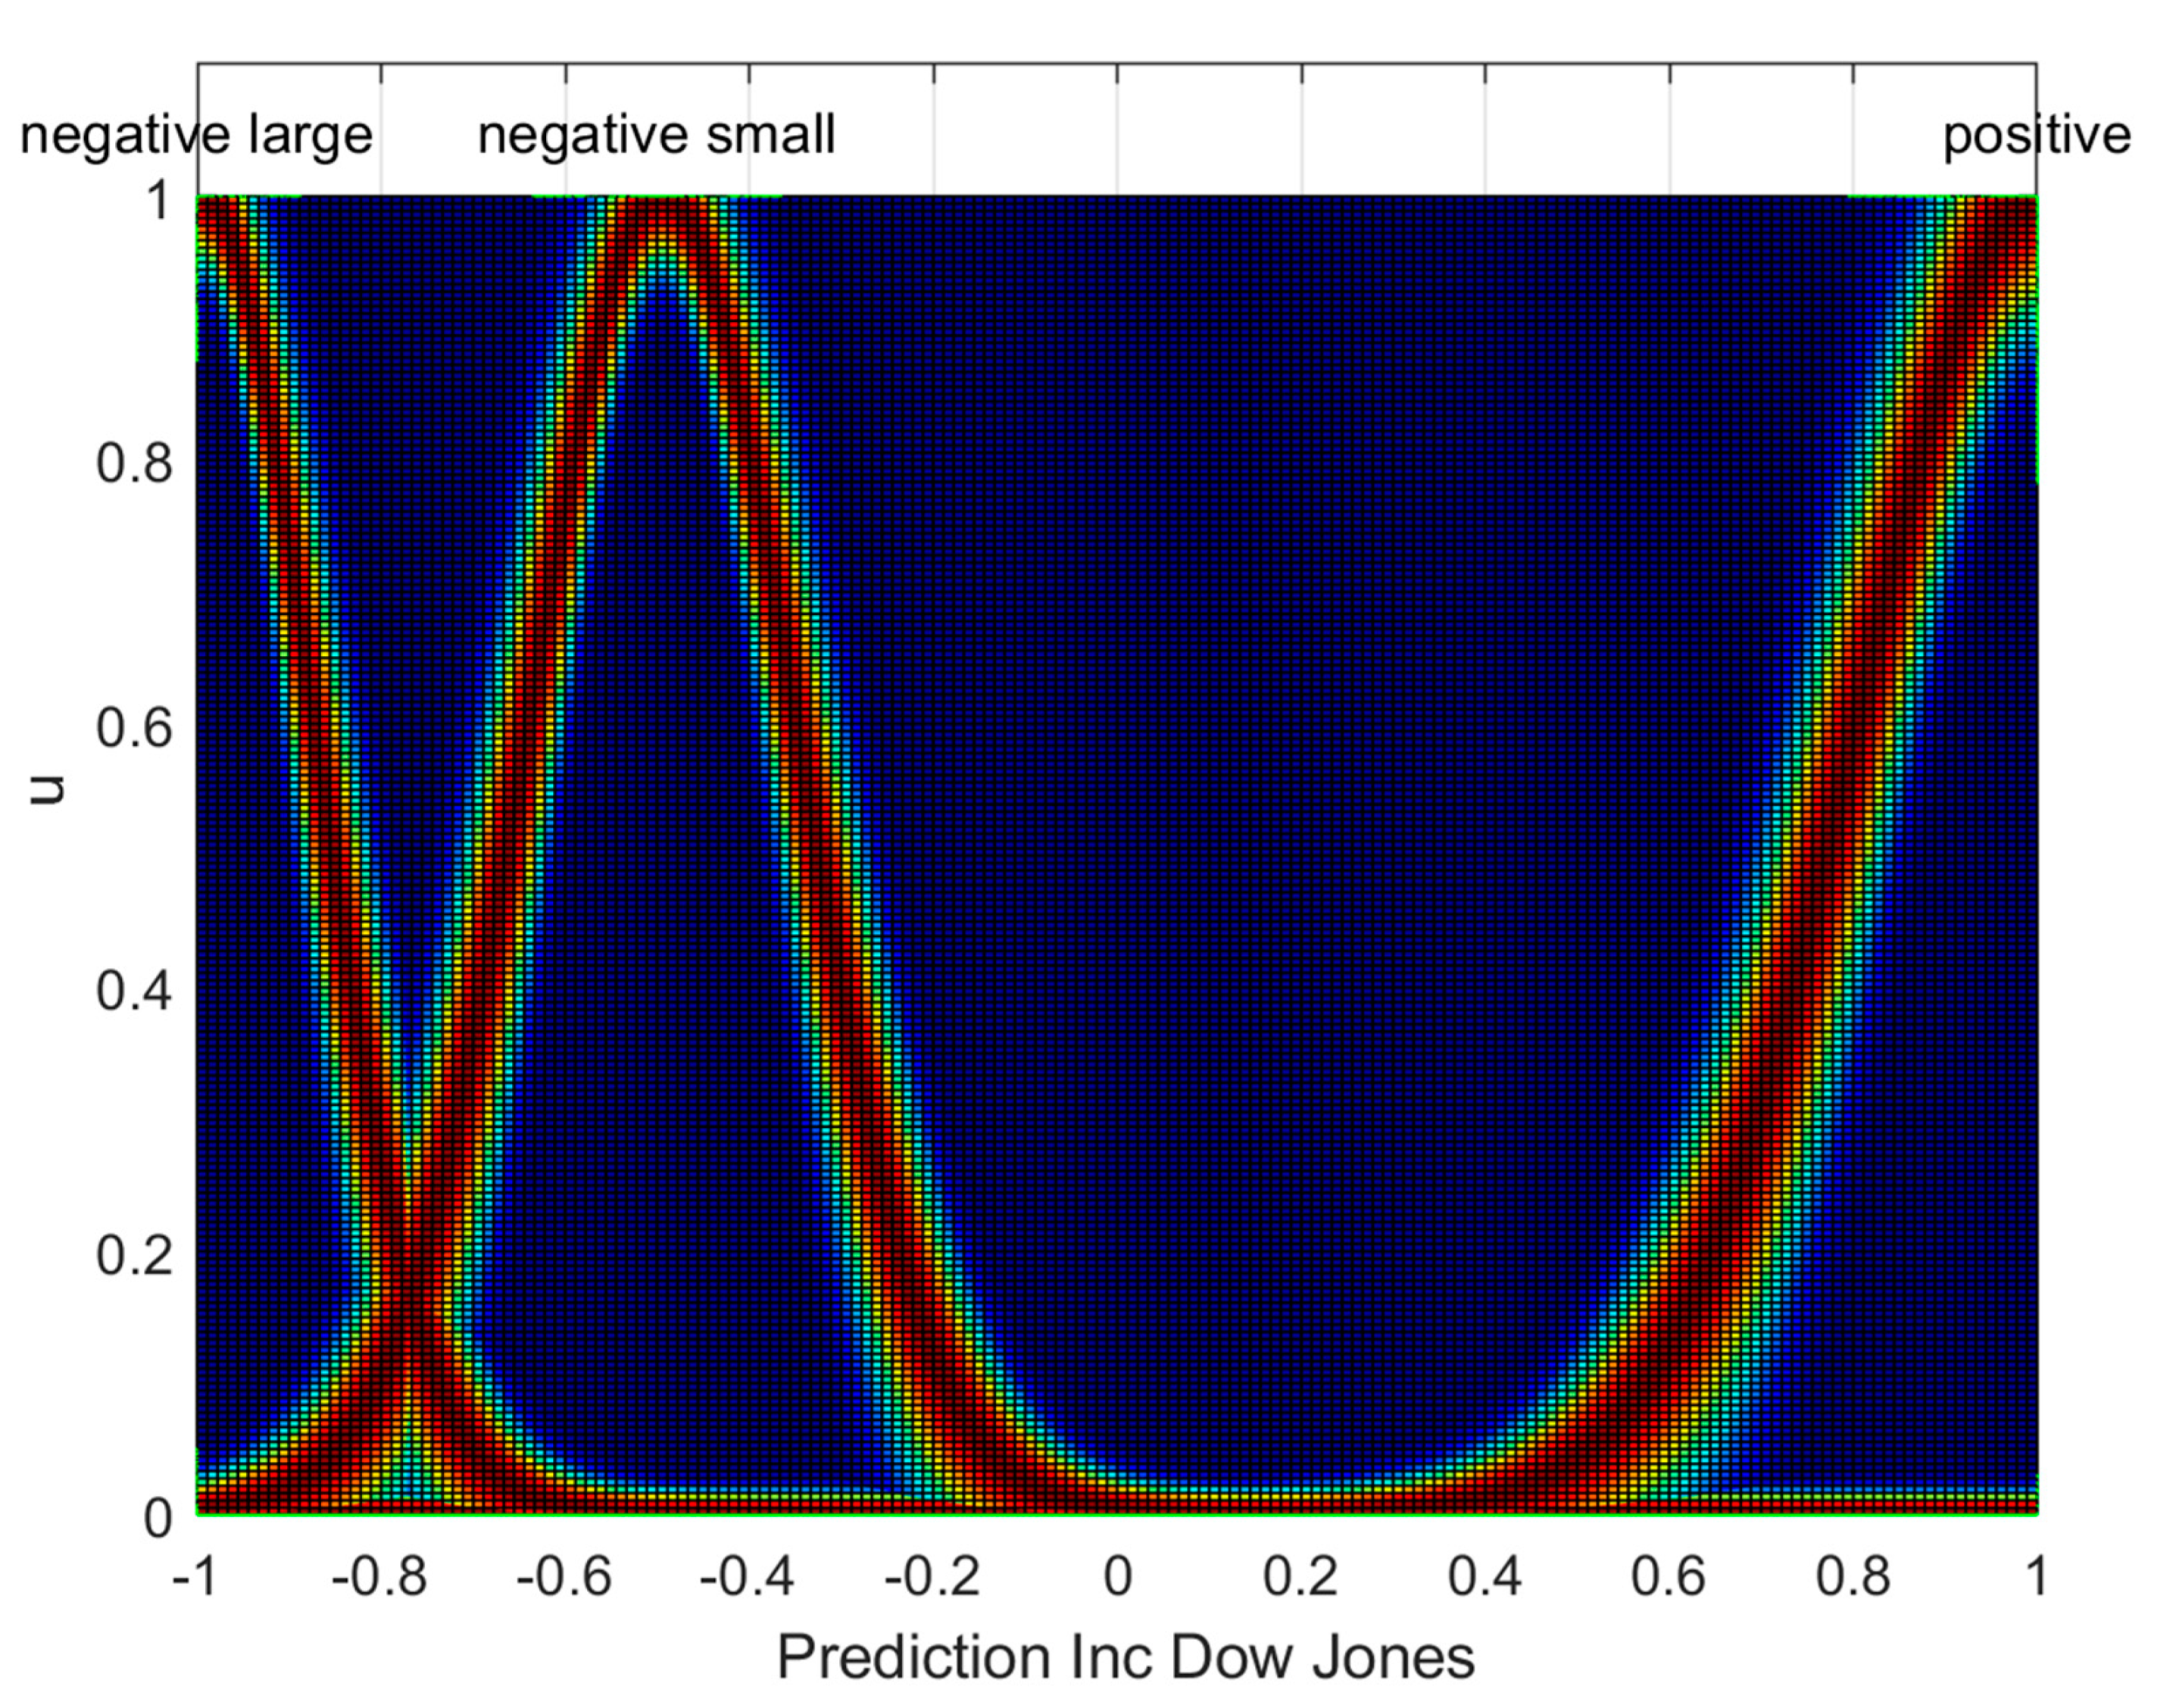
- If (ΔP1 is high) and (ΔP2 is low), then (ΔP is positive).
- If (ΔP 1 is high) and (ΔP2 is medium), then (ΔP is negative small).
- If (ΔP1 is high) and (ΔP2 is high), then (ΔP is negative large).
- If (ΔP 1 is medium) and (ΔP 2 is low), then (ΔP is positive).
- If (ΔP1 is medium) and (ΔP2 is medium), then (ΔP is negative small).
- If (ΔP1 is medium) and (ΔP2 is high), then (ΔP is negative large).
- If (ΔP1 is low) and (ΔP2 is low), then (ΔP is positive).
- If (ΔP1 is low) and (ΔP2 is medium), then (ΔP is negative small).
- If (ΔP1 is low) and (ΔP2 is high), then (ΔP is negative large).
4. Simulation Results
5. Conclusions
Author Contributions
Funding
Data Availability Statement
Acknowledgments
Conflicts of Interest
References
- Zadeh, L.A. Knowledge representation in Fuzzy Logic. IEEE Trans. Knowl. Data Eng. 1989, 1, 89. [Google Scholar] [CrossRef]
- Zadeh, L.A. Fuzzy Logic. Computer 1998, 1, 83–93. [Google Scholar]
- Mendel, J.M. Uncertain Rule-Based Fuzzy Logic Systems: Introduction and New Directions; Prentice-Hall: Upper-Saddle River, NJ, USA, 2001. [Google Scholar]
- Mendel, J.M. Uncertain Rule-Based Fuzzy Logic Systems: Introduction and New Directions, 2nd ed.; Springer: Berlin/Heidelberg, Germany, 2017. [Google Scholar]
- Karnik, N.N.; Mendel, J.M. Operations on Type-2 Fuzzy Sets. Fuzzy Sets Syst. 2001, 122, 327–348. [Google Scholar] [CrossRef]
- Moreno, J.E.; Sanchez, M.A.; Mendoza, O.; Rodríguez-Díaz, A.; Castillo, O.; Melin, P.; Castro, J.R. Design of an interval Type-2 fuzzy model with justifiable uncertainty. Inf. Sci. 2020, 513, 206–221. [Google Scholar] [CrossRef]
- Mendel, J.M.; Hagras, H.; Tan, W.-W.; Melek, W.W.; Ying, H. Introduction to Type-2 Fuzzy Logic Control; Wiley and IEEE Press: Hoboken, NJ, USA, 2014. [Google Scholar]
- Olivas, F.; Valdez, F.; Castillo, O.; Melin, P. Dynamic parameter adaptation in particle swarm optimization using interval type-2 fuzzy logic. Soft Comput. 2016, 20, 1057–1070. [Google Scholar] [CrossRef]
- Sakalli, A.; Kumbasar, T.; Mendel, J.M. Towards Systematic Design of General Type-2 Fuzzy Logic Controllers: Analysis, Interpretation, and Tuning. IEEE Trans. Fuzzy Syst. 2021, 29, 226–239. [Google Scholar] [CrossRef]
- Ontiveros, E.; Melin, P.; Castillo, O. High order α-planes integration: A new approach to computational cost reduction of General Type-2 Fuzzy Systems. Eng. Appl. Artif. Intell. 2018, 74, 186–197. [Google Scholar] [CrossRef]
- Castillo, O.; Amador-Angulo, L. A generalized type-2 fuzzy logic approach for dynamic parameter adaptation in bee colony optimization applied to fuzzy controller design. Inf. Sci. 2018, 460–461, 476–496. [Google Scholar] [CrossRef]
- Cao, Y.; Raise, A.; Mohammadzadeh, A.; Rathinasamy, S.; Band, S.S.; Mosavi, A. Deep learned recurrent type-3 fuzzy system: Application for renewable energy modeling/prediction. Energy Rep. 2021, 7, 8115–8127. [Google Scholar] [CrossRef]
- Mohammadzadeh, A.; Castillo, O.; Band, S.S.; Mosavi, A. A Novel Fractional-Order Multiple-Model Type-3 Fuzzy Control for Nonlinear Systems with Unmodeled Dynamics. Int. J. Fuzzy Syst. 2021, 23, 1633–1651. [Google Scholar] [CrossRef]
- Qasem, S.N.; Ahmadian, A.; Mohammadzadeh, A.; Rathinasamy, S.; Pahlevanzadeh, B. A type-3 logic fuzzy system: Optimized by a correntropy based Kalman filter with adaptive fuzzy kernel size. Inform. Sci. 2021, 572, 424–443. [Google Scholar] [CrossRef]
- Khalilpourazari, S.; Doulabi, H.H.; Çiftçioglu, A.Ö.; Weber, G.W. Gradient-based grey wolf optimizer with Gaussian walk: Application in modelling and prediction of the COVID-19 pandemic. Expert Syst. Appl. 2021, 177, 114920. [Google Scholar] [CrossRef]
- Kuvvetli, Y.; Deveci, M.; Paksoy, T.; Garg, H. A predictive analytics model for COVID-19 pandemic using artificial neural networks. Decis. Anal. J. 2021, 1, 100007. [Google Scholar] [CrossRef]
- Liu, D.; Ding, W.; Dong, Z.S.; Pedrycz, W. Optimizing deep neural networks to predict the effect of social distancing on COVID-19 spread. Comput. Ind. Eng. 2022, 166, 107970. [Google Scholar] [CrossRef]
- The Humanitarian Data Exchange (HDX). Available online: https://data.humdata.org/dataset/novel-coronavirus-2019-ncov-cases. (accessed on 31 March 2020).
- Shereen, M.A.; Khan, S.; Kazmi, A.; Bashir, N.; Siddique, R. COVID-19 infection: Origin, transmission, and characteristics of human coronaviruses. J. Adv. Res. 2020, 24, 91–98. [Google Scholar] [CrossRef]
- Sohrabi, C.; Alsafi, Z.; O’neill, N.; Khan, M.; Kerwan, A.; Al-Jabir, A.; Iosifidis, C.; Agha, R. World Health Organization declares global emergency: A review of the 2019 novel coronavirus (COVID-19). Int. J. Surg. 2020, 76, 71–76. [Google Scholar] [CrossRef]
- Apostolopoulos, I.D.; Bessiana, T. COVID-19: Automatic detection from X-Ray images utilizing Transfer Learning with Convolutional Neural Networks. arXiv 2020, arXiv:2003.11617. [Google Scholar] [CrossRef] [Green Version]
- Sarkodie, S.A.; Owusu, P.A. Investigating the Cases of Novel Coronavirus Disease (COVID-19) in China Using Dynamic Statistical Techniques. Heliyon 2020, 6, e03747. [Google Scholar] [CrossRef]
- Beck, B.R.; Shin, B.; Choi, Y.; Park, S.; Kang, K. Predicting commercially available antiviral drugs that may act on the novel coronavirus (SARS-CoV-2) through a drug-target interaction deep learning model. Comput. Struct. Biotechnol. J. 2020, 18, 784–790. [Google Scholar] [CrossRef]
- Zhong, L.; Mu, L.; Li, J.; Wang, J.; Yin, Z.; Liu, D. Early Prediction of the 2019 Novel Coronavirus Outbreak in the Mainland China based on Simple Mathematical Model. IEEE Access. 2020, 8, 51761–51769. [Google Scholar] [CrossRef]
- Kamel Boulos, M.N.; Geraghty, E.M. Geographical tracking and mapping of coronavirus disease COVID-19/severe acute respiratory syndrome coronavirus 2 (SARS-CoV-2) epidemic and associated events around the world: How 21st century GIS technologies are supporting the global fight against outbreaks and epidemics. Int. J. Health Geogr. 2020, 19, 8. [Google Scholar] [CrossRef] [Green Version]
- Gao, P.; Zhang, H.; Wu, Z.; Wang, J. Visualising the expansion and spread of coronavirus disease 2019 by cartograms. Environ. Plan. A Econ. Space 2020, 52, 698–701. [Google Scholar] [CrossRef] [Green Version]
- Srinivasa Rao, A.; Vazquez, J. Identification of COVID-19 can be quicker through artificial intelligence framework using a mobile phone-based survey in the populations when Cities/Towns are under quarantine. Infect. Control. Hosp. Epidemiol. 2020, 41, 826–830. [Google Scholar] [CrossRef] [Green Version]
- Melin, P.; Monica, J.C.; Sanchez, D.; Castillo, O. Analysis of Spatial Spread Relationships of Coronavirus (COVID-19) Pandemic in the World using Self Organizing Maps. Chaos Solitons Fractals 2020, 138, 109917. [Google Scholar] [CrossRef]
- Melin, P.; Monica, J.C.; Sanchez, D.; Castillo, O. Multiple Ensemble Neural Network Models with Fuzzy Response Aggregation for Predicting COVID-19 Time Series: The Case of Mexico. Healthcare 2020, 8, 181. [Google Scholar] [CrossRef]
- Rickard, J.T.; Aisbett, J.; Gibbon, G. Fuzzy subsethood for fuzzy sets of type-2 and generalized type-n. IEEE Trans. Fuzzy Syst. 2009, 17, 50–60. [Google Scholar] [CrossRef]
- Mohammadzadeh, A.; Sabzalian, M.H.; Zhang, W. An interval type-3 fuzzy system and a new online fractional-order learning algorithm: Theory and practice. IEEE Trans. Fuzzy Syst. 2020, 28, 1940–1950. [Google Scholar] [CrossRef]
- Liu, Z.; Mohammadzadeh, A.; Turabieh, H.; Mafarja, M.; Band, S.S.; Mosavi, A. A New Online Learned Interval Type-3 Fuzzy Control System for Solar Energy Management Systems. IEEE Access 2021, 9, 10498–10508. [Google Scholar] [CrossRef]
- Castillo, O.; Castro, J.R.; Melin, P. Interval Type-3 Fuzzy Systems: Theory and Design; Springer: Cham, Switzerland, 2022. [Google Scholar]
- Dow Jones Time Series Data. Available online: https://m.mx.investing.com/indices/us-30-historical-data (accessed on 31 March 2022).
- Cervantes, L.; Castillo, O. Type-2 Fuzzy Logic Aggregation of Multiple Fuzzy Controllers for Airplane Flight Control. Inf. Sci. 2015, 324, 247–256. [Google Scholar] [CrossRef]
- Castillo, O.; Castro, J.R.; Melin, P. A Rodriguez-Diaz, Application of interval type-2 fuzzy neural networks in non-linear identification and time series prediction. Soft Comput. 2014, 18, 1213–1224. [Google Scholar] [CrossRef]


| Variable | Membership Function | σ | m |
|---|---|---|---|
| Input 1 | small | 0.127 | 0.00 |
| Input 1 | medium | 0.13 | 0.50 |
| Input 1 | high | 0.25 | 1.00 |
| Input 2 | small | 0.20 | 0.00 |
| Input 2 | medium | 0.15 | 0.50 |
| Input 2 | high | 0.30 | 1.00 |
| Output 1 | low | 0.15 | −1.00 |
| Output 1 | medium | 0.18 | −0.50 |
| Output 1 | high | 0.25 | 1.00 |
| Dow Jones NN | Inc Dow Jones | COVID NN | Inc COVID | Dow Jones IT3 | Dow Jones Real |
|---|---|---|---|---|---|
| 34,349.25 | 0.0664 | 33,849,760 | 0.0007 | 34,948.49 | 34,421.93 |
| 34,137.63 | 0.2917 | 33,861,363 | 0.0973 | 35,536.12 | 34,870.16 |
| 34,477.83 | 0.4690 | 33,895,756 | 0.2887 | 35,113.13 | 34,996.18 |
| 34,665.86 | 0.2592 | 33,921,173 | 0.2133 | 34,697.25 | 34,888.79 |
| 34,598.99 | 0.0921 | 33,946,079 | 0.2090 | 35,257.75 | 34,933.23 |
| 34,614.08 | 0.0208 | 34,015,922 | 0.5863 | 34,894.75 | 34,987.02 |
| 34,664.91 | 0.0700 | 34,015,183 | 0.0062 | 34,247.86 | 34,687.85 |
| 34,422.15 | 0.3347 | 34,023,764 | 0.0720 | 33,628.03 | 33,962.04 |
| 33,696.86 | 1.0000 | 34,068,368 | 0.3744 | 33,999.74 | 34,511.99 |
| 34,055.52 | 0.4945 | 34,101,607 | 0.2790 | 34,436.44 | 34,798.00 |
| 34,419.24 | 0.5014 | 34,141,916 | 0.3383 | 34,820.19 | 34,823.35 |
| 34,494.41 | 0.1036 | 34,182,819 | 0.3433 | 34,439.27 | 35,061.55 |
| 34,695.49 | 0.2772 | 34,301,941 | 1.0000 | 34,862.25 | 35,144.31 |
| 34,803.33 | 0.1486 | 34,297,819 | 0.0346 | 35,488.40 | 35,058.52 |
| 34,748.02 | 0.0762 | 34,317,020 | 0.1611 | 34,927.89 | 34,930.93 |
| Dow Jones NN | Inc Dow Jones | COVID NN | Inc COVID | Dow Jones IT3 | Dow Jones Real |
|---|---|---|---|---|---|
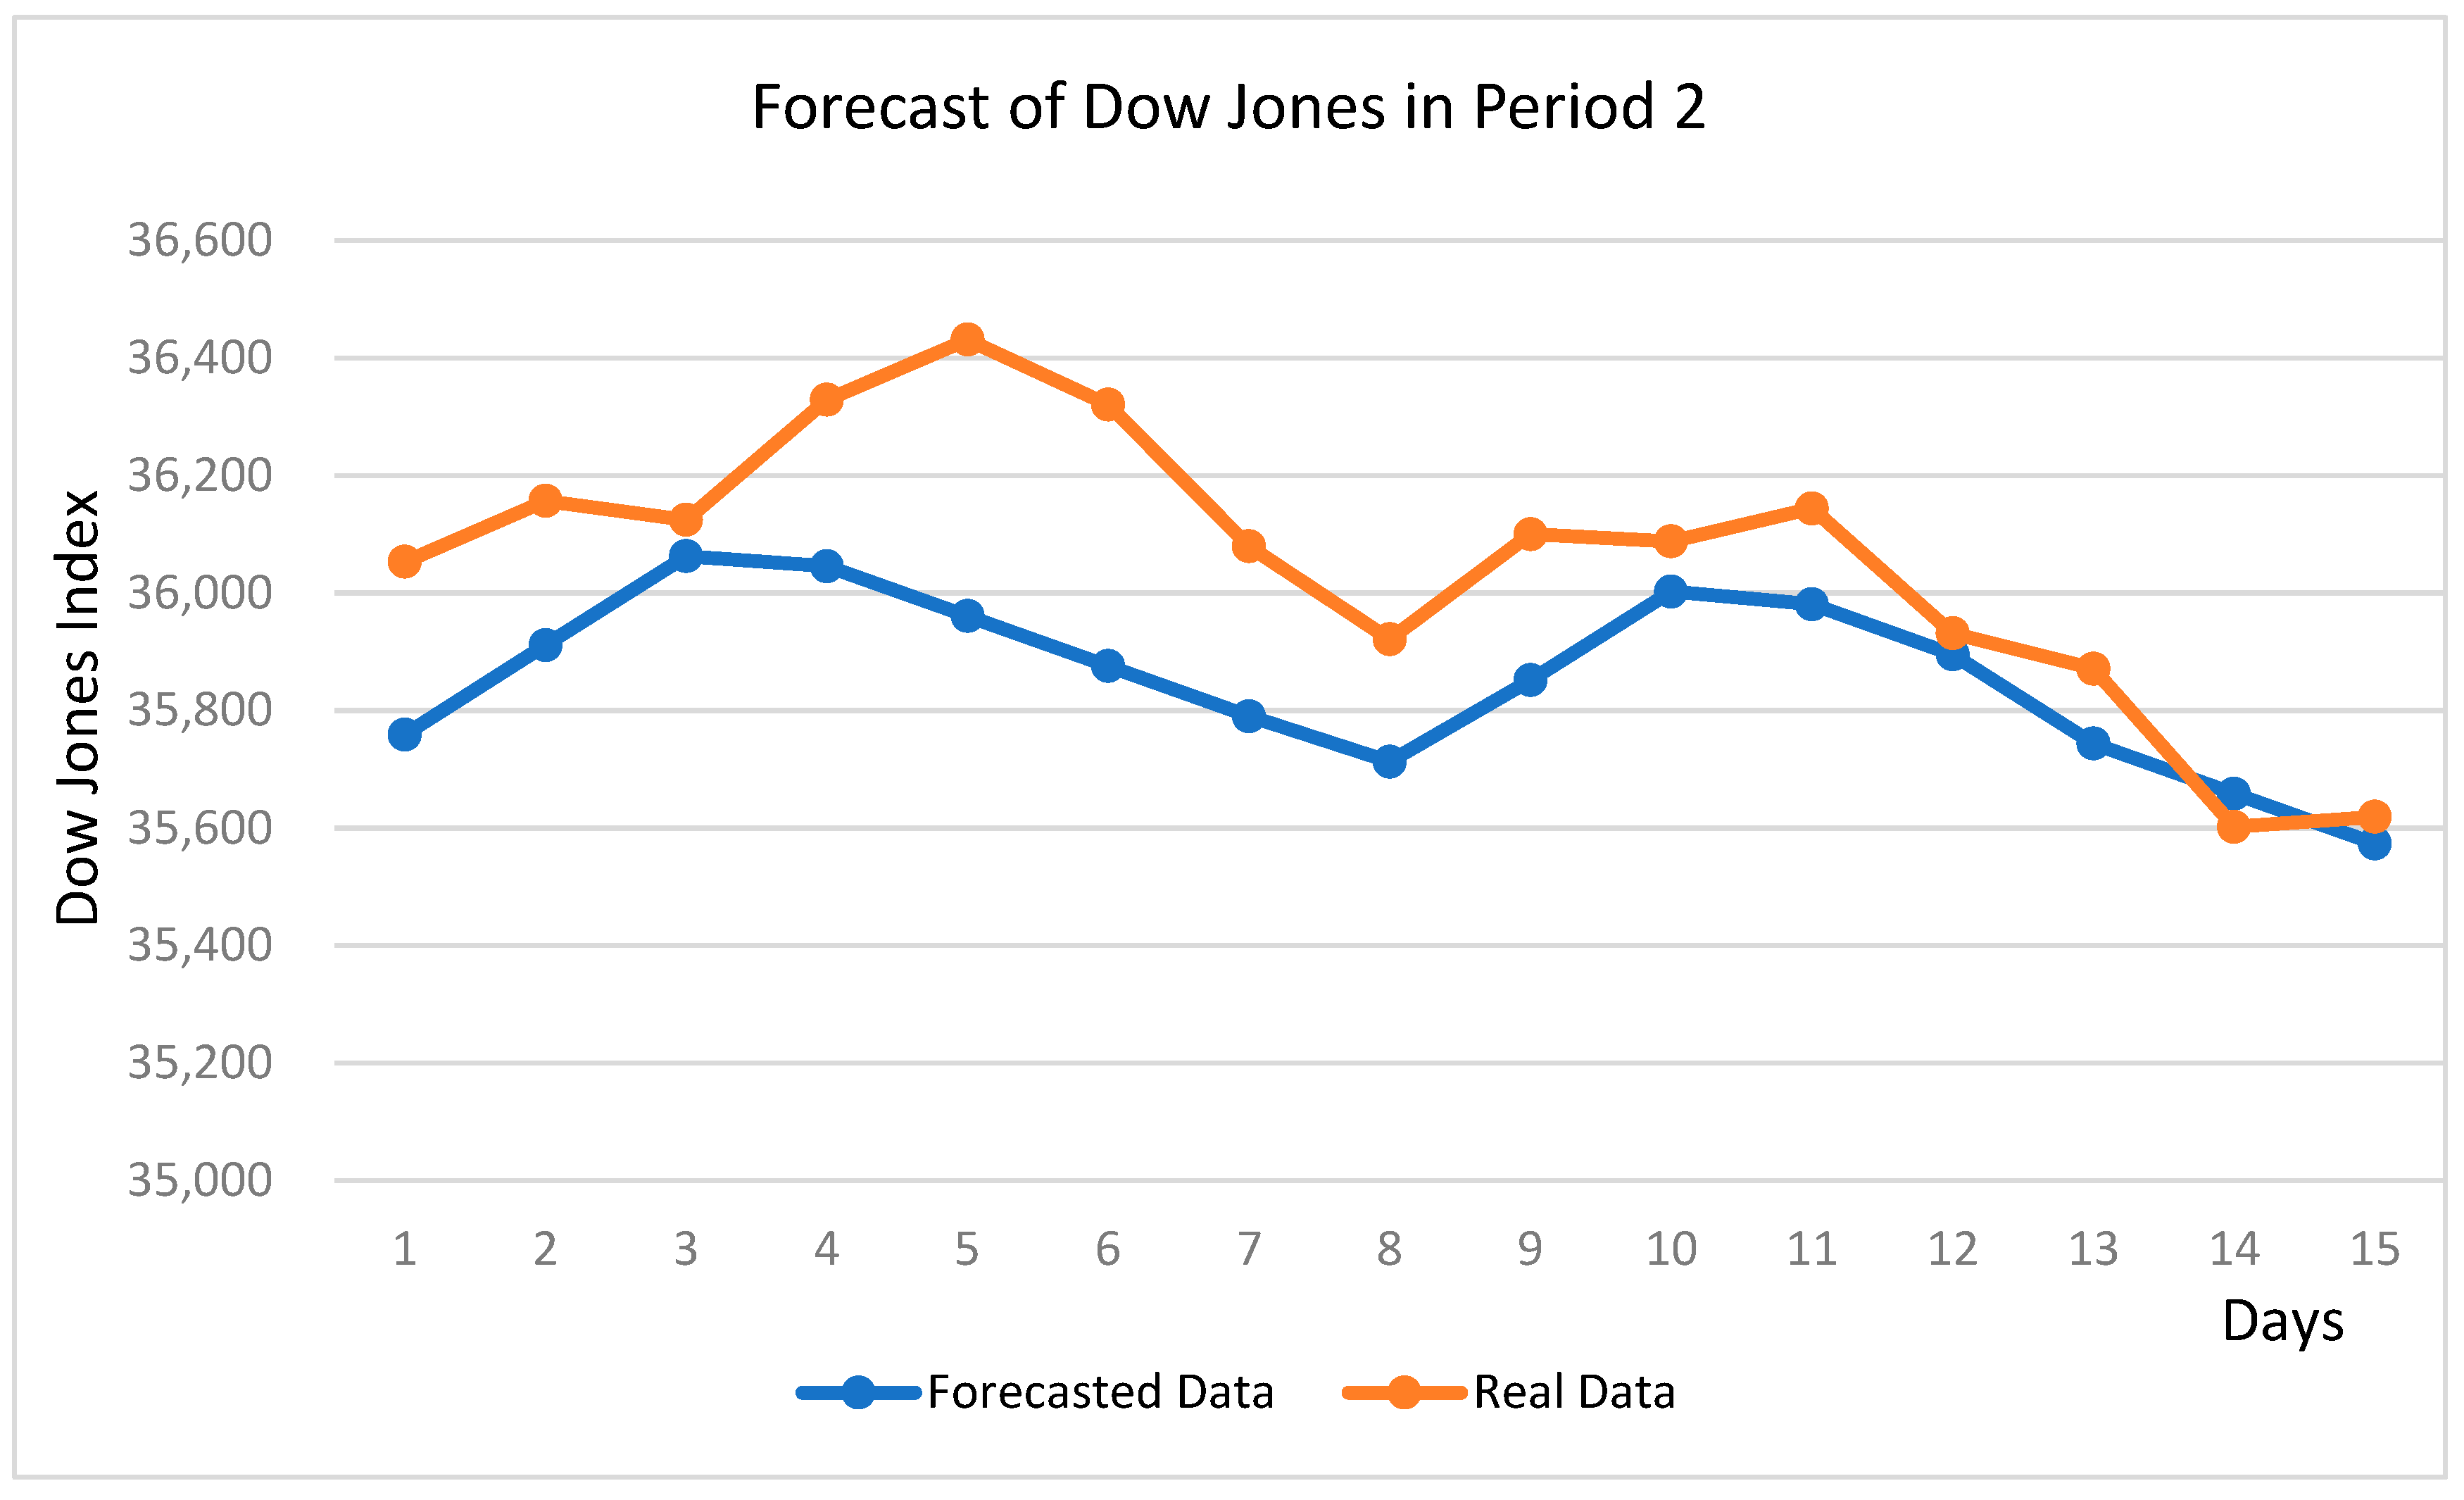
| 35,846.72 | 0.3971 | 42,945,142 | 0.9286 | 35,759.14 | 36,053.09 |
| 35,937.04 | 0.5319 | 42,956,944 | 0.0585 | 35,911.26 | 36,157.02 |
| 36,012.04 | 0.4416 | 42,963,958 | 0.0347 | 36,063.11 | 36,124.66 |
| 36,010.28 | 0.0103 | 43,165,597 | 1.0000 | 36,045.81 | 36,329.07 |
| 36,106.41 | 0.5661 | 43,282,333 | 0.5789 | 35,960.82 | 36,431.39 |
| 36,182.72 | 0.4494 | 43,384,050 | 0.5044 | 35,875.72 | 36,320.50 |
| 36,144.14 | 0.2272 | 43,485,767 | 0.5044 | 35,790.21 | 36,079.54 |
| 36,007.92 | 0.8022 | 43,648,660 | 0.8078 | 35,712.82 | 35,921.24 |
| 35,884.66 | 0.7259 | 43,652,130 | 0.0172 | 35,851.73 | 36,100.37 |
| 35,954.61 | 0.4119 | 43,655,554 | 0.0169 | 36,002.58 | 36,087.98 |
| 35,975.10 | 0.1206 | 43,841,478 | 0.9220 | 35,980.98 | 36,144.13 |
| 36,001.28 | 0.1541 | 43,938,298 | 0.4801 | 35,895.52 | 35,931.52 |
| 35,896.29 | 0.6183 | 44,035,711 | 0.4831 | 35,743.67 | 35,871.34 |
| 35,826.56 | 0.4106 | 44,129,867 | 0.4669 | 35,658.40 | 35,602.18 |
| 35,656.76 | 1.0000 | 44,263,637 | 0.6634 | 35,573.42 | 35,619.26 |
| Dow Jones NN | Inc Dow Jones | COVID NN | Inc COVID | Dow Jones IT3 | Dow Jones Real |
|---|---|---|---|---|---|
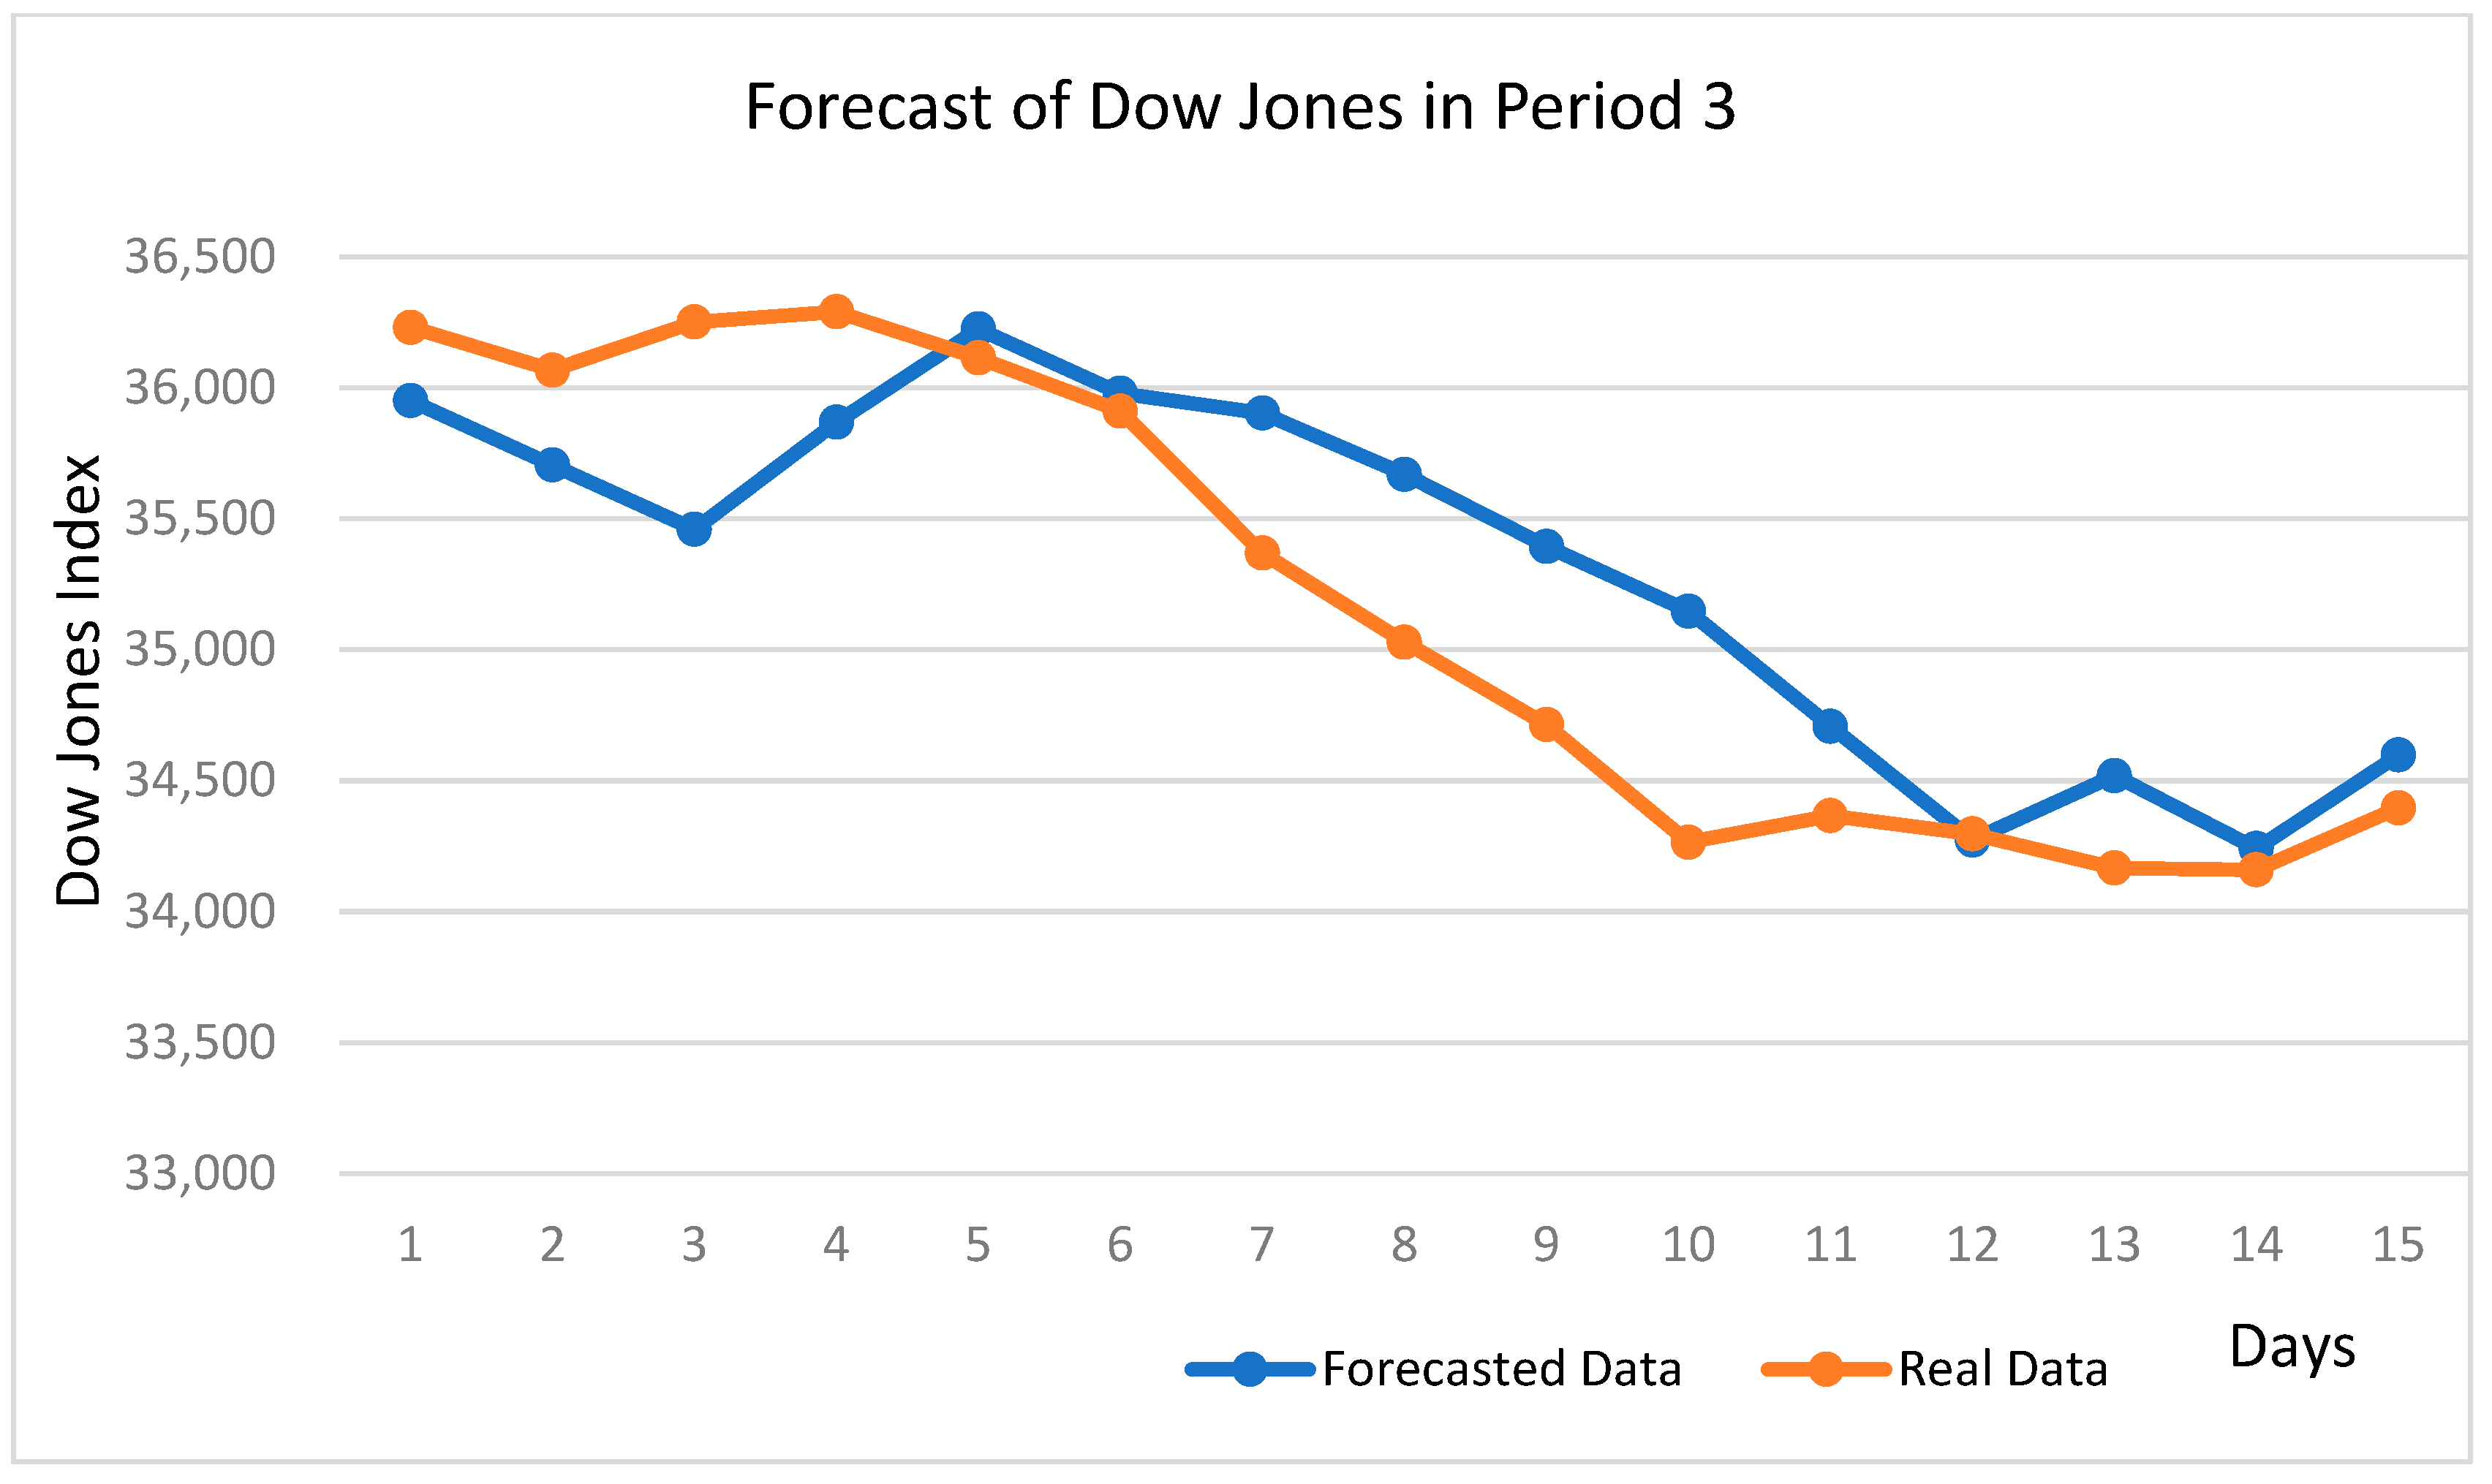
| 35,708.46 | 1.0000 | 61,193,732 | 0.4173 | 35,951.24 | 36,231.53 |
| 35,680.58 | 0.0568 | 61,859,887 | 0.6109 | 35,705.81 | 36,067.75 |
| 35,578.43 | 0.2083 | 62,512,122 | 0.5981 | 35,459.80 | 36,251.7 |
| 35,666.52 | 0.1796 | 62,608,798 | 0.0886 | 35,868.95 | 36,290.71 |
| 35,714.28 | 0.0973 | 62,857,485 | 0.2280 | 36,225.59 | 36,114.94 |
| 35,612.50 | 0.2075 | 63,468,896 | 0.5607 | 35,979.53 | 35,911.28 |
| 35,455.57 | 0.3200 | 64,559,291 | 1.0000 | 35,903.62 | 35,369.39 |
| 35,040.59 | 0.8462 | 65,381,414 | 0.7539 | 35,670.02 | 35,029.17 |
| 34,671.35 | 0.7530 | 65,738,705 | 0.3276 | 35,394.68 | 34,714.14 |
| 34,333.13 | 0.6897 | 66,300,125 | 0.5148 | 35,147.79 | 34,265.50 |
| 33,853.37 | 0.9784 | 66,301,034 | 0.0008 | 34,707.74 | 34,366.67 |
| 33,844.16 | 0.0187 | 66,423,477 | 0.1122 | 34,273.53 | 34,296.74 |
| 33,799.14 | 0.0918 | 67,335,050 | 0.8360 | 34,519.54 | 34,166.84 |
| 33,656.33 | 0.2912 | 67,698,546 | 0.3333 | 34,241.95 | 34,160.51 |
| 33,617.53 | 0.0791 | 68,105,464 | 0.3731 | 34,598.59 | 34,396.39 |
| Period 1 | Period 2 | Period 3 | |||||||
|---|---|---|---|---|---|---|---|---|---|
| Day | Forecast λ = 0.9 ℓ = 0.2 | Forecast λ = 0.8 ℓ = 0.3 | Real Values of Period 1 | Forecast λ = 0.9 ℓ = 0.2 | Forecast λ = 0.8 ℓ = 0.3 | Real Values of Period 2 | Forecast λ = 0.9 ℓ = 0.2 | Forecast λ = 0.8 ℓ = 0.3 | Real Values of Period 3 |
| 1 | 34,948.49 | 34,951.46 | 34,421.93 | 35,759.14 | 35,759.92 | 36,053.09 | 35,951.24 | 35,951.78 | 36,231.53 |
| 2 | 35,536.12 | 35,537.21 | 34,870.16 | 35,911.26 | 35,912.87 | 36,157.02 | 35,705.81 | 35,706.35 | 36,067.75 |
| 3 | 35,113.13 | 35,113.78 | 34,996.18 | 36,063.11 | 36,065.49 | 36,124.66 | 35,459.80 | 35,460.24 | 36,251.70 |
| 4 | 34,697.25 | 34,698.92 | 34,888.79 | 36,045.81 | 36,048.92 | 36,329.07 | 35,868.95 | 35,872.34 | 36,290.71 |
| 5 | 35,257.75 | 35,275.60 | 34,933.23 | 35,960.82 | 35,963.95 | 36,431.39 | 36,225.59 | 36,238.39 | 36,114.94 |
| 6 | 34,894.75 | 34,912.66 | 34,987.02 | 35,875.72 | 35,878.85 | 36,320.50 | 35,979.53 | 35,992.23 | 35,911.28 |
| 7 | 34,247.86 | 34,262.80 | 34,687.85 | 35,790.21 | 35,793.29 | 36,079.54 | 35,903.62 | 35,918.28 | 35,369.39 |
| 8 | 33,628.03 | 33,640.26 | 33,962.04 | 35,712.82 | 35,716.08 | 35,921.24 | 35,670.02 | 35,684.29 | 35,029.17 |
| 9 | 33,999.74 | 34,010.26 | 34,511.99 | 35,851.73 | 35,854.36 | 36,100.37 | 35,394.68 | 35,409.05 | 34,714.14 |
| 10 | 34,436.44 | 34,449.64 | 34,798.00 | 36,002.58 | 36,005.85 | 36,087.98 | 35,147.79 | 35,161.91 | 34,265.50 |
| 11 | 34,820.19 | 34,831.28 | 34,823.35 | 35,980.98 | 35,985.07 | 36,144.13 | 34,707.74 | 34,719.66 | 34,366.67 |
| 12 | 34,439.27 | 34,452.54 | 35,061.55 | 35,895.52 | 35,899.73 | 35,931.52 | 34,273.53 | 34,282.26 | 34,296.74 |
| 13 | 34,862.25 | 34,875.96 | 35,144.31 | 35,743.67 | 35,747.12 | 35,871.34 | 34,519.54 | 34,528.37 | 34,166.84 |
| 14 | 35,488.40 | 35,504.43 | 35,058.52 | 35,658.40 | 35,661.95 | 35,602.18 | 34,241.95 | 34,251.03 | 34,160.51 |
| 15 | 34,927.89 | 34,927.75 | 34,930.93 | 35,573.42 | 35,576.98 | 35,619.26 | 34,598.59 | 34,617.08 | 34,396.39 |
Publisher’s Note: MDPI stays neutral with regard to jurisdictional claims in published maps and institutional affiliations. |
© 2022 by the authors. Licensee MDPI, Basel, Switzerland. This article is an open access article distributed under the terms and conditions of the Creative Commons Attribution (CC BY) license (https://creativecommons.org/licenses/by/4.0/).
Share and Cite
Castillo, O.; Castro, J.R.; Melin, P. Interval Type-3 Fuzzy Aggregation of Neural Networks for Multiple Time Series Prediction: The Case of Financial Forecasting. Axioms 2022, 11, 251. https://doi.org/10.3390/axioms11060251
Castillo O, Castro JR, Melin P. Interval Type-3 Fuzzy Aggregation of Neural Networks for Multiple Time Series Prediction: The Case of Financial Forecasting. Axioms. 2022; 11(6):251. https://doi.org/10.3390/axioms11060251
Chicago/Turabian StyleCastillo, Oscar, Juan R. Castro, and Patricia Melin. 2022. "Interval Type-3 Fuzzy Aggregation of Neural Networks for Multiple Time Series Prediction: The Case of Financial Forecasting" Axioms 11, no. 6: 251. https://doi.org/10.3390/axioms11060251
APA StyleCastillo, O., Castro, J. R., & Melin, P. (2022). Interval Type-3 Fuzzy Aggregation of Neural Networks for Multiple Time Series Prediction: The Case of Financial Forecasting. Axioms, 11(6), 251. https://doi.org/10.3390/axioms11060251