1. Introduction
Emotion analysis aims to recognize and analyze the emotions behind massive human behavior data such as text, pictures, movies, and music [
1,
2,
3]. With the rapid development of Internet-based social media, text-based emotion classification shows promising application prospects in many emerging artificial intelligence fields such as public opinion analysis, commodity recommendation, and business decision making [
4]. In recent years, the text-oriented emotion classification model has become a research hotspot in the field of natural language processing and machine learning [
5].
Many traditional emotion classification models adopt the multi-label learning paradigm and assume that an example is associated with some emotion labels. On this technical line, many scholars have proposed various effective works to solve the problem of emotion recognition. Multi-label learning can deal with multi-emotion recognition tasks, but it cannot quantitatively model a variety of emotions with different expression intensities [
6]. To solve this problem, Zhou et al. proposed emotion distribution learning (EDL) [
7] motived by label distribution learning (LDL) [
6]. Different from the traditional emotion classification model, EDL associates an emotion distribution vector with each example (e.g., facial image or text sentence). The emotion distribution vector records the expression degree of a given example of each emotion label, and its dimension is the number of all emotions. In recent years, many EDL research works have been published in top conferences and journals in the field of machine learning. For example, Yang et al. proposed a circular-structured representation for visual emotion distribution learning by exploiting the intrinsic relationship between emotions based on psychological models [
8]. Xu and Wang proposed a method for learning emotion distribution based on an attention mechanism in 2021, using an emotional graph-based network to explore the correlation between various regions in the image and emotion distribution [
9]. Fei et al. proposed a latent emotional memory network that can learn latent emotional distributions without external knowledge, and the model has been used well for classification tasks [
10]. Zhao et al. proposed a small sample text EDL model of the meta-learning method [
11]; Jia et al. proposed a facial EDL method using local low-rank label correlation [
12]; Pang et al. proposed a basic model of an acceleration algorithm to predict the emotion distribution of unlabeled files [
13]. These EDL methods can effectively record the intensity of examples of different emotion labels and show better performance than the traditional emotion classification model. However, most of the existing EDL methods do not introduce the unique affective word information containing prior emotion knowledge into the prediction model.
Affective words are words with different emotional tendencies [
14], which have generally been manually labeled based on emotional linguistic knowledge. Different affective words are usually used to describe different emotional characteristics, and different combinations of affective words can also express different emotional tendencies. At present, some scholars have used affective word information in the field of emotion analysis. Teng et al. showed that affective words have a significant effect in predicting emotion in 2016 [
14]. Zhang et al. proposed lexicon-based emotion distribution label enhancement (LLE) in 2018 [
15]. Tong et al. annotated affective words manually and used them for emotion analysis [
16]. These studies show that affective words can significantly improve the performance of the emotion analysis model. However, so far, there is no EDL method to use affective word information for emotion distribution prediction.
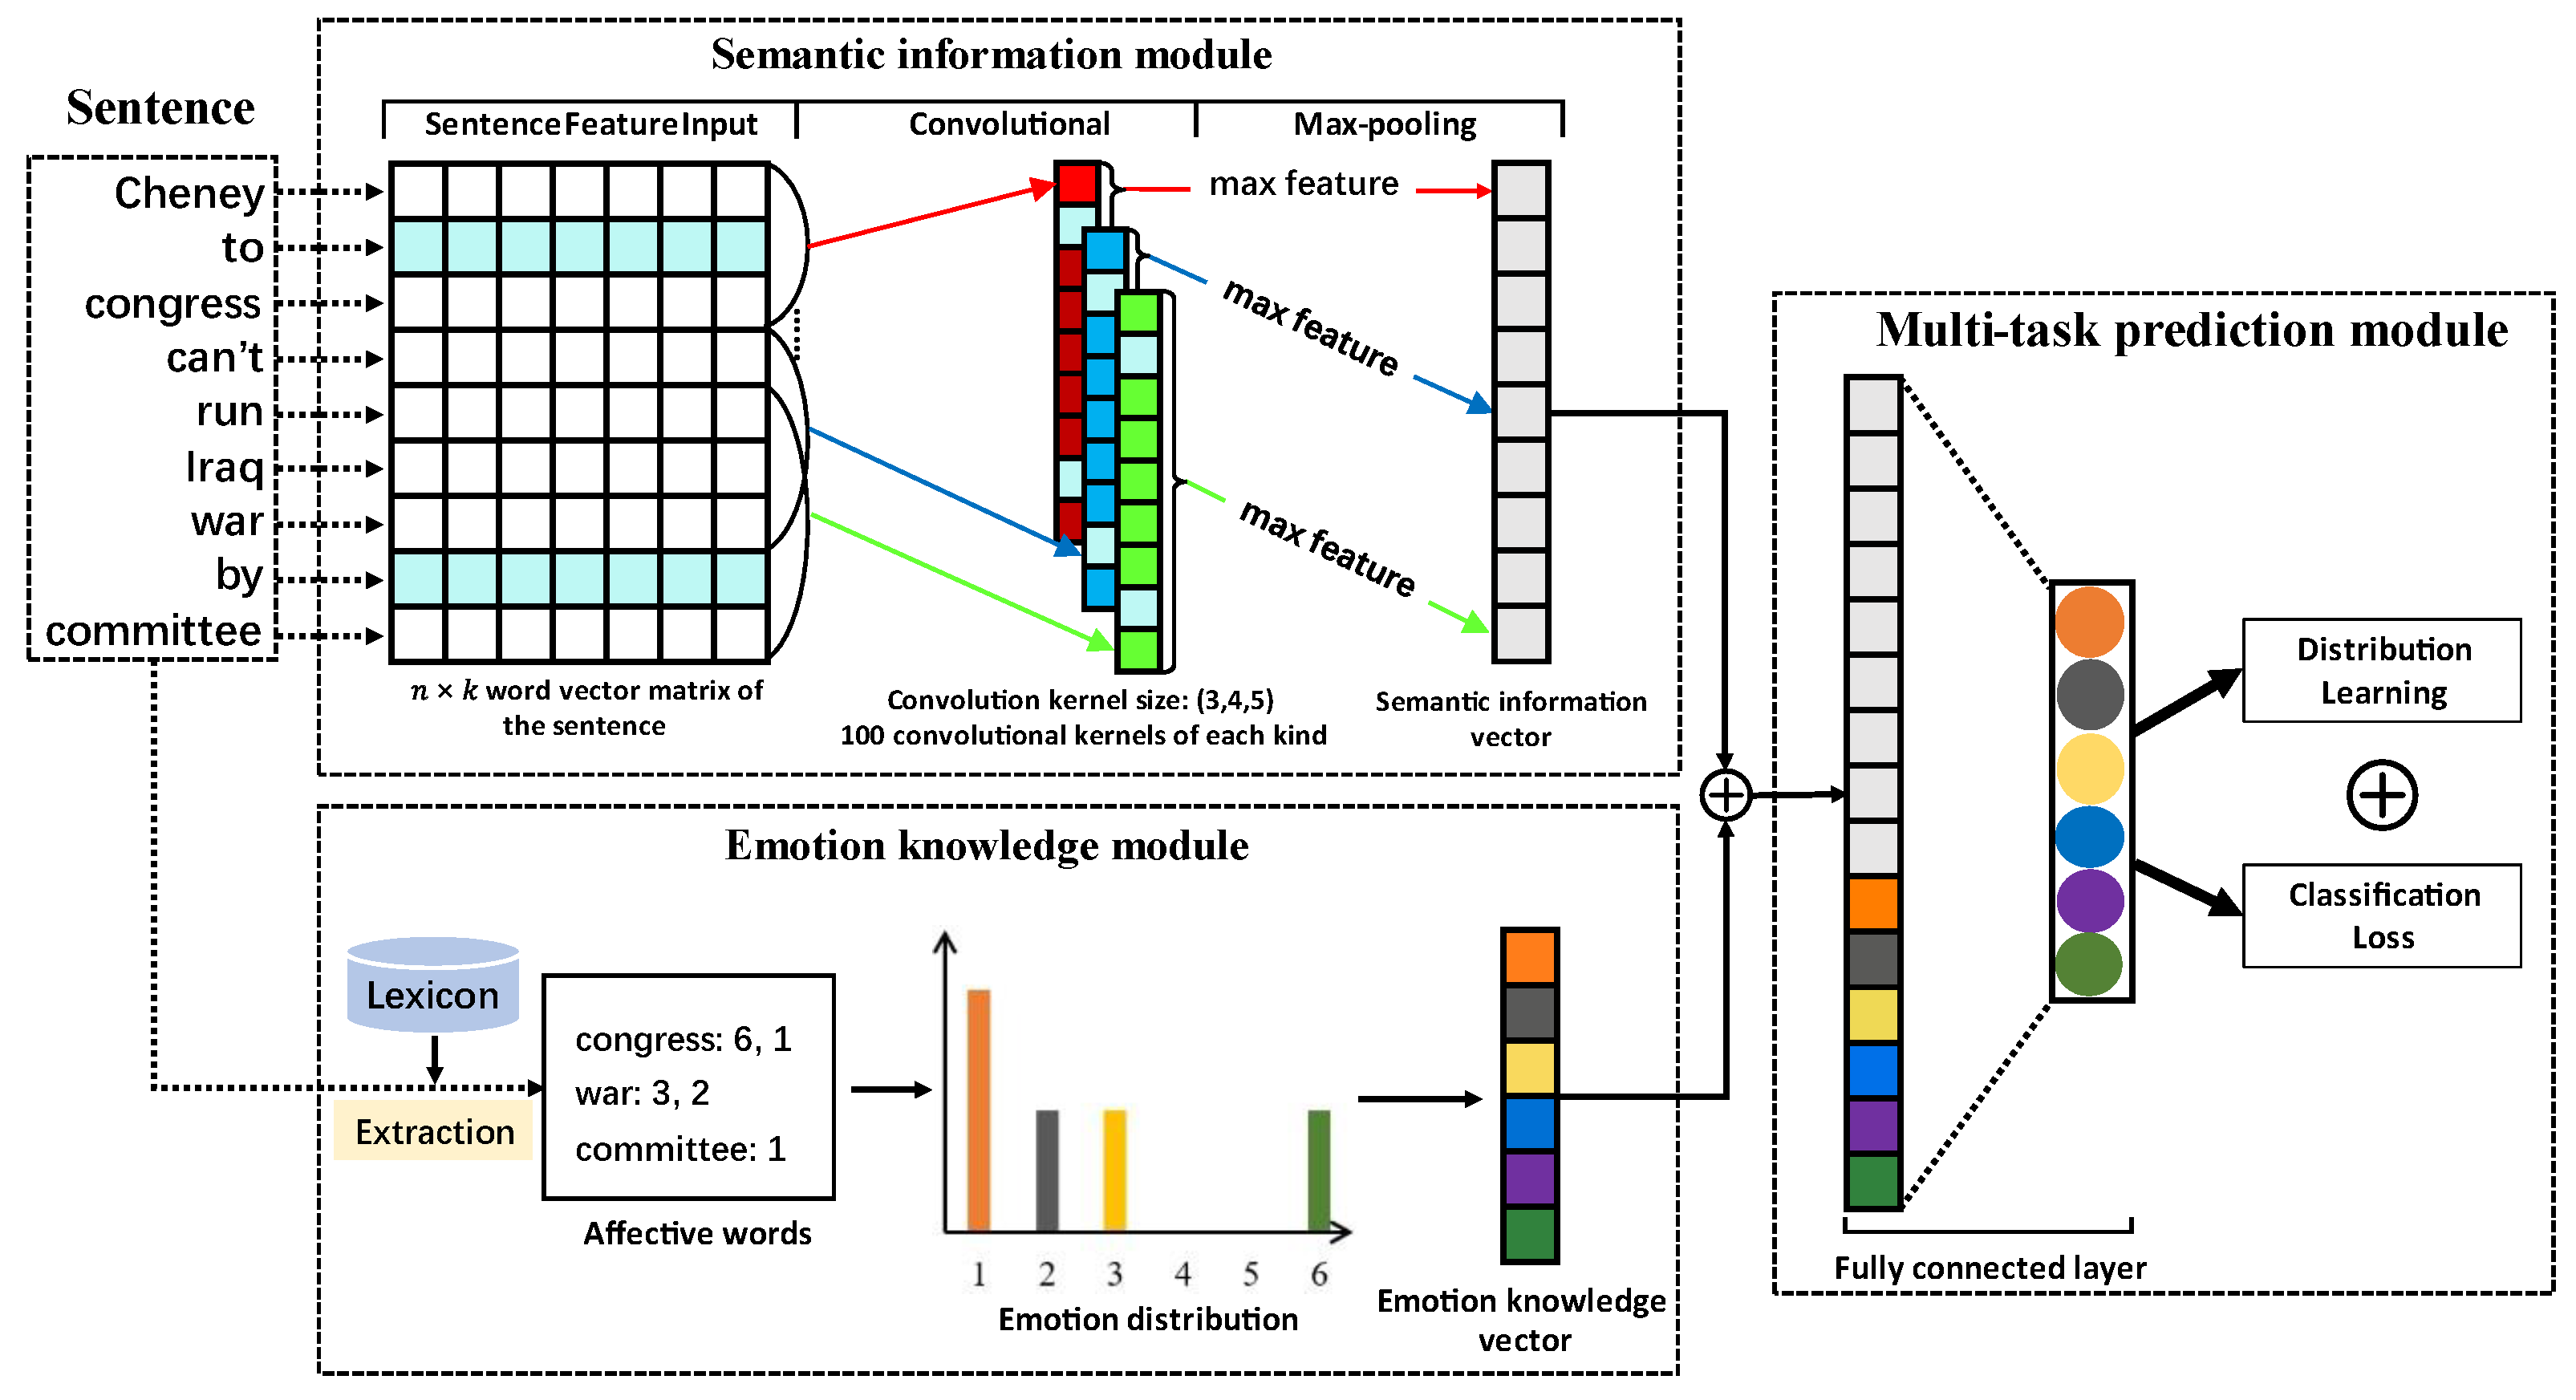
To address this problem, we propose a text emotion distribution learning model based on a lexicon-enhanced multi-task convolutional neural network (LMT-CNN). The overall architecture of the LMT-CNN model has three major modules: semantic information, emotion knowledge, and multi-task prediction. The semantic information module uses the sliding window convolution neural network to extract the semantic information of the text from the word embedding space of the input text. Based on the affective words extracted from the text, the emotion knowledge module uses the lexicon to introduce the corresponding emotional prior knowledge to synthesize an emotion knowledge vector. The input of the multi-task prediction module is constructed from the outputs of the first two modules. Then, the final emotion distribution is predicted through a full connection layer. The two prediction tasks of the emotion distribution output layer are emotion distribution prediction based on Kullback–Leibler (KL) loss [
17] and emotion classification based on cross-entropy loss. The emotion with the highest score in the emotion distribution output layer is used as the dominant emotion output for emotion classification. The existing EDL research work shows that the multi-task convolution neural network model combined with KL loss and cross-entropy loss can achieve better performance by simultaneously training emotion distribution prediction and emotion classification tasks in an end-to-end manner [
15].
Different from the existing EDL work based on neural networks, the proposed LMT-CNN method considers the linguistic prior knowledge of affective words unique to the text mining task and combines it with text-based semantic information to construct an end-to-end deep neural network. We evaluated the LMT-CNN method on the English emotion distribution dataset Semeval [
18], Chinese emotion distribution dataset Ren-CECps [
19], four English single-label emotion datasets (Fairy Tales [
20], TEC [
21], CBET, ISEAR [
22], and Affect in Tweets [
23]), and Chinese single-label emotion datasets NLP&CC 2013 and NLP&CC 2014 [
24], comparing LMT-CNN methods with multiple baseline methods. Compared with the baseline methods, our LMT-CNN method achieved the best performance in almost all measurements.
The rest of the paper is organized as follows. First,
Section 2 briefly reviews some related works. Then,
Section 3 describes the proposed lexicon-enhanced multi-task convolutional neural network for emotion distribution learning.
Section 4 describes in detail the datasets used for the experiments, experimental setup, and experimental results and analysis.
Section 5 mainly discusses the limitations of our proposed method. Finally,
Section 6 concludes the entire paper and provides an outlook on future work.
2. Related Work
Emotions are ubiquitous in our daily life and play an important role in our lives, influencing our decisions and judgments. For a long time, people have expected a variety of ways to recognize the diverse emotions that humans generate. Many researchers have proposed a variety of algorithms aiming at making machines that have emotional intelligence through artificial intelligence algorithms, meaning machines that have the ability to recognize, interpret, and process emotions. For this reason, machines should first learn to recognize human emotions from their external and implicit emotional cues.
Emotion models are the basis of emotion recognition systems, which define the expression of emotions. To measure emotions quantitatively, psychologists considered that emotions exist in multiple states and therefore proposed various emotion models to distinguish different emotional states. Two of the most prominent emotion representation models are the categorical emotional state (CES) and the dimensional emotional space (DES) [
25]. CES classifies emotions into different basic categories and considers each type of basic emotion independent. Among the popular CES models are binary emotions [
26], Ekman’s six emotions [
27], and Plutchik’s eight emotions [
28]. Binary emotions contain positive, negative, and sometimes neutral emotions. In this case, “emotion” is often referred to as “sentiment”. In the Paul Ekman model, emotions are independent and can be distinguished into six basic categories depending on how they are perceived by the experiencer. These basic emotions are joy, sadness, anger, disgust, surprise, and fear. Plutchik’s eight emotions consist of amusement, anger, awe, contentment, disgust, excitement, fear, and sadness. The DES model assumes that emotions do not exist independently of each other and that there are interactions between emotions. Therefore, some scholars consider locating emotions in a multidimensional space, such as valence–arousal–dominance (VAD) [
29]. In our work, Ekman’s six emotions were used as the target emotion label set.
Early work in emotion recognition focused on combining machine learning methods to learn emotional features to recognize the emotions embedded in text, speech, or images. Examples include the methods of Naive Bayes, maximum entropy, and support vector machines [
30]. Later, Vrysis et al. proposed a method for emotion recognition combined with lexicon-based and rule-based algorithms [
31]. The lexicon-based approach relies on the semantic direction of the text with the polarity of the words and phrases appearing in it [
32]. Rule-based algorithms design extraction rules based on syntactic dependencies [
33], which need to be used within the controllable range of the rules and may lead to incorrect emotion judgments if they are beyond the range of the rules. We believe that the performance of this approach largely depends on the quality of the lexicon and the number and quality of the rules formulated. It is more suitable when the data are lacking, and there is a performance bottleneck when dealing with large-scale data, combined with the fact that now the path of the method based on deep learning language models is more attractive in the field of emotion classification [
34].
Deep learning changes in feature engineering and feature learning both make problem solving easier. Traditionally, the efficiency of machine learning algorithms is highly dependent on how well the input data are represented. For this reason, feature engineering has been the most critical step in the machine learning workflow. In contrast, deep learning algorithms can automate feature extraction, which allows researchers to extract features with minimal domain knowledge and manpower. Another transformative aspect of deep learning is that models can learn all representation layers together at the same time. Through common feature learning, once the model modifies an internal feature, all other features that depend on that feature will automatically adapt accordingly without human intervention.
With the wide application of deep learning in the field of emotion recognition, various effective methods have been proposed by many scholars around the world. For example, Franzoni et al. proposed a semantic model for emotion recognition (SEMO), which can quickly extract the basic emotions hidden in short, emotion-rich sentences [
35]. Dashtipour et al. proposed a novel context-aware multimodal framework for multimodal emotion analysis, which simultaneously uses text, speech, and visual cues to determine emotion [
36]. Rahman et al. proposed a multimodal adaptation gate (MAG) as an attachment to BERT and XLNet which achieves human-level multimodal emotion analysis performance [
37]. In recent years, emotion recognition methods have also been applied to social services [
38] and opinion detection [
39]. For example, Kydros et al. analyzed tweets from Twitter during the time of the coronavirus outbreak that helped government agencies develop effective strategies by understanding people’s emotions [
38]. Zou et al. designed an emotion analysis method that combines emojis and other emoticons with short texts to capture the deep value of public opinion and help companies optimize their services [
40].
The traditional text emotion analysis model mainly classifies the polar emotion of the text, that is, to judge the positive and negative polarity of emotion. However, the polar emotion classification model cannot capture the fine-grained emotions contained in the text and can only be used in simple emotion analysis scenarios. Different from the traditional polar emotion analysis task, the goal of fine-grained emotion analysis is to identify fine-grained emotions in the text [
41], such as anger, disgust, sadness, surprise, fear, and joy. The classical fine-grained emotion analysis model is generally modeled by single-label learning or multi-label learning. It is assumed that the example is associated with one or more emotion labels [
6].
The classical multi-label learning model can handle many emotion recognition tasks, but its modeling ability is still insufficient to quantitatively answer the expression degree of each emotion label in the text [
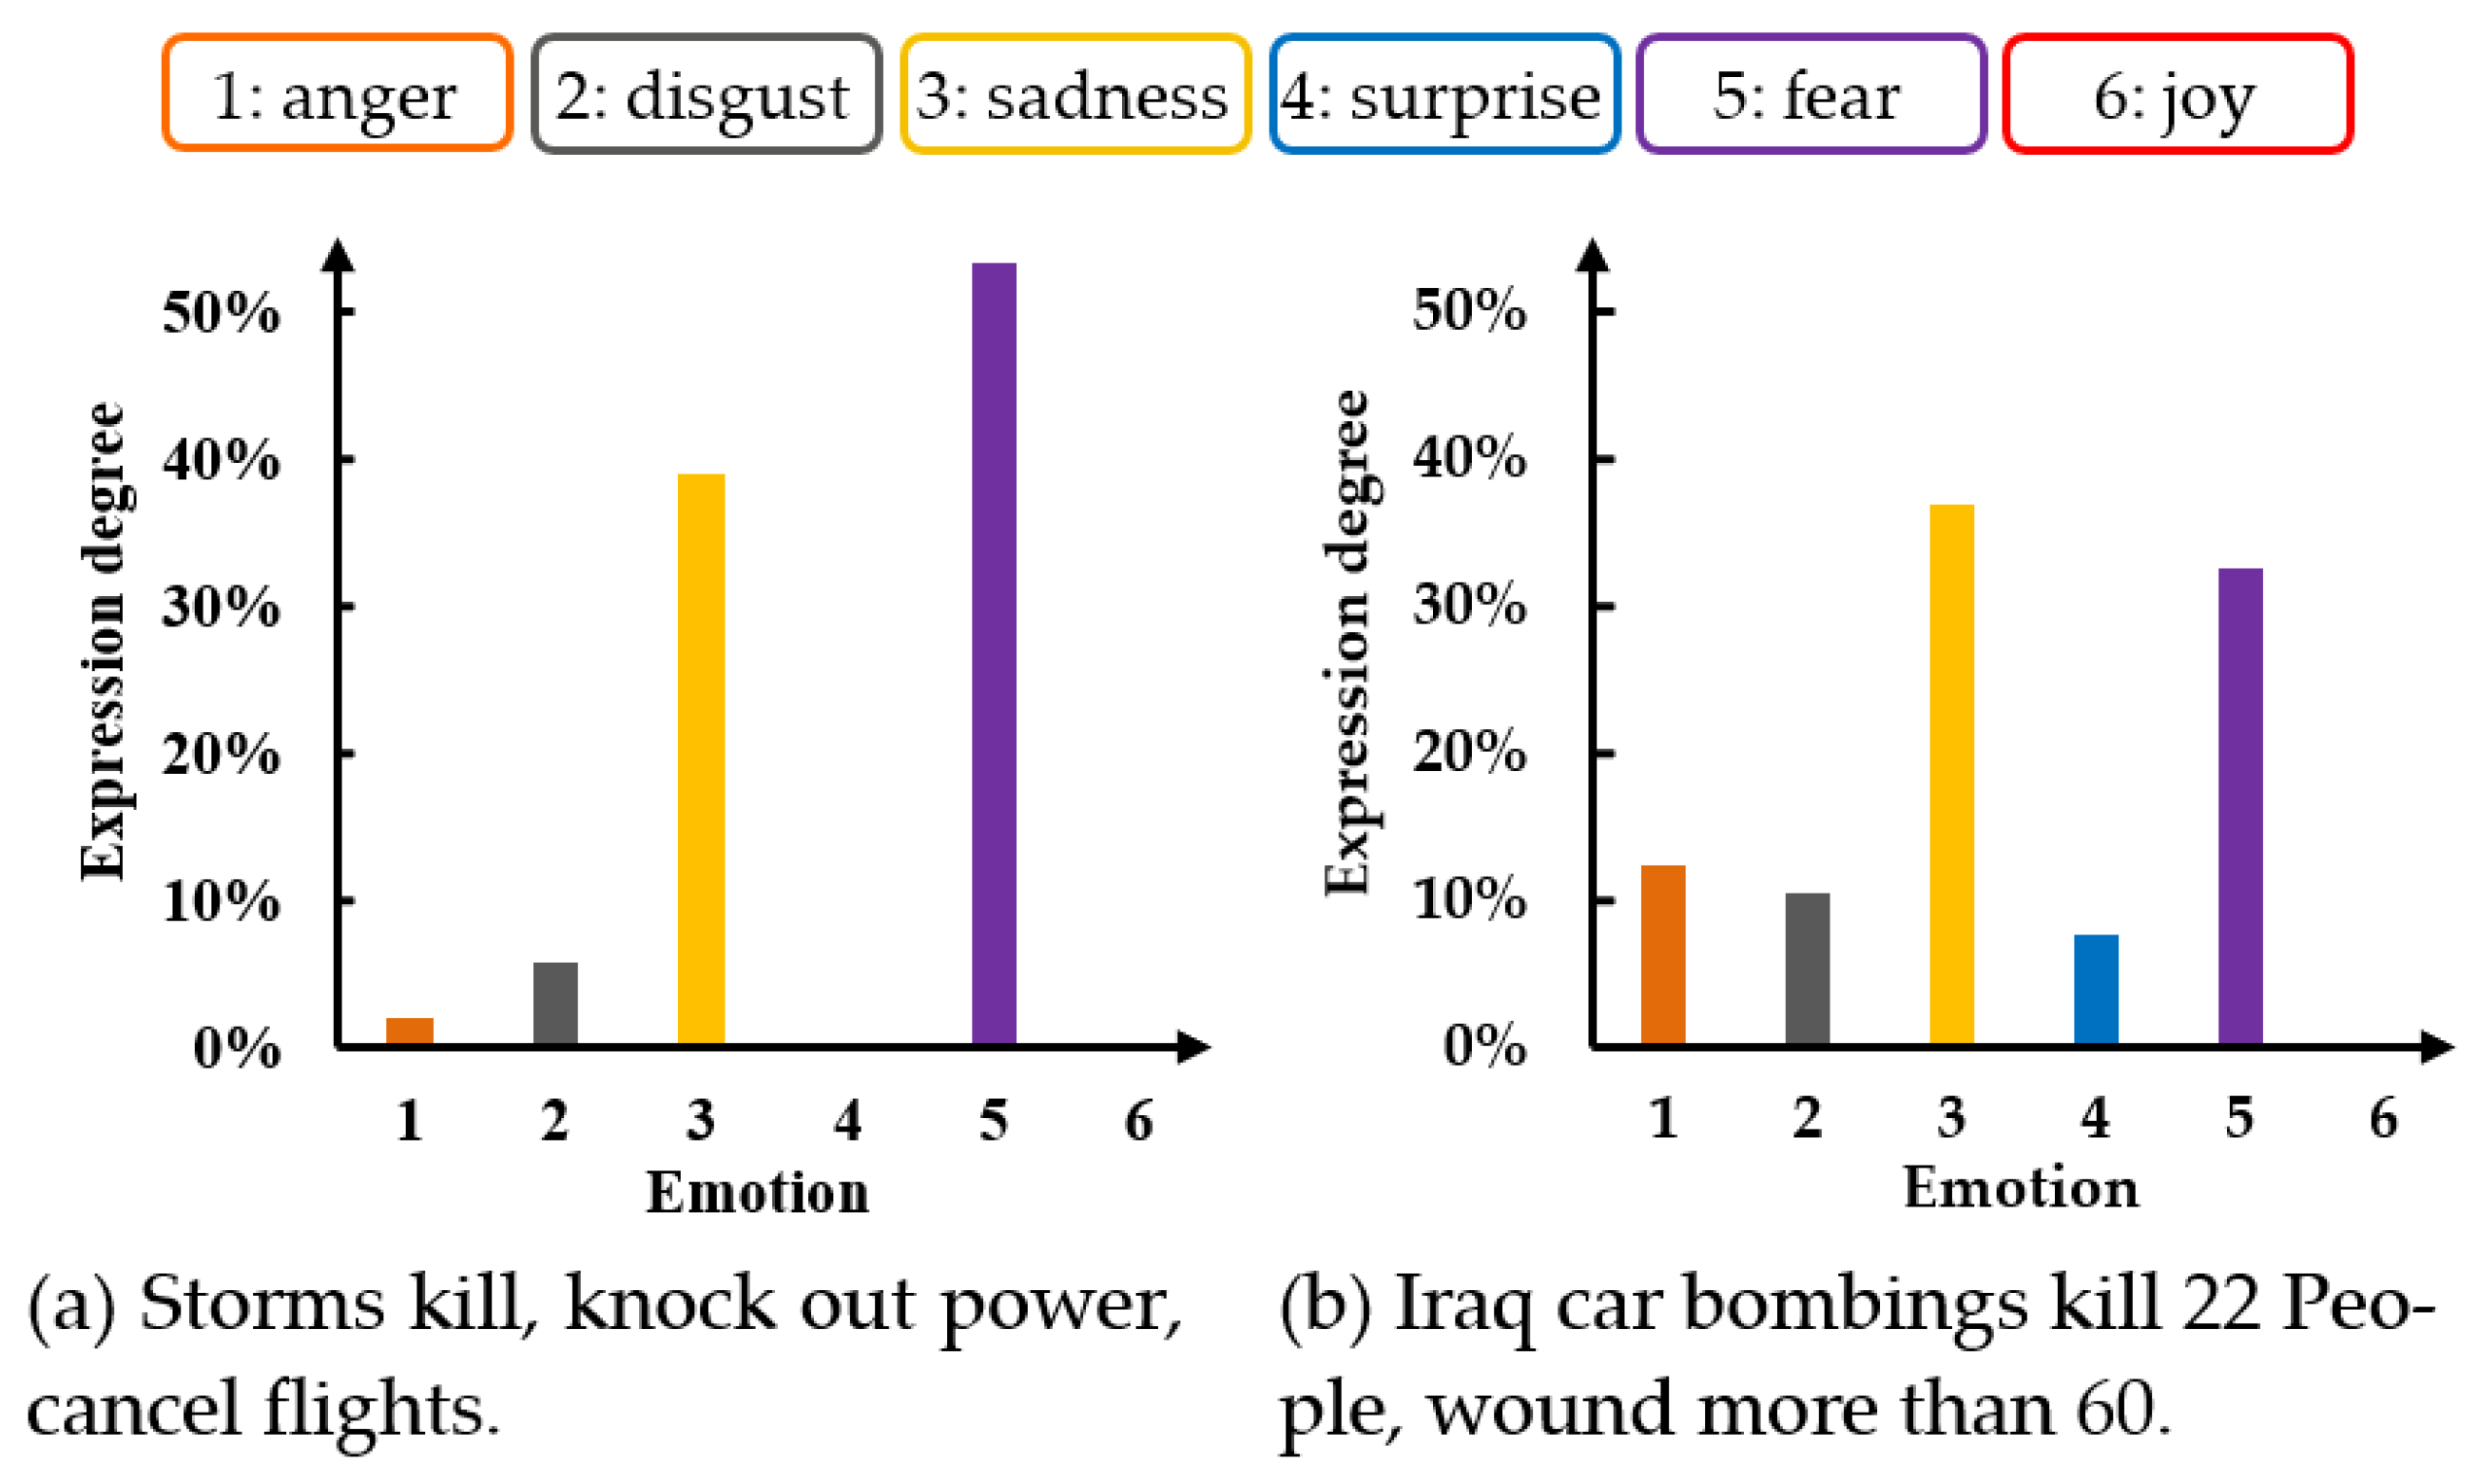
7]. In practical application, it is very common for a sentence to express multiple emotions at the same time. For example, the sentences in the commonly used Semeval text emotion dataset mark the expression degree of six fine-grained basic emotions [
19]. As shown in
Figure 1, fear is the main emotion of
Figure 1a sentence, and the degree of expression is 53.2%. The expression of secondary emotion sadness is 39%. The fine-grained basic emotion labeling of
Figure 1b sentence is similar to that of
Figure 1a sentence.
Aiming to quantitatively deal with the situation that a sentence expresses different degrees of fine-grained emotions at the same time, Zhou et al. proposed emotion distribution learning (EDL) for the task of text emotion analysis [
7]. EDL believes that the emotion of each sentence is a mixture of basic emotions with different expression intensities, and the goal of modeling is to transform the sentence
maps to an emotional distribution
, where
represents a finite set of emotion labels in a sentence,
N is the number of emotion label classes, and
is each element of emotional distribution that denotes sentence
expression degree of class j emotion label,
and
. The EDL method assigns a distribution to each instance, and the strength of the probability distribution of each label indirectly indicates the relative importance of the corresponding label. To output emotion labels based on the emotion distribution, it is natural to consider one or more of the top-ranked emotions as the correct emotion label. Since the emotion classification datasets selected for the experiments in this paper are all multi-class datasets (each sample has only one emotion label in several possible classes), we assume that there is only one correct emotion label in a sample for simplicity of processing.
Emotion distribution learning can effectively deal with the problem that a sentence expresses multiple emotions with different intensities at the same time. It is more suitable for emotion analysis tasks with emotion fuzziness than the traditional emotion analysis model. In recent years, many scholars have put forward many effective works in the field of EDL [
7,
13,
14,
42,
43,
44]. For example, Zhou et al. proposed an EDL method based on the Plutchik’s wheel of emotions in 2016 [
7]; Zheng et al. proposed an EDL method using local correlation of samples in 2018 [
42]; Batbaatar et al. proposed a semantic emotion neural network in 2019 [
43]; Qin et al. proposed a constrained optimization method for cross-domain EDL in 2021 [
44]. However, most of the existing EDL work only focuses on the semantic information or emotional wheel information, ignoring the prior knowledge of affective words in the text.
Affective words are words that express emotional tendencies in the text. Generally, they have been labeled with artificial emotion. The extraction and discrimination of affective words is the basic work of word-level emotion analysis and the basis of text emotion analysis. Relevant work has shown that emotion prior knowledge is very effective for emotion recognition tasks [
14]. Scholars have proposed a variety of emotion recognition methods based on the lexicon. The general process of these methods is to extract affective words from the text based on the lexicon and then use the emotion labels of affective words to predict the emotion of the text. For example, Wang proposed a multi-constraint emotion classification model based on a lexicon in 2015 [
45]; Zhang et al. proposed lexicon-based emotion distribution label enhancement (LLE) in 2018 [
15]; Abdi et al. proposed a multi-feature fusion evaluation model based on deep learning for text emotion classification in 2019 [
46]; Ke et al. proposed a new language expression model in 2020, which introduces part-of-speech tagging and affective word language knowledge into the training model [
47]. These studies showed that using affective words in emotion recognition tasks can significantly improve the performance of the emotion analysis model, but most existing EDL methods do not consider the affective word information of a text. Compared with the existing EDL method, the LMT-CNN model proposed in this paper considers the prior knowledge of affective word linguistics specific to text mining tasks. According to the emotional category and number of affective words in the text, the emotional knowledge vector is generated, and the semantics information and emotional word knowledge are combined. KL loss and cross-entropy loss are combined to simultaneously learn emotion distribution prediction and emotion classification tasks in an end-to-end manner.
3. Text Emotion Distribution Learning Based on Lexicon-Enhanced Multi-Task Convolutional Neural Network
In order to improve the performance of the text emotion distribution learning model based on a deep network, this paper proposes a lexicon-enhanced multi-task convolutional neural network (LMT-CNN). The network structure of the LMT-CNN model includes three modules: semantic information module, emotion knowledge module, and multi-task prediction module. The specific network structure is shown in
Figure 2.
3.1. Semantic Information Module
The semantic information module is a convolution neural network (CNN) built on word embedding for extracting semantic information from text. The CNN model was originally created in the domain of image recognition and classification, and its recent application in NLP has proven to be successful with excellent results [
15]. Another competitive approach for semantic extraction is the long short-term memory (LSTM) network, which has been shown to have a good ability to learn sequential data [
36]. LSTM controls the transmission state by gating the states, stores information that needs to be remembered for a long time, and forgets unimportant information. To the best of our knowledge, there is no evidence to prove which approach is definitely better for emotion recognition. However, because of the many contents introduced, LSTM leads to more parameters and makes the training more time-consuming. Since our aim was to verify the influence of prior knowledge of affective words on the model, we did not want to involve unnecessarily complex computations. Hence, we followed the previous successful EDL work by Zhang et al. [
15] and used CNN to extract semantic information.
The semantic information module is composed of the input layer, convolution layer, and max-pooling layer. The specific workflow is as follows: Firstly, each sentence of the text dataset is used as the input of the module. Then, each word is transformed into a word embedding based on the pretrained word embedding model. Finally, the word embedding matrix representing the original sentence is processed by the convolution layer and max-pool layer to output a semantic information vector.
We use , which represents the training text dataset, where is the number of sentences in the dataset, is the i-th sentence, represents for sentence corresponding emotion distribution, is a finite set of emotion labels, and N is the number of emotion labels. Next, we specifically describe the functions of the input layer, convolution layer, and max-pooling layer of this module.
Input Layer: The length of the input sentence is
, and
is the
k-dimensional word2vec word embedding representation of the
-th word in the sentence. In this way, the input sentence is represented as a
word embedding matrix
as
where ⊕ is the concatenation operator. Note that, if the sentence length is less than
, the end of the word embedding matrix is filled with 0.
Convolution layer: A set of filters
with a sliding window size of
are adopted to generate new features. The width of the filter is the same as the width of the word embedding matrix, and thus the filter can only move in the height direction to conduct the convolution on several adjacent words. For example, set
denotes the concatenation of word
, and a new feature
is generated from the word window
as
where
is a nonlinear active function, and
is a bias term. The filter is used for each possible word window in the sentence
to produce the feature mapping
by
Max-pooling layer: We use the standard max-pooling operation to obtain the generated feature map and take the maximum value of
as the characteristic of this particular filter:
this operation can capture the feature with the highest value as the most important feature for each feature map.
Through the above operations, a semantic feature can be extracted by each filter. The module uses several filters of different sizes to extract multiple semantic features from a given sentence.
3.2. Emotion Knowledge Module
The emotion knowledge module uses the lexicon to extract affective words from the sentence text and then synthesizes an emotion knowledge vector based on the prior emotion labels corresponding to affective words.
Given sentence
, we extract all affective words in
from the lexicon and obtain all the emotion labels corresponding to each emotion word. For each emotion, we set the number of emotion labels of corresponding affective words as
and the total number of all emotion labels as
. Then, we set the emotion knowledge vector to
, where
Taking the input sentence in
Figure 2 as an example, we extract three emotional words—congress, war, and committee—by looking up the lexicon. Among them, the affective word congress has two emotion labels (anger and joy), war has two emotion labels (disgust and sadness), and committee has one emotion label (anger). The total number of emotion labels of all affective words in the sentence is 5, the number of categories of emotional labels is 6, and the corresponding emotion knowledge vector is
.
In addition, when a sentence does not contain any affective words, the emotion knowledge weight of the sentence is the same on the six emotion labels, and its corresponding emotion knowledge vector is .
3.3. Multi-Task Prediction Module
The multi-task prediction module supports two tasks: emotion distribution prediction and emotion classification, including the semantic synthesis layer and emotion distribution output layer.
Semantic synthesis layer: We splice the output
of the semantic information module and the output
of the emotion knowledge module to generate the semantic synthesis vector
by
where
is the vector splicing operation, and the parameter α is used to control the ratio of adding emotional word information. When
= 0, it means that the semantic synthesis layer only contains semantic information and does not consider the prior knowledge of affective words; when
= 1, it means that all affective word information is considered in the semantic synthesis layer, and the semantic information is combined with all affective words prior to knowledge splicing. We believe that the importance of semantic information in the LMT-CNN model should be greater than affective word knowledge, that is, the value of parameters
should not be too large. This is because, in general, manually labeled emotion labels have high reliability, while the prior information of general affective words has more noise. This study analyzed the value of the parameter
in the experimental part where it is further discussed.
Emotion distribution output layer: Semantic synthesis vector after a full connection layer transformation and the output result of the emotion distribution layer are obtained. The dimension of the emotion distribution layer is the number of categories of emotion labels.
The LMT-CNN model uses an end-to-end manner to train the emotion distribution prediction and emotion classification tasks simultaneously. For the distribution prediction task, we use KL loss [
13] to measure the distance between the real distribution and the predicted one. The KL loss is defined as
where
,
represents the sum of each emotion label loss in sentence
.
The optimization objective of the emotion classification task is cross-entropy loss
, and its formula is
where
means when
is correctly divided into
j classes; otherwise,
.
The total loss of the emotion distribution output layer is a weighted combination of KL loss and cross-entropy loss as
where
is a weight parameter to control the importance of two kinds of losses. According to the experimental results of the existing related work, we set
= 0.7 [
15].
Finally, we use the stochastic gradient descent (SGD) algorithm [
48] to optimize the LMT-CNN model. When the prediction task is emotion classification, we take the emotion with the highest expression degree in the emotion distribution output from the full connection layer as the real emotion of the sentence.
Recent research work shows that the emotion distribution model based on a multi-task convolutional neural network (MT-CNN) [
15] can achieve good results by simultaneously training emotion distribution prediction and emotion classification tasks in an end-to-end manner. However, the MT-CNN model does not consider the linguistic prior knowledge of affective words, which is very important in the task of text analysis. In the experimental part, the performance of LMT-CNN and MT-CNN models is compared and analyzed.
The source code of the LMT-CNN model is released at our website [
49].
4. Experiments
To investigate the performance of the LMT-CNN model proposed in this paper, we conducted three groups of experiments on two emotion distribution datasets and five single-label emotion datasets. First, to verify the effectiveness of adding affective word information to the LMT-CNN model, we changed the value of α and recorded the performance of LMT-CNN. Second, to test the performance of the emotion distribution prediction of the LMT-CNN model, we used 8 different emotion distribution learning methods compared with the LMT-CNN method. Third, to examine the performance of the LMT-CNN model on emotion classification tasks, we used the deep-learning-based TextCNN, MT-CNN, and LMT-CNN emotion distribution learning models for comparative experiments.
4.1. Dataset
There were 9 commonly used text emotional datasets adopted in the experiments, namely Semeval [
18], Ren-CECps [
19], Fair Tales [
20], TEC [
21], CBET, ISEAR [
22], Affect in Tweets [
23], NLP&CC 2013, and NLP&CC 2014 [
24]. Among them, Semeval and Ren-CECps are emotion distribution datasets, and the other 7 datasets are traditional single-label datasets. We list the details of all experimental datasets in
Table 1.
SemEval is an English text dataset containing multiple emotions, including 1250 news headlines labeled with 6 emotion labels (anger, disgust, sadness, surprise, fear, and joy). Each headline has a percentile score for each emotion. The multiple emotions associated with each sample can be regarded as an emotion distribution vector, and the length of the vector is 1 through normalization.
Ren-CECps is a Chinese text emotion distribution dataset. The sentence corpus comes from Chinese blogs. Each sentence is labeled with 8 emotion labels, and each sentence has a score for each emotion. In order to be consistent with the types of emotions in other datasets, we selected 13,924 sentences of 5 emotions (anger, disgust, sadness, surprise, and joy) for experiments. The emotion distribution label retains the scores of the corresponding five emotions, and the multiple emotion labels corresponding to each sentence can be regarded as an emotion distribution vector, and the length of the vector is 1 by normalization.
Fairy Tales contains 1204 sentences from 185 children’s stories, each sentence labeled with one of five emotions (anger, sadness, surprise, fear, and joy). TEC contains 21,051 emotional tweets, each marked with one of six emotions (anger, disgust, sadness, surprise, fear, and joy). CBET is marked with 76,860 tweets of 9 emotions, and 8540 tweets are collected for each emotion. We retained a total of 51,240 tweets of 6 emotions. ISEAR contains 7666 English sentences. Each English sentence describes the situation and experience of different people when they experience seven main emotions. We retained five emotions, a total of 5431 sentences. Affect in Tweets is created from tweets. There are four emotions contained in dataset: anger, fear, joy, and sadness. The dataset contains 3489 English comments from tweets.
NLP&CC 2013 is a Chinese Weibo corpus containing 7 emotion labels released by the Natural Language Processing and Chinese Computing Conference in 2013, containing 10,552 emotional sentences and 29,633 non-emotional sentences. In this experiment, 7581 emotional sentences marked with six emotions of anger, disgust, sadness, surprise, fear, and joy were retained.
Table 1 respectively lists the detailed information of the dataset. NLP&CC 2014 Chinese microblog emotion analysis dataset is from Sina Weibo, and all tweets in the dataset are divided into two categories with or without emotion; those without emotion are labeled as none, and those with emotion are divided into 7 emotion categories. In this paper, six categories of emotions were selected: happiness, anger, sadness, fear, disgust, and surprise; a total of 11,431 Chinese tweets were selected.
The English lexicon used in the experiment was formed by the merger of Emosenticnet [
50] and NRC [
51]. The Emosenticnet lexicon contains 13,189 English affective words, and each affective word is labeled with 6 emotion labels. Each affective word in Emosenticnet and NRC lexicons is marked with one or more emotion labels. When the two lexicons were merged, we retained the 6 emotion labels (anger, disgust, sadness, surprise, fear, and joy) and deleted the affective words that were not labeled with these 6 emotions. For an affective word shared by the two dictionaries, the emotion label is the union of the emotion label of the affective word in the two lexicons. In the end, we obtained an English affective lexicon consisting of 15,603 affective words and 6 emotion labels. The Chinese affective lexicon uses the emotion vocabulary text database of the Dalian University of Technology [
52], which has 27,466 affective words and 11 emotion labels. We kept 5 emotion labels (anger, disgust, sadness, surprise, and joy) corresponding to the Chinese dataset and deleted the affective words that were not labeled with these 5 emotions. Finally, 15,179 Chinese affective words were retained, and each word was labeled with 1 label.
4.2. Experimental Setup
The experimental process adopted the standard stratified 10-fold cross-validation. We partitioned the dataset before feeding the data into the network. All samples were divided into ten categories evenly under the constraint of keeping the category proportions essentially the same. Each time, one of the samples was selected as the test set, and the remaining data were merged as the training dataset. In total, 90% of the training set was used for neural network training, and the remaining 10% was used as the validation set. Each fold cross-validation was a separate emotion prediction task, repeated ten times, and the average evaluation indicators of the ten cross-validations were used to evaluate the final performance of the model. The data division of all models participating in the comparison experiment remained the same.
Since the output of the LDL model is a distribution vector, a single indicator can reflect only one aspect of the algorithm on a particular data, and it is difficult for us to determine which indicator is the best. Geng et al. proposed that when comparing different LDL algorithms in the same dataset, multiple indicators can be used to evaluate and compare the algorithms [
6]. Following four principles, six indicators were finally selected to evaluate the LDL algorithms. Based on this suggestion, Zhou et al. chose six indicators to measure the average similarity or distance between the actual and predicted emotion distributions in the EDL model, respectively [
7]. Similarly, we used six evaluation indicators for our emotion distribution prediction task evaluation, namely
Euclidean, Sørensen, Squaredχ2, KL Divergence, Cosine, and
Intersection [
7]. The calculation formulas of the 6 evaluation indicators are as follows:
where
is the true emotion distribution of the text,
is the predicted emotion distribution, and
is the number of emotion types contained in the sentence. These 6 indicators are used to measure the similarity between the predicted emotion distribution
and the real emotion distribution
.
The emotion classification task uses 4 commonly used classification task evaluation indicators, namely
Precision, Recall, F1-score and
Accuracy. The specific calculation formulas of the 4 evaluation indicators are as follows:
where
TP represents the number of positive samples with correct predictions,
FP represents the number of negative samples with incorrect predictions,
FN represents the number of positive samples with incorrect predictions,
TN represents the number of negative samples with correct predictions, and A represents the total number of all samples.
Precision represents the proportion of all samples predicted to be positive that are actually positive.
Recall indicates the proportion of all positive examples in the sample that are correctly predicted. The
F1-score is the weighted average (or harmonic mean) of
Precision and
Recall. Therefore, this score takes both false positives and false negatives into account to strike a balance between
Precision and
Recall.
Accuracy is the most intuitive measure of performance and reflects the proportion of samples correctly classified by the prediction model.
For all the datasets we used, we set the filter windows of CNN to 3, 4, 5 in our experiments, each with 100 feature maps; the dropout rate was 0.5, the learning rate was set to 0.05, and the mini-batch size was 50 [
53]. We used the word embedding method to convert each instance into a word embedding matrix. We counted the average length of Chinese dataset samples as 100 and the average length of English dataset samples as 15, and thus we set the word vector matrix shape as 100 × 300 and 15 × 300, respectively. We used publicly available word2vec vectors. The English word vector is trained from 100 billion words in Google News [
54], and the Chinese word vector is trained from Sogou News [
55]. The dimension of all these word vectors is 300. In particular, the parameters of the LMT-CNN model were set as shown in
Table 2.
For the computational complexity of the LMT-CNN model, we chose Params and FLOPs to measure the complexity. Params refers to the total number of parameters to be trained in the model training and is only related to the defined network structure. FLOPs is the number of floating-point operations, which can be regarded as the calculation amount of the model [
56]. We regard the multi-add combination as a floating-point operation. FLOPs are related to different layer operation structures, and the maximum length of the input sentences influences the size of the computation. We calculated the parameter quantities of the convolutional layer and the fully connected layer that use different height convolution kernels; we also calculated the calculation amount of convolutional layer and fully connected layer at different sentence maximum length
. The results are shown in
Table 3.
4.3. The Influence of the Weight Coefficient of Affective Words on the Performance of LMT-CNN Model
The affective word weight coefficient
is an important parameter of the LMT-CNN model, which is used to control the weight of affective word information and semantic information. To verify the effectiveness of adding affective word information to the LMT-CNN model, we changed the value of
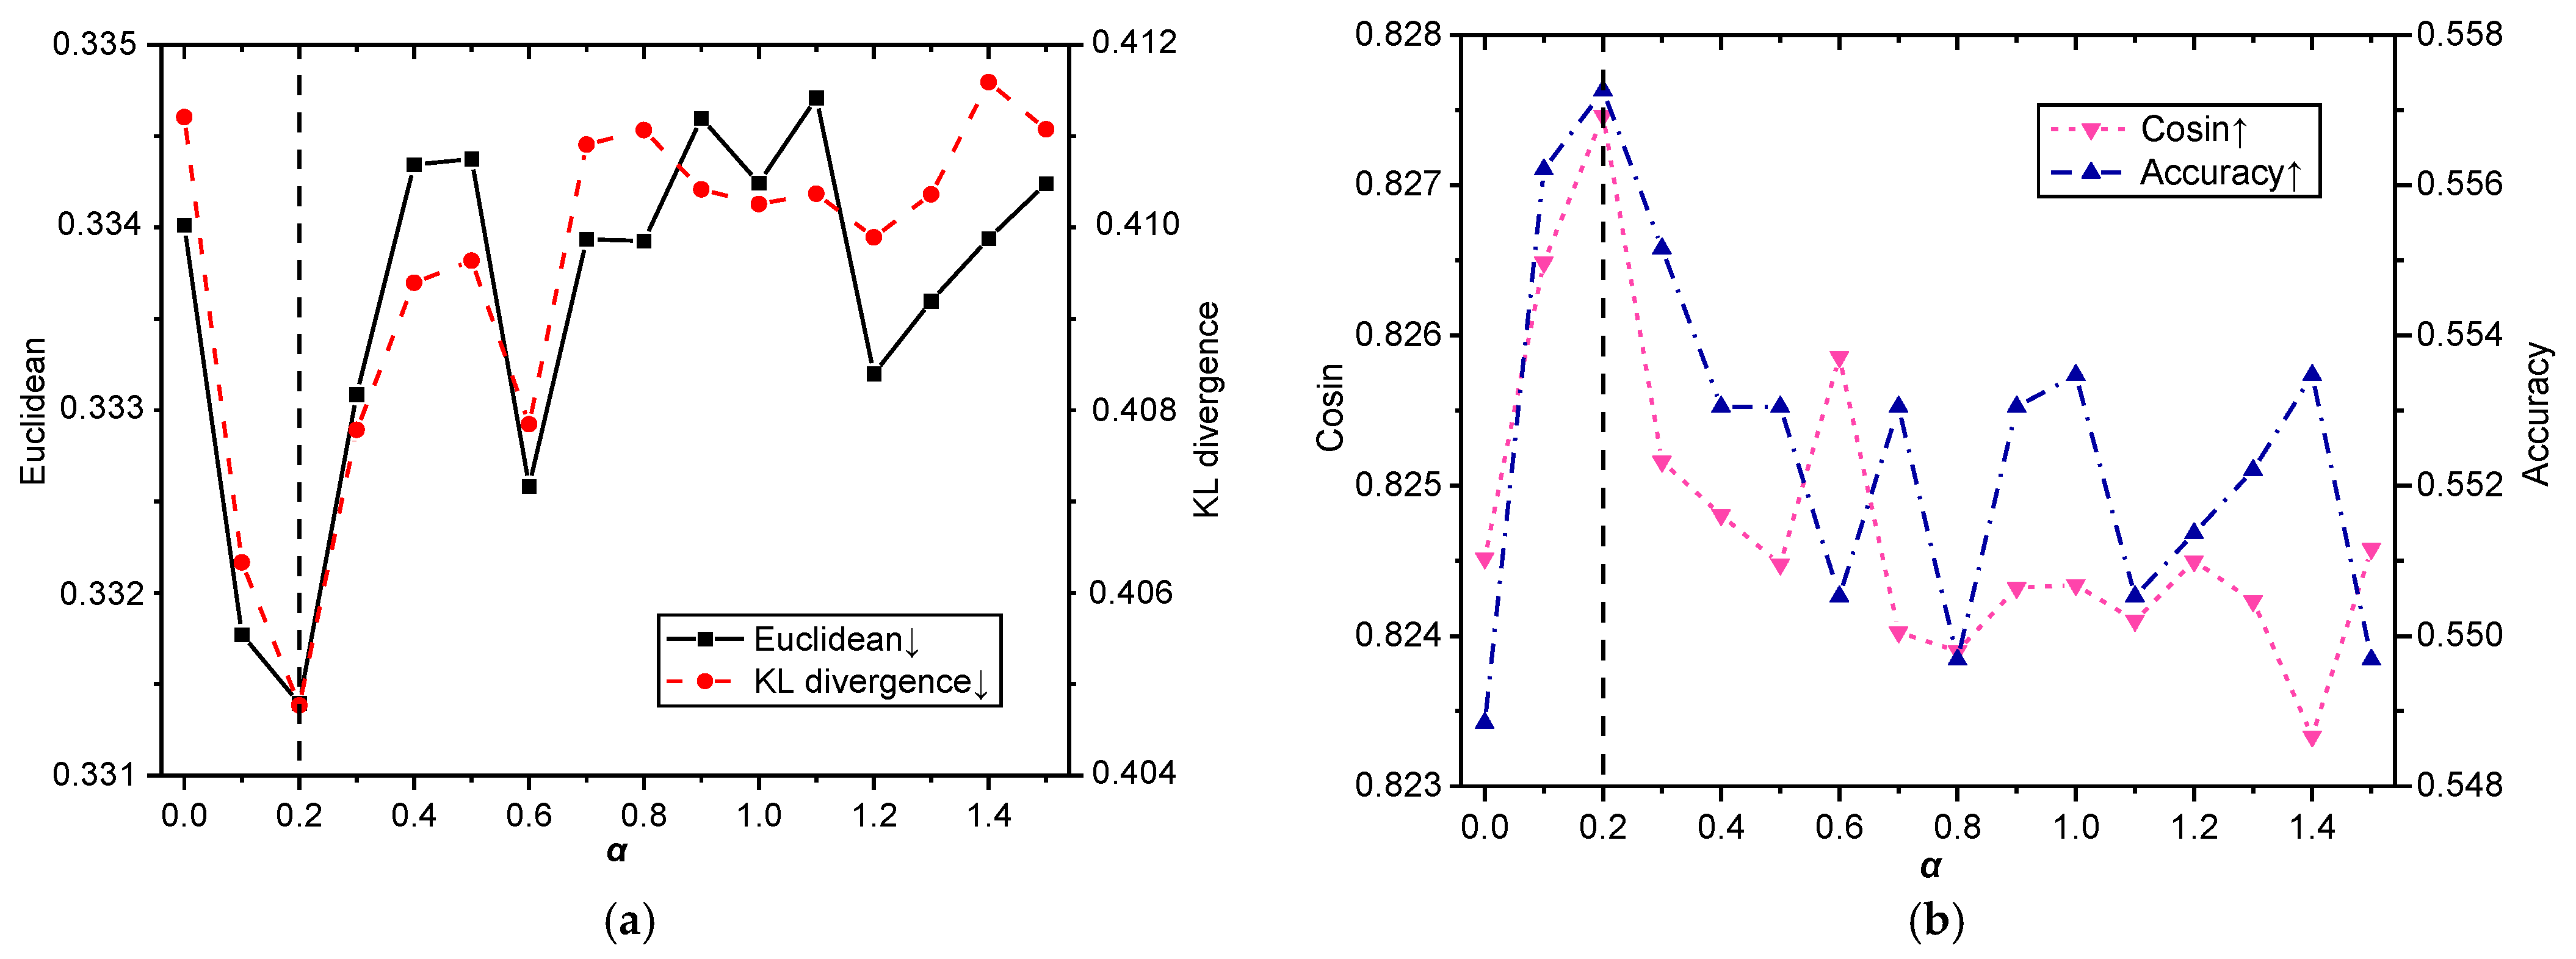
from 0 to 1.5 (every 0.1) and recorded the scores of the
Euclidean,
KL Divergence,
Cosine, and
Accuracy indicators of the LMT-CNN model on the Semeval and Ren-CECps datasets. The detailed experimental results are shown in
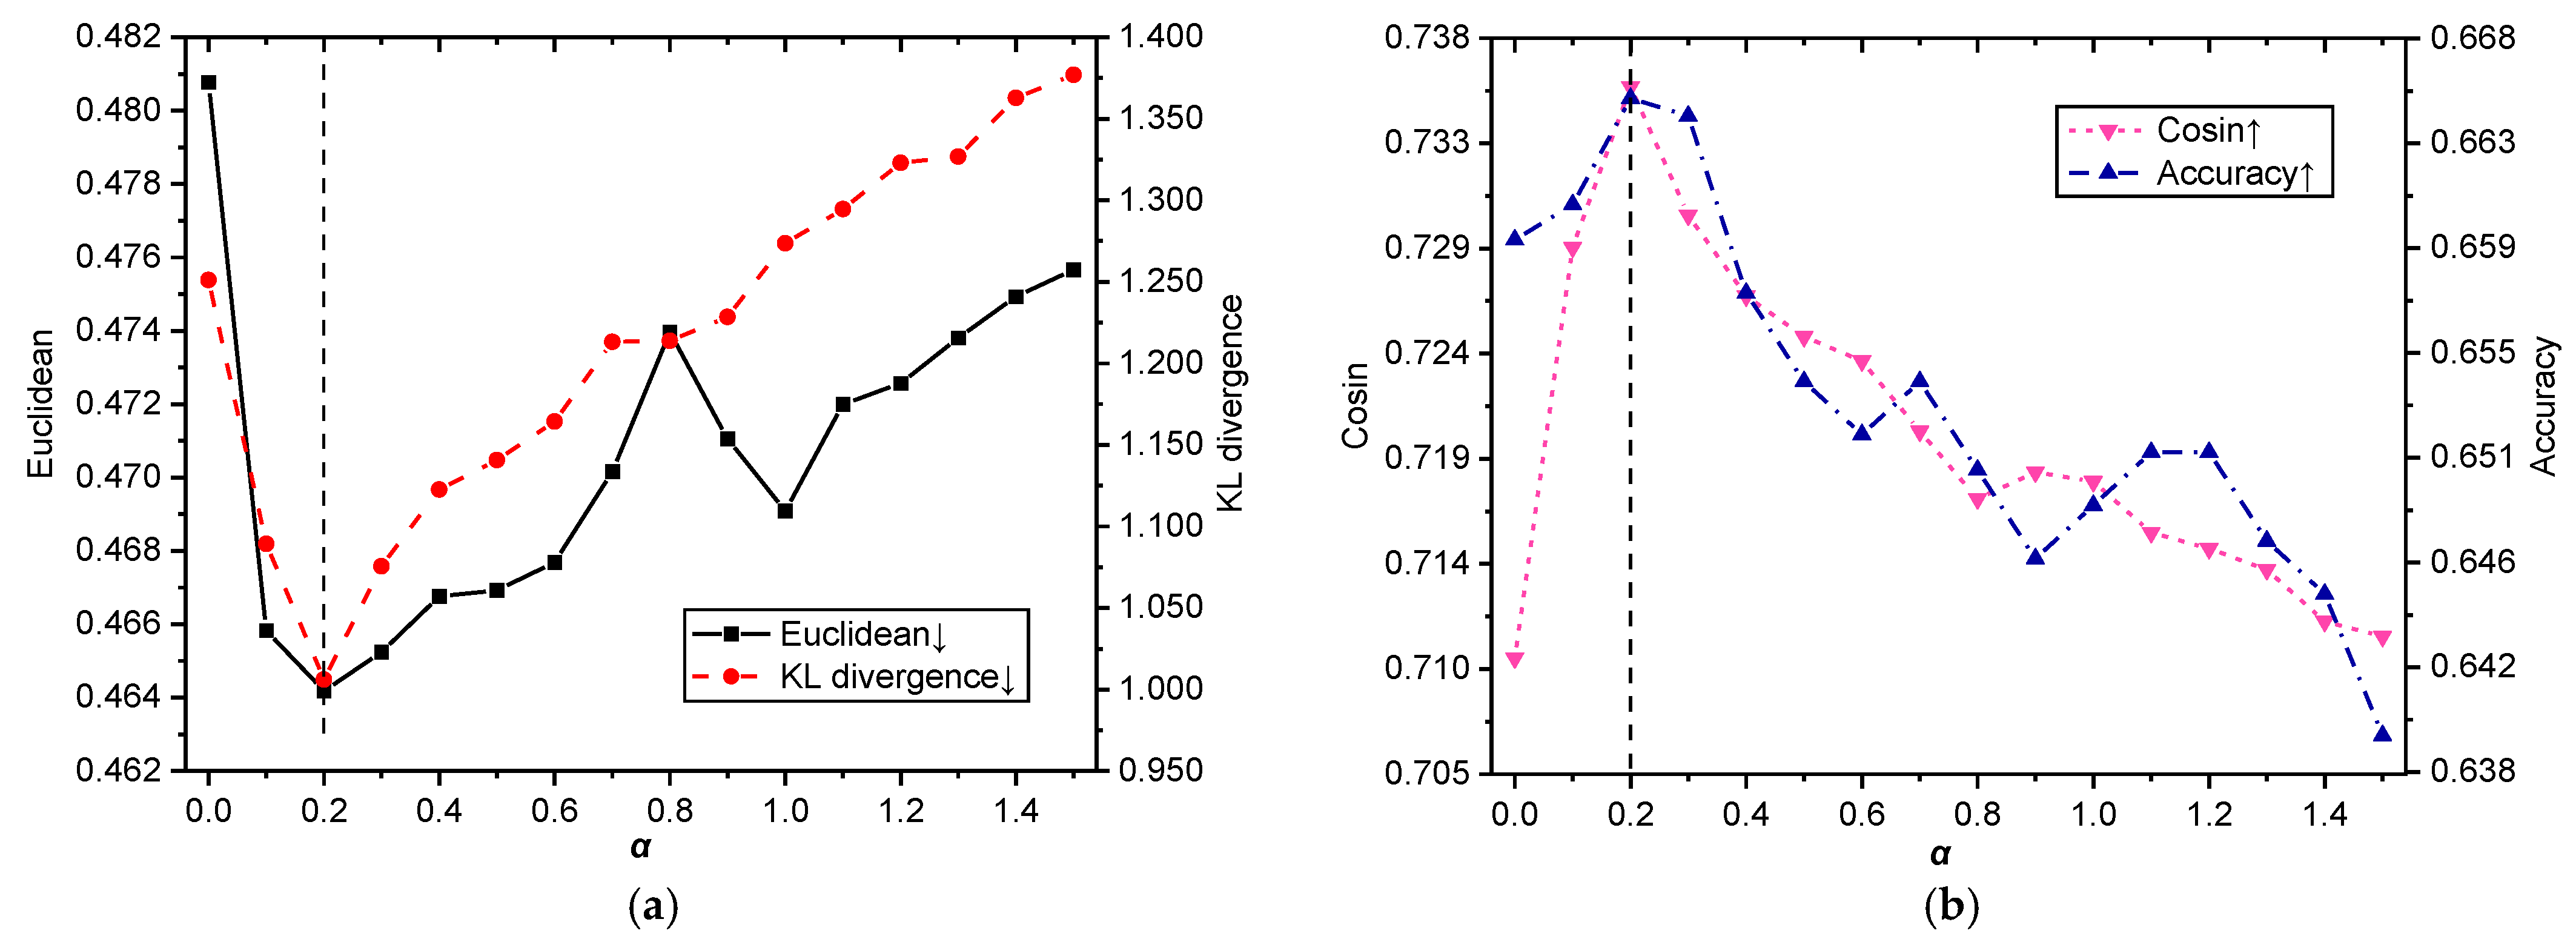
Figure 3 and
Figure 4.
As can be seen from the experimental results of the English dataset in
Figure 3, although the scores of the four evaluation indicators vary greatly with the change in weight
, the optimal value is reached when
= 0.2. When
increases from 0 to 0.2, the two indicators in
Figure 3a gradually decrease, and the two indicators in
Figure 3b gradually increase, which shows that it is beneficial to increase the linguistic knowledge of affective words. When
= 0.2, the four indicators in
Figure 3 reach the best value, and the performance of the LMT-CNN model is the best, which shows that emotion knowledge and semantic information reach a balance. When
> 0.2, the indicators in
Figure 3a,b show an unstable upward and downward trend, respectively, and the performance of the model begins to decrease as a whole, which shows that when the weight of affective words is too large, the noise of affective word information affects the performance of the model.
For the Chinese dataset Ren-CECps, it can be seen from the experimental results in
Figure 4 that the changing trend of the four evaluation indicators with the increase in weight is similar to that of the English dataset. The
Euclidean and
KL Divergence indicators in
Figure 4a rise first and then fall;
Cosine and
Accuracy indicators in
Figure 4b fall first and then rise. The four evaluation indicators are in
= 0.2, indicating that the affective word information and semantic information reach a balance.
The above experimental results show that affective words contain effective emotional information. Adding affective word information to the EDL model can help improve the performance of emotion distribution prediction. However, since affective words have more noise, affective word information weight should not be too large. Considering the balance of text semantic information and affective word information, in the following experiments of this paper, we set = 0.2 for the dataset for the LMT-CNN model.
4.4. Contrast Experiment of Multiple Text Emotion Distribution Prediction Methods
To verify the performance of the emotion distribution prediction of the LMT-CNN model, we selected 8 different EDL methods as baseline methods and conducted a comprehensive comparative experiment on the Semeval and Ren-CECps datasets. The compared EDL methods included AA-KNN, AA-BP, SA-LDSVR, SA-IIS, SA-BFGS, SA-CPNN [
6], TextCNN [
53], and MT-CNN [
15]. The detailed model configurations are described as follows.
Specifically, AA-KNN and AA-BP are extended versions of the classical KNN algorithm and BP (backpropagation) neural network to solve LDL tasks [
6]. In the AA-KNN model, we set the number of neighbor samples as 4, used
Euclidean distance to calculate the distance from the sample point to be classified to each other sample, and predicted the category of the sample to be tested through the nearest 4 neighboring samples. In the AA-BP model, we created a three-layer network; the number of neurons in the first layer was 24, and the transfer function was “
tansig”. The number of neurons in the second layer was 60, and the transfer function was “
tansig”. The number of neurons in the output layer was 6, and the transfer function was “
purelin”. We set the learning rate to 0.05 and the momentum factor to the default value of 0.9.
Additionally, SA-LDSVR, SA-IIS, SA-BFGS, and SA-CPNN are algorithms specifically designed for LDL tasks [
6]. In the SA-LDSVR model, we chose radial basis function (RBF) as the core function, the penalty parameter was 1.0, and the other parameters were the default values. The SA-IIS method establishes the maximum entropy model and uses the IIS algorithm to estimate the parameters. SA-BFGS follows the idea of an effective quasi-Newton method BFGS to further improve IIS-LLD. SA-CPNN has a network structure similar to Modha’s neural network, where the only difference is its training manner is supervised.
Both TextCNN and MT-CNN are deep-neural-network-based models. TextCNN is a convolutional neural network model for text emotion classification [
53]. The height of convolutional kernel size was divided into three groups (3, 4, 5), and the width was 300, which was equal to the dimension of the word vectors. There were 32 channels in each group. Batch size and learning rate were set to 16 and 0.001. MT-CNN is a multi-task convolutional neural network model that simultaneously predicts the distribution of text emotion and the dominant emotion of the text [
15]. The height of convolutional kernel size was divided into three groups (3, 4, 5), and the width was 300, which was equal to the dimension of the word vectors. We combined the cross-entropy loss with the KL loss by setting the weight (
). Therefore, considering the balance between distribution prediction and classification performance in the experiment,
= 0.7 [
15] was set for this model, which means that the weight of the cross-entropy loss was 0.3, and the weight of the KL loss was 0.7.
The detailed experimental results of all emotion distribution learning methods participating in the comparison of the datasets are shown in
Table 4 and
Table 5. In the table, ↑ means that the larger the indicator is, the better, and ↓ means that the smaller the indicator is, the better. The optimal results of each indicator are marked in bold.
In the emotion classification task on Semeval dataset, except that MT-CNN Recall is higher than LMT-CNN, LMT-CNN model is 0.39%, 0.41%, and 0.80% higher than MT-CNN model in Precision, F1-score, and Accuracy. On Ren-CECps dataset, LMT-CNN is 2.65%, 3.73%, 2.51%, and 3.23% higher than MT-CNN in Precision, Recall, F1-score, and Accuracy. The experiment results show that the emotion knowledge vector extracted from the emotion lexicon can effectively increase the dominant emotion information of sentences and help to improve the emotion classification performance of the LMT-CNN model.
4.5. Comparison of Emotion Classification Performance on Single-Label Datasets
To examine the performance of the LMT-CNN model on the emotion classification task, we conducted comparative experiments using deep-learning-based TextCNN, MT-CNN, and LMT-CNN emotion distribution learning models on seven single-label datasets. Note that the LLE label enhancement method [
12] was used to transform the single-label dataset into the emotion distribution dataset.
When the classification task is multi-category, the performance of the classification model can be evaluated by comparing the scores of the classification indicators for each individual category. If using the arithmetic mean of all categories on different indicators as a criterion for evaluating the model, in the case of data imbalance, the categories with fewer data will affect the scores of the indicators more. For example, the
Precision indicator may score relatively high on categories with small sample sizes. This improves the average of
Precision indicators on the overall data to some extent, while in reality, not so many samples are correctly classified. Therefore, we compared the performance of the three CNN-based EDL models on each emotion label. The detailed comparative experimental results for each individual emotion category are shown in
Table 6, where the last column shows the macro averaged score of the corresponding indicators. The optimal results of each indicator are marked in bold.
As can be seen from
Table 6, LMT-CNN achieves the overall best results on all seven datasets. Taking the macro averaged
F1-score as an example, on the Fairy Tales, TEC, CBET, ISEAR, and Affect in Tweets datasets, the macro averaged F1 value of the LMT-CNN model is 0.40%, 1.32%, 0.91%, 2.17%, and 3.36% higher than that of the MT-CNN model and 0.64%, 2.37%, 1.88%, 3.54%, and 4.78% higher than that of TextCNN. Comparing the performance of LMT-CNN and the baseline model on each emotion, we can see that our model gives better results on almost all emotions. Moreover, the classification of Anger, Sadness and Fear emotions is more challenging, and the performance in all models is relatively low. For example, in the experimental results of Chinese datasets NLP&CC 2013 and NLP&CC 2014, the scores of
Recall and
F1-score on the three emotion labels Anger, Sadness, and Fear were relatively low, while the classification on the two labels Joy and Surprise achieved better results.
Compared to the two baseline methods, LMT-CNN shows different degrees of performance score improvement on different datasets. Overall, on all seven datasets, the LMT-CNN method almost always scored higher than the baseline method being compared for the classification indicators in each class. This shows that the classification performance is improved more effectively by combining the emotion knowledge module with semantic connotations for the same input text features. Adding the consideration of prior knowledge of affective words clearly helps in emotion recognition, and our particular method learns more information in the sentence while considering the information of affective words.
In addition, consistent with the experimental results of Zhang et al. [
15], the MT-CNN model scored higher than the TextCNN model on each evaluation indicator in the experiments on the seven datasets. This result shows that the performance of the multi-task neural network is significantly better than that of the traditional single-task networks in the emotion classification task. MT-CNN and LMT-CNN use the combination of cross-entropy loss and KL loss to train multi-task neural networks. In the training process, emotion distribution prediction and emotion classification tasks improve each other and can achieve better performance than single-task CNN.


