Abstract
Over the years, oil-related energy sources have played an irreplaceable role in both developed and developing countries. Therefore, the efficiency of petroleum supply chains is a key factor that significantly affects the economy. This research aimed to optimize the configuration of the uncertainty multimodal petroleum supply chain in terms of economy, energy and environment (3E assessment). This study proposes a novel integration methodology between a heuristic algorithm and exact solution optimization. In the first stage, this study determines the facilities’ potential geographical coordinates using heuristic algorithm. Then, the fuzzy min-max goal programming model (FMMGPM) was developed to find the multi-objective solutions. In particular, this model allows analysis of supply chain uncertainty through simultaneous factors such as demand, resource, cost and price. These uncertainty factors are expressed as triangular fuzzy parameters that can be analyzed in terms of both probability and magnitude. Moreover, the model is applied to the entire petroleum supply chain in Vietnam, including downstream and upstream activities. In addition, another novelty is that for the first time, pipeline systems in logistics activities are considered in Vietnam’s petroleum supply chain optimization study. The results also show the short-term and long-term benefits of developing a pipeline system for oil transportation in Vietnam’s petroleum supply chain. To evaluate the effects of uncertainty on design decisions, this study also performed a sensitivity analysis with scenarios constructed based on different magnitudes and probabilities of uncertainty.
1. Introduction
Renewable energy sources have been shown to be efficient in most modern industries. However, fossil resources still play a major role in providing the energy that powers most of the world’s economies [1]. Of these fossil energy sources, the most common are oil and its related products. Therefore, in addition to political issues, the optimization of petroleum supply chains is a topic of interest to governments, businesses, supply chain managers and researchers [2,3]. In addition, sustainable development requires not only economic efficiency optimization, but also environmental impacts and energy security. These objectives are commonly known as the 3E evaluation, which entails the economy, environment and energy [4]. Furthermore, the impact of uncertainties such as consumption demand, capacity, costs and prices can cause changes in supply chain configurations [5,6,7,8,9]. Therefore, mid- and long-term decisions in petroleum supply chain design should include an uncertainty factor analysis.
Known as one of the fastest growing economies in the region, Vietnam has a high potential petroleum supply chain, which includes upstream, middle stream and downstream activities. Statistics show that Vietnam has played an important crude oil export role in Southeast Asia over the past two decades [10]. On the other hand, Vietnam’s petroleum demand is increasing year-over-year. However, this demand is heavily dependent on imports because of the domestic limited oil refining capacity. Possessing large crude oil reserves but still having to import petroleum for the domestic market is a special situation in Vietnam’s petroleum supply chain [10]. The government’s revised energy plan also clearly states the major role of petroleum in the structure of energy sources from now to 2030, with approximately 22.8% [11]. Therefore, effectively implementing both import and export tasks is an essential problem for petroleum supply chain managers in Vietnam. Therefore, medium- and long-term design decisions, such as the location and size of facilities or the appropriate mode of transport for transit routes, can partially address this pressing issue. In addition, petroleum transportation in Vietnam is currently mainly carried out by roadways, waterways and railways. Meanwhile, recent studies have shown the efficiency of pipeline systems in the petroleum supply chain [12]. In other words, decisions related to pipeline system development are also included in the petroleum supply chain design problem.
The oil and gas supply chain considered in this study includes upstream, midstream and downstream facilities, as shown in Figure 1. In the first tier of the supply chain, oil rigs are responsible for extracting and transporting crude oil. This amount of crude oil is either exported at ports or filtered into other products at the refineries. At the same time, these seaports are also responsible for importing refined oil products. The third tier of the supply chain is a system of distribution centers in different forms of regional centralized warehouses. The primary role of these distribution centers is to maintain inventory and perform crossdocking processes before shipping gasoline and diesel oil to retail stores in the fourth tier. The transport system between the tiers of the supply chain consists of four common modes for domestic oil and gas transport: roads, waterways, railways and pipelines.
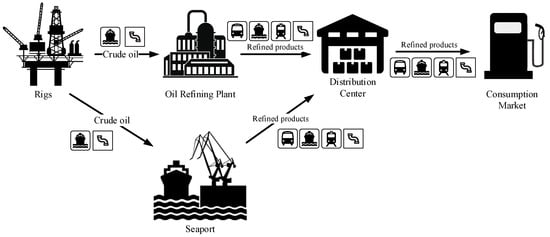
Figure 1.
Petroleum supply chain network.
The contributions of this study are intended to provide recommendations for design decisions in the above identified problem. Firstly, this study develops an integrated methodology composed of a heuristic algorithm and a fuzzy multi-objective mixed integer linear programming (FMOMILP) optimization model. In this, the heuristic algorithm allows users to determine the potential coordinates of the markets based on the population density of each region. Then, the FMOMILP model, which includes the properties of multi-objective, multimodal, multi-product, multi-scale and uncertainty simultaneously, is used to suggest the optimal design for the petroleum supply chain. Through the decision variables, this model supports decisions related to the development of distribution centers, transportation, imports and exports and development of the pipeline system. Moreover, uncertainty is considered in the model as fuzzy parameters that relate to consumption demand, cost, price, capacity and import/export quota. The variety of uncertain sources allows the model to comprehensively analyze possible variations in the long-term configuration of the supply chain. These uncertainty factors are expressed as triangular fuzzy parameters that can be analyzed in terms of both probability and magnitude. In addition, this model balances the three objectives of maximizing profits, maximizing energy security and minimizing transport emissions by applying the min-max variant of the goal programming approach. This variation helps the model avoid goal-oriented extremism in finding solutions according to goal programming approaches. Secondly, the above integrated methodology is applied in practice for the petroleum supply chain in Vietnam. In this managerial contribution, a detailed petroleum supply chain configuration is proposed for managers in Vietnam based on the results of the optimization model. This includes a proposal for the process of developing a pipeline system for both crude oil exports and gasoline imports. As a third contribution, this study analyzes scenarios that are developed based on two factors, including amplitude and probability of fuzzy parameters, to evaluate the impact of uncertainty on supply chain configuration.
The organization of the following sections of this paper is as follows: Section 2 is a literature review related to petroleum supply chain design; the integrated methodology is presented in Section 3; in Section 4, the study describes the application of the methodology to the case of Vietnam’s petroleum industry and uncertainty sensitivity analyses; and finally, conclusions, limitations and suggestions for future research are discussed in Section 5.
2. Literature Review
Over the past decades, the efficiency of different upstream to downstream segments of petroleum supply chains has been improved by researchers using various approaches. Approaches to this topic can be classified into two main groups: heuristic algorithms/simulation/strategic analysis and mathematical optimization models [2]. As one of the approaches without an optimization mathematical model, the combined framework, which was introduced by Ghasemzadeh et al. in 2017, shows that identifying key metrics for prioritizing supply chain segment strategies can determine the optimal strategy in the total supply chain and the players within it. The study also confirms that the most important strategic decisions of each segment and the total supply chain are not necessarily the same [13]. Using a different approach, Eslami et al. proposed a genetic algorithm to search for the multi-objective problem’s set of solutions. This approach supports the selection of safety measures that minimize the cost and risk of hazards for petroleum facilities [14]. Grudz et al.’s study, published in 2020, analyzed the difference between forecast and actual performance indicators of the underground gas pumping plunger operation modes [15]. In 2017, Guliman presented several logistics performance evaluation methods for the petroleum industry. This study aims to clarify the purpose of both original, improved and modern methods to achieve the necessary suitability when applying these methods [3]. In a review paper, Sahebi et al. classified the optimization mathematical models for this topic in the last three decades in terms of supply chain structure, decision levels, uncertain factors and environmental impact. The results of this study show that the application of mathematical models in the petroleum supply chain design problem has emerged, and there are still many avenues for future research [16].
For decades, multiple criteria decision-making (MCDM) methods and optimization mathematical models have been widely applied to decision-making problems [17,18,19,20,21,22]. In 2019, Ahmed M. Attia introduced the mixed integer linear programming (MILP) model to address the problem of hydrocarbon supply chain (HCSC) optimization in terms of perspectives and goals in the oil and gas industry. Furthermore, this study investigates the balance between the different goals of the HCSC. Therefore, the results showed that gas production depends on many aspects [23]. In 2020, Sheel’s study provides ideas for application to the model, which was developed by Gligor et al. (2016), on India’s petroleum supply chain transportation. At the same time, the study elaborates on the difficult points affecting the development of the oil and gas transportation industry in this country [24]. Pipeline systems, which require large investments, have a significant impact on the performance of petroleum supply chains. Therefore, this infrastructure factor is also more commonly considered in strategic studies on petroleum supply chain management [25,26,27,28,29,30,31,32,33,34,35]. In 2017, an optimization model and a decomposition algorithm were applied in combination in Roger Rocha’s study to optimize the cost of activities in the petroleum supply chain [36]. Meanwhile, Wang used the MILP model to optimize downstream oil supply chain design addresses and consider transportation planning and pipeline evaluation oil. The results of this study show that it is necessary to build a new pipeline system [12]. In the article, published in 2017, H. Devold presented the installation of advanced systems, along with the application of modern technologies and MILP methods [37].
Besides cost optimization models, other studies are more interested in other impacts of petroleum supply chains in developing countries, such as emissions, energy and society [38,39,40,41,42,43]. The multi-objective sustainable competitive petroleum supply chain (SCPSC) model, which was developed by N. Moradinasab, was used to solve existing problems deposited in refineries, distribution centers and consumption markets. As a result, a certain distribution center can be applied across many supply chains, leading to better distribution center usage and better practice [44]. In 2019, Meng Yuan proposed a pipeline network reform method and highlighted the importance of influence on other aspects, such as China’s 3E and downstream oil supply chain. The results of this study are extremely efficient as a year-over-year improvement of overall energy efficiency, as well as a reduction in electricity consumption [4]. In 2020, another study by Ayman Alghanmi applied mathematical modeling in combination with fuzzy rule-based and Bayesian networks theory to stimulate, explain and analyze operational risks. The performance of the model achieved the desired results, and this is also one of the first studies to address the problem of uncertain data from the point of view of the petroleum transportation system [45]. FoomaniDana’s study provides a comprehensive assessment to analyze the competition between road and pipeline systems in different regions. Then, the functional demand and profit for both competing systems were analyzed and compared in detail [46]. Zhou’s contribution used the MILP model to solve the problem of supply chain management in both the economy and CO2 emissions dimensions. According to the above model implementation, the research has optimized the design to reduce not only carbon emissions, but also cost in the pipeline oil system [47].
As a reinforcement, this study aims to fill in the remaining gaps in terms of both the problem properties and methods of the optimization mathematical models in this field, as described in Table 1 and Table 2 below.

Table 1.
Related research problem characteristic.
Table 2.
Related research methodology.
3. Methodology
This section first describes the structure of the oil and gas supply chain network considered in this study. Next, a two-phase methodology including a heuristic algorithm and fuzzy multi-objective mixed-integer linear programming optimization model is proposed to design a multimodal oil and gas supply network. The integrated methodology is described in Figure 2.
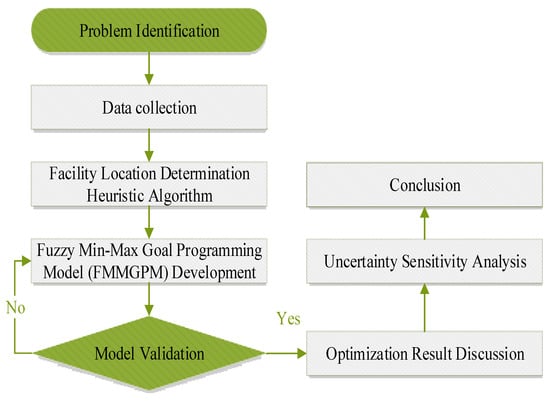
Figure 2.
Proposed methodology.
3.1. Location Determination Algorithm
The first phase of this research is to propose a four-step heuristic algorithm for determining the potential locations of distribution centers. In addition, because of the very large number of petroleum retailers at the end of the supply chain, this algorithm is also used to determine the central point of consumption zones. In the first step, the algorithm determines the initial trial location based on the longitude , latitude and weight of the related locations in the area under consideration, as in Equations (1) and (2). In the second step, in Equation (3), the ratio between the weight of each relevant position and its distance to the trial location is used to determine the relative weight . Next, the algorithm modifies the coordinates of the potential position, as in Equations (4) and (5). This modification was repeated until there was no difference in the coordinates of the trial position in two consecutive iterations.
Step 1: Determine initial potential location:
Step 2: Consider a trial location , for the first iteration . For each location ( compute:
Step 3: Modify the and values as follows:
Step 4: If one or both of change, repeat the process with modified . Go to step 2 with modified . If none of changes, then stop.
3.2. Fuzzy Mixed-Integer Programming Model
3.2.1. Sets and Parameters
This fuzzy optimization model is developed on sets that relate the type of product in the supply chain along with the modes of transport . In addition, the assemblies represent facilities at all levels of the supply chain, such as rigs , refinery plants , ports , distribution centers and market central points . In addition, the distribution centers are also considered by the model with many different construction scales .
In addition to the deterministic parameters, the operating efficiency of the oil and gas supply chains is influenced by the uncertainties that are represented by the fuzzy parameters in this model. These parameters are related to product price , unit costs , environmental impact coefficients , consumption demand , refinery ratio , export-import quotas and facility capacity .
To handle the uncertainty, the triangular fuzzy numbers (TFN) are defined as representing the most pessimistic, most likely and most optimistic value as Equation (6):
In this study, the above fuzzy parameters are defined as TFN ( as shown in Figure 3. As Equations (7) and (8), from the known mean of the parameters , the lower and upper boundary values (, ) of the fuzzy parameter are determined based on the coefficient of variation. These two boundary coefficients are valid in the interval [0, 1] and are denoted as and , respectively.
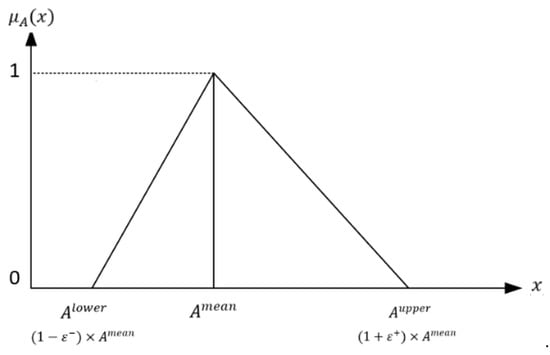
Figure 3.
Fuzzy parameter membership function.
Next, the defuzzification values of the fuzzy parameters are determined by the model based on the probabilities of the boundary values, as shown in Equation (9):
The fuzzy and non-fuzzy parameters mentioned above are listed in Table 3 below.
Table 3.
Fuzzy and non-fuzzy parameters.
3.2.2. Decision Variables
For product flow decisions, integer variables and represent the amount of crude oil transported from the oil rigs to the refineries and export ports by transportation modes , respectively. Meanwhile, the integer variables and represent the quantity of refined products that are transported from refineries and import ports to distribution centers . Next, the amount of refined product transported from the distribution centers to the consumer markets is described by this model through the integer variable .
In addition to supporting initial investment decisions, the proposed model uses the binary variables , , , and to represent the decision to develop oil pipelines and the binary variable to describe the decision to build different scale distribution centers. Finally, the float variable is used as an intermediary to determine the supply chain’s demand response rate in consumer markets. The decision variables which mentioned above are presented Figure 4.
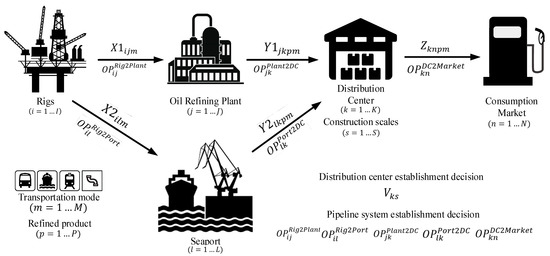
Figure 4.
Fuzzy parameter membership function.
3.2.3. Objective Functions
Towards sustainable development, the objective functions of this model revolve around the three pillars of sustainability: economic, social and environmental. First, this study formulates the factors that influence supply chain profitability and optimizes them. As described in Equation (10), supply chain profit is determined by the difference between revenue and costs.
In Equation (11), the revenue is obtained from the value of exported crude oil plus the value of refined oil products in the consuming markets. In Equations (12)–(17), this is the transportation cost of crude oil or refining products in the supply chain, the distribution center construction cost, the oil pipeline system development cost, the oil exploitation cost at rigs, the refining cost at plants and the refined oil products import cost.
The second objective function of this model is to maximize the ratio between the quantity supplied and demanded as Equation (18). This ratio represents the level of energy security guaranteed by the supply chain.
In the final objective function, the model aims to minimize the number of emissions generated during the transportation of crude oil and finished products in Equation (19).
3.2.4. Constraints
Constraints (20) and (21) ensure that the total volume of finished products does not exceed their demand’s crisp value in markets. At the same time, the quantity of this product cannot be less than the lower boundary of demand. In Equation (22), the total amount of finished product that is produced by refineries and imported at ports is shipped to DCs is greater than that shipped from DCs to markets. Constraint (23) ensures that the amount of product shipped out of the refineries is equal to the amount refined based on the refinery ratio coefficient. Constraints (24) and (25) ensure that the amount of crude oil shipped to ports for export purposes is greater than the crisp value of the export quota and less than the upper boundary of the export quota. Similarly, the amount of a finished product imported and shipped from ports to DCs does not exceed the import quota, as described in Equation (26). Constraint (27) shows that the total amount of crude oil transported from a particular rig to refineries and ports for export does not exceed the rig’s capacity. However, as shown in Equations (28) and (29), the total amount of crude oil delivered to a particular refinery is neither above its design capacity nor below its utilization factor. For DCs, the total amount of finished product that is shipped to markets is limited by the capacity of the DCs depending on the design scale, as described in Equation (30). In addition, constraint (31) ensures that the DCs are designed with only one size at a location.
For modes of transport other than pipelines, Big-M constraints (32)–(36) ensure that crude oil and finished goods are transported only if and only if the route is feasible for a certain mode of transportation. For the pipeline mode of transport, the Big-M constraints (37)–(41) assist in determining the routes needed to develop the pipeline system through variables such as , , , and .
To determine the level of energy security from the designed supply chain, constraint (42) estimates the ratio ( of product supply to demand in markets.
3.3. Fuzzy Min-Max Goal Programming Model (FMMGPM)
To search for solutions with weighted compromise between objective functions, this study applies a goal-programming approach with a min-max variant. This approach is followed by the following four-step procedure:
First, the single-objective optimal solutions are determined. The objective function values from these single-objective solutions are aggregated and used as the goals ( of each related objective. In step two, constraints (43)–(45) are established to estimate the under-attainment ( and over-attainment ( deviation variables between the objective function values and the goal value.
In step three, as described in Equations (47)–(50), the product of the objectives’ weight and the ratio of the undesirable variables to the goal value are controlled by the same variable, . In other words, this variable represents the maximum weighted difference ratio. Finally, the optimal solutions with a weighted compromise between the objective functions are determined by minimizing the variable .
4. Numerical Results
4.1. Case Study Description
In Southeast Asia, Vietnam is known as one of the most potential developing economies due to its advantages of location, low human cost and political stability. In just two years, this potential economy has consumed more than a thousand terawatt-hours of energy each year. Energy sources from oil and oil products accounted for 25.92% to 35.68% in the decade in Vietnam [53]. On the other hand, the petroleum supply chain in Vietnam includes not only upstream roles such as oil exploration, refining and crude oil exports, but also downstream roles such as importing oil products and retailing. However, with the middle stream, the accompanying logistics system is mainly water and road, while pipeline systems that are believed to be more efficient do not yet exist. Therefore, the model proposed in this study is applied to find optimal design solutions for both the petroleum supply chain in general and the pipeline system, particularly in Vietnam.
As described in Table 4, the upstream petroleum facilities consist of six oil rigs, two refinery plants owned by the Vietnam National Petroleum Group (Petrolimex), three import/export seaports in Haiphong City, Quinhon City and Hochiminh City. The downstream supply chain includes distribution centers in direct-controlled municipalities such as Hanoi, Danang, Hochiminh and Cantho, along with the retail system in the northern, central and southern regions of Vietnam. The design decisions of distribution centers will be chosen at three different scales with different fixed costs. In addition to crude oil, the supply chain also distributes two main product groups, gasoline and diesel, through four modes of transport: waterways, railways, roads and pipelines. In particular, the model aims to propose the development of a pipeline system on necessary transport sections, while the feasibility of other modes of transport is based on the current state of infrastructure. Railways are almost not feasible in the southern region because of the terrain with an interlaced river network, leading to challenges in railway development.
Table 4.
Set descriptions.
As mentioned above, the input parameters include fuzzy and non-fuzzy groups that are collected from open databases [10,54,55,56,57], government statistics [11,58,59] and other publications [4,7,12,14,23,47,60,61,62,63]. For the fuzzy triangular parameters, the lower and upper boundary values are estimated using Equations (7) and (8), with boundary coefficients in the first optimization. In addition, as in Equation (9), the defuzzification values of those fuzzy parameters are determined to transform the model from a fuzzy form to a crisp form with probabilities that are chosen as . The data of these input parameters are presented in the Appendix A. In addition, based on the coordinates of the provinces and cities in the northern, central and southern regions of Vietnam, this study first determines the center point coordinates of each of the above-mentioned consuming regions through the heuristic algorithm discussed in Section 3.1 above. The results of this algorithm are listed in Table 5.
Table 5.
Market region center point determination.
4.2. Multiple Objective Optimization Results
Next, to determine the solution for FMMGPM, the model is resolved with the addition of new constraints and objective functions, such as Equations (43)–(49). The weights of the objective functions related to profit, energy security and emissions are chosen equally to imply the balance of 3E for sustainable development. The values of the objective functions provided by the compromise solution are listed in Table 6. As shown in Figure 5, the results show that FMMGPM’s solution almost reaches the goal value at the objective functions that maximize profit and energy security while sacrificing little in minimizing emissions.
Table 6.
FMMGPM objective value.
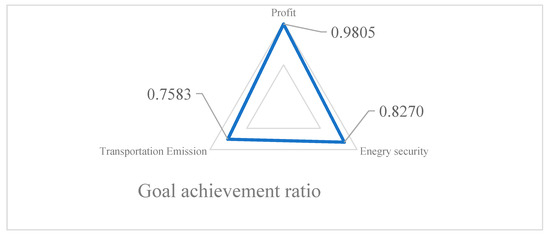
Figure 5.
FMMGPM goal achievement ratio.
Based on the value of the decision variables in the solution of FMMGPM, the configuration of the petroleum supply chain, as well as the product flow for both crude oil, gasoline and diesel oil, is depicted in Figure 6. This configuration includes all components of the upstream, middle-stream and downstream petroleum supply chains across Vietnam.
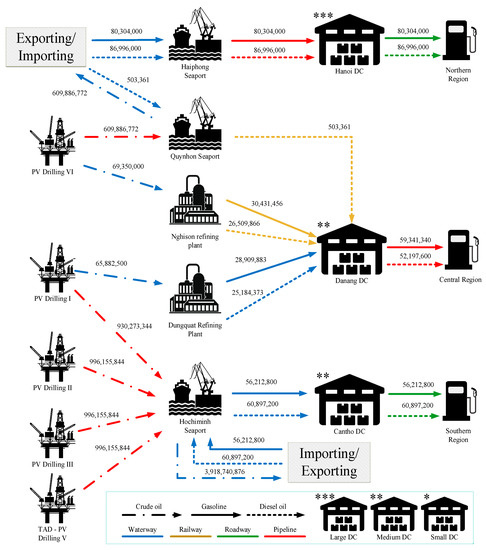
Figure 6.
FMMGPM Vietnam Petroleum Supply Chain Configuration and Transportation Flow (in barrel).
In the northern market, the supply chain establishes a large-scale distribution center that plays the role of storing and distributing gasoline and diesel. The amount of gasoline and diesel oil in this distribution center comes entirely from imported sources from abroad through the Haiphong seaport by pipeline.
In the south, the seaport in Hochiminh City is identified as the pharynx of the country’s crude oil exports, with a total annual output of approximately four billion barrels. This amount of crude oil is exploited at PV Drilling II, PV Drilling III, TAD—PV Drilling V and a part from PV Drilling I. In addition to its export role, this port is also in charge of importing all gasoline and diesel oil that is consumed in southern Vietnam. After being imported to the seaport of Hochiminh City, this product is transported by an inland waterway to the distribution center in the largest city in the Mekong Delta, Cantho. They are then distributed from the Can Tho distribution center to retailers in the southern market through the trucking system.
In general, the income of a petroleum supply chain depends mainly on crude oil exports. Meanwhile, approximately 69.7% of gasoline products and 73.9% of domestic diesel products are imported products. Owing to capacity limitations, post-refined products obtained from oil refineries are only sufficient to supply the central market. Therefore, other refinery projects that have been invested and developed by the government are expected to change to reduce the import rate. An overview of the transport infrastructure and supply chain configuration proposed by this optimization model using a combination of all modes of transport is considered, based on the advantages of each mode for each area’s infrastructure. According to the above configuration, the shared structure of transport modes used in the supply chain logistics system is shown in Figure 7. The chart presents the share of modes of transport for crude oil, gasoline and diesel. Because of the large transportation volume, the transportation of crude oil is primarily operated by pipelines (97.10%), and a negligible proportion by waterways (2.90%). For gasoline and diesel, the share of pipelines and waterways, which includes both inland waterways and coastal waterways, is approximately 34% to 36%. In addition, the trucking mode plays a key role in distributing gasoline and diesel from distribution centers to consumer markets that cover a large area, such as the north and south of Vietnam. Thus, trucking constitutes approximately one-fifth of the overall logistics system. Finally, with the lowest proportion (6.75–7.77%), the railway system shows its advantage in the long vertical and narrow horizontal areas, such as central Vietnam. In summary, the results of FMMGPM imply that the pipeline mode of transport, without infrastructure development in Vietnam, has the potential to have a positive impact, as well as a key role in the 3E sustainable development of Vietnam.
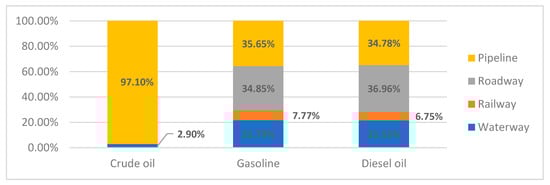
Figure 7.
Transportation mode sharing.
In addition, fixed costs such as distribution center development and pipeline systems account for a negligible proportion of variable costs, as shown in Figure 8. Accordingly, because of the large export volume of crude oil, the cost of exploiting this amount of oil also accounts for more than 80% of the variable cost structure. However, this study focuses on logistics systems with concerns about the necessity of developing pipeline systems, which directly affect transportation costs, as well as transportation emissions. According to the optimization results of the model, transportation costs account for approximately a quarter of the total variable costs. At the same time, it ranks second in terms of the impact of crude oil exploitation costs. In short, a five-year-project fixed-cost pipeline system that is insignificant compared to the large transportation needs, but designed at a few key segments in the supply network, is a factor that positively affects the efficiency of the supply chain.
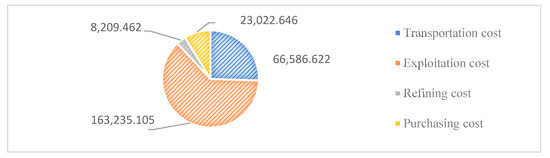
Figure 8.
Variable cost structure.
4.3. Uncertainty Sensitivity Analysis
Because fuzzy parameters are defined as triangular fuzzy numbers, as discussed in Section 3, the mean and boundary values of these fuzzy parameters, as well as their probabilities, can affect the model’s crisp form. Therefore, these variations also change the configuration of the petroleum supply chain, which is proposed through a multi-objective optimization solution. Therefore, in this section, we analyze the sensitivity of the models under the influence of uncertainty of fuzzy parameters through scenarios developed based on the following two factors, as shown in Figure 9. The first factor is the slope to the sides of the fuzzy triangular number, which is determined by the two variables and , as described in Equations (7) and (8). This factor implies the magnitude of volatility in both the positive and negative directions. Accordingly, this analysis develops four situations for this factor, as shown in Table 7.
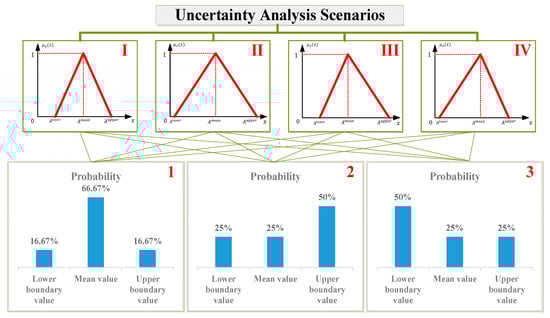
Figure 9.
Two-dimension Uncertainty Sensitivity Analysis.
Table 7.
Variation magnitude analyze situations.
The second factor is the probability distribution of the variation expressed in terms of the probability of occurrence of the mean and boundary values. Accordingly, there are three situations analyzed in this study: the probability of concentration on the mean value; the probability of bias on the upper boundary value; and the probability of bias on the lower boundary value. In the case of probability centered on the mean, this factor implies that the uncertainties have a high stability at the mean. The other two situations imply that volatility tends to go in either pessimistic or optimistic directions. By combining the above two factors, this study develops 12 scenarios whose notations and goal values of single-objective optimization are presented in Table 8. Scenario I-1’s solution is detailed above.
Table 8.
Scenario goal.
The optimization results of the scenarios show that the nature and intensity of the uncertainty factor can be the cause of the improvisation chain profits ranging from $20 billion to $30 billion. In particular, managers should pay attention to scenarios I-3 and IV-3, in which the uncertainty parameters tend to move in the negative direction. For energy security, the average value of the scenarios of 83.48% is an acceptable value in uncertain situations, as the market may also involve other private supply chains. Even so, the Group II and Group IV scenarios with large negative margins should be of interest to managers, due to the energy market supply levels of these two groups being lower than the rest. Finally, the comparison between scenarios suggests that scenarios with a wider margin, such as III-1, III-2 and III-3, have larger transportation emissions. In addition, in each group with the same volatility, the situation tends to develop positively. In other words, the expanded scale of operations also increases the impact of the supply chain on the environment.
In addition, the sensitivity analysis of the uncertainty parameters also shows that the proportion of the pipeline transport mode changes under different uncertainty situations. As shown in Figure 10, except for scenario III-3, fluctuations in the share of pipeline transport for crude oil were not significantly different between the scenarios. This implies that the pipeline system is a necessary investment for the transportation of crude oil, a product group with high traffic volumes, despite changing uncertainty conditions. In addition, this analysis also shows that the logistics system can utilize pipelines for gasoline and diesel by approximately 30% to 40%. In several scenarios where the probability of uncertainty parameters tends to increase in the negative direction, such as II-3 and III-3, other modes of transport can be achieved more economically. In short, according to the multi-objective optimization results in this study, the investment and development of pipeline transport systems at several locations in Vietnam brings long-term value in both economic and environmental terms.
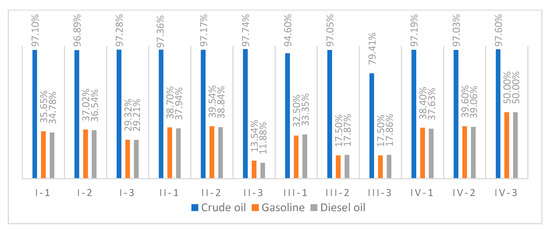
Figure 10.
Pipeline transportation proportion.
In summary, in this section, the authors have applied the optimization model to the Vietnam petroleum industry case, one of the countries with great potential for the oil and gas industry. This result suggests suitable configurations for the multimodal petroleum supply chain that are interested in sustainable development based on 3E. In addition, sensitivity analyses were performed to predict changes in design when uncertainty conditions fluctuated. According to the results of the optimization and uncertainty sensitivity analysis, the role of pipeline transport system development, which has not been fully developed in the infrastructural mode, is also confirmed. The FMMGPM is then applied to the case of Vietnam’s petroleum supply chain, which has both upstream and downstream activities.
5. Conclusions
An integrated methodology was presented to support tactical and strategic decisions in petroleum supply chain development. In the first step, the facilities’ potential coordinates were determined using a heuristic algorithm. Subsequently, a fuzzy multi-objective mixed integer programming optimization model was developed to provide solutions that harmoniously improve the economics, energy and environment of the multimodal petroleum supply chain. Min-max goal programming and fuzzy sets are approaches to augmenting the mixed-integer programming model to deal with this multiple objective and uncertain problem. The FMMGPM is then applied to the case of Vietnam’s petroleum supply chain, which has both upstream and downstream activities. The optimization results suggested the supply chain configuration for the Vietnamese situation, which simultaneously satisfied the 3E assessment. This solution includes decisions on transportation volume, transportation mode, facilities development, export/import volume and recommendations on pipeline system development. Then, uncertainty scenarios are developed and analyzed to assess the impact of these factors on the strategic decisions of Vietnam’s petroleum supply chain. The results of the analysis show that in some situations where uncertainty factors change in the downward direction, it affects the utilization of facilities such as the pipeline system. However, these impacts are not as significant as the long-term benefits that this infrastructure system has developed at the locations proposed by the model.
The main limitations of this study are the lack of expert opinion survey on the weights of the objective functions, as well as the intensity and probability predictive analyzes of uncertainty. In addition, for sustainable development, the offshore petroleum pipeline system development in this study has not considered marine-protected areas in Vietnam.
In future studies, the uncertainty that affects the supply chain configuration can be approached with more complex random distributions. In addition, other real-world properties may be of interest in models such as logistics services, transportation modes and other post-refinery products.
Author Contributions
Conceptualization, C.-N.W. and N.-L.N.; methodology, C.-N.W. and N.-L.N.; formal analysis, N.-L.N.; investigation, N.-L.N. and Y.-H.W.; data curation, N.-L.N. and K.-P.T.; writing—original draft preparation, N.-L.N. and K.-P.T.; writing—review and editing, C.-N.W. and N.-L.N.; project administration, C.-N.W.; and funding acquisition, C.-N.W. and Y.-H.W. All authors have read and agreed to the published version of the manuscript.
Funding
This research received no external funding.
Acknowledgments
The authors appreciate the support from the National Kaohsiung University of Science and Technology and the Ministry of Sciences and Technology in Taiwan. The authors would like to thank the anonymous reviewers of Axioms for their comments and recommendations, which helped to improve this article’s quality significantly.
Conflicts of Interest
The authors declare no conflict of interest.
Appendix A
Table A1.
Annual domestic demand (barrel).
Table A1.
Annual domestic demand (barrel).
| Region | Gasoline | Diesel Oil |
|---|---|---|
| Northern | 80,304,000 | 86,996,000 |
| Central | 68,832,000 | 74,568,000 |
| Southern | 80,304,000 | 86,996,000 |
Table A2.
Transportation-related parameter value.
Table A2.
Transportation-related parameter value.
| Parameter | Waterway | Railway | Roadway | Pipeline |
|---|---|---|---|---|
| Transportation Cost (USD/Barrel-Km) | 0.081 | 0.147 | 0.334 | 0.074 |
| Transportation Emission Factor (g/Barrel-km) | 2.17 | 1.58 | 4.09 | 0.68 |
Table A3.
Product-related parameter value.
Table A3.
Product-related parameter value.
| Parameter | Crude Oil | Gasoline | Diesel Oil |
|---|---|---|---|
| Annual export quota (Barrel) | 3,483,559,729 | - | - |
| Annual import quota (Barrel) | - | 3,710,546,452 | 2,473,697,635 |
| Expected refining ratio (%) | - | 46 | 40 |
| Sell price (USD/Barrel) | 60 | 121.88 | 90.31 |
| Refining cost (USD/Barrel) | - | 85.94 | 60.16 |
| Purchasing cost (USD/Barrel) | - | 92.32 | 70.22 |
| Exploitation cost (USD/Barrel) | 35 | - | - |
Table A4.
Facility-related parameter value.
Table A4.
Facility-related parameter value.
| Parameter | Scale | ||
|---|---|---|---|
| Small | Medium | Large | |
| Distribution center capacity (Barrel/year) | 100,000,000 | 150,000,000 | 200,000,000 |
| Distribution center fixed cost (USD) | 1,000,000 | 1,500,000 | 2,000,000 |
| Pipeline construction cost (USD/Km) | 2,880,000 | ||
Table A5.
Production-related parameter value.
Table A5.
Production-related parameter value.
| Parameter | Refining Plant | |
|---|---|---|
| Dungquat | Nghison | |
| Refining capacity (Barrel/year) | 69,350,000 | 73,000,000 |
| Rig Exploitation capacity (Barrel/year-rig) | 996,155,844 | |
Table A6.
Acronym list.
Table A6.
Acronym list.
| Abbreviation | Definition |
|---|---|
| 3E assessment | Economy, Energy and Environment |
| FMMGPM | Fuzzy Min-Max Goal Programming Model |
| FMOMILP | Fuzzy Multi-Objective Mixed Integer Linear Programming |
| MILP | Mixed Integer Linear Programming |
| MCDM | Multiple Criteria Decision Making |
| HCSC | Hydrocarbon Supply Chain |
| SCPSC | Sustainable Competitive Petroleum Supply Chain |
| TFN | Triangular Fuzzy Numbers |
| DC | Distribution Center |
References
- Brutschin, E.; Fleig, A. Innovation in the energy sector—The role of fossil fuels and developing economies. Energy Policy 2016, 97, 27–38. [Google Scholar] [CrossRef]
- Emenike, S.N.; Falcone, G. A review on energy supply chain resilience through optimization. Renew. Sustain. Energy Rev. 2020, 134, 110088. [Google Scholar] [CrossRef]
- Guliman, B.; Ionescu, S.; Niculescu, A. Modern Logistics Methods. FAIMA Bus. Manag. J. 2017, 5, 64–74. [Google Scholar]
- Yuan, M.; Zhang, H.; Wang, B.; Shen, R.; Long, Y.; Liang, Y. Future scenario of China’s downstream oil supply chain: An energy, economy and environment analysis for impacts of pipeline network reform. J. Clean. Prod. 2019, 232, 1513–1528. [Google Scholar] [CrossRef]
- Hosseini, S.; Ivanov, D. Bayesian networks for supply chain risk, resilience and ripple effect analysis: A literature review. Expert Syst. Appl. 2020, 161, 113649. [Google Scholar] [CrossRef]
- Chen, Z.; Ming, X.; Zhou, T.; Chang, Y. Sustainable supplier selection for smart supply chain considering internal and external uncertainty: An integrated rough-fuzzy approach. Appl. Soft Comput. 2020, 87, 106004. [Google Scholar] [CrossRef]
- Wang, C.-N.; Nhieu, N.-L.; Chung, Y.-C.; Pham, H.-T. Multi-Objective Optimization Models for Sustainable Perishable Intermodal Multi-Product Networks with Delivery Time Window. Mathematics 2021, 9, 379. [Google Scholar] [CrossRef]
- Wang, C.-N.; Nhieu, N.-L.; Tran, T.T.T. Stochastic Chebyshev Goal Programming Mixed Integer Linear Model for Sustainable Global Production Planning. Mathematics 2021, 9, 483. [Google Scholar] [CrossRef]
- Sahin, B.; Soylu, A. Multi-Layer, Multi-Segment Iterative Optimization for Maritime Supply Chain Operations in a Dynamic Fuzzy Environment. IEEE Access 2020, 8, 144993–145005. [Google Scholar] [CrossRef]
- U.S. Energy Information Administration. Vietnam Petroleum and Other Liquids; U.S. Energy Information Administration: Washington, DC, USA, 2021.
- Decision on the Approval of the Revised National Power Development Master Plan for the 2011–2020 Period with the Vision to 2030; Prime Minister; Vietnam Department of Prime Minister: Hanoi, Vietnam, 2016.
- Wang, B.; Liang, Y.; Zheng, T.; Yuan, M.; Zhang, H. Optimisation of a downstream oil supply chain with new pipeline route planning. Chem. Eng. Res. Des. 2019, 145, 300–313. [Google Scholar] [CrossRef]
- Ghasemzadeh, F.; Pishdar, M.; Antuchevičienė, J. Prioritization of Petroleum Supply Chains’ Disruption Management Strategies Using Combined Framework of Bsc Approach, Fuzzy Ahp and Fuzzy Choquet Integral Operator. J. Bus. Econ. Manag. 2017, 18, 897–919. [Google Scholar] [CrossRef] [Green Version]
- Eslami Baladeh, A.; Cheraghi, M.; Khakzad, N. A multi-objective model to optimal selection of safety measures in oil and gas facilities. Process Saf. Environ. Prot. 2019, 125, 71–82. [Google Scholar] [CrossRef]
- Grudz, V.; Grudz, Y.; Zapukhliak, V.; Chudyk, I.; Poberezhny, L.; Slobodyan, N.; Bodnar, V. Optimal Gas Transport Management Taking into Account Reliability Factor. Manag. Syst. Prod. Eng. 2020, 28, 202–208. [Google Scholar] [CrossRef]
- Sahebi, H.; Nickel, S.; Ashayeri, J. Strategic and tactical mathematical programming models within the crude oil supply chain context—A review. Comput. Chem. Eng. 2014, 68, 56–77. [Google Scholar] [CrossRef]
- Zimmermann, H.-J. Fuzzy Programming and Linear Programming with Several Objective Functions. Fuzzy Sets Syst. 1978, 1, 45–55. [Google Scholar] [CrossRef]
- Sear, T.N. Logistics Planning in the Downstream Oil Industry. J. Opl. Res. Soc. 1993, 44, 9–17. [Google Scholar] [CrossRef]
- Konak, A.; Coit, D.W.; Smith, A.E. Multi-objective optimization using genetic algorithms: A tutorial. Reliab. Eng. Syst. Saf. 2006, 91, 992–1007. [Google Scholar] [CrossRef]
- Jiao, J.-L.; Zhang, J.-L.; Tang, Y.-S. A Model for the Optimization of the Petroleum Supply Chain in China and its Empirical Analysis. In Proceedings of the 2010 International Conference on E-Business and E-Government, Guangzhou, China, 7–9 May 2010; pp. 3327–3330. [Google Scholar]
- Fernandes, L.J.; Relvas, S.; Barbosa-Póvoa, A.P. Downstream Petroleum Supply Chain Planning under Uncertainty. In Computer Aided Chemical Engineering; Elsevier: Amsterdam, The Netherlands, 2015; Volume 37, pp. 1889–1894. [Google Scholar]
- Wang, C.N.; Nhieu, N.L.; Nguyen, H.P.; Wang, J.W. Simulation-based Optimization Integrated Multiple Criteria Decision-Making Framework for Wave Energy Site Selection: A Case Study of Australia. IEEE Access 2021, 9, 167458–167476. [Google Scholar] [CrossRef]
- Attia, A.M.; Ghaithan, A.M.; Duffuaa, S.O. A multi-objective optimization model for tactical planning of upstream oil & gas supply chains. Comput. Chem. Eng. 2019, 128, 216–227. [Google Scholar]
- Sheel, A.; Singh, Y.P.; Nath, V. Managing agility in the downstream petroleum supply chain. Int. J. Bus. Excell. 2020, 20, 269–294. [Google Scholar] [CrossRef]
- Guo, Y.; Meng, X.; Wang, D.; Meng, T.; Liu, S.; He, R. Comprehensive risk evaluation of long-distance oil and gas transportation pipelines using a fuzzy Petri net model. J. Nat. Gas Sci. Eng. 2016, 33, 18–29. [Google Scholar] [CrossRef]
- Kim, Y.; Yun, C.; Park, S.B.; Park, S.; Fan, L.T. An integrated model of supply network and production planning for multiple fuel products of multi-site refineries. Comput. Chem. Eng. 2008, 32, 2529–2535. [Google Scholar] [CrossRef]
- Kuo, T.-H.; Chang, C.-T. Application of a Mathematic Programming Model for Integrated Planning and Scheduling of Petroleum Supply Networks. Ind. Eng. Chem. Res. 2008, 47, 1935–1954. [Google Scholar] [CrossRef]
- Al-Qahtani, K.; Elkamel, A. Multisite facility network integration design and coordination: An application to the refining industry. Comput. Chem. Eng. 2008, 32, 2189–2202. [Google Scholar] [CrossRef]
- Al-Othman, W.B.E.; Lababidi, H.M.S.; Alatiqi, I.M.; Al-Shayji, K. Supply chain optimization of petroleum organization under uncertainty in market demands and prices. Eur. J. Oper. Res. 2008, 189, 822–840. [Google Scholar] [CrossRef]
- Hamedi, M.; Zanjirani Farahani, R.; Husseini, M.M.; Esmaeilian, G.R. A distribution planning model for natural gas supply chain: A case study. Energy Policy 2009, 37, 799–812. [Google Scholar] [CrossRef]
- Jie, C.; Jing, L.; Shilong, Q. Transportation network optimization of import crude oil in China based on minimum logistics cost. In Proceedings of the 2010 IEEE International Conference on Emergency Management and Management Sciences, Beijing, China, 8–10 August 2010; IEEE: Piscataway, NJ, USA, 2010. [Google Scholar]
- Song, F.M. A comprehensive model for predicting CO2 corrosion rate in oil and gas production and transportation systems. Electrochim. Acta 2010, 55, 689–700. [Google Scholar] [CrossRef]
- Aizemberg, L.; Kramer, H.H.; Pessoa, A.A.; Uchoa, E. Formulations for a problem of petroleum transportation. Eur. J. Oper. Res. 2014, 237, 82–90. [Google Scholar] [CrossRef]
- Kazemi, Y.; Szmerekovsky, J. Modeling downstream petroleum supply chain: The importance of multi-mode transportation to strategic planning. Transp. Res. Part E Logist. Transp. Rev. 2015, 83, 111–125. [Google Scholar] [CrossRef]
- Ghezavati, V.R.; Ghaffarpour, M.H.; Salimian, M. A hierarchical approach for designing the downstream segment for a supply chain of petroleum production systems. J. Ind. Syst. Eng. 2015, 8, 1–17. [Google Scholar]
- Rocha, R.; Grossmann, I.E.; de Aragão, M.V.S.P. Petroleum supply planning: Reformulations and a novel decomposition algorithm. Optim. Eng. 2017, 18, 215–240. [Google Scholar] [CrossRef]
- Devold, H.; Graven, T.; Halvorsrød, S.O. Digitalization of Oil and Gas Facilities Reduce Cost and Improve Maintenance Operations. In Proceedings of the Offshore Technology Conference 2017, Houston, TX, USA, 1–4 May 2017. [Google Scholar]
- Anifowose, B.; Odubela, M. Methane emissions from oil and gas transport facilities—Exploring innovative ways to mitigate environmental consequences. J. Clean. Prod. 2015, 92, 121–133. [Google Scholar] [CrossRef]
- Creating a High-Performance Downstream Petroleum Supply Chain. 2000. Available online: http://kambing.ui.ac.id/onnopurbo/library/library-ref-eng/ref-eng-1/application/e-commerce/eichmann.pdf (accessed on 22 February 2021).
- Allen, D.T.; Torres, V.M.; Thomas, J.; Sullivan, D.W.; Harrison, M.; Hendler, A.; Herndon, S.C.; Kolb, C.E.; Fraser, M.P.; Hill, A.D.; et al. Measurements of methane emissions at natural gas production sites in the United States. Proc. Natl. Acad. Sci. USA 2013, 110, 17768–17773. [Google Scholar] [CrossRef] [PubMed] [Green Version]
- Hadizadeh, A.K.A.; Allen, J.K. Designing a Dynamic Bi-Objective Network Model for a Petroleum Supply Chain. In Proceedings of the 2012 Industrial and Systems Engineering Research Conference; Institute of Industrial and Systems Engineers (IISE): Peachtree Corners, GA, USA, 2012. [Google Scholar]
- Moradi Nasab, N.; Amin-Naseri, M.R. Designing an integrated model for a multi-period, multi-echelon and multi-product petroleum supply chain. Energy 2016, 114, 708–733. [Google Scholar] [CrossRef]
- Ghaithan, A.M.; Attia, A.; Duffuaa, S.O. Multi-objective optimization model for a downstream oil and gas supply chain. Appl. Math. Model. 2017, 52, 689–708. [Google Scholar] [CrossRef]
- Moradinasab, N.; Amin-Naseri, M.R.; Behbahani, T.J.; Jafarzadeh, H. Competition and cooperation between supply chains in multi-objective petroleum green supply chain: A game theoretic approach. J. Clean. Prod. 2018, 170, 818–841. [Google Scholar] [CrossRef]
- Alghanmi, A.; Yang, Z.; Blanco-Davis, E. Risk analysis of petroleum transportation using fuzzy rule-based Bayesian reasoning. Int. J. Shipp. Transp. Logist. 2020, 12, 39–64. [Google Scholar] [CrossRef]
- Chamani FoomaniDana, A.; Tamannaei, M. A Game-Theoretic Approach for Transportation of Oil Products in a Duopolistic Supply Chain. AUT J. Civ. Eng. 2020, 5, 7. [Google Scholar]
- Zhou, X.; Zhang, H.; Xin, S.; Yan, Y.; Long, Y.; Yuan, M.; Liang, Y. Future scenario of China’s downstream oil supply chain: Low carbon-oriented optimization for the design of planned multi-product pipelines. J. Clean. Prod. 2020, 244, 118866. [Google Scholar] [CrossRef]
- Elkamel, A.; Ba-Shammakh, M.; Douglas, P.; Croiset, E. An Optimization Approach for Integrating Planning and CO2 Emission Reduction in the Petroleum Refining Industry. Ind. Eng. Chem. Res. 2008, 47, 760–776. [Google Scholar] [CrossRef]
- Guyonnet, P.; Grant, F.H.; Bagajewicz, M.J. Integrated Model for Refinery Planning, Oil Procuring and Product Distribution. Ind. Eng. Chem. Res. 2009, 48, 463–482. [Google Scholar] [CrossRef]
- Lima, C.; Relvas, S.; Barbosa-Póvoa, A. Corrigendum to Designing and planning the downstream oil supply chain under uncertainty using a fuzzy programming approach. Comput. Chem. Eng. 2021, 153, 107400. [Google Scholar] [CrossRef]
- Pudasaini, P. Integrated planning of downstream petroleum supply chain: A multi-objective stochastic approach. Oper. Res. Perspect. 2021, 8, 100189. [Google Scholar] [CrossRef]
- Santibanez-Borda, E.; Korre, A.; Nie, Z.; Durucan, S. A multi-objective optimisation model to reduce greenhouse gas emissions and costs in offshore natural gas upstream chains. J. Clean. Prod. 2021, 297, 126625. [Google Scholar] [CrossRef]
- Panos, E.; Densing, M.; Volkart, K. Access to electricity in the World Energy Council’s global energy scenarios: An outlook for developing regions until 2030. Energy Strategy Rev. 2016, 9, 28–49. [Google Scholar] [CrossRef] [Green Version]
- Vietnam Gasoline Prices. 2021. Available online: https://www.globalpetrolprices.com/Vietnam/gasoline_prices/ (accessed on 21 March 2021).
- Annual Statistical Bulletin. 2020. Available online: https://asb.opec.org/ (accessed on 20 January 2021).
- Vietnam Oil Consumption. 2021. Available online: https://www.ceicdata.com/en/indicator/vietnam/oil-consumption (accessed on 20 February 2021).
- Vietnam Cities Database. 2020. Available online: https://simplemaps.com/data/vn-cities (accessed on 15 December 2020).
- Vietnam Energy Sector. 2019. Available online: https://www.ukabc.org.uk/wp-content/uploads/2019/07/Energy-Sector-Update-April-2019.pdf (accessed on 10 February 2021).
- The Vietnam Household Living Standards Survey 2018. May 2020. Available online: https://www.gso.gov.vn/en/data-and-statistics/2020/05/result-of-the-vietnam-household-living-standards-survey-2018 (accessed on 27 July 2021).
- Vietnam’s Crude Oil Export Price. 2021. Available online: https://tuoitre.vn/viet-nam-xuat-khau-dau-tho-gia-thap-20210322075805618.htm (accessed on 10 March 2021).
- Blancas, L.C.; El-Hifnawi, M.B. Facilitating Trade through Competitive, Low-Carbon Transport: The Case for Vietnam’s Inland and Coastal Waterways; The World Bank: Washington, DC, USA, 2014. [Google Scholar]
- Tencati, A.; Russo, A.; Quaglia, V. Sustainability along the global supply chain: The case of Vietnam. Soc. Responsib. J. 2010, 6, 91–107. [Google Scholar] [CrossRef]
- Oil and Gas Pipeline Construction Costs. 2021. Available online: https://www.gem.wiki/Oil_and_Gas_Pipeline_Construction_Costs#:~:text=For%20proposed%20onshore%20US%20gas,(%244.10%20million%2Fkm) (accessed on 30 December 2020).
Publisher’s Note: MDPI stays neutral with regard to jurisdictional claims in published maps and institutional affiliations. |
© 2022 by the authors. Licensee MDPI, Basel, Switzerland. This article is an open access article distributed under the terms and conditions of the Creative Commons Attribution (CC BY) license (https://creativecommons.org/licenses/by/4.0/).