Article

Value Creation Performance Evaluation for Taiwanese Financial Holding Companies during the Global Financial Crisis Based on a Multi-Stage NDEA Model under Uncertainty

Accounting School, Nanfang College, Guangzhou, No. 882, Wenquan Road, Guangzhou 510970, China
*
Author to whom correspondence should be addressed.
Axioms 2022, 11(2), 35; https://doi.org/10.3390/axioms11020035
Submission received: 29 November 2021 / Revised: 12 January 2022 / Accepted: 14 January 2022 / Published: 18 January 2022
(This article belongs to the Special Issue Intelligent and Fuzzy Systems)

Abstract

:
In this paper, we use the multi-stage network slacks-based measure model under uncertainty to evaluate the performance of Taiwanese financial holding companies (FHCs) from 2007 to 2012. We conceptualize the value creation process to be a two-stage framework, as the profitability and the marketability stages with a serial-linkage relationship, in order to solicit more information from the value creation process of FHCs. Under this framework, the profitability stage can be further divided into banking, insurance, and securities profitability sub-stages. In addition, we further extend the proposed model mentioned above to not only incorporate the NPLs as the undesirable output in the banking profitability stage but also use the fuzzy set approach to process its uncertainty. Results indicate that the discriminatory ability of our model is higher when we simplify the variables in the model specification. We also find that all Taiwanese FHCs in that particular period were “inefficient performers”, which is mainly attributed to the weak profitability performance, especially in banking service. We postulate that the global financial crisis, the US subprime crisis in particular, had a negative effect on the value creation performance of Taiwanese FHCs; however, they gradually recovered and improved their performance after the crisis.

1. Introduction

Economic development in Taiwan is closely tied to the operation of its financial system that involves government authorities, financial markets, and financial service enterprises. As the economy grows, calls for the liberation of financial liberalization becomes louder. In response, the Taiwan government rolled out necessary reforms to ensure the stability of the financial system. In the early 1990s, the Taiwan government deregulated its financial markets, opening them to both foreign and domestic private institutions. As Taiwan joined the World Trade Organization (WTO) in 2002, one of its duties was to gradually open up the financial markets, allowing more foreign institutions to enter. Domestic financial institutions were thus exposed to more competition. Enhancing the competitiveness of domestic financial institutions, as well as making Taiwan a regional financial service hub, have become important policy goals under this circumstance [1].
The scale of the financial market in Taiwan is relatively small, however, limiting the growth potential of value creation, compared to other developing countries in Asia. The Financial Institution Merger Act and the Financial Holding Company Act were introduced in June 2001, to encourage domestic financial institutions to consolidate and become a financial holding company (FHC) in order to enhance its competitive ability. Nowadays, some FHCs are ranked in the Taiwanese 10 largest enterprises in terms of market scale, and have been considered to be more market oriented. Generally speaking, there are other obstacles still present in the Taiwanese financial system, such as risk tolerance of outside shock and fierce competition among Taiwanese FHCs, as well as other domestic and foreign financial institutions. Therefore, it will be of interest to understand the FHCs’ value creation performance for the managers or the political executive to augment the information matrix for investment decisions and resource deployment, by gaining a deeper insight on the performance status and changes in each financial service.
DEA is a performance evaluation model with a multi-input and multi-output framework, firstly introduced by Charnes et al. [2], in contrast to models with a single financial criterion [3]. Previous studies have applied this technique to several financial services such as banking [4,5,6,7,8,9,10], securities [11] and insurance [12,13]. However, since modern industrial or service operations usually involve a complex organization structure, it could be challenging to evaluate performance measurements and provide sufficient information to the firms’ management teams with the conventional DEA structure [14]. An evaluation framework with a network structure is proposed to look inside the black box to capture the internal structure of the operational process, e.g., two-stage activities, which provides rich and valuable managerial information to managers on how to improve their efficiency in various industrial applications [15,16,17,18,19,20,21,22]. Tone and Tsustui [23] introduced the slacks-based measure (SBM) under a network DEA (NDEA) framework, namely the network slacks-based measure (NSBM), in which the slack of each decision variable represents the difference between its actual value and the “efficient value”. These slacks can serve as directional guides to decision makers for improvement. Kao [24] postulated that because there was no standard form for an NDEA model, it then had higher applicability.
There has been an abundant amount of literature on the performance evaluation of banks in Taiwan (e.g., Chao et al. [25]; Kao and Liu [24] Lin and Chiu [7]; Juo et al. [26]); however, research on the performance of FHCs is still relatively scant (Chiou [27]; Lo and Lu [28]; Liu [29]). When assessing the performance of Taiwanese FHCs, the value of an FHC is ultimately assessed in the stock market. That is, during the process of merger and acquisition (M&A) to form an FHC, the merger and acquisition costs are closely related to the market value of the companies. Lo and Lu [28] employed a two-stage evaluation framework, comprising of the profitability process and the marketability process. In their model, the revenue and the profit were treated as intermediate outputs from the profitability stage, and then to become intermediate inputs in the marketability stage. However, the previous two-stage evaluation framework treated the profitability and marketability for measurement separately. The dilemma of intermediate variables between the profitability and marketability stages will occur. Therefore, in this paper, a two-stage evaluation is proposed under a single programming framework.
It has been recognized that the discriminatory ability of the DEA-based model is an important issue. As Golany and Roll [30] proposed, the minimum required ratio of the number of DMUs to the sum of the model variables is two. Lo and Lu [28] considered seven variables in their model, where they not only had three inputs and two outputs at the profitability stage but also two inputs and two outputs at the marketability stage. Since there were 15 to 16 Taiwanese FHCs (DMUs) created over the research period, a simplified version of variables selection based on the work of Lo and Lu, 2009, may be considered to further satisfy the variable–DMU ratio requirement. In addition, previous two-stage evaluation frameworks designed for Taiwanese FHCs have not fully considered the performance of various services provided in the profitability stage. Therefore, a multi-stage network evaluation framework, including banking profitability, insurance profitability, securities profitability, and FHC marketability, is proposed to more accurately represent the operational nature of listed Taiwanese FHCs.
Beginning in 2007, the subprime mortgage crisis originated from the U.S. and caused the global financial crisis, which had a strong spillover to the world economy. The lack of credit risk management can be considered the main reason why the U.S. subprime crisis occurred, and that is an important issue that gradually took more and more of the supervisor’s attention. For the operation of a financial institution, particularly in banking, both the capital adequacy guideline from Basel III [31] and the financial instrument recognition from no. 9 of the International Financial Report Standard (IFRS) [32] are safety valves. For example, credit risk is normally represented by a non-performing loan (NPL), which is a kind of possible expected credit loss and must be recognized in the statement of comprehensive income at the end of the fiscal year. Hence, it is vital for the performance evaluation of banking, and then is incorporated into the proposed model as an undesirable output. However, the question is that the measurement of whether these expected NPLs will be an actual loss or not in the future is subject to the decision-maker’s attitude, such as whether they are pessimistic, neutral, optimistic, or their attitude is unknown, at the moment a decision is made. Therefore, uncertainty is an obvious feature of NPL, which should be considered on the performance evaluation purpose.
Fuzzy set is a widely-used approach to characterize the uncertainty in real-time problems originated from human subjectivity [33]. In real-world practice, incorporating the fuzzy set with DEA model is developed to deal with the performance evaluation under uncertainty [34]. In addition, in comparison with type-1 fuzzy sets, type-2 fuzzy sets with fuzzy membership function are more suitable to handle the uncertainty problem [35]. Zhou et al. [10] employed type-2 fuzzy sets with fuzzy membership functions to handle the uncertain NPLs of Chinese banks. In order to defuzzy the type-2 fuzzy sets of the NPLs for the DEA model, they also used not only a general expectation reduction approach with an optimistic parameter to represent the estimated NPLs originated from the different subjective attitudes of decision makers, but also the alpha-cut method to obtain the reduced value of type-2 fuzzy NPLs.
After considering the above, in this paper, a multi-stage NDEA model is developed to value creation performance evaluation for Taiwanese financial holding companies during the global financial crisis when considering the uncertainty of NPL and the profitability of the banking, insurance, and securities service environment. The main contributions of this study to the existing literature are summarized as the following aspects. First, we improve the two-stage evaluation framework employed by Seiford and Zhu [5] and Lo and Lu [28], by reducing the number of decision variables in enhancing the applicability and discriminatory power of the proposed model when the number of DMUs is limited. Second, to the best of our knowledge, this study is the first to consider the profitability performance of three different financial services in the value creation process of FHCs, where various financial services’ profitability and marketability are linked, to provide more managerial information. Third, investigating the value creation performance of FHCs in Taiwan, we are also able to estimate the influence of the global financial crisis on the Taiwanese financial system. We further extend the proposed model mentioned above not only to incorporate the NPLs as the undesirable output in the banking profitability stage but also to use the fuzzy set approach to process its uncertainty. Given the reliable evaluation, it is important to note that the global financial crisis, the US subprime crisis in particular, had a negative effect on the value creation performance of Taiwanese FHCs, and yet they have also gradually recovered after the US subprime crisis.
The remainder of this paper is organized as follows. In Section 2 we present the two-stage evaluation framework on the performance of financial holding companies in Taiwan. In Section 3 we introduce the development of the proposed two-stage NSBM model. The empirical results are discussed in Section 4, and Section 5 concludes the study.

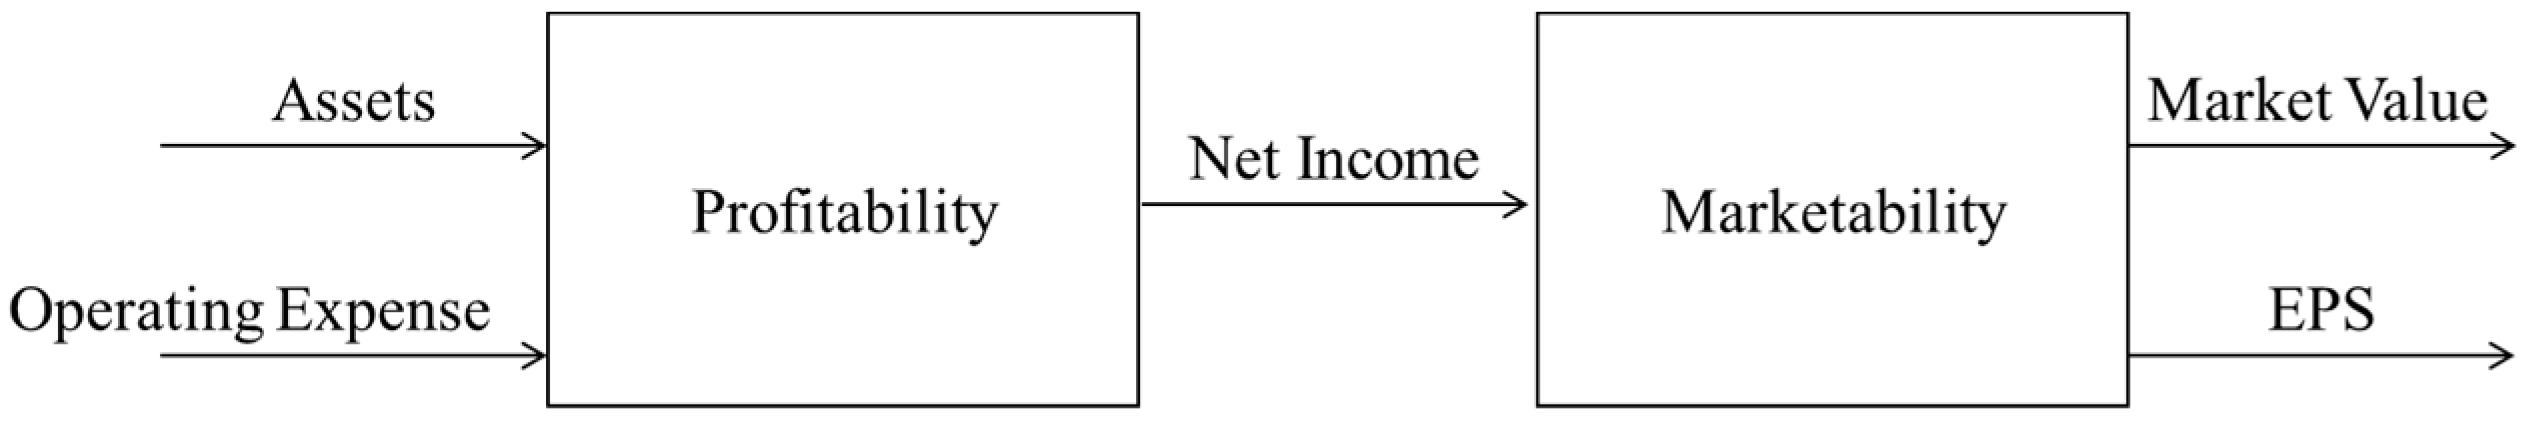
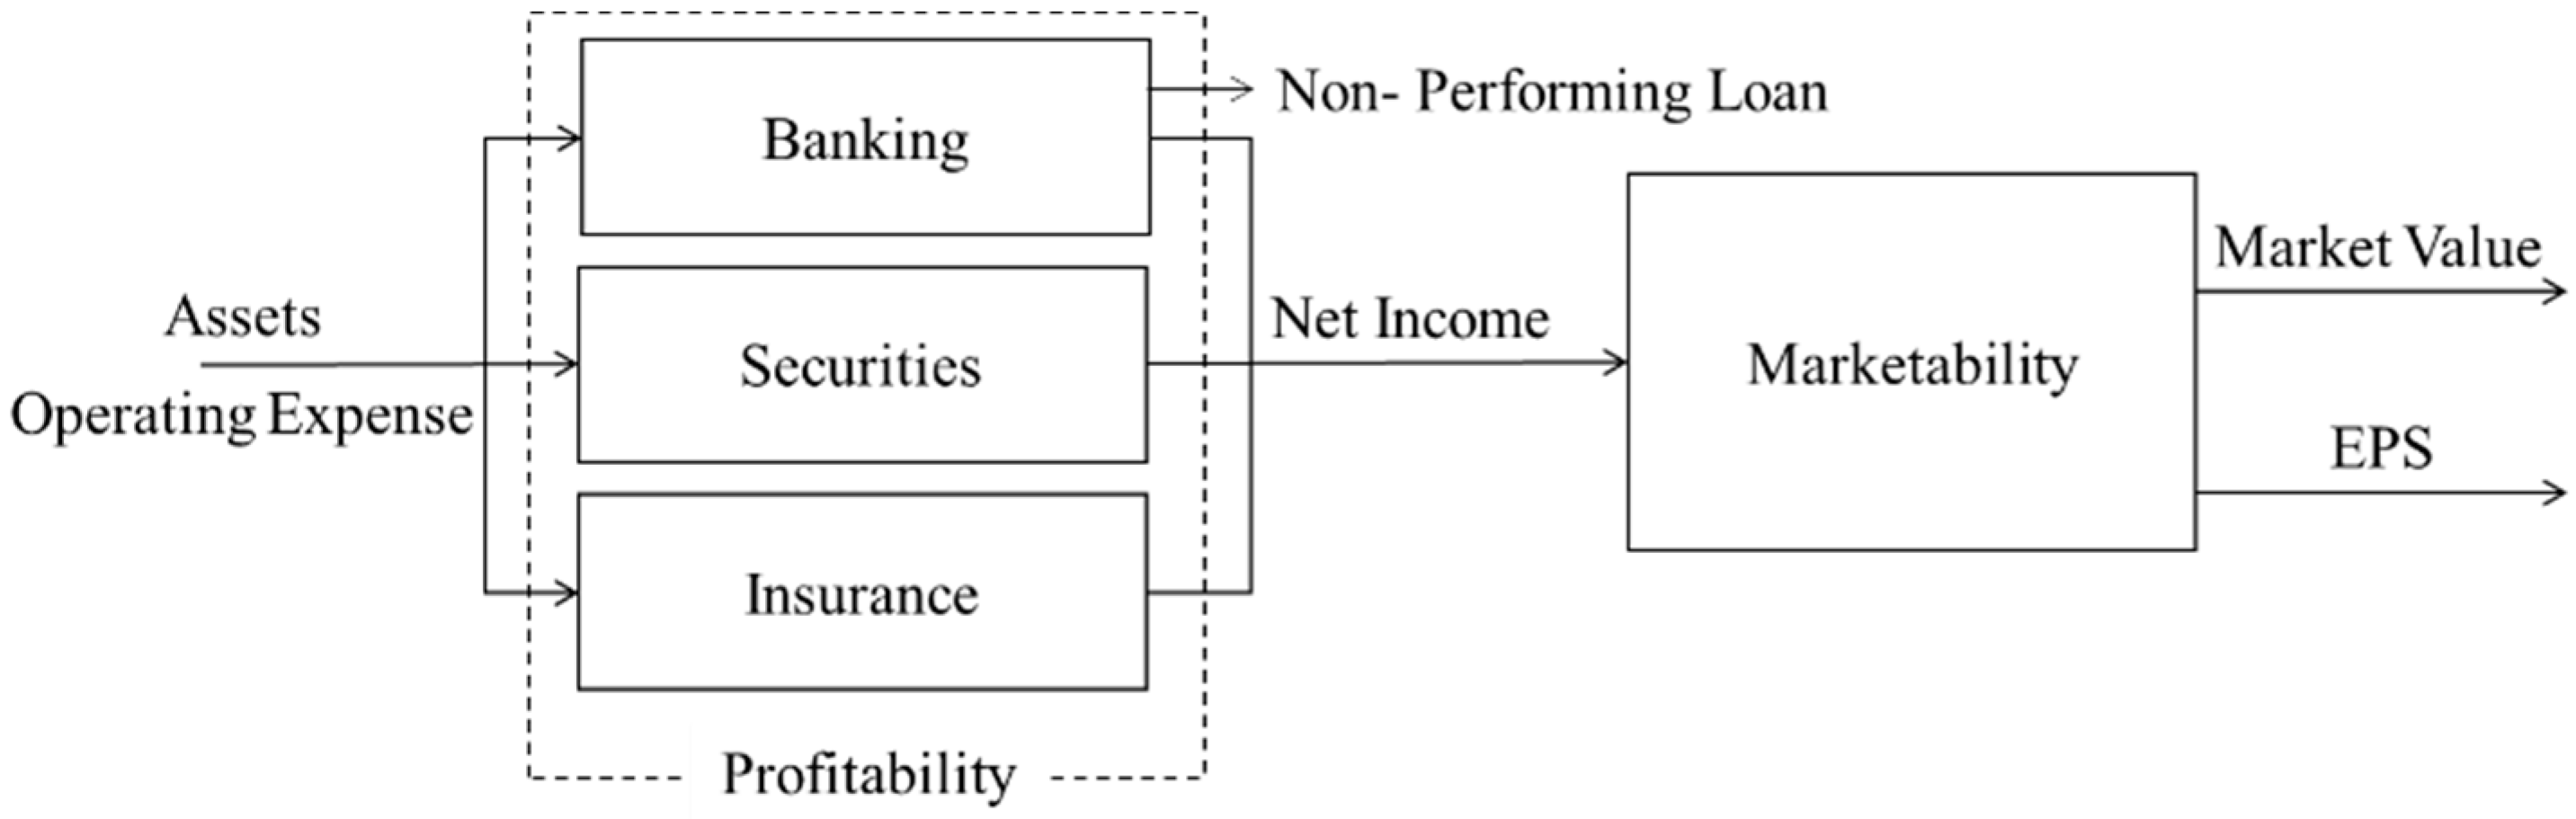
2. Conceptual Evaluation Framework of Financial Holding Companies in Taiwan

Seiford and Zhu [5] proposed a two-stage performance DEA model with profitability and marketability stages, to measure the performance of the listed US commercial banks, in which each stage performance was calculated independently. Later, Lo and Lu [28] employed the same two-stage evaluation framework to explore the value creating process of FHCs in Taiwan, under the slack-based measure (SBM) model to enhance the model applicability when compared to conventional DEA models. They dropped some variables in the Seiford and Zhu model [28], while both the performance of the profitability stage and marketability stage of each FHC were still individually evaluated.
Kao and Hwang [1] confirmed that the series relationship of the two sub-processes can provide a more informative evaluation. Therefore, the value creation process of Taiwanese FHCs we proposed extended the framework of Seiford and Zhu [5] and Lo and Lu [28]. The serial linkage between the profitability stage and the marketability stage is employed, where the output from the previous stage (profitability) is the input of the following stage (marketability).
To appropriately select variables into our proposed model we referred to the setting of Seiford and Zhu [5] and Lo and Lu [28], as well as some business rationale. The profitability stage aims to measure how well an FHC utilizes the input resources to generate relevant earnings. Two financial indicators commonly used to measure a firm’s profitability for a specific period are return on assets (ROA) and return on equity (ROE). From the perspective of the accounting equation, assets come from the financing requirement through liabilities and shareholders’ equity. We argue that ROA is a more appropriate indicator for the operating ability of a firm’s manager, who is normally also a trustee. Therefore, in the profitability stage, we consider two inputs, assets and operating expense, and the equity is preliminarily removed from the output consideration.
Marketability efficiency is also critical to measure the real value of an FHC, as this is often the concern of stockholders who track variations in stock price. Profitability is seen to be a critical factor to influence the marketability. The desirable output from the profitability stage can be treated as the intermediate variable to link the profitability stage and the marketability stage. For this purpose, we further discuss the correlation between the seven preliminarily selected variables in Lo and Lu [28], as another criterion for variable selection in our proposed framework. That is, if two variables have a strong correlation, we will keep them in the variables set. As the correlation between net income and EPS (MV) is stronger than that of the sales revenue and EPS (MV), we, in the end, decided to remove sales revenue as the desirable output in the profitability stage as well as the intermediate variable between the profitability stage and the marketability stage. Meanwhile, EPS and the variation in market value became the outputs to measure the marketability efficiency of each FHC.
Moreover, it is worth noting that as there is no carryover variable that links two consecutive accounting periods, the proposed two-stage model is merely a static analysis. It is then more appropriate to use the flow measure, instead of the capitalization measure for the evaluation purpose. In that sense, we use the arithmetic average of assets measured between two consecutive accounting periods (instead of assets on 31 December of specific year) to be the input variable. Similarly, we calculate the variation in market value to reflect the difference in the firm’s fair value (a firm’s closing price multiplied by its outstanding common stock on 31 December of each fiscal year) between two consecutive financial periods. The initial modified two-stage value creation framework of FHC is shown in Figure 1.
Because FHCs can legally diversify their range of financial services for a synergy effect, they often offer financial services that are not permissible for ordinary banks, such as insurance underwriting, securities dealing and underwriting, and investment advisory services. In Taiwan, FHCs mainly provide three financial services: banking (intermediation), insurance (risk bearing), and securities (financial instrument investing). In this study, we decomposed the profitability stage of FHCs into that of three main subsidiaries responsible for each financial services. The issue of risk management on banking is being paid more and more attention after the subprime mortgage crisis. According to the IFRS guideline, the credit risk of financial instruments needs to be considered in terms of their possible losses in future periods as a part of the profitability evaluation. Here, for the operation of banking as an example, the main credit risk for its business model is the non-performing loans (NPLs) that are loans in which the borrower has not made repayments of principal and/or interest, and, therefore, it will be incorporated into our proposed model as an undesirable output of the profitability stage in the banking subsidiary. However, the NPL is the probability-weighted estimate of credit losses on the loan over the expected life. Following Zhou et al. [10], triangular type-2 fuzzy numbers are mainly employed to describe the NPLs in a banking environment because the uncertainty of that may be subject to the decision maker and their risk attitude, either pessimistic, neutral, or optimistic.
We made three important adjustments to the original two-stage performance evaluation framework proposed by Seiford and Zhu [5] and Lo and Lu [28]. (1) We dropped the equity and net revenue keeping total asset and net income in the profitability process; (2) we replaced the original specific year-end figures with the average of the assets and the variable firm value; (3) the profitability performance process of an FHC was further decomposed into three indirect financial subsidiary services, forming a network structure that established a serial link between subsidiaries’ profitability and parent marketability; (4) the uncertainty of credit risk in the banking service was also included.
Above all, we hope to provide more reliable managerial information and enrich the DEA-based evaluations in the various literatures. The operational process of FHCs is conceptualized as a network framework as incorporating parallelly-equaled subsidiaries’ profitability stages and serial linkage between these and the marketability stage, as shown in Figure 2; the selected variables are listed in Table 1.

3. Model Development

3.1. The Concept of Network Data Envelopment Analysis

After the introduction of the non-parametric programming approach of Charnes et al. [2], DEA may have been the most commonly used method to measure the relative performance of homogeneous DMUs in a multi-input and multi-output setting [36]. Cooper et al. [37] pointed out that DEA has several well-known advantages: (1) It does not require a functional production relationship between inputs and outputs to be pre-specified; (2) it works relatively well with a small sample; (3) it identifies inefficient DMUs and sources of inefficiency, which provides valuable information for performance management. However, the internal activities/divisions within the organization were overlooked and there was no information on the relations between the efficiency of each activity/division and that of the organization as a whole.
To tackle this problem, the NDEA model that accounts for divisional efficiencies as well as the overall efficiency in a unified framework has emerged. Färe and Grosskopf [38] were the first to introduce an NDEA model that discussed variations in the standard DEA model. The NDEA model is designed to motivate managers to allocate resources more efficiently [39]. The general NDEA model utilizes the radial and oriented measure of efficiency similar to the conventional DEA assumption. The main target of evaluation of this input- and output-oriented model is either input reduction or output expansion. A radial model implies that the input or the output undergoes proportional change.
However, in the real world there is rarely the case that fits this proportional change assumption. Tone and Tsutsui [23] introduced a network DEA model with SBM approach, called the network SBM (NSBM), which utilized the slacks variable to evaluate multiple stages/processes efficiency with a serial connection or parallel structure. As it could be modelled in a non-radial setting, it was more suitable for measuring efficiencies when the inputs and outputs change non-proportionally. This model also had another advantage: in the non-oriented framework, it could accommodate a contraction of inputs and an expansion of outputs simultaneously.

3.2. The Two-Stage NSBM Model Development under Uncertainty

As noted in the previous section, we adopted the two-stage NSBM model proposed by Tone and Tsutsui [23], to deal with the disproportionality in the input–output changes, to rate the value creation performance of Taiwanese FHCs, and further identify the sources of inefficiencies in terms of profitability and marketability.
Supposing that there are n Taiwanese FHCs treated as independent decision-making units (DMUs) ( j = 1 , , n ) . The value creation process of DMU consists of two stages, profitability P and marketability M , and then the profitability stage can be further decomposed into three subsidiaries, as banking P B , insurance P I , and securities P S , meaning that the profit of FHC is made up by contributions from those three main financial services. The relative performance scores of an FHC in each stage are of ratio values, ranging between 0 and 1, measuring its efficiency in resource (inputs) utilization and outcome (outputs) generation.
The production possibility set of Taiwanese FHCs in time t is defined as follows
P t F H C = { X j t ( B , S , I ) , A , X j t ( B , S , I ) , O P E , B Y j t B , N P L , Z j t ( B , I , S M ) , N I , Y j t M , E P S , Y j t M , V M V }
For the profitability stage of the banking subsidiary in each Taiwanese FHC, both assets X j t B , A and operating expenses X j t B , O P E are inputs to produce the non-performing loans B Y j t B , N P L and net income Z j t ( B M ) , N I , and the latter also represents an intermediate link connection between the profitability stage of the banking subsidiary and the marketability stage of the FHC. The “slacks” are used to reflect the potential reductions in X j t B , A , X j t B , O P E , and B Y j t B , N P L , and the potential increases in Z j t ( B M ) , N I , which are the constraints incorporated into the evaluation model programming as follows
j = 1 n λ j t B X j t B , A = X j t B , A + S j t B , A j = 1 n λ j t B X j t B , O P E = X j t B , O P E + S j t B , O P E j = 1 n λ j t B Z j t ( B M ) , N I = Z j t ( B M ) , N I S j t ( B M ) , N I + j = 1 n λ j t B B Y j t B , N P L = B Y j t B , N P L + S j t B , N P L λ j t B 0 , j = 1 , , n , t = 1 , , T
where λ j t B is the intensity variable corresponding to the profitability stage of the banking subsidiary in year t . S j t B , A , S j t B , O P E , S j t ( B M ) , N I + , and S j t B , N P L are the slacks in X j t B , A , X j t B , O P E , and Z j t ( B M ) , N I .
According to the loan recognition requirement from the IFRS, a bank must disclose their annual NPL as well as the credit impairment loss associated with its loan on the statement of financial position and their comprehensive income based on the expected credit loss model. However, the NPL merely represents that they may suffer the loss, but the creditor does not know, ultimately, whether or when the borrower can repay the loan and interest. The expected credit loss measurement from NPLs is therefore an uncertainty problem. The theory of fuzzy set was initially introduced by Zadeh [40] and it is an effective tool used to handle the uncertainty problem in the real world. As it is criticized that the membership function of a type-1 fuzzy set has no uncertainty associated with it, e.g., an assumption of fixed membership function, Zadeh [41] proposed the type-2 fuzzy set with a fluctuating membership function; therefore, the primary memberships have a range between 0 and 1 instead of binary logic.
Supposing that a triangular type-2 fuzzy variable F is denoted by F = ( r 1 ; r 2 ; r 3 ; σ l ; σ r ) , where σ l and σ r are two parameters used to measure the degree of uncertainty and F takes the value range between r 1 and r 3 . If σ l = σ r = 0 , F is a fuzzy number. In this paper, we use these triangular type-2 fuzzy variables to describe the NPLs before, which are fed into the proposed model programming. A triangular type 2 fuzzy NPL of each DMU in year t is defined as B Y j t B , N P L   =   ( B Y j t 1 B , N P L , B Y j t 2 B , N P L , B Y j t 3 B , N P L , σ l B , N P L , σ r B , N P L ) . Following Zhou et al. [10], both the general expectation reduction method and the α -cut method are used to transform the triangular type 2 fuzzy NPL B Y j t B , N P L into an explicit number B Y j t , F z B , N P L with parameters λ , α , and ω . λ is the optimistic–pessimistic attitude parameter. λ = 1 represents an extremely optimistic attitude, λ = 0 . 5 indicates a natural attitude, and λ = 0 shows an extremely pessimistic attitude. α is a predetermined parameter of the α cut method used to gather the left bound and right bound, as B Y j t , L α ( F z ) B , N P L and B Y j t , R α ( F z ) B , N P L , respectively. In addition, we would like to obtain a numeric number instead of both B Y j t , L α ( F z ) B , N P L and B Y j t , R α ( F z ) B , N P L incorporated into the proposed model at the same time. ω is the predetermined weight given by the DMU, and the expected NPL of each DMU in year t will be a liner combination of B Y j t , L α ( F z ) B , N P L and B Y j t , R α ( F z ) B , N P L with ω and 1 ω , that is, B Y j t , L α ( F z ) B , N P L is measured by ω B Y j t , L α ( F z ) B , N P L + ( 1 ω ) B Y j t , R α ( F z ) B , N P L . Each of λ = 0 . 5 , α = 0.2 , and ω = 0.5 are predetermined parameters in this paper to handle the uncertainty of NPL. Here, the last equation in Equations (1) can be replaced as Equation (2) as follows
j = 1 n λ j t B ( ω B Y j t , L α ( F z ) B , N P L + ( 1 ω ) B Y j t , R α ( F z ) B , N P L ) = ( ω B Y j t , L α ( F z ) B , N P L + ( 1 ω ) B Y j t , R α ( F z ) B , N P L ) + S j t B , N P L
For the profitability stage of the insurance subsidiary in each Taiwanese FHCs, both assets X j t I , A and operating expenses X j t I , O P E are inputs to produce net income Z j t ( I M ) , N I , and the latter is an intermediate link connection between the profitability stage of the insurance subsidiary and the marketability stage of FHC. The slacks of X j t I , A , X j t I , O P E , and Z j t ( I M ) , N I are the constraints incorporated into the evaluation model programming as Equation (3) as follows
j = 1 n λ j t I X j t I , A = X j t I , A + S j t I , A j = 1 n λ j t I X j t I , O P E = X j t I , O P E + S j t I , O P E j = 1 n λ j t I Z j t ( I M ) , N I = Z j t ( I M ) , N I S j t ( I M ) , N I + λ j t I 0 , j = 1 , , n , t = 1 , , T
where λ j t I is the intensity variable corresponding to the profitability stage of the banking subsidiary in year t . S j t I , A , S j t I , O P E , and S j t ( I M ) , N I + are the slacks in X j t I , A , X j t I , O P E , and Z j t ( I M ) , N I , respectively.
For the profitability stage of the securities subsidiary in each Taiwanese FHC, both assets X j t S , A and operating expenses X j t S , O P E are inputs to produce net income Z j t ( S M ) , N I , and the latter is an intermediate link connection between the profitability stage of the insurance subsidiary and the marketability stage of the FHC. The slacks of X j t S , A , X j t S , O P E , and Z j t ( S M ) , N I are the constraints incorporated into the evaluation model programming as Equation (4) as follows
j = 1 n λ j t S X j t S , A = X j t S , A + S j t S , A j = 1 n λ j t S X j t S , O P E = X j t S , O P E + S j t S , O P E j = 1 n λ j t S Z j t ( S M ) , N I = Z j t ( S M ) , N I S j t ( S M ) , N I + λ j t S 0 , j = 1 , , n , t = 1 , , T
where λ j t S is the intensity variable corresponding to the profitability stage of the banking subsidiary in year t . S j t S , A , S j t S , O P E , and S j t ( S M ) , N I + are the slacks in X j t S , A , X j t S , O P E , and Z j t ( S M ) , N I , respectively.
For the marketability stage of Taiwanese FHCs, Z j t ( B M ) , N I , Z j t ( I M ) , N I , and Z j t ( S M ) , N I are the three intermediate links used to produce both earning per share (EPS) Y j t M , E P S and variation in market value (VMV) Y j t M , V M V . The slacks of Z j t ( B M ) , N I , Z j t ( I M ) , N I , Z j t ( S M ) , N I , Y j t M , E P S and Y j t M , V M V are the constraints incorporated into the evaluation model programming as Equation (5) as follows
j = 1 n λ j t M Z j t ( B M ) , N I = Z j t ( B M ) , N I + S j t ( B M ) , N I + j = 1 n λ j t M Z j t ( I M ) , N I = Z j t ( I M ) , N I + S j t ( I M ) , N I + j = 1 n λ j t M Z j t ( S M ) , N I = Z j t ( S M ) , N I + S j t ( S M ) , N I + j = 1 n λ j t M Y j t M , E P S = Y j t M , E P S S j t M , E P S + j = 1 n λ j t M Y j t M , V M V = Y j t M , V M V S j t M , V M V + λ j t M 0 , j = 1 , , n , t = 1 , , T
where λ j t M is the intensity variable corresponding to the profitability stage of the banking subsidiary in year t . S j t ( B M ) , N I + , S j t ( I M ) , N I + , S j t ( S M ) , N I + , S j t M , E P S + , and S j t M , V M V + are the slacks in Z j t ( B M ) , N I , Z j t ( I M ) , N I , Z j t ( S M ) , N I , Y j t M , E P S , and Y j t M , V M V , respectively.
The stage and value creation performances based on the proposed two-stage evaluation framework are estimated by the single programming approach, namely, the network slacks-based measure (NSBM) proposed by Tone and Tsutsui [23]. There are some constraints related to the intermediate link that should be incorporated, which consider the dual role of the intermediate links between consecutive stages, as Equation (6) as follows
j = 1 n λ j t B Z j t ( B M ) , N I = j = 1 n λ j t M Z j t ( B M ) , N I j = 1 n λ j t I Z j t ( I M ) , N I = j = 1 n λ j t M Z j t ( I M ) , N I j = 1 n λ j t S Z j t ( S M ) , N I = j = 1 n λ j t M Z j t ( S M ) , N I
Here, following Tone and Tsutsui [23], the non-oriented two-stage NSBM model is established under the assumption of variable return to scale (VRS). The objective function of evaluating the value creation performance of Taiwanese FHCs, ρ j t V C , is evaluated by the following programs
ρ j t V C = min w B [ 1 1 2 [ S j t B , A X j t B , A + S j t B , O P E X j t B , O P E + S j t B , N P L B Y j t B , N P L ] ] + w I [ 1 1 2 [ S j t I , A X j t I , A + S j t I , O P E X j t I , O P E ] ] + w S [ 1 1 2 [ S j t S , A X j t S , A + S j t S , O P E X j t S , O P E ] ] + w M [ 1 ( S j t ( B M ) , N I Z j t ( B M ) , N I + S j t ( I M ) , N I Z j t ( I M ) , N I S j t ( S M ) , N I Z j t ( S M ) , N I ) ] w B [ 1 + [ S j t ( B M ) , N I + Z j t ( B M ) , N I ] ] + w I [ 1 + [ S j t ( I M ) , N I + Z j t ( I M ) , N I ] ] + w S [ 1 + [ S j t ( S M ) , N I + Z j t ( S M ) , N I ] ] + w M [ 1 + 1 2 ( S j t M , V M V + Y j t M , V M V + S j t M , E P S + Y j t M , E P S ) ]
subject to Equations (1)–(6) and Equation (8) as follows
w B + w I + w S + w M = 1
where w B , w I , w S , and w M are also user-specified weights for the profitability stage of three financial service subsidiaries and the marketability stages of FHC, respectively, which represents its specific contribution to the value creation performance of each FHC. Therefore, if a general two-stage framework, including the profitability stage and marketability stage, is used, the weight assigned to the profitability stage and marketability stage are the same as 0.5, respectively, because we assume that they are equally important to the operational performance for Taiwanese FHCs. Moreover, if the profitability stage is decomposed into the three main financial services as we proposed, in order to be a modified multi-stage framework, the weight assigned to the three financial services in the profitability stage are equal to one third of 0.5, so 0.167, respectively.
ρ j t P and ρ j t M are defined to represent the stage performance scores in the profitability and marketability stages, which are evaluated in Equations (9) and (10), respectively.
ρ j t P = min w B [ 1 1 2 [ S j t B , A X j t B , A + S j t B , O P E X j t B , O P E + S j t B , N P L B Y j t B , N P L ] ] + w I [ 1 1 2 [ S j t I , A X j t I , A + S j t I , O P E X j t I , O P E ] ] + w S [ 1 1 2 [ S j t S , A X j t S , A + S j t S , O P E X j t S , O P E ] ] w B [ 1 + [ S j t ( B M ) , N I + Z j t ( B M ) , N I ] ] + w I [ 1 + [ S j t ( I M ) , N I + Z j t ( I M ) , N I ] ] + w S [ 1 + [ S j t ( S M ) , N I + Z j t ( S M ) , N I ] ]
ρ j t M = min [ 1 ( S j t ( B M ) , N I Z j t ( B M ) , N I + S j t ( I M ) , N I Z j t ( I M ) , N I S j t ( S M ) , N I Z j t ( S M ) , N I ) ] [ 1 + 1 2 ( S j t M , V M V + Y j t M , V M V + S j t M , E P S + Y j t M , E P S ) ]
In this paper, the performance of the profitability stage consists of separate financial services from three sub-stages: banking, insurance, and securities, as shown in Figure 2. The profitability stage performances of banking, insurance, and securities subsidiaries are obtained and shown as ρ j t B , ρ j t I , and ρ j t S , which are evaluated in Equations (11)–(13), respectively.
ρ j t B = min [ 1 1 2 [ S j t B , A X j t B , A + S j t B , O P E X j t B , O P E + S j t B , N P L B Y j t B , N P L ] ] [ 1 + [ S j t ( B M ) , N I + Z j t ( B M ) , N I ] ]
ρ j t I = min [ 1 1 2 [ S j t I , A X j t I , A + S j t I , O P E X j t I , O P E ] ] [ 1 + [ S j t ( I M ) , N I + Z j t ( I M ) , N I ] ]
ρ j t S = min [ 1 1 2 [ S j t S , A X j t S , A + S j t S , O P E X j t S , O P E ] ] [ 1 + [ S j t ( S M ) , N I + Z j t ( S M ) , N I ] ]

4. Empirical Study and Findings

4.1. Data Collection

Following the 2001 Financial Holding Company Act passed in Taiwan, FHCs have become important legal financial conduits of a synergy of various financial services. In total, 14 FHCs were established between 2001 and 2002. Taiwan Financial Holdings and Taiwan Cooperative Holdings were later established in 2008 and 2011, respectively. These listed FHCs are excellent representatives of Taiwan’s financial industry. The global financial system underwent a severe economic recession during the global financial crisis (2007–2012) [42,43], which can be divided into three phases: (1) the subprime financial crisis: 2007–2008; (2) the global financial crisis: 2008–2010, (3) the European sovereign debt crisis: 2010–2012.
In this study, we consider 16 FHCs in Taiwan’s financial industry over the 2007–2012 period. We select this period not only to measure the value creation performance of Taiwan’s financial industry, but also to investigate the impact of the global market fluctuation (financial crisis) on the performances. The sources of all necessary variables in our model are gathered from Market Observation Post System of Taiwan Stock Exchange, the Taiwan Economic Journal (TEJ), and the annual report available on the FHCs’ official websites. We also take scaling transformation to address negative values of the variables. For instance, a positive amount is added to that particular variable for the whole sample, so the efficiency frontier is not affected.
The descriptive statistics of all variables used in the proposed two-stage NSBM model are inflated by consumer price index (CPI) of 2015 to derive their present value (2015 CPI = 100), the CPI index in each year is shown in Table 2. Table 2 reports the yearly means and standard deviations of all variables throughout the research period, including the equity and net revenue. Our attention is drawn to the banking service in Taiwanese FHCs, which obviously plays a greater part in the FHCs’ operations than other services (for example, the net income of banking service shows a continued increase in contribution to that of whole financial industry 2007–2012). Note that in 2008, the FHCs’ gained the worst profit performance from their operation ever, which was mainly affected by the illiquidity of the global financial markets and the recognition of loss due to bad loans during the US subprime crisis. With the gradual recovery of the US economy, the profitability of Taiwanese FHCs also improved and, in some way, effectively mitigated the impact of the European financial crisis. The correlation matrix of the preliminary variables is shown in Table 3.

4.2. Model Performance Comparisons

The discriminatory ability in a value creation performance evaluation model depends on the variable selection. In Lo and Lu [28], they used the assets, equity, operating expense, revenue, net income, market value, and EPS in their two-stage SBM model (Model 1). In this study, we compare Model 1 to Model 2, in which the value creation performances are measured without variables of equity and net revenue. Model 3 is the profitability of Model 2 decomposed into those of three financial service subsidiaries, where both the year-end asset and firms’ market value in Model 2 are also replaced by the arithmetic mean of assets and variation in market value. By comparing Model 2 and Model 3 we can show the influence of each financial service on the profitability performance evaluation of FHCs in the static two-stage framework. Model 4 is further proposed to consider the uncertainty of NPLs in the performance evaluation framework on the profitability of banking services as well as the value creation performance of FHCs. Using the MATLAB Toolbox for interval Type-2 Fuzzy logic systems [44], we obtain the estimated NPLs under a neutral attitude, which are brought into the proposed Model 4. Model 5, a black-box model specification, is proposed as a benchmark model compared with Model 4 for a robustness check. The selected inputs, intermediate, and outputs of each model are shown in Table 4. Using the DEA-SolverPro 15 software [45], based on the above variables setting, the annually average performances in each stages as well as their value creation performances are reported in Table 5.
From Table 5, we can observe the average value creation performance of Taiwan FHCs under Model 1 (0.778) is much higher than that under Model 2 (0.610), and the performance scores of the profitability and marketability stages are also higher in Model 1. The Kruskal–Wallis rank sum test indicates that there is a huge difference in the average value creation performance over the 2007–2012 period between Model 1 and Model 2, as shown in Table 6. We find that net revenue (intermediate) has a direct impact on both the profitability and marketability performances in Model 1. Net revenue is treated as a desirable intermediate output only in Model 1, in which generating a net revenue as high as possible can, thus, increase the performance score of the FHCs. From 2007 to 2011, the average net revenue is normally more than five times of the average net income, which may be the reason the average value creation performance of Model 1 is much higher than that of Model 2. Returning to the conceptual two-stage framework we mentioned, net income represents the income after all revenue and expenses for the specific period are considered, and is viewed as the most important component in the two financial indices, return on assets (ROA) and earnings per share (EPS). As stated above, adding the revenue as an intermediate variable in the two-stage evaluation framework, therefore, may overestimate the value creation performance of FHCs in Taiwan.
Further comparison t between Model 2 and Model 3 over the sample period is reported in Table 5. It is clear that the overall and period performances of Model 3 are much higher than those of Model 2. The performance gap between these two models is significant, as shown in Table 6. The reason for these results may be attributed to the following aspects. The two-stage evaluation framework we proposed does not consider the intertemporal feature, yet some variables still retain carryover traits from one period to another, such as assets and market value. To correct this inconsistency, we transform these two variables into flow variables, that is, the ending assets and market value are replaced by the average assets and variation in market value, respectively, which are employed in Model 3. Compared with Model 2, Model 3, thus, obtains a higher performance for Taiwan’s FHCs than that of Model 2. Based on these results from model comparison and statistical testing (shown in Table 6), we argue that when evaluating the value creation performance of FHCs in Taiwan, Model 3 has more discriminative power than Models 1 and 2.

4.3. Analyses on Value Creation Performance of Taiwanese Financial Holding Companies

The overall value creation performances and stage performances, as well as the period performances of Taiwanese FHCs are evaluated with Model 3, under the variable return to scale assumption, as reported in Table 7. From 2007 to 2012 during the global financial crisis period, the average overall performance of FHCs in Taiwan was 0.696, while the average performances in the profitability stage and in the marketability stage were 0.657 and 0.736, respectively. These results suggest that the main inefficient source came from the profitability stage rather than the marketability stage, highlighting the importance of improving the operational profitability. With regard to period performance, the annual value creation performance hit rock bottom in 2009. This may be attributed to the spillover effect of the global financial crisis on Taiwan’s financial industry, especially the US subprime mortgage crisis. We can observe that the one-year time deposits and one-year loan interest rates were both significantly cut, six times, in the last half of 2008 in Taiwan, ranging from 2.675% and 6.31% to 1.42% and 6.14%, respectively. In late February 2009, the two interest rates fell to 0.77% and 4.82%, respectively, and it was not until late 2010 that both increased slightly. This evidence confirms that the interest rate is one of the most important profit generation channels to the financial industry, and sharp changes in them have a great impact on the value creation performances of Taiwanese FHCs.
It can also be seen in Table 7 that all 16 Taiwanese FHCs were not deemed as good performers in the overall value creation process between 2007 and 2012. IBF and Fubon were the top two among FHCs, whose average overall value creation performance scores were 0.878 and 0.861, respectively. Similarly, they had the outstanding performances in the marketability stages. Excluding the Taiwan Cooperative, IBF also had the relative higher profitability performance score of 0.784. On the contrary, Shin Kong had the lowest scores on average overall value creation, as well as the profitability and the marketability performances.
For stage-wise performance, we find that no one FHC was rated as a good performer in either the profitability stage or the marketability stage. IBF had the highest profitability performance score (0.784); Yuanta and Fubon were ranked closely behind. Interestingly, Fubon fought back in the marketability stage, in which it had the highest performance score (0.986), and was ranked top. First and Shin Kong were the worst two performers in the profitability stage, with scores under 0.5. Shin Kong was ranked bottom in the marketability stage, with a performance score under 0.5. This could be due to much less net income gained compared to other FHCs, which was an intermediate variable to link between the profitability and marketability stages and had a direct impact on their performances. For example, compared with Fubon in the profitability stage, Cathay invested the average assets of NTD 4032.59 billion and an operating expense of NTD 56.08 billion in 2008. Those were much higher than that of Fubon (NTD 2066.46 billion and NTD 29.98 billion, respectively), but its net income was still much lower than that of Fubon, that is, NTD 25.81 billion and NTD 35.45 billion.
With regard to the period performances, we find that only IBF ever had a period performance score equal to 1 in 2012, while other FHCs had room for improvement in all years, as shown in Table 7. The period performance of Cathay reached its peak in 2007, and began to decline from 0.814 in 2007 to 0.384 in 2011. This could be due to the fact that they had recognized a loss of more than NTD 100 billion on the income statement in 2008. Eventually, the period performance score of Cathay began to pick up after 2011, and scored 0.792 in 2012. The majority of Taiwanese FHCs’ period performance improved after 2010, which may have resulted from improvements in both the gradual profit increase and effective cost management.

4.4. Analyses on Stage Performances of Taiwanese Financial Holding Companies

The performance in the profitability stage mainly came from three financial services in each year. We can further compare the performances in these three sub-stages to identify the sources of inefficiency. The profitability performances of banking, securities, and insurance financial services for all Taiwanese FHCs between 2007 and 2012 are reported in Table 8, Table 9 and Table 10, respectively. Note that if an FHC’s performance score was 1, it was deemed a good performer, meaning that its performance scores in all three financial services’ stage were rated as 1. Unfortunately, there was no good performing FHC in all three financial services’ stage in all years during 2007–2012, as shown in Table 8, Table 9 and Table 10 respectively. That being said, China Development was deemed as efficient on banking service in all periods, meaning that on average, it was a good performer in banking service between 2007 and 2012. Moreover, it was rated as efficient on securities service only in 2012, meaning that it was not a good performer in securities service between 2007 and 2012. China Development, therefore, is not a good performer in the profitability stage. We could see that the profitability inefficiency of China Development was caused by the securities service, especially in 2008, which could be attributed to the negative impact of the global financial crisis.
Note that although most of the FHCs started by providing regular banking services, their banking profitability performances were the worst among the three financial services. This indicated that in order to enhance the profitability performance, Taiwanese FHCs should put the priority on improving their banking services. In addition, in the face of fiercer competition among local and foreign financial institutions (as the financial markets opened up after Taiwan joined the WTO), the government has introduced a financial policy instrument in 2001, encouraging domestic financial institutions to consolidate and become larger FHCs. The number of financial holding companies have not gradually decreased under market competition; on the contrary, they have slightly increased from 14 to 16 in the Taiwan financial industry after 2011. Moreover, the foreign financial institutions entered the Taiwan financial market merely taking corporate finance and insurance services into consideration for the business. Obviously, they are not the cause for fierce market competition as anticipated before. In summary, the problem of fierce competition among domestic financial institutions continues to exist.

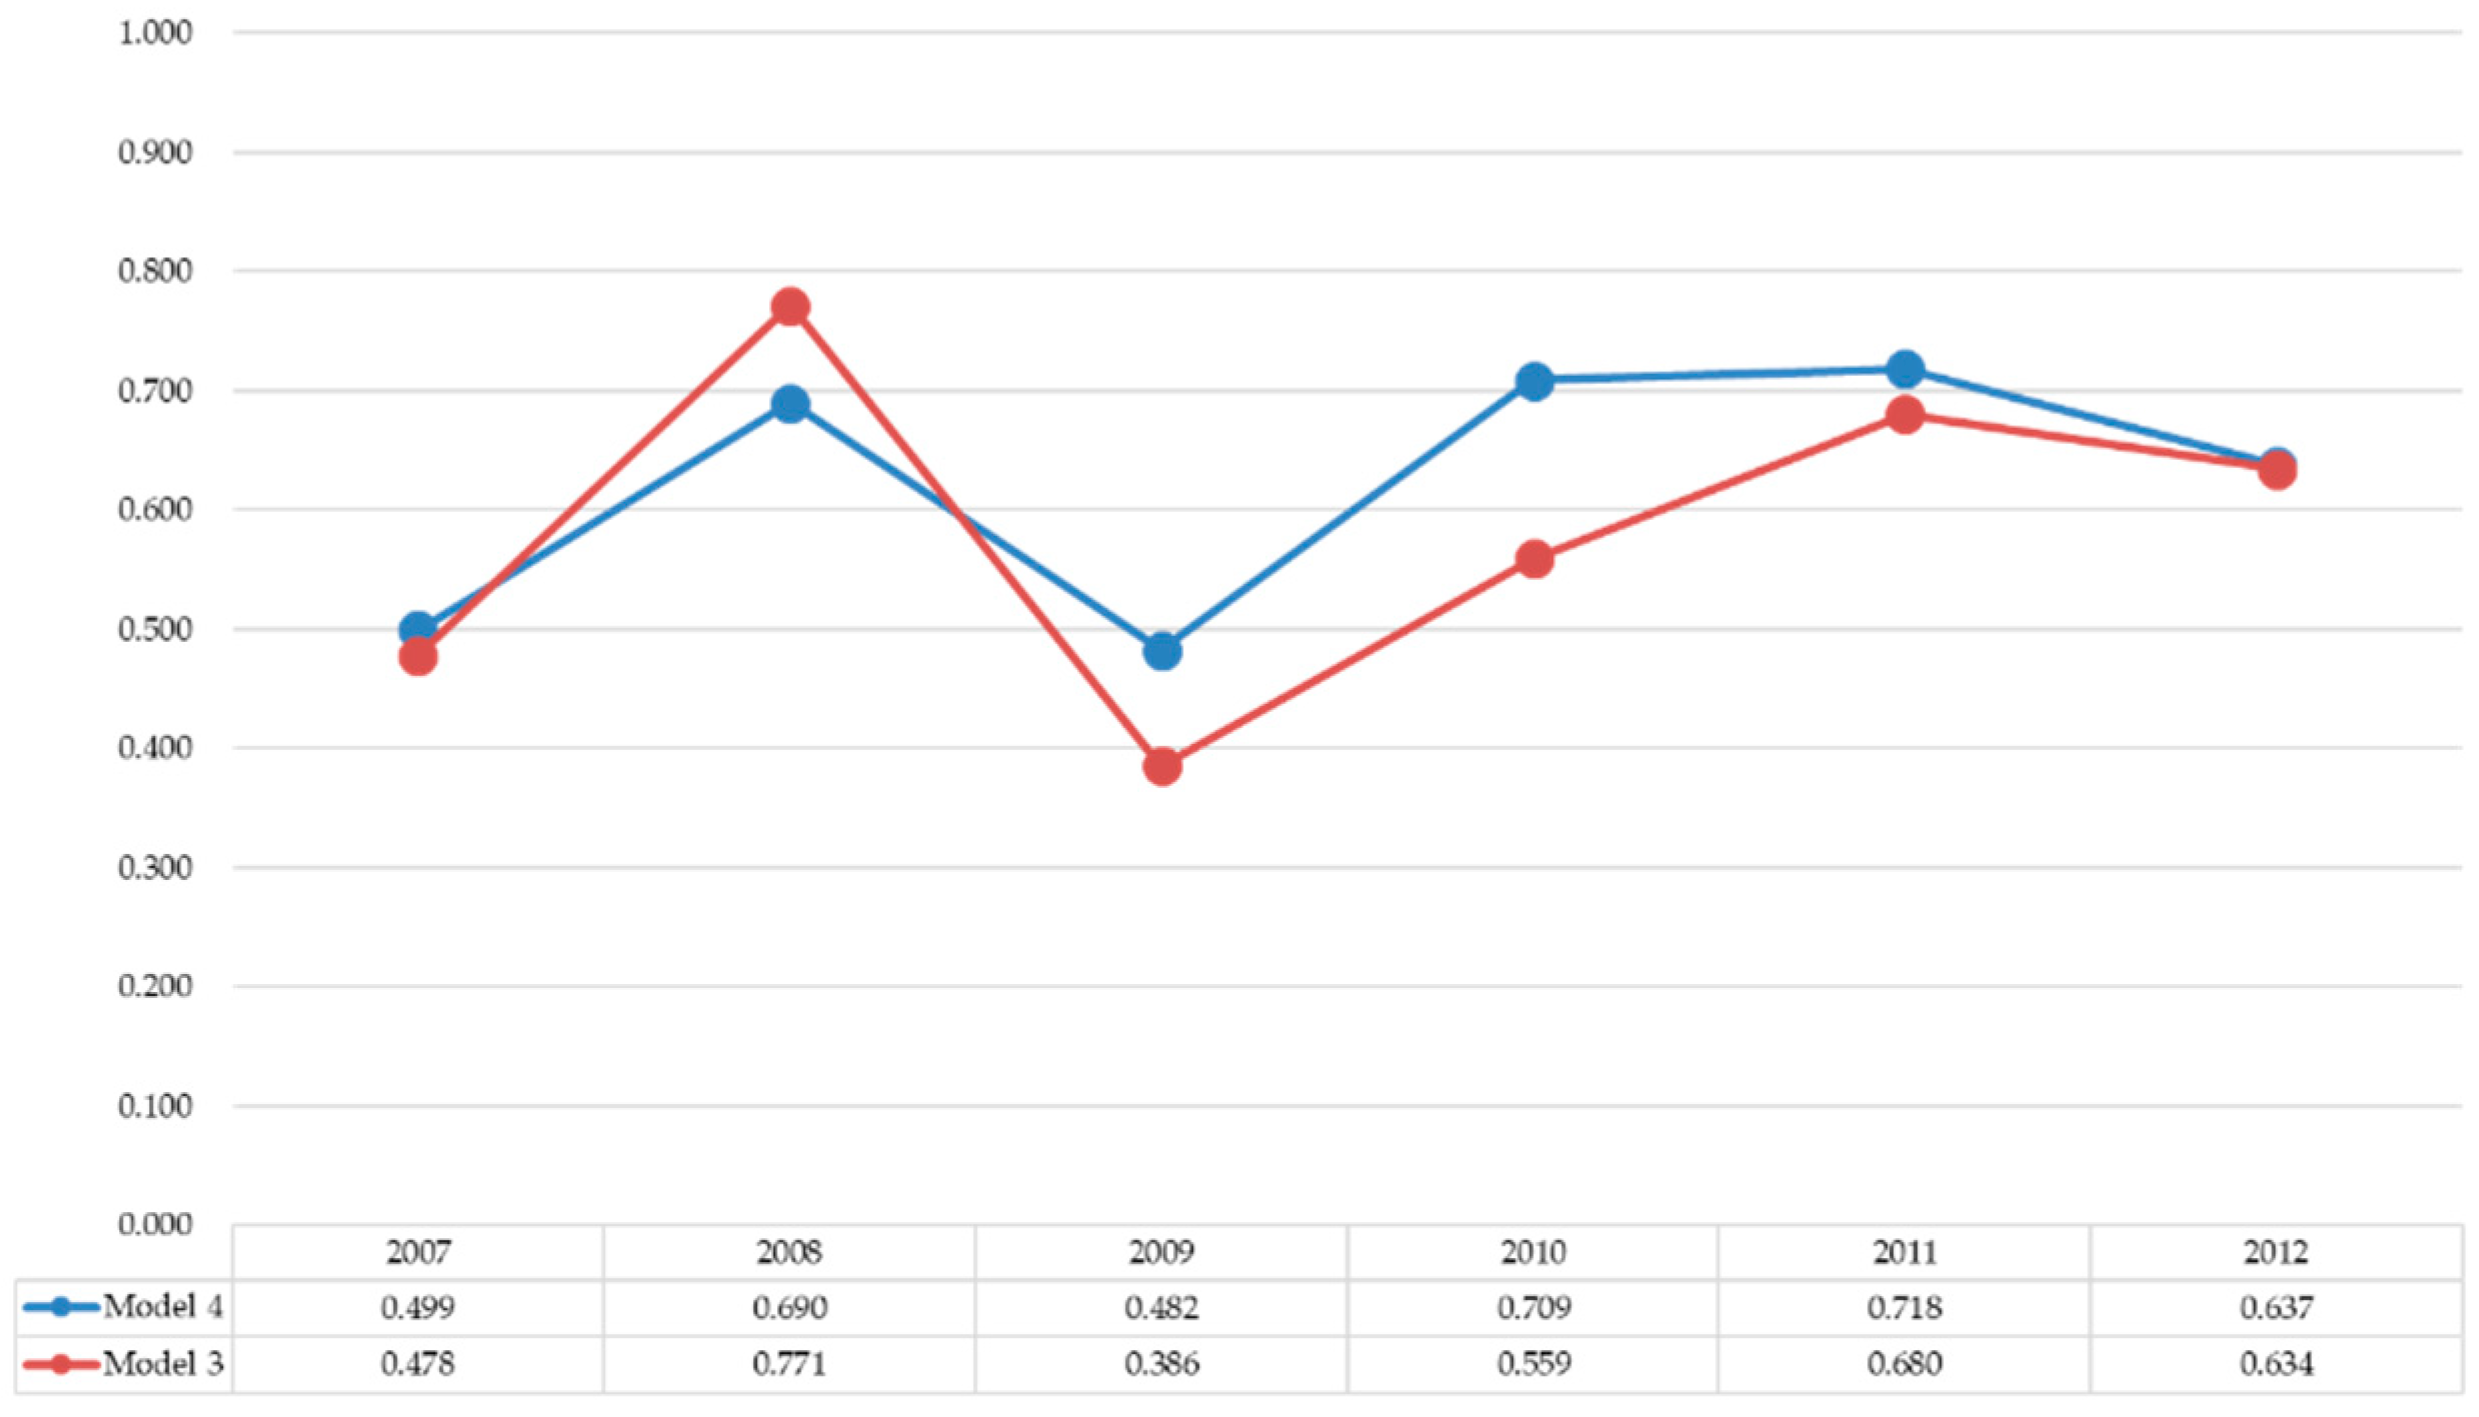
4.5. Additional Analyses of Banking Profitability Performances of Taiwanese Financial Holding Companies

To understand the impact of NPLs on the profitability stage performance of the banking subsidiary, we compared the profitability performance of the banking subsidiary with or without NPLs as an undesirable output, based on the proposed multi-stage NDEA model, where the former is Model 4 and the latter is Model 3. The estimated NPLs were obtained from the triangular type-2 fuzzy set by employing the general expectation reduction method and the alpha-cut method under the decision maker with different risk attitudes, as summarized in Table A1. Then, the NPLs were brought into the proposed model (Model 4), where a neutral attitude was assumed, and further details are discussed below.
The average banking profitability performance scores as well as their value creation performance estimated in Model 4 were slightly higher than those in Model 3, which is reported in Table 11. The efficient management of the credit risk of loans on banking can, therefore, not only enhance its profitability performance but also improve the value creation performance of the FHC. Further comparisons of the profitability performance of the banking subsidiary considering NPLs or not over the research period from 2007 to 2012 are shown in Figure 3.
In general, the banking profitability performance of FHCs with and without NPLs is different, which emphasizes the importance of the NPL on the profitability performance in banking. The banking profitability performances of FHCs incorporating NPLs into the model evaluation are nearly outperforming those without NPLs, except for 2008, suggesting that the U.S. subprime crisis had a considerable spillover effect by decreasing the banking profitability performance of Taiwanese FHCs. It is worth noting that the golden cross between the two trends has occurred since 2009.
If the intermediate net income is removed, Model 4 can be simplified to be a single-stage framework, i.e., a black-box model. The results of average value creation performance during the research period obtained from Model 4 (multi-stage) and Model 5 (single-stage) are reported in the last three columns of Table 11. It can be observed that the average value creation performances of Taiwanese-listed FHCs under the black-box model (Model 5) are much lower than under the multi-stage model (Model 4). This may imply that neglecting the intermediate variable (net income) may lead to an underestimation of the value creation performance when both the EPS and variation in market value are desirable outputs. In addition, it is not clear from the inefficient sources what the profitability performance of these kinds of financial services is.
In summary, the previous findings show that the banking profitability performance plays a key role in FHCs’ value creation performance improvement. Moreover, when evaluating the performance of the banking profitability stage, the NPLs under the fuzzy transformation should be incorporated into the multi-stage NDEA model, which will improve the discriminatory power.

4.6. Overall Performance Ranking the Best FHCs from 2007 to 2012

In order to identify the best performing FHCs during 2007–2012, we follow the ranking approach proposed by Premachandra et al. [46] and sort the total five ranking groups from the Top 2 group (only awarding the first and second place) to the Top 5 (including the first to the fifth place) group; for example, if an FHC is ranked in the first or second place by their average overall value creation performance score, it will be counted one time in all five groups, respectively, and, similarly, if an FHC is ranked in the third place, it will be counted one time in the groups of the Top 3 to the Top 5, and so on. Table 12 reports the value creation performance ranking of all FHCs operating in Taiwan during 2007–2012, based on Model 4 that incorporates the NPLs as the undesirable output of the banking profitability stage. Waterland had an outstanding performance to be ranked the best FHC, and Yuanta was ranked behind Waterland to be in second place. In addition, compared with Waterland and Yuanta, Fubon achieved third place because they were ranked two times in the Top 2 group and three times in the Top 3 group between 2007 and 2012.

5. Conclusions

We propose a modified multi-stage NDEA model based on the SBM approach under an uncertainty environment, i.e., considering NPLs, to estimate the value creation performance of 16 FHCs in Taiwan during 2007–2012. Following the work of Lo and Lu [28], the value creation process of FHCs is conceptualized as a serially-linked two-stage process, comprising of the profitability stage and the marketability stage. We further decompose the profitability stage performance of FHCs into those of three financial service subsidiaries, and then make contributions to the marketability stage of FHCs as intermediate variables. In addition, non-performing loans (NPLs) that are crucial for banking profitability may bring a new insight to the proposed model. Our proposed multi-stage Fuzzy NDEA (NSBM) model is designed to consider the uncertainty of NPLs, regarded as the undesirable output of the banking profitability stage.
Our model stands apart from others by the following contributions to the existing literature. First, with regards to the variable selections on the general two-stage evaluation framework, the profitability and marketability stages, from the accounting point of view, we argue that assets and net income are better variables to reflect the profitability performance evaluation, and these increase the discriminatory ability of the model. Second, from the managerial point of view, our model has more information on the FHCs as we investigate their performances further in banking, insurance, and securities services. We are able to better identify more useful information regarding the sources of inefficiencies than other existing DEA models. Third, the type-2 fuzzy set is used to clarify the uncertainty of the NPLs to improve the value creation performance identification of those FHCs under the requirement of expected credit risk.
In our empirical examination, we find that the “revenue” variable may lead to the overestimation of performances. Our results reveal that, when using variables more consistent with accounting and finance theories, the model would have better discriminatory ability. These findings may contribute to multi-stage performance modelling on financial institutions. Moreover, from our evaluation results, we then show that all Taiwanese FHCs were inefficient performers in terms of their overall value creation during 2007–2012, meaning there was room for improvement. We find that the average annual value creation performance of all FHCs decreased from 2007 to 2009, and then increased slightly in 2010 and in subsequent years. It may be inferred that the global financial crisis, especially the U.S. subprime crisis, had a negative impact on the performance of the Taiwanese financial industry, but the speed of recovery of Taiwanese FHCs is gratifying. The effective management of credit risk is an important aspect for managers in either banking or FHCs to consider as this can improve the organizations tolerance of outside shock. We also show that the inefficient source in the profitability stage was the banking services. This indicates that in order to enhance the profitability performance, Taiwanese FHCs should prioritize the improvement of its banking services.
There are some limitations to our model: we only designed a static two-stage NSBM model, without considering the dynamic feature between periods. Constructing a dynamic model could solicit more information from the financial institutions and be more instructive for managerial purposes.

Author Contributions

Conceptualization, T.-Y.L. and S.-H.C.; methodology, T.-Y.L., Y.W. and S.-H.C.; validation, T.-Y.L. and S.-H.C.; data curation, Z.O.; writing—original draft preparation, T.-Y.L. and S.-H.C.; writing—review and editing, T.-Y.L. and S.-H.C. All authors have read and agreed to the published version of the manuscript.

Funding

The paper was supported by the Special Funds for the Cultivation of Guangdong College Students’ Scientific and Technological Innovation. (“Climbing Program” Special Funds.) [Grant number pdjh2021b0666].

Institutional Review Board Statement

Not applicable.

Informed Consent Statement

Not applicable.

Data Availability Statement

All the data can be collected from public sources, such as Market Observation Post System of Taiwan Stock Exchange, the Taiwan Economic Journal (TEJ), and the annual report available on the FHCs’ official websites.

Conflicts of Interest

No conflict of interest exist in this study.

Appendix A

Table A1. NPLs with assumed fixed parameters (Billion Taiwanese dollars).
200720082009201020112012
Panel A: λ = 0.5, α = 0.2, ω = 0.5
Hua Nan12,897,5217,106,25815,746,75510,344,1078,041,1345,470,735
Fubon14,359,5007,682,7895,748,0081,527,5302,851,516657,684
Cathay5,694,4861,292,071017,6372,106,6543,902,890
China Development520,9101,243,9047,575,8743,109,1922,415,206498,376
E.SUN0003,906,8167,701,6813,685,510
Yuanta5,713,5624,463,656756,03501,195,2192,606,518
Mega9,298,63211,655,03610,443,4453,219,3196,550,8716,991,179
Taishin16,907,81824,560,14213,626,6458,420,31500
Shin Kong2,788,5972,782,3462,713,4632,513,0372,103,3661,916,469
Waterland35040268,489111,2051,378,523862,201
SinoPac9,092,8258,048,0244,712,8573,701,1265,032,9562,571,813
CTBC00002,227,3041,630,291
First8,448,2239,938,50115,064,0507,672,2008,761,7449,257,096
Jih Sun6,891,9857,127,5819,288,868898,9792,337,8531,338,939
Taiwan-2,228,6786,437,533600,9087,986,0465,271,805
Taiwan Cooperative----2,059,9565,862,458
Panel B: λ = 0, α = 0.2, ω = 0.5
Hua Nan12,646,8976,968,24015,457,51510,149,8947,972,9615,424,664
Fubon14,080,4667,533,5695,653,0631,504,6412,884,187687,065
Cathay5,583,8311,267,035018,4252,153,7993,887,285
China Development510,7881,219,8047,445,4113,055,5682,456,356520,641
E.SUN0003,837,6927,640,1043,674,129
Yuanta5,602,5374,376,990758,09501,248,6142,616,105
Mega9,117,94111,428,62610,257,2593,163,5556,511,6576,915,563
Taishin16,579,26624,082,96113,378,6038,263,48500
Shin Kong2,734,4092,728,3512,677,4862,470,9972,150,5751,939,464
Waterland34360280,023115,8381,439,817900,719
SinoPac8,916,1337,891,7074,638,0283,636,0005,023,2382,582,074
CTBC00002,272,1051,658,848
First8,284,0579,745,44814,788,0767,529,9088,679,5689,137,449
Jih Sun6,758,0606,989,1499,125,118888,3042,399,2351,373,157
Taiwan-2,185,4416,329,190596,0257,918,9435,229,600
Taiwan Cooperative----2,108,0095,808,775
Panel C: λ = 1, α = 0.2, ω = 0.5
Hua Nan12,955,3587,138,10815,813,50210,388,9258,056,8665,481,366
Fubon14,423,8927,717,2255,769,9181,532,8122,843,976650,903
Cathay5,720,0221,297,848017,4552,095,7743,906,491
China Development523,2461,249,4667,605,9813,121,5672,405,710493,238
E.SUN0003,922,7677,715,8913,688,136
Yuanta5,739,1844,483,656755,56001,182,8982,604,306
Mega9,340,33011,707,28410,486,4113,232,1886,559,9207,008,629
Taishin16,983,63824,670,26013,683,8858,456,50600
Shin Kong2,801,1022,794,8072,721,7652,522,7382,092,4711,911,162
Waterland35200265,828110,1361,364,378853,313
SinoPac9,133,6008,084,0984,730,1253,716,1555,035,1992,569,445
CTBC00002,216,9651,623,701
First8,486,1079,983,05215,127,7367,705,0378,780,7089,284,707
Jih Sun6,922,8917,159,5279,326,657901,4432,328,0101,331,043
Taiwan-2,238,6556,462,536602,0358,001,5315,281,544
Taiwan Cooperative----2,048,8675,874,846
Note: monetary unit is billion Taiwanese dollars.

References

  1. Hwang, D.-Y.; Wu, W.-H. Financial system reform in Taiwan. J. Asian Econ. 2007, 18, 21–41. [Google Scholar] [CrossRef]
  2. Charnes, A.; Cooper, W.W.; Rhodes, E. Measuring the efficiency of decision making units. Eur. J. Oper. Res. 1978, 2, 429–444. [Google Scholar] [CrossRef]
  3. Coelli, T.; Rao, D.S.; Battese, G.E. An Introduction to Efficiency and Productivity Analysis; Kluwer Academic Publishers: New York, NY, USA, 1998. [Google Scholar]
  4. Berger, A.N.; Humphrey, D.B. Efficiency of financial institutions: International survey and directions for future research. Eur. J. Oper. Res. 1997, 98, 175–212. [Google Scholar] [CrossRef] [Green Version]
  5. Seiford, L.M.; Zhu, J. Profitability and Marketability of the Top 55 U.S. Commercial Banks. Manag. Sci. 1999, 45, 1270–1288. [Google Scholar] [CrossRef] [Green Version]
  6. Isik, I.; Hassan, M. Technical, scale and allocative efficiencies of Turkish banking industry. J. Bank. Financ. 2002, 26, 719–766. [Google Scholar] [CrossRef]
  7. Lin, T.-Y.; Chiu, S.-H. Using independent component analysis and network DEA to improve bank performance evaluation. Econ. Model. 2013, 32, 608–616. [Google Scholar] [CrossRef]
  8. Gulati, R.; Kumar, S. Assessing the impact of the global financial crisis on the profit efficiency of Indian banks. Econ. Model. 2016, 58, 167–181. [Google Scholar] [CrossRef]
  9. Zha, Y.; Liang, N.; Wu, M.; Bian, Y. Efficiency evaluation of banks in China: A dynamic two-stage slacks-based measure approach. Omega 2016, 60, 60–72. [Google Scholar] [CrossRef]
  10. Zhou, X.; Xu, Z.; Chai, J.; Yao, L.; Wang, S.; Lev, B. Efficiency evaluation for banking systems under uncertainty: A multi-period three-stage DEA model. Omega 2019, 85, 68–82. [Google Scholar] [CrossRef]
  11. Zhang, W.D.; Zhang, S.; Luo, X. Technological progress, inefficiency, and productivity growth in the US securities industry, 1980–2000. J. Bus. Res. 2006, 59, 589–594. [Google Scholar] [CrossRef]
  12. Tone, K.; Kweh, Q.L.; Lu, W.-M.; Ting, I.W.K. Modeling investments in the dynamic network performance of insurance companies. Omega 2019, 88, 237–247. [Google Scholar] [CrossRef]
  13. Wanke, P.; Barros, C.P. Efficiency drivers in Brazilian insurance: A two-stage DEA meta frontier-data mining approach. Econ. Model. 2016, 53, 8–22. [Google Scholar] [CrossRef]
  14. Avkiran, N.K. Opening the black box of efficiency analysis: An illustration with UAE banks. Omega 2009, 37, 930–941. [Google Scholar] [CrossRef]
  15. Cook, W.D.; Liang, L.; Zhu, J. Measuring performance of two-stage network structures by DEA: A review and future perspective. Omega 2010, 38, 423–430. [Google Scholar] [CrossRef]
  16. Wang, K.; Huang, W.; Wu, J.; Liu, Y.-N. Efficiency measures of the Chinese commercial banking system using an additive two-stage DEA. Omega 2014, 44, 5–20. [Google Scholar] [CrossRef]
  17. Galagedera, D.; Watson, J.; Premachandra, I.; Chen, Y. Modeling leakage in two-stage DEA models: An application to US mutual fund families. Omega 2016, 61, 62–77. [Google Scholar] [CrossRef]
  18. Fukuyama, H.; Matousek, R. Modelling bank performance: A network DEA approach. Eur. J. Oper. Res. 2017, 259, 721–732. [Google Scholar] [CrossRef]
  19. Chiu, S.-H.; Lin, T.-Y. Performance evaluation of taiwanese international tourist hotels: Evidence from a modified ndea model with ica technique. Technol. Econ. Dev. Econ. 2018, 24, 1560–1580. [Google Scholar] [CrossRef]
  20. Galagedera, D.; Roshdi, I.; Fukuyama, H.; Zhu, J. A new network DEA model for mutual fund performance appraisal: An application to U.S. equity mutual funds. Omega 2018, 77, 168–179. [Google Scholar] [CrossRef]
  21. Iftikhar, Y.; Wang, Z.; Zhang, B.; Wang, B. Energy and CO2 emissions efficiency of major economies: A network DEA approach. Energy 2018, 147, 197–207. [Google Scholar] [CrossRef]
  22. Lin, T.-Y.; Chiu, S.-H. Sustainable Performance of Low-Carbon Energy Infrastructure Investment on Regional Development: Evidence from China. Sustainability 2018, 10, 4657. [Google Scholar] [CrossRef] [Green Version]
  23. Tone, K.; Tsutsui, M. Network DEA: A slacks-based measure approach. Eur. J. Oper. Res. 2009, 197, 243–252, Erratum in Eur. J. Oper. Res 2010, 202, 308–309. [Google Scholar] [CrossRef] [Green Version]
  24. Kao, C.; Liu, S.-T. Multi-period efficiency measurement in data envelopment analysis: The case of Taiwanese commercial banks. Omega 2014, 47, 90–98. [Google Scholar] [CrossRef]
  25. Chao, C.-M.; Yu, M.-M.; Hsiung, N.-H.; Chen, L.-H. Profitability efficiency, marketability efficiency and technology gaps in Taiwan’s banking industry: Meta-frontier network data envelopment analysis. Appl. Econ. 2017, 50, 233–250. [Google Scholar] [CrossRef]
  26. Juo, J.-C.; Fu, T.-T.; Yu, M.-M.; Lin, Y.-H. Non-radial profit performance: An application to Taiwanese banks. Omega 2016, 65, 111–121. [Google Scholar] [CrossRef]
  27. Chiou, C.-C. Effects of Financial Holding Company Act on bank efficiency and productivity in Taiwan. Neurocomputing 2009, 72, 3490–3506. [Google Scholar] [CrossRef]
  28. Lo, S.-F.; Lu, W.-M. An integrated performance evaluation of financial holding companies in Taiwan. Eur. J. Oper. Res. 2009, 198, 341–350. [Google Scholar] [CrossRef]
  29. Liu, S.-T. Performance measurement of Taiwan financial holding companies: An additive efficiency decomposition approach. Expert Syst. Appl. 2011, 38, 5674–5679. [Google Scholar] [CrossRef]
  30. Golany, B.; Roll, Y. An application procedure for DEA. Omega 1989, 17, 237–250. [Google Scholar] [CrossRef]
  31. Basel Committee on Banking Supervision. Minimum Capital Requirements for Market Risk. 2016. Available online: www.bis.org/bcbs/publ/d352.pdf (accessed on 25 November 2021).
  32. The IFRS Foundation. IFRS 9 Financial Instruments. 2021. Available online: https://www.ifrs.org/issued-standards/list-of-standards/ifrs-9-financial-instruments (accessed on 25 November 2021).
  33. Xu, J.; Zhou, X. Fuzzy-Like Multiple Objective Decision Making; Springer: Singapore, 2011. [Google Scholar]
  34. Ghasemi, M.-R.; Ignatius, J.; Lozano, S.; Emrouznejad, A.; Hatami-Marbini, A. A fuzzy expected value approach under generalized data envelopment analysis. Knowl. Based Syst. 2015, 89, 148–159. [Google Scholar] [CrossRef] [Green Version]
  35. Zhou, X.; Pedrycz, W.; Kuang, Y. Type-2 fuzzy multi-objective DEA model: An application to sustainable supplier evaluation. Appl. Soft. Comput. 2016, 46, 424–440. [Google Scholar] [CrossRef]
  36. Coelli, T.J.; Prasada Rao, D.S. Total factor productivity growth in agriculture: A Malmquist index analysis of 93 countries, 1980–2000. Agri Econ. 2005, 32, 115–134. [Google Scholar] [CrossRef] [Green Version]
  37. Cooper, W.W.; Seiford, L.M.; Tone, K. Data Envelopment Analysis: A Comprehensive Text with Models, Applications, References and DEA-Solver Software, 2nd ed.; Princeton University Press: Princeton, NJ, USA, 2007. [Google Scholar]
  38. Färe, R.; Grosskopf, S. Network DEA. Socio-Econ. Plan. Sci. 2000, 34, 35–49. [Google Scholar] [CrossRef]
  39. Vaz, C.B.; Camanho, A.S.; Guimarães, R.C. The assessment of retailing efficiency using Network Data Envelopment Analysis. Ann. Oper. Res. 2008, 173, 5–24. [Google Scholar] [CrossRef] [Green Version]
  40. Zadeh, L.A. Fuzzy sets. Inf. Control 1965, 8, 338–353. [Google Scholar] [CrossRef] [Green Version]
  41. Zadeh, L.A. The concept of a linguistic variable and its application to approximate reasoning—I. Inf. Sci. 1975, 8, 199–249. [Google Scholar] [CrossRef]
  42. Degl’Innocenti, M.; Kourtzidis, S.A.; Sevic, Z.; Tzeremes, N.G. Bank productivity growth and convergence in the European Union during the financial crisis. J. Bank. Financ. 2017, 75, 184–199. [Google Scholar] [CrossRef] [Green Version]
  43. Fiordelisi, F.; Ricci, O. “Whatever it takes”: An Empirical Assessment of the Value of Policy Actions in Banking. Rev. Financ. 2015, 20, 2321–2347. [Google Scholar] [CrossRef] [Green Version]
  44. Taskin, A.; Kumbasar, T. An Open Source Matlab/Simulink Toolbox for Interval Type-2 Fuzzy Logic Systems. In Proceedings of the 2015 IEEE Symposium Series on Computational Intelligence, Cape Town, South Africa, 7–10 December 2015. [Google Scholar]
  45. Cooper, W.W.; Seiford, L.M.; Tone, K. Data Envelopment Analysis—A Comprehensive Text with Models, Applications, References and DEA-Solver Software; Springer: Boston, MA, USA, 2006. [Google Scholar]
  46. Premachandra, I.; Zhu, J.; Watson, J.; Galagedera, D. Best-performing US mutual fund families from 1993 to 2008: Evidence from a novel two-stage DEA model for efficiency decomposition. J. Bank. Financ. 2012, 36, 3302–3317. [Google Scholar] [CrossRef]
Figure 1. The modified two-stage value creation framework of financial holding companies.
Axioms 11 00035 g001
Figure 2. The modified two-stage value creation framework for Taiwanese financial holding companies including three main financial subsidiaries.
Axioms 11 00035 g002
Figure 3. The trend of banking profitability performance with or without NPLs over the sample period.
Axioms 11 00035 g003
Table 1. Variables and descriptions.
VariablesNotationDescription
Dedicated input (B), (S), (I):
Average total assets (A) X j t ( B , S , I ) , A The average total assets of banking (B), insurance (I), and securities (S) subsidiaries in fiscal year t, respectively.
Operating expense (OPE) X j t ( B , S , I ) , O P E The sum of the operating expenses of banking (B), insurance (I), and securities (S) subsidiaries in fiscal year t, respectively.
Undesirable Output (B):
Non-performing loan (NPL) B Y j t B , N P L Problem loans for which the lending banks might not recover on time in fiscal year t, respectively.
Intermediate Output/Input (B–M), (S–M), (I–M):
Net income (NI) Z j t ( B , S , I M ) , N I The residual income of banking (B), insurance (I), and securities (S) subsidiaries in fiscal year t, respectively, which summarizes total revenue and gains and subtracting all expenses and losses.
Final Output (M):
Earnings per share (EPS) Y j t M , E P S EPS indicates how much money a company makes for each of its outstanding common stock in year t, which is reported on the statement of comprehensive income.
Variation in market value (VMV) Y j t M , V M V The difference in market value of firm between two consecutive years. Firm value is measured by the outstanding common stocks multiplied by the closing price on 31 December of specific year.
Table 2. Descriptive statistics of all possible variables for the period 2007–2012.
StageVariablesTypeYear200720082009201020112012
Profitability inputsAssetsFHCMean1591.521739.571943.592050.972176.962274.37
S.D.1069.821220.241413.281476.891482.871563.77
BankingMean990.731227.661300.431373.261520.731498.62
S.D.656.31947.391008.771044.621068.651045.35
SecurityMean50.0545.7940.4545.3145.7649.37
S.D.46.6848.3942.3546.3655.8664.14
InsuranceMean448.98426.86547.37630.88573.17599.64
S.D.605.03576.30640.82717.60697.94772.05
OPEFHCMean22.4221.0821.4722.2120.4622.30
S.D.15.0913.6714.3113.3413.7612.99
BankingMean11.3011.6611.2411.9213.0313.45
S.D.8.047.917.598.278.428.73
SecurityMean3.092.752.732.893.023.24
S.D.2.762.502.742.774.303.92
InsuranceMean6.535.626.786.875.826.43
S.D.6.666.306.977.157.328.18
EquityFHCMean128.76115.98136.64141.36144.72157.68
S.D.66.9461.2574.5376.1571.6480.26
Undesirable output BankingMean5.544.864.892.271.741.58
NPLs S.D.3.784.643.962.402.242.04
Intermediate
output/input
NIFHCMean10.690.936.528.759.5711.69
S.D.8.859.476.695.768.797.91
BankingMean5.682.733.556.837.399.18
S.D.5.895.544.604.815.666.20
SecurityMean1.840.001.491.360.890.73
S.D.2.762.311.861.773.261.31
InsuranceMean5.59−2.872.390.562.112.99
S.D.9.547.614.514.534.255.26
RevenueFHCMean64.8259.0984.5975.7961.9789.47
S.D.67.8963.15119.8192.9781.21120.72
Marketability
outputs
EPSFHCMean1.35−0.140.761.051.091.27
S.D.0.931.540.910.490.830.66
MVFHCMean175.72105.90164.45179.53138.02147.69
S.D.165.7392.45151.65137.1396.46100.59
CPI (2015 = 100) 90.5593.7492.9293.8295.1596.99
Note: OPE represents the operating expense during the specific period; EPS is the earning per share; MV is the market value. All variables are monetary and measured as billion Taiwanese dollars; S.D. indicates standard deviation.
Table 3. Correlation matrix of the selected variables from the value creation approach.
AssetsEquityOPENet RevenueNet IncomeEPSMV
Assets1.000
Equity0.830 ***1.000
OPE0.818 ***0.735 ***1.000
Net Revenue0.858 ***0.759 ***0.930 ***1.000
Net Income0.614 ***0.734 ***0.665 ***0.678 ***1.000
EPS0.456 ***0.522 ***0.518 ***0.538 ***0.908 ***1.000
MV0.369 ***0.417 ***0.426 ***0.426 ***0.541 ***0.265 ***1.000
Note: *** represent significance at 0.10, 0.05, and 0.01 levels, respectively; OPE represents the operating expense during the specific period; EPS is the earning per share; MV is the market value.
Table 4. Variables specification of Models 1–4.
VariableModels
Model 1Model 2Model 3Model 4Model 5
Input
 Total assetsVV
 Average total assets VVV
 EquityV
 Operating expenses (OPE)VVVVV
Undesirable output
 Non-performing loans (NPLs) VV
Intermediate
 Net RevenueV
 Net Income (NI)VVVV
Output
 Market valueVV
 Variation in market value (VMV) VVV
Earnings per share (EPS)VVVVV
Table 5. Performance comparison of Models 1–3.
TypeStage or PeriodModel 1Model 2Model 3
MeanStd.MeanStd.MeanStd.
Overall value creation0.7780.1780.6100.1900.6960.116
StageProfitability0.8990.0780.7420.1630.6570.119
Marketability0.7340.2250.5790.2180.7360.150
Period20070.8190.2430.6140.2860.6620.172
20080.7620.2620.5370.3320.6860.218
20090.7510.2680.4520.3100.6380.170
20100.7910.2660.5900.2750.7120.173
20110.7640.2440.6870.2560.6530.199
20120.7990.1950.7370.2100.7790.127
Table 6. Kruskal–Wallis rank sum test of the performance differences within/between Models 1–3.
2007200820092010201120122007–2012
Model 1–20.1990.2170.011 ***0.050 **0.4530.2930.036 **
Model 2–30.4110.1280.004 ***0.052 **0.7140.073 *0.035 **
Note: *, **, and *** denote that 10%, 5%, and 1% significance level, respectively.
Table 7. Overall value creation, stage, and period performance in Model 3.
BankOverall Value CreationPeriodStage
200720082009201020112012ProfitabilityMarketability
Hua Nan0.7080.6680.8590.6690.6530.6550.7460.6410.776
Fubon0.8610.8300.8660.8410.8050.8910.9350.7370.986
Cathay0.6010.8140.5430.6200.4510.3840.7920.5220.679
China Development 0.6840.6110.6660.7610.8960.4010.7710.7620.607
E.SUN0.7120.7120.8080.5630.6880.6610.8390.6110.812
Yuanta0.8090.8030.7940.6680.8590.9170.8150.7740.845
Mega0.6830.7200.2700.9290.7730.6030.8020.7660.600
Taishin0.6040.4490.4430.5480.8130.5970.7730.5790.628
Shin Kong0.4340.5230.3130.4470.3480.3440.6280.4220.446
IBF0.8780.8810.7190.8740.9920.8031.0000.7840.972
SinoPac0.6450.4620.9500.6330.5070.4750.8460.6790.612
CTBC0.7180.6450.8490.5160.7570.7600.7810.6360.800
First0.6090.8320.6690.4920.6320.4950.5330.4520.766
Jih Sun0.6280.3130.5780.3020.8040.8760.8970.6670.589
Taiwan0.707 0.9620.7090.7020.6290.5320.6560.758
Taiwan Cooperative0.861 0.9570.7660.8300.893
Mean0.6960.6620.6860.6380.7120.6530.7790.6570.736
Table 8. Profitability performance for banking service of Taiwanese FHCs in Model 3.
Bank2007200820092010201120122007–2012
Hua Nan0.1161.0000.1360.1890.4660.3630.378
Fubon0.0990.7440.3770.4420.6851.0000.558
Cathay0.1170.5030.7171.0000.7560.6380.622
China Development1.0000.7331.0001.0001.0001.0000.955
E.SUN0.5380.7480.4230.7730.8150.6700.661
Yuanta0.9980.3570.9990.6571.0000.2790.715
Mega1.0000.4261.0001.0001.0001.0000.904
Taishin0.2640.1530.1321.0000.8450.7320.521
Shin Kong0.2661.0000.2070.6160.5380.3400.494
IBF1.0001.0001.0001.0001.0001.0001.000
SinoPac0.1840.7780.0970.6770.2940.6870.453
CTBC0.4891.0000.3760.8631.0001.0000.788
First0.4880.8080.0530.2210.4570.4160.407
Jih Sun0.4280.3230.3380.7700.6560.6180.522
Taiwan 0.7800.3820.4260.1410.2190.390
Taiwan Cooperative 0.8380.2360.537
Mean0.4990.6900.4820.7090.7180.6370.619
Table 9. Profitability performance for securities service of Taiwanese FHCs in Model 3.
Bank2007200820092010201120122007–2012
Hua Nan0.68050.15330.84160.68010.10440.84410.5507
Fubon0.83560.53800.89870.67980.72270.84260.7529
Cathay0.73500.64880.99570.98370.08010.89370.7228
China Development0.20480.00400.96870.92430.04021.00000.5237
E.SUN0.96070.64350.88210.92630.29430.69160.7331
Yuanta1.00001.00001.00001.00001.00001.00001.0000
Mega0.38900.08650.57180.74740.21010.24560.3751
Taishin0.75970.10210.78311.00000.33851.00000.6639
Shin Kong0.81610.83330.69030.57460.18060.82090.6526
IBF0.52220.21620.49580.96740.21221.00000.5690
SinoPac1.00001.00001.00000.79900.80220.95010.9252
CTBC0.96200.39740.83560.45450.16590.92740.6238
First0.83330.17041.00000.74680.04930.22430.5040
Jih Sun0.63830.35890.70431.00000.89870.99490.7659
Taiwan-1.00001.00001.00000.47251.00000.8945
Taiwan Cooperative----1.00001.00001.0000
Mean0.73840.47680.84450.83230.41070.83970.6838
Table 10. Profitability performance for insurance service of Taiwanese FHCs obtained in Model 3.
Bank2007200820092010201120122007–2012
Hua Nan1.00001.00000.99971.00001.00001.00000.9999
Fubon1.00001.00001.00001.00001.00001.00001.0000
Cathay1.00000.03220.19790.02930.02310.19050.2455
China Development-------
E.SUN-------
Yuanta-------
Mega0.99691.00001.00001.00000.99980.99950.9994
Taishin-------
Shin Kong0.13720.03340.00740.04030.14160.46900.1381
IBF-------
SinoPac-------
CTBC----1.00000.23580.6179
First1.00000.40180.14080.33270.32160.34160.4231
Jih Sun-------
Taiwan-1.00001.00001.00000.22800.45540.7367
Taiwan Cooperative----0.99990.99990.9999
Mean0.85570.63820.62080.62890.58930.63240.6845
Table 11. Overall value creation and banking profitability performance with or without NPLs.
Multi-Stage Performance
Evaluation without NPLs (Model 3)
Multi-Stage Performance
Evaluation with NPLs (Model 4)
Black-Box (Single-Stage)
Performance Evaluation with NPLs (Model 5)
Value
Creation
Banking
Profitability
Value
Creation
Banking
Profitability
Value
Creation
1Hua Nan0.7080.3730.7090.3780.471
2Fubon0.8610.4570.8780.5580.936
3Cathay0.6010.5990.6050.6220.592
4China Development0.6841.0000.6730.9550.620
5E.SUN0.7120.4890.7550.6610.809
6Yuanta0.8090.5480.8510.7150.763
7Mega0.6830.9220.6800.9040.370
8Taishin0.6040.4940.6100.5210.390
9Shin Kong0.4340.4740.4370.4940.237
10Waterland0.8781.0000.8781.0001.000
11SinoPac0.6450.4320.6510.4530.415
12CTBC0.7180.6820.7450.7880.913
13First0.6090.4290.6050.4070.487
14Jih Sun0.6280.5690.6170.5220.724
15Taiwan0.7070.3360.7160.3900.497
16Taiwan Cooperative0.8610.4910.8690.5370.795
Average0.6960.5810.7050.6190.626
Table 12. Top-performing Taiwanese financial holding companies in Model 4 with NPLs.
FHCTop 2Top 3Top 4Top 5
Fubon2 (33.33%)3 (50.00%)5 (83.33%)5 (83.33%)
Yuanta3 (50.00%)3 (50.00%)4 (66.67%)5 (83.33%)
Waterland3 (50.00%)4 (66.67%)4 (66.67%)5 (83.33%)
Taiwan Cooperative2 (33.33%)2 (33.33%)2 (33.33%)2 (33.33%)
SinoPac1 (16.67%)1 (16.67%)2 (33.33%)2 (33.33%)
Jih Sun 1 (16.67%)1 (33.33%)3 (50.00%)
Taiwan1 (20.00%)1 (20.00%)1 (20.00%)1 (20.00%)
Mega1 (16.67%)1 (16.67%)1 (16.67%)1 (16.67%)
Hua Nan 1 (16.67%)1 (16.67%)1 (16.67%)
China Development 1 (16.67%)1 (16.67%)1 (33.33%)
CTBC 1 (16.67%)1 (16.67%)
First 1 (16.67%)1 (16.67%)1 (16.67%)
Cathay
E.SUN 1 (16.67%)
Taishin
Shin Kong
Publisher’s Note: MDPI stays neutral with regard to jurisdictional claims in published maps and institutional affiliations.

