Article

A Peptides Prediction Methodology with Fragments and CNN for Tertiary Structure Based on GRSA2

by
Juan P. Sánchez-Hernández
1,†,
Juan Frausto-Solís
2,*,†,
Diego A. Soto-Monterrubio
2,†,
Juan J. González-Barbosa
2 and
Edgar Roman-Rangel
3
1
Departamento de Tecnologías de la Información, Universidad Politécnica del Estado de Morelos, Jiutepec 62574, Mexico
2
División de Estudios de Posgrado e investigación, Tecnológico Nacional de México/I.T. Ciudad Madero, Madero 89440, Mexico
3
Computer Science Department, Instituto Tecnológico Autónomo de México, Mexico City 01080, Mexico
*
Author to whom correspondence should be addressed.
These authors contributed equally to this work.
Axioms 2022, 11(12), 729; https://doi.org/10.3390/axioms11120729
Submission received: 7 October 2022 / Revised: 9 December 2022 / Accepted: 9 December 2022 / Published: 14 December 2022
(This article belongs to the Section Mathematical Analysis)

Abstract

:
Proteins are macromolecules essential for living organisms. However, to perform their function, proteins need to achieve their Native Structure (NS). The NS is reached fast in nature. By contrast, in silico, it is obtained by solving the Protein Folding problem (PFP) which currently has a long execution time. PFP is computationally an NP-hard problem and is considered one of the biggest current challenges. There are several methods following different strategies for solving PFP. The most successful combine computational methods and biological information: I-TASSER, Rosetta (Robetta server), AlphaFold2 (CASP14 Champion), QUARK, PEP-FOLD3, TopModel, and GRSA2-SSP. The first three named methods obtained the highest quality at CASP events, and all apply the Simulated Annealing or Monte Carlo method, Neural Network, and fragments assembly methodologies. In the present work, we propose the GRSA2-FCNN methodology, which assembles fragments applied to peptides and is based on the GRSA2 and Convolutional Neural Networks (CNN). We compare GRSA2-FCNN with the best state-of-the-art algorithms for PFP, such as I-TASSER, Rosetta, AlphaFold2, QUARK, PEP-FOLD3, TopModel, and GRSA2-SSP. Our methodology is applied to a dataset of 60 peptides and achieves the best performance of all methods tested based on the common metrics TM-score, RMSD, and GDT-TS of the area.

1. Introduction

Three-dimensional structures of proteins provide valuable information for understanding their biological functions. Proteins are formed by a polymeric chain of amino acids (aa). Formations with a small amount of aa are called peptides or small proteins. There are twenty different aa reported in the literature [1]. The study of small proteins or peptides has great relevance due to their applications, such as in pharmaceutical research and drug design [2,3,4,5,6,7].
The main objective of the Protein Folding problem (PFP) is to obtain the Native Structure (NS) of a protein using its amino acid sequence only. The NS of a protein is the native state in which the protein performs its biological functions. The main computational methods reported in the literature for predicting the three-dimensional structure of proteins are those based on the assembly of fragments of known proteins. The best results were obtained by I-TASSER [8], Rosetta [9], and AlphaFold [10] as reported in the CASP (Critical Assessment of Protein Structure Prediction) competition. The fragment-based method consists of assembling small structures of known proteins to build a new structure [11]. An important objective is to obtain adequate fragments given a predicted protein target. Currently, these methods use neural networks for fragment selection and assembly. Another important process is the refinement method for assembling structures; Simulated Annealing (SA) is commonly used in this process [12,13]. Hybrid Simulated Annealing (HSA) algorithms have obtained good results in the prediction of small proteins or peptides; for example, the methods that include Monte Carlo or Simulated Annealing algorithms are I-TASSER [8], Rossetta [9], QUARK [14], PEP-FOLD3 [15], GRSA [16], GRSA2 [17], GRSA2-SSP [18], and AlphaFold [10]. An important aspect of HSA algorithms is that the computational cost increases in proportion to the length of the amino acid sequence. Conversely, the works in the references [16,17,18] are all based on another HSA algorithm called Golden Ratio Simulated Annealing (GRSA), which has a cooling scheme that improves the computational times compared to the classical SA.
It is important to mention that the protein prediction community has obtained very good results. Nevertheless, the problem of obtaining the NS from the amino acid sequence is still open.
In this paper, we propose a methodology named GRSA2-FCNN. The process of GRSA2-FCNN is to predict and assemble fragments structures using Convolutional Neural Networks (CNN) and refine the structural protein with the GRSA2 algorithm [17] to obtain the three-dimensional structure of proteins. GRSA2-FCNN stands for Fragments, CNN, and GRSA2 algorithm. We applied this methodology to a set of small proteins or peptides. To evaluate the results of the predictions, we use metrics to assess their three-dimensional structure. The metrics used are TM-score [19] and Root Mean Square Deviation (RMSD), and GDT-TS [20].
This paper is organized as follows. First, we present an introduction to the fragment-based method and SA algorithms. Second, in the Section 2, we review the definition of PFP and some relevant protein prediction research in the literature. We also introduce a brief explanation of CNN and HSA algorithms. Then, we describe the GRSA2-FCNN methodology. In the Section 4, we present the experimental results comparing the GRSA2-FCNN algorithm with those in the literature, and we describe the performance of our methodology. Finally, we discuss our conclusions.

2. Background

Protein prediction aims to find the best three-dimensional structure or NS of a protein. This is a problem studied in different areas such as computational sciences, molecular biology, and bioinformatics. Finding the three-dimensional structure of a protein from its amino acid sequence is a highly relevant problem for the scientific community, in which the process that nature performs so quickly and efficiently is analyzed. The PFP encompasses the following important points for protein structure prediction [21]:
  • To understand the physical code in which an amino acid sequence dictates its NS.
  • Design an algorithm that quickly and efficiently finds the NS.
Designing an algorithm to obtain the NS is the principal objective in relation to the PFP. Therefore, there are different strategies in the state-of-the-art, which are mainly divided into two types [22]:
  • To determine the NS using only amino acid sequence information.
  • To determine the NS using protein structure information, such as the secondary structure (SS) or fragments of other known proteins.

2.1. Protein Structure Prediction

Finding the three-dimensional structure of a protein known as the NS is very difficult due to the unlimited number of combinations that it can take; even with faster and more advanced computers, for finding the NS in proteins, the execution time is still very far from that obtained by nature in a very short time. This problem is known as Levinthal’s paradox [23].
The aforementioned methods Rosetta [9], I-TASSER [8], QUARK [14], PEP-FOLD3 [15], and AlphaFold [10] have shown promise for predicting the three-dimensional structure of proteins with good results.
The Rosetta method [9] predicts protein structures by using the primary and secondary structures; the algorithm employs an assembly of fragments using SA to yield native protein conformations. I-TASSER predicts protein structures using four steps: threading templates, assembly of structural fragments, refinement of models, and structure-based protein function annotation [8,24]. The Quark algorithm uses an assembly of fragments of small structures and applies an SA for refinement [14]. PEP-FOLD3 is a framework that predicts peptides between 5 to 50 aa and has three principal steps. Firstly, it starts with an amino acid sequence for predicting the a priori probability from each fragment of the peptide to obtain a structural alphabet profile. Secondly, Forward-Backtrack or Taboo sampling algorithms are applied to generate a sub-optimal series of states or trajectories; finally, it identifies the clusters and the scoring of the conformation to generate the five best models [15].
The TopModel method is a fully automated meta-method that uses top-down consensus and deep neural networks for selecting templates. This method combines several state-of-the-art strategies, for example, threading, alignment, and model quality estimation [25].
AlphaFold [10] uses deep-learning-based methods and combines three Neural Networks (NN): the first NN predicts the distance between pairs of residues within the protein; the second NN is applied to estimate the accuracy of the candidate structures. Finally, the third NN is used to generate the NS protein structure. The combination of these NNs uses two memory-augmented SA with neural fragment generation [26] with GDT-net potential and distance potential [27]. In addition, a repeated gradient descent of distance potential [28] was applied. At the CASP14 event, AlphaFold2 [29] obtained excellent performance. AlphaFold2 uses very sensitive homology detection methods such as MMseqs2 [30] to find homologous templates.
However, even with the aforementioned methods, it has not been possible to obtain the NS for proteins or peptides. Therefore, even at present, these methods are still improving their prediction strategies. Strategies that have had outstanding results, such as Alphafold, use deep-learning techniques [29].

2.2. Deep Learning and CNN

One of the most popular Deep Learning (DL) algorithms is CNN, which uses convolutional operation for the automatic extraction of features from datasets. CNN consists of convolutional stages, pooling stages, and fully connected layers. CNN has succeeded in tackling several challenges, such as those described in [31,32,33]. There are three important aspects of a CNN: equivalent representations, sparse interactions, and parameter sharing [34]. There are several CNN architectures [35]; these include AlexNet, ZefNet, GoogLeNet, and ResNet.

2.3. HSA Algorithms

SA [12,36] is an algorithm inspired by the heating of metals, which has been applied to NP-hard problems such as PFP [37]. The SA algorithm is applied to solve optimization problems. This algorithm searches for solutions by minimizing or maximizing its objective function. A Hybrid Simulated Annealing algorithm of SA applied to PFP is GRSA [16] which, similarly to SA, minimizes the energy of a protein structure. In addition, GRSA improves upon the SA cooling process.
In particular, the cooling scheme of GRSA decreases its temperature according to the cuts of temperatures calculated by the golden number (ɸ); the temperature decrement is controlled by the α parameters, which have a range of values of 0.7 α < 1 and are related to each temperature cut. In addition, a stop criterion is implemented for reducing the exploration cost and the execution time.
GRSA2 enhances the Golden Ratio Simulated Annealing algorithm (Algorithm 1). This algorithm has a perturbation phase in which decomposition and a soft collision (line 11) are implemented. In addition, an acceptance criterion (lines 13 to 16) is applied. Algorithm 2 shows the perturbation process which determines a new solution. GRSA2 was applied to a set of peptides and mini proteins in the GRSA2-SSP [18] algorithm and compared with the state-of-the-art. GRSA2 is an algorithm that has been able to refine peptide structures with good results [17]. However, this application was limited to small peptides in the alpha class [18]—i.e., when applied to peptides of class none and beta, GRSA2 obtained poor quality results.
Algorithm 1 GRSA2 algorithm Procedure
1: Data: Tf, Tfp, Ti, E, S, α, KE
2: α = 0.70
3: ϕ = 0.618
4: KE = 0
5: Tfp = Ti
6: Tk = Ti
7: Si = generateSolution()
8:    while Tk ≥ Tf do //Temperature cycle
9:       while Metropolis length do //Metropolis cycle
10:          Eold = E(Si)
11:          Sj = GRSA2pert(Si)
12:          EP = E(Sj)
13:          if (EP ≤ Eold + KE) then
14:             Si = Sj
15:             KE = ((Eold + KE) – EP) *random[0,1]
16:          end if
17:       end while //End Metropolis cycle
18:         GRSA_Cooling_Schema(Tfp)
19:         GRSA_Stop_Criterion()
20:    end while //End Temperature cycle
21: end Procedure
Algorithm 2 GRSA2pert Function
1: GRSA2pert(Si)
2: moleColl, b
3:    if b > moleColl then
4:        Randomly select one particle Mω
5:        if Decompositioncriterionmet
6:           Sj = Decomposition(Si)
7:        else if
8:           Sj = SoftCollition(Si)
9:        end if
10:    end if
11:    return Sj
12: end Function
SA and HSA algorithms are used in the refinement process of protein prediction. In this work, GRSA2 is used for the refinement of three-dimensional structures.

2.4. Performance Evaluation
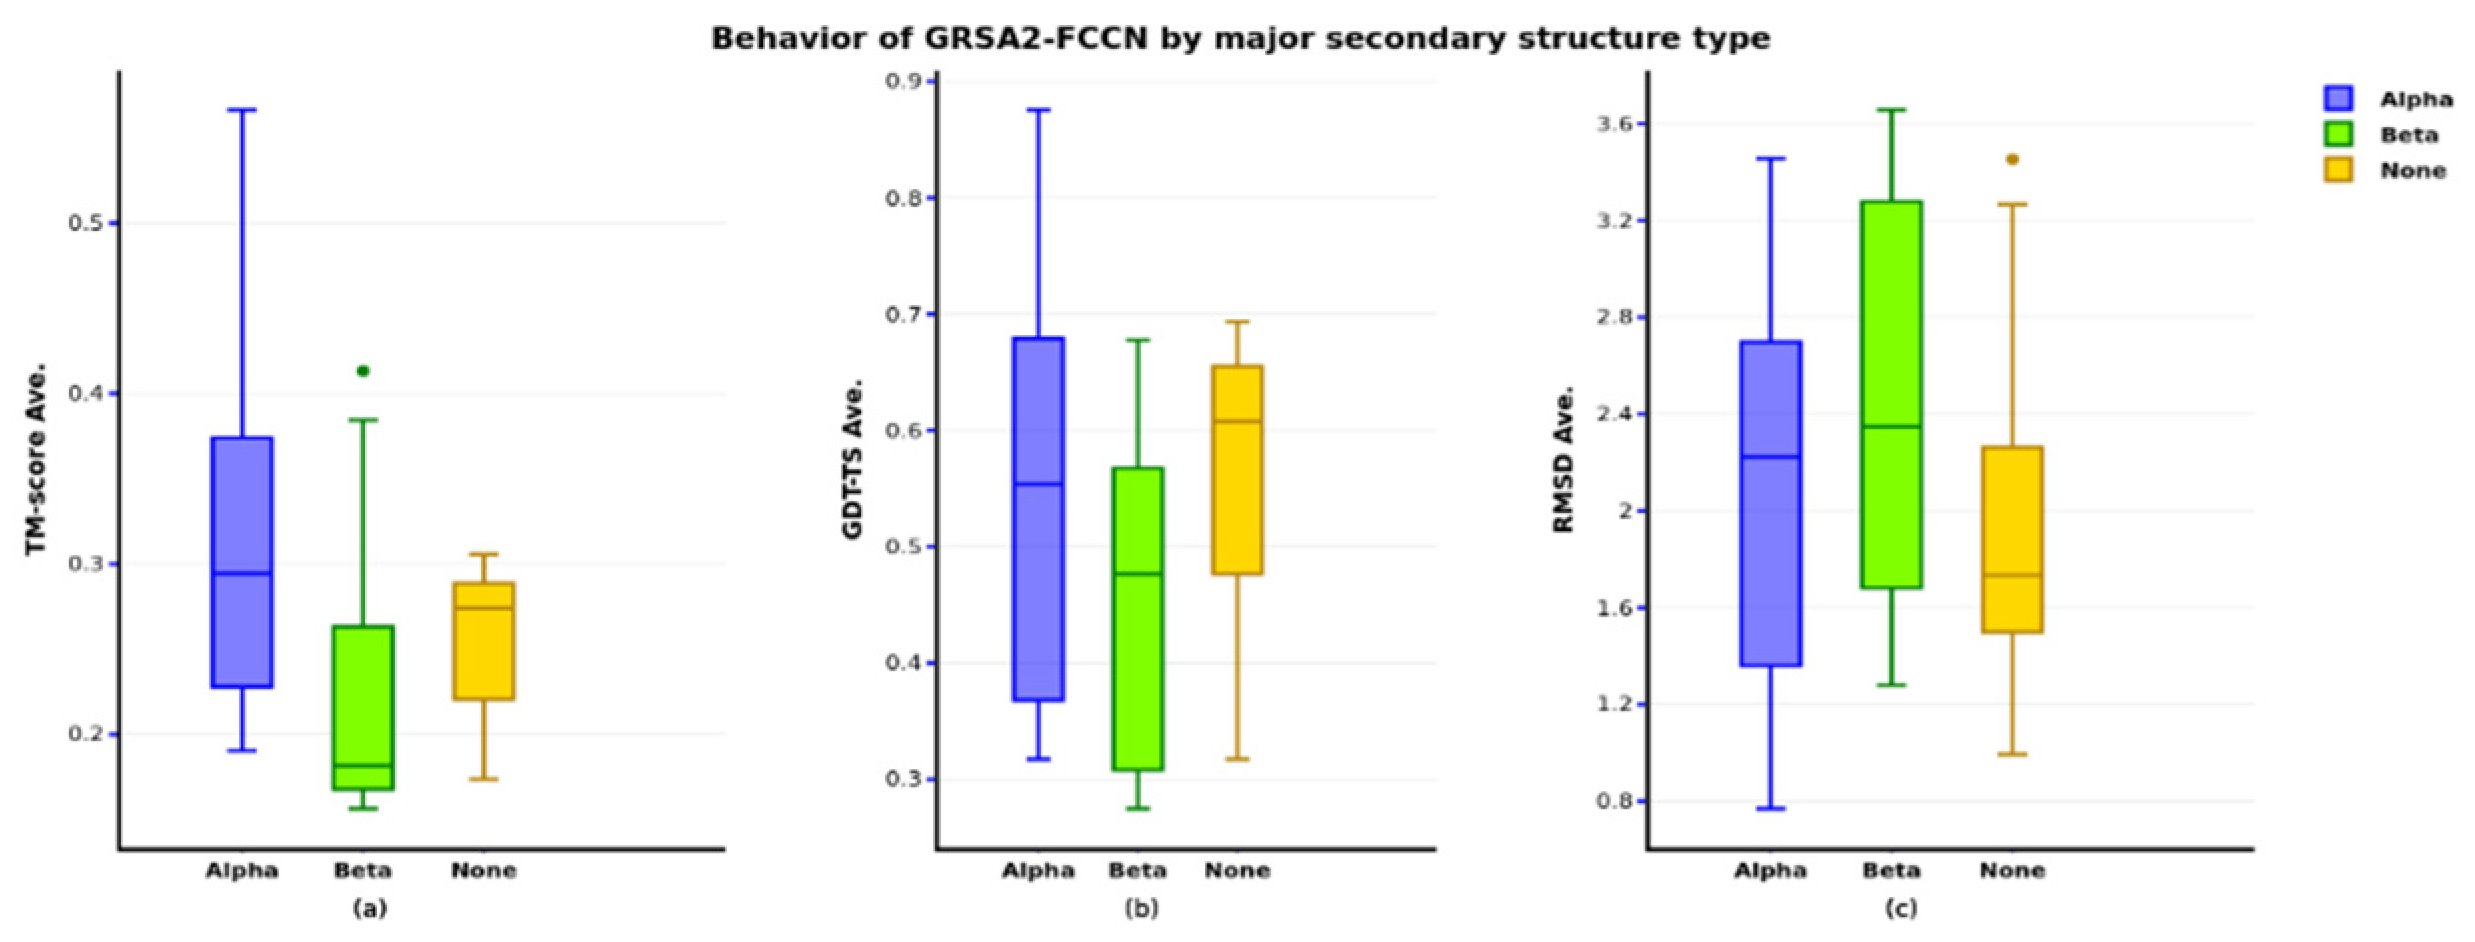
The metrics TM-score [19], RMSD, and Global Distance Test-Total Score (GDT-TS) are commonly used to evaluate PFP methodologies [20]. They are used by the scientific community, particularly in CASP competitions [19], for evaluating structural quality. They are described in the following subsections.

2.4.1. TM-Score

The TM-score scoring function was proposed by Zhang et al. and is defined in Equation (1) [19]:
T M s c o r e = M a x [ 1 L N i = 1 L T 1 1 + ( d i   d 0 ) 2 ]
where L N   is the length of the native structure,   L T   is the length of the residues (amino acid) aligned to the structure predicted, d i is the distance between the i-th pair of aa, d 0 is a scale to normalize the match difference, and Max represents the maximum value after optimal special superposition.

2.4.2. GDT-TS

GDT-TS is also used to evaluate the similarity between a predicted protein structure and a reference structure. The value ranges from 0 (a meaningless prediction) to 1 (a perfect prediction).
The scoring function of GDT-TS is defined in Equation (2):
G D T T S = ( G D T _ P 1 + G D T _ P 2 + G D T _ P 4 + G D T _ P 8 ) 4
where GDT_P1, GDT_P2, GDT_P4, and GDT_P8 denote the percent of residues under distance cutoff identifying multiple maximum substructures associated with different threshold cutoffs (1, 2, 4, and 8 Å) [19]. Reference [19] notes that the metric GDT_TS is defined as the average coverage of the target sequence of the substructures with the four different distance thresholds.

2.4.3. RMSD

The RMSD metric is used for measuring the difference between two protein structures; the minor value of Å is the best result.
The scoring function of RMSD is defined in Equation (3):
R M S D = 1 N i = 1 n d i 2
where N is the number of atoms, and d i is the distance between two atoms in the i-th pair. The RMSD is usually calculated with the backbone of the structure [38].

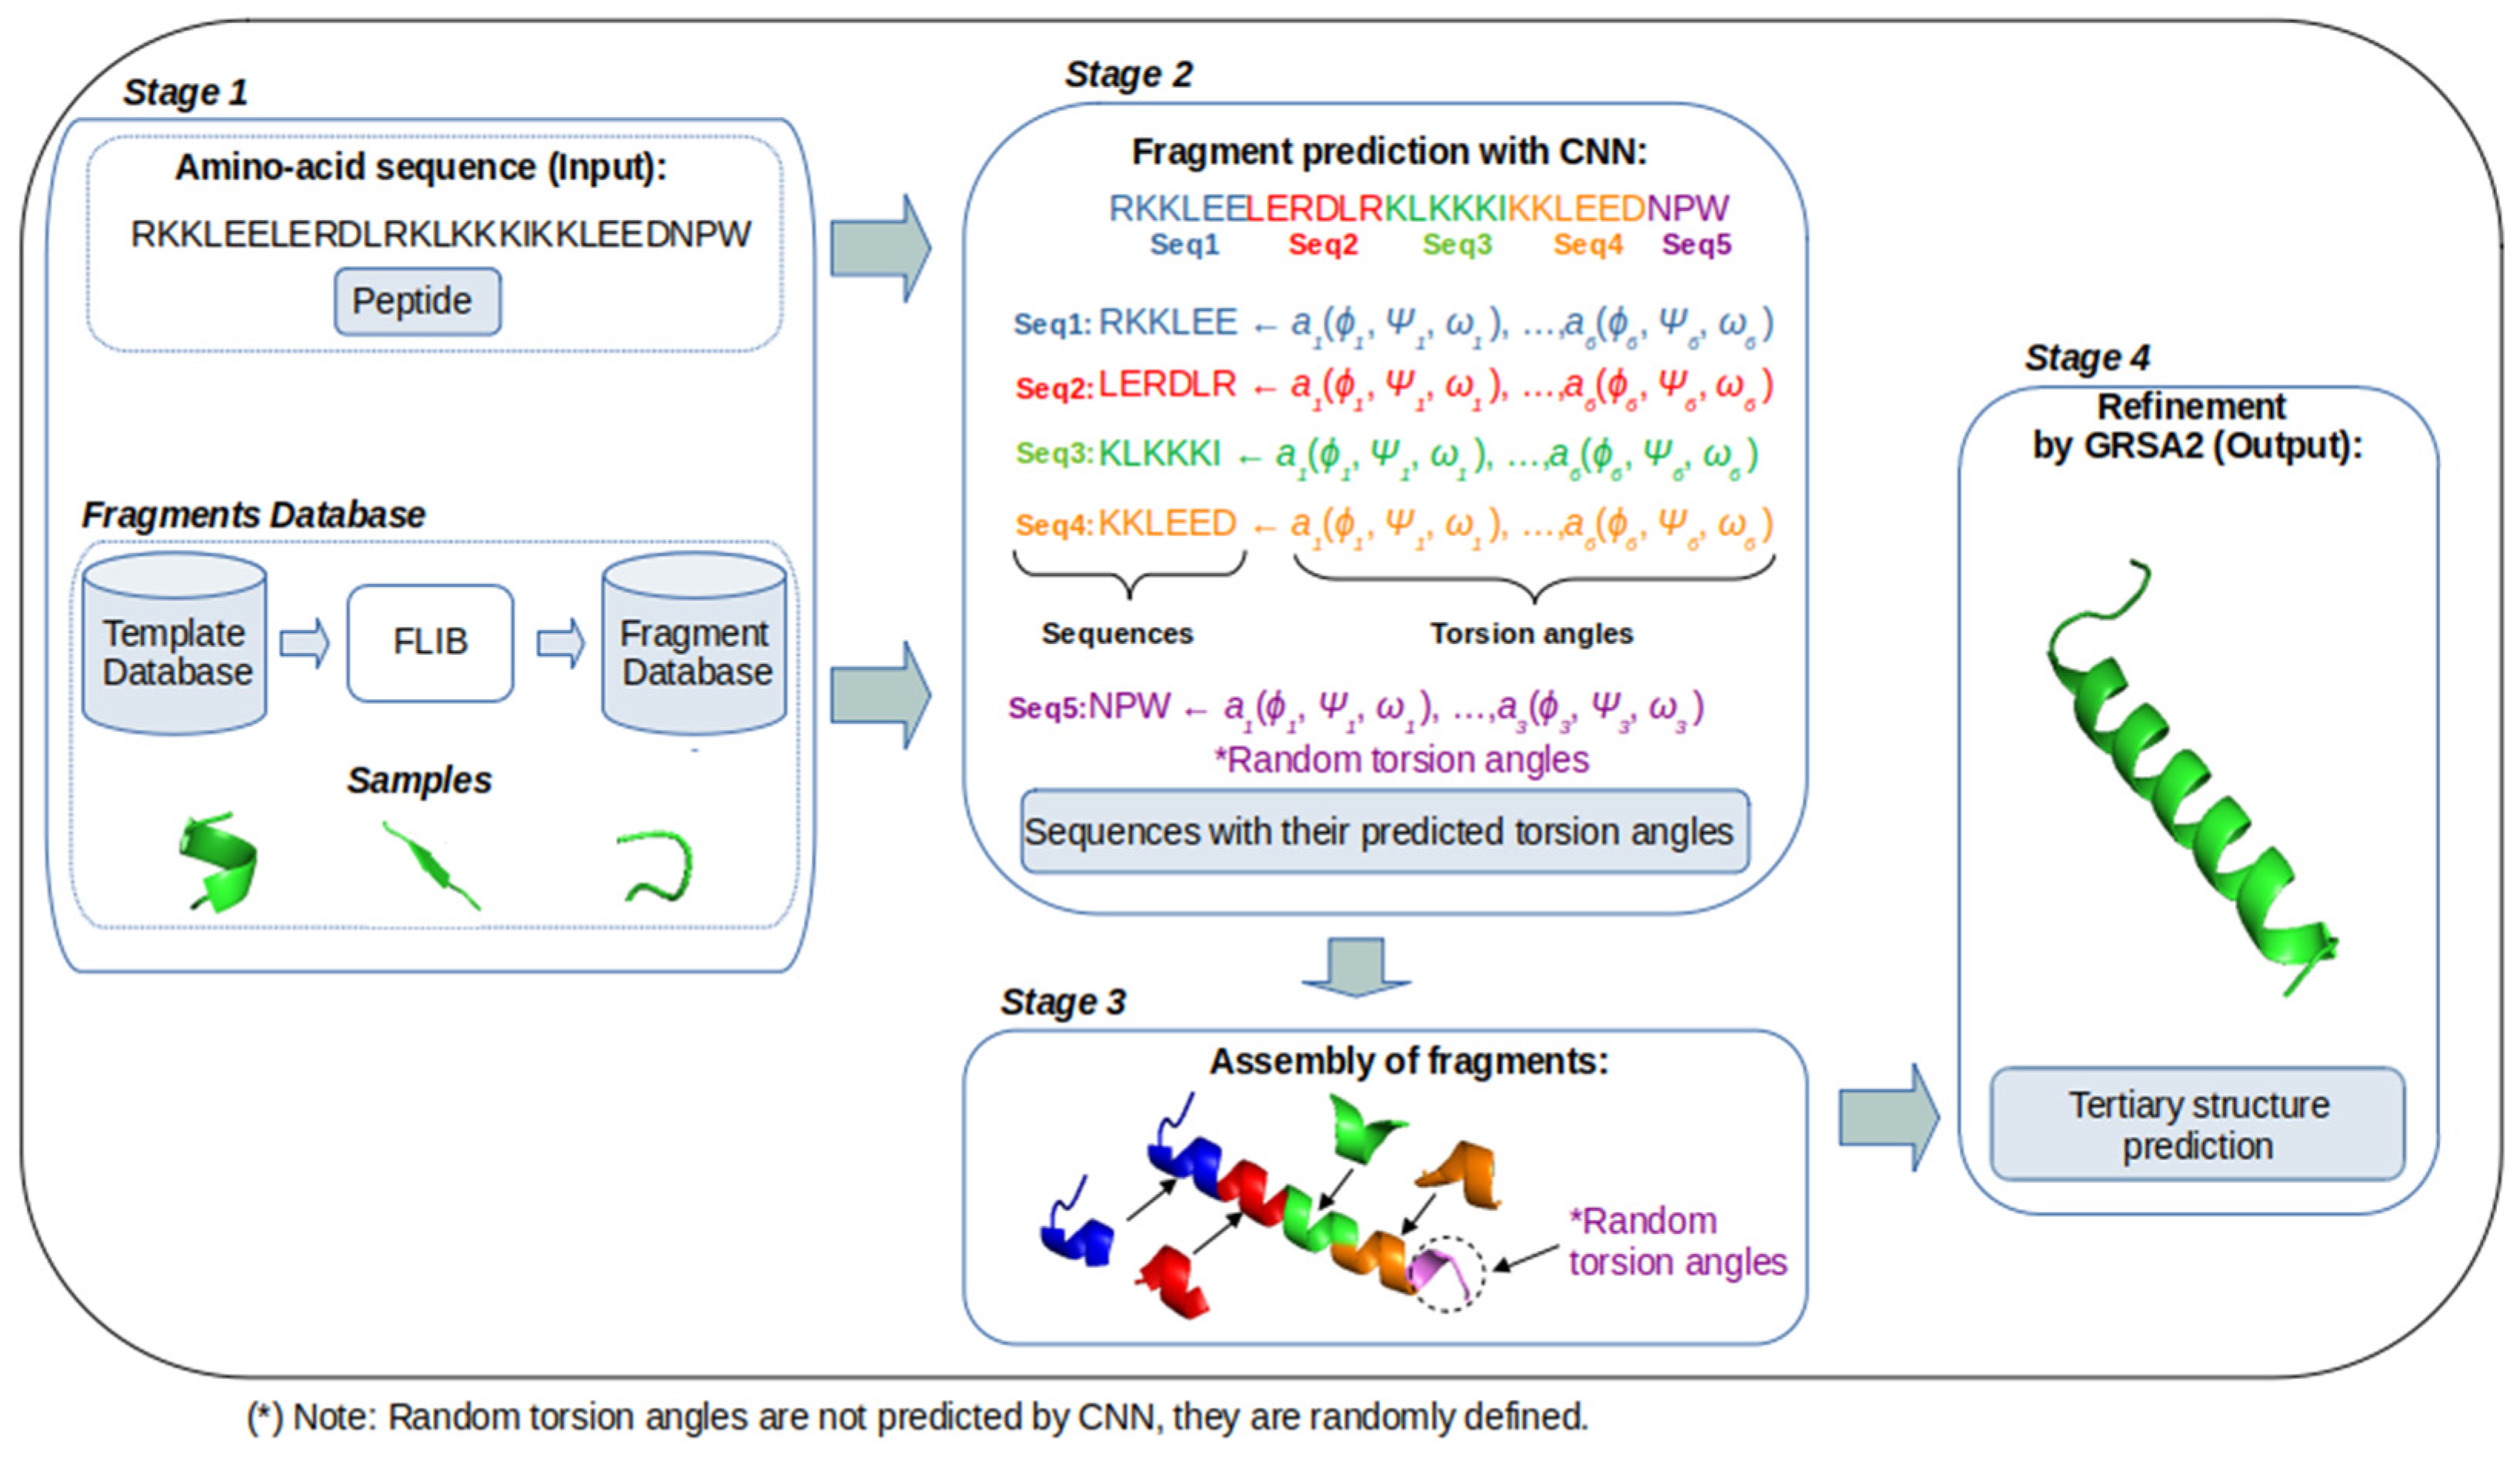
3. GRSA2-FCNN Methodology

This section describes the GRSA2-FCNN methodology that we propose for the prediction of the three-dimensional structure of a protein starting from the character-based representation of the sequence of their aa.
The methodology works by processing short subsequences of six aa, consisting of four stages. As shown in Figure 1, the input of the proposed method consists of the sequence of aa identified by letters that define the primary structure of the protein. Using this input, the main stages of the proposed GRSA2-FCNN methodology are as follows:
  • Amino acid sequence (Stage 1): The amino acid sequence of the target protein is the input for our method. In this stage, the fragments database contains a set of fragments that are classified according to their predominant alpha, beta, and loop secondary structures.
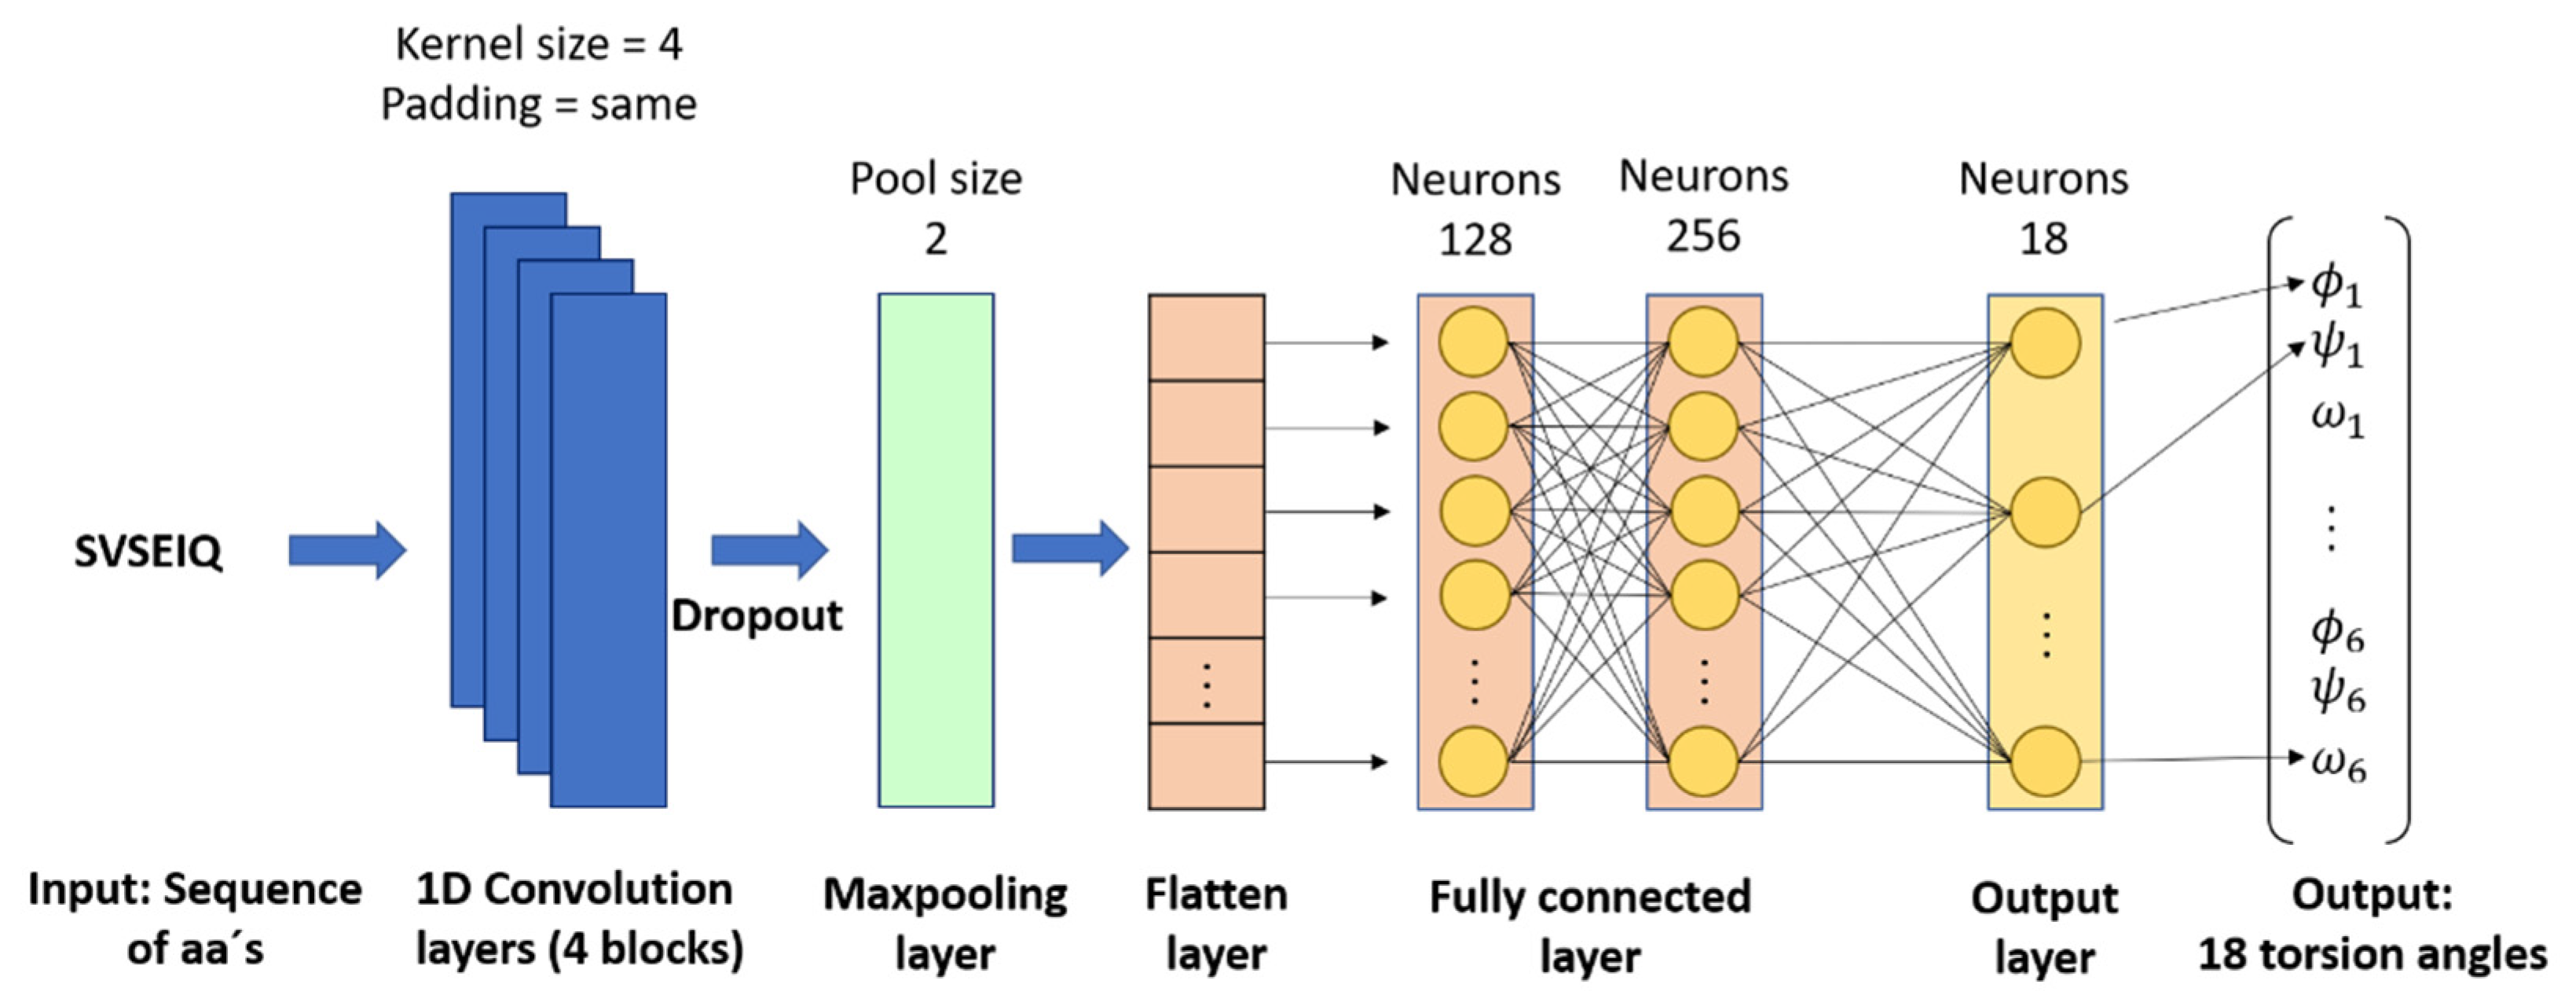
  • Fragments prediction with CNN (Stage 2): The fragments database of stage 1 is used as the input for training a CNN, which performs the prediction of fragments (alpha, beta, and loop) and their torsion angles, which are the internal angles of the backbone of a protein (phi ϕ, psi ψ, and omega ω). A CNN is used to map aa sequences, described by their character-based representation, into their corresponding 3D configurations, which are described by the torsion angles ϕ, ψ, and ω of the bonds of their atoms. These inputs are short sequences of six amino acids only. We chose to work with sequences of this length to maintain low computational requirements. The notation used to represent the input and output of this stage is:
    I n p u t [ a 1 , a 2 , a 3 , a 4 , a 5 , a 6 ]
    O u t p u t [ ϕ 1 ψ 1 ω 1 , ϕ 2 ψ 2 ω 2 , , ϕ 6 ψ 6 ω 6 ]
    where a n indicates the name of the n-th amino acid in the input sequence, and ϕ, ψ, and ω represent the n-th triplet of the torsion angles for a n .
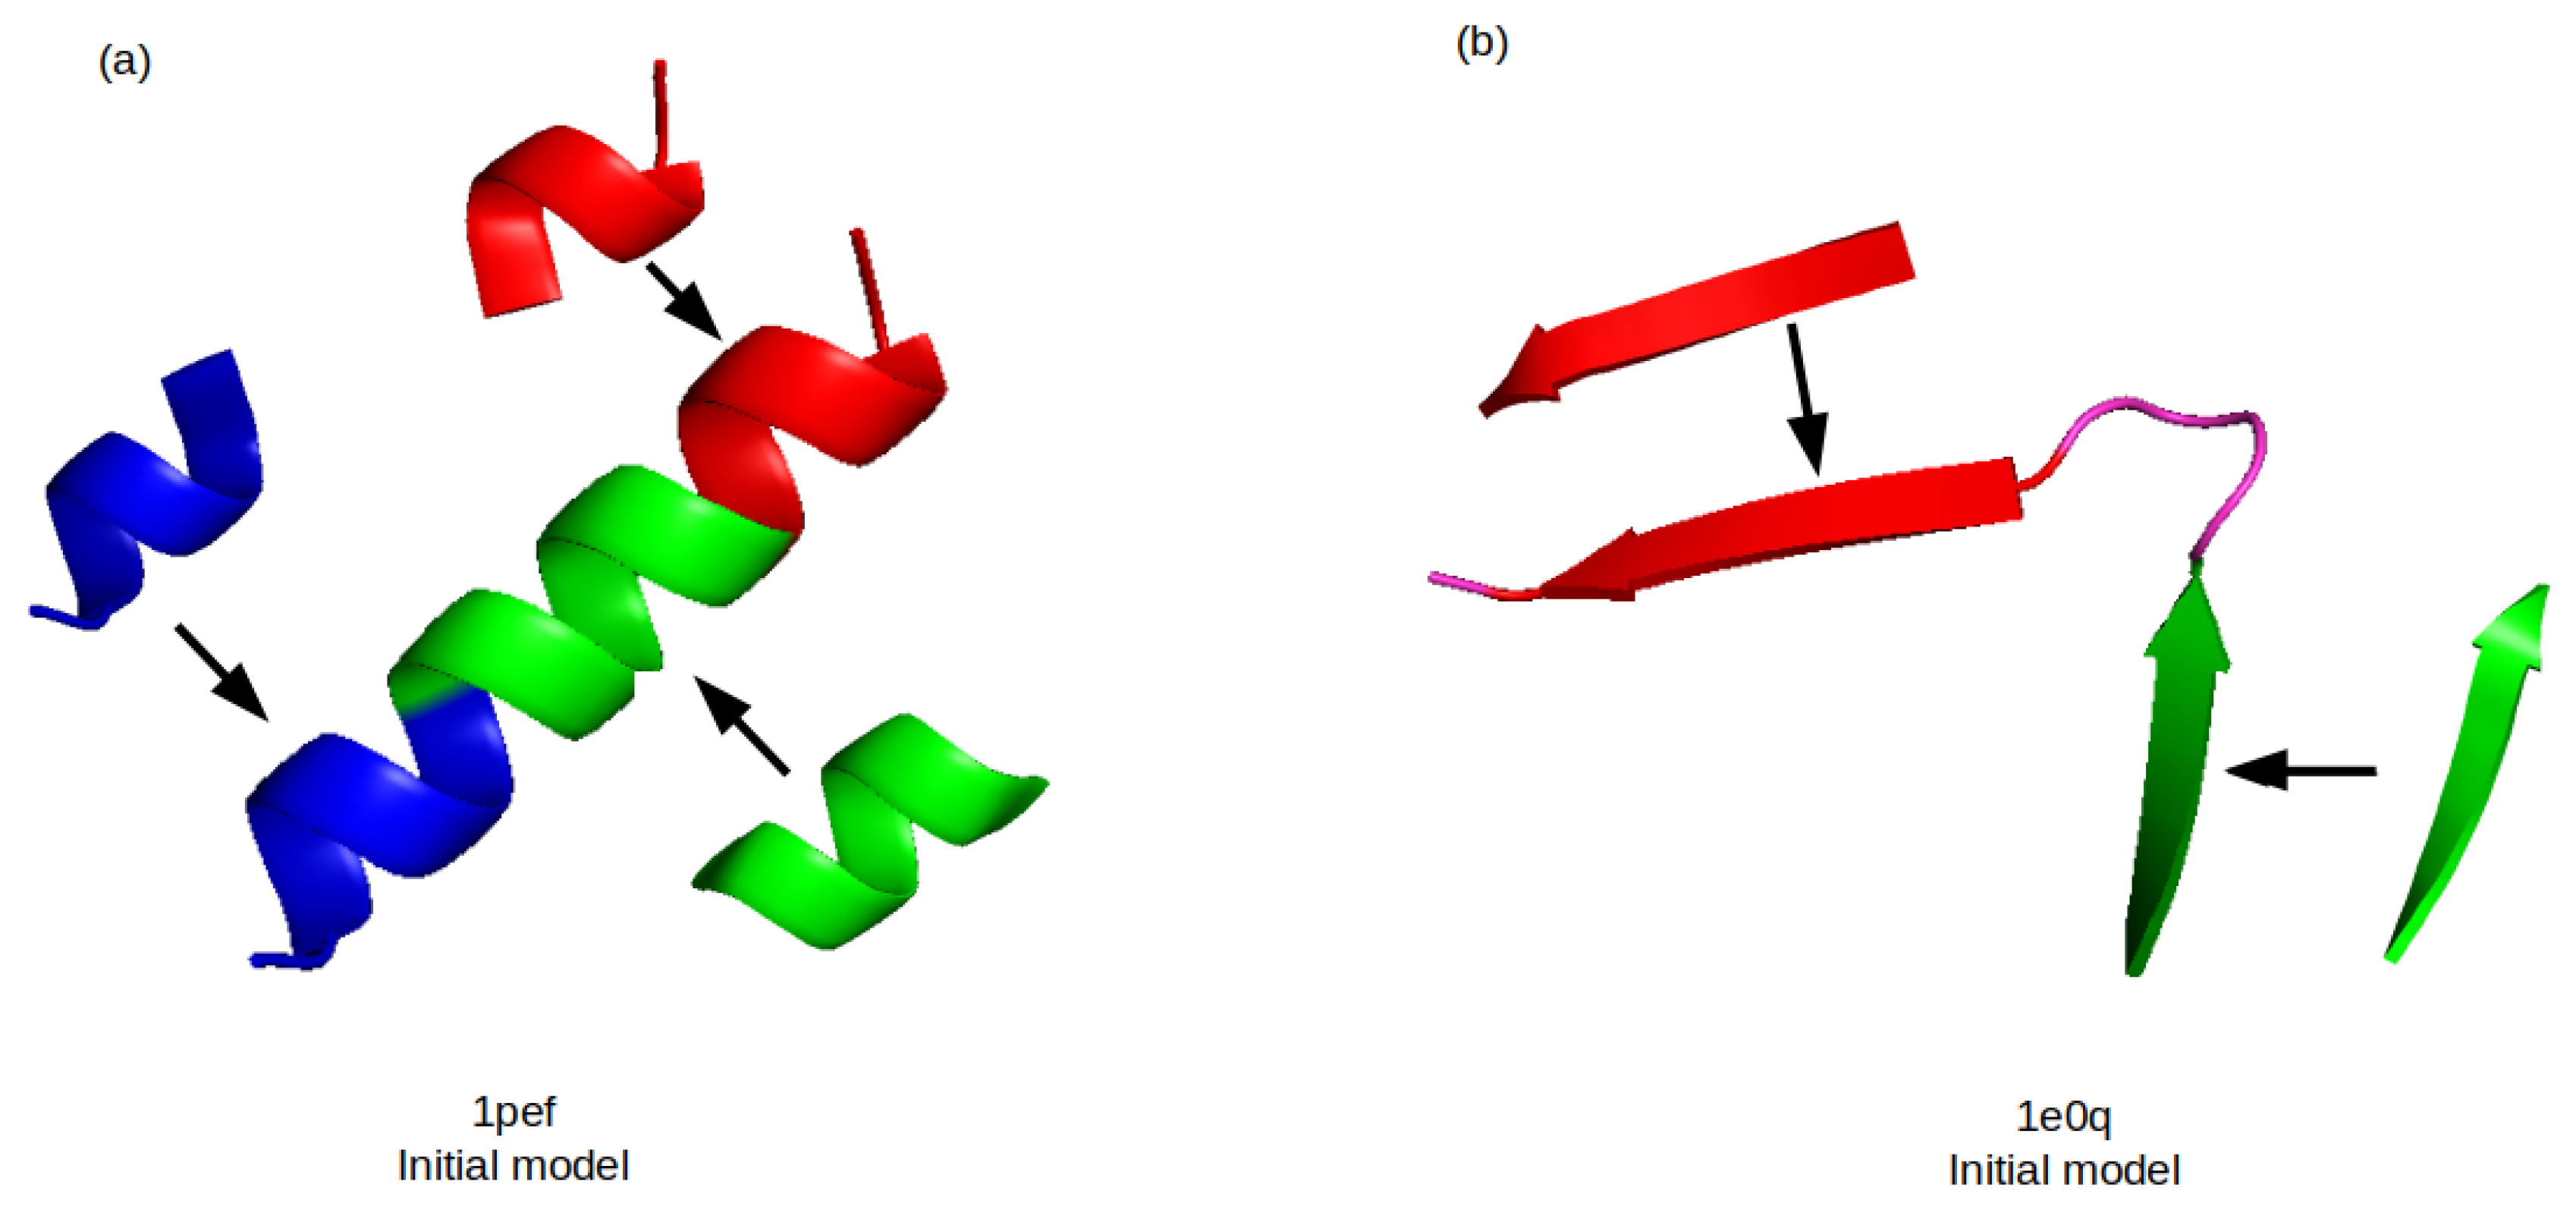
  • Assembly of fragments (Stage 3): The predicted fragments (vector of torsion angles) are concatenated to build a new model of the target sequence. This is to say, the preliminary predictions of the individual segments are concatenated one after the other to build a large vector of torsion angles that corresponds to the complete protein. In this process, the torsion angles of the fragments are assembled in cuts of six amino acids based on the sequence of the aa target. If eventually, the size of the target sequence is not proportional to the size of the fragments, some angles cannot be predicted. In this case, random values are used. This and other issues are solved in the next stage.
  • Refinement by GRSA2 (Stage 4): The full preliminary model, formed by the concatenation of fragments from stage 3, is refined with the energy minimization algorithm GRSA2. The result of this stage is the final tertiary structure of the target protein.
The input of the proposed method consists of the sequence of aa identified by letters that define the primary structure of the protein. The main stages of the proposed GRSA2-FCNN methodology are shown in Figure 1.
To summarize, our methodology is very simple in comparison to state-of-the-art methods and starts from an amino acid sequence that describes the primary structure. Next, with the amino acid sequence known, a CNN makes the construction of a new model of enchained fragments and is ready for a refinement stage with GRSA2, which obtains the final three-dimensional structure. Section 3.1, Section 3.2 and Section 3.3 provide details on each stage of our proposed model.

3.1. Fragments Prediction with CNN (FCNN)

We use a CNN in stage 2, which we call Fragment CNN (FCNN), that processes short fragments of six aa, one at a time. The fragments are taken from a database generated by Flib [39]. The latter database is a fragment library of known three-dimensional structures taken from the Protein Data Bank [40]. In addition, each fragment is made by making cuts in the known structures. Thus, we can conform to a set of alpha, beta, and loop fragments [39]. To obtain our database fragments, we use 12,368 alpha-like fragments, 9953 beta-like fragments, and 3576 loop-like fragments. This database is used as input data for our CNN. The fragments predicted by this network are described by their amino acid sequence and their respective torsion angles ϕ, ψ, and ω. The dataset was divided into 80% for training and 20% for validation. This was done for each type of fragment.
The CNN architecture (see Figure 2) contains four one-dimensional layers (1D CNN) with a configuration of a kernel size of four, and a ReLU activation function followed by a dropout with a value of 0.1. Then, there is a maxpooling layer with a size equal to two. In turn, each convolutional layer contains four 1D filters.
After the set of convolutional blocks, the data representation is flattened and passes through a dropout regularizer with a dropout rate of 0.1, and then on to two fully connected layers of 128 and 256 neurons, respectively, with a ReLU activation function. The training configuration used was an Adam optimizer [41], mean square error as a loss function, 200 epochs, and a batch size with a value of eight. Finally, the data representation is fed to the output layer of 18 neurons with a ReLU activation function, which produces the final prediction for the 18 torsion angles of the protein. The configuration and parameters of this CNN were determined by extensive experimentation.
For learning the FCNN parameters, we minimized the Mean Square Error (MSE) loss function, which measures the average distance in absolute terms between the predicted and the expected torsion angles ϕ, ψ, and ω. Specifically, we minimized the MSE which is equal to a function lm for the m-th training sample, which is computed with Equation (4).
m i n i m i z e   l m = j = 1 18 | y j ( m ) y ^ j ( m ) |
where the index j denotes each of the 18 torsion angles, i.e., ϕ, ψ, and ω for each of the six aa in the sequences, y m denotes the ground truth for the m-sample, and y ^ m its corresponding prediction. In turn, the MSE for the whole training set is computed by Equation (5).
l = 1 M m = 1 M l m
where M indicates the size of the training set.
As mentioned above, we used the Adam optimizer [41], consisting of 200 epochs, in batches of eight samples.

3.2. Assembly of Fragments

The construction of the new protein model in stage 3 is based on the assembly of fragments (i.e., concatenation) of the individual short fragments. FCNN predicts the torsion angles for the target sequence. Each fragment predicted by the FCNN is assembled one by one according to the position of their amino acid sequence. To do this, the FCNN uses the Flib database to train a prediction model, which predicts the torsion angles for each fragment of the amino acid sequence target. In other words, these torsion angles represent an initial model Si = [ɸ1, Ψ1, Χ1, ω1, ɸ2, Ψ2, Χ2, ω2,..., ɸn, Ψn, Χn, ωn], where the corresponding angles for each amino acid are determined by the subindex from 1 to n. For example, in the case of a peptide with 27 aa, it is constructed with four fragments whose length is six aa. The remaining aa are started with a random value generated by the GRSA2 algorithm during the refinement phase. Figure 3 shows two examples of the initial models with the fragments generated by FCNN, the 1pef peptide in (a) has a majority alpha SS and 1e0q (b) has a majority beta SS.

3.3. Refinement by GRSA2

GRSA2 in stage 4 refines the model obtained in the previous stage. The main features of this algorithm are: First, a fast-cooling SA is implemented. In the cooling scheme to lower the temperature value, the alpha parameter is used in a range of values from 0.75 to 0.95 with five golden ratio sections, which are determined by experimentation [16]. Finally, different perturbation strategies are applied to explore the solutions space. The search for solutions is based on perturbation decomposition and soft collision to find a new structure with lower energy.
Figure 4 shows four models obtained by the GRSA2 refinement, and the native structure evaluated with the TM-score and GDT-TS metrics.

4. Results

We carried out experiments with the proposed GRSA2-FCNN methodology and compared it with I-Tasser, Quark, Rosetta, PEP-FOLD3, TopModel, AlphaFold2, and GRSA2-SSP. The instances (peptides) that we used in this experiment have a length that varies from 9 to 49 aa in their primary structure. Consequently, the varying number of aa also varies the number of torsion angles. Specifically, the number of torsion angles is within the range [47–304] for each peptide instance. Table 1 shows the peptides dataset that we used in this work. It contains 60 instances, which are represented with their PDB code and ordered by the number of aa. These instances according to their SS are classified into alpha (mostly alpha structures), beta (mostly beta structures), and none (structures with no alpha or beta majority). Also, we included the experimental method (named Exp in Table 1) used to obtain the structure of the protein in the Protein Data Bank. The peptides (PDB code) are taken from [15,17,42,43].
GRSA2-FCNN was evaluated by processing each instance 30 times. The SMMP [44] software package (version 3.0) was used to calculate a protein structure with the energy function (ECEPP/2). The initial and final temperature parameters for each instance were determined by an analytical tuning method [37]. The algorithms of the proposed methodology GRSA2-FCNN were executed in the Ehecatl cluster in TecNM/IT Ciudad Madero, which has the characteristics: Intel ® Xeon ® processor at 2.30 GHz, memory: 64 GB (4 × 16 GB) ddr4-2133, Linux CentOS operating system, and FORTRAN and Python programming languages.

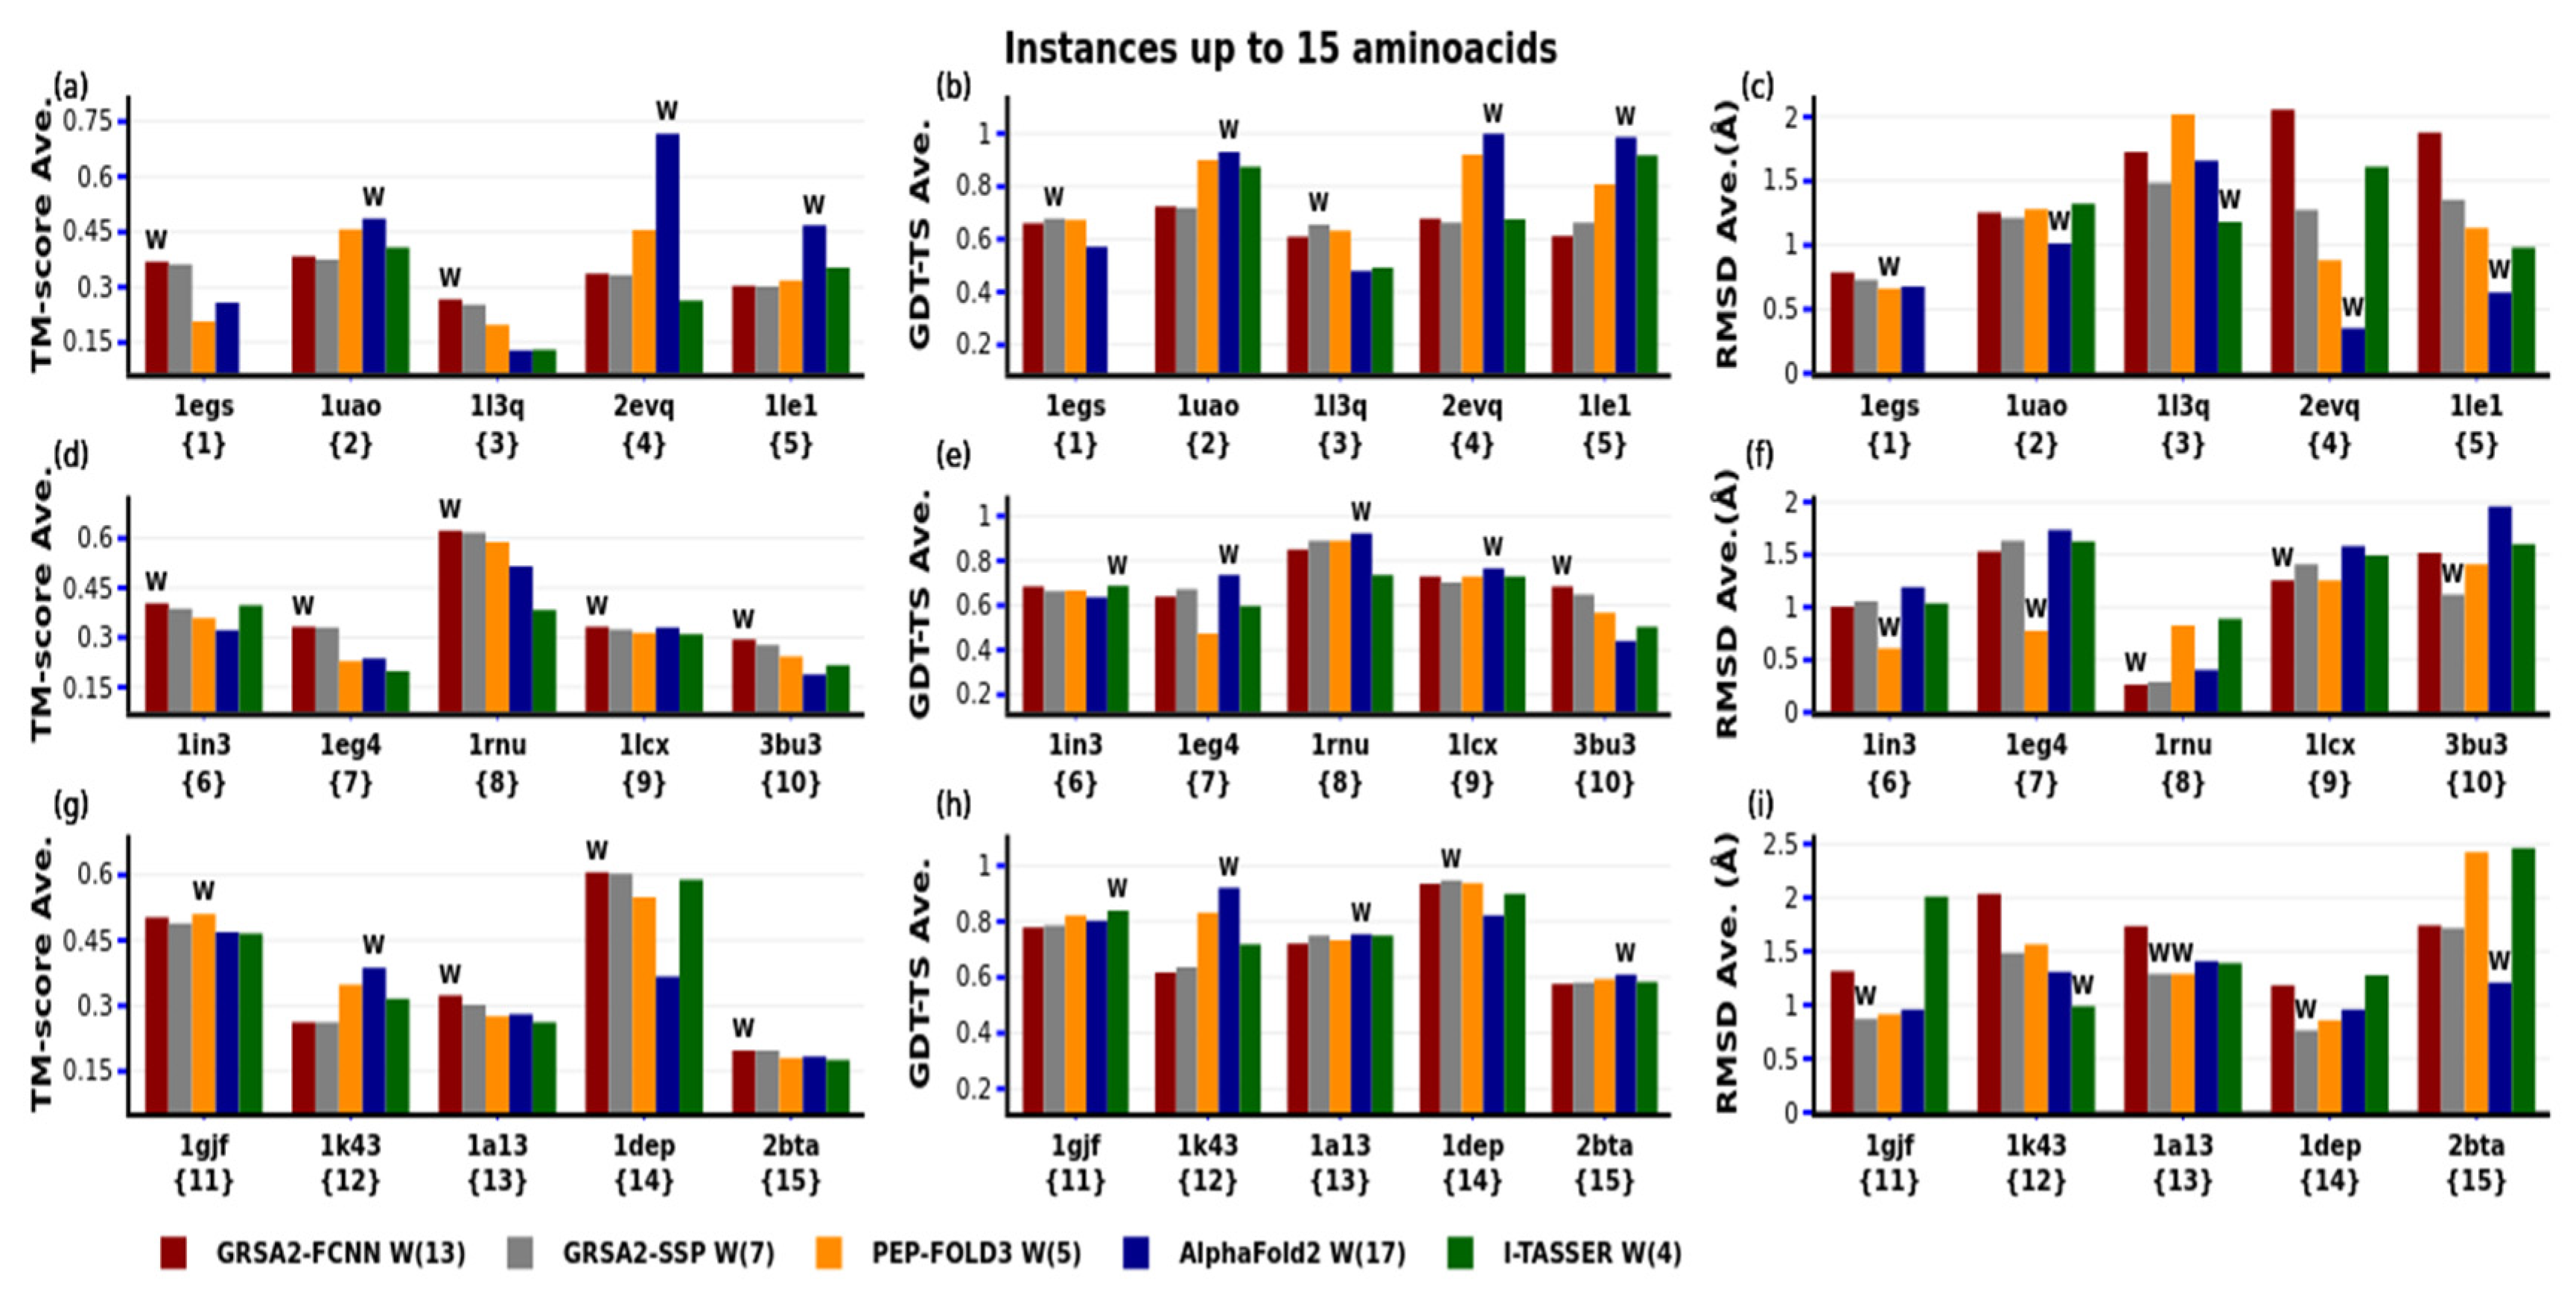
4.1. First Evaluation

To evaluate our methodology we use the metrics TM-score [19], RMSD [38], and Global Distance Test-Total Score (GDT-TS) [20]. These metrics are commonly used in the CASP competition for assessing the quality of the PFP methods. The TM-score has a range of values [from 0 to 1] to measure the similarity between two protein structures. Values above 0.5 and close to 1 in the TM-score indicate high structural similarity, whereas values below 0.5 indicate low structural similarity. In the case of GDT-TS, a protein is considered more perfect when its metric is closer to 1. RMSD is the oldest metric used in the PFP area, and a protein is considered with the best structure when the RMSD value is close to 0.
First, in Figure 5 we show the behavior of GRSA2-FCNN, where the 60 instances were classified by type of main secondary structure alpha, beta, and none. In the none secondary structure, there is no case where alpha or beta has a significant majority. GRSA2-FCNN obtained better results for the case of peptides with more alpha structures having high values in TM-score and GDT-TS and small values in RMSD. Conversely, peptides with majority beta structures have the lowest values for TM-score and GDT-TS, and the highest values in RMSD.
Figure 6, Figure 7 and Figure 8 show the results of GRSA2-FCNN compared with the state-of-the-art algorithms, which were executed in their servers. Instances are numbered from {1} to {60} by sequence from 9 to 49 aa and divided into three ranges for groups of five for each figure: up to 15, from 16 to 30, 31 to 40, and over 40. In every instance, each algorithm is labeled with a color and the one with the best result for each instance in its respective metric is labeled with a letter W, representing the winning method for the group. For the TM-score metric, we present in Figure 6, Figure 7 and Figure 8 the mean of the five best scores for each algorithm and the mean of the corresponding scores in GDT-TS and RMSD. For each algorithm, we performed a W-count to determine the most frequent winner.
In Figure 6, we show the results achieved for the smaller peptides (up to 15 aa), where AlphaFold2 obtained seventeen Ws (four in TM-score, nine in GDT-TS, and four in RMSD), while for I-TASSER there were four Ws (two in GDT-TS and two in RMDS), GRSA2-SSP had seven Ws (three in GDT-TS and four in RMSD), and PEP-FOLD3 had five Ws (one in TM-score and four in RMSD). GRSA2-FCNN obtained thirteen Ws (ten in TM-score, one in GDT-TS, and two in RMSD). The three best algorithms for instances with up to 15 aa were AlphaFold2, GRSA2-FCNN, and GRSA2-SSP. The performance of GRSA2-FCNN is as good as that of AlphaFold2. In this test, Quark, Rosetta, and TopModel are not included because they are not designed to predict instances with lengths lower than 20, 27, and 30 aa, respectively.
Figure 7 shows the results obtained for peptides of lengths between 16 and 30 aa. AlphaFold2 achieved fifteen Ws (three in TM-score, seven in GDT-TS, and five in RMDS), I-TASSER had twelve Ws (four in TM-score, five in GDT-TS, and three in RMSD), GRSA2- SSP had two Ws (one in GDT-TS and one in RMSD), QUARK obtained only two Ws (one in TM-score and one in RMSD), and PEP -FOLD3 had four Ws (all of them in RMSD). The GRSA2-FCNN methodology achieved twelve Ws (seven in TM-score, four in GDT-TS, and one in RMSD). Therefore, for this case, the performance of GRSA2-FCNN is better than all the alternatives when TM-score is used for the comparison.
Figure 8 presents the results for peptides of 31 to 40 aa. AlphaFold2 had twelve Ws (five in TM-score, six in GDT-TS, and one in RMSD), I-TASSER was the best in seven Ws (three in TM-score, three in GDT-TS, and one in RMSD), TopModel had thirteen Ws (four in TM-score, four in GDT-TS, and five in RMSD), Rosetta obtained nine Ws (three in TM-score, two in GDT-TS, and four in RMSD), GRSA2-SSP had no Ws, QUARK had two Ws in RMSD, and PEP-FOLD3 one W in RMSD. In this case, GRSA2-FCNN obtained one W in RMSD. In this test, TopModel was the best method in all the metrics. The performance of GRSA2-FCNN was not good with this set of instances.
Figure 9 presents the results for peptides of over 40 aa. AlphaFold2 had fourteen Ws (four in TM-score, five in GDT-TS, and five in RMSD), I-TASSER had eleven Ws (four in TM-score, four in GDT-TS, and three in RMSD), TopModel had three Ws (one in GDT-TS and two in RMSD), Rosetta obtained nine Ws (two in GDT-TS, three in TM-score, and four in RMSD), GRSA2-SSP had one W in TM-score, and QUARK had one in RMSD. GRSA2-FCNN obtained six Ws (three in TM-score and three in GDT-TS), and AlphaFold2 was the best method in all the metrics. The performance of GRSA2-FCNN was better than TopModel, QUARK, PEP-FOLD3, and GRSA2-SSP.

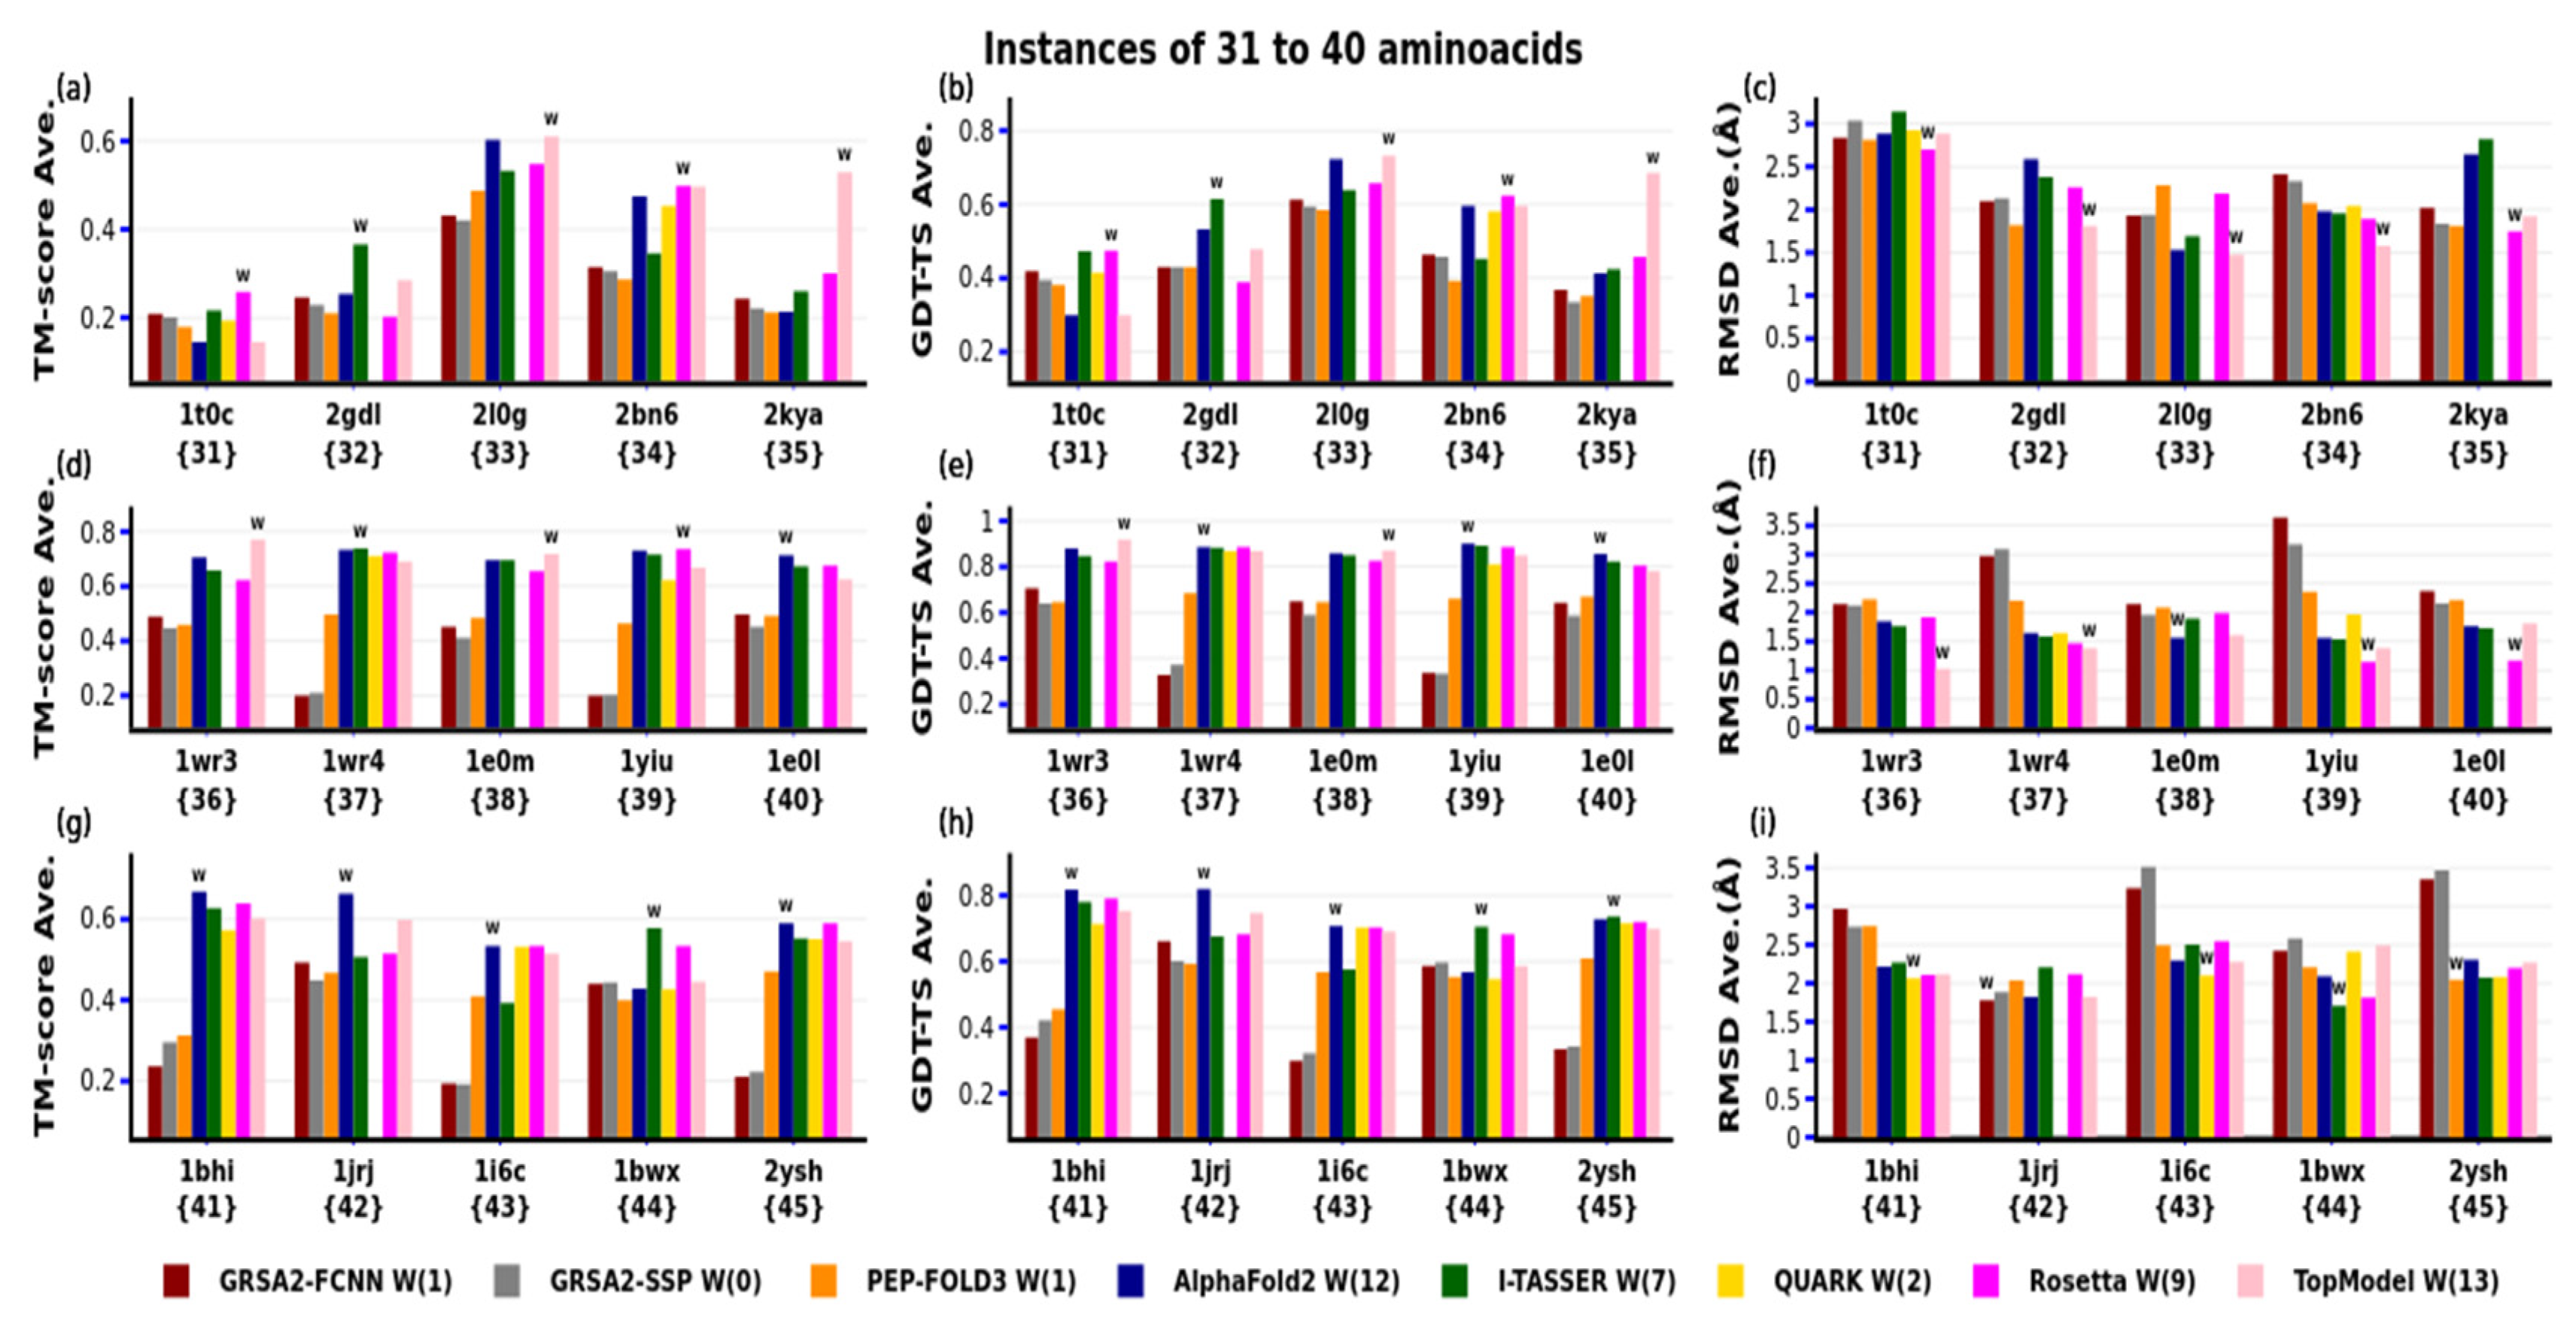
4.2. Second Evaluation

Figure 10 and Figure 11 present a comparison according to secondary structure type and are organized into two groups. The first group with instances of up to 30 aa and the second group with instances of greater or equal to 30 aa. This is because the algorithms QUARK, Rosetta, and TopModel cannot predict peptides less than 20, 27, and 30 aa respectively. In the first group (Figure 10), we performed a comparison between AlphaFold2, I-TASSER, PEP-FOLD3, GRSA2-SSP, and our proposed method GRSA2-FCNN, according to the type of the main secondary structure of the peptides, considering alpha, beta, and none majority structures. GRSA2-FCNN had good results in alphas and none structures in this group. However, it is somewhat limited in beta structures.
In the second group of over 30 aa (Figure 11), we performed a comparison between AlphaFold2, I-TASSER, PEP-FOLD3, GRSA2-SSP, Rosetta, QUARK, TopModel, and our proposed method GRSA2-FCNN. In this comparison, our method did not perform so well.

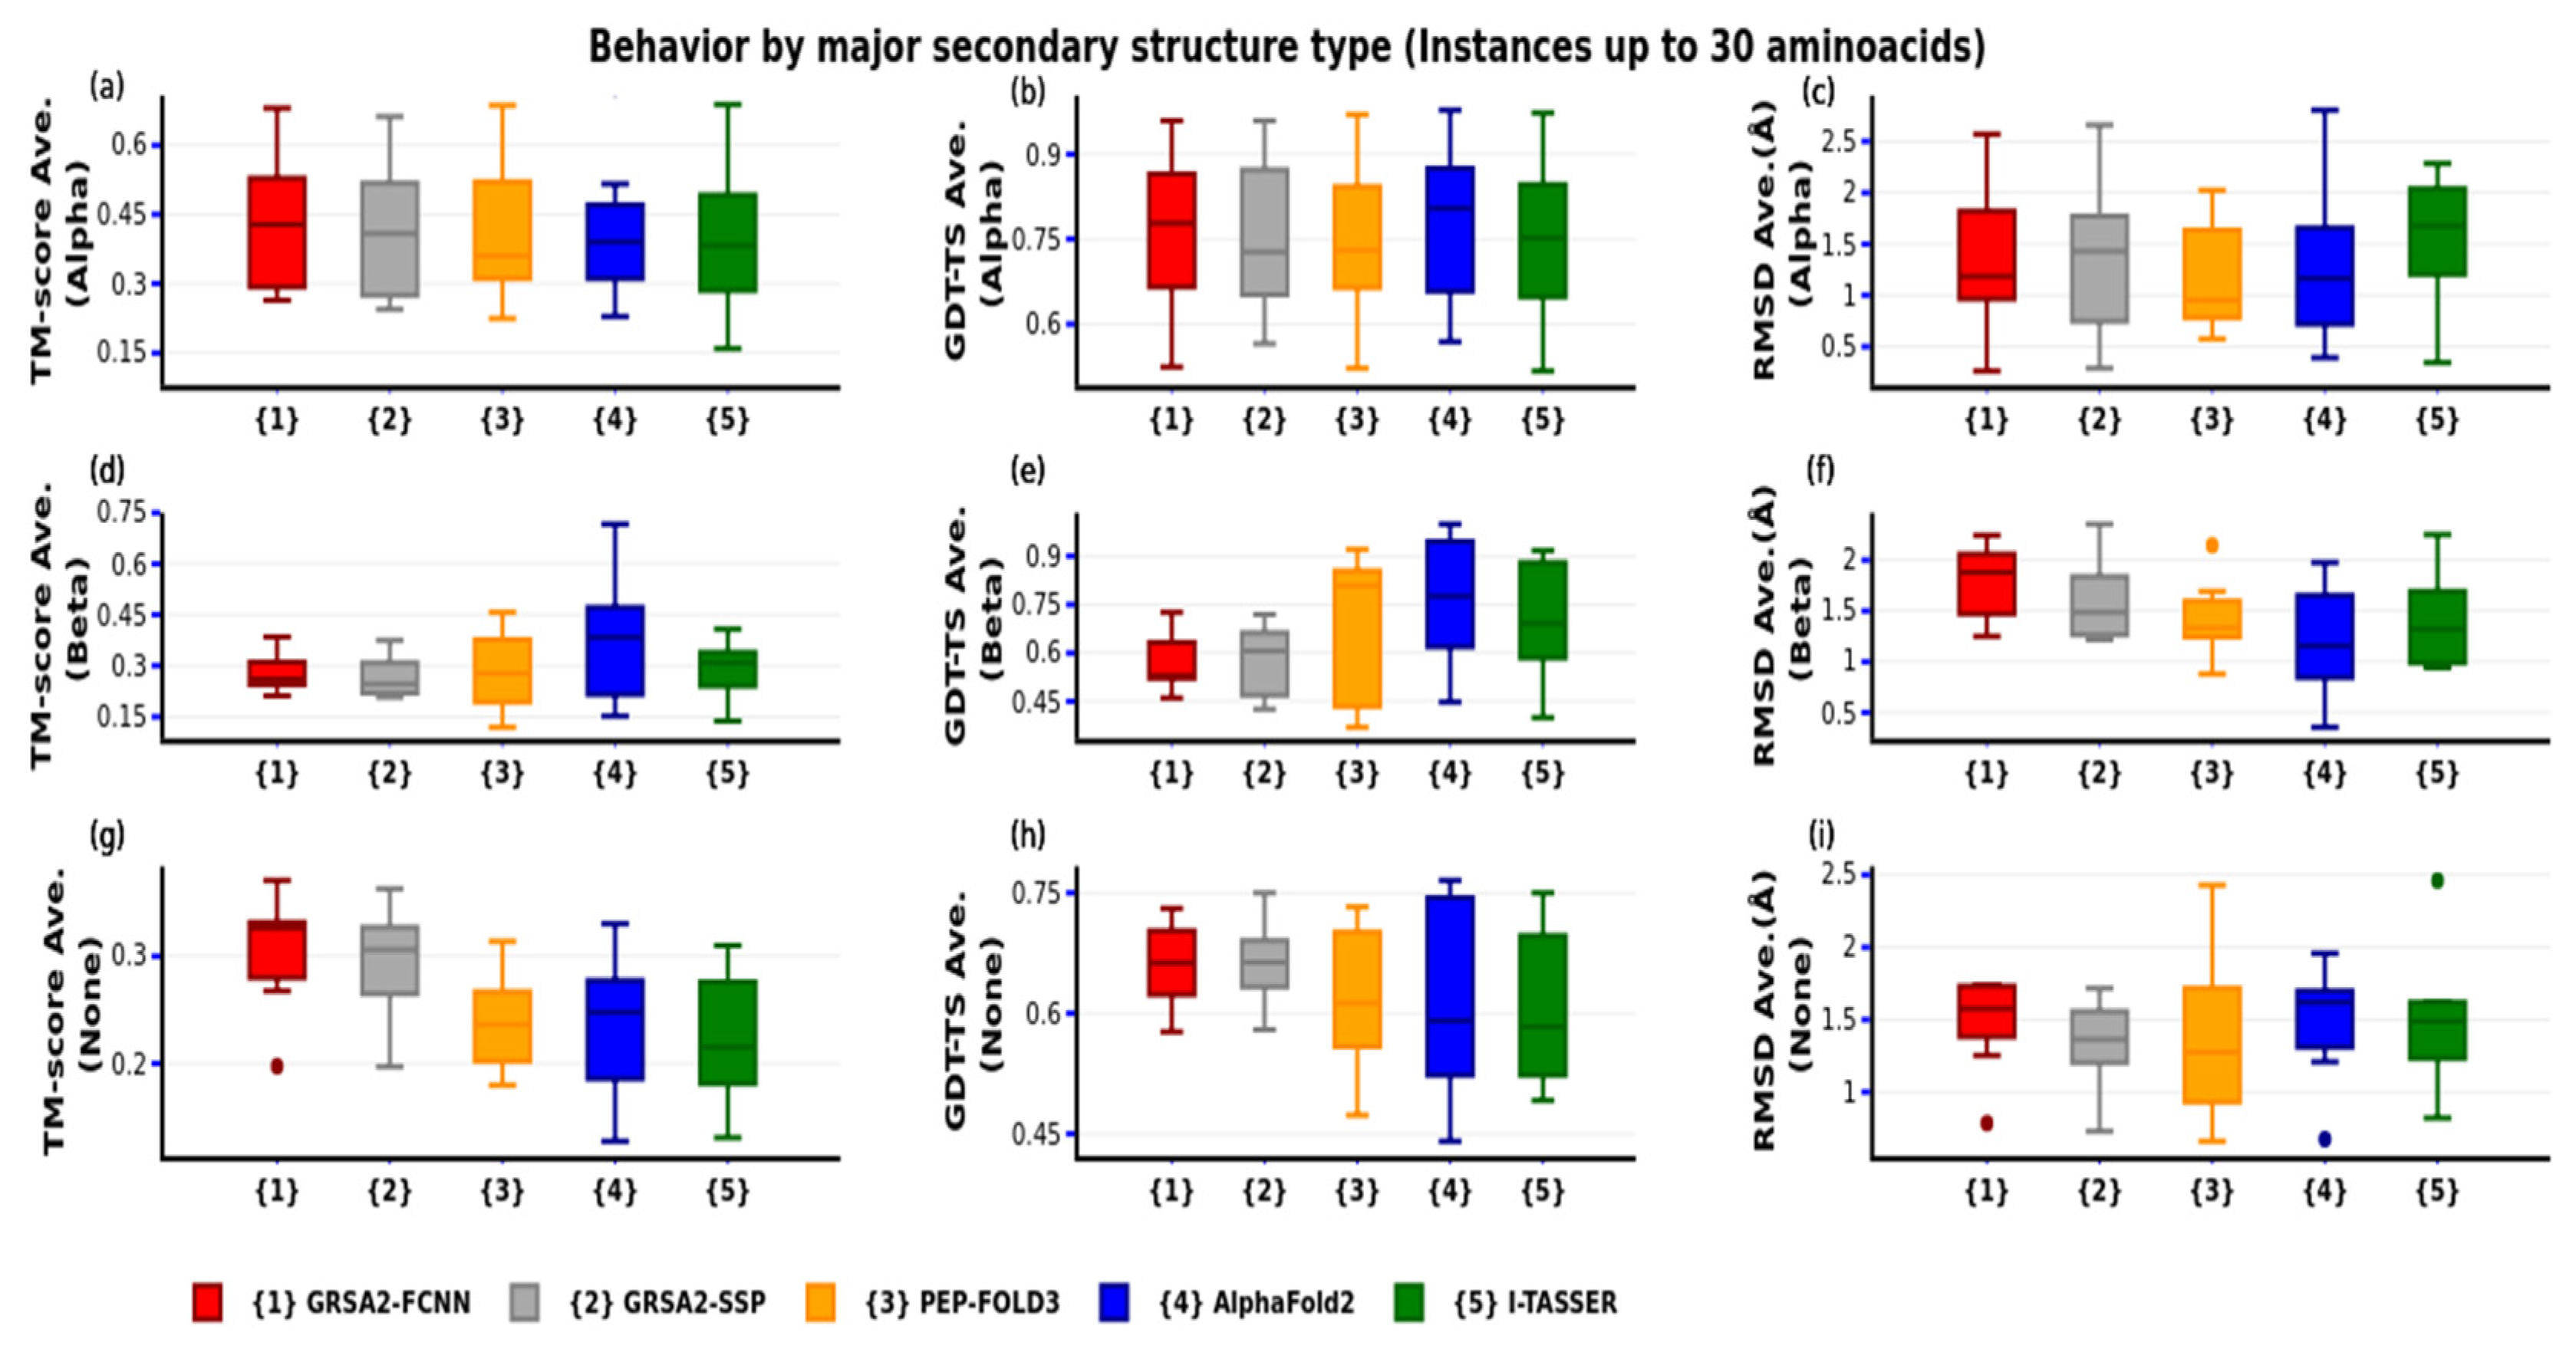
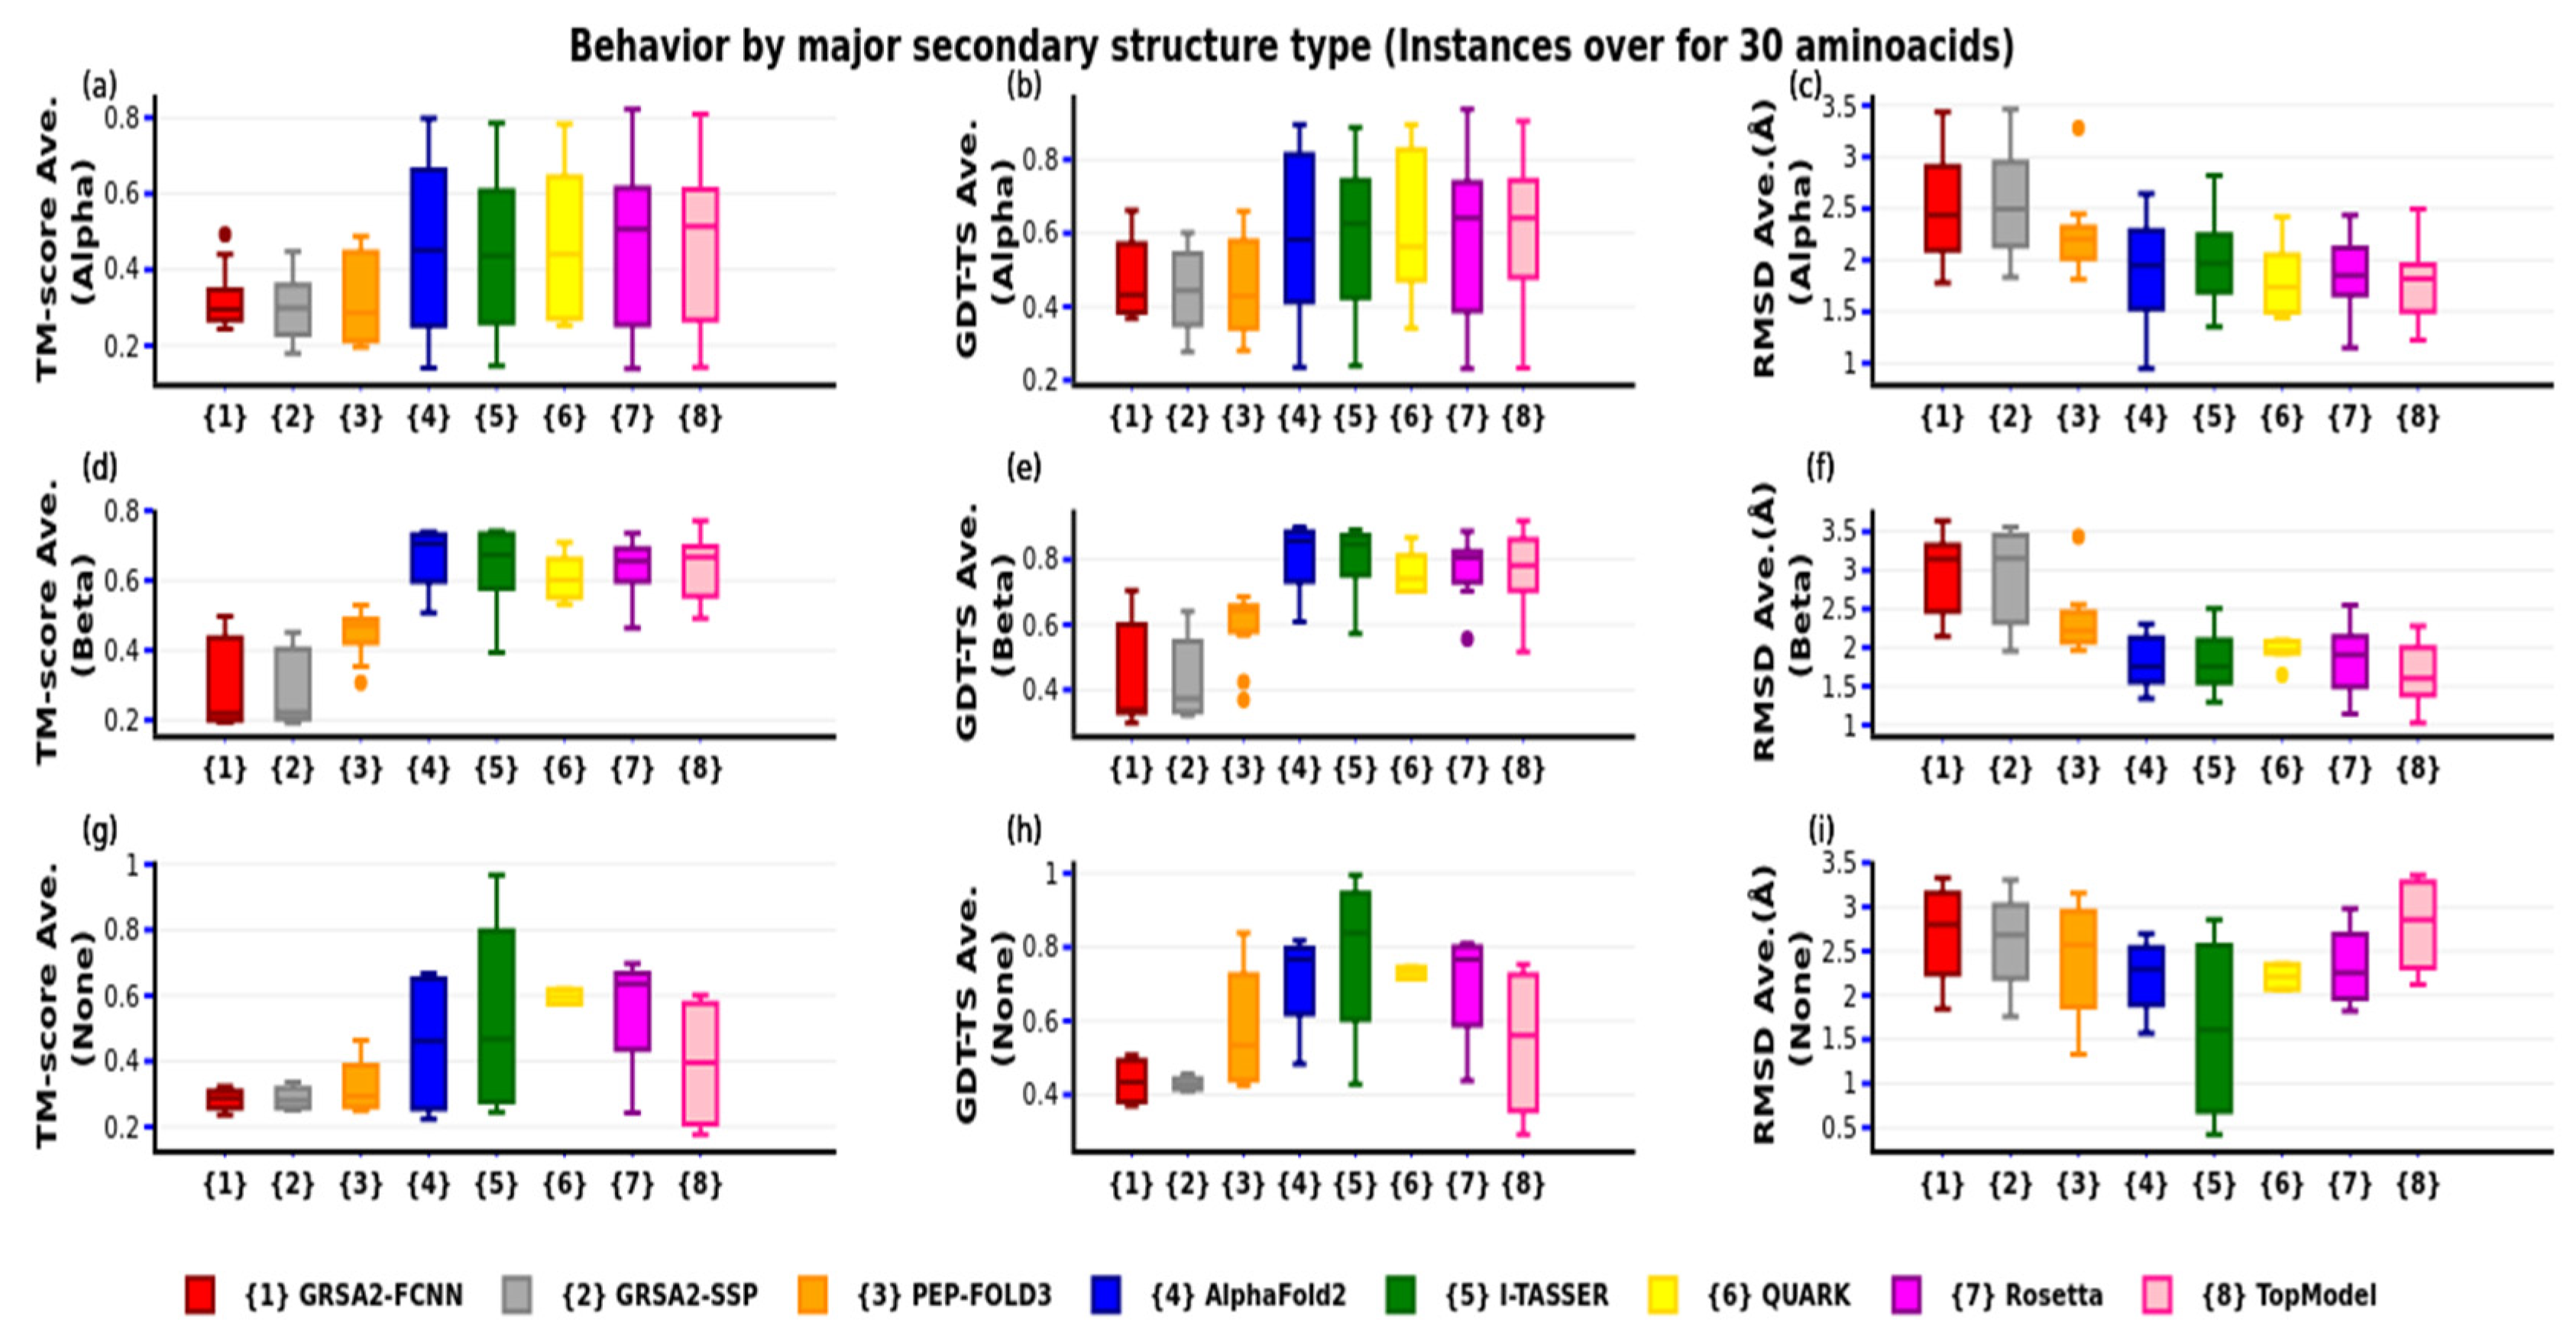
4.3. Third Evaluation

To analyze the performance of our algorithm for each secondary structure, we considered the length of the peptides, measured the correlation of the set of peptides in each structure, and carried out hypothesis tests taking the TM-score as the main metric. In Figure 12, we present the performance of our GRSA2-FCNN algorithm versus the length of each peptide grouped by secondary structure alpha, beta, and none. Figure 12c shows the alpha secondary structure, and the quality achieved by this algorithm decreases with peptide length for the dataset. The trend shown in this figure is negative, which helps to explain why the results are more accurate for the alpha structures, as the peptides are shorter. Figure 12a,b show there is no clear trend for the none and beta secondary structures. The correlation obtained for the three structures between quality metric versus the length of the peptides were −0.5156, 0.0770, and −0.04057. These values confirm that the results obtained by the proposed algorithm show a tendency only for small alpha peptides.
To compare the performance of our algorithm in each group by secondary structure, a nonparametric Wilcoxon signed-rank test was performed with a critical value of 0.05 and over for the p-value. For comparison, a ranking of algorithms was established according to the number of times the best TM-score was obtained (Table 2). In group 1, the proposed algorithm has, on average, a better result than AlphaFold2. These two algorithms were compared by establishing the following hypothesis: H0: μ 1 = μ 2 where μ 1 and μ 2 are the means for the GRSA2-FCNN and AlphaFold3 algorithms, respectively. Similarly, for group 2, the proposed algorithm is compared with the next-best-ranked algorithm establishing the same null hypothesis. In the third and fourth groups, where the proposed algorithm ranks 5 and 4, respectively, the proposed algorithm was compared with the next-best-ranked algorithm, i.e., I-TASSER and Rosetta. The box plots of results obtained after the hypothesis test are shown in Figure 13.
In Figure 13, the box plots obtained with the hypothesis test in alpha and beta structures are shown using the TM-score metric. These box plots are analyzed by groups and secondary structures. In the case of alpha structures, the result for the alpha structures of the proposed algorithm is as follows: in groups, 1, 2, 3, and 4, we note that the proposed algorithm achieved the places 1st, tied with the best, 5th, and 4th, respectively. Moreover, we observe that, as the groups are smaller, the proposed algorithm has a better performance. In the first column of Figure 13, the results of the alpha structure are presented to compare GRSA2-FCNN with the best of the state-of-the-art. In group 1, where our algorithm is compared with AlphaFold2, we can observe that GRSA2-FCNN surpassed it. In group 2, the TM-score average of the GRSA2-FCNN is slightly superior, however, the test hypothesis results showed these two algorithms are equivalent; thus, we declared in this figure they are tied. In groups 3 and 4, the TM-score average of I-TASSER and Rosetta surpassed GRSA2-FCNN.
In the case of beta structures, size does not have an important impact, as was discussed above. In group 1, GRSA2-FCNN competes against AlphaFold2, which performs better. In group 2, it competes against I-TASSER and, as is shown in the box plots, I-TASSER performs better. For groups 3 and 4, the proposed algorithm competes against I-TASSER and Rosetta, respectively; the result is that, in these two groups, the algorithm has a poor performance. Consequently, in these last two groups, the proposed algorithm should be ranked in 5th and 4th place. The none structures could not be assessed because the number of samples was too small; thus, boxplots were not obtained for these structures.
The 60 peptides of the dataset evaluated for GRSA2-FCNN show similar performance to the AlphaFold2 and I-TASSER for up to 30 aa. The fragments generated by CNN significantly enhanced the initial model. Moreover, the refinement of the model improves the final peptide prediction. In the case of the larger peptides of over 30 aa, GRSA2-FCNN does not have the best performance when the comparison is by secondary structure Beta and None. However, in the case of the Alpha structure, our method is competitive in group 3 in the comparison of the results obtained by I-TASSER with the set of instances proposed in this paper.

5. Conclusions

In this work, we present the GRSA2-FCNN methodology for the prediction of three-dimensional peptide structures that includes Golden Ratio Simulated Annealing and Convolutional Neural Networks. GRSA2-FCNN is compared to the state-of-the-art methods I-TASSER, Rosetta, AlphaFold2, PEP-FOLD3, QUARK, TopModel, and GRSA2-SSP in an experiment testing the performance of GRSA2-FCNN with a set of 60 instances.
The evaluation and comparison of GRSA2-FCNN results with those of the state-of-the-art algorithms were based on the metrics currently used in the protein folding problem area for 60 instances. The dataset of peptides was divided into groups of up to 15 aa, 16 to 30 aa, 31 to 40 aa, and over 40 aa, and the results of each instance were analyzed. The evaluation shows that GRSA2-FCNN performs very well for up to 30 aa compared to the state-of-the-art. For the group of up to 15 aa, we found that GRSA2-FCNN was the second best with AlphaFold2 the winner, while in the group from 16 to 30 aa, GRSA2-FCNN had the same performance as AlphaFold2. In the group of 31 to 40 aa, AlphaFold2 and TopModel were the best in obtaining the winning results. Finally, the group of over 40 aa AlphaFold and I-TASSER were the best, although, GRSA2-FCNN had six good results.
Additionally, we compared GRSA2-FCNN to the state-of-the-art algorithms according to the secondary structure type, which was divided into two groups, because the algorithms QUARK, Rosetta, and TopModel can only predict peptides of over 20, 27, and 30 aa, respectively. The performance of GRSA2-FCNN concerning the type of secondary structure shows good results for predictions of peptides with mostly alpha type of up to 30 aa, while in the case of instances of over 30 aa, our method is competitive only in alpha structures. For the case of peptides that are mostly beta or none, the proposed algorithm gave limited results compared to AlphaFold2, I-TASSER, Rosetta, and TopModel.
Finally, we made an evaluation using the TM-score metric, where we considered the secondary structure versus the length (number of aa) of peptides. We show that, in the case of alpha structure, the length of peptides impacts the quality of the results. Nevertheless, in beta and none there is no clear trend between the performance metric and the length of the peptides. Also, assessing with box plots for secondary structures alpha and beta, we show that the proposed method achieves equivalent results for small peptides to those of the state-of-the-art. However, it obtains poor results as the length of the peptides is increased.
We analyzed the results obtained by GRSA2-FCNN in comparison with the state-of-the-art algorithms and concluded that, in the case of peptides, GRSA2-FCNN surpasses PEP-FOLD3, QUARK, and GRSA2-SSP. The proposed methodology achieves very good results with the set of instances presented in the paper and for peptides of up to thirty aa. In conclusion, we find that our methodology is competitive with the other algorithms evaluated in this paper.

Author Contributions

Authors J.F.-S., D.A.S.-M. and J.P.S.-H. contributed equally to the development of this paper. Conceptualization, J.P.S.-H., D.A.S.-M. and J.F.-S.; methodology D.A.S.-M., J.F.-S., J.P.S.-H., E.R.-R. and J.J.G.-B.; Software J.F.-S., J.P.S.-H. and D.A.S.-M.; validation, J.P.S.-H. and J.F.-S.; formal analysis, D.A.S.-M., J.J.G.-B. and E.R.-R.; writing—original draft, D.A.S.-M., J.F.-S. and J.P.S.-H.; writing—review and editing, J.F.-S., D.A.S.-M., E.R.-R. and J.P.S.-H. All authors have read and agreed to the published version of the manuscript.

Funding

This research received no external funding.

Data Availability Statement

Publicly available datasets were analyzed in this study. This data can be found here: https://github.com/juanpaulosh/GRSA2-FCNN-results.git (accessed on 8 December 2022).

Acknowledgments

The authors would like to acknowledge with appreciation and gratitude CONACYT and TecNM/Instituto Tecnológico de Ciudad Madero. Also, we acknowledge Laboratorio Nacional de Tecnologías de la Información (LaNTI) for the access to the cluster.

Conflicts of Interest

The authors declare no conflict of interest.

References

  1. Anfinsen, C.; Haber, E.; Sela, M.; White, F.H.J. The kinetics of formation of native ribonuclease during oxidation of the reduced polypeptide chain. Proc. Natl. Acad. Sci. USA 1961, 47, 1309. [Google Scholar] [CrossRef] [PubMed] [Green Version]
  2. Patel, L.N.; Zaro, J.L.; Shen, W.-C. Cell Penetrating Peptides: Intracellular Pathways and Pharmaceutical Perspectives. Pharm. Res. 2007, 24, 1977–1992. [Google Scholar] [CrossRef] [PubMed]
  3. Agyei, D.; Danquah, M.K. Industrial-scale manufacturing of pharmaceutical-grade bioactive peptides. Biotechnol. Adv. 2011, 29, 272–277. [Google Scholar] [CrossRef] [PubMed]
  4. Uhlig, T.; Kyprianou, T.; Martinelli, F.G.; Oppici, C.A.; Heiligers, D.; Hills, D.; Verhaert, P. The Emergence of Peptides in the Pharmaceutical Business: From Exploration to Exploitation. EuPA Open Proteom. 2014, 4, 58–69. [Google Scholar] [CrossRef] [Green Version]
  5. Vetter, I.; Davis, J.L.; Rash, L.D.; Anangi, R.; Mobli, M.; Alewood, P.F.; King, G.F. Venomics: A new paradigm for natural products-based drug discovery. Amino Acids. 2010, 40, 15–28. [Google Scholar] [CrossRef]
  6. Craik, D.J.; Fairlie, D.P.; Liras, S.; Price, D. The future of peptide-based drugs. Chem. Biol. Drug Des. 2013, 81, 136–147. [Google Scholar] [CrossRef]
  7. Fosgerau, K.; Hoffmann, T. Peptide Therapeutics: Current Status and Future Directions. Drug Discov. Today 2015, 20, 122–128. [Google Scholar] [CrossRef] [Green Version]
  8. Wang, D.; Geng, L.; Zhao, Y.J.; Yang, Y.; Huang, Y.; Zhang, Y.; Shen, H.B. Artificial intelligence-based multi-objective optimization protocol for protein structure refinement. Bioinformatics 2020, 36, 437–448. [Google Scholar] [CrossRef]
  9. Hiranuma, N.; Park, H.; Baek, M.; Anishchenko, I.; Dauparas, J.; Baker, D. Improved protein structure refinement guided by deep learning based accuracy estimation. Nat. Commun. 2021, 12, 1–11. [Google Scholar] [CrossRef]
  10. Senior, A.W.; Evans, R.; Jumper, J.; Kirkpatrick, J.; Sifre, L.; Green, T.; Qin, C.; Žídek, A.; Nelson, A.W.R.; Bridgland, A.; et al. Protein structure prediction using multiple deep neural networks in the 13th Critical Assessment of Protein Structure Prediction (CASP13). Proteins Struct. Funct. Bioinform. 2019, 87, 1141–1148. [Google Scholar] [CrossRef]
  11. De Oliveira, S.; Law, E.C.; Shi, J.; Deane, C.M. Sequential search leads to faster, more efficient fragment-based de novo protein structure prediction. Bioinformatics 2017, 34, 1132–1140. [Google Scholar] [CrossRef] [PubMed] [Green Version]
  12. Li, Z.; Scheraga, H.A. Monte Carlo-minimization Approach to the Multiple-minima Problem in Protein Folding. Proc. Natl. Acad. Sci. USA 1987, 84, 6611–6615. [Google Scholar] [CrossRef] [PubMed] [Green Version]
  13. Kirkpatrick, S.; Gelatt, C.D.; Vecchi, M.P. Optimization by simulated annealing. Science 1983, 220, 671–680. [Google Scholar] [CrossRef] [PubMed]
  14. Xu, D.; Zhang, Y. Toward optimal fragment generations for ab initio protein structure assembly. Proteins 2013, 81, 229–239. [Google Scholar] [CrossRef] [Green Version]
  15. Lamiable, A.; Thévenet, P.; Rey, J.; Vavrusa, M.; Derreumaux, P.; Tufféry, P. PEP-FOLD3: Faster de Novo Structure Prediction for Linear Peptides in Solution and in Complex. Nucleic Acids Res. 2016, 44, W449–W454. [Google Scholar] [CrossRef] [Green Version]
  16. Frausto, J.; Sánchez, J.P.; Sánchez, M.; García, E.L. Golden Ratio Simulated Annealing for Protein Folding Problem. Int. J. Comput. Methods 2015, 12, 1550037. [Google Scholar] [CrossRef]
  17. Frausto, J.; Sánchez, J.P.; Maldonado, F.; González, J.J. GRSA Enhanced for Protein Folding Problem in the Case of Peptides. Axioms 2019, 8, 136. [Google Scholar] [CrossRef] [Green Version]
  18. Sánchez-Hernández, J.P.; Frausto-Solís, J.; González-Barbosa, J.J.; Soto-Monterrubio, D.A.; Maldonado-Nava, F.G.; Castilla-Valdez, G. A Peptides Prediction Methodology for Tertiary Structure Based on Simulated Annealing. Math. Comput. Appl. 2021, 26, 39. [Google Scholar] [CrossRef]
  19. Zhang, Y.; Skolnick, J. Scoring function for automated assessment of protein structure template quality. Proteins 2004, 57, 702–710. [Google Scholar] [CrossRef]
  20. Zemla, A.; Venclovas, C.; Moult, J.; Fidelis, K. Processing and analysis of casp3 protein structure predictions. Proteins Struct. Funct. Genet. 1999, 3, 22–29. [Google Scholar] [CrossRef]
  21. Dill, K.A.; MacCallum, J.L. The Protein-Folding Problem, 50 Years On. Science 2012, 338, 1042–1046. [Google Scholar] [CrossRef] [PubMed] [Green Version]
  22. Dorn, M.; e Silva, M.B.; Buriol, L.S.; Lamb, L.C. Three-dimensional protein structure prediction: Methods and computational strategies. Comput. Biol. Chem. 2014, 53, 251–276. [Google Scholar] [CrossRef] [PubMed]
  23. Levinthal, C. Are there pathways for protein folding? J. De Chim. Phys. 1968, 65, 44–45. [Google Scholar] [CrossRef]
  24. Zheng, W.; Zhang, C.; Bell, E.W.; Zhang, Y. I-TASSER gateway: A protein structure and function prediction server powered by XSEDE. Future Gener. Comput. Syst. 2019, 99, 73–85. [Google Scholar] [CrossRef]
  25. Mulnaes, D.; Porta, N.; Clemens, R.; Apanasenko, I.; Reiners, J.; Gremer, L.; Gohlke, H. TopModel: Template-based protein structure prediction at low sequence identity using top-down consensus and deep neural networks. J. Chem. Theory Comput. 2020, 16, 1953–1967. [Google Scholar] [CrossRef]
  26. Simons, K.T.; Kooperberg, C.; Huang, E.; Baker, D. Assembly of protein tertiary structures from fragments with similar local sequences using simulated annealing and bayesian scoring functions. J. Mol. Biol. 1997, 268, 209–225. [Google Scholar] [CrossRef] [Green Version]
  27. Senior, A.W.; Evans, R.; Jumper, J.; Kirkpatrick, J.; Sifre, L.; Green, T.; Hassabis, D. Improved protein structure prediction using potentials from deep learning. Nature 2020, 577, 706–710. [Google Scholar] [CrossRef]
  28. Conway, P.; Tyka, M.D.; DiMaio, F.; Konerding, D.E.; Baker, D. Relaxation of backbone bond geometry improves protein energy landscape modeling. Protein Sci. 2014, 23, 47–55. [Google Scholar] [CrossRef]
  29. Mirdita, M.; Schütze, K.; Moriwaki, Y.; Heo, L.; Ovchinnikov, S.; Steinegger, M. ColabFold: Making protein folding accessible to all. Nat. Methods 2022, 19, 679–682. [Google Scholar] [CrossRef]
  30. Mirdita, M.; Steinegger, M.; Söding, J. MMseqs2 desktop and local web server app for fast, interactive sequence searches. Bioinformatics 2019, 35, 2856–2858. [Google Scholar] [CrossRef]
  31. Muhammad, K.; Ahmad, J.; Lv, Z.; Bellavista, P.; Yang, P.; Baik, S.W. Efficient Deep CNN-Based Fire Detection and Localization in Video Surveillance Applications. IEEE Trans. Sys. Man Cybernetics Sys. 2019, 49, 1419–1434. [Google Scholar] [CrossRef]
  32. Dyrmann, M.; Karstoft, H.; Midtiby, H.S. Plant species classification using deep convolutional neural network. Biosyst. Eng. 2016, 151, 72–80. [Google Scholar] [CrossRef]
  33. Frausto-Solís, J.; Hernández-González, L.J.; González-Barbosa, J.J.; Sánchez-Hernández, J.P.; Román-Rangel, E.F. Convolutional Neural Network–Component Transformation (CNN–CT) for Confirmed COVID-19 Cases. Math. Comput. Appl. 2021, 26, 29. [Google Scholar] [CrossRef]
  34. Goodfellow, I.; Bengio, Y.; Courville, A.; Bengio, Y. Deep Learning; MIT Press: Cambridge, MA, USA, 2016. [Google Scholar]
  35. Alzubaidi, L.; Zhang, J.; Humaidi, A.J.; Al-Dujaili, A.; Duan, Y.; Al-Shamma, O.; Farhan, L. Review of deep learning: Concepts, CNN architectures, challenges, applications, future directions. J. Big Data 2021, 8, 1–74. [Google Scholar] [CrossRef]
  36. Černý, V. Thermodynamical approach to the traveling salesman problem: An efficient simulation algorithm. J. Optim. Theory Appl. 1985, 45, 41–51. [Google Scholar] [CrossRef]
  37. Frausto, J.; Román, E.F.; Romero, D.; Soberon, X.; Liñán, E. Analytically Tuned Simulated Annealing Applied to the Protein Folding Problem. In Proceedings of the 7th International Conference on Computational Science, Beijing, China, 27–30 May 2007; pp. 370–377. [Google Scholar]
  38. Kufareva, I.; Abagyan, R. Methods of protein structure comparison. Methods Mol Biol. 2012, 857, 231–257. [Google Scholar] [CrossRef] [Green Version]
  39. De Oliveira, S.H.; Shi, J.; Deane, C.M. Building a better fragment library for de novo protein structure prediction. PLoS ONE 2015, 10, e0123998. [Google Scholar] [CrossRef] [Green Version]
  40. Bernstein, F.C.; Koetzle, T.F.; Williams, G.J.; Meyer Jr, E.E.; Brice, M.D.; Rodgers, J.R.; Kennard, O.; Shimanouchi, T.; Tasumi, M. The Protein Data Bank: A Computer-based Archival File For Macromolecular Structures. J. Mol. Biol. 1977, 112, 535. [Google Scholar] [CrossRef]
  41. Kingma, D.P.; Ba, J. Adam: A Method for Stochastic Optimization. In Proceedings of the 3rd International Conference on Learning Representations, ICLR, San Diego, CA, USA, 7–9 May 2015. [Google Scholar]
  42. Maupetit, J.; Derreumaux, P.; Tuffery, P. PEP-FOLD: An online resource for de novo peptide structure prediction. Nucleic Acids Res. 2009, 37, W498–W503. [Google Scholar] [CrossRef] [Green Version]
  43. Shen, Y.; Maupetit, J.; Derreumaux, P.; Tufféry, P. Improved PEP-FOLD approach for peptide and miniprotein structure pre-diction. J. Chem. Theory Comput. 2014, 10, 4745–4758. [Google Scholar] [CrossRef]
  44. Eisenmenger, F.; Hansmann, U.H.; Hayryan, S.; Hu, C.-K. [SMMP] A modern package for simulation of proteins. Comput. Phys. Commun. 2001, 138, 192–212. [Google Scholar] [CrossRef]
Figure 1. Example of GRSA2-FCNN method for peptide prediction.
Axioms 11 00729 g001
Figure 2. FCNN Architecture.
Axioms 11 00729 g002
Figure 3. Two examples (a,b) of the initial models with the fragments generated by FCNN.
Axioms 11 00729 g003
Figure 4. Three-dimensional models of peptides refined by GRSA2 (red) and the native structure (green). (ad) show the superposition of the native and prediction structure for the peptides 1pef, 1egs, 1gjf, and 1dep, respectively.
Axioms 11 00729 g004
Figure 5. The behavior of GRSA2-FCNN with the majority of secondary structures type in TM-score GDT-TS, and RMSD. (a) shows 60 results for instances classified as Alpha, Beta, and None evaluated by TM-score. (b) presents 60 results for instances classified in Alpha, Beta, and None evaluated by GDT-TS. (c) has 60 results for the instances classified as Alpha, Beta, and None evaluated by RMSD.
Axioms 11 00729 g005
Figure 6. Comparison of GRSA2-FCNN versus I-TASSER, AlphaFold2, PEP-FOLD3, and GRSA2-SSP (Up to 15 aa): (a,d,g) present the average of the five best predictions of TM-score; (b,e,h) show GDT-TS for each instance; and (c,f,i) show the RMSD.
Axioms 11 00729 g006
Figure 7. Comparison of GRSA2-FCNN versus I-TASSER, AlphaFold2, QUARK, PEP-FOLD3, and GRSA2-SSP (Instances of 16 to 30 aa). (a,d,g) show the average of the five best predictions of TM-score. (b,e,h) present GDT-TS for each instance, and (c,f,i) show the RMSD results.
Axioms 11 00729 g007
Figure 8. Comparison of GRSA2-FCNN versus I-TASSER, AlphaFold2, Rosetta, QUARK, PEP-FOLD3, TopModel, and GRSA2-SSP (from 31 to 40 aa). (a,d,g) show the average of the five best predictions of TM-score; (b,e,h) present their corresponding GDT-TS metric for each instance; (c,f,i) display the RMSD results.
Axioms 11 00729 g008
Figure 9. Comparison of GRSA2-FCNN versus I-TASSER, AlphaFold2, Rosetta, QUARK, PEP-FOLD3, TopModel, and GRSA2-SSP (over 40 aa). (a,d,g) show the average of the five best predictions of TM-score. (b,e,h) present the GDT-TS metric; and (c,f,i) show the RMSD results.
Axioms 11 00729 g009
Figure 10. Comparison by major secondary structure type of GRSA2-FCNN versus AlphaFold2, I-TASSER, PEP-FOLD3, and GRSA2-SSP with TM-score and GDT-TS. (a,d,g) show the set of type Alpha, Beta, and None evaluated with TM-score (average of the five best predictions for each peptide). (b,e,h) show GDT-TS for Alpha, Beta, and None. (c,f,i) present the RMSD results in Alpha, Beta, and None.
Axioms 11 00729 g010
Figure 11. Comparison by major secondary structure type of GRSA2-FCNN versus AlphaFold2, PEP-FOLD3, I-TASSER, GRSA2-SSP, QUARK, Rosetta, and TopModel; TM-score and GDT-TS were used in this comparison. (a,d,g) show the set of type Alpha, Beta, and None; they were evaluated with TM-score (average of the five best predictions for each peptide). (b,e,h) were made with GDT-TS for Alpha, Beta, and None; and (c,f,i) have the RMSD results for Alpha, Beta, and None.
Axioms 11 00729 g011
Figure 12. Secondary structure performance versus length of peptides, (a) Alpha structures, (b) Beta structures, and (c) None structures.
Axioms 11 00729 g012
Figure 13. Box plots for alpha and beta structures.
Axioms 11 00729 g013
Table 1. Peptides Dataset.
NPDB-CodeN° aaVar.Type SSExp NPDB-codeN° aaVar.Type SSExp
11egs949noneNMR311t0c31163noneNMR
21uao1047betaNMR322gdl31201alphaNMR
31l3q1262noneNMR332l0g32183alphaNMR
42evq1266betaNMR342bn633200alphaNMR
51le11269betaNMR352kya34210alphaNMR
61in31274alphaNMR361wr336197betaNMR
71eg41361noneX-ray371wr436206betaNMR
81rnu1381alphaX-ray381e0m37206betaNMR
91lcx1381noneNMR391yiu37212betaNMR
103bu31474noneX-ray401e0l37221betaNMR
111gjf1479alphaNMR411bhi38216noneNMR
121k431484betaNMR421jrj39208betaNMR
131a131485noneNMR431i6c39218alphaNMR
141dep1594alphaNMR441bwx39242alphaNMR
152bta15100noneNMR452ysh40213betaNMR
161nkf1686alphaNMR461wr741222betaNMR
171le31691betaNMR471k1v41279alphaNMR
181pgbF1693betaX-ray482hep42268alphaNMR
191niz1697betaNMR492dmv43229alphaNMR
201e0q17109betaNMR501res43268betaNMR
211wbr17120noneNMR512p8144295alphaNMR
221rpv17124alphaNMR521ed745247betaNMR
231b0318109betaNMR531f4i45276alphaNMR
241pef18124alphaX-ray542l4j46250betaNMR
251l2y20100alphaNMR551qhk47272alphaNMR
261du120134alphaNMR561dv047279alphaNMR
271pei22143alphaNMR571pgy47304noneNMR
281wz423123alphaNMR581e0g48294noneNMR
291yyb27160alphaNMR591ify49290noneNMR
301by027193alphaNMR601nd949303alphaNMR
Note: The rows of the table are sorted according to the number of aa. Var (variables) and Exp (Experimental Method).
Table 2. Ranking of algorithms by TM-score.
Group 1Group 2Group 3Group 4
1° GRAS2-FCNN1°GRAS2-FCNN1° AlphaFold21° AlphaFold2
2° AlphaFold22° I-TASSER2° TopModel2° I-TASSER
3° PEP-FOLD33° AlphaFold2 3° Rosetta3° Rosetta
4° I-TASSER4° QUARK4° I-TASSER 4° GRAS2-FCNN
5° GRSA2-SSP5° PEP-FOLD35° GRAS2-FCNN5° GRAS2-SSP
Publisher’s Note: MDPI stays neutral with regard to jurisdictional claims in published maps and institutional affiliations.

