Article

Identification of the Critical Factors for Global Supply Chain Management under the COVID-19 Outbreak via a Fusion Intelligent Decision Support System

1
Finance and Accounting Research Center, School of Accounting, Nanfang College, Guangzhou 510970, China
2
Department of Accounting, Chinese Culture University, Taipei 111, Taiwan
3
English Program of Global Business, Chinese Culture University, Taipei 111, Taiwan
4
Department of Financial Engineering and Actuarial Mathematics, Soochow University, Taipei 111, Taiwan
*
Author to whom correspondence should be addressed.
Axioms 2021, 10(2), 61; https://doi.org/10.3390/axioms10020061
Submission received: 8 March 2021 / Revised: 12 April 2021 / Accepted: 13 April 2021 / Published: 16 April 2021
(This article belongs to the Special Issue Intelligent and Fuzzy Systems)

Abstract

:
Under the ravages of COVID-19, global supply chains have encountered unprecedented disruptions. Past experiences cannot fully explain the situations nor provide any suitable responses to these fatal shocks on supply chain management (SCM), especially in todays’ highly intertwined/globalized business environment. This research thus revisits and rechecks the crucial components for global SCM during such special periods, and the basic essence of such management covers numerous perspectives that can be categorized into a multiple criteria decision making (MCDM) approach. To handle this complex issue appropriately, one can introduce a fusion intelligent system that involves data envelopment analysis (DEA), rough set theory (RST), and MCDM to understand the reality of the analyzed problem in a faster and better manner. Based on the empirical results, we rank the priorities in order as cash management and information (D), raw material supply (B), global management strategy (C), and productivity and logistics (A) for improvement in SCM. This finding is confirmed by companies now undergoing a downsizing strategy in order to survive in this harsh business environment.

1. Introduction

Over the last year, the unimaginable destructiveness of COVID-19 has had a devastating effect on global supply chains, which were woefully unprepared to face this huge challenge. In particular, known as the factory of the world, China has encountered a serious epidemic and has continued to shut down production activities, leading to the interruption of flow from raw materials to finished products all over the world. While nearly all countries are trying to suppress the spread of the virus and reduce potential losses, there is still an ongoing crisis, because supply and demand have drastically fallen down, resulting from mass production stoppages [1]. As such, the risk awareness of supply chain management (SCM) has been more heightened and valued, and deliberate considerations are being implemented [2].
Global SCM is one of the key components of sustainability development of enterprises in a competitive market [3]. A blueprint of SCM is important since enterprise operation performance involves a series of activities from manufacturing to sale of products [4,5]. To improve the sustainable benefits and competitiveness, entities must reduce obstacles from the external environment (e.g., SCM). According to the research by Dueby et al. [6], sustainable theory and SCM exhibit a close relationship. Mehdikhani and Valmohammadi [7] showed that an effective implementation of global SCM supports the development of economic and social performances [8]. Global SCM is considered as a long-term strategic weapon based on Valmohammadi [9], as it not only decreases business risk, but also leads to stable development of corporate operations [10]. As stakeholders’ value creation can be implemented for promoting responsible global SCM, organizations must satisfy the various needs of their stakeholders [11]. Responding to stakeholders’ demand for SCM is crucial for organizations, as corporate performance is closely associated with their suggestions and engagement [12,13].
After the global pandemic of COVID-19 was announced by the World Health Organization in early 2020, unintentional shortages of workforce/labor, resources, and facilities soon resulted in supply chain disruptions and had tremendous negative ramifications on both short- and long-term operational performances [3]. The global supply chain has risen dramatically over time as globalization has taken root, but the COVID-19 pandemic contributed to great concerns and reconsiderations regarding the supply chain issue of globalization [14]. Such a social atmosphere poses a new conundrum for corporate survival, as firms must navigate these unprecedented challenges and find alternatives for innovation [15]. From this recent epidemic, the world is moving towards a clearer view of the need for building a flexible supply chain model, because disruption is always inevitable [16,17,18,19].
Despite the main contribution of extant research on SCM, it is still worth revisiting this issue under the raging COVID-19 pandemic, given the worldwide economic context. However, to provide a proper analytical procedure for firms, we have to realize the dimensions and criteria and how their complex interactions exist within supply chains, so as to enhance a firm’s operation quality as well as prevent the occurrence of future supply chain failures. The motivation for this study is thus to explore more in-depth the critical dimensions and criteria in regards to global supply chain strategies by firms under a Coronavirus-driven recession and to premeditate the problems of dependence and feedback among multiple criteria/attributes [20,21,22]. As for the complex and influential relationship under the adoption of global SCM, we introduce herein a fusion decision architecture that consists of data envelopment analysis (DEA), rough set theory (RST) with fish swarm optimization (FSO), and decision-making trial and evaluation laboratory (DEMATEL).
DEA is a data-driven technique that has demonstrated its usefulness in handling complex decision-making tasks when multiple indicators are involved. It also can present a company’s strengths and weaknesses and provide a specific direction for users to make continuous improvement by yielding a performance rank. However, the performance rank derived from this technique requires a decision on which inputs and outputs to employ—that is, the rank is affected by the inclusion or exclusion of an input or an output [22,23]. The usual balance between parsimony and information overload is adopted when it comes to DEA application [24]. On one hand, we would like to have an intuitive decision framework that contains all relevant messages in the system under investigation, but we are worried about the potential exclusion of relevant messages. On the other hand, we do not want to take irrelevant messages into consideration so as to prevent the problem of over-fitting. Lu et al. [25] stated that the influence of a specific input or output on the outcome can be measured by estimating the rank without such a variable. By doing so, we are able to realize which variable contributes the most to the outcome.
For an unfamiliar domain, users tend to gather as much information as possible to depict the whole picture of the situation they are facing. However, too much information will confuse and mislead the users’ decision making. To combat this, one can consider data exploration that assists in understanding the investigated reality in an efficient and effective manner. Rough set theory (RST), one such data exploration technique, not only handles data full of uncertainties, vagueness, and impreciseness, but also reduces dimensionality with minimal information loss as well as speeds up the calculation process. RST has numerous merits in data exploration, but it still comes with some challenges, such as minimal reduct generation (that is, the best minimal subset).
Minimal reduct generation is a NP-hard task, and the calculation time of generating all the reducts is exponential [26,27]. Prior studies typically employed a hill-climbing algorithm to determine the minimal reduct for RST, but this algorithm cannot guarantee an optimal solution. To combat this, the fish swarm optimization (FSO) algorithm, one type of swarm intelligence (SI) algorithm, is inspired by the natural schooling behaviors of fish by employing a wide search domain and having strong ability to escape from local minimums. By joint utilization of DEA and RST with FSO, we can filter out redundant and irrelevant information (i.e., it can be viewed as a data pre-processer) in order to improve the decision quality and to facilitate the decision process of users. To gain much deeper insights and realize the complex structure of assessing criterion, the analyzed data (i.e., the best minimal subset) are then injected into DEMATEL to represent the mutual relationships among them and prioritize which one is the most essential part users need to target. By utilizing this fusion decision architecture, they can initiate some treatments/strategies to prevent the situation from getting worse and to provide appropriate reactions and improvement strategies to a highly fluctuating economic environment so as to reach the goal of sustainable development.
The current research aims to fill the following gaps in the literature. First, it contributes to existing global SCM during a time of the COVID-19 crisis by exploring the key influence factors of a firm. Second, we link DEA with RST-FSO for decision makers to deal with the best reduct determination task as well as to eliminate any computational burden. Third, we add to the stream of decision-making studies that concentrate on SCM. Compared to other studies (i.e., identification of key successful factors in information systems/ERP adoption), works on critical factor identification for global SCM are quite scarce. Fourth, the key factors are purified via DEA-RST, and the results are then fed into DEMATEL to depict the cause-and-effect relations among criteria and dimensions as well as realize their effect on the final decision. Finally, we adopt an interactive influential network relationship map (IINRM) derived from DEMATEL as a guideline to indicate which part of global SCM has to be corrected/improved first so as to reach the best solution under the global pandemic of COVID-19.
The remainder of the paper is organized as follows. Section 2 reviews the relevant literature on the evaluation of global SCM factors. Section 3 develops a fusion decision architecture that consists of DEA, RST, FSO, and DEMATEL for key factor selection. Section 4 conducts a questionnaire design and data collection and analyzes empirical results. Section 5 presents a discussion and implications. Finally, Section 6 draws conclusions and future research directions.

2. Global Supply Chain Management Sustainability Factors

Organizations need to regularly and quickly review and update their supply chain practices and build a functional global supply chain management framework in order to better predict and manage disruptions in response to abrupt environmental shocks. However, an integral part of corporate sustainable development is how to construct a robust global supply chain management framework to provide a mechanism for effectively and immediately identifying potential disruption risk. Following past literature, we look to pose practical requirements and suggestions for a comprehensive global supply chain management framework of the manufacturing industry under the outbreak of COVID-19. According to the global supply chain framework proposed by a Deloitte research survey [28] as well as relevant research on supply chain management and supply chain characteristics in Chinese manufacturing, this study divides global supply chain management factors into four dimensions as the evaluation framework: “Productivity and logistics”, “Raw material supply”, “Global management strategy”, and “Cash management and information”. We provide a brief introduction of the four proposed dimensions.

2.1. Productivity and Logistics

The United Nations Global Compact has issued a guide indicating that labor is one of the four key areas advancing the sustainability of global supply chains [29]. There is a need to maintain the normal availability of the workforce to support ongoing manufacturing operations even during overall economic downturns [30]. However, restrictions in a quarantine area under an epidemic mean that many facilities cannot ramp back up to normal operations, and labor planning should be initiated at any time in response to worker shortages when a factory is operating. Under an epidemic situation, factory closures can be mandated, and so a company should formulate a re-routing production plan for finding an alternative factory. Lim et al. [31] demonstrated that a multi-factory/multi-sourced system is preferable to a single chain, as it has a high value of flexibility given supply chain disruptions [32]. Alternative logistical solutions are often considered a key element of the global supply chain, especially in extraordinary times. Therefore, in some cases, companies need to ensure the capabilities of their logistics partners and find other channels when necessary, such as alternative logistics [33].

2.2. Raw Material Supply

Facts have proven in today’s severe domestic and foreign contexts that there is a need for closer upstream relationships. It is now essential to understand the competencies of the critical supplier (called key direct supplier or original supplier) to meet supply requirements and what position a firm is in under an allocation perspective for the case of raw material shortages [34]. In an uncontrolled environment, suppliers may fail to live up to promises to deliver at the right time to a plant, thus holding back production and consequently regular operations [35]. In addition, manufacturers are constricted under emergency situations and thus should introduce an alternative source for their sustainability in supply chain management [36]. Thomas and Mahanty [37] also suggested that emergency backup sources should be constructed and adopted fundamentally when the original supply is disrupted due to many causes. Deliveries can be expected to show widespread declines from the original supplier during an epidemic around the globe. Thus, creating better visibility on the inventory of raw materials can help predict potential supplier shortages and allow a firm to prepare accordingly [38,39].

2.3. Global Management Strategy

Companies must determine an optimum inventory buffer to maintain operations under supply disruptions, in order to decrease the risks of supply shortages and ensure customer service [40]. Dynamic inventory policies can effectively inflate inventory positions for manufacturing plants, leading to the optimization of global inventory management, and help respond to potential supplier and demand variability [41]. When a stock-out crisis occurs due to fluctuations in the inventory market, refining production schedules and dynamic demand substitutions will thus delineate new considerations for corporates [42]. An agile production schedule can allow a firm to properly position inventory control so as to adjust to changing demand in the upstream and downstream and make for more feasible decision-making [43]. Kalir and Grosbard [44] demonstrated that operating smoothly and reducing barriers involve leveraging the global layout of the supply chain to enable the issuance of insufficient and excess raw materials for manufacturing plants [45].

2.4. Cash Management and Information

Cash flow is a decisive component of the backing for flow of goods, and thus understanding the relationship between cash flow management and supply chain can help formulate appropriate operations and management decisions [46]. Companies should reduce the influence of cash flow risks under tight cash flow constraints, especially in such remarkable times as COVID-19, and keep a certain amount of cash in reserve at any time [47]. In order to respond to an increasingly fluctuating, complex, and uncertain global environment, enterprises must seek a suitable IT evaluation system for the production activities of their supply chain [48]. Villegas and Pedregal [49] also stated that an automatic evaluation technique has become an indispensable part of the whole supply chain and can demonstrate an early warning effect. In addition, by collecting valuable and complete information on upstream suppliers and downstream customers, manufacturing firms can build a stable supply chain in a turbulent, competitive economy [50]. Given asymmetric information, better management of market knowledge and information across countries should be incorporated into the whole supply chain, as argued by Cragg and McNamara [51].

2.5. Fusion Intelligent Model

The seminal work on enterprise risk management was done by Fitzpartrick [52] who implemented a univariate statistical model to form his final conclusion. After that, studies on risk management started to proliferate and enter an advanced structure; i.e., the multivariate model. However, the aforementioned structures belong to statistical-based models that have to obey strict statistical assumptions—that is, in practical applications, the requirement of the model adoption is very hard to satisfy. With the advance of information technology, artificial intelligence (AI) models without satisfying pre-determined assumptions were introduced. Odam and Sharda [53] introduced the neural network (NN) model to deal with the risk management task, and the model’s performance was better than that of statistical-based models. Hu et al. [54] and Liu et al. [55] applied rough set theory with advanced probability consideration to solve the decision-making task. Karagoz et al. [56] and Yi et al. [57] used support vector machine (SVM) to solve bankruptcy prediction problems. Gu et al. [58] and Feng et al. [59] employed a deep learning architecture to construct the forecasting mechanism, and the results stated that their model performs a satisfactory job. However, these models belong to a class of “single best” forecasting models, and none of them outperform all the other models under all assessing criteria. Inspired by a fusion mechanism, combining multiple dissimilar models’ outcomes and transforming them into a consensus conclusion turn out to be an efficient and effective way to improve the model’s forecasting quality. The basic idea of the fusion model is to complement the error made by a singular model. This idea is echoed by Huotari et al. [60] and Lin [61] who indicated that even a fraction of improvement in forecasting accuracy can translate into a tremendous amount of future profits. Thus, the present study is grounded on this concept to develop a fusion intelligent model for SCM to reach an unbiased and reliable judgment under the global pandemic of COVID-19.

3. Methodologies

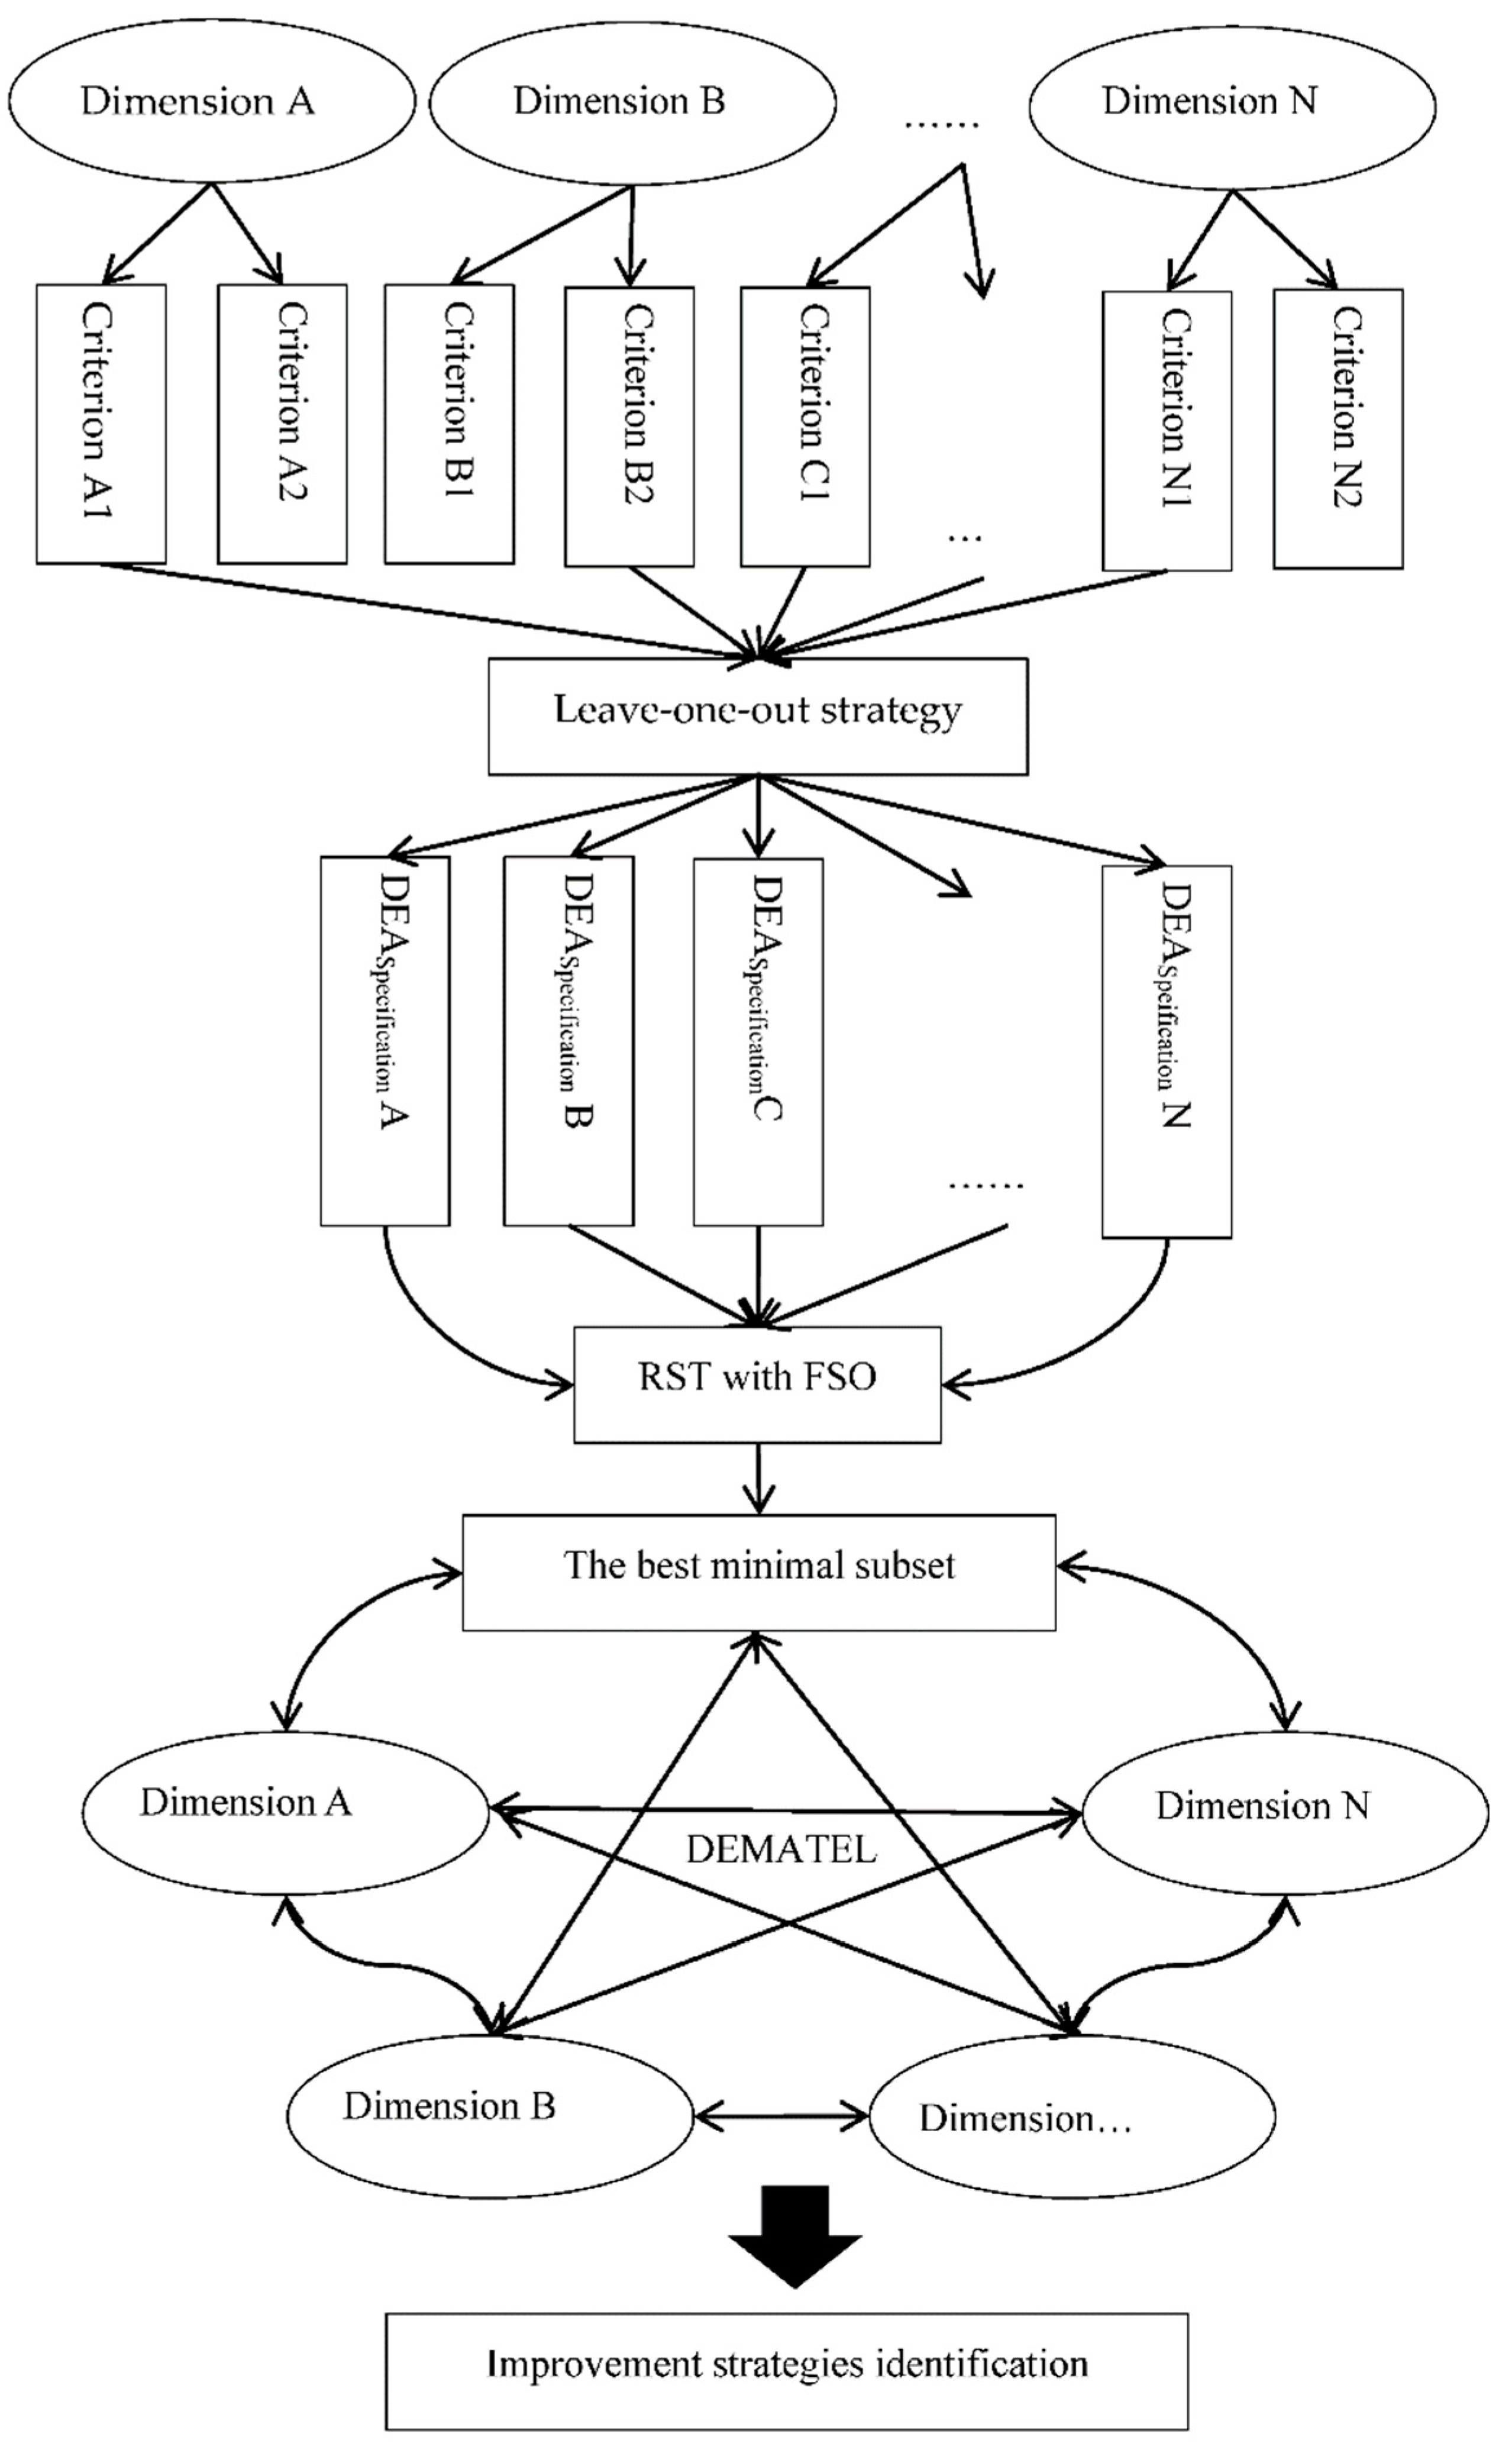
3.1. A Fusion Intelligent Decision Support System

Because a tremendous amount of production processes have been postponed and companies have shut down due to COVID-19, it is an urgent requirement to refine and rethink how to appropriately implement SCM and provide suitable directions for users to follow and to form a reliable judgment so as to survive in this extremely unordinary situation. The solution to this complicated problem undoubtedly involves numerous perspectives and belongs to a MCDM task. To capture the nature of SCM and understand the reliability of business operations, a fusion decision architecture (see Figure 1) that involves DEA, RST with FSO, and DEMATEL is considered.
For an unknown domain, users prefer to collect as much information as possible to understand the real situation of business operations. However, too much information will confuse and disturb the decision-making processes of users [62,63]. To overcome this task, feature selection, which aims at preserving the original meanings of a criterion after reduction, turns out to be an inevitable procedure [64]. DEA has demonstrated its usefulness in performance analysis without pre-determined assumptions and also has the ability to handle multiple inputs and outputs simultaneously. However, the problem of DEA is that the inputs and outputs have to be decided before the performance rank is generated. It is widely recognized that different inputs or outputs will lead to dissimilar outcomes. To combat this and look beyond any single DEA specification, one can use multiple DEA specifications that combine inputs and outputs in several dissimilar manners. For example, we collect 18 criteria in the beginning and then exclude one criterion each time so as to generate different DEA specification (i.e., a leave-one-out strategy). Finally, 18 different DEA specifications are generated. By extending a singular DEA specification to multiple DEA specifications, users can capture the multi-dimensional nature of performance analysis and present an overarching reflection of business operations.
Most of the collected information (i.e., 18 DEA specifications) derives from financial documents or questionnaires, which may be contaminated by some errors (i.e., different accounting principles, human judgement, and estimation bias). RST has the advantage of handling vague, uncertain, imprecise information and is used to cope with the aforementioned task and determine the most essential attribute subset. How to determine the minimal subset (i.e., the most essential attribute subset) for RST is a NP-hard task. With considerable searching ability, FSO performs a satisfactory job in the optimization task. By joint utilization of DEA and RST-FSO, we can filter out redundant information, eliminate the computational burden as well as increase the quality of decision making. In other words, this combined model (DEA + RST-FSO) can be taken as a data pre-processer which places an essential role in decision making field.
The analyzed attributes are then inserted into DEMATEL to address the relationships of dependence and feedback among criterion (i.e., the cause-and-effect relations) and to find out the most essential core factors [65]. By realizing the priority of assessing factors, users can allocate suitable resources to the right place, strengthen company’s risk absorbing ability as well as solidify the development of the capital market. Even a little improvement in decision quality can translate into considerable financial savings.

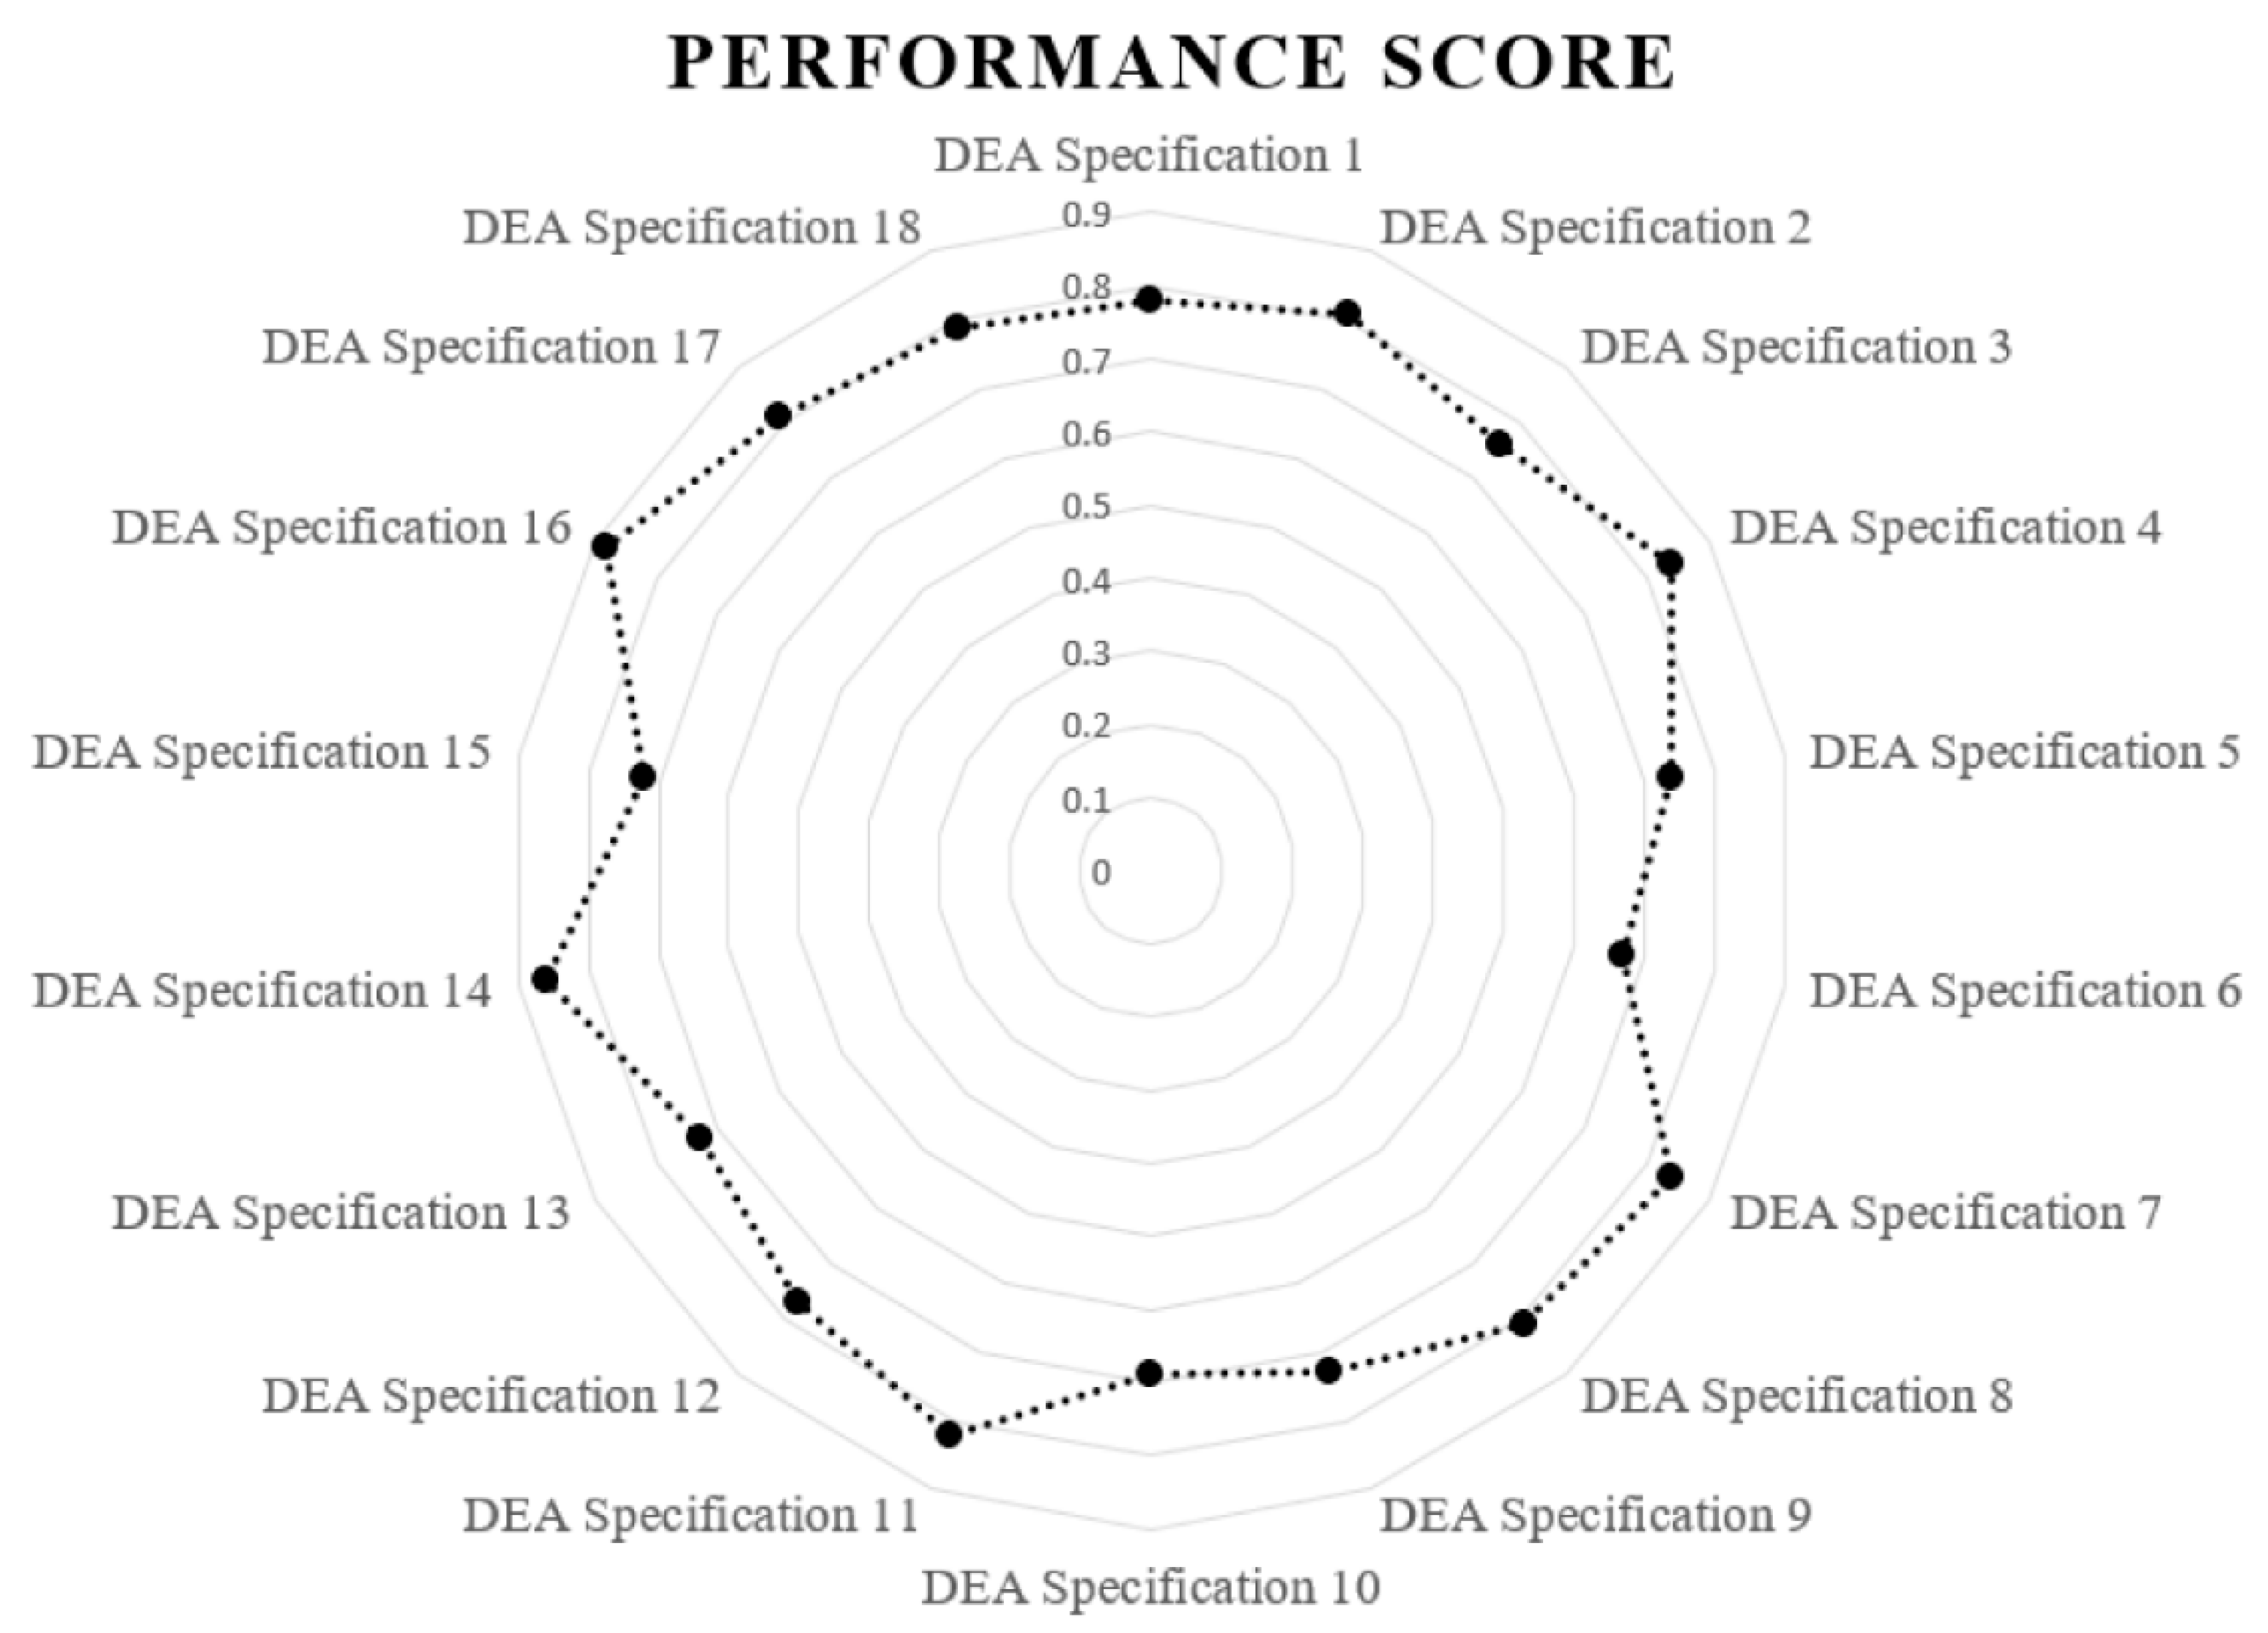
3.2. Data Envelopment Analysis (DEA)

DEA is a mathematical algorithm that can be used to cope with multiple inputs and outputs simultaneously without pre-determined production functions in order to assess the relative performance of decision-making units (DMUs). Each DMU’s relative performance is decided as the ratio of the weighted sum of outputs to the weighted sum of inputs. A performance score ranges from 0 (inefficiency) to 1 (efficiency). Assuming that each unit contains d input to generate e output, the basic mathematical formulation of DEA is represented in Equation (1).
M A X _ E F j = r = 1 e u r y r j i = 1 d v i x i j s . t . r = 1 e u r y r j i = 1 d v i x i j 1 , j = 1 , , n u r 0 , r = 1 , , e v i 0 , r = 1 , , d
here, y r j and x i j denote the r th input and output of the j th DMU, respectively; u r represents the weight given to output r , and v i expresses the weight given to input i . The aim of DEA is to identify the optimal input and output weights for each DMU separately so as to reach the goal of maximal efficiency. By performing this method, we can realize the relative performance of each DMU.

3.3. Rough Set Theory with Fish Swarm Optimization (RST-FSO)
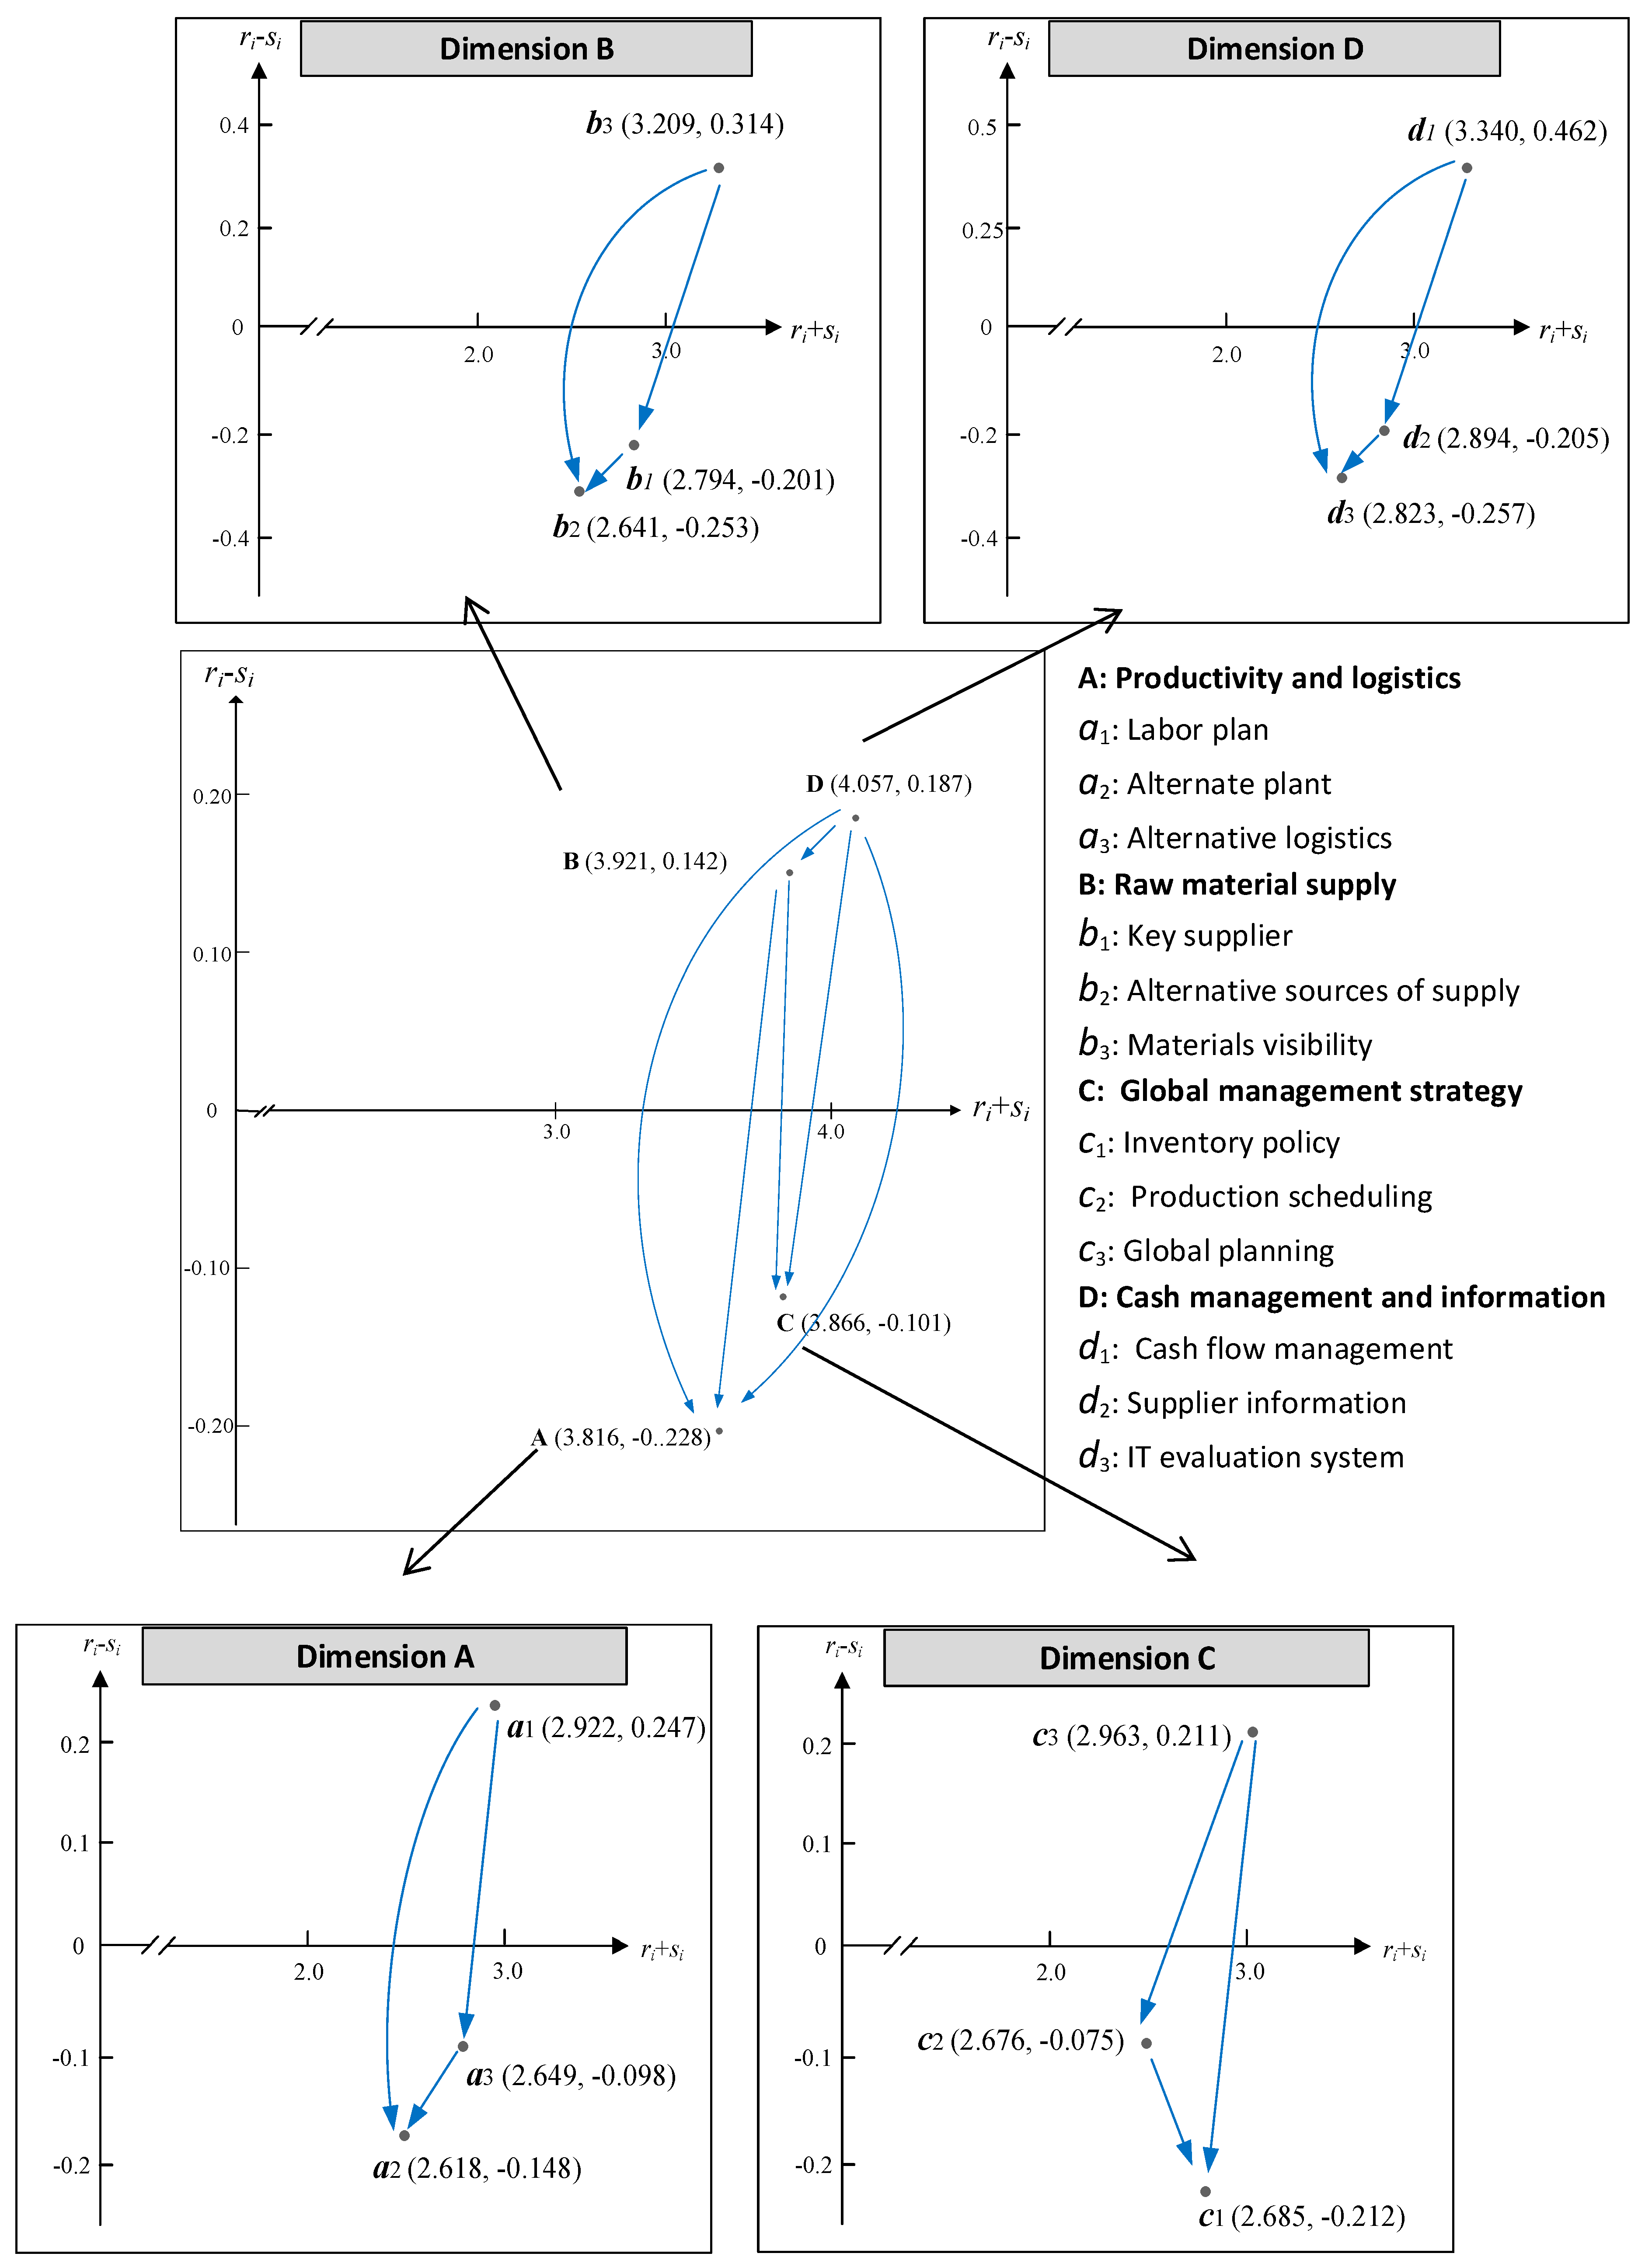
RST is a relatively new mathematical algorithm that requires no additional knowledge to handle data full of uncertainties, vagueness, and imprecisions and gains numerous advantages in real-life applications. A brief description of RST is presented as follows [66,67]. Assume I = ( G , B ) is an information system, where G denotes the universe, B expresses a non-empty finite set of attributes, and b B determines the function F b : G V b , where V b denotes the set of value b . If U B , then the associated equivalence relation can be expressed in Equation (2).
I N D ( U ) = { ( x , y ) G × G | b U , F b ( x ) = F b ( y ) }
We note that G / U indicates the partition G divided by I N D ( U ) . If ( x , y ) I N D ( U ) , then x and y cannot be separated by utilizing the attributes from U . Moreover, [ x ] U depicts the equivalence classes of the U -indiscernibility relation that is the key element of RST. Letting X G , the U -lower approximation and U -upper approximation can be represented in Equations (3) and (4).
U _ X = { x G | [ x ] U X }
U ¯ X = { x G | [ x ] U X ϕ }
Assume U , Q B is an equivalence relation over G , and then positive, negative, and boundary regions can be illustrated as follows:
P O S U ( Q ) = X G / Q U _ X
N E G U ( Q ) = G X G / Q U ¯ X
B N D U ( Q ) = X G / Q U ¯ X X G / Q U _ X
The main issue in data analysis is identifying the dependencies between attributes. For U , Q B , U depends entirely on Q , if and only if I N D ( U ) I N D ( Q ) . It means that the partition made by U performs better than the partition made by Q . Here, U k Q denotes that Q depends on U by the degree k   ( 0 k 1 ) , if:
k = α U ( Q ) = | P O S U ( Q ) | | G |
Any decision system contains two different attributes: condition attribute C and decision attribute D . The degree of dependency between condition and decision attributes can be represented as α C ( D ) , which indicates the quality of approximation of classification [67].
The fundamental concept of feature selection is to reduce dimensionality and preserve the original semantics of the data. A reduct is deemed as a reduced subset R of the original condition attribute C , and the mathematical formulation can be indicated in Equation (9).
α R ( D ) = α C ( D )
In RST, the minimal reduct ( R E D min R E D ) is identified when it reaches the minimal cardinality value.
R E D min = { R R E D | R R E D , | R | | R | }
The core represents the intersection of all reducts.
C O R E ( C ) = R E D
FSO is an emerging population-based optimization algorithm inspired by the natural feeding behaviors of fish. By updating their searching behavior, swarming behavior, and following behavior, we can calculate the value of the fitness function so as to determine the goodness of each feature subset.
F i t n e s s = ω α R ( D ) + ( 1 ω ) | C | | R | | R |
here, α R ( D ) denotes the classification quality, and | C | and | R | individually represent the number of all features and the number of reduced features.

3.4. DEMATEL Method

DEMATEL is utilized to analyze complex intertwined issues and has been widely accepted as one of the best tools for cause-and-effect among dimensions and criteria [68,69]. The procedures are demonstrated as follows [70,71].
Step 1: Calculation of initial average-relation matrix D. Each decision maker is invited to give an evaluation of any two components through a pairwise comparison and given an integer score within [0,4] (0 = no influence and 4 = strong influence) to develop a direct influence matrix. An initial average-relation matrix D can therefore be constructed from the opinions of 30 respondents as shown in Equation (13).
D = [ d 11 d 1 j d 1 n d i 1 d i j d i n d n 1 d n j d n n ]
here, dij is the average score of each criterion for each decision-maker.
Step 2: Computation of initial direct influence matrix M. The initial direct influence matrix X = [ x i j ] n × n of DEMATEL can be achieved through Equations (14) and (15), and the values of the diagonal matrix are zero (i.e., zero matrix, dii = 0).
M = τ × D ,
where
τ = min { 1 max 1 i n j = 1 n d i j , 1 max 1 j n i = 1 n d i j }
Step 3: Creation of direct/indirect relation matrix M. The total-influence relation matrix involves direct and indirect effects and is accomplished from the following expression:
T = M + M 2 + M 3 + + M l = M ( I M ) 1 ,   when   lim h M h = [ 0 ] n × n ,
where T = [ t i j ] n × n for i,j = 1,2,…,n, and I is an identity matrix.
Step 4: Delineation of IINRM cause-and-effect. Each row vector r and column vector s of matrix T can be denoted as follows:
r = ( r i ) n × 1 ( [ j = 1 n t i j ] n × 1 = ( r 1 , r i , r n ) )
s = ( s j ) n × 1   ( [ i = 1 n t i j ] 1 × n = ( s 1 , s j , s n ) )
The cause-and-effect diagram of the interactive influential network relationship among dimensions/criteria of systems can be visualized by mapping the values of ( r i + s i , r i s i ) , or called IINRM (interactive influential network relationship map). If ri is the sum of the ith row in matrix T, then ri indicates the summation of direct and indirect casual effects of component i on the other components. Similarly, if sj is the sum of the jth column in matrix T, then sj indicates the summation of direct and indirect casual effects of component j on the other components. Furthermore, ( r i + s i ) shows the measure of the central role that component “i” plays in the entire system, whereas ( r i s i ) indicates the degree of net effect that component “i” devotes to the whole system.

4. Empirical Results

This section describes the process of the questionnaire design and data collection and conducts the empirical analysis by performing a fusion decision architecture based on respondents’ opinions on the global supply chain layout under the COVID-19 pandemic.

4.1. Questionnaire Design and Data Collection

Based on the review of relevant literature and professional judgement of domain experts, we arrive at 18 criteria distributed into 4 dimensions (see Table 1). Satty [72] stated that each dimension consisting of too many criteria will impede users’ decision quality—that is, the finite criteria in each dimension will lead to a consistent outcome of pairwise comparison. To reach this goal, the original 18 criteria need to be narrowed down.
A pre-test questionnaire survey (i.e., containing 18 criteria distributed into 4 dimensions) was sent to 17 work-domain experts (1 CEO, 6 general managers, and 10 factory directors) from publicly listed companies and 3 academic researchers in supply chain management. Each respondent was invited to score the criteria of the pre-test questionnaire on a 0–10 scale for supply chain operations, which represents the importance from low to high. Because the experts have different working experience and knowledge, they must have different focuses on SCM—that is, not all experts focus on the same criterion and dimension. To prevent the problem of users’ bias/subjective, this study utilizes DEA (as a data-driven technique) to summarize all the information. Apart from prior studies that merely focused on a singular DEA specification, this study extends it to multiple DEA specifications (i.e., it takes all combinations into consideration) to gain much deeper insights. A leave-one-out combination strategy is considered.
Figure 2 shows the results. Because we have 18 criteria, we have 18 DEA specifications and each result deletes one criterion each time. For example, DEA specification 1 means the derived result excludes criterion 1. We can see that each scenario has a different outcome. This finding is echoed by Lu et al. [25] who stated that not all experts have the same focus of attention. To prevent the problem of over-fitting, RST is considered for picking up the most essential criteria so as to reach a robust outcome. Identifying the most essential criteria for RST is a classical optimization task. Prior studies implemented hill-climbing to solve it, but it cannot guarantee an optimal solution. To combat this, FSO, one type of SI algorithm with superior search ability, is conducted. However, RST is categorized as a supervised learning technique, and the decision attributes have to be decided beforehand.
In line with the work by Hu et al. [23], we apply the K-means algorithm to determine the decision attributes. The main purpose of K-means is to partition all observations into K clusters in which each observation belongs to the cluster with the nearest mean (that is, it minimizes the within-cluster sum of squared errors), serving as a prototype of the cluster. The essential topic is how to decide the appropriate number of clusters (i.e., K). Thus, a trial-and-error strategy is implemented. Here, K is set from 1 to 5, and the summation of preciseness and rule coverage (SPRC) is viewed as an assessment measure.
Table 2 lists the results. We can see that K set to 3 reaches the highest SPRC. Thus, the number of clusters of this study is set to 3. The selected criteria/features are shown in Table 3. Based on the criteria shown in Table 4, we can formulate the finalized questionnaire survey (that is, the aforementioned hybrid technique can be viewed as a data pre-processor to delete a criterion’s lack of information contained).
The finalized questionnaire survey was sent to 6 CEOs, 12 general managers, and 12 factory directors of publicly listed companies in first-tier cities of China. The respondents are familiar with supply chain operations and have at least 10 years’ work experience in a relevant workplace. The questionnaires were administered through video interviews of 60 to 90 min between March and May 2020. To determine the reliability of the sample collection, the consensus level is calculated and the consensus ratio is 99.31% (more than the 95% confidence level). Considering the responses of respondents, the assessment of the direct influence between any two criteria using pairwise comparison was generated using five-point rating scales of 0 (“absolutely no influence”) to 4 (“very high influence”). Finally, 30 valid questionnaires were imported into the DEMATEL model pictured herein to serve as a basis for empirical analysis.

4.2. Key Criteria Acquisition Using the DEMATEL Technique

The total influence relation matrix T is presented in Table 4, and expert consensus is measured (see notes) in this study. Following the DEMATEL technique, the ( r i + s i ) values and ( r i s i ) values are calculated as shown in Table 5. Out of the four dimensions and based on the values of calculations ( r i + s i ) , the priorities of the most important dimensions are D: Cash management and information (4.057); B: Raw material supply (3.921); C: Global management strategy (3.866); and A: Productivity and logistics (3.861) (D > B > C > A). The ( r i s i ) values for each component are calculated either to be a driver (positive value) or a receiver (negative value), indicating a determinant is confirmed to have influence on or is influenced by the other components, respectively. Of the four dimensions, dimension D (cash management and information) is the largest influential factor, which indicates that it has the greatest impact and its improvement will beget improvement in other dimensions. Cash management and information (D) ( r i s i = 0.187 ) and raw material supply (B) ( r i s i = 0.142 ) are positive, which means they exert a direct effect on other dimensions as drivers. On the other hand, the values of global management strategy (C) ( r i s i = 0.101 ) and productivity and logistics (A) ( r i s i = 0.228 ) are negative, which means these dimensions are influenced by other dimensions as receivers. Compared to the twelve criteria, criterion d1 (cash flow management) shows the largest value of ( r i s i ) at 0.462, which means that this criterion has the most significant impact on the other criteria. Criterion d3 (IT evaluation system) has the lowest score ( r i s i = 0.257 ), representing that this indicator is most easily influenced by other criteria.
According to Figure 3, IINRM is constructed by measuring the degree of interaction in the implementation of global supply chain management practices using the DEMATEL method. IINRM is plotted based on the data described in Table 4. There are four sub-systems: productivity and logistics (A), raw material supply (B), global management strategy (C), and cash management and information (D). The longitude axis ( r i + s i ) and the latitude axis ( r i s i ) indicate the degree of centrality among components and the degree of influential impact among determinants in the map, respectively. The arrow direction triggers a cause effect, whereby the indicator affects another indicator. For example, dimension D (cash management and information) affirms that it has an immediate influence on other dimensions, such as dimension B (raw material supply), and also has a central influence on dimension C (global management strategy) and dimension A (productivity and logistics). Consequently, IINRM provides a clearer landscape on the interdependence of various criteria in the global supply chain management practices under the COVID-19 outbreak.

5. Discussion and Implication

This study provides a practical framework of global supply chain management under the outbreak of COVID-19 for manufacturing companies based on a set of conflicting criteria using a fusion decision architecture. From the causal diagram (Figure 2), an aspiration level of China’s manufacturing sectors can be immediately and directly activated via the preferential use of the crucial parts of multiple considerations. Therefore, it can be clearly identified based on Figure 2 that the improvement priority runs as follows: cash management and information (D), raw material supply (B), global management strategy (C), and productivity and logistics (A). In other words, “cash management and information” is the first-driver determinant, and if a company favors it as the priority of improvement, then it will return a multiplication effect on global supply chain management under the COVID-19 pandemic. García-Alcaraz [73] suggested that the cash management and information of manufacturing sectors are critical components of supply chain management, assuring not only the risk assessment of financial leakage, but also self-sustainability. This finding can help current companies worldwide that are applying a downsizing strategy to survive in this harsh situation [74].
It is noteworthy when one confronts an abnormal event from a global catastrophe that opening a sustainable global supply chain model is not easy, because it greatly changes normal operating ecosystems. A series of large-scale events has the potential to create many unprecedented dilemmas like how to fight the crisis, and thus construction of an effective model seems indispensable. Criteria such as labor/workforce plan ( a 2 ), materials visibility ( b 1 ), global planning ( c 1 ), and cash flow management ( d 3 ) receive the same maximal network influence within each dimension. The decision-maker of a global supply chain management framework for manufacturing corporates should therefore improve these four components, because they are the main drivers on separate dimensions.
From the 12 selected components, “cash flow management” is the top driver criterion based on its interactive relationships among mutual influences, and it has the greatest score of ( r i s i ) , indicating a powerful tendency to affect others. The finding is not only echoed by current companies undergoing a downsizing strategy as their first order to survive this harsh business environment, but also yields a justifiable and consensus direction for users to coordinate the resources distributed to each criterion appropriately. Since firms operating under a supply chain with insufficient financial resources may not be able to maintain production optimization, cash constraints will impede their development and cause customer churn [75]. This phenomenon is also consistent with the recent closure of large-scale enterprises in China. Kulchania and Thomas [76] pointed out that the stable development of supply chain management is associated with precautionary cash holdings, which can help support the quality of customer relationships. In the current raging epidemic of COVID-19, proper supply chain management provides flexibility for production scheduling, but the complexity and criticality of fund flow are also highlighted due to the numbers of factories, equipment, and human resources [77].
Materials visibility across the entire supply chain can be the second driver criterion based on Table 5. This type of global visibility refers to upstream and downstream suppliers, distributors, logistics, customers, etc., which provide manufacturers with agility based on market changes [78]. Eckstein et al. [79] analyzed the importance of materials visibility at achieving a supply chain flexibility model. The increasing visibility not only helps minimize possible threats, but also avoids potential disruptions and facilitates a prompt response to these changes [80]. A global supply chain contingency plan can be implemented quickly and effectively at any time to improve safe capacity if materials visibility is enhanced. The higher demand visibility built by manufacturing companies and the ability at forging close relationships with customers and suppliers significantly influence their competitiveness. A resilience model design for a global supply chain management in the time of COVID-19 is thus compulsory for avoiding failures and decreasing losses.
According to the above empirical analysis, executives should focus on the capital-constrained scheduling problem or a certain level of cash retention to maintain a sustainable supply chain. This situation can even explain that in an atmosphere of global economic turmoil and severe recession, insufficient working capital will lead to the domino effect of supply chain vulnerability. In addition, to ensure that raw materials are not scarce in the production process, the business manager should always pay attention to the upstream raw material source and whether there is enough inventory to meet the production needs. The factory should make appropriate production configurations based on the downstream manufacturers’ dynamic production decisions. Compared to past experiences, companies should have a new thinking about SCM in the globalization of the COVID-19 pandemic, since the pandemic may continue for a period of time. This research can be used as a useful reference.

6. Conclusions and Future Directions

Even after COVID-19 is mitigated, the resulting global supply chain shocks will exert a long-term impact on the global economy. This is why it is important for executives to understand the global market status and provide countermeasures, such as what to do now and how to meet future challenges. There is thus an imperative demand to establish a global SCM framework during the COVID-19 outbreak in the China context. This research proposes a comprehensive and practical improvement strategy that can serve as a basis when manufacturing entities revise their global supply chain management architecture. A promising theoretical foundation with a practical verification model is developed herein for joint fusion using DEA, RST with FSO technique, and DEMATEL method, so as to address the complex interactions among factors and to delineate IINRM.
A combination of multiple DEA specifications and RST with FSO is an efficient algorithm for data exploration and knowledge discovery. It not only can deal with data uncertainty and vagueness, but also can prevent loss of information encountered by RST, assign users the best professional judgement, and help firms move towards an arena of real-world application. The selected important factors by DEA-RST-FSO are submitted to DEMATEL to construct IINRM, which can be utilized to forge an improvement direction for corporates’ specific global supply chain strategies. The ranking priority of improvement among dimensions is based on expert opinions by using the DEMATEL method and runs as follows: cash management and information, raw material supply, global management strategy, and productivity and logistics. The criterion of cash flow management is confirmed as having the maximum influence on the other criteria, meaning it should be the first improvement objective among criteria. Materials visibility is also a key influence factor for achieving a comprehensive SCM. Diversified financing channels will be a powerful guarantee for effective SCM of enterprises. An early warning system of global raw material could be the best guarantee for companies to promote safe capacity and continuous production. Empirical findings consequently not only provide a new direction for manufacturing sectors, but these observations can also help at raising problem-solving competencies and providing a useful operating model in turbulent economic times.
To expand the present direction analysis of this paper, some interesting views are worth further exploration in the future. The assessment framework adopted herein is based on the inherent characteristics of the global supply chain, and so one can aim to append some considerations of special circumstances, such as supplier quality [81,82], IT evaluation system [83,84] business counterparts’ culture and customs among countries [55,85,86]. Multiple comparisons among other data screening models [87,88] can be one way to capture how the model herein transcends other methods and also help assess the appropriateness of the global supply chain issue in such extraordinary times.

Author Contributions

Conceptualization, K.-H.H. and F.-H.C.; methodology, M.-F.H.; software, K.-H.H. and F.-H.C.; validation, K.-H.H. and F.-H.C.; formal analysis, K.-H.H. and F.-H.C.; investigation, K.-H.H. and F.-H.C.; resources, K.-H.H. and F.-H.C.; data curation, K.-H.H., S.Y., M.-C.H. and F.-H.C.; writing—original draft preparation, K.-H.H. and F.-H.C.; writing—review and editing, K.-H.H., S.Y., M.-C.H. and F.-H.C.; visualization, K.-H.H. and F.-H.C.; supervision, M.-F.H.; project administration, K.-H.H. and F.-H.C.; funding acquisition, K.-H.H., M.-F.H. and F.-H.C. All authors have read and agreed to the published version of the manuscript.

Funding

The authors would like to thank the Ministry of Science and Technology, Taiwan, R.O.C. for financially supporting this work under contract No. 108-2410-H-034-050-MY2, No. 108-2410-H-034-056-MY2, 13th five-year plan of philosophy and social sciences of Guangdong Province (GD18CLJ02), and Department of education of Guangdong Province, China (No. 2020WTSCX139).

Institutional Review Board Statement

Not applicable.

Informed Consent Statement

Not applicable.

Data Availability Statement

Data collected from interviewing and questionnaires collection.

Conflicts of Interest

We have no conflict of interest to declare in this article.

References

  1. Harbour, L. The Coronavirus Impact on The Global Automotive Supply Chains. Available online: https://www.forbes.com/sites/laurieharbour1/2020/03/13/the-coronavirus-impact-on-the-global-automotive-supply-chain/185153c8444e (accessed on 10 April 2020).
  2. Keogh, J.G. COVID-19. To Ensure the Supply of Food and Consumer Goods, We Must Change the Rules of the Game. Available online: www.foodincanada.com (accessed on 22 April 2020).
  3. Hong, J.; Zhang, Y.; Ding, M. Sustainable supply chain management practices, supply chain dynamic capabilities, and enterprise performance. J. Clean. Prod. 2018, 172, 3508–3519. [Google Scholar] [CrossRef]
  4. Kot, S.; Goldbach, I.R.; Ślusarczyk, B. Supply chain management in SMEs-Polish and Romanian approach. Econ. Soc. 2018, 11, 142. [Google Scholar] [CrossRef]
  5. Kot, S.; Haque, A.U.; Baloch, A. Supply chain management in SMEs: Global perspective. Monten. J. Econ. 2020, 16, 87–104. [Google Scholar] [CrossRef]
  6. Dubey, R.; Gunasekaran, A.; Papadopoulos, T.; Childe, S.J.; Shibin, K.T.; Samuel, S.F. Sustainable supply chain management: Framework and further research directions. J. Clean. Prod. 2017, 142, 1119–1130. [Google Scholar] [CrossRef] [Green Version]
  7. Mehdikhani, R.; Valmohammadi, C. Strategic collaboration and sustainable supply chain management. J. Enterp. Inf. Manag. 2018, 32, 778–806. [Google Scholar] [CrossRef]
  8. Mesjasz-Lech, A. The use of IT systems supporting the realization of business processes in enterprises and supply chains in Poland. Pol. J. Manag. Stud. 2014, 10, 94–103. [Google Scholar]
  9. Valmohammadi, C. Investigating supply chain management practices in Iranian manufacturing organizations. Oper. Supply Chain Manag. 2013, 6, 36–42. [Google Scholar] [CrossRef]
  10. Kasim, E.S.; Daud, D.; Said, J.; Md Zin, N.; Kusrini, E. Supply disruption risk mitigation: A case study of automotive company. Pol. J. Manag. Stud. 2020, 22, 247–262. [Google Scholar]
  11. Damert, M.; Koep, L.; Guenther, E.; Morris, J. Stakeholders and socially responsible supply chain management: The moderating role of internationalization. Sust. Account. Manag. Policy J. 2020. ahead-of-print. [Google Scholar] [CrossRef]
  12. Gualandris, J.; Klassen, R.D. Emerging Discourse Incubator: Delivering transformational change: Aligning supply chains and stakeholders in non-governmental organizations. J. Supply Chain Manag. 2018, 54, 34–48. [Google Scholar] [CrossRef]
  13. Gualandris, J.; Klassen, R.D.; Vachon, S.; Kalchschmidt, M. Sustainable evaluation and verification in supply chains: Aligning and leveraging accountability to stakeholders. J. Oper. Manag. 2015, 38, 1–13. [Google Scholar] [CrossRef] [Green Version]
  14. Speier, C.; Whipple, J.M.; Closs, D.J.; Voss, M.D. Global supply chain design considerations: Mitigating product safety and security risks. J. Oper. Manag. 2011, 29, 721–736. [Google Scholar] [CrossRef]
  15. Ivanov, D. Predicting the impact of epidemic outbreaks on the global supply chains: A simulation-based analysis on the example of Coronavirus (COVID-19/SARS-CoV-2) case. Transp. Res. Part E 2020, 136, 101922. [Google Scholar] [CrossRef]
  16. Ivanov, D.; Dolgui, A. Viability of intertwined supply networks: Extending the supply chain resilience angles towards survivability. A position paper motivated by COVID-19 outbreak. Int. J. Prod. Res. 2020, 58, 2904–2915. [Google Scholar] [CrossRef] [Green Version]
  17. Sheffi, Y.; Rice, J.B., Jr. A supply chain view of the resilient enterprise. MIT Sloan Manag. Rev. 2005, 47, 41–48. [Google Scholar]
  18. Hosseini, S.; Ivanov, D.; Dolgui, A. Review of quantitative methods for supply chain resilience analysis. Transp. Res. Part E 2019, 125, 285–307. [Google Scholar] [CrossRef]
  19. Lin, W.K.; Lin, S.J.; Yang, T.N. Integrated business prestige and artificial intelligence for corporate decision making in dynamic environments. Cyber Syst. 2007, 48, 303–324. [Google Scholar] [CrossRef]
  20. Lin, S.J.; Chang, T.M.; Hsu, M.F. An emerging online business decision making architecture in a dynamic economic environment. J. Intell. Fuzzy Syst. 2019, 37, 1893–1903. [Google Scholar] [CrossRef] [Green Version]
  21. Chen, F.H. Application of a hybrid dynamic MCDM to explore the key factors for the internal control of procurement circulation. Int. J. Prod. Res. 2015, 53, 2951–2969. [Google Scholar] [CrossRef]
  22. Hu, K.H.; Chen, F.H.; Tzeng, G.H. CPA firm’s cloud auditing provider for performance evaluation and improvement: An empirical case of China. Technol. Econ. Dev. Econ. 2018, 24, 2338–2373. [Google Scholar] [CrossRef] [Green Version]
  23. Hu, K.H.; Hsu, M.F.; Chen, F.H.; Liu, M.Z. Identifying the key factors of subsidiary supervision and management using an innovative hybrid architecture in a big data environment. Financ. Innov. 2021, 7, 10. [Google Scholar] [CrossRef]
  24. Hu, K.H.; Lin, S.J.; Hsu, M.F.; Chen, F.H. A dynamic network-based decision architecture for performance evaluation and improvement. J. Intell. Fuzzy Syst. 2020, 39, 4299–4311. [Google Scholar] [CrossRef]
  25. Lu, W.; Kweh, Q.L.; Wang, C. Integration and application of rough sets and data envelopment analysis for assessments of the investment trusts industry. Ann. Oper. Res. 2021, 296, 163–194. [Google Scholar] [CrossRef]
  26. Chang, T.M.; Hsu, M.F. Integration of incremental filter-wrapper selection strategy with artificial intelligence for enterprise risk management. Int. J. Mach. Learn. Cyber. 2018, 9, 477–489. [Google Scholar] [CrossRef]
  27. Hu, K.H.; Chen, F.H.; Hsu, M.F.; Tzeng, G.H. Identifying key factors for adopting artificial intelligence-enabled auditing techniques by joint utilization of fuzzy-rough set theory and MRDM technique. Technol. Econ. Dev. Econ. 2020, 27, 459–492. [Google Scholar] [CrossRef]
  28. Deloitte COVID-19: Managing Supply Chain Risk and Disruption. Available online: https://www2.deloitte.com/global/en/pages/risk/articles/covid-19-managing-supply-chain-risk-and-disruption.html (accessed on 25 April 2020).
  29. Hsu, C.C.; Tan, K.C.; Zailani, S.H.M. Strategic orientations, sustainable supply chain initiatives, and reverse logistics empirical evidence from an emerging market. Int. J. Oper. Prod. Manag. 2016, 36, 86–110. [Google Scholar] [CrossRef]
  30. Mönch, L.; Uzsoy, R.; Fowler, J.W. A survey of semiconductor supply chain models part I: Semiconductor supply chains, strategic network design, and supply chain simulation. Int. J. Prod. Res. 2018, 56, 4524–4545. [Google Scholar] [CrossRef]
  31. Lim, M.; Bassamboo, A.; Chopra, S.; Daskin, M.S. Flexibility and Fragility: Supply Chain Network Design with Disruption Risks; Northwestern University: Evanston, IL, USA, 2011. [Google Scholar]
  32. Karimi, B.; Niknamfar, A.H.; Hassan Gavyar, B.; Barzegar, M.; Mohtashami, A. Multi-objective multi-facility green manufacturing closed-loop supply chain under uncertain environment. Assem. Autom. 2019, 39, 58–76. [Google Scholar] [CrossRef]
  33. Trappey, C.V.; Trappey, A.J.C.; Lin, G.Y.P.; Liu, C.S. Business and logistics hub integration to facilitate global supply chain linkage. Proc. Mech. Eng. Part B J. Eng. Manuf. 2007, 221, 1221–1233. [Google Scholar] [CrossRef]
  34. Uluskan, M.; Godfrey, A.B. Business environment-supply chain framework and benchmarking supply chain structures Haiti versus China. Benchmark. Int. J. 2018, 25, 3021–3044. [Google Scholar] [CrossRef]
  35. Adewole, A. Developing a strategic framework for efficient and effective optimisation of information in the supply chains of the UK clothing manufacture industry. Supply Chain Manag. 2005, 10, 357–366. [Google Scholar] [CrossRef]
  36. Luomaranta, T.; Martinsuo, M. Supply chain innovations for additive manufacturing. Int. J. Phys. Distrib. Logist. Manag. 2020, 50, 54–79. [Google Scholar] [CrossRef]
  37. Thomas, V.H.; Mahanty, B. Assessment of emergency sourcing strategy of a supply chain through dynamic simulation approach. J. Ind. Prod. Eng. 2020, 37, 56–69. [Google Scholar] [CrossRef]
  38. Aryal, A.; Liao, Y.; Nattuthurai, P.; Li, B. The emerging big data analytics and IoT in supply chain management: A systematic review. Supply Chain Manag. 2018, 25, 141–156. [Google Scholar] [CrossRef]
  39. Bag, S.; Gupta, C.; Foropon, C. Examining the role of dynamic remanufacturing capability on supply chain resilience in circular economy. Manag. Decis. 2019, 57, 863–885. [Google Scholar] [CrossRef]
  40. Huo, B.; Han, Z.; Chen, H.; Zhao, X. The effect of high-involvement human resource management practices on supply chain integration. Int. J. Phys. Distrib. Logist. Manag. 2015, 45, 716–746. [Google Scholar] [CrossRef]
  41. Alimardani, M.; Rafiei, H.; Rabbani, M. A novel approach toward coordinated inventory management of an agile multi-echelon multiproduct supply chain. Cogent Eng. 2015, 3, 1–26. [Google Scholar]
  42. Kobayashi, M.; Tomino, T.; Shintaku, J.; Park, Y.W. Demand fluctuation and supply chain integration: Case studies of Japanese firms. Persp. Glob. Dev. Technol. 2017, 16, 564–586. [Google Scholar] [CrossRef] [Green Version]
  43. Madhani, P.M. Supply chain strategy selection: A multi-criteria decision-making approach. IUP J. Supply Chain Manag. 2017, 14, 38–56. [Google Scholar]
  44. Kalir, A.A.; Grosbard, D.I. Global optimization of a semiconductor IC supply chain network. J. Serv. Sci. Manag. 2017, 10, 338–352. [Google Scholar] [CrossRef] [Green Version]
  45. Bay, B.K.; Tang, N.H.K.; Bennett, D. An empirical study of the imperatives for a supply chain implementation project in Seagate Technology International. Supply Chain Manag. 2004, 9, 331–340. [Google Scholar]
  46. Tsai, C.Y. On delineating supply chain cash flow under collection risk. Int. J. Prod. Econ. 2011, 129, 186–194. [Google Scholar] [CrossRef]
  47. Zhao, F.; Dash Wu, D.; Liang, L.; Dolgui, A. Cash flow risk in dual-channel supply chain. Int. J. Prod. Res. 2015, 53, 3678–3691. [Google Scholar] [CrossRef]
  48. Hmida, F.B.; Séguy, A.; Dupas, R. Multiagent simulation and evaluation of supply chain control architectures. IFAC Proc. 2012, 45, 781–786. [Google Scholar] [CrossRef]
  49. Villegas, M.A.; Pedregal, D.J. Automatic selection of unobserved components models for supply chain forecasting. Int. J. Forecast 2019, 35, 157–169. [Google Scholar] [CrossRef] [Green Version]
  50. Mani, V.; Gunasekaran, A.; Delgado, C. Supply chain social sustainability: Standard adoption practices in Portuguese manufacturing firms. Int. J. Prod. Econ. 2018, 198, 149–164. [Google Scholar] [CrossRef]
  51. Cragg, T.; McNamara, T. An ICT-based framework to improve global supply chain integration for final assembly SMES. J. Enterp. Inf. Manag. 2018, 31, 634–657. [Google Scholar] [CrossRef]
  52. Fitzpartrick, P.J. A comparison of ratios of successful industrial enterprises with those of failed companies. J. Account Res. 1932, 10, 598–605. [Google Scholar]
  53. Odom, M.; Sharda, R. A neural networks model for bankruptcy prediction. In Proceedings of the 1990 IJCNN International Joint Conference Neural Networks, San Diego, CA, USA, 17–21 June 1990; pp. 163–168. [Google Scholar]
  54. Hu, X.; Sun, B.; Chen, X. Double quantitative fuzzy rough set-based improved AHP method and application to supplier selection decision making. Int. J. Mach. Learn. Cyber. 2020, 11, 153–167. [Google Scholar] [CrossRef]
  55. Liu, D.; Yang, X.; Li, T. Three-way decisions: Beyond rough sets and granular computing. Int. J. Mach. Learn. Cyber. 2020, 11, 989–1002. [Google Scholar] [CrossRef]
  56. Karagoz, G.N.; Yazici, A.; Dokeroglu, T.; Cosar, A. A new framework of multi-objective evolutionary algorithms for feature selection and multi-label classification of video data. Int. J. Mach. Learn. Cyber. 2021, 12, 53–71. [Google Scholar] [CrossRef]
  57. Yi, Y.; Shi, Y.; Wang, W.; Lei, G.; Dai, J.; Zheng, H. Combining boundary detector and SND-SVM for fast learning. Int. J. Mach. Learn. Cyber. 2021, 12, 689–698. [Google Scholar] [CrossRef]
  58. Gu, X.; Chung, F.; Wang, S. Extreme vector machine for fast training on large data. Int. J. Mach. Learn. Cyber. 2020, 11, 33–53. [Google Scholar] [CrossRef]
  59. Feng, S.; Song, K.; Wang, D.; Gao, W.; Zhang, Y. InterSentiment: Combining deep neural models on interaction and sentiment for review rating prediction. Int. J. Mach. Learn. Cyber. 2021, 12, 477–488. [Google Scholar] [CrossRef]
  60. Huotari, T.; Savolainen, J.; Collan, M. Deep reinforcement learning agent for S&P 500 stock selection. Axioms 2020, 9, 130. [Google Scholar]
  61. Lin, S.J. Integrated artificial intelligence and visualization technique for enhanced management decision in today’s turbulent business environments. Cybern. Syst. 2021, 52, 274–292. [Google Scholar] [CrossRef]
  62. Romanov, A.; Voronina, V.; Guskov, G.; Moshkina, I.; Yarushkina, N. Discrete and fuzzy models of time series in the tasks of forecasting and diagnostics. Axioms 2020, 9, 49. [Google Scholar] [CrossRef]
  63. Zhao, J.; Du, W.-S. New generalized Ekeland’s variational principle, critical point theorems and common fuzzy fixed point theorems induced by Lin-Du’s abstract maximal element principle. Axioms 2021, 10, 11. [Google Scholar] [CrossRef]
  64. Muhiuddin, G.; Al-Kadi, D.; Balamurugan, M. Anti-intuitionistic fuzzy soft a-ideals applied to BCI-algebras. Axioms 2020, 9, 79. [Google Scholar] [CrossRef]
  65. Pramanik, S.; Dey, P.P.; Smarandache, F.; Ye, J. Cross entropy measures of bipolar and interval bipolar neutrosophic sets and their application for multi-attribute decision-making. Axioms 2018, 7, 21. [Google Scholar] [CrossRef] [Green Version]
  66. Ma, X.A. Fuzzy entropies for class-specific and classification-based attribute reducts in three-way probabilistic rough set models. Int. J. Mach. Learn. Cyber. 2021, 12, 433–457. [Google Scholar] [CrossRef]
  67. Pal, P.; Tiwari, S.P.; Singh, S. L-fuzzy rough automaton: A mathematical model for natural languages. Int. J. Mach. Learn. Cyber. 2021. [Google Scholar] [CrossRef]
  68. Chen, C.Y.; Tzeng, G.H.; Huang, J.J. Generalized DEMATEL technique with centrality measurements. Technol. Econ. Dev. Econ. 2018, 24, 600–614. [Google Scholar] [CrossRef]
  69. Chen, F.H.; Tzeng, G.H.; Chang, C.C. Evaluating the enhancement of corporate social responsibility websites quality based on a new hybrid MADM model. Int. J. Inf. Technol. Decis. Mak. 2015, 14, 697–724. [Google Scholar] [CrossRef]
  70. Bakir, S.; Khan, S.; Ahsan, K.; Rahman, S. Exploring the critical determinants of environmentally oriented public procurement using the DEMATEL method. J. Environ. Manag. 2018, 225, 325–335. [Google Scholar] [CrossRef] [PubMed]
  71. Gardas, B.B.; Raut, R.D.; Narkhede, B. Evaluating critical causal factors for post-harvest losses (PHL) in the fruit and vegetables supply chain in India using the DEMATEL approach. J. Clean. Prod. 2018, 199, 47–61. [Google Scholar] [CrossRef]
  72. Saaty, T.L. Decision Making with Dependence and Feedback: The Analytic Network Process; RWS Publications: Pittsburgh, PA, USA, 1996. [Google Scholar]
  73. García-Alcaraz, J.L.; Sánchez-Ramírez, C.; Avelar-Sosa, L.; Alor-Hernández, G. Techniques, Tools and Methodologies Applied to Global Supply Chain Ecosystems; Springer: Cham, Switzerland, 2020. [Google Scholar] [CrossRef]
  74. Hu, K.H.; Wei, J.; Tzeng, G.H. Risk factor assessment improvement for China’s cloud computing auditing using a new hybrid MADM model. Int. J. Inform. Tech. Decis. Mak. 2017, 16, 737–777. [Google Scholar] [CrossRef]
  75. Raghavan, N.R.S.; Mishra, V.K. Short-term financing in a cash-constrained supply chain. Int. J. Prod. Econ. 2011, 134, 407–412. [Google Scholar] [CrossRef]
  76. Kulchania, M.; Thomas, S. Cash reserves as a hedge against supply-chain risk. J. Financ. Quant. Anal. 2017, 52, 1951–1988. [Google Scholar] [CrossRef]
  77. Bertel, S.; Fenies, P.; Roux, O. Optimal cash flow and operational planning in a company supply chain. Int. J. Comput. Integr. Manuf. 2008, 21, 440–454. [Google Scholar] [CrossRef]
  78. Kazi, Y.; Mitra, S.R. Supply chain collaboration—Next steps and beyond. J. Supply Chain Manag. Syst. 2017, 6, 1–16. [Google Scholar]
  79. Eckstein, D.; Goellner, M.; Blome, C.; Henke, M. The performance impact of supply chain agility and supply chain adaptability: The moderating effect of product complexity. Int. J. Prod. Res. 2015, 53, 3028–3046. [Google Scholar] [CrossRef]
  80. Tukamuhabwa, B.R.; Stevenson, M.; Busby, J.; Zorzini, M. Supply chain resilience: Definition, review and theoretical foundations for further study. Int. J. Prod. Res. 2015, 53, 5592–5623. [Google Scholar] [CrossRef]
  81. Chau, K.Y.; Tang, Y.M.; Liu, X.; Ip, Y.K.; Tao, Y. Investigation of critical success factors for improving supply chain quality management in manufacturing. Enterp. Inf. Syst. 2021, 1, 1–20. [Google Scholar] [CrossRef]
  82. Chen, H.; Daugherty, P.J.; Landry, T.D. Supply chain process integration: A theoretical framework. J. Bus. Logist. 2009, 30, 27–46. [Google Scholar] [CrossRef]
  83. Xu, L.D. Information architecture for supply chain quality management. Int. J. Prod. Res. 2011, 49, 183–198. [Google Scholar] [CrossRef]
  84. Enagi, M.A.; Van Belle, J.P. Information searching and satisficing process for IT decision making process of SMEs. Afr. J. Inf. Syst. 2019, 11, 99–116. [Google Scholar]
  85. Vargas, M.A.; Comuzzi, M. A multi-dimensional model of enterprise resource planning critical success factors. Enterp. Inf. Syst. 2020, 14, 38–57. [Google Scholar] [CrossRef]
  86. Raut, R.D.; Narkhede, B.; Gardas, B.B. To Identify the critical success factors of sustainable supply chain management practices in the context of oil and gas industries: ISM approach. Renew. Sust. Energ. Rev. 2017, 68, 33–47. [Google Scholar] [CrossRef]
  87. Zhong, S.-h.; Huang, X.; Xiao, Z. Fine-art painting classification via two-channel dual path networks. Int. J. Mach. Learn. Cyber. 2020, 11, 137–152. [Google Scholar] [CrossRef]
  88. Martínez Torres, J.; Iglesias Comesaña, C.; García-Nieto, P.J. Review: Machine learning techniques applied to cybersecurity. Int. J. Mach. Learn. Cyber. 2019, 10, 2823–2836. [Google Scholar] [CrossRef]
Figure 1. The framework of a fusion decision support system.
Axioms 10 00061 g001
Figure 2. The outcomes derived from different DEA specifications.
Axioms 10 00061 g002
Figure 3. The IINRM of influence relationships based on DEMATEL within global supply chain management.
Axioms 10 00061 g003
Table 1. Criteria of global supply chain management for the pre-test questionnaire.
DimensionsCriteria
Productivity and logisticsA1: Labor/workforce plan
A2: Alternate plant
A3: Alternative workforce
A4: Alternative logistics
Raw material supplyB1: Key supplier
B2: Second supplier
B3: Alternative sources of supply
B4: Materials visibility
B5: Relationship with suppliers
Global management strategyC1: Inventory policy
C2: Production scheduling
C3: Global planning
C4: Local and national policies
Cash management and informationD1: Cash flow management
D2: Supplier information
D3: Home country regulation of cooperative manufacturers
D4: IT evaluation system
D5: Information of competitors
Table 2. The results of RST-FSO.
Status Selected CriteriaForecasting PrecisenessRule CoverageSPRC
K = 2a1, a2, a3, a4, b1, b2, b3, b5, c1, c3, d3, d50.870.861.73
K = 3a1, a2 a3, b1, b2, b3, c1, c2, c3, d1, d2, d30.880.891.77
K = 4a1, a3, a4, b2, b4, c3, c4, d1, d40.820.851.67
K = 5a1, a2, a4, b1, b3, c1, c2, d1, d3, d50.810.841.65
K = 6a2 a3, b1, b4, b5, c3, c4, d2, d4, d50.780.861.64
K = 7a1, a2, b2, b4, c1, c2, c4, d1, d3, d50.750.841.59
K = 8a1, a2 a4, b2, b3, c1, c3, c4, d2, d40.710.821.53
K = 9a1, a3, b1, b4, b5, c2, d1, d3, d50.680.811.49
K = 10a2 a3, b1, b3, b5, c2, c3, c4, d2, d4, d50.660.791.45
SPRC: The summation of preciseness and rule coverage (SPRC).
Table 3. Global supply chain management factor assessment architecture.
Dimensions/CriteriaDefinitionsSources
Productivity and logistics (A)
Labor/workforce plan ( a 1 )Labor demand to maintain production.Hsu et al. [29]; Mönch et al. [30]
Alternate plant ( a 2 )Preparation for alternative factories when the legacy factory cannot engage in production. Lim et al. [31]; Karimi et al. [32]
Alternative logistics ( a 3 )Alternative transportation projects from interruption of the original logistics system. Trappey et al. [33]
Raw material supply (B)
Key supplier ( b 1 )Main suppliers of raw materials.Uluskan and Godfrey [34]
Alternative sources of supply ( b 2 )Alternative sources of supply for other available raw materials.Luomaranta and Martinsuo [36]; Thomas and Mahanty [37]
Materials visibility ( b 3 )Ability to fully and effectively grasp the status of raw materials engaged in production. Aryal et al. [38]; Bag et al. [39]
Global management strategy (C)
Inventory policy ( c 1 )Flexible dynamic inventory strategy. Alimardani et al. [41]; Huo et al. [40]
Production scheduling ( c 2 )Agile production scheduling strategy.Kobayashi et al. [42]; Madhani [43]
Global planning ( c 3 )Multi-channel global production planning.Bay et al. [45]; Kalir and Grosbard [44]
Cash management and information (D)
Cash flow management ( d 1 )Maintain a certain cash flow at any time. Tsai [46]; Zhao et al. [47]
Supplier information ( d 2 )Fully grasp the information of upstream and downstream suppliers. Cragg and McNamara [51];
IT evaluation system ( d 3 )IT system to evaluate supply chain production activities.Hmida et al. [48]; Villegas and Pedregal [49]
Table 4. Total (direct and indirect) influence relation matrix.
Criterion a 1 a 2 a 3 b 1 b 2 b 3 c 1 c 2 c 3 d 1 d 2 d 3
a 1 0.4720.5590.5540.5460.5260.4890.5720.5540.5140.5080.5380.540
a 2 0.4240.3720.4380.4250.4090.3640.4220.4170.3940.3960.4200.421
a 3 0.4420.4520.3810.4320.4130.3780.4460.4320.4190.4050.4320.439
b 1 0.4810.4920.4880.4040.4640.4290.4910.4630.4400.4390.4730.460
b 2 0.4520.4630.4560.4400.3640.3900.4620.4400.4210.4150.4370.435
b 3 0.6570.6690.6690.6530.6190.4890.6770.6590.6110.6040.6440.633
c 1 0.4500.4620.4530.4370.4230.3790.3920.4320.4230.4200.4370.438
c 2 0.4580.4610.4590.4400.4280.4000.4760.3870.4370.4340.4540.449
c 3 0.5600.5890.5680.5710.5340.4960.5800.5570.4500.5230.5490.546
d 1 0.6940.7120.7090.6940.6650.6150.7250.6840.6450.5500.6770.674
d 2 0.4940.5050.5030.4800.4700.4370.5120.4910.4570.4530.4130.478
d 3 0.4640.4720.4680.4540.4360.4080.4820.4620.4340.4360.4590.388
Average gap (%) = 1 n × ( n 1 ) i = 1 n j = 1 n ( | b ¯ i j 30 b ¯ i j 29 | / b ¯ i j 30 ) × 100 % = 0.25 % < 1 % . The result indicates that the domain expert achieved consensus on 99.75%, where b ¯ i j 30 and b ¯ i j 29 denote the average scores from the respondents for 30 and 29, correspondingly; n represents the number of selected criteria; n = 12; and n × n matrix.
Table 5. Causal effect ( r i s i ) and strength of influences ( r i + s i ) for the factors.
Dimensions/CriteriaRow Sum ( r i ) Column Sum ( s i ) r i + s i r i s i
Productivity and logistics (A)1.8162.0453.861−0.228
Labor/workforce plan ( a 1 )1.5841.3382.9220.247
Alternate plant ( a 2 )1.2351.3832.618−0.148
Alternative logistics ( a 3 )1.2751.3742.649−0.098
Raw material supply (B)2.0321.8893.9210.142
Key supplier ( b 1 )1.2961.4972.794−0.201
Alternative sources of supply ( b 2 )1.1941.4472.641−0.253
Materials visibility ( b 3 )1.7621.4473.2090.314
Global management strategy (C)1.8831.9833.866−0.101
Inventory policy ( c 1 )1.2361.4492.685−0.212
Production scheduling ( c 2 )1.3001.3762.676−0.075
Global planning ( c 3 )1.5871.3762.9630.211
Cash management and information (D)2.1221.9354.0570.187
Cash flow management ( d 1 )1.9011.4393.3400.462
Supplier information ( d 2 )1.3451.5492.894−0.205
IT evaluation system ( d 3 )1.2831.5402.823−0.257
Publisher’s Note: MDPI stays neutral with regard to jurisdictional claims in published maps and institutional affiliations.

