1. Introduction
The first mineral explorations in Serbia began in the early 19th century (1835), when Baron Sigmund August Wolfgang Freiherr von Herder, the supreme mining elder of Saxony, arrived at the invitation of Prince Miloš Obrenović [
1,
2,
3,
4]. His work led to the discovery of an unknown blue mineral in the municipality of Kraljevo, in the village of Rudnjak, on the western slopes of mountain Željin, Serbia [
5]. As a sign of gratitude, he named this mineral “miloschin” after Prince Miloš Obrenović [
5]. In the following years, Professor of Mineralogy August Breithaupt analyzed its mineralogical and chemical composition and published the results in a paper titled “Bestimmung neuer Mineralien; Serbian or Miloschin” [
6]. In the third revised edition of
Dana’s Mineralogy from 1850 [
7], “miloschin” is referred to as a chromiferous compact mineral, probably a mechanical mixture. Subsequent investigations of this mineral were conducted by other authors, who reported their findings in the following years [
8,
9,
10,
11]. Kersten [
8] reported that this new mineral is a hydrated aluminum silicate with chromium, while Kenngott [
9] states that it consists of a crystalline part, probably kaolin, and an amorphous part. Somewhat later, in the sixth revised edition of
Dana’s Mineralogy [
12], the name was first introduced as “miloschite” to comply with English terminology. In 1916, the first American occurrence of “miloschite” was reported [
13], where it was recognized as a separate mineral species of chromium kaolinite. They felt that their mineral from Nevada closely resembled the published descriptions of “miloschite”. However, they were not in possession of an original sample of “miloschite” from the type locality—Rudnjak, and they considered it desirable to compare the two minerals. New insight into this mineral emerged in 1942, when Grim and Rowland [
14] reported the first differential thermal analysis, suggesting that it was chromium-bearing kaolinite and/or halloysite. Later, in 1953, Maksimović [
15] defined it as a chromium-bearing halloysite, citing the higher H
2O content in its structure. Maksimović [
15], based on thermogravimetric analysis (TGA) and X-ray diffraction (XRD) results, and Stangačilović [
16,
17], based on differential thermal analysis (DTA) results on the original samples of “miloschite”, unequivocally confirmed that the sample is chromo-bearing halloysite. Maksimović, in his article from 1972 [
18], mentions that “miloschite” was also found in other localities in Serbia, as well as that “miloschite” occurs in various shades of blue and that the intensity of the color of the mineral increases with the increase in chromium content. Brookins published a paper in 1973 [
19] where he raised a question regarding the term “miloschite” and stated that it was originally intended to refer to a chromiferous kaolinite and/or halloysite, since no X-ray diffraction data were known anywhere in the world. Nevertheless, he decided to declare the samples from The Geysers (Sonoma County, CA, USA) as “miloschite”, to publish their XRD data, and to claim that this was the first unambiguous identification of “miloschite” as chromium-bearing kaolinite. Maksimović and Brindley [
20] mention and distinguish the occurrence of chromium-bearing halloysite alongside chromium-bearing kaolinite and tosudite near Takovo (Serbia), while Maksimović and co-authors [
21] mention chromium-bearing dickite and chromium-bearing kaolinite from Teslić, Yugoslavia (now Bosnia and Herzegovina). Lastly, in the Clay Minerals Society Glossary of Clay Science from 2020 [
22], it was stated that “miloschite” represents an obsolete term for chromium-bearing kaolinite, which probably originates from Brookins’ [
19] claims. The name “miloschite” is not included in the official list of species names of the IMA Commission on New Minerals, Nomenclature, and Classification (CNMNC), as it is a variety name. The existing names of mineral varieties which are not regarded as species do not come under the jurisdiction of the CNMNC and are therefore unregulated.
An investigation was conducted on an original sample of “miloschite” from the University of Belgrade’s collection of Minerals and Rocks (Faculty of Mining and Geology) that was brought in the first half of the 19th century by its discoverer, Baron von Herder [
1,
23]. The aim was to gain new insights into its mineralogical and chemical properties. The objectives were twofold: firstly, to confirm and expand upon previous findings; and secondly, to identify the oldest sample of “miloschite” (after which it is named) as a chromium variety of halloysite that warrants renewed recognition within the scientific community. This research seeks to preserve the status of “miloschite” as a significant component of geoheritage materials and to maintain its name as a chromium variety of halloysite.
3. Materials and Methods
All investigations were carried out on a sample from the University collection of Rocks and Minerals (University of Belgrade—Faculty of Mining and Geology, Collection of Rocks and Minerals). The investigated sample is part of the specimens collected personally by Baron von Herder in 1835; some of these specimens were left in Serbia [
1,
23], while others were first examined in Germany [
6,
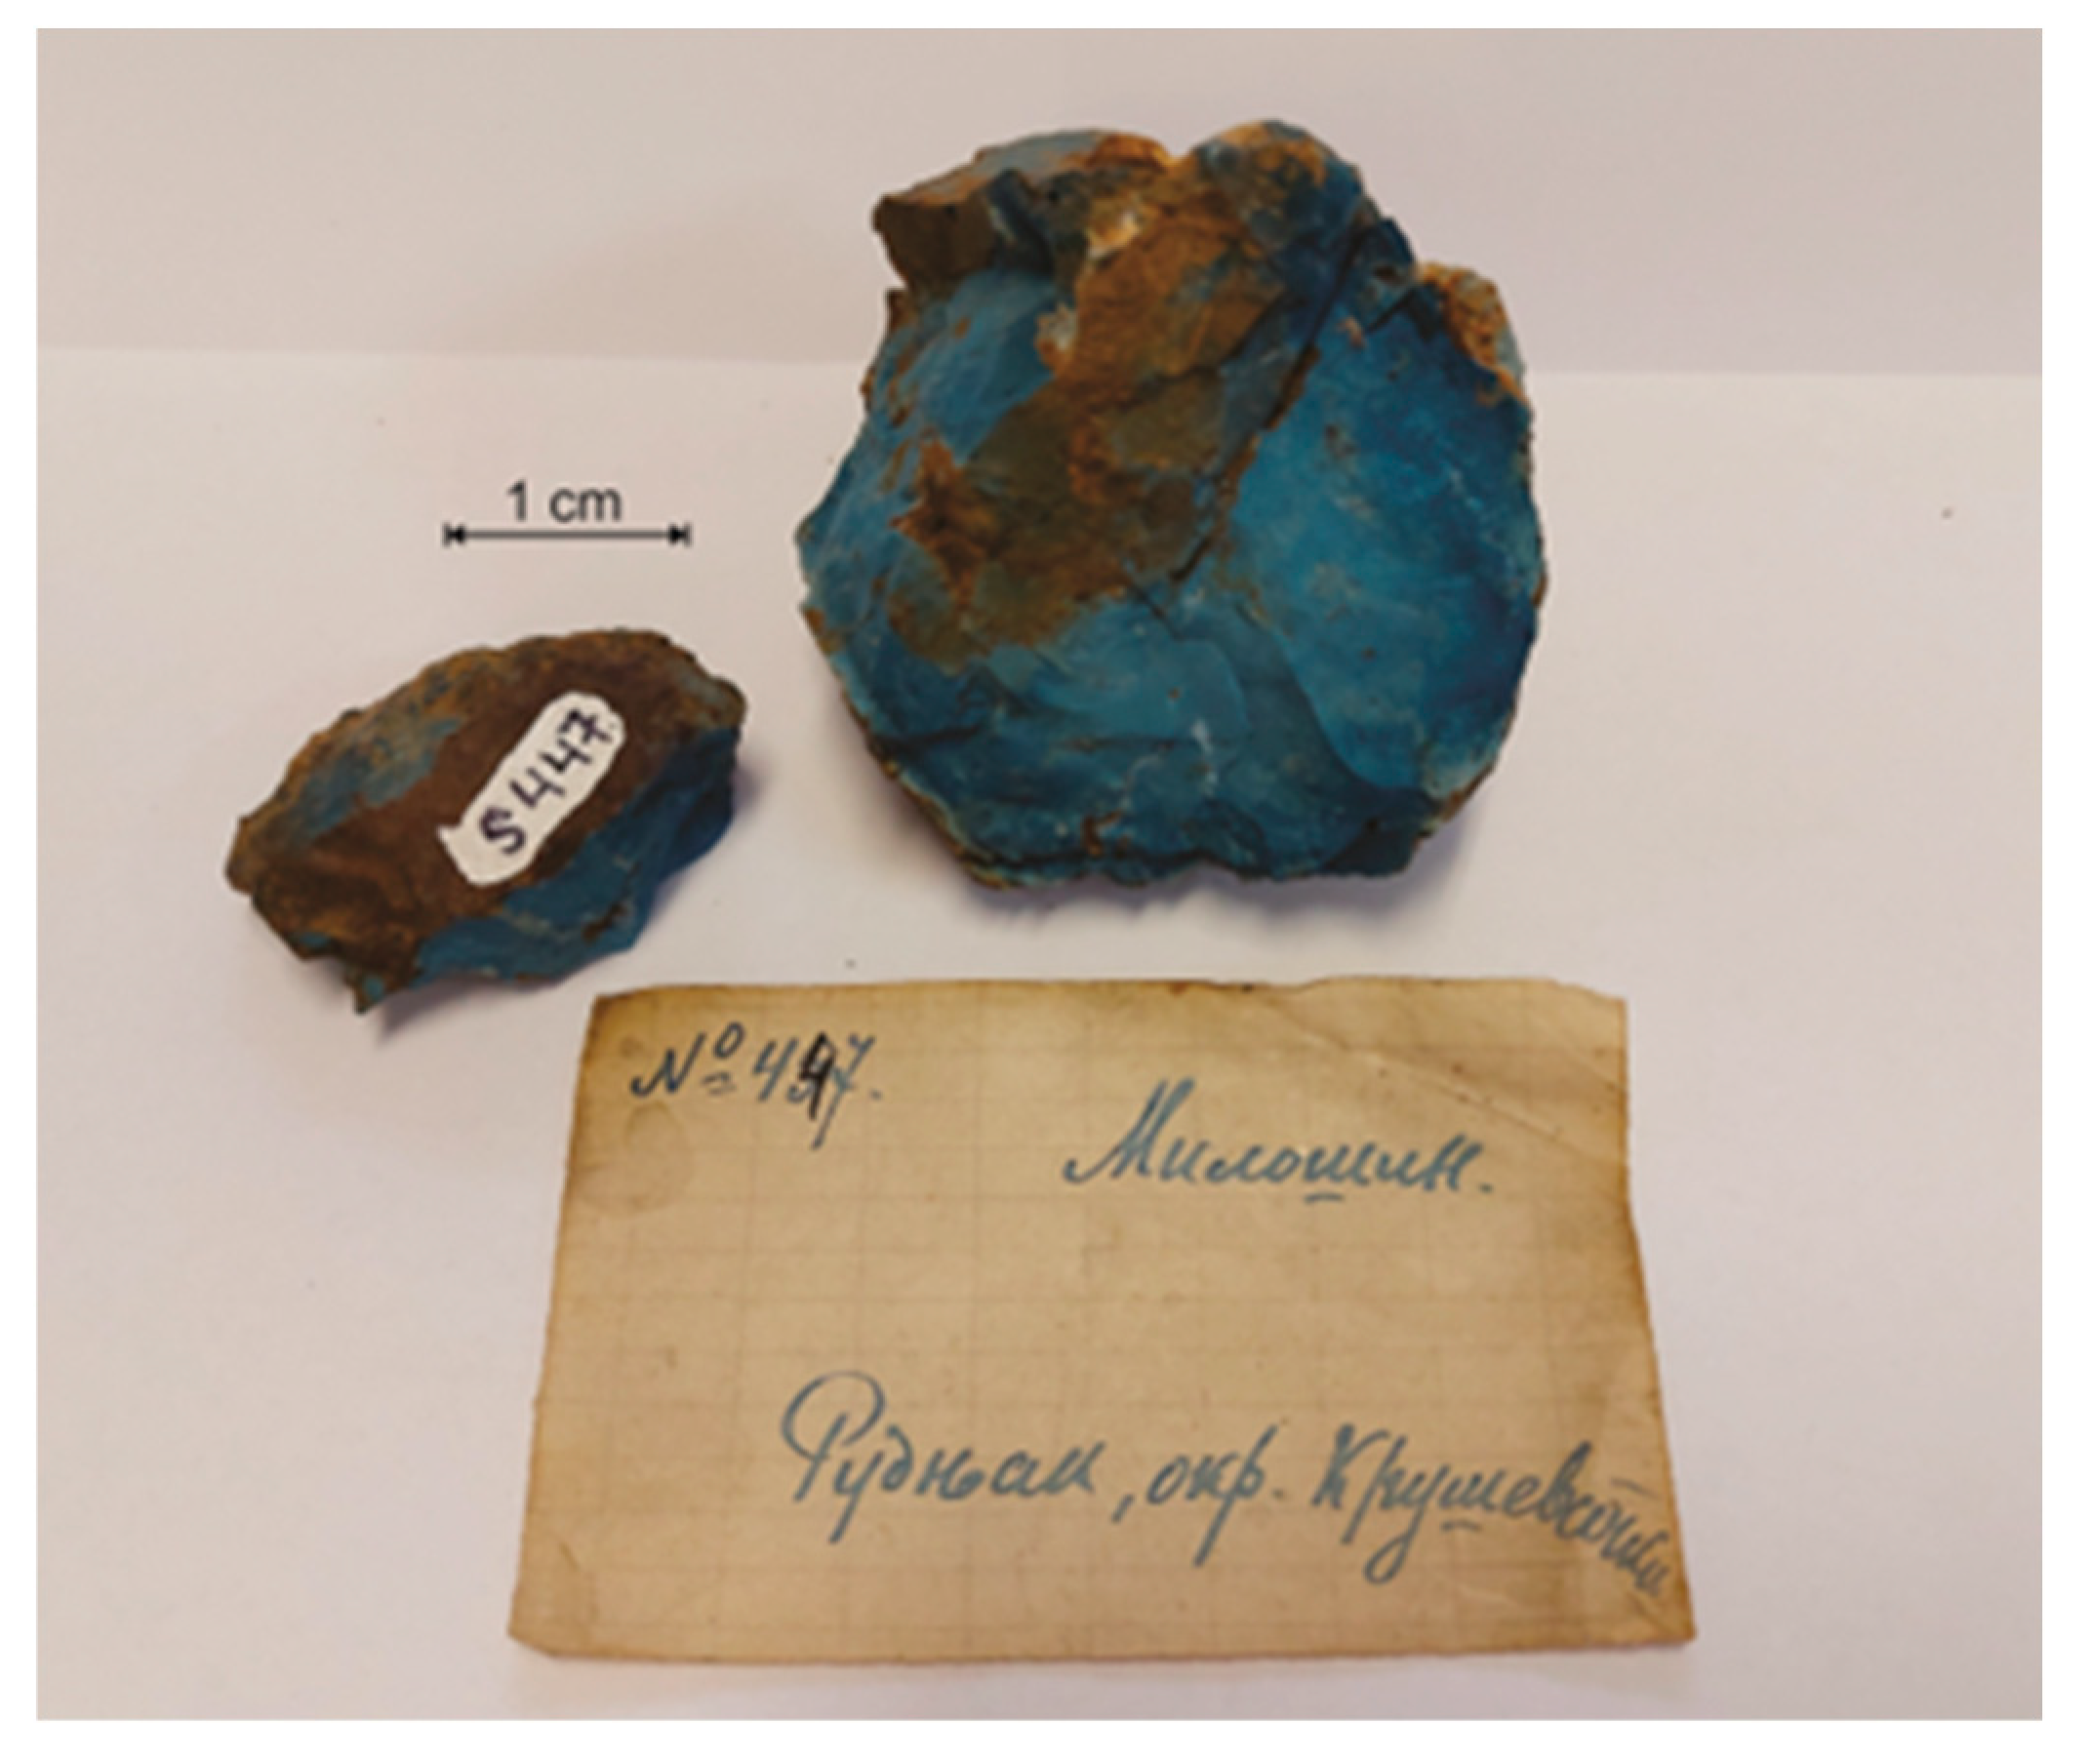
8] and represent specimens from the aforementioned type locality, Rudnjak. It is a raw clay sample without further separation or purification. The investigated sample of “miloschite” is very homogeneous, with some parts exhibiting an earthy habitus (
Figure 2). The observed color is blue, with a blue streak that is only slightly lighter in shade. It exhibits an irregular fracture with sharp edges, although it can be scratched somewhat with a nail. The surface is sparsely covered with iron oxide/hydroxide minerals. No additional mineral phases were visually observed. The observed Fe mineral coating was manually removed from the surface of the sample before it was crushed, hand-milled, and homogenized.
The powder X-ray diffraction (PXRD) data were
analyzed using a powder sample and glass slide oriented mounts: air-dried, saturated with ethylene glycol, and heated to 550 °C [
26]. The data were collected on a Rigaku SmartLab X-ray diffractometer (Rigaku, Tokyo, Japan) equipped with a D/teX Ultra 250 strip detector using Bragg–Brentano geometry and Cu Kα radiation at room temperature, while the diffractometer was operated at 40 kV and 30 mA. The scan range was from 2 to 65°2θ (for powder sample) and from 2 to 30°2θ (for the oriented mounts), with a scanning speed of 5°/min and step size of 0.01°, in both cases. Thermogravimetric and differential thermal analysis (DSC/TGA) of the investigated sample was carried out on a SDT Q600 instrument (TA Instruments, New Castle (DE, USA)) in an air atmosphere (flow rate: 100 cm
3 min
−1; heating rate: 20 °C min
−1), ranging from room temperature to 1200 °C. The obtained results were plotted regarding the Al
2O
3 as the reference material. Measurement of elemental concentration in the sample was performed by application of an inductively coupled plasma analytical technique with optical emission spectrometry (ICP-OES), using the iCAP 6500 Duo ICP instrument (Thermo Fisher Scientific, Cambridge, UK) with iTEVA operating software (Thermo Fisher Scientific, Cambridge, UK). Total dissolution was performed at high pressure (100 bar) and high temperature (210 °C) for 20 min, in closed Teflon cuvettes, in a microwave digester (Ethos 1, Milestone, Italy). Qualitative chemical composition was determined using Scanning Electron Microscopy (SEM) with a JEOL JSM-6610LV SEM (JEOL Ltd., Tokyo, Japan) coupled with an Oxford Energy Dispersive X-Max 20 mm
2 SDD energy dispersive X-ray spectrometer (EDXS). The analyses were performed with 20 kV acceleration potential and 20 nA beam current using external and internal standards. Calibration of the
analyzing system was achieved using iron, and the sample was coated with gold films (LEICA Model SCD005; Wetzlar, Germany). SEM micrographs of the “miloschite” morphology were taken on a JEOL JSM-6390LV Scanning Electron Microscope (JEOL Ltd., Tokyo, Japan). Sample preparation for SEM imaging included manual grinding of the sample into powder for 15 min in an agate mortar, after which the powder was treated with distilled water for 60 min in an ultrasonic bath. The droplet was transferred from the suspension onto a carbon self-adhesive tape using a glass rod and left to dry for 24 h. The thus dried suspension was coated with gold for 100 s at 30 milliamperes on a Bal-Tech SCD 005 sputter coater. Infrared spectroscopic analysis was performed using a Perkin Elmer 597 spectrometer (Perkin Elmer, Waltham, MA, USA) with the standard KBr pellet method (1:200) in the region of 4000–200 cm
−1. Raman spectroscopy was performed by using an XploRA Raman spectrometer from Horiba Jobin Yvon (France, Palaiseau). Raman scattering was excited by a laser at a 532 nm wavelength, equipped with a 1200 lines/mm grating. Spectra were accumulated from 10 scans, each lasting 5 s. The spectra were recorded in the range from 200 to 1800 cm
−1; all recorded measurements were with a spectral resolution of 4 cm
−1. The Raman spectra acquisitions were managed by the LabSpec 6 software (Horiba Jobin Yvon; France, Palaiseau), and the spectra preprocessing was realised using Spectragryph v1.2.15 software [
27]. Spectra were baseline corrected, and Savitzky–Golay filters with 5 points and a second-order polynomial function were used for spectra smoothing. Diffuse reflectance (DR) measurements in the VIS-NIR region were performed using a Cornerstone 130TM 74,000 monochromator (Oriel Instruments, Stratford, CT, USA) using an R45,0 adapter. Measurements were carried out in the wavelength interval between 1300 and 2100 nm at 2 nm steps, 2 s pause, BaSO
4 as a reference sample with an InGaAs (Thorlabs, Newton, NJ, USA) DET C/M) photodiode for the investigated region [
28]. The cation exchange capacity (CEC) and specific surface area (SSA) of the sample were determined after saturation with methylene blue (MB) solution according to the standard test [
29], using a uniSPEC2 (LLG Labware; Hambuch, Germany) spectrophotometer. The color of the dry-pressed, raw powder sample was measured using a CCS200 spectrometer (Thorlabs, Newton, NJ, USA) with diffuse reflectance geometry in the region between 400 and 700 nm according to the Commission Internationale de l’Eclairage method [
30]. The white standard was BaSO
4, and the light source was illuminant C. Visual inspection was represented with a geological rock-color chart with genuine Munsell color chips [
31] and in HEX color codes.
4. Results
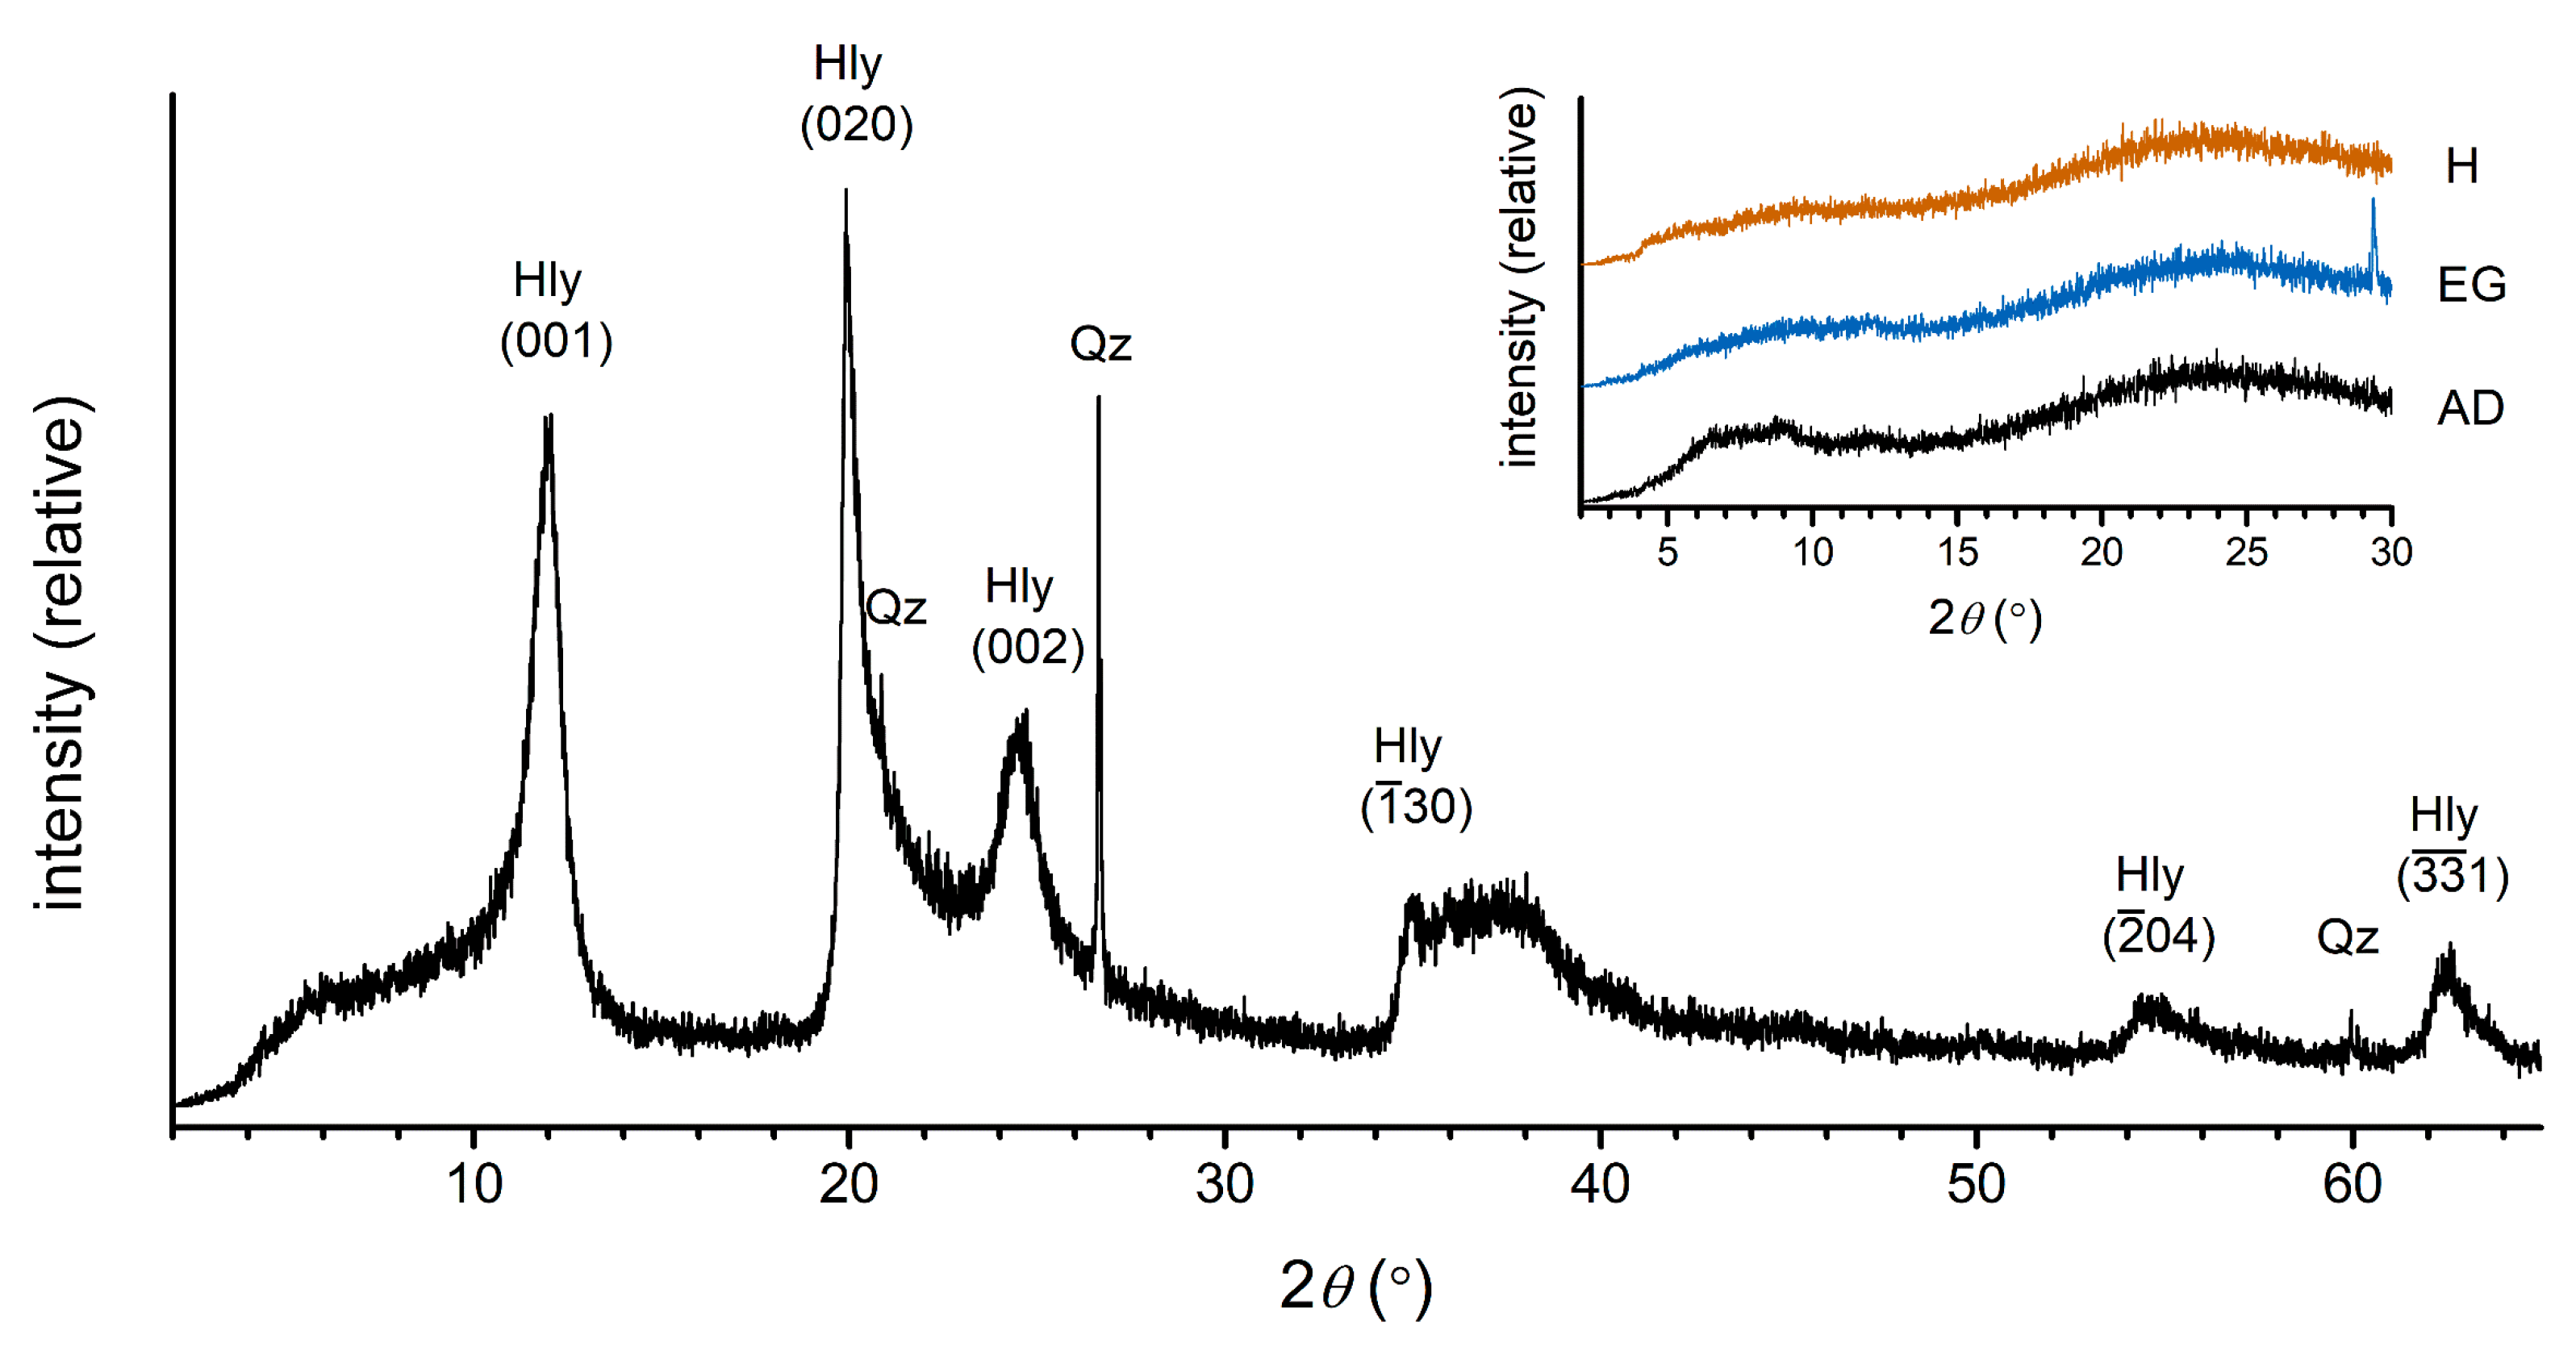
X-ray diffraction of a powder sample revealed the presence of halloysite with a small amount of quartz (
Figure 3). The slightly broad peaks at 7.37 Å, 4.46 Å and 3.63 Å are characteristic of halloysite. Oriented mounts showed only a few very broad and low-intensity peaks, which can be ascribed to amorphous phases or very disordered phases (probably aluminosilicate phases). The diffraction maximum in the ethylene-glycolated sample is probably originating from calcite, which may be formed under these specific conditions.
The chemical analyses conducted using ICP-OS measurements on the “miloschite” sample reveal significant insights and are compared with existing literature data for the same mineral from Rudnjak, as presented in
Table 1. This comparison demonstrates the importance of the obtained results and highlights the relevance of our research within the context of previously established mineralogical studies performed on the sample of “miloschite”.
The sample under investigation contains approximately 33% alumina and 43% silica. Additionally, since chromium oxide is present at levels exceeding 7%, it qualifies as one of the main constituents. The remaining oxides detected are all present at concentrations below 1% (refer to
Table 1). The calculated mass ratio of SiO
2 to Al
2O
3 for the “miloschite” sample was found to be 1.32. The trace element content, as measured using ICP-OES, is summarized in
Table 2. Notably, higher concentrations of arsenic (As), cobalt (Co), copper (Cu), manganese (Mn), strontium (Sr), and zinc (Zn) were observed compared to the other trace elements analyzed.
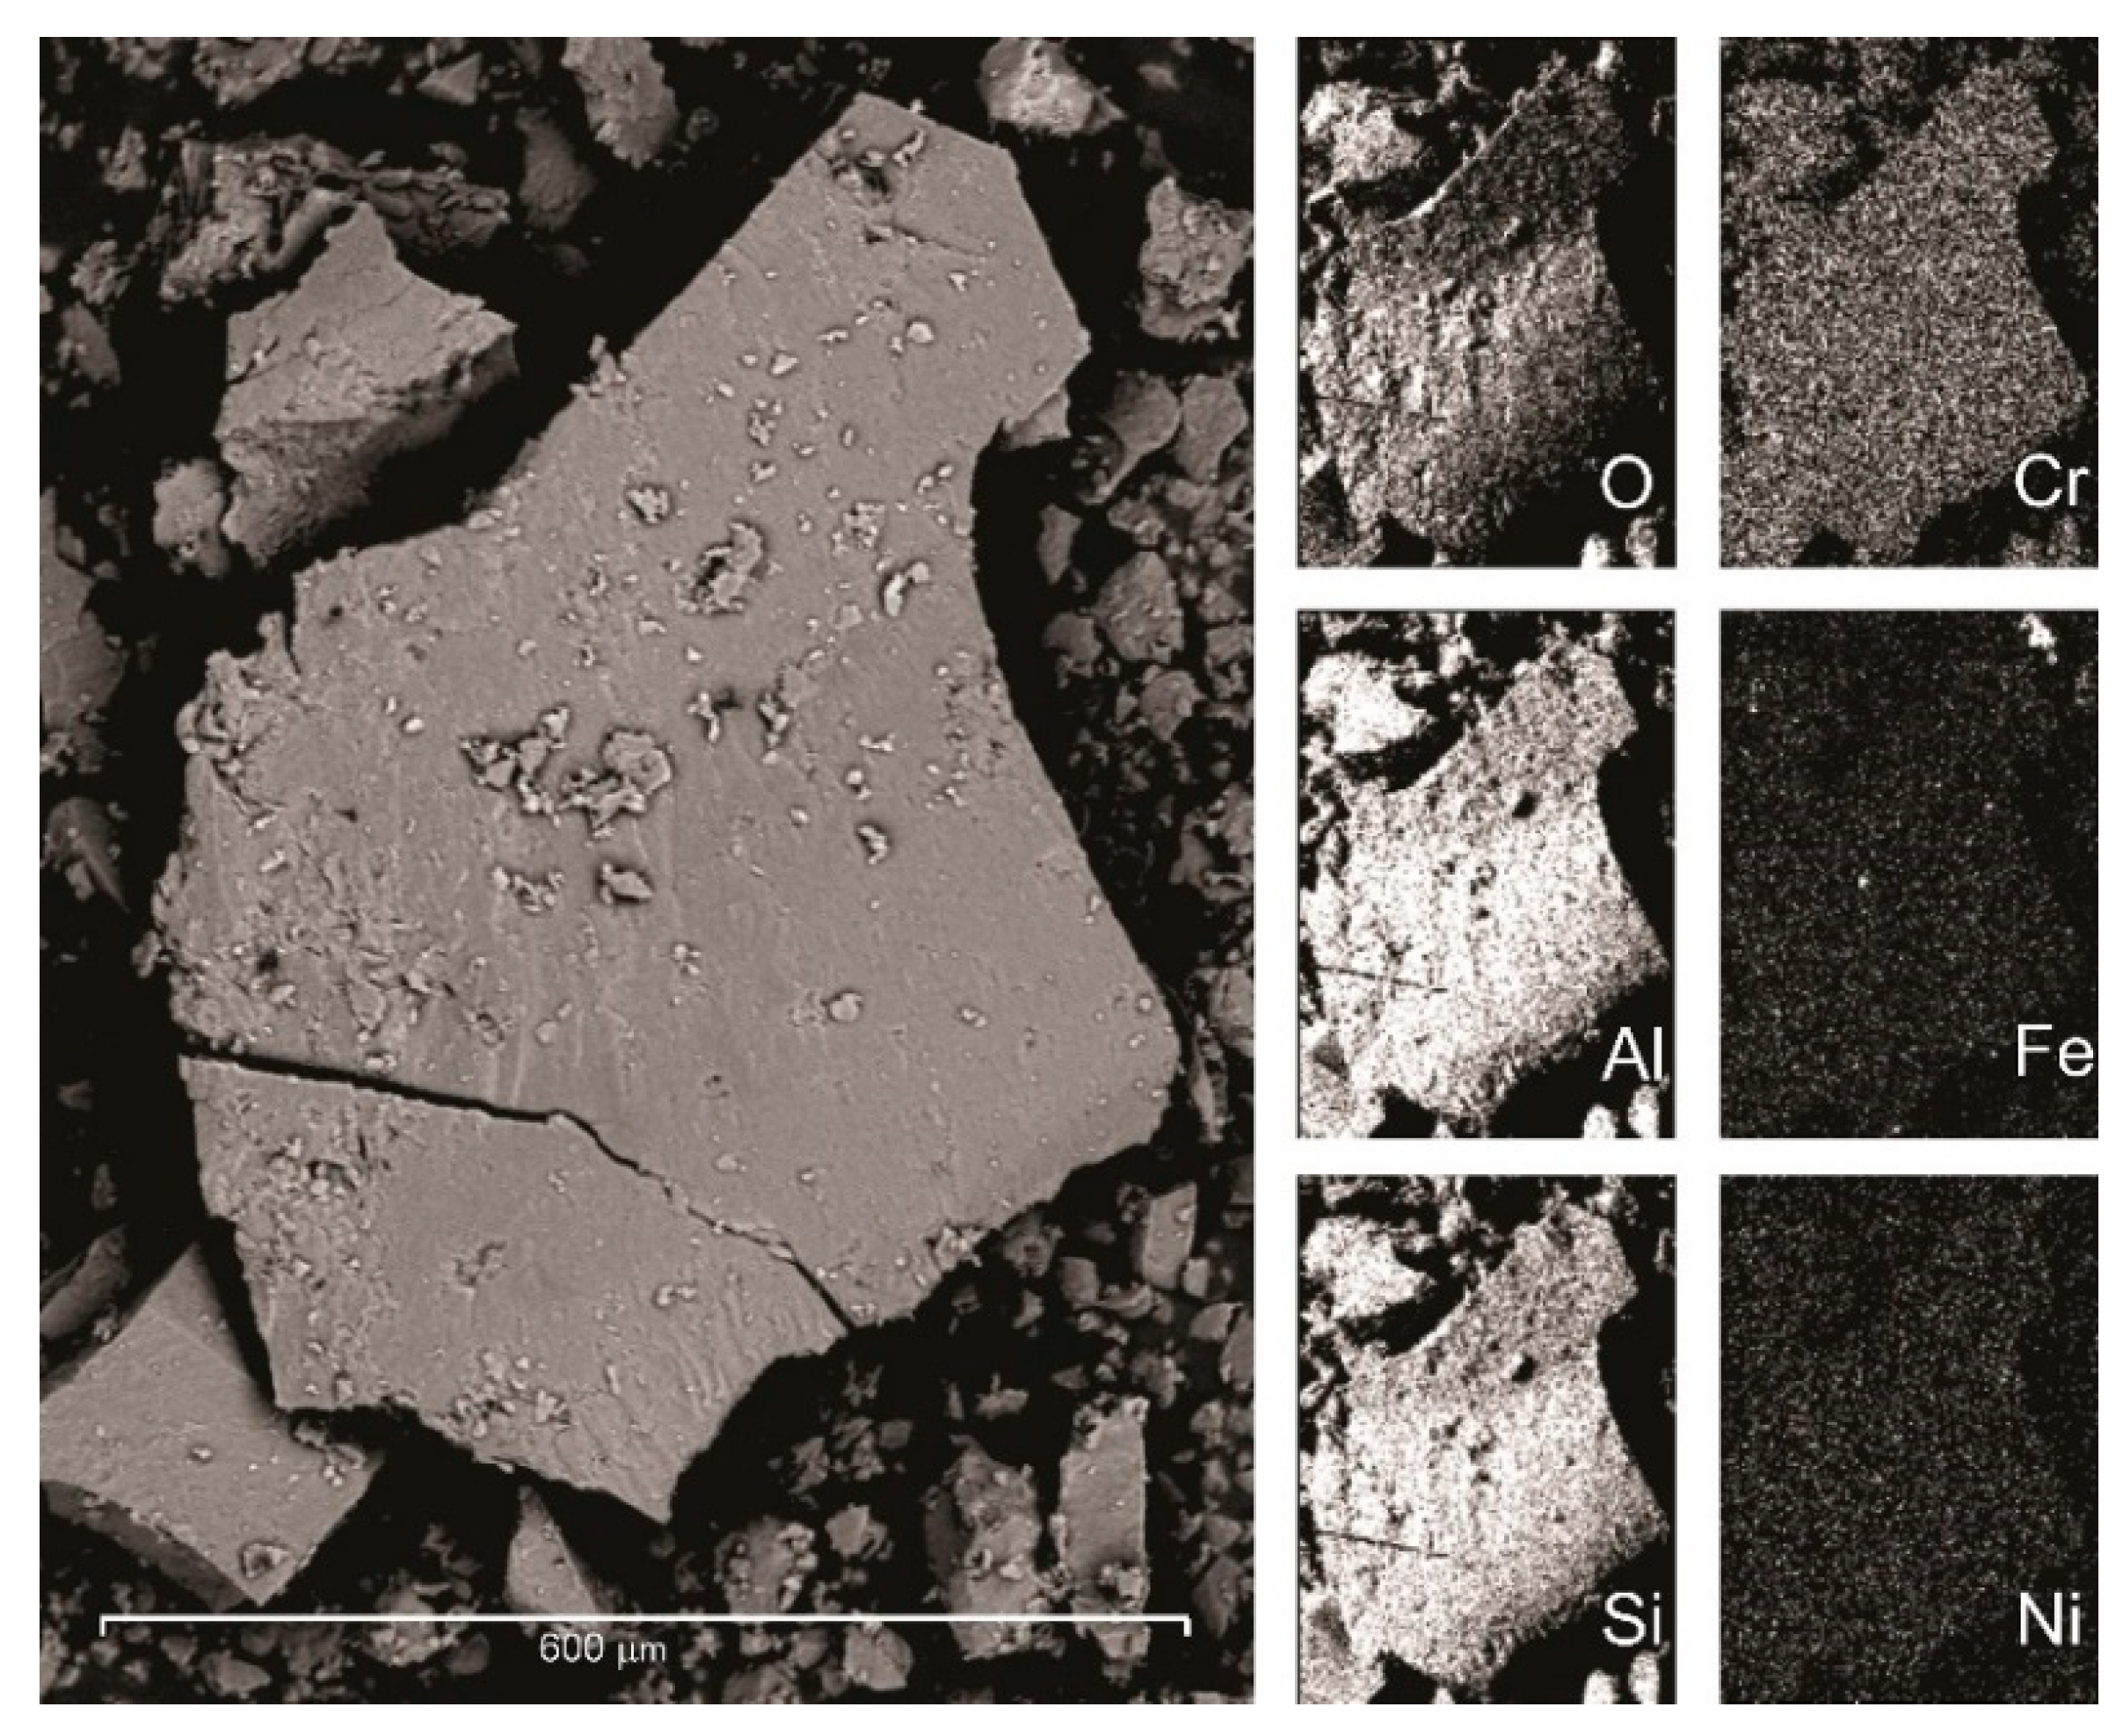
According to the distribution of energy-dispersive X-ray spectroscopy results of common elements found in the sample, the relative contents and areal distribution of Al, Si, Cr, Fe, Ni, and O were obtained (
Figure 4). Apart from the Fe minerals themselves in the EDS map, there is a uniform distribution of Cr throughout the sample, and therefore, the chromium is not present as a chromium-rich impurity, but as a substitution in the mineral structure.
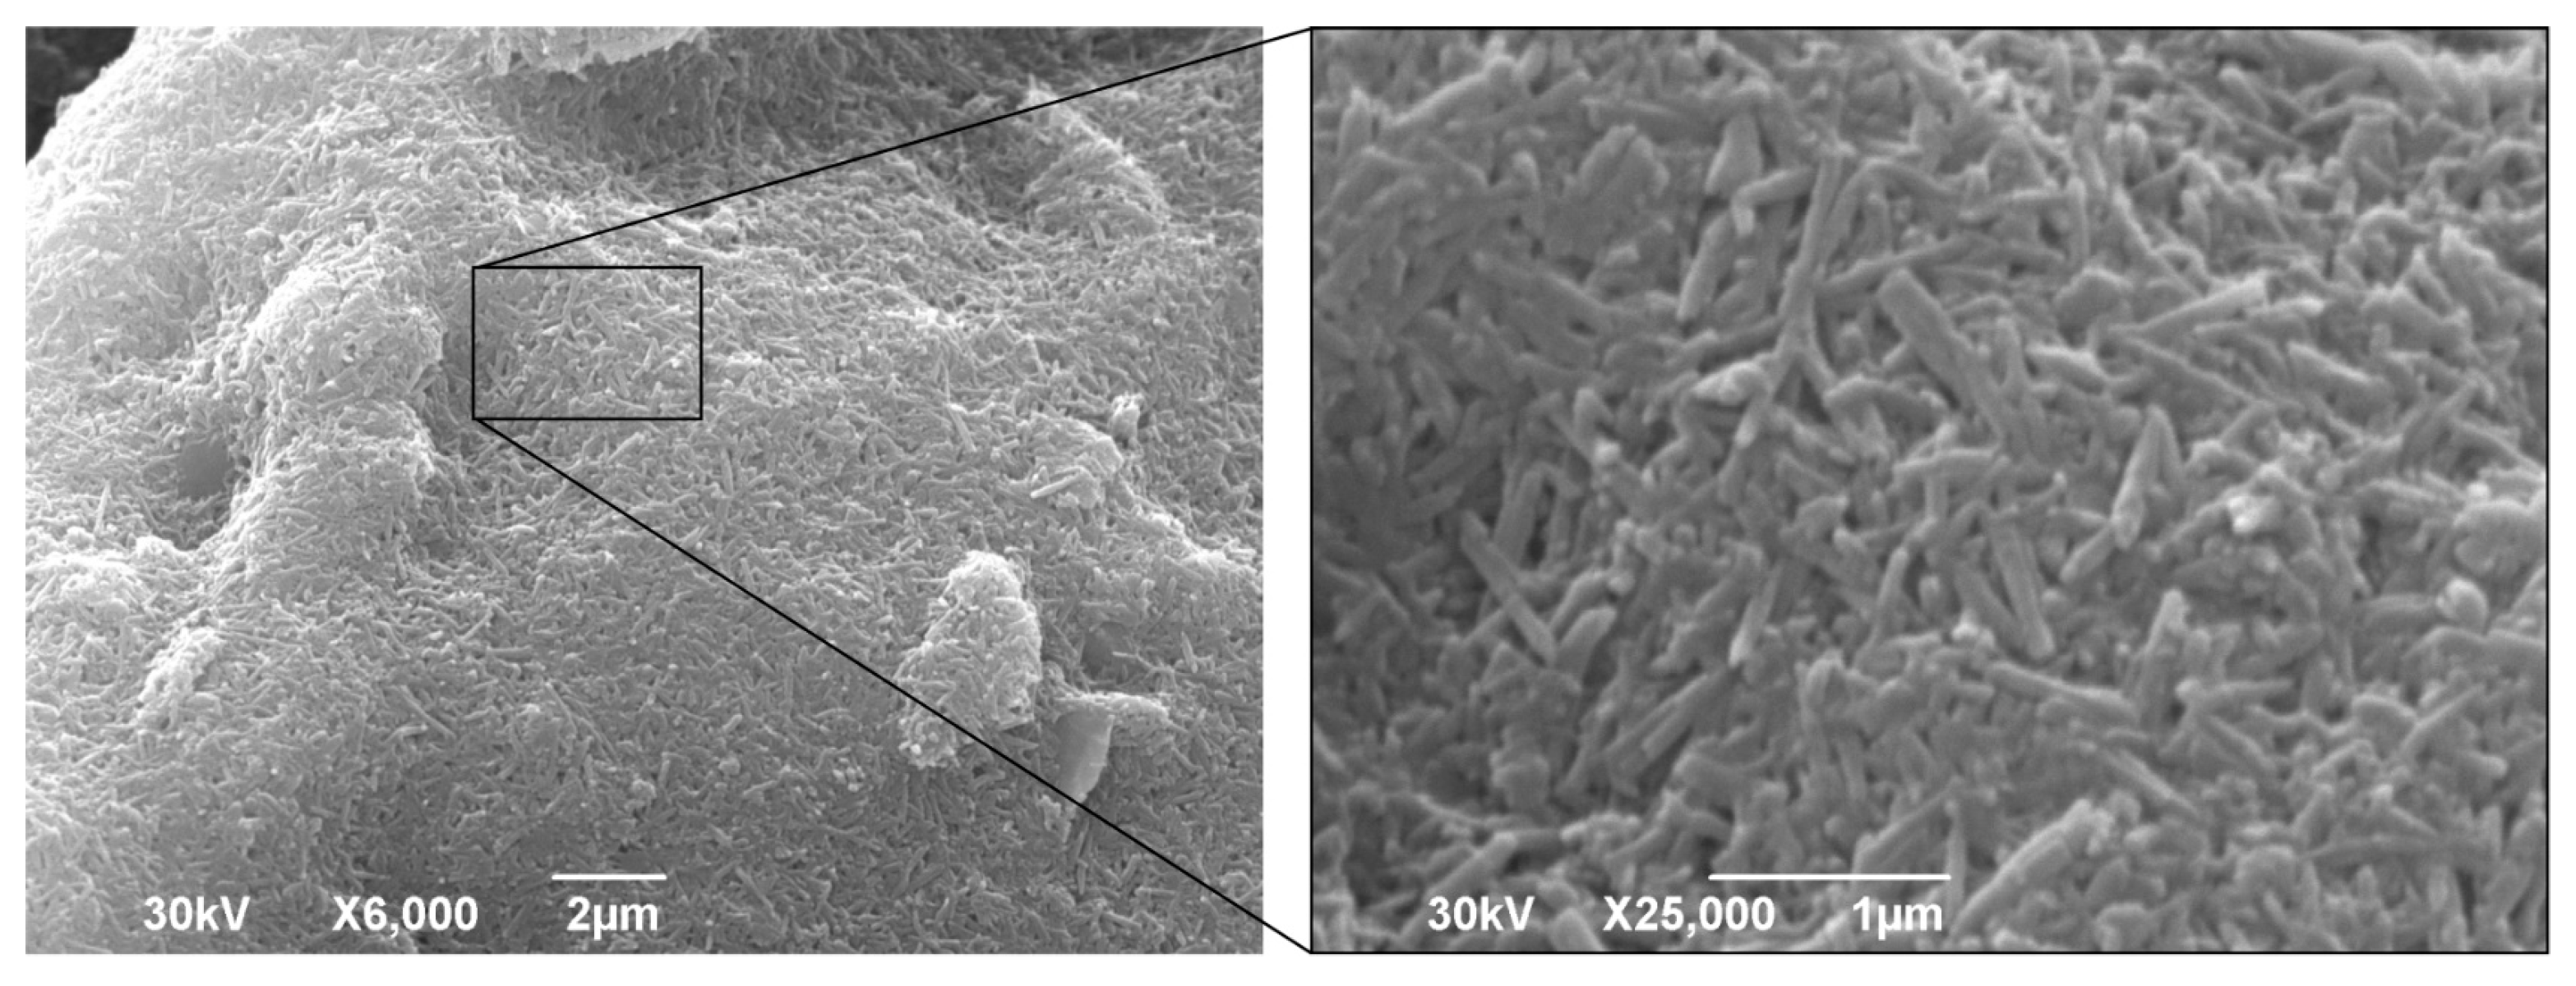
SEM micrographs of a powdered “miloschite” sample (
Figure 5) with a magnification of 25,000× showed elongated particles up to 700 nanometers in size, which can be described as nanotubular aggregates. The SEM analysis indicates that the sample analyzed exhibits a uniform composition, consisting of nanotubes with occasional particle agglomerates, which can be accurately described as nanotubular aggregates. The investigated sample of “miloschite” unequivocally displays a dominant tubular morphology, characterized by diversity in its structure, where the observed tubes can range from elongated and slender to compact and stout, or even branch off from one another.
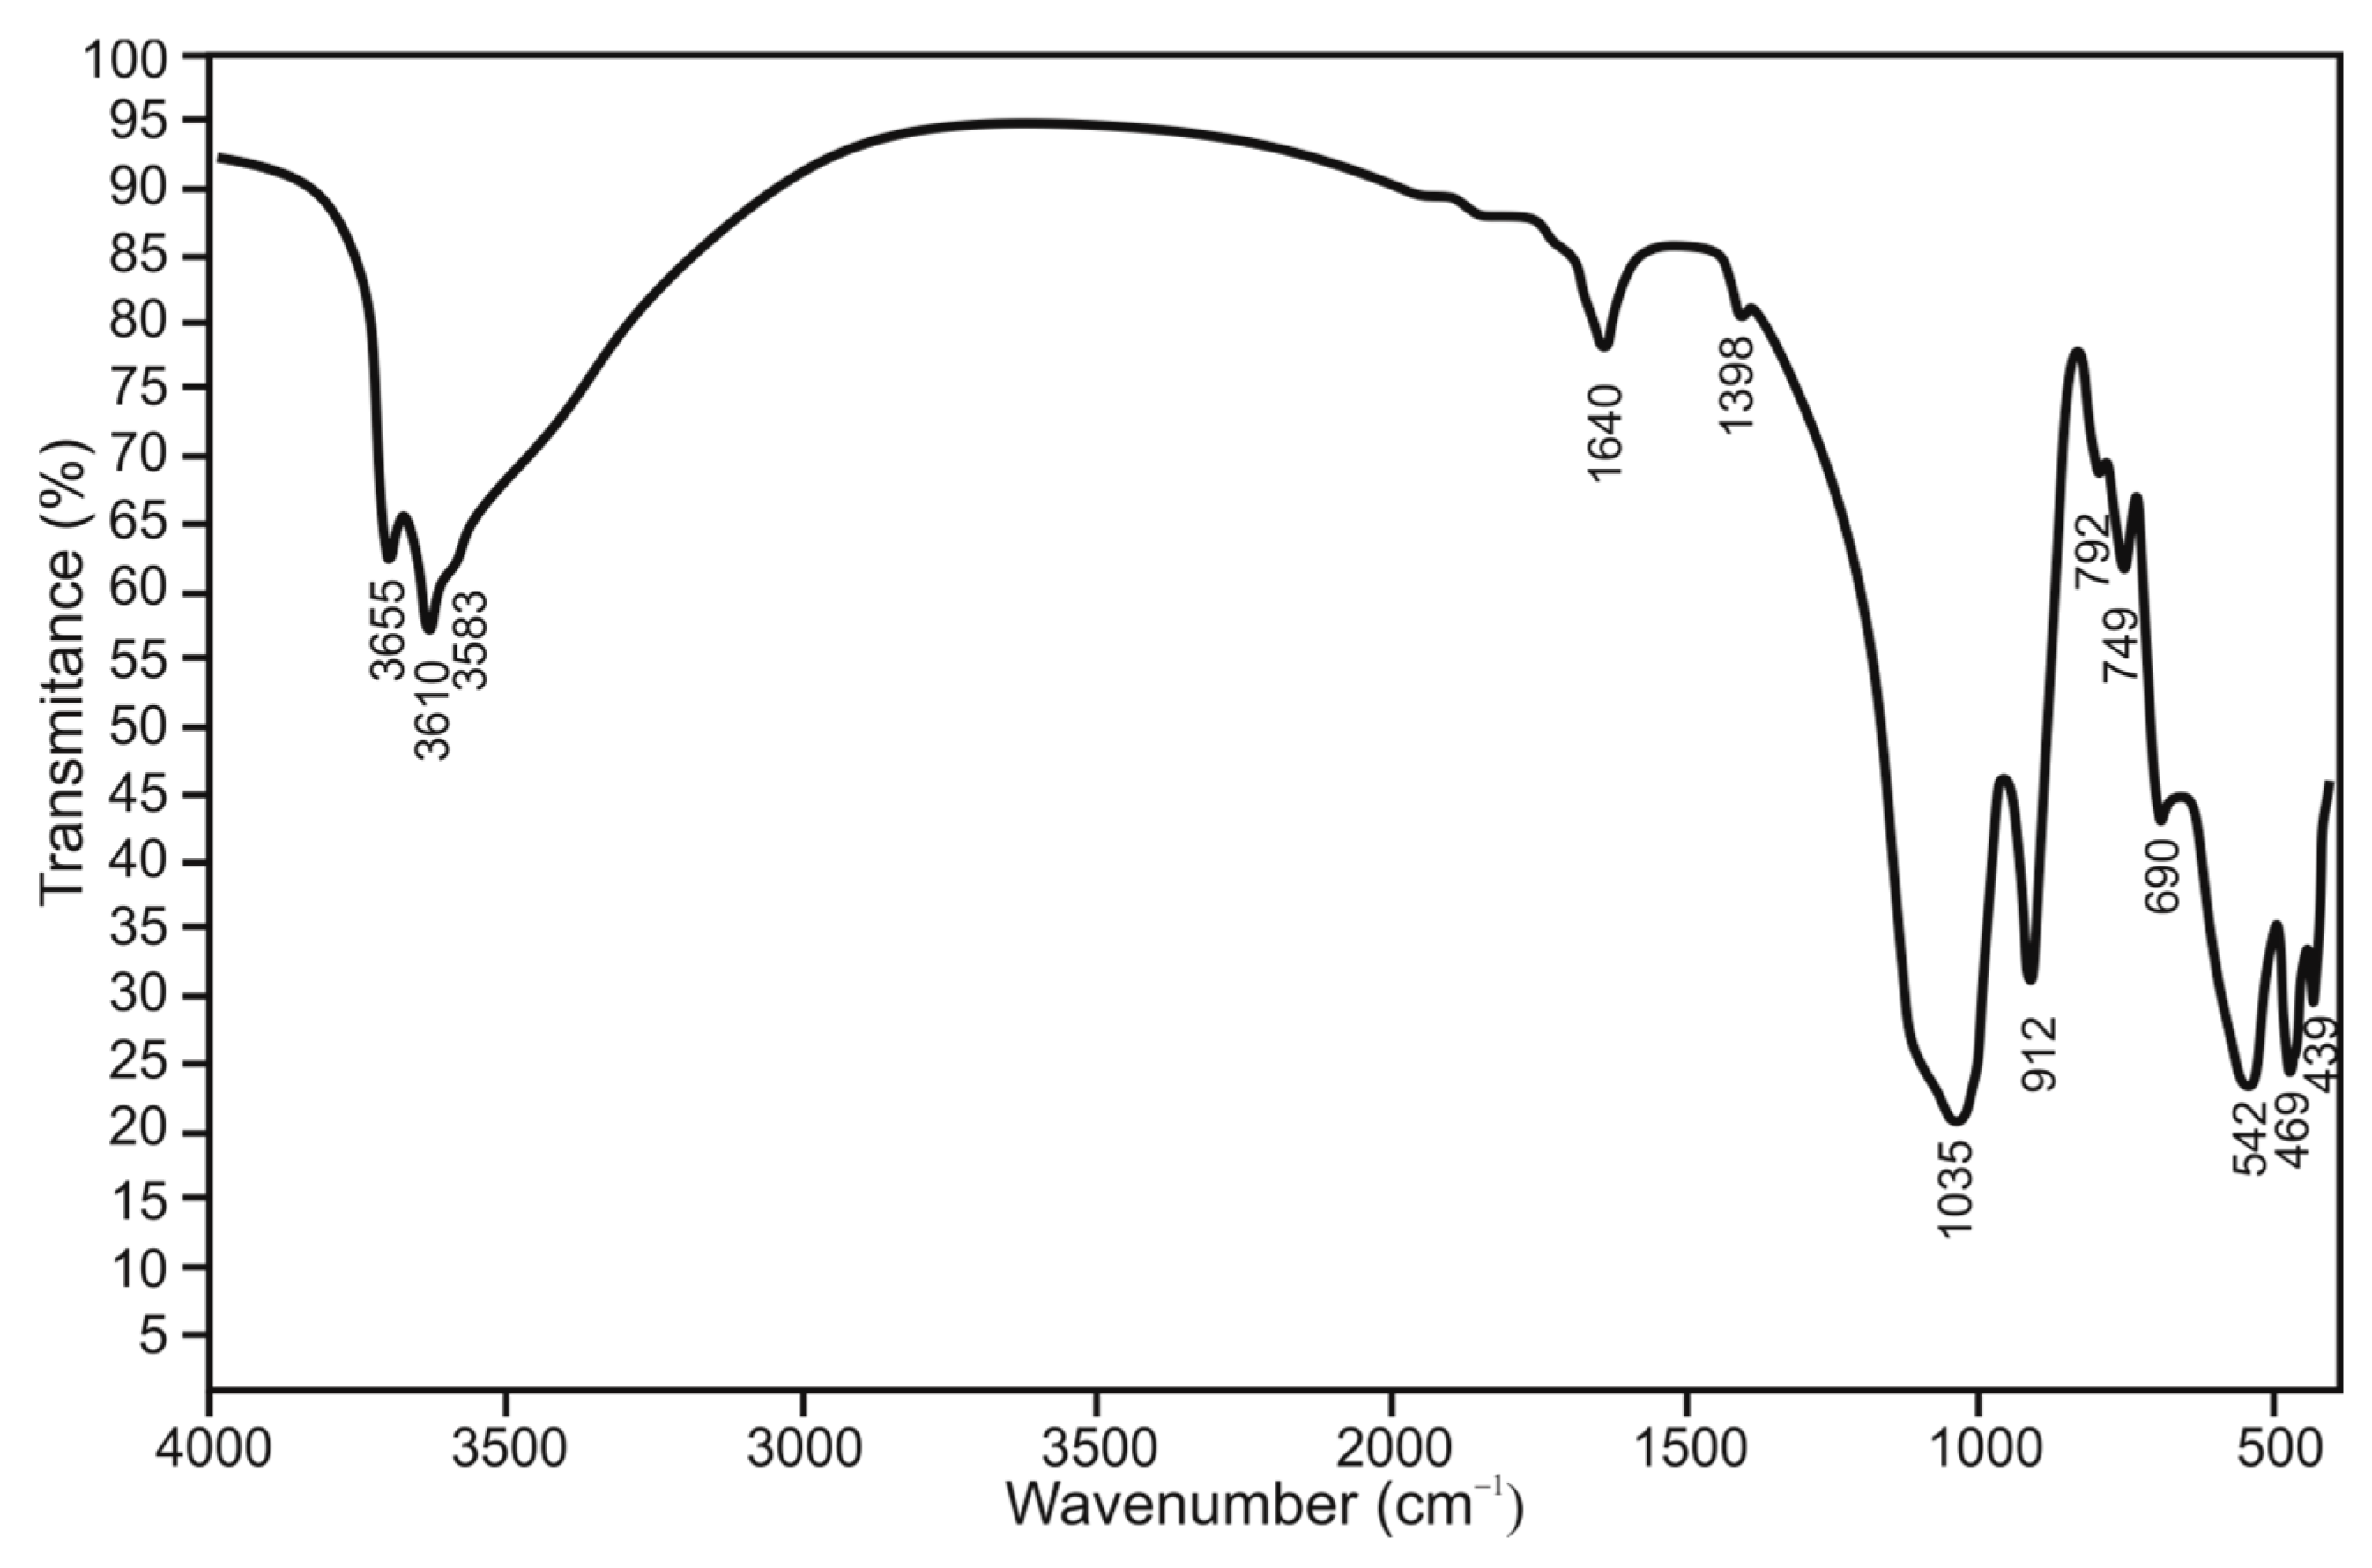
FTIR spectroscopy was effectively employed as a fingerprint method for mineral identification, complementing the XRPD technique, as illustrated in
Figure 6. The resulting spectra provided unique insights that align excellently with those obtained from other methods, confirming the identification of ”miloschite” as halloysite. Upon analyzing the results, several distinct groupings are evident. The first is found in the region of 3800–3400 cm
−1, the second spans 1150–690 cm
−1, and the third occurs between 790 and 440 cm
−1. Notably, in the vibration zone between 3800 and 3400 cm
−1, three strong bands at 3585, 3610, and 3655 cm
−1 unmistakably indicate the presence of hydroxyl groups and water molecules. In addition to the previously mentioned hydroxyl groups, typical Si-O stretching vibrations characteristic of 1:1 layered silicates are observed in the 1120–1000 cm
−1 region, while bending vibrations are evident in the range of 790–605 cm
−1.
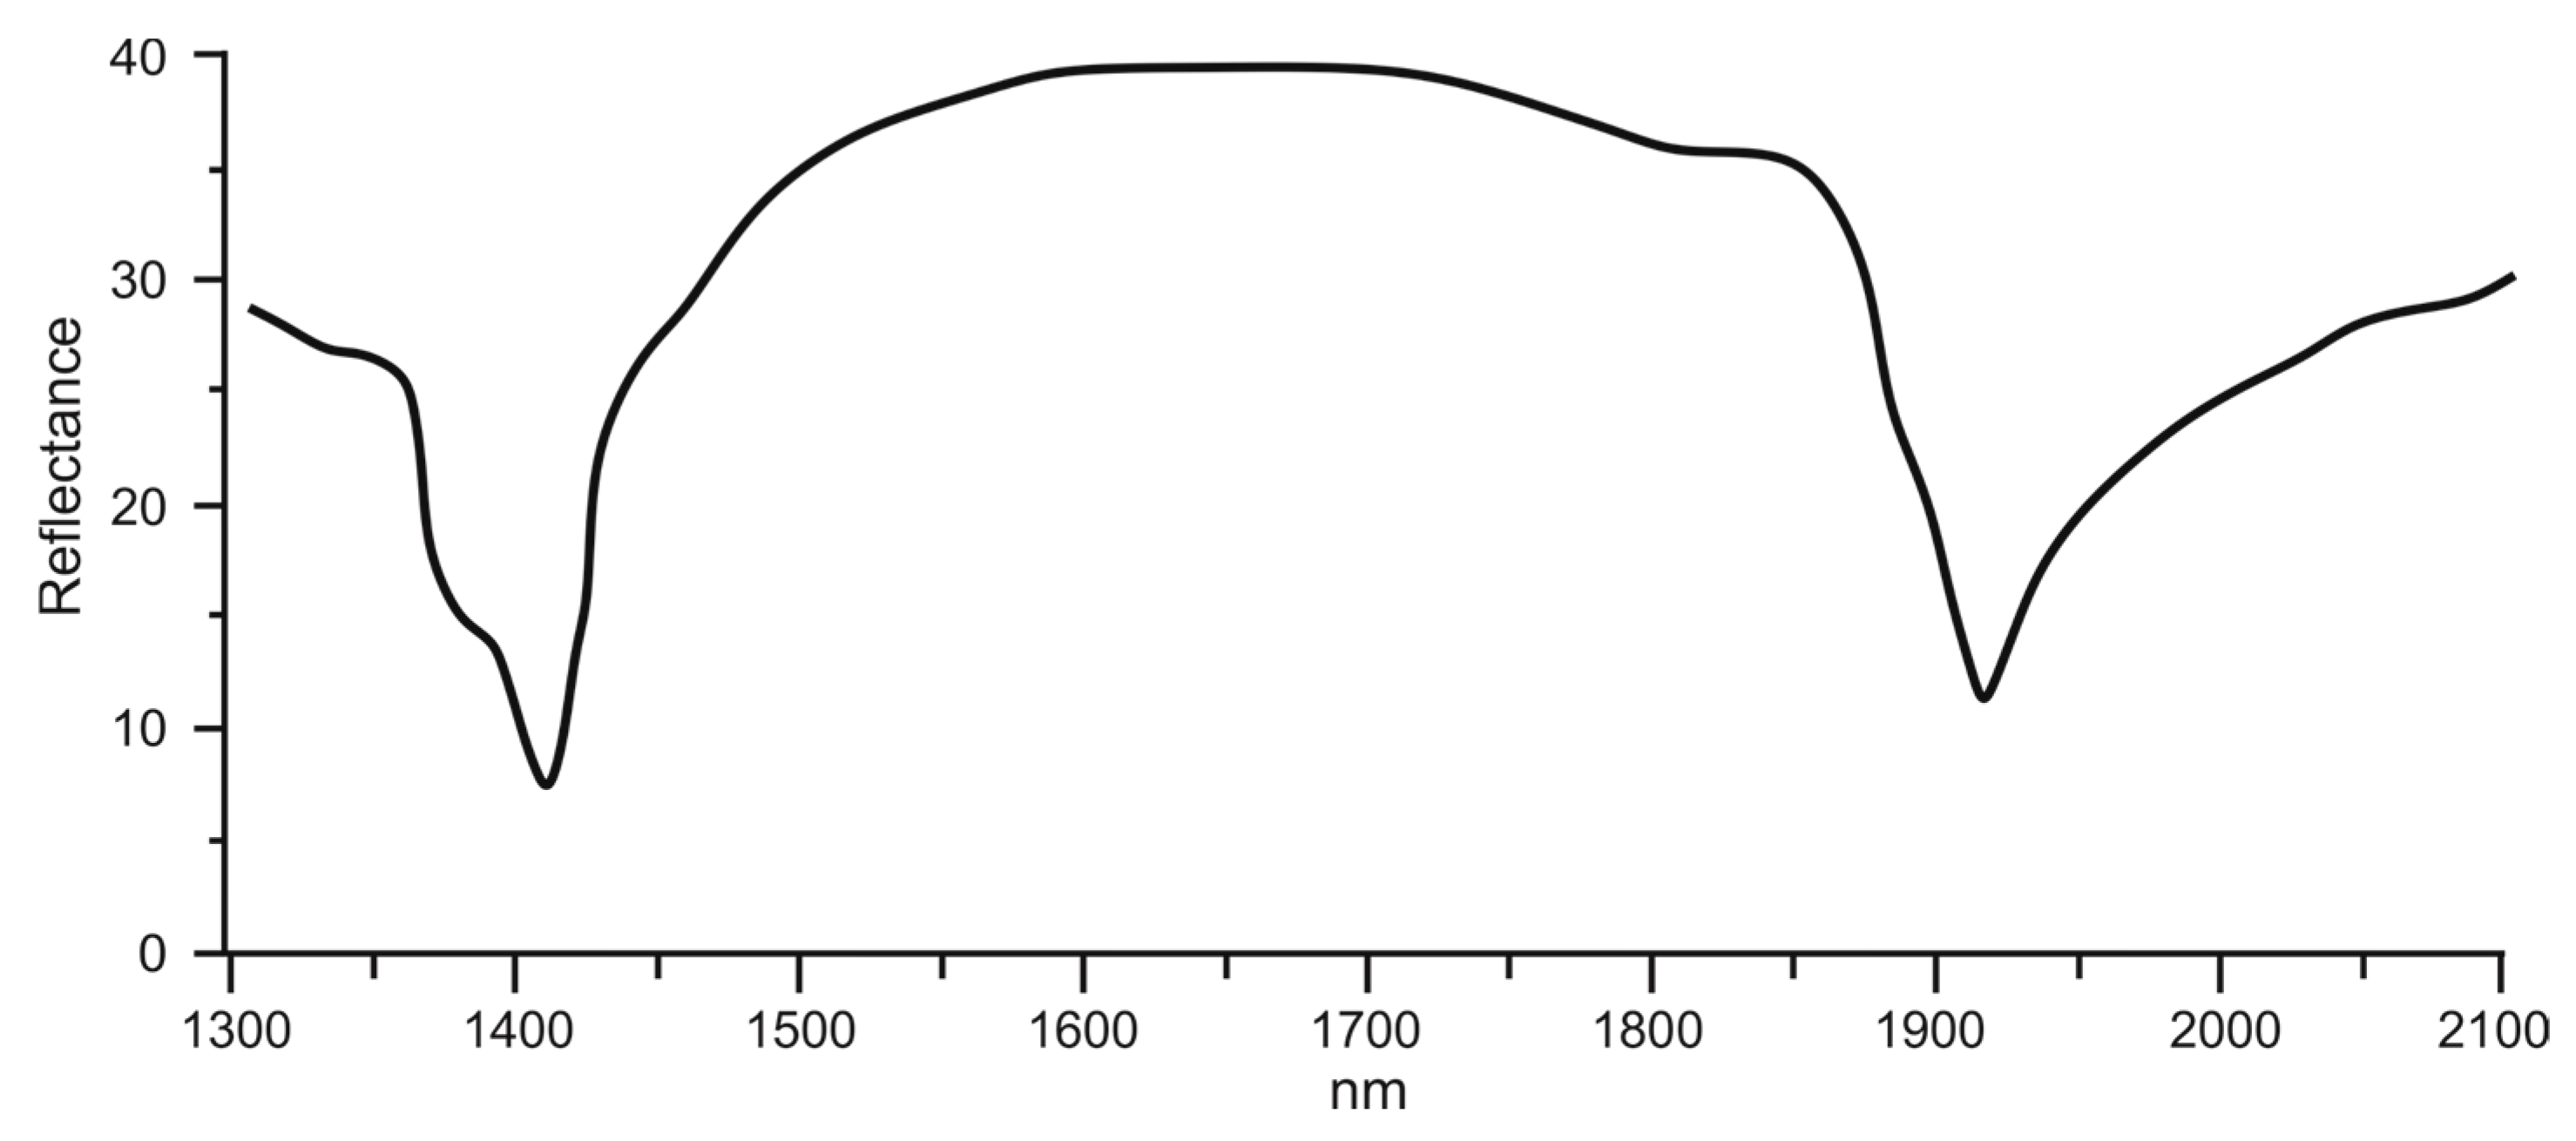
Major distinctive bands when observing the VIS-NIR (Diffuse reflection—DR) are presented in
Figure 7. The spectrum shows a distinct pair of bands resulting from the stretching overtone of Al
2OH at 1395 nm and 1415 nm, along with a prominent water absorption band at 1912 nm. These spectral features, particularly the band associated with water absorption, indicate the presence of halloysite-type clays.
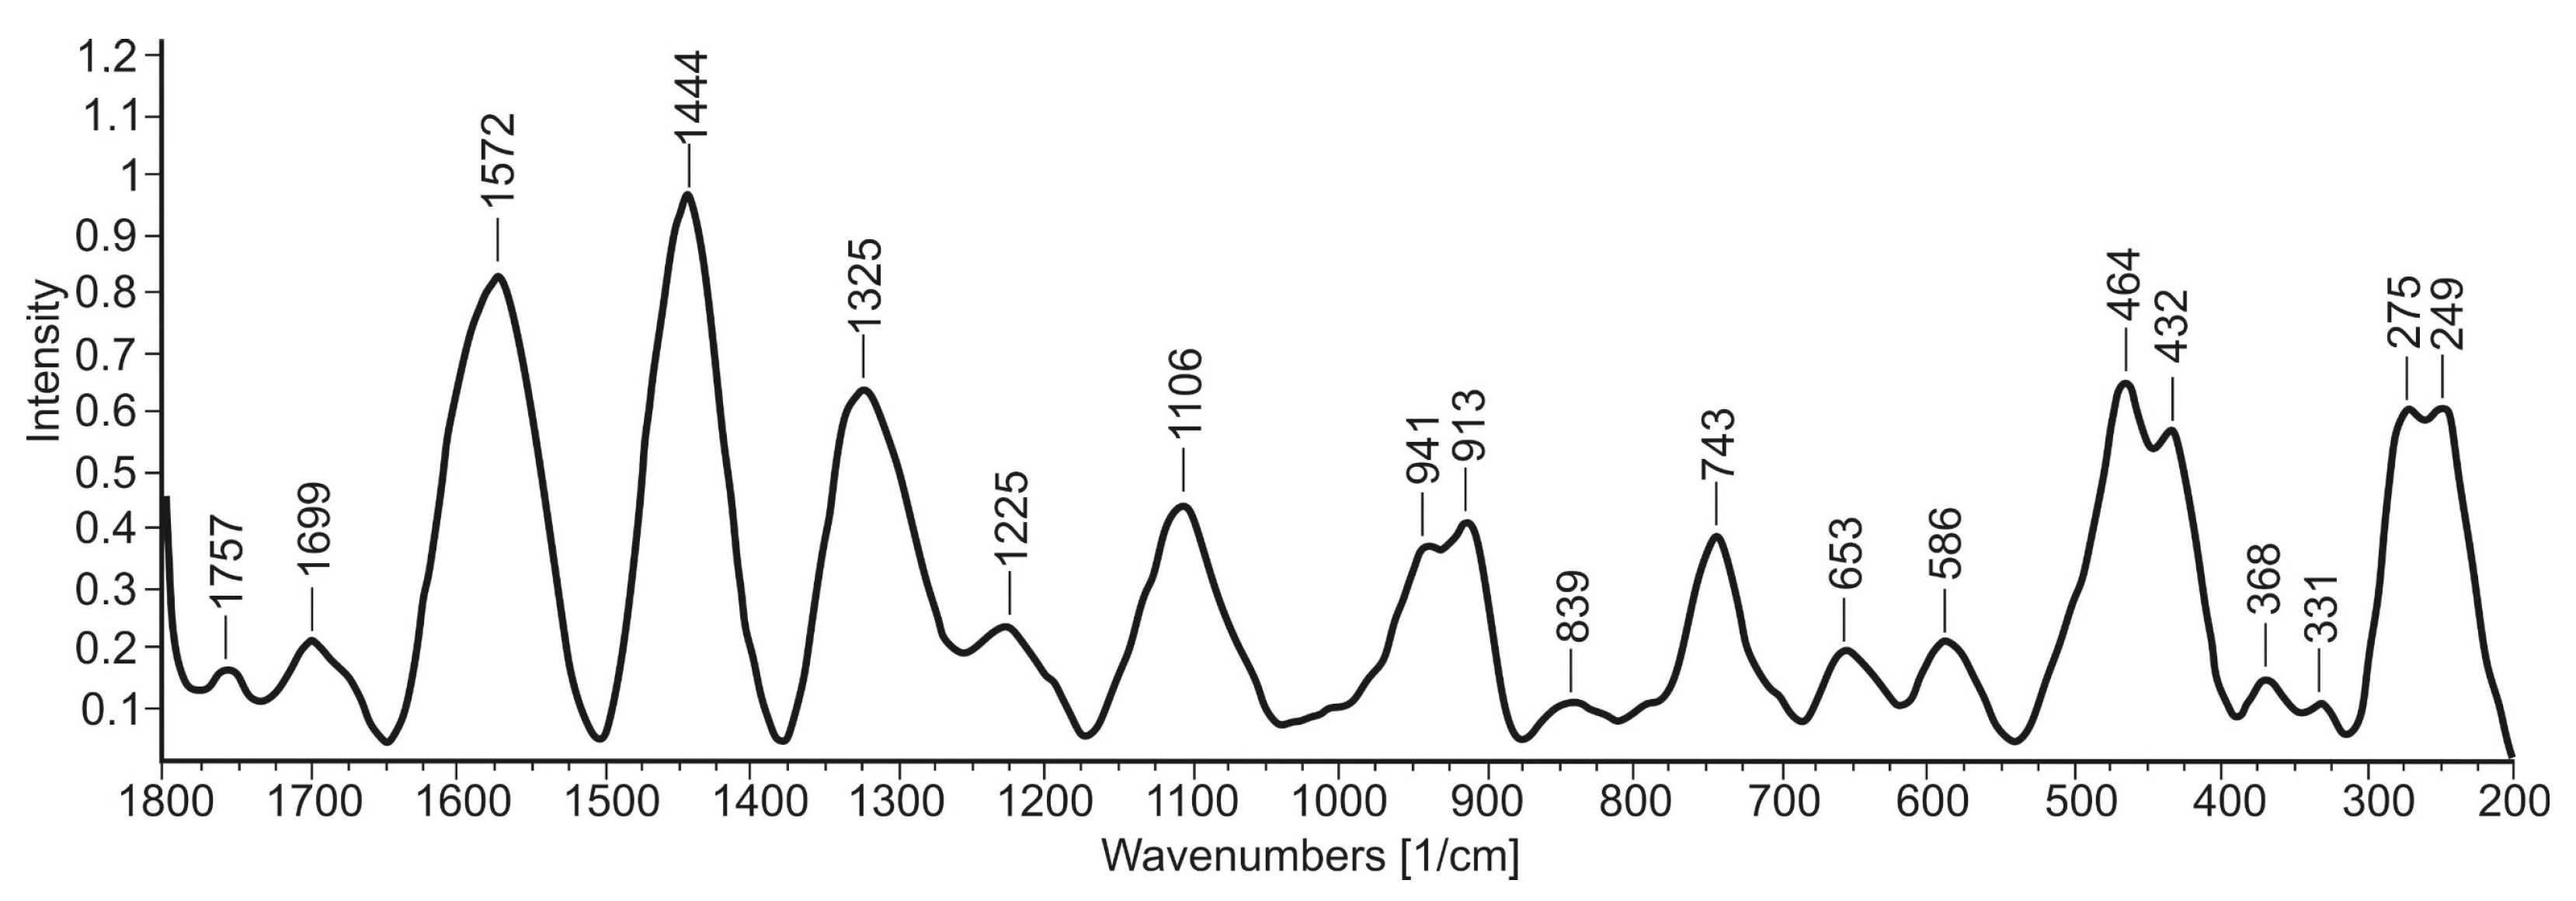
The average Raman spectrum of the “miloschite” exhibited the main bands which indicate the chemical composition of the investigated sample (
Figure 8). The higher-intensity bands were positioned at 1572, 1444, and 1325, in the regions from 470 to 430 and 280 to 247 cm
−1, indicating the highest chemical contributions inside the sample. Lower intensity bands positioned from 550 to 1250 cm
−1 indicated the presence of less abundant components. The predominant bands could be assigned to the Si–O and Al–O stretches characteristic of halloysite minerals.
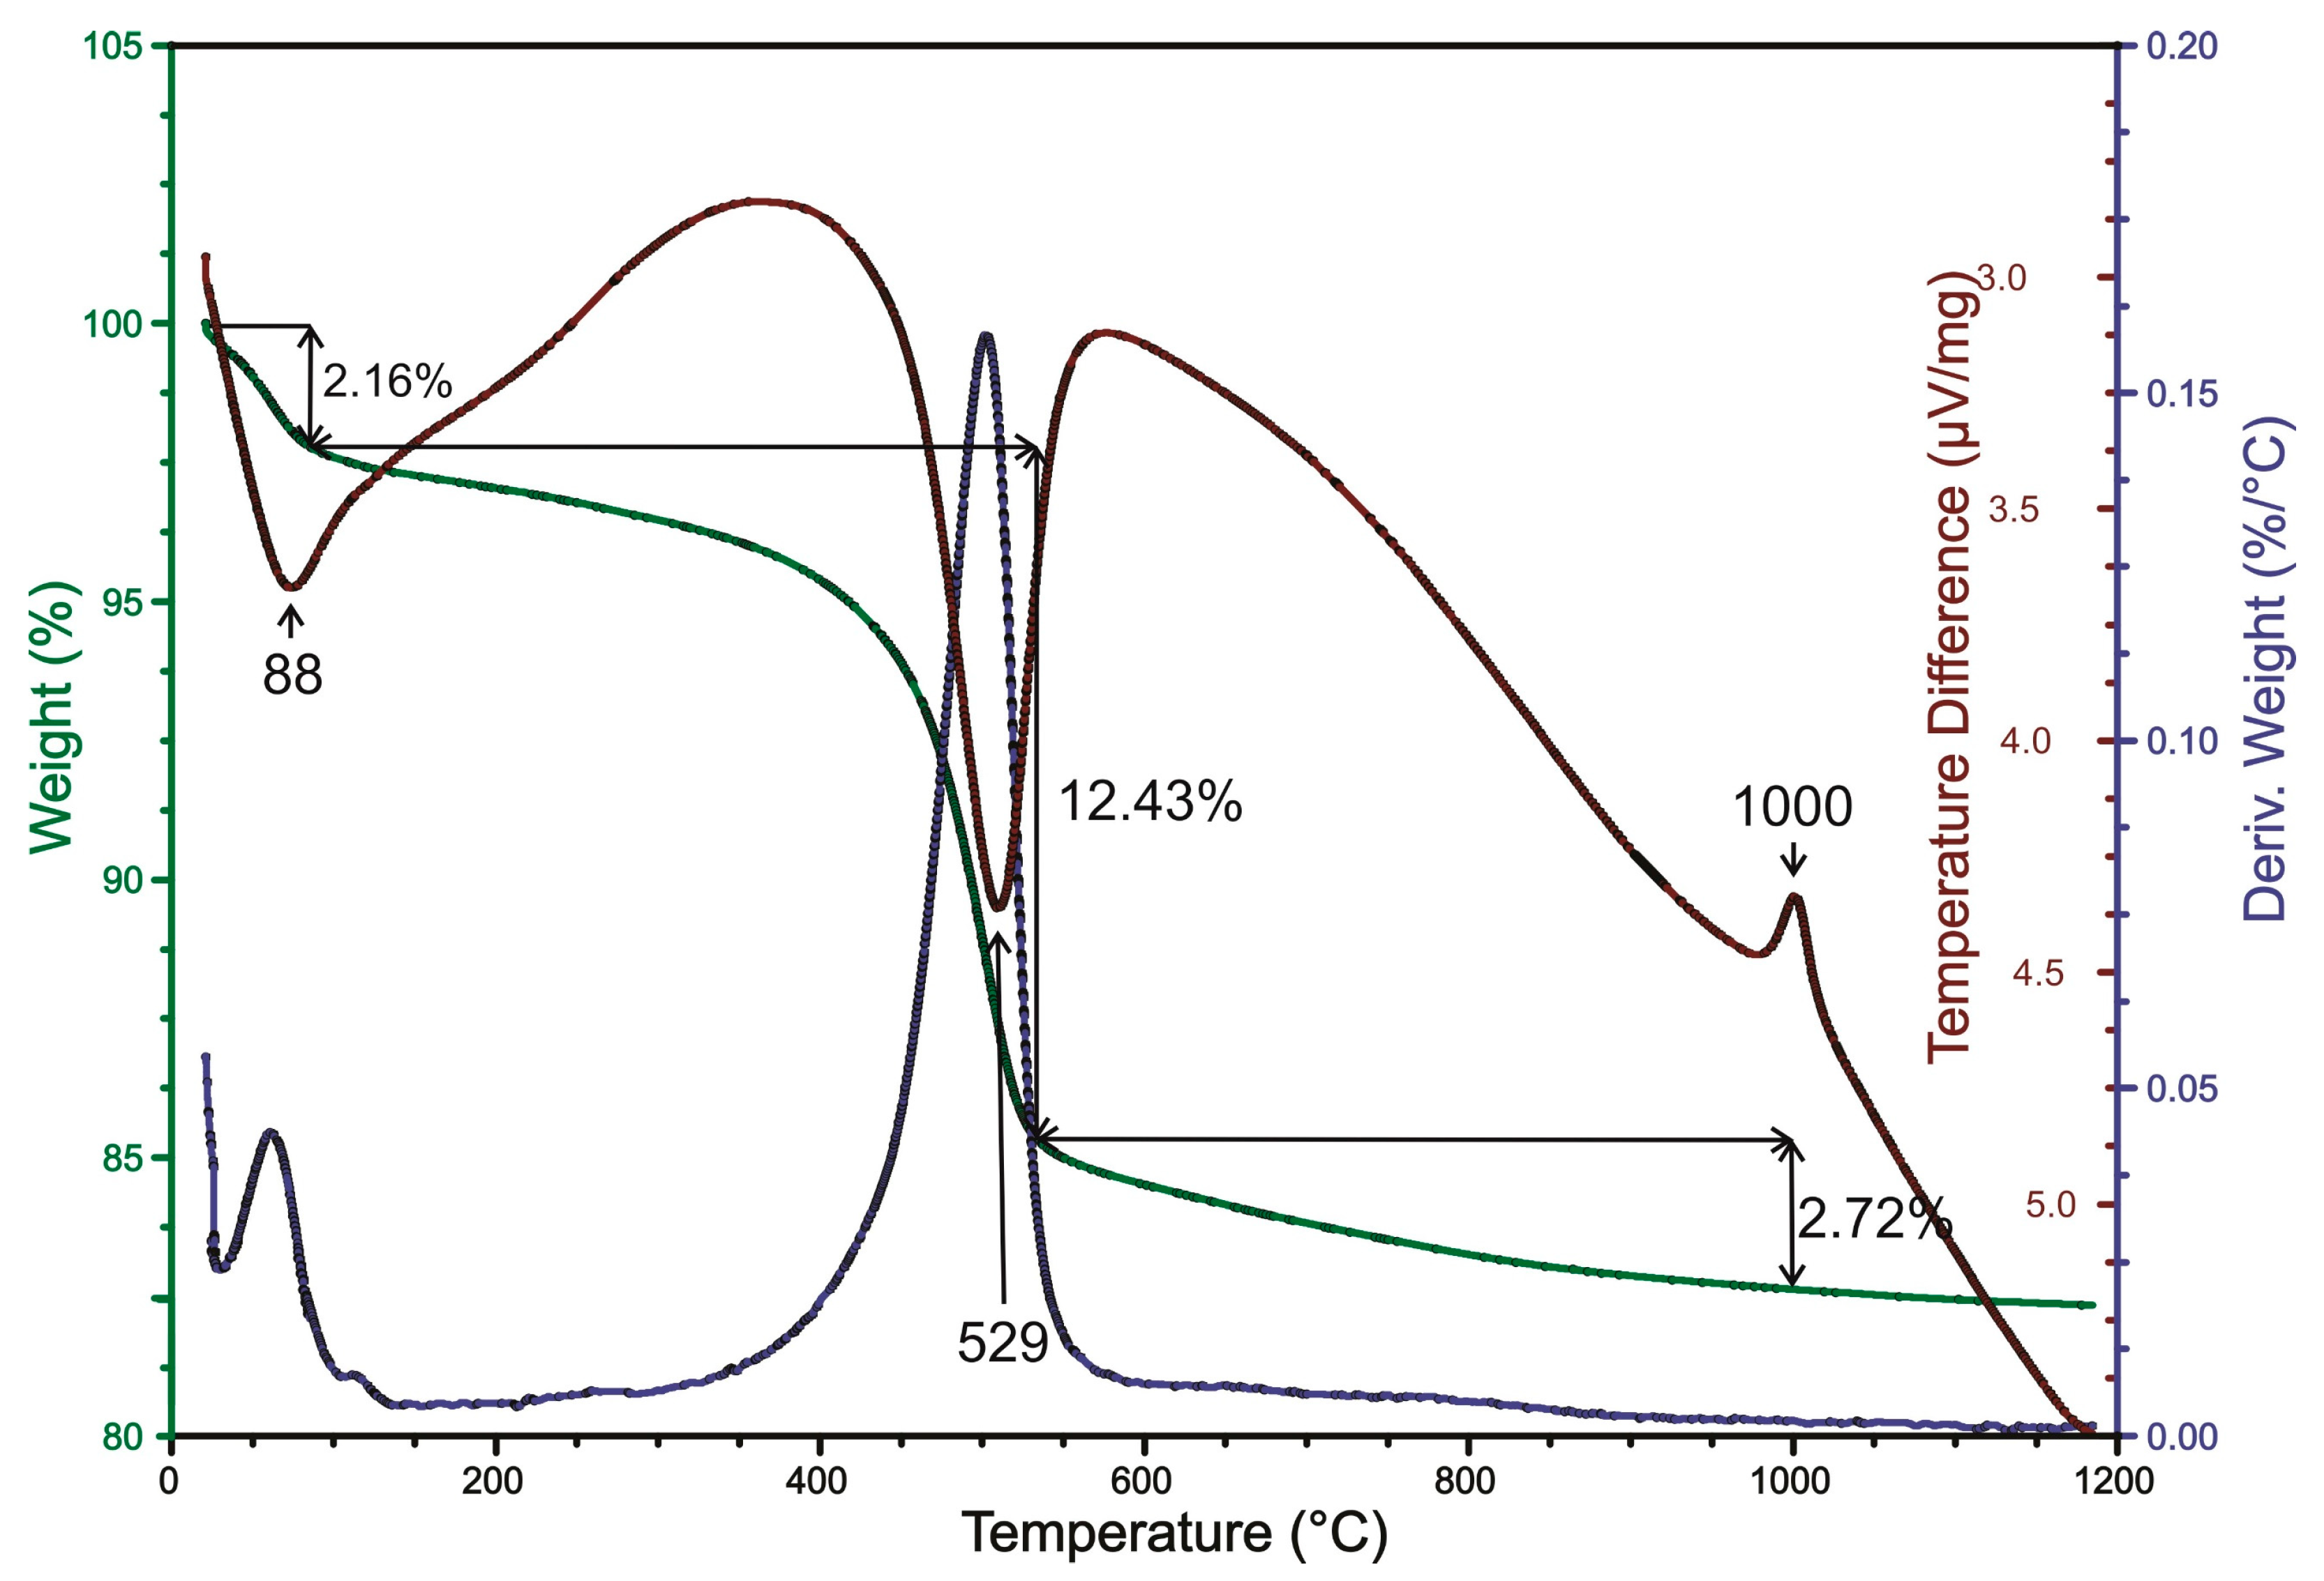
Thermogravimetric and differential thermal analysis (DSC-TGA) of the investigated sample of “miloschite” is shown in
Figure 9. A broad endothermic band at 88 °C and a highly pronounced endothermic band at 529 °C, together with an exothermic band at 1000 °C, were noted in the sample. A broad band with a center at 88 °C was observed to have a mass loss of 2.16% measured at 100 °C.
The cation exchange capacity (CEC) of the sample, assessed following methylene blue (MB) saturation, was found to be 15.4 meq/100 g. Additionally, the specific surface area (SSA) was recorded at 120.6 m2/g, highlighting the extensive surface available for chemical interactions.
The results of color measurements correspond to a light shade of blue. The measured and calculated dominant color, after three probes, was 489 nm with color purity of 10.42% and falls into the blue area of the color spectra. After comparison with Munsell cards [
31], the color of the sample was found to be between two cards with color codes 5BG6/6 and 5B7/6, corresponding to light blue-green and light blue, respectively. Its hexadecimal code is identical to the powder blue or very soft cyan (#b0e0e6) color. Although, due to the purity of the color of the investigated raw sample (10.42%), it is of a lighter shade than the hexadecimal standard.
5. Discussion
According to the previously reported chemical analyses of “miloschite” [
6,
10,
11,
18], it is composed of alumina (28–35 wt%) and silica (42–52 wt%) as its main constituents, along with chromium oxide (3–10 wt%), iron oxide (0.3–1.3 wt%) and magnesium oxide (0.4–0.6 wt%), together with a higher percentage of water (13–17%), which is in good accordance with the results obtained for the investigated sample (
Table 1). A higher chromium content was also observed in some illites and smectites from Serbia and former Yugoslavia, where it was reported that these clays contain as much as about 14 wt% Cr
2O
3, whereas in some halloysites, the content of Cr
2O
3 reaches up to 11.5 wt% [
21,
32]. The calculated mass ratio for SiO
2/Al
2O
3 of the investigated “miloschite” sample can generally be found in raw halloysites and indicates that the sample consists primarily of clay minerals, which coincides with the literature data [
33]. The difference from the theoretically pure halloysite (the theoretical mass ratio for SiO
2/Al
2O
3 is 1.18) can be attributed to the presence of quartz mineral and other impurities, which is in good agreement with the XRD results of the miloschite sample. Chromium-containing halloysite, exhibiting 0.59% Cr
2O
3, has been investigated and identified by Gritsaienko and Grum-Grzhimailo [
34] in the Aydirlinsky contact-karst nickel deposit located in the southern Urals of Russia. Furthermore, Cr-bearing halloysite has also been confirmed in the Soussaki area of Greece [
35], where ultramafic rocks underwent alteration due to post-volcanic activity and associated hydrothermal fluids. In this area, the average Cr
2O
3 content reaches 4.3%. The researchers found that chromium cations are not only homogeneously distributed at the microscale and nanoscale but also occupy octahedral sites within the clay structure. In addition, Kutsevol [
36] has reported a notable presence of chromium-containing halloysite in the weathering crust of the Derenyukhinskiy gabbro-peridotite massif in Ukraine, with Cr
2O
3 concentrations reaching up to 2.47%.
Chromium-containing kaolinite has been identified in various locations, showcasing significant levels of Cr
2O
3. Notably, samples from Ely, Nevada, USA, exhibit an average Cr
2O
3 content of 3.85%, as reported by Wherry and Brown [
13]. In Japan, Sudo and Anzai [
37] documented the presence of chrome-containing kaolinite in multiple sites, with Cr
2O
3 contents measuring 1.12% and 0.41% from Urakawa-mati in Shizuoka Prefecture and the Mitake mine in Yamaguchi Prefecture, respectively. In California, USA, Cr-bearing kaolinite samples formed under hydrothermal conditions have been described by Brookins [
19] and Mosser et al. [
38]. Brookins calculated Cr
2O
3 contents of 1.19% and 1.08% in his samples, while Mosser et al. [
38] characterized two additional Cr-bearing kaolinite samples with conventional hexagonal shapes. Their EDX analysis revealed Cr
2O
3 levels of 2.1% and 0.6%. Further, Singh and Gilkes [
39] investigated Cr-containing kaolinites from Toodyay, Australia, which developed through the lateritic weathering of chromium muscovite, incorporating approximately 1% Cr
2O
3. Additionally, chromium-rich kaolinite, with an average Cr
2O
3 content of around 0.6%, has been found in the argillic zone adjacent to an epithermal sulfide vein within ultramafic rocks near Teslić in Bosnia and Herzegovina [
21].
The EDS map showed that Cr (chromium) is evenly distributed on the microscale. Chromium is not present as a chromium-rich impurity but as a substitution in the mineral structure, so it can be assumed that chromium fills octahedral sites within the clay lattice. This conclusion was also reached by Maksimović et al. [
21] in their investigation of chromium-bearing dickite and chromium-bearing kaolinite from Teslić, former Yugoslavia.
Similar positions and intensities of peaks have been established previously on “miloschite” samples characterized as Cr-halloysite [
18,
32] and on a Cr-halloysite sample from Crommyonia, Greece [
35]. Because halloysite does not have a platy habit, it cannot be oriented in such a manner to enhance the intensity of basal reflections [
26]. That is the main reason why halloysite’s 00l peaks are relatively weak in oriented mounts, which would not be the case with other clay minerals.
Typical values of unit cell parameters for kaolinite (the values in the reference [
40] is taken as an example) are:
a = 5.1554(1),
b = 8.9448(2),
c = 7.4048(2) Å,
α = 91.7(2),
β = 104.862(1),
γ = 89.822(2)°, while typical values of unit cell parameters for halloysite (the values in the reference [
41] is taken as an example and used as starting model for lattice parameter refinement of “miloschite“) are as follows:
a = 5.1616(6),
b = 8.8304(10),
c = 7.5032(8) Å,
α = 93.992(12),
β = 104.526(12),
γ = 89.661(10)°. The values of the unit cell of “miloschite“ in this work, after lattice parameter refinement, are as follows:
a = 5.28(11),
b = 8.96(19),
c = 7.56(17) Å,
α = 94.1(10),
β = 104.3(4),
γ = 89.6(6)°. Calculations showed that the volume of the “miloschite“ unit cell increases by about 4.8% when chromium ions are incorporated into the halloysite crystal structure (ionic radii of octahedral Cr
3+ and Al
3+ are 0.615 and 0.535 Å, respectively [
42]).
Halloysite presents a diverse range of morphologies influenced by its crystallization processes and geological origin. These morphologies cover short tubular, spheroidal, platy, and elongated tubules, with the latter being the most frequently observed form [
43]. Notably, tubular shapes primarily occur when halloysite forms from the alteration of feldspars and micas, although this shape may also arise from the transformation of platy kaolinite particles [
39,
43,
44]. The analyzed sample of “miloschite“shows a strong correlation with findings from the literature, particularly the work by Joussein et al. [
43], which indicates that the presence of tubular shapes is a definitive characteristic of halloysite minerals.
According to Mosser [
38], vibrational bands of Si-O-Si and Si-O-groups are visible in the range between 690 and 1150 cm
−1, where the band at 915 cm
−1 and its smaller shoulder at around 938 cm
−1 corresponds to Al
2OH bending vibrations. This band is visible in the spectra at a close value with a center at 912 cm
−1. A band observed at 3585 cm
−1 represents a characteristic that is observed with halloysite minerals [
38]. Maksimović et al. [
21] have attributed this band to OH-stretching vibrations of the octahedral grouping AlCrOH. This additional band has also been noted in the IR spectra of “miloschite”, from California, by Mosser et al. [
38]. Petit et al. [
45] calculated the position of the δAlCrOH vibration band for “miloschite” and stated that this vibrational band would be located at about 900 cm
−1, overlapping with the δAl
2OH band (915 cm
−1). The location of this band has also been observed in the spectra of Cr rich halloysites together with bands at 792 and 749 cm
−1, which reflect the presence of Cr in octahedral sites [
32,
35].
Doublets that occur at 1395 and 1412 nm, and 2160 and 2208 nm when observing the VIS-NIR spectra, alongside the appearance of an additional band as a shoulder on the longer wavelength, are the major distinctive bands that can be assigned to halloysite [
46]. The analyzed sample is classified as halloysite due to its spectral characteristics being similar to those reported by Bowitz and Ehling [
46]. It can be easily distinguished from well-ordered kaolinite, as it exhibits a prominent band at 1912 nm that is associated with a water feature in halloysite. This observation aligns with the existing literature [
46].
According to Kloprogge [
47], kaolin group minerals, such as kaolinite and halloysite, exhibit similar Raman patterns, although there are small shifts in position, while the intensities show significant differences. The band at 249 cm
−1, related to a mixture of silicon-oxygen deformation and OH vibration, is indicative of kaolinite and halloysite [
48]. The band at 275 cm
−1 is a combination of silicon-oxygen deformations and octahedral sheet vibrations, according to Kloprogge and Frost [
49], originating from halloysite. Three vibrations observed between 300 and 500 cm
−1 (
Figure 8) represent H-bonded H
2O (331 cm
−1), Al-O stretch (432 cm
−1) and Si-O bend (464 cm
−1) can be assigned to halloysite and correspond to the two hydroxyl stretching modes around 3556 and 3598 cm
−1 [
49]. According to Kloprogge [
47], halloysite is characterized by an intense band at 465 cm
−1 accompanied by much weaker bands at 503 and 540 cm
−1. In the region below 700 cm
−1, the spectrum of aluminum atoms shows a broad band between 580 and 670 cm
−1 [
50]; there could be bands at ~653 and 586 cm
−1 (
Figure 8). The bands in the region from 700 to 800 cm
−1 for kaolinite and halloysites are associated with Al–O–Si vibrations, some of which involve structural OH groups [
48], or only one broad band positioned at 743 cm
−1 could indicate Al–O–Si vibrations [
51]. According to Kloprogge [
47], the associated libration mode of the inner Al—OH groups has been observed at 910 cm
−1, but a second band can also be observed at 944 cm
−1, which is ascribed to the inner surface Al-OH libration mode. These bands are observed in the investigated sample at 913 and 941cm
−1 (
Figure 8). Slight differences in the position of the bands could be associated with some differences in the crystal structure between the reported and investigated sample. For halloysite, it is reported that a stronger band at ~913 cm
−1 with a lower intensity shoulder at ~941 cm
−1 should be noted [
48,
49,
50,
51], and this was confirmed in the investigated sample of “miloschite”. The Si–O–Si vibration modes give intense bands in the IR spectra and a medium intensity band in the Raman spectrum in the region from 1000 to 1200 cm
−1, where halloysite could give only a single band [
49,
52], observed as a broad band at ~1110 cm
−1.
An endothermic band at 88 °C and at 529 °C, together with an exothermic band at 1000 °C, indicates the presence of halloysite, kaolinite and/or disordered types of kaolinite (“fire clay”) [
14,
15]. According to the analysis of Grim and Rowland [
14], which was performed on the sample of “miloschite” from Rudnjak, Serbia (U. S. Nat. Mus., No. 48649), there was an indication that the sample was of kaolinite and/or a halloysite structure. The initial endothermic peak at around 529 °C is broader, indicating that the clay material was halloysite mixed with another mineral, such as Fe-hydroxides and/or kaolinite, which follows observations made by Grim and Rowland [
14]. Foldvari [
53] states that halloysite bands fall between 40 and 200 °C (dehydration), ~560 °C (endothermic: dehydroxylation), and 900 and 1000 °C (exothermic—a transformation from amorphous metahalloysite into crystalline phases). Halloysite has two major reactions: between 530 and 590 °C (endothermic with mass loss of 12.43%), corresponding to dehydroxylation, and between 900 and 1000 °C (exothermic), corresponding to transformation into crystalline phases, primary mullite, or pseudomullite [
53]. Based on the analyzed peak positions of the investigated sample of “miloschite”, there is strong evidence to suggest that the sample is halloysite.
According to Maksimović and White [
32], cation exchange capacity values of Cr-halloysites from Rudnjak are between 21 (with 3.02% Cr
2O
3) and 22 meq/100 g (with 5.78% Cr
2O
3). The difference between the obtained results and the literature data may be attributed to the fact that the former investigation was conducted using the standardized ammonium acetate method [
32], which yielded slightly higher results compared to the methylene blue method. The lower CEC values are attributed to the larger size of MB molecules and their influence on adsorption, together with a higher concentration of dimers in the solution [
54]. Halloysite has been regarded as a low-activity clay, although its CEC has been measured to be as high as 20–60 cmol×kg
−1 [
43,
55,
56]. The specific surface area (SSA) of halloysites varies greatly and ranges from 50–60 m
2×g
−1 found in New Zealand and Australia [
43], while Birrell et al. [
57] have reported a value for SSA as high as 137 m
2×g
−1 for their sample of halloysite from New Zealand derived from volcanic ash. These values are greater than those that are reported for kaolinites (5–39 m
2×g
−1) [
43]. The high value of 120.6 m
2×g
−1 measured for the investigated sample corroborates the findings of the other methods, which indicate that the sample is halloysite. However, the difference between the reported values [
43] and those presented in this work is highly dependent on experimental conditions and sample preparation.
Rhodes and Hopper [
58] state that low percentages of iron oxide (0.5%–1%) combined with potassium will produce light blue or light blue-green in reduction. The content of iron oxides in the sample corresponds to around 0.5% and 0.01% of potassium oxide could yield a light blue or light blue-green color, while chrome oxide, present with around 7.6% in the sample, could contribute to the blue component in the measured color. Maksimović and White [
32] and Maksimović et al. [
21] stated that Cr
3+ to Al
3+ substitution in chromium-bearing halloysite gives rise to a blue color in samples.
Generally, halloysite, with its exceptional properties and availability, demonstrates significant potential for a wide range of applications for the development of both traditional and advanced ceramics, as well as ceramic composites, nanofillers, polymers, agricultural materials, and medical and cosmetical products [
59,
60,
61,
62,
63,
64,
65,
66,
67,
68]. Future work is needed to determine if “miloschite” has crucial parameters for applications in various industries.

