Article

Application of BEMD in Extracting Gravity Anomaly Components Showing Deep Ore-Forming Dynamic Background of Jiaodong Gold Cluster Region

1
School of Earth and Minerals, China University of Geosciences, Beijing 100083, China
2
Sinomine Resource Group Co., Ltd., Beijing 100089, China
*
Author to whom correspondence should be addressed.
Minerals 2025, 15(11), 1159; https://doi.org/10.3390/min15111159
Submission received: 29 September 2025 / Revised: 28 October 2025 / Accepted: 31 October 2025 / Published: 2 November 2025

Abstract

The Jiaodong gold cluster region (JGCR) at the southeastern edge of the North China Craton (NCC), holding approximately 5000 t gold reserve, is the third largest gold cluster region in the world. The Bidimensional Empirical Mode Decomposition (BEMD) is applied in extracting gravity anomaly components showing deep geological architectures and geodynamics. The research results illustrate that (a) at a depth of about 27 km, there are three tectonic units, namely the mantle uplift (I) with gravity values ranging from 2 to 14 μm/s2, a mantle depression (II) with gravity values varying from 0 to −13 μm/s2, and a mantle flat (III) with gravity values ranging from −2 to 2 μm/s2. All giant gold deposits are distributed within the mantle depression. This implies that mantle uplift can trigger the concentration of hot, ore-forming fluids in mantle depressions, leading to the accumulation of large amounts of gold and the formation of giant deposits. (b) At about 17.1–12.5 km, there are three tectonic units: the Jiaolai–Jiaobei mantle uplift (I), showing a strong positive gravity anomaly with gravity values ranging from 1.5 to 10 μm/s2, the Sulu ultra-high pressure metamorphic block (II), displaying a negative gravity anomaly with gravity values ranging from −10 to −1.5 μm/s2, and the Jiaoxibei gold cluster region (III), exhibiting gravity background with gravity values varying from −1.5 to 1.5 μm/s2. (c) At about 8.9–5.3 km, there are a series of positive and negative gravity anomalies. Most granites with low density display negative gravity anomalies, among which there are some negative anomalies with positive anomalous edges which contain gold deposits. This illustrates an ore-forming pattern, a granite with negative gravity anomaly, around which there is alteration mineralization with positive gravity anomaly. Combined with other studies, it was concluded that the geological architectures at different depths as and the giant Jiaodong gold cluster region were formed by the asthenosphere upwelling triggered by NNW-ward subduction of the Izanagi Plate over a time period of approximately 200–100 Ma.

1. Introduction

The Jiaodong gold cluster region with approximately 5000 t of gold reserve, located at the southeastern edge of the North China Craton, is the third largest gold cluster region in the globe [1,2,3,4] (Figure 1). The Yanshanian orogen defines the Jurassic-Cretaceous active continental margin of Eurasia plate, characterized by subduction of the paleo-Pacific plate below a late Paleozoic-early Mesozoic amalgamation of a series of ancient cratonic fragments. The metallogenic effects of the subduction were recorded as far as 1000–2000 km to the west of the Izanagi trench in mainland China [5,6]. Approximately one-third of China’s gold resources are located in the eastern North China block bounded by the Tan-Lu transform fault system [7]. The giant Jiaodong gold ore cluster (Figure 1), formed between 135 and 115 Ma, shows a remarkable spatial correlation with asthenospheric upwelling triggered by NNW-directed subduction of the Izanagi Plate from approximately 200 to 100 Ma [8,9].
These late Yanshanian gold deposits are related, in some ways, to hydrothermal events during the rapid exhumation of mid-crustal rocks through the ductile–brittle regime during the rollback of the Izanagi slab, whereas the genetic model for these ore deposits remains equivocal [8,13]. Thus, a mantle depression within a compressional regime—produced as mantle uplift was triggered and governed first by oblique subduction and later by rollback of the Izanagi slab—may have focused massive fluid flow, leading to the formation of the giant Jiaodong gold ore cluster.
In this study, we aim to explore ore-controlling geodynamic factors in the formation of the giant Jiaodong gold ore cluster region by applying the bidimensional empirical mode decomposition (BEMD), extracting gravity anomaly components that show geological architecture at different depths in the study area [14].

2. Principle and Method of BEMD

The BEMD is used to decompose the original data [ O r i ( m , n ) ] into a finite number of BIMFs(Bidimensional Intrinsic Mode Function, BIMF) ranging from high-frequency to low-frequency data and residual data by iteratively sifting processes:
O r i ( m , n ) = i = 1 t B I M F i ( m , n ) + R e s ( m , n )
Each BIMF component reflects specific geological information in a frequency range of the original data. The residual (Res(m, n)) generally shows the background of the original data: the BIMFi with higher frequency shows usually the local anomaly triggered by mineralized processes, and the BIMFi with lower frequency shows generally the regional anomalies caused by geological processes such as sedimentation, magmatism, and metamorphism, among other factors.
Given gravity data, the local extrema are established by the eight-neighborhood connectivity in a two-dimensional sifting process, and the BIMFi is extracted by multiquadric surface interpolation [15]. The standard deviation (SD) is applied as a stopping criterion for BIMFs in the sifting process and is calculated as follows [16,17,18]:
S D i j = m = 1 n = 1 h j ( i 1 ) ( m , n ) h i j ( m , n ) 2 h j ( i 1 ) 2 ( m , n )
The SDij value determines the sifting performance; the ε is an empirical value that refers to the threshold of SDij; and the smaller value of ε means that more BIMFs could be decomposed. The 2D sifting process algorithm presented by [17,18] was improved in this study in envelope interpolation [15].
The index of orthogonality (IO) of any two BIMFs defined by Chen et al. (2019) can be calculated as follows ([15]):
I O = A b s p = 1 m q = 1 n B I M F i ( p , q ) B I M F j ( p , q ) B I M F i 2 ( p , q ) + B I M F j 2 ( p , q ) ,
where Abs denotes the absolute value operation. If the IMFs are orthogonal, the inner product should be equal to zero, that is, IMFi(t)∙IMFj(t) = 0. The orthogonality can be accepted if the IO is less than 0.05. A small IO indicates that the BIMF components are nearly orthogonal. Usually, the data length influences IO, and a longer data length corresponds to a smaller IO.
Different filters can be defined as high-pass, band-pass, and low-pass filters [19]. Some BIMF components representing a specific range of frequency structures can be chosen as the filters:
F H P ( m , n ) = i = 1 k B I M F i ( m , n )
F B P ( m , n ) = i = k p B I M F i ( m , n )
F L P ( m , n ) = i = p t B I M F I ( m , n ) + R e s ( m , n )
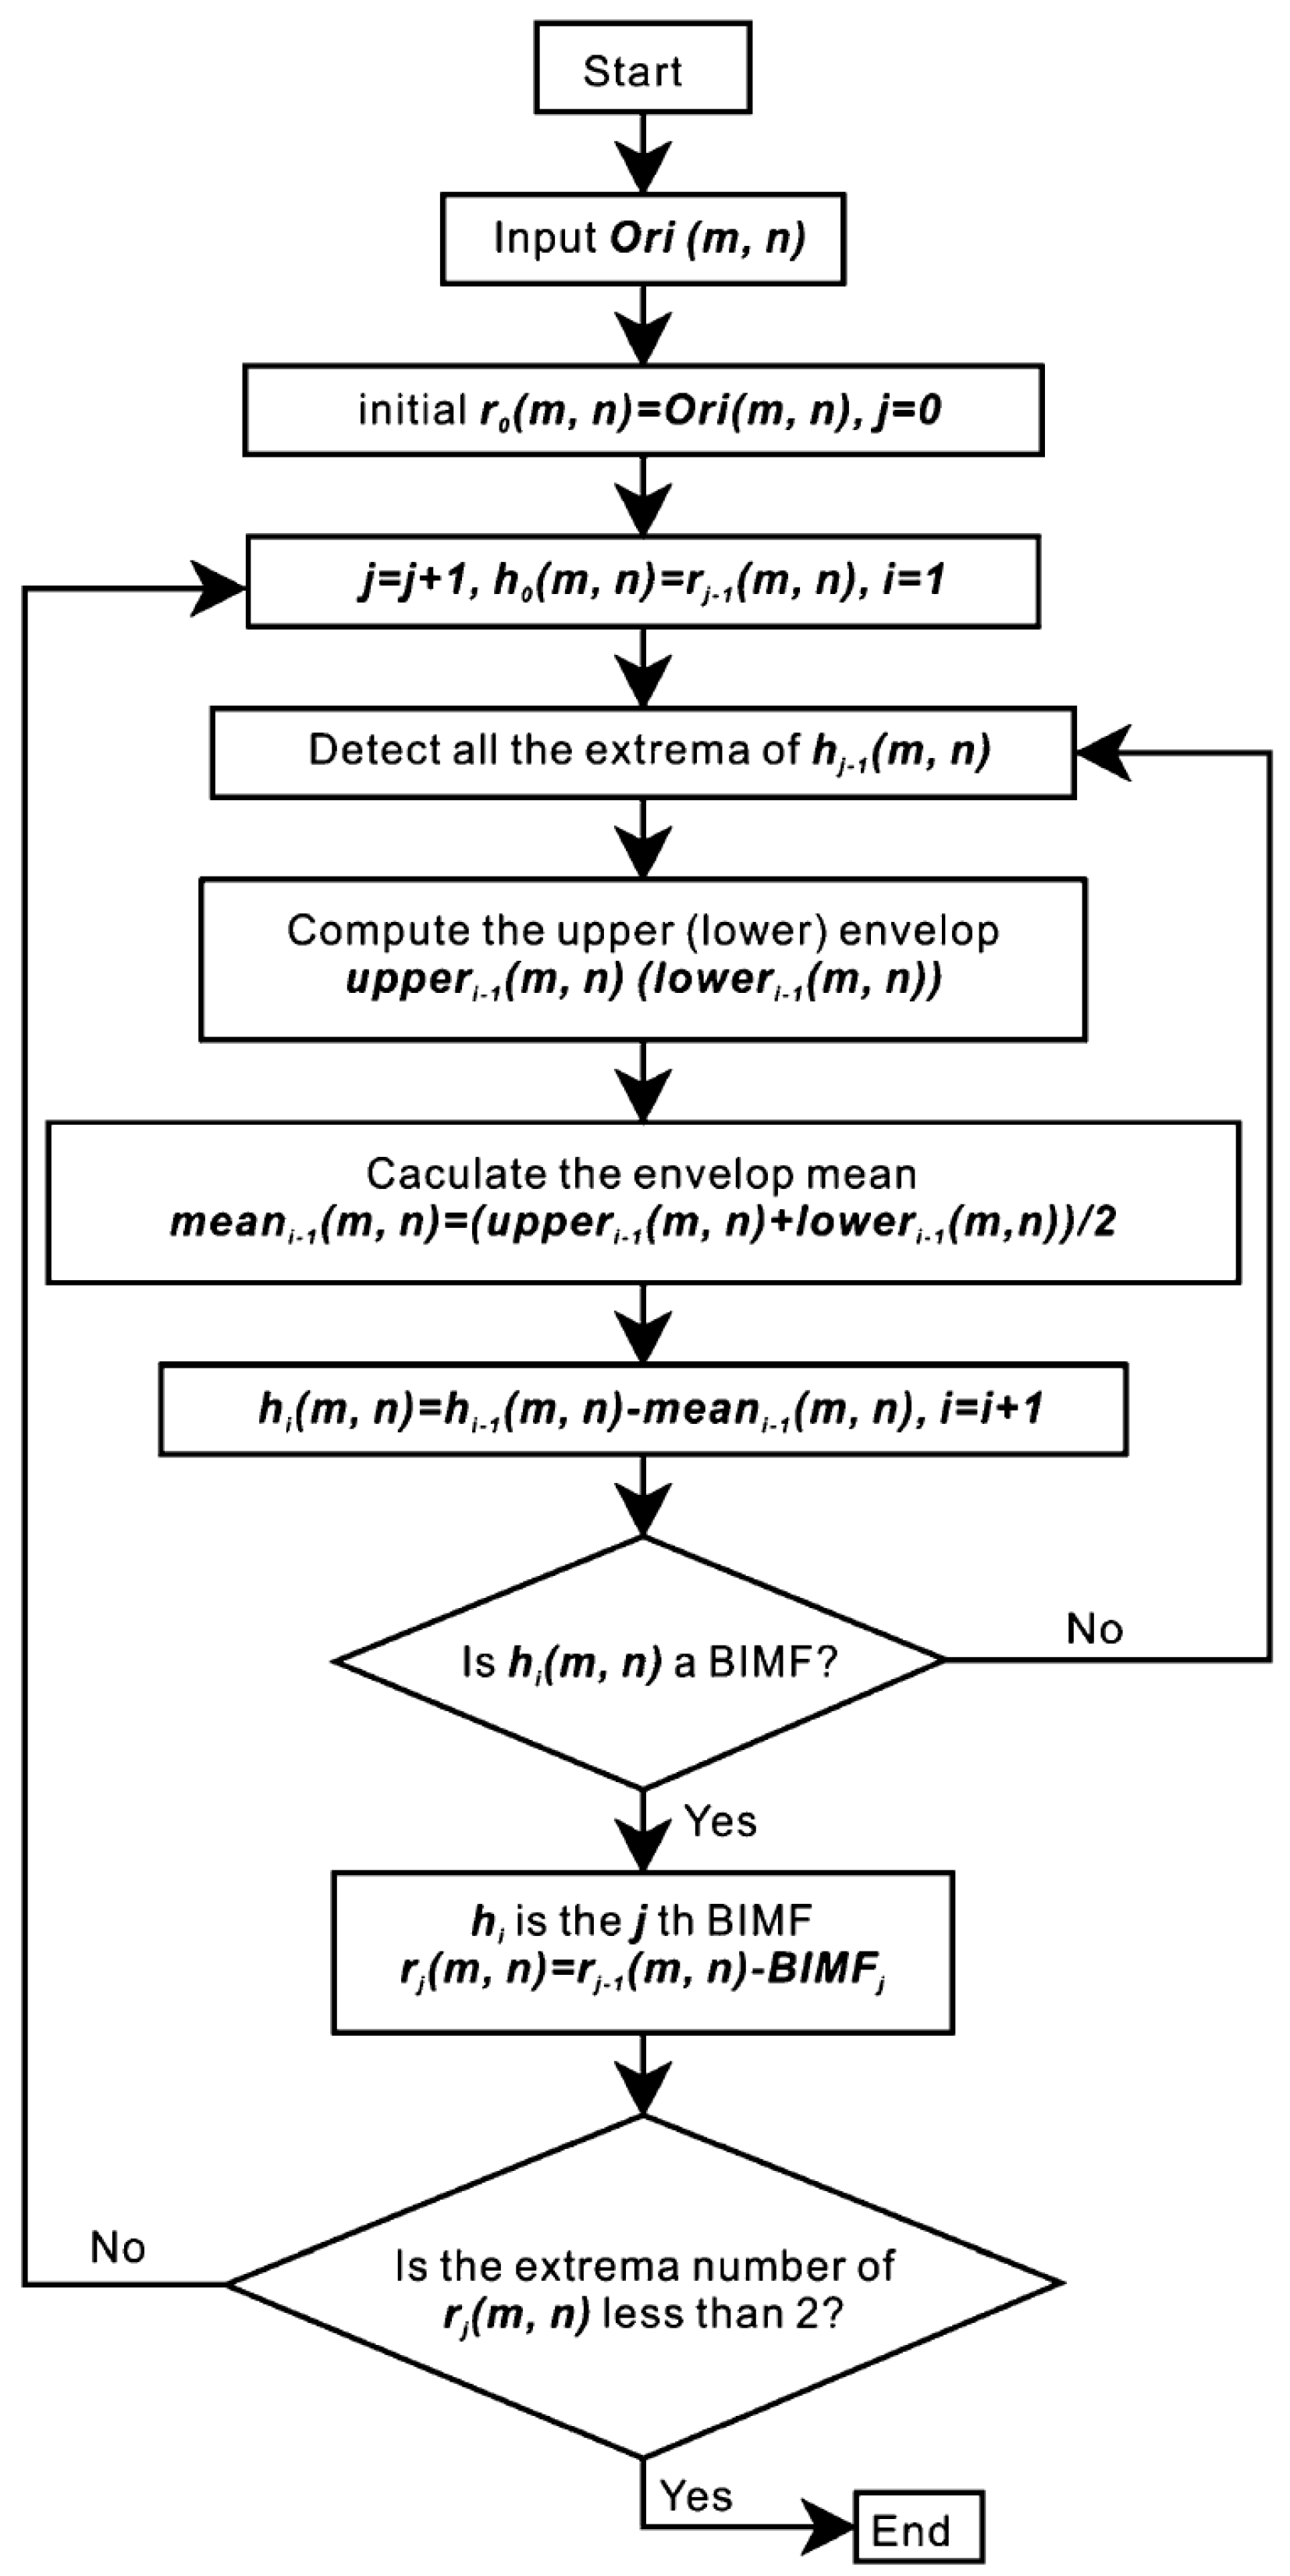
The 2D sifting algorithm used here—originally proposed in [17,18] and refined with improved envelope interpolation in [20]—proceeds as follows (Figure 2):
(1)
Initialization: r0(m, n) = Ori(m, n), and i = 1 is the BIMF index;
(2)
Extraction of the ith BIMF component:
(i)
Initialize and make h0(m, n) = ri−1(m, n), j = 1;
(ii)
Detect all the points of local upper (upperj−1) and local lower (lowerj−1) of hj−1(m, n), respectively;
(iii)
Compute the upper (lower) envelope of the local maximum and local minimum point, respectively;
(iv)
Calculate the envelope mean: meanj−1(m, n) = (upperj−1(m, n) + lowerj−1(m, n))/2;
(v)
hj (m, n) = hj−1(m, n) − mj−1(x, y), j = j + 1;
(vi)
hj(m, n) = BIMFi(m, n) if hj(m, n) matches the stopping criterion, then the ith BIMF is got, or
(vii)
Repeat steps (ii)–(vi);
(3)
ri (m, n) = ri−1(m, n) − BIMFi(m, n);
(4)
Go to step (2), when the number of extrema in ri(m, n) is more than 2, i = i + 1 or the decomposition is ended.

3. Extraction of Gravity Anomaly Components

3.1. Gravity Data Set and Gravity Field

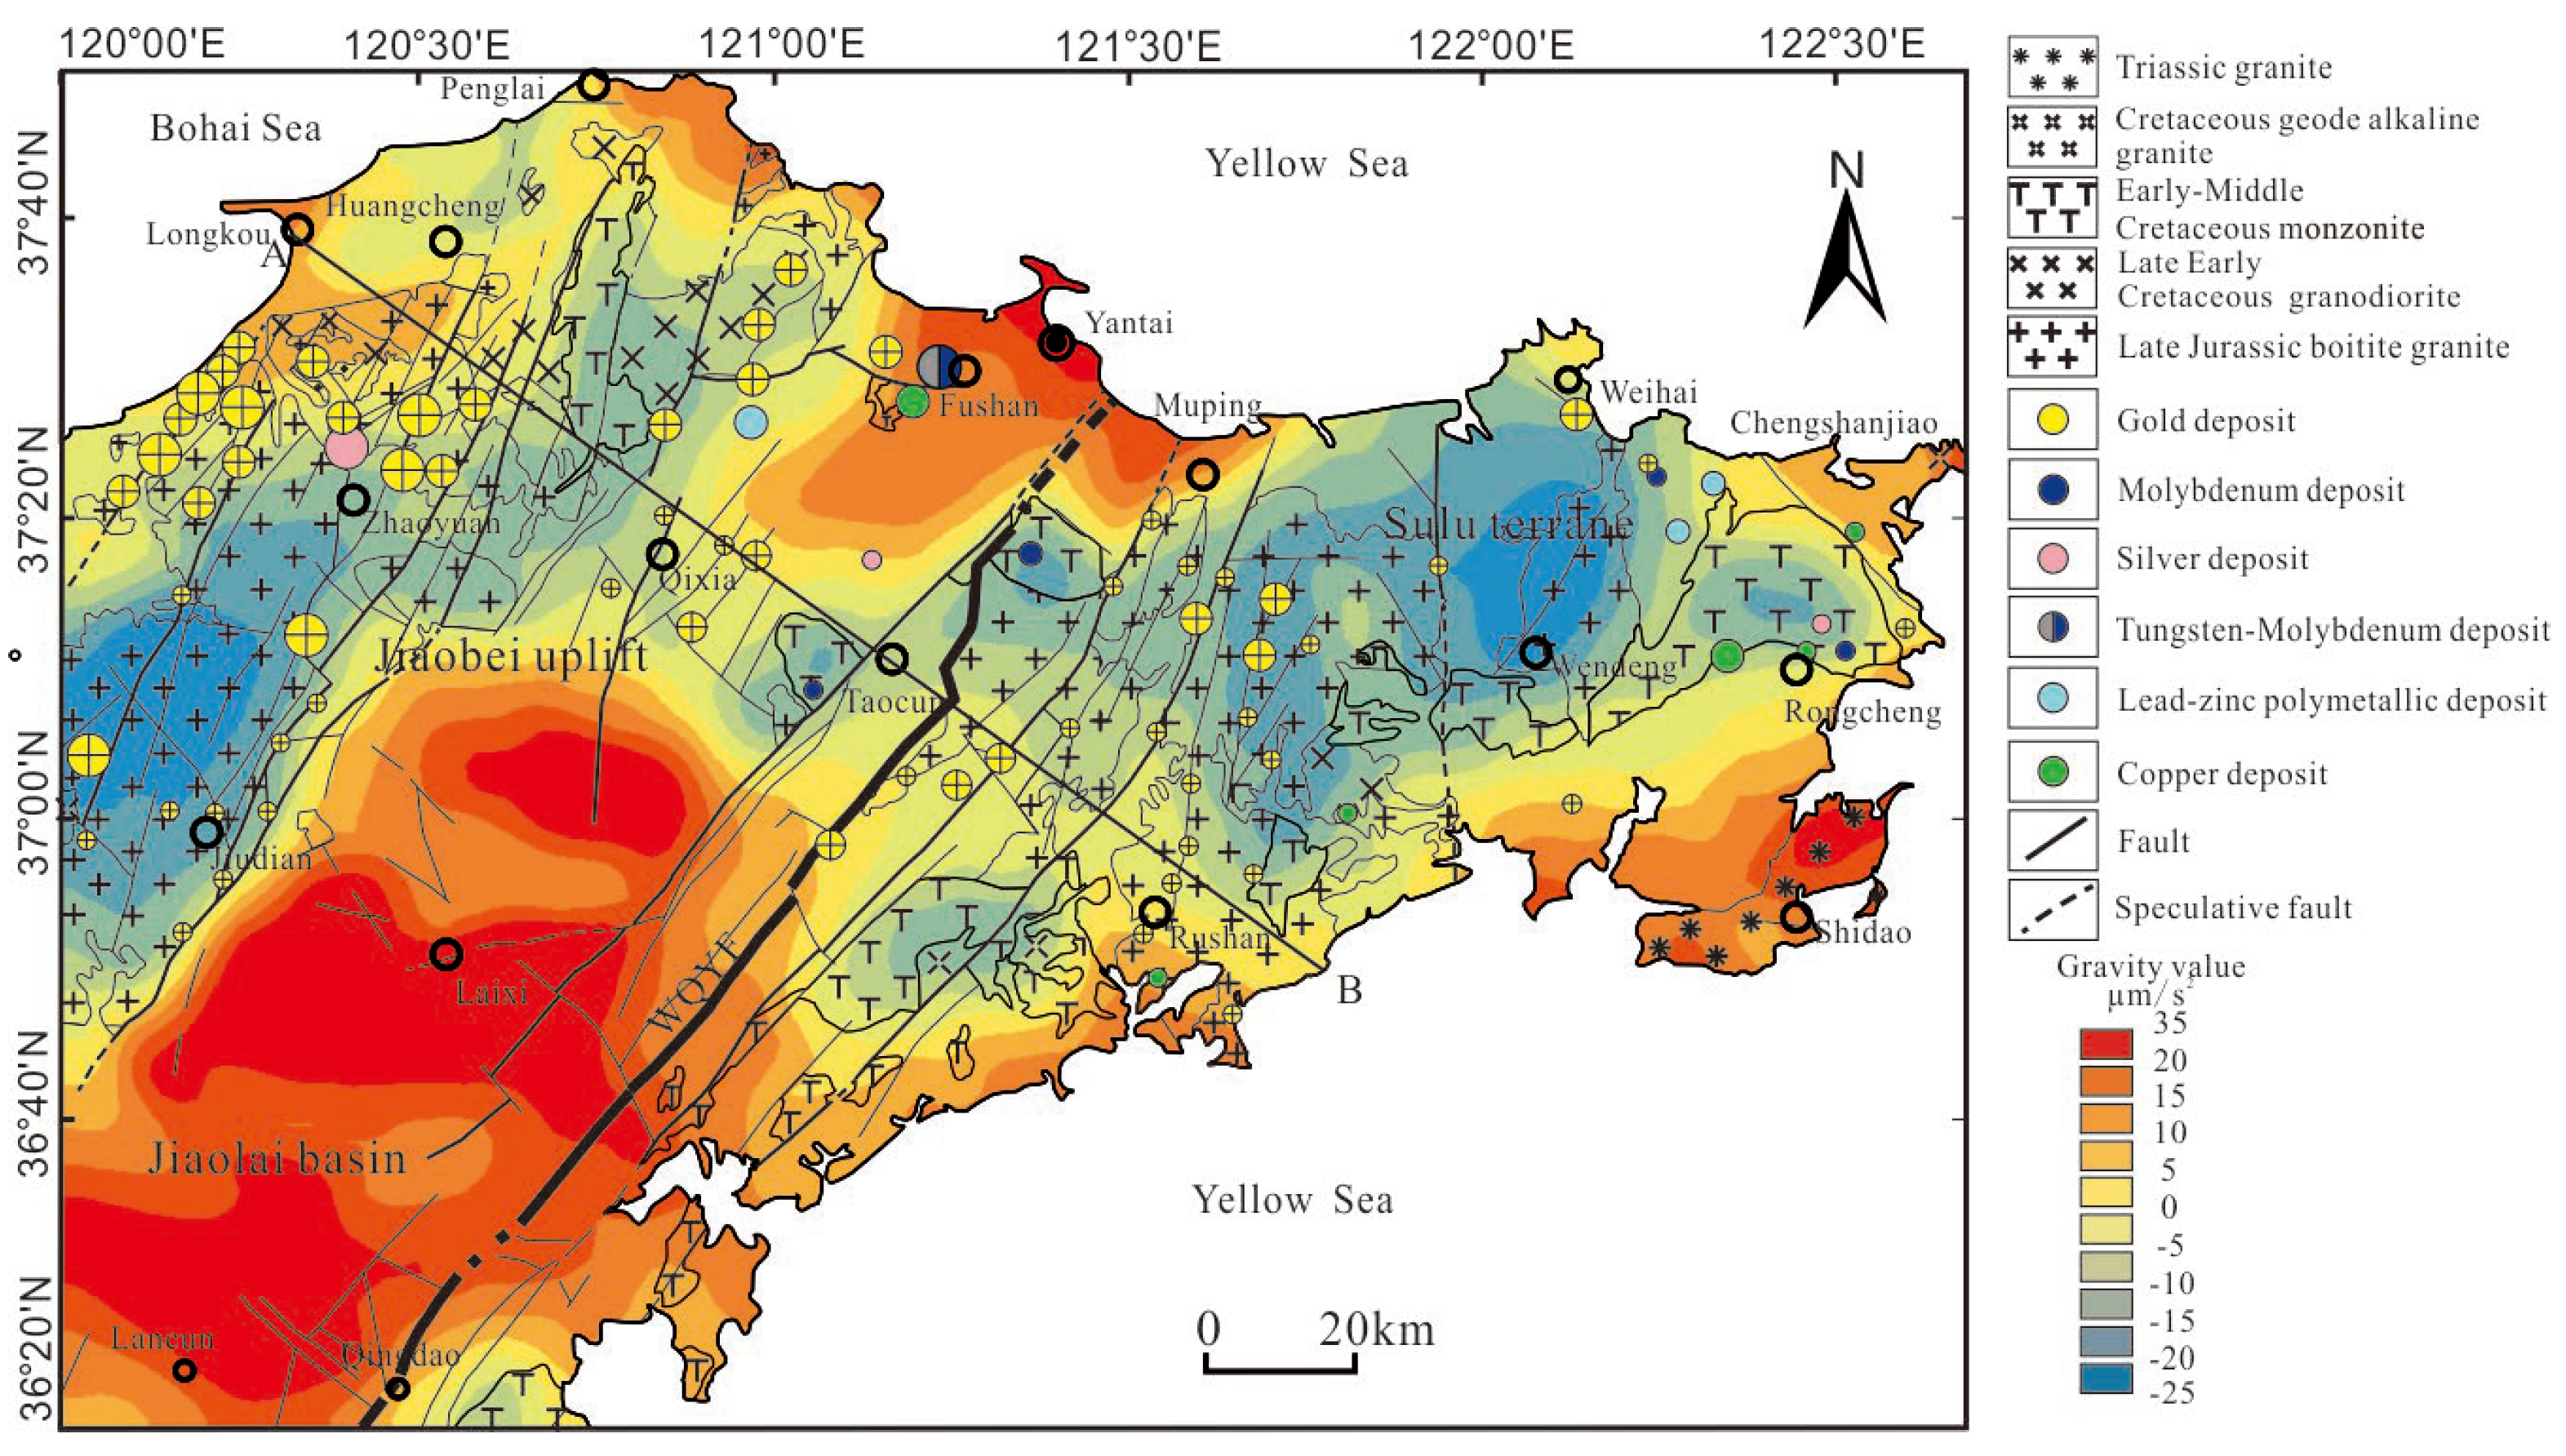
The gravity data measured on a grid of 2000 m × 2000 m, covering the Jiaodong gold cluster region (Figure 1), comes from the Shandong Geological and Exploration Institute. The total data resolution is ±2.32 × 10⁻⁶ m/s2. The Bouguer anomaly (Figure 2) illustrates overlapping gravitational features of geological units at different depths. The high gravity fields are generally distributed in the Jiaolai Basin—the Jiaobei uplift, Yantai–Fushan–Muping area, and Shidao area—with variation values ranging from 5 to 35 μm/s2. The low gravity fields mainly coincide with the Mesozoic granites, except for the Triassic Shidao granites, with variation values from −5 to −25 μm/s2. Additionally, the gravity fields distributed over the Mesozoic granites associated with the super-large gold deposits display higher values than those of granites of the same ages distributed in other areas (Figure 2).
The density of the exposed rocks and strata ranges from 2.60 to 3.30 g/cm3 (the average value 2.76 g/cm3) for the Archean rock group, from 2.50 to 3.30 g/cm3 (the average value 2.74 g/cm3) for the Proterozoic strata, and from 2.30 to 2.70 g/cm3 (the average value 2.62 g/cm3) for the Mesozoic strata. The exposed granitic plutons vary from 2.30 to 2.70 g/cm3 (the average value 2.60 g/cm3) for the Late Jurassic Linglong biotite granite, from 2.50 to 2.74 g/cm3 (the average value 2.65 g/cm3) for the Late Early Cretaceous Guojialing granodiorite, and from 2.53 to 2.70 g/cm3 (the average value 2.65 g/cm3) for the Early-Middle Cretaceous Weideshan monzonite, with an average value of 2.56 g/cm3 for pyritic sericite quartzite [22].
In this study, an SD = 0.05 is assumed for decomposition of the gravity data surveyed at a grid of 2000 × 2000 m, according to Equation (7), using the sifting process of the BEMD described below:
O r i ( m , n ) = i = 1 4 B i ( m , n ) + R e s ( m , n )
Ori(m, n) represents the original 2D gravity data; Bi(m, n) represents the 2D IMFs; and Res(m, n) represents the 2D residual component. The mixed gravity data in the study area were decomposed into four BIMFs (BIMF1, BIMF2, BIMF3, and BIMF4) (Figure 4a–d) and one residue Res(m, n) (Figure 4e). The BIMFs decrease in frequency from BIMF1 to BIMF4, with the residual component having the lowest frequency.
The 1D decomposition results along the northwestern profile (line AB) across the Jiaodong gold cluster region (see Figure 3) are shown in Figure 4. The smoothness of the curves increases as the frequency decreases from IMF1 to IMF4. The orthogonality of the BIMFs was checked along the NW directions (Table 1). The results show that all IO values are close to zero, indicating that orthogonality is approximately satisfied.
The original gravity image (Figure 2) was decomposed into four BIMFs (BIMF1, BIMF2, BIMF3, and BIMF4) and one residue Res(m, n) by BEMD. As BIMF1, BIMF2, BIMF3, and BIMF4 decrease in frequency, BIMF1 represents the gravity image with the highest frequency and Res(m, n) represents the gravity image with the lowest frequency. The frequencies of the BIMF2, BIMF3, and BIMF4 images range between that of BIMF1 and Res(m, n). The above-mentioned BIMFs have distinct geological implications.
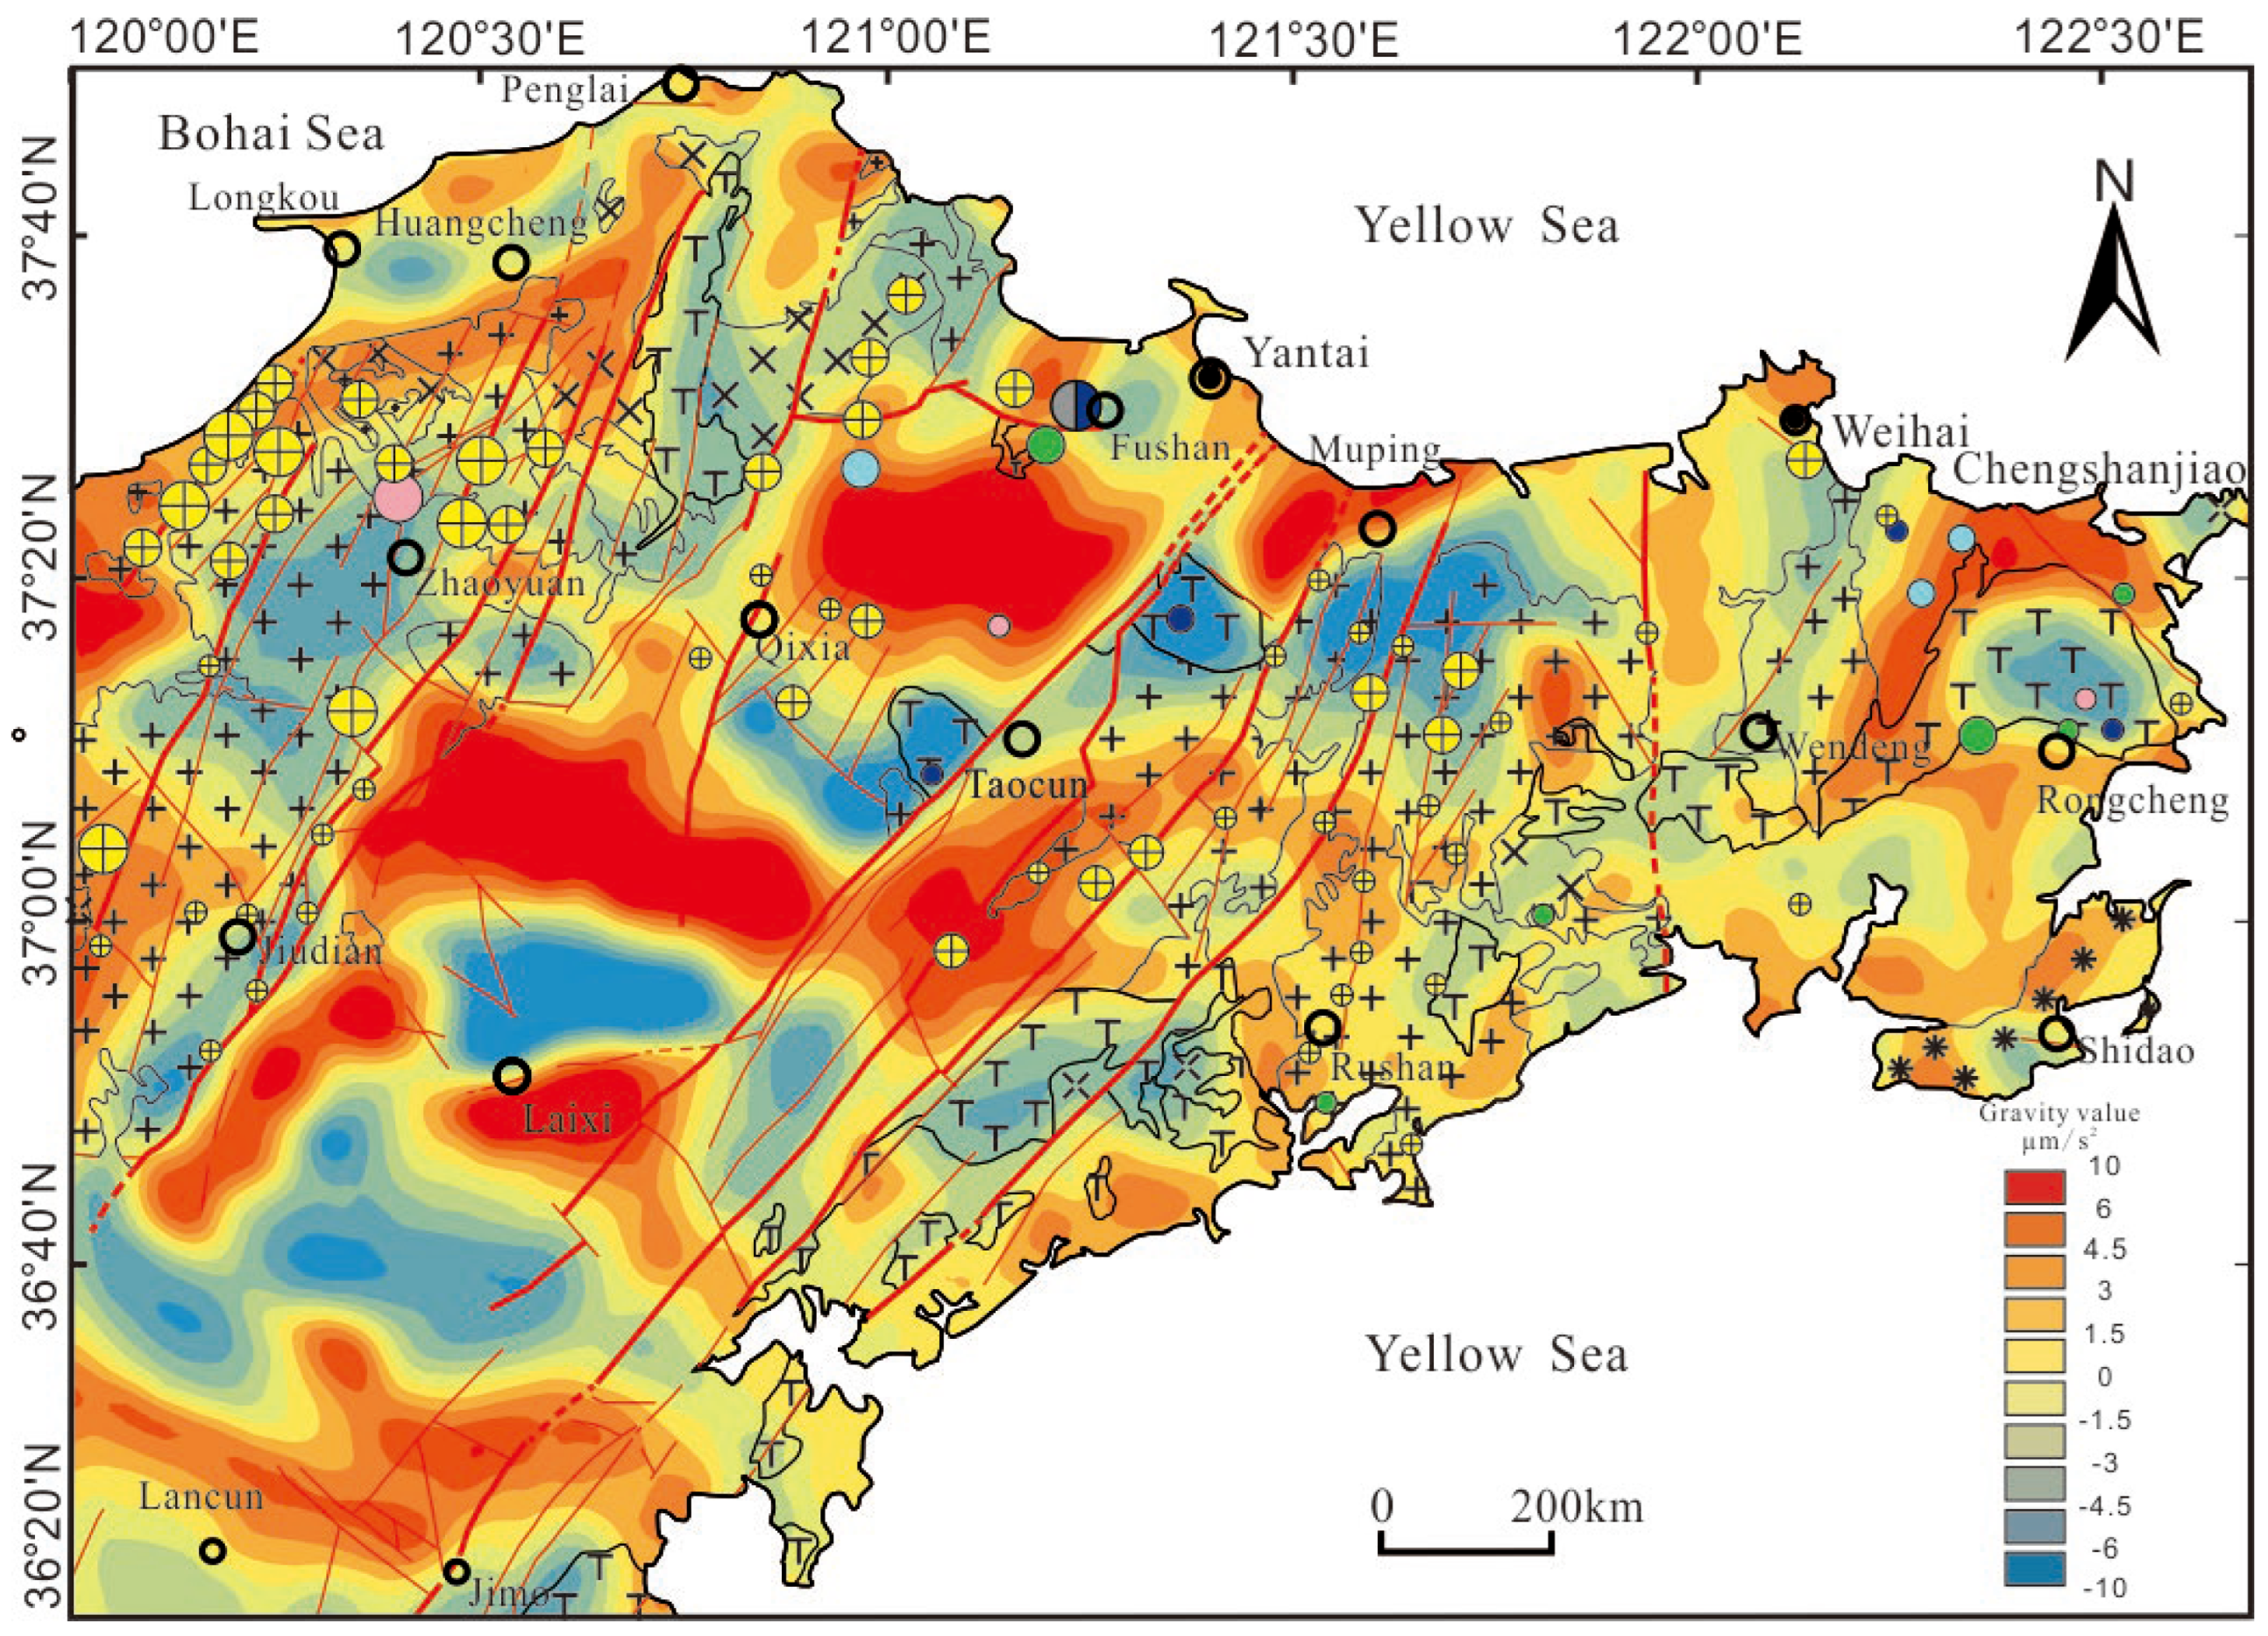
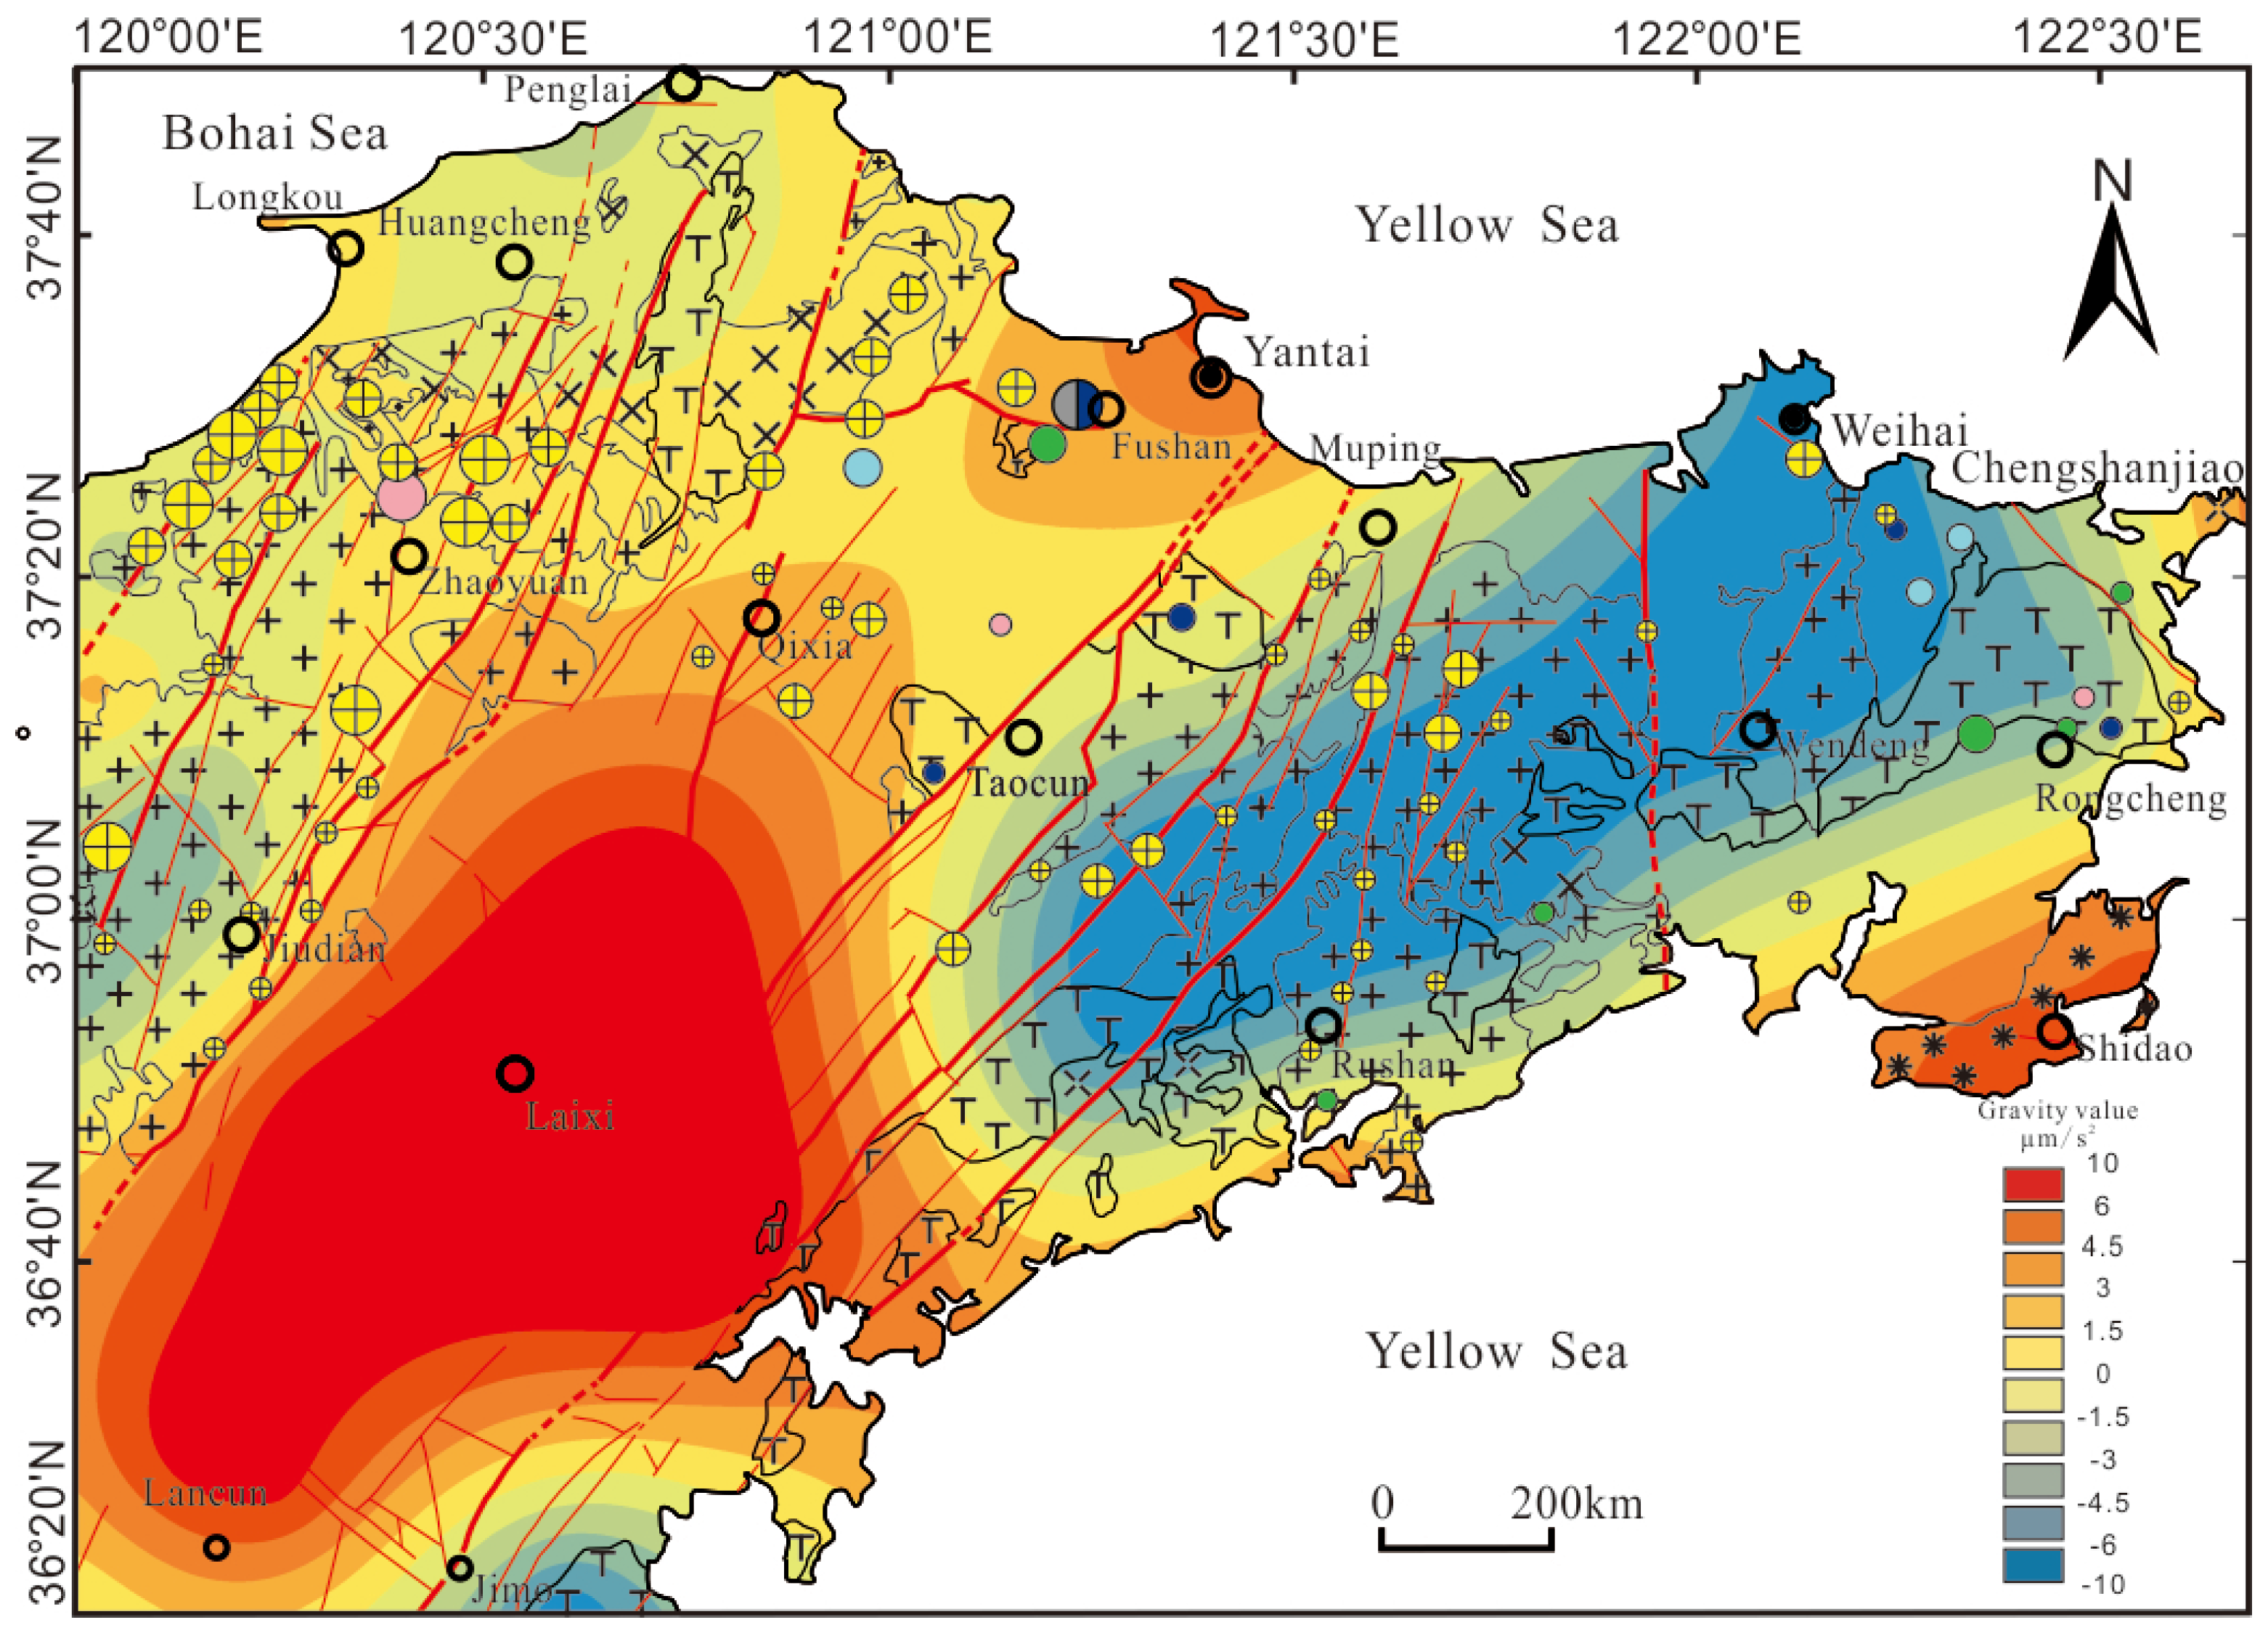
The high-pass-filtered image (IMF1) (Figure 5) depicts the shallow geological architecture in the study area. A series of negative gravity anomalies, which vary from −1.5 to −10 μm/s2 (Figure 5), corresponds to the outcropping Late Jurassic biotite granites and the late-early Cretaceous granodiorites in the study area. Most gold deposits are distributed around these granites [4] (Figure 5). The positive gravity anomalies vary from +1.5 to +10, which reflects basalts in the Jiaolai Basin. These observations imply that the local gravity anomaly variation may be mainly influenced by rock types such as intrusions, metamorphic rocks and volcanic sedimentary rocks, as well as by local gold mineralization.
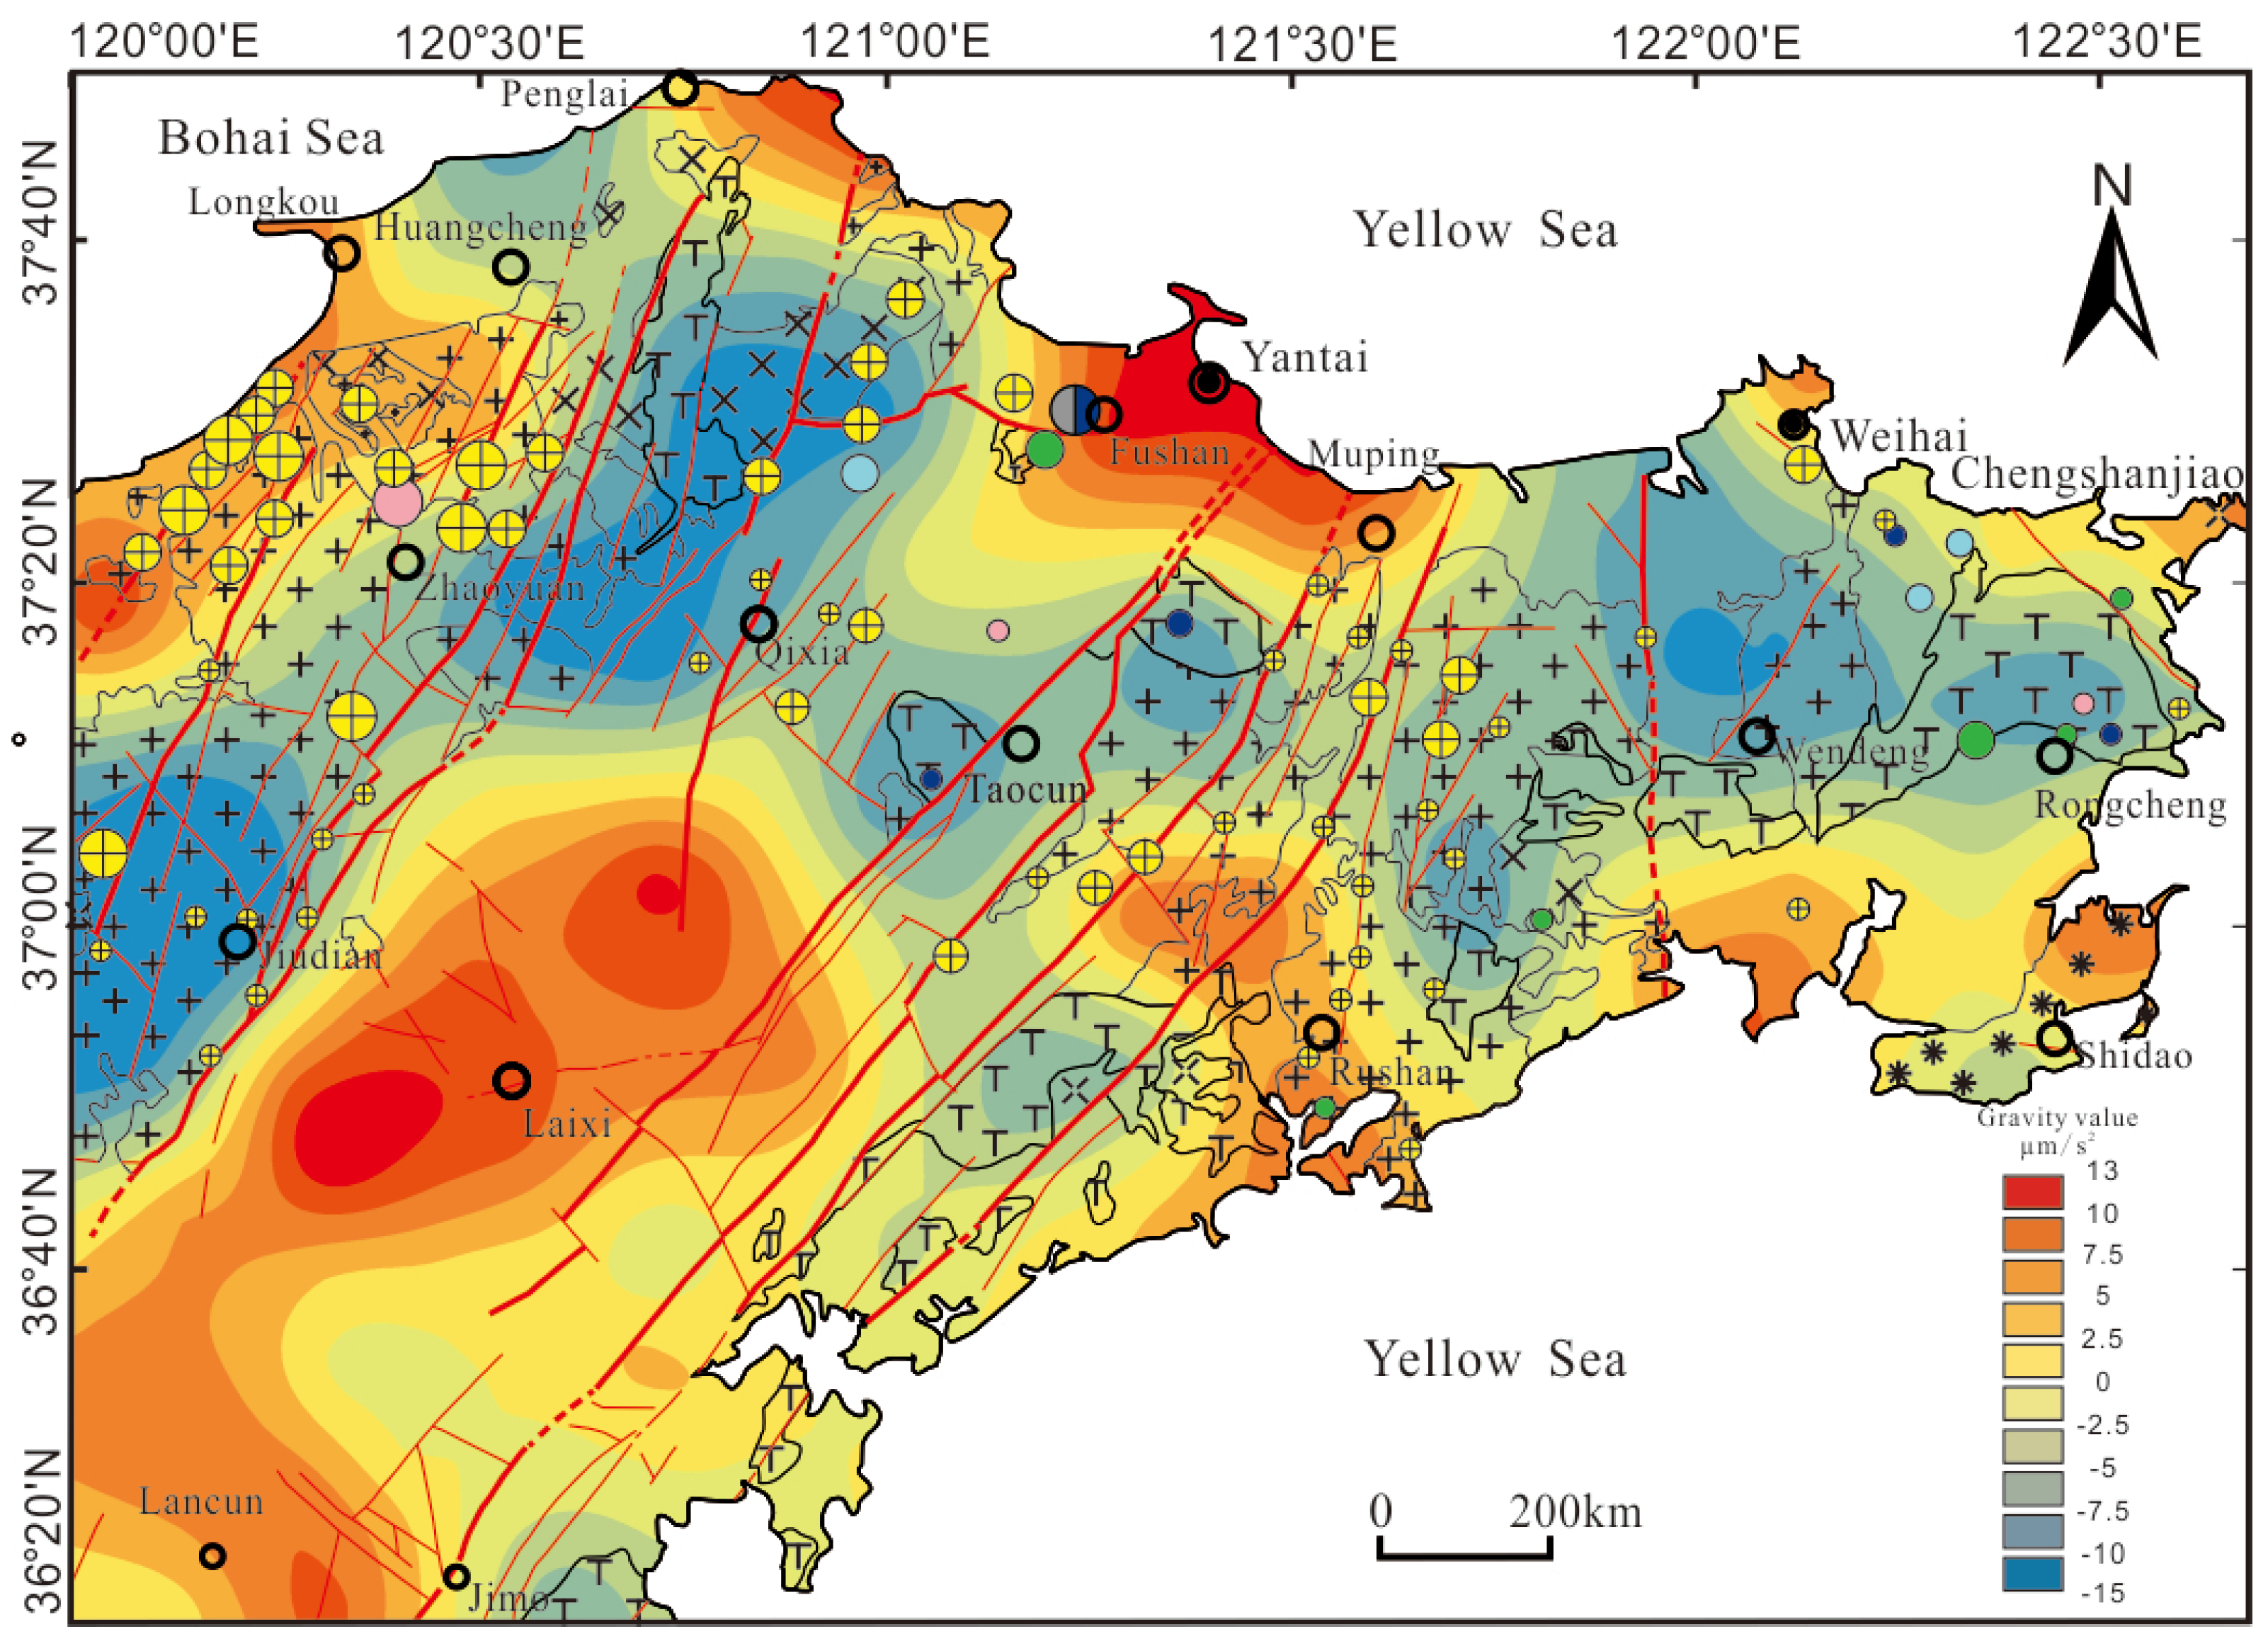
The band-pass-filtered image (BIMF2) (Figure 6) depicts the middle- to shallow-level geological architecture of the study area. At this depth, various types of granites are connected to each other and display negative gravity anomaly values varying from 0 to −10. Some gold deposits, located on the northwestern side of the Late Jurassic biotite granites, illustrate positive gravity anomalies of 0 to +7.5 μm/s2. Their protolith may be the Archean granitic gneiss. The Lancun–Laixi–Yantai positive gravity anomaly, with values varying from +2.5 to +13 μm/s2, indicates a possible NE-trending basement uplift separated by Qixia–Taocun granites, which shows a negative gravity anomaly. This basement uplift may be composed of high-density Archean metamorphic rocks.
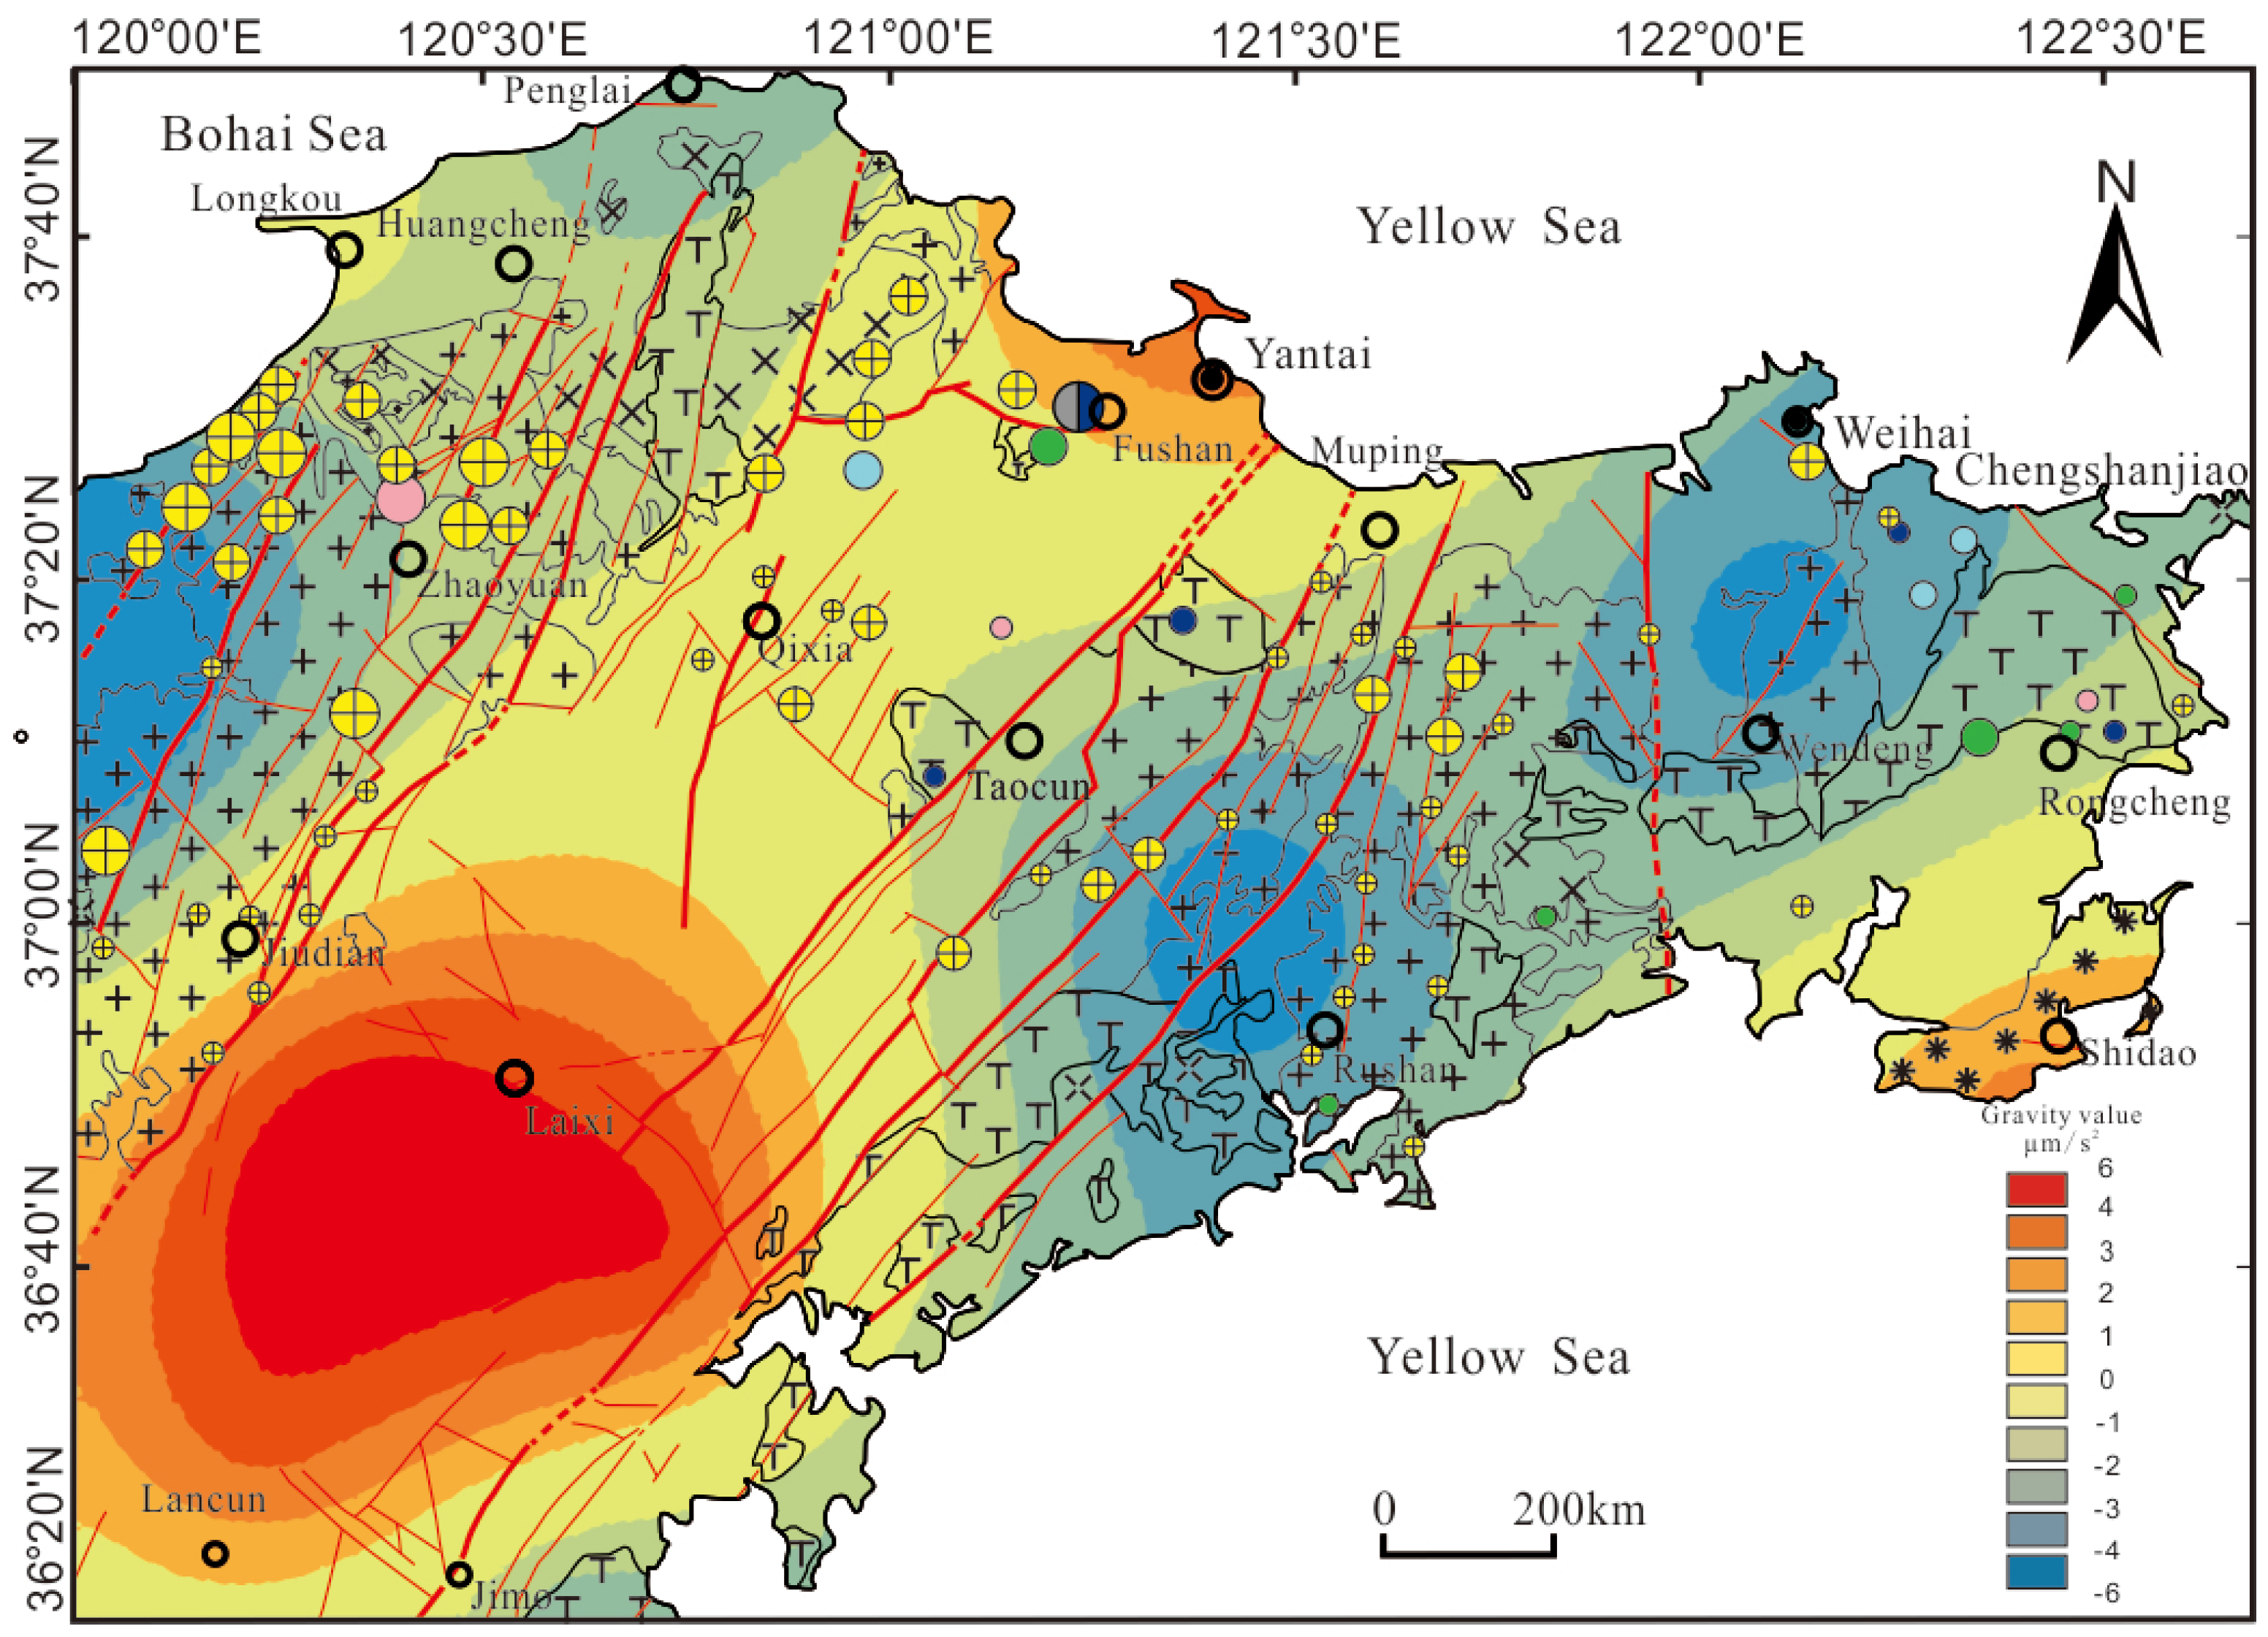
The band-pass-filtered image (BIMF3; Figure 7) depicts the middle- to lower-level geological architecture. There are three gravity anomaly areas: the Laixi positive anomaly area (red color), the Rushan–Weihai negative gravity anomaly area (blue color), and the gravity background area (yellow color) (Figure 7). The positive anomaly area of 0 to 10 μm/s2 may reflect mantle uplift beneath Laixi, whereas the negative gravity anomaly of −1.5 to −10 μm/s2 may correspond to the metamorphic basement of the Yangtze block. The gold deposits are mainly distributed in the background gravity area and partially in the negative gravity anomaly area (Figure 7).
The low-pass-filtered gravity component images (BIMF4) (Figure 8) and (Res(m, n)) (Figure 9) may reflect the deep geological architecture within the study area, which is associated with the mantle and/or the basement uplift and depression [23,24,25,26,27].
In Figure 8, one mantle uplift with a positive gravity anomaly and two mantle depressions with negative anomalies are evident. The uplift—defined as the Lancun–Laixi mantle uplift—shows values of 1–6 μm/s2, dropping abruptly to 0–1 μm/s2 northeastward toward Fushan, then rising to 1–3 μm/s2 toward Yantai. This forms a northeast-trending gravity anomaly ridge with higher values as its southwestern and northeastern ends and a low, flat central segment. Flanking this ridge are two northeast-trending mantle depressions, within which most gold deposits are located (Figure 8).
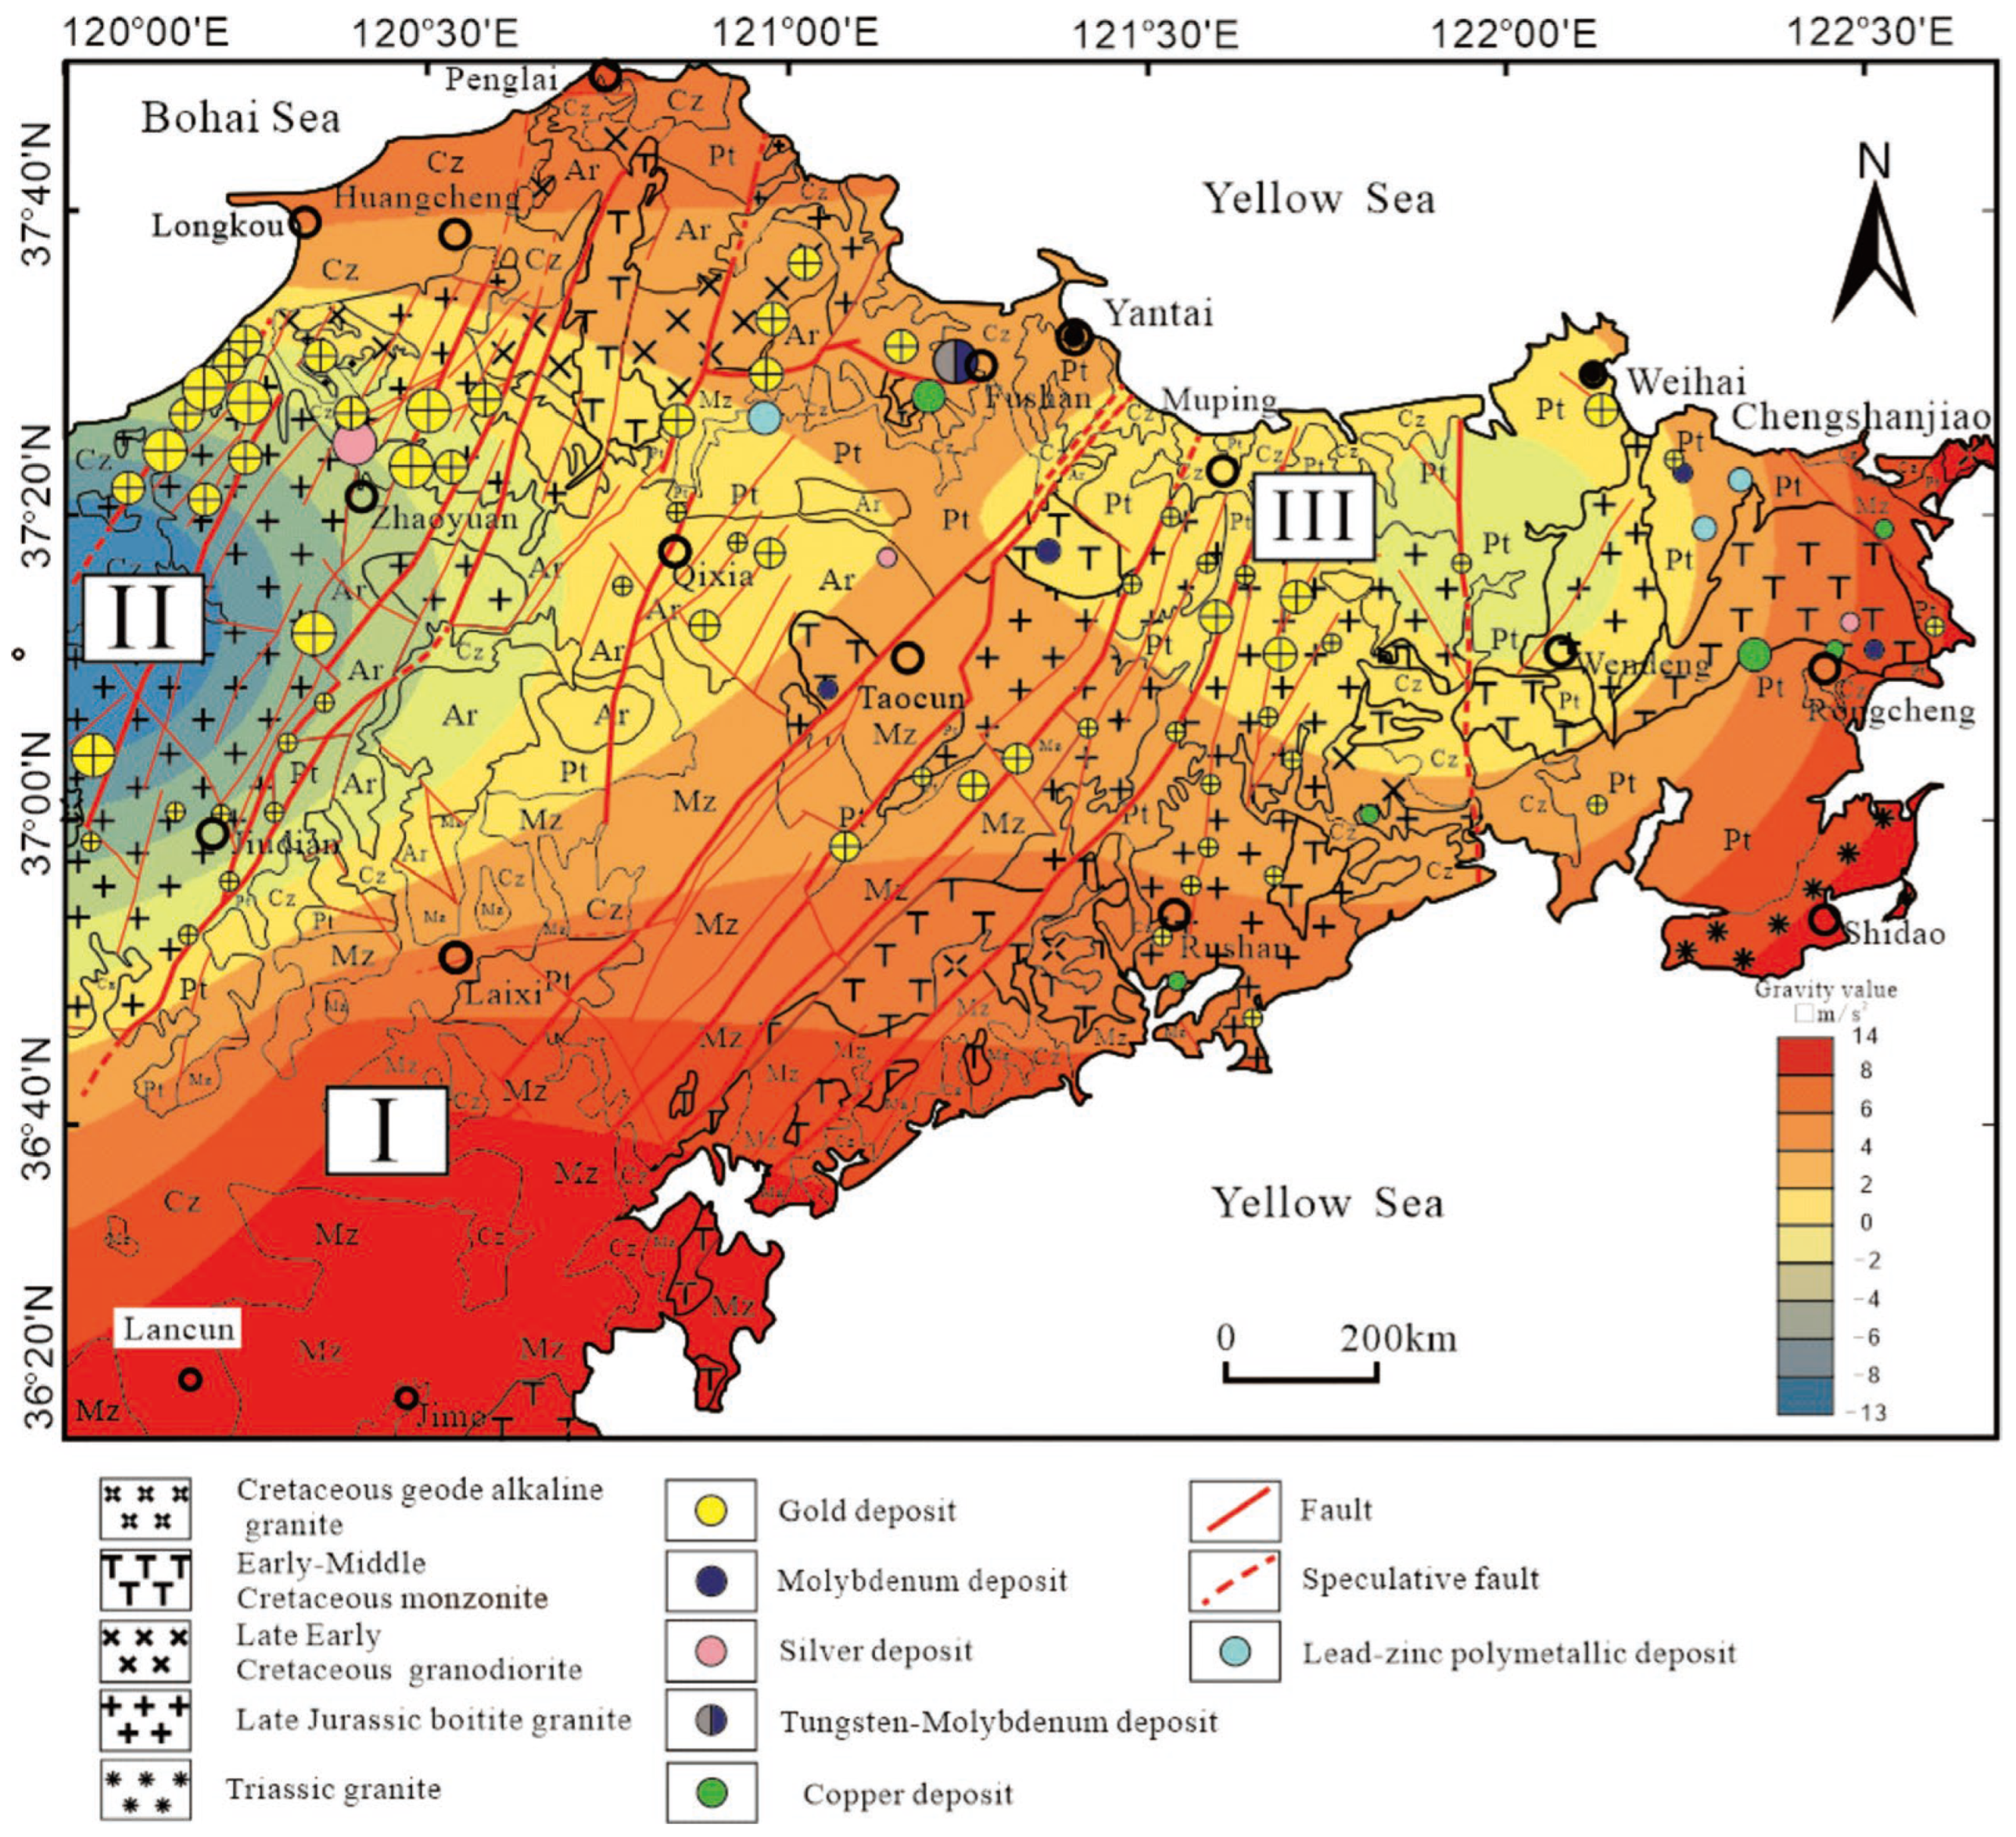
The low-pass-filtered image (Res(m, n)) (Figure 9) depicts the architecture of the upper mantle at a depth of about 27 km within the study area, which can be divided into three zones: (a) Zone I with gravity field values ranging from 2 to 14 μm/s2 is defined as a positive gravity anomaly, which may reflect a mantle uplift. (b) Zone II with gravity field values varying from −2 to −13 μm/s2 is defined as a negative anomaly, which may imply a mantle sag. (c) Zone III with gravity field values ranging from −2 to 2 μm/s2 is defined as a background gravity field, which may show a mantle flat area. All large gold deposits are distributed within the mantle sag. It has been proposed that the upper-mantle architecture reflects asthenosphere upwelling and consequent lithospheric thinning, triggered by NNW-directed subduction of the Izanagi Plate and later northward subduction of the Pacific Plate [28,29,30,31].

3.2. Application of Power Spectrum Analysis in Approximately Estimating the Depth of BIMFi

Spectral analysis (e.g., power spectrum analysis) can be used for the quantitative recognition of geophysical anomalies in the frequency domain and is widely applied for decomposing information from the potential fields [32,33,34,35]. The decomposed component that corresponds to a specific frequency distribution may, to some degree, represent anomalies at a specific depth. Consequently, power spectrum analysis can be applied to quantitatively estimate the approximate depth of the field source corresponding to each BIMF acquired by BEMD [36].
Radial logarithmic power spectrum estimation the depth of the field source, based on the statistical model proposed by Spector and Grant [32], is a method for calculating field source depth in frequency domain. The advantage is that the field source depth can be estimated roughly without prior information. As Equation (8) is based on the theoretical model, the estimated depth of the field source has errors, but it can still provide a reference for the study of the distribution law of the deep geological body. By Fourier transform, the convolution integral of space domain can be converted into the multiplication of frequency domain, which simplifies the study of gravity potential field. The method has been widely applied to estimate field-source depth in the frequency domain [34,35,36,37,38]. The method steps are as follows:
(1)
Transform the gravity anomaly component data from the spatial domain to the frequency domain using a two-dimensional Fourier transform;
(2)
Square the two-dimensional Fourier transformation result to obtain the power spectrum value;
(3)
Convert the power spectrum’s coordinates from Cartesian to polar, then compute the arithmetic mean of power spectrum values covered within each radial frequency bin;
(4)
Draw the radial average logarithmic power spectrum curve through the radial frequency value and the logarithm of the corresponding radial average power spectrum value;
(5)
The least square method is used to fit the appropriate frequency band, and the average top depth of the field source is calculated according to the slope of the fitting straight line (Equation (8)):
h = ln P w 1 ln P w 2 2 w 1 w 2
In Equation (8), ln P(w1) and ln P(w2) denote the arithmetic mean logarithmic power spectrum values at radial frequencies w1 and w2, respectively, and h is the average depth of the field source.
Based on the original gravity data image (Figure 2), the establishment of BIMFs corresponding to different depths using BEMD and power spectrum analysis is illustrated in Figure 4a–e.

4. Results and Discussion

The above-mentioned BIMFs have distinct geological implications. The low-pass-filtered image (Res(m, n) (Figure 10e) depicts the architecture of the upper mantle at a depth of about 27 km within the study area, which can be divided into three zones: (a) Zone I is a positive gravity anomaly component, which may reflect a mantle uplift. (b) Zone II is defined as a negative anomaly component, which may imply a mantle sag. (c) Zone III represents the background gravity field component, which may indicate a flat mantle domain. All giant gold deposits are distributed within the mantle sag.
BIMF4 and BIMF3 (Figure 10c,d) images reflect the geological architecture at a depth of approximate 17–12 km within the study area, which can also be divided into three zones. Zone I displays a positive gravity anomaly component (red color); Zone II shows a background gravity component (yellow color); and Zone III is a negative gravity anomaly component (blue color). Zone I and Zone II illustrate the deep geological architectures of the Jiaobei terrane. Zone I with a strong positive gravity component anomaly coincides with the Jiaobei mantle uplift developed under the Jiaolai Basin. Zone II with a background gravity component coincides with the Jiaoxibei gold-concentrated cluster region. Zone III displays a negative gravity component anomaly that coincides with the Sulu ultra-high pressure metamorphic block. It has been shown that the Jiaolai Basin is a faulted basin developed atop mantle uplift, triggered by asthenosphere upwelling, lithospheric thinning, and crustal stretching driven by NNW-directed subduction of the Izanagi Plate and subsequent northward subduction of the Pacific Plate [29,30,31,39,40,41].
Goldfarb et al. [8] hypothesized that the ore concentration requires fluid focusing during a subcrustal thermal event, broadly linked to coeval lithospheric thinning, asthenospheric upwelling driven by paleo-Pacific plate subduction, and seismicity along the continental-scale Tan-Lu fault. Possible ore genesis scenarios include those where ore fluids were produced directly by the metamorphism of oceanic lithosphere and overlying sediment on the subducting paleo-Pacific slab, or by devolatilization of an enriched mantle wedge above the slab. Both sulfur and gold could be sourced from either the oceanic sediments or the serpentinized mantle. A clearer picture of the Early Cretaceous paleo–Pacific slab architecture beneath eastern China is essential for evaluating competing models [8]. We propose that asthenospheric upwelling—associated with mantle uplift and depression triggered by paleo-Pacific plate subduction—was the primary driver of giant gold deposit formation on the Jiaodong peninsula. The asthenospheric upwelling made ore-forming fluids from mantle concentrate in the mantle depression to form gold ores. The NE-NNE trending Tan-Lu fault system is the main channel of gold-bearing fluid migration. Gold may come from the mantle because the gold background value of the Jiaodong terrane is too low (0.76–1.35 ppb) to form gold ore source [42].
The BIMF1 and BIMF2 images (Figure 4a,b) resolve middle- to shallow-level geological architecture at approximately 8.9–5.3 km depth. There are a series of positive and negative gravity component anomalies. Most granites have lower density (2.5–2.70 g/cm3) than their wall rocks (2.62–2.76 g/cm3) and display negative gravity anomalies. Among them, there are negative anomalies with ring-shaped positive gravity anomalies that contain gold deposits, implying a pattern of gold alteration–mineralization in which a positive, ring-shaped gravity anomaly encloses a negative gravity over a granitic intrusion.
It has been illustrated that the geological architectures at different depths as well as the giant Jiaodong gold cluster region were formed by the asthenosphere rise that caused lithospheric thinning triggered by NNW-ward subduction of the Izanagi Plate over a time period of approximately 200–100 Ma.
The most important orogenic gold event in the North China Craton was related to the Upper Jurassic to Lower Cretaceous mantle lithosphere thinning and delamination due to the complex history and geometry of subduction related to the convergence of the paleo-Pacific Plate [43,44]. This resulted in asthenosphere upwelling, largely widespread granite magmatism, and widespread mesozonal to epizonal orogenic gold mineralization [8,12,45] at 120 Ma [46,47,48] in the Jiaodong gold cluster region, which contains >35% (>5000 t gold) of China’s gold resources. In the Cretaceous, subsequent asthenosphere upwelling related to complex subduction of the paleo-Pacific Plate is interpreted to have caused devolatilization of the metasomatized and fertilized mantle lithosphere to release auriferous ore fluids [49,50]. These fluids were advected along lithosphere-scale faults and focused into subsidiary faults and shear zones, forming the Jiaodong gold deposits (Figure 11) [28,51,52]. Fortunately, the deposits were preserved due to relatively slow exhumation despite the previous lithosphere delamination [47].

5. Conclusions

BEMD is applied to extract bi-gravity anomaly components with different frequencies based on 1:200,000 bouguer gravity data in the JGCR. The research conclusions are as follows:
(1)
The bi-intrinsic mode functions (BIMFs), extracted by BEMD from the gravity data, can be categorized as three filters: high-pass, band-pass, and low-pass. Some BIMFs represent a specific range of frequency structures of the gravity data.
(2)
The bi-intrinsic mode function, obtained by the high-pass filter, represents a gravity anomaly component with high frequency, which characterizes superficial geological bodies with different densities, such as granitoids, basalt, and volcanic sediments, in this study area.
(3)
The bi-intrinsic mode function, extracted by the band-pass filter, is a gravity anomaly component with medium frequency, which implies that the deep part of geological architecture reflects basement uplift and/or depression such as the Laixi uplift.
(4)
The bi-intrinsic mode function, extracted by the low-pass filter, is a gravity anomaly component with low frequency, which implies that the deepest part of the geological architecture reflects mantle uplift (Unit I in Figure 10e) and/or depression (Unit II in Figure 10e). The concentration of the majority of giant gold deposits in the JGCR within Unit II (Figure 10e) is inferred to be associated with the mantle ore-forming fluids concentrated in the mantle depression.

Author Contributions

J.F., writing—review and editing, writing—original draft, methodology, formal analysis, conceptualization. X.Z., writing-review and editing, supervision, software. Y.C., writing—review and editing, writing—original draft, resources, methodology, investigation, funding acquisition, conceptualization. A.Z., validation, supervision, software, methodology. B.Z., programming, software development; designing computer programs; implementing the computer code and supporting algorithms; testing the existing code components. P.Z., writing—review and editing, supervision, conceptualization. All authors have read and agreed to the published version of the manuscript.

Funding

This research is jointly funded by National Natural Science Foundation of China (grant Nos.: 41972312, 41672329), and the National Key Research & Development Project of China (No.: 2016YFC0600509).

Data Availability Statement

The data presented in this study are available on request from the corresponding author. The data are not publicly available due to the data being classified as a state secret.

Acknowledgments

We would also like to thank China Geological Survey for providing the gravity data at the scale of 1:200,000, covering the Jiaodong gold cluster area for this research.This article is a revised and expanded version of a paper entitled Application of BEMD in extracting gravity anomaly components showing deep ore-forming dynamic background of Jiaodong giant gold cluster region, which was presented at the 18th SGA Biennial Meeting, Golden, Colorado USA, 3–7 August 2025.

Conflicts of Interest

Dr. Binbin Zhao is an employee of Sinomine Resource Group Co., Ltd. The paper reflects the views of the authors and not those of the company.

References

  1. Zhou, X.; Yang, J.; Zhang, L. Metallogenesis of Superlarge Gold Deposits in Jiaodong Region and Deep Processes of Subcontinental Lithosphere Beneath North China Craton in Mesozoic. Sci. China Ser. D Earth Sci. 2003, 46, 14–25. [Google Scholar] [CrossRef]
  2. Deng, J.; Wang, Q.F.; Zhang, L.; Xue, S.C.; Liu, X.F.; Yang, L.; Liang, Y.Y. Metallogenetic Model of Jiaodong-Type Gold Deposits, Eastern China. Sci. China Earth Sci. 2023, 66, 2287–2310. [Google Scholar] [CrossRef]
  3. Yang, L.Q.; Wang, G.J.; Zhang, Z.J.; Deng, J.; Zhao, A.H.; Wang, J.P. Lithospheric Structure and Deep-Seated Mineralization in Jiaodong Gold Deposit Concentration Region, Shandong, China. Earth Sci. 2000, 25, 421–427. [Google Scholar]
  4. Zhang, Q.; Song, M.; Ding, Z.; Guo, M.; Zhou, M.; Dai, C.; Huo, G.; Zhang, P. Exhumation History and Preservation of the Jiaojia Giant Gold Deposit, Jiaodong Gold Cluster Region. Sci. China Earth Sci. 2022, 65, 1161–1177. [Google Scholar] [CrossRef]
  5. Deng, J.; Wang, Q.; Liu, X.; Zhang, L.; Yang, L.; Yang, L.; Qiu, K.; Guo, L.; Liang, Y.; Ma, Y. The Formation of the Jiaodong Gold Province. Acta Geol. Sin. 2022, 96, 1801–1820. [Google Scholar] [CrossRef]
  6. Xie, Z.; Li, Q.Z.; Gao, T.S. Comment on “Petrogenesis of Post-Orogenic Syenites in the Sulu Orogenic Belt, East China: Geochronological, Geochemical and Nd–Sr Isotopic Evidence” by Yang et al. Chem. Geol. 2006, 235, 191–194. [Google Scholar] [CrossRef]
  7. Goldfarb, R.J.; Qiu, K.F.; Deng, J.; Chen, Y.J.; Yang, L.Q. Orogenic gold deposits of China. Soc. Econ. Geol. 2019, 22, 263–324. [Google Scholar] [CrossRef]
  8. Goldfarb, R.J.; Santosh, M. The Dilemma of the Jiaodong Gold Deposits: Are They Unique? Geosci. Front. 2014, 5, 139–153. [Google Scholar] [CrossRef]
  9. Goldfarb, R.J.; Hart, C.; Davis, G. East Asian Gold: Deciphering the Anomaly of Phanerozoic Gold in Precambrian Cratons. Econ. Geol. 2007, 102, 341–345. [Google Scholar] [CrossRef]
  10. Song, M.; Song, Y.; Li, J.; Li, S. Metallogenic Series of Gold and Nonferrous Metal Deposits Related to Cretaceous Granites in Eastern Shandong Peninsula, China. Acta Geol. Sin. 2015, 39, 828–843. [Google Scholar] [CrossRef]
  11. Liu, J.L.; Ji, L.; Ni, J.L.; Chen, X.Y. Dynamics of the Early Cretaceous Lithospheric Thinning and Destruction of the North China Craton as the Consequence of Paleo-Pacific Type Active Continental Margin. Acta Geol. Sin. 2022, 96, 3360–3380. [Google Scholar] [CrossRef]
  12. Yang, C.; Santosh, M. Ancient Deep Roots for Mesozoic World-Class Gold Deposits in the North China Craton: An Integrated Genetic Perspective. Geosci. Front. 2020, 11, 203–214. [Google Scholar] [CrossRef]
  13. Qiu, K.-F.; Yu, H.-C.; Deng, J.; McIntire, D.; Gou, Z.-Y.; Geng, J.-Z.; Chang, Z.-S.; Zhu, R.; Li, K.-N. The Giant Zaozigou Au-Sb Deposit in West Qinling, China: Magmatic- or Metamorphic-Hydrothermal Origin? Mineral. Depos. 2020, 55, 345–362. [Google Scholar] [CrossRef]
  14. Zheng, A.; Chen, C.; Chen, Y.; Zhao, B.; Zhao, P. Application of Anomaly Components of Multi-Element Combination Extracted from Stream Sediments Data by BEMD in Mapping Ore Prospectivity within the JGCR, Eastern China. Appl. Geochem. 2024, 169, 106034. [Google Scholar] [CrossRef]
  15. Chen, Y.; Zhang, L.; Zhao, B. Identification of the Anomaly Component Using BEMD Combined with PCA from Element Concentrations in the Tengchong Tin Belt, SW China. Geosci. Front. 2019, 10, 1561–1576. [Google Scholar] [CrossRef]
  16. Huang, N.E. Beyond the Fourier Transform: Coping with Nonlinear, Nonstationary Time Series; Goddard Institute for Data Analysis, NASA Goddard Space Flight Center: Greenbelt, MD, USA, 26 May 2006; Available online: https://lcp.csail.mit.edu/events/hrv-2006/huang.pdf (accessed on 30 October 2025).
  17. Nunes, J.; Bouaoune, Y.; Delechelle, E.; Niang, O.; Bunel, P. Image Analysis by Bidimensional Empirical Mode Decomposition. Image Vis. Comput. 2003, 21, 1019–1026. [Google Scholar] [CrossRef]
  18. Nunes, J.C.; Guyot, S.; Deléchelle, E. Texture Analysis Based on Local Analysis of the Bidimensional Empirical Mode Decomposition. Mach. Vis. Appl. 2005, 16, 177–188. [Google Scholar] [CrossRef]
  19. Freire, M.L.S.; Ulrych, J.T. Application of Singular Value Decomposition to Vertical Seismic Profiling. Geophysics 2012, 53, 778–785. [Google Scholar] [CrossRef]
  20. Chen, Y.; Zhang, L.; Zhao, B. Application of Bi-Dimensional Empirical Mode Decomposition (BEMD) Modeling for Extracting Gravity Anomaly Indicating the Ore-Controlling Geological Architectures and Granites in the Gejiu Tin-Copper Polymetallic Ore Field, Southwestern China. Ore Geol. Rev. 2016, 88, 832–840. [Google Scholar] [CrossRef]
  21. Huang, J.N.; Zhao, B.B.; Chen, Y.Q.; Zhao, P. Bidimensional Empirical Mode Decomposition (BEMD) for Extraction of Gravity Anomalies Associated with Gold Mineralization in the Tongshi Gold Field, Western Shandong Uplifted Block, Eastern China. Comput. Geosci. 2010, 36, 987–995. [Google Scholar] [CrossRef]
  22. Liu, J.L.; Ni, J.L.; Chen, X.Y.; Craddock, J.P.; Zheng, Y.; Ji, L.; Hou, C. Early Cretaceous Tectonics across the North Pacific: New Insights from Multiphase Tectonic Extension in Eastern Eurasia. Earth-Sci. Rev. 2021, 217, 103552. [Google Scholar] [CrossRef]
  23. Kane, M.F.; Godson, R.H. Features of a Pair of Long-Wavelength (>250 km) and Short-Wavelength (<250 km) Bouguer Gravity Maps of the United States. In The Utility of Regional Gravity and Magnetic Anomaly Maps; Society of Exploration Geophysicists: Tulsa, OK, USA, 1985; pp. 46–61. [Google Scholar] [CrossRef]
  24. Zeng, G.X.; Lü, C.; Xu, J.F. Geology of Iron Ore Deposits in Shandong; Shandong Science and Technology Press: Jinan, China, 1998. [Google Scholar]
  25. Goldfarb, R.J.; Mao, J.-W.; Qiu, K.-F.; Goryachev, N. The Great Yanshanian Metallogenic Event of Eastern Asia: Consequences from One Hundred Million Years of Plate Margin Geodynamics. Gondwana Res. 2021, 100, 223–250. [Google Scholar] [CrossRef]
  26. Chen, G.; Cheng, Q.; Zuo, R.; Liu, T.; Xi, Y. Identifying Gravity Anomalies Caused by Granitic Intrusions in Nanling Mineral District, China: A Multifractal Perspective. Geophys. Prospect. 2015, 63, 256–270. [Google Scholar] [CrossRef]
  27. Chen, Y.; Zhang, L.; Zhao, B. Application of Singular Value Decomposition (SVD) in Extraction of Gravity Components Indicating the Deeply and Shallowly Buried Granitic Complex Associated with Tin Polymetallic Mineralization in the Gejiu Tin Ore Field, Southwestern China. J. Appl. Geophys. 2015, 123, 63–70. [Google Scholar] [CrossRef]
  28. Zhao, D.; Maruyama, S.; Omori, S. Mantle Dynamics of Western Pacific and East Asia: Insight from Seismic Tomography and Mineral Physics. Gondwana Res. 2006, 11, 120–131. [Google Scholar] [CrossRef]
  29. Zhu, G.; Jiang, D.; Zhang, B.; Chen, Y. Destruction of the Eastern North China Craton in a Backarc Setting: Evidence from Crustal Deformation Kinematics. Gondwana Res. 2012, 22, 86–103. [Google Scholar] [CrossRef]
  30. Guo, P.; Santosh, M.; Li, S. Geodynamics of Gold Metallogeny in the Shandong Province, NE China: An Integrated Geological, Geophysical and Geochemical Perspective. Gondwana Res. 2013, 24, 1172–1202. [Google Scholar] [CrossRef]
  31. Song, M.C.; Song, Y.X.; Ding, Z.J.; Li, S.Y. Jiaodong Gold Deposits: Essential Characteristics and Major Controversy. Gold Sci. Technol. 2018, 26, 406–422. [Google Scholar] [CrossRef]
  32. Spector, A.; Grant, F.S. Statistical Models for Interpreting Aeromagnetic Data. Geophysics 1970, 35, 293–302. [Google Scholar] [CrossRef]
  33. Maus, S.; Dimri, V. Potential Field Power Spectrum Inversion for Scaling Geology. J. Geophys. Res. 1995, 100, 12605–12616. [Google Scholar] [CrossRef]
  34. Zhang, S.X.; Chen, C.; Wang, L.S.; Wang, Q.G.; Wang, H.R.; Sun, S.D. The Bidimensional Empirical Mode Decomposition and Its Applications to Denoising and Separation of Potential Field. Prog. Geophys. 2015, 30, 2855–2862. [Google Scholar] [CrossRef]
  35. Zhu, Z.Y.; Liu, G.F. Analysis of Potential Field Data and Its Application Based on Bidimensional Empirical Mode Decomposition. Prog. Geophys. 2016, 31, 882–892. [Google Scholar] [CrossRef]
  36. Tao, G.; Wang, G.; Zhang, Z. Extraction of Mineralization-Related Anomalies from Gravity and Magnetic Potential Fields for Mineral Exploration Targeting: Tongling Cu(–Au) District, China. Nat. Resour. Res. 2019, 28, 461–486. [Google Scholar] [CrossRef]
  37. Zhang, S.X.; Chen, Z.H.; Wang, T.Q.; Liu, J.Z.; Zhang, P.; Zhu, C.D. The Extraction of Abnormal Feature of Mobile Gravity in the Sichuan-Yunnan Region Using BEMD Method. Geod. Geodyn. 2018, 38, 407–413. [Google Scholar] [CrossRef]
  38. Zhang, S.X.; Chen, Z.H.; Wang, Q.H.; Liu, J.Z.; Zhang, P. The Anomaly Feature Extraction of Mobile Gravity in the Sichuan-Yunnan Region Using Wavelet Transform Method—The Case Study of the Ludian MS6.5 and Jinggu MS6.6 Earthquakes in 2014. Geod. Geodyn. 2020, 40, 87–93. [Google Scholar] [CrossRef]
  39. Sun, F.Y. Mesozoic-Cenozoic Regional Tectonic Evolution and Gold Mineralization in Jiaodong Area, Shandong Province. Changchun Univ. Earth Sci. 1994, 24, 378–385. [Google Scholar]
  40. Xu, Y.G.; Huang, X.L.; Ma, J.L.; Wang, Y.-B.; Iizuka, Y.; Xu, J.-F.; Wang, Q.; Wu, X.-Y. Crust-Mantle Interaction during the Tectono-Thermal Reactivation of the North China Craton: Constraints from SHRIMP Zircon U–Pb Chronology and Geochemistry of Mesozoic Plutons from Western Shandong. Contrib. Mineral. Petrol. 2004, 147, 750–767. [Google Scholar] [CrossRef]
  41. Xu, Y. Thermo-Tectonic Destruction of the Archaean Lithospheric Keel Beneath the Sino-Korean Craton in China: Evidence, Timing and Mechanism. Phys. Chem. Earth Part A Solid Earth Geod. 2001, 26, 747–757. [Google Scholar] [CrossRef]
  42. Chen, Y.M.; Zeng, Q.D.; Sun, Z.F.; Wang, Z.K. Study on Geochemical Background Field of the Gold Deposits in Jiaodong, China. Gold Sci. Technol. 2019, 27, 791–801. [Google Scholar] [CrossRef]
  43. Dong, S.W.; Zhang, Y.Q.; Li, H.L.; Shi, W.; Xue, H.; Li, J.; Huang, S.; Wang, Y. The Yanshan Orogeny and Late Mesozoic Multi-Plate Convergence in East Asia—Commemorating 90th Years of the “Yanshan Orogeny”. Sci. China Earth Sci. 2018, 61, 1888–1909. [Google Scholar] [CrossRef]
  44. Goss, S.C.; Wilde, A.S.; Wu, F.; Yang, J. The Age, Isotopic Signature and Significance of the Youngest Mesozoic Granitoids in the Jiaodong Terrane, Shandong Province, North China Craton. Lithos 2010, 120, 309–326. [Google Scholar] [CrossRef]
  45. Yang, L.; Deng, J.; Guo, L.; Wang, Z.-L.; Li, X.-Z.; Li, J.-L. Origin and Evolution of Ore Fluid, and Gold-Deposition Processes at the Giant Taishang Gold Deposit, Jiaodong Peninsula, Eastern China. Ore Geol. Rev. 2016, 72, 585–602. [Google Scholar] [CrossRef]
  46. Deng, J.; Yang, L.Q.; Groves, D.I.; Zhang, L.; Qiu, K.-F.; Wang, Q.-F. An Integrated Mineral System Model for the Gold Deposits of the Giant Jiaodong Province, Eastern China. Earth-Sci. Rev. 2020, 208, 103274. [Google Scholar] [CrossRef]
  47. Zhang, Y.; Hu, F.; Fan, H.; Liu, X.; Feng, K.; Cai, Y.-C. Fluid Evolution and Gold Precipitation in the Muping Gold Deposit (Jiaodong, China): Insights from In-Situ Trace Elements and Sulfur Isotope of Sulfides. J. Geochem. Explor. 2020, 218, 106617. [Google Scholar] [CrossRef]
  48. Groves, D.I.; Santosh, M. Province-Scale Commonalities of Some World-Class Gold Deposits: Implications for Mineral Exploration. Geosci. Front. 2015, 6, 389–399. [Google Scholar] [CrossRef]
  49. Yang, Q.L.; Deng, J.; Zhang, L.; Zhao, A.-H.; Santosh, M.; Yu, X.-F.; Yang, W.; Li, D.-P.; Shan, W.; Xie, D.; et al. Mantle-Rooted Fluid Pathways and World-Class Gold Mineralization in the Giant Jiaodong Gold Province: Insights from Integrated Deep Seismic Reflection and Tectonics. Earth-Sci. Rev. 2024, 255, 104862. [Google Scholar] [CrossRef]
  50. Goldfarb, R.J.; Groves, D.I. Orogenic Gold: Common or Evolving Fluid and Metal Sources through Time. Lithos 2015, 233, 2–26. [Google Scholar] [CrossRef]
  51. Goldfarb, R.J.; Groves, D.I.; Gardoll, S.J. Orogenic Gold and Geologic Time: A Global Synthesis. Ore Geol. Rev. 2001, 18, 1–75. [Google Scholar] [CrossRef]
  52. Groves, D.I.; Santosh, M.; Goldfarb, R.J.; Zhang, L. Structural Geometry of Orogenic Gold Deposits: Implications for Exploration of World-Class and Giant Deposits. Geosci. Front. 2018, 9, 1163–1177. [Google Scholar] [CrossRef]
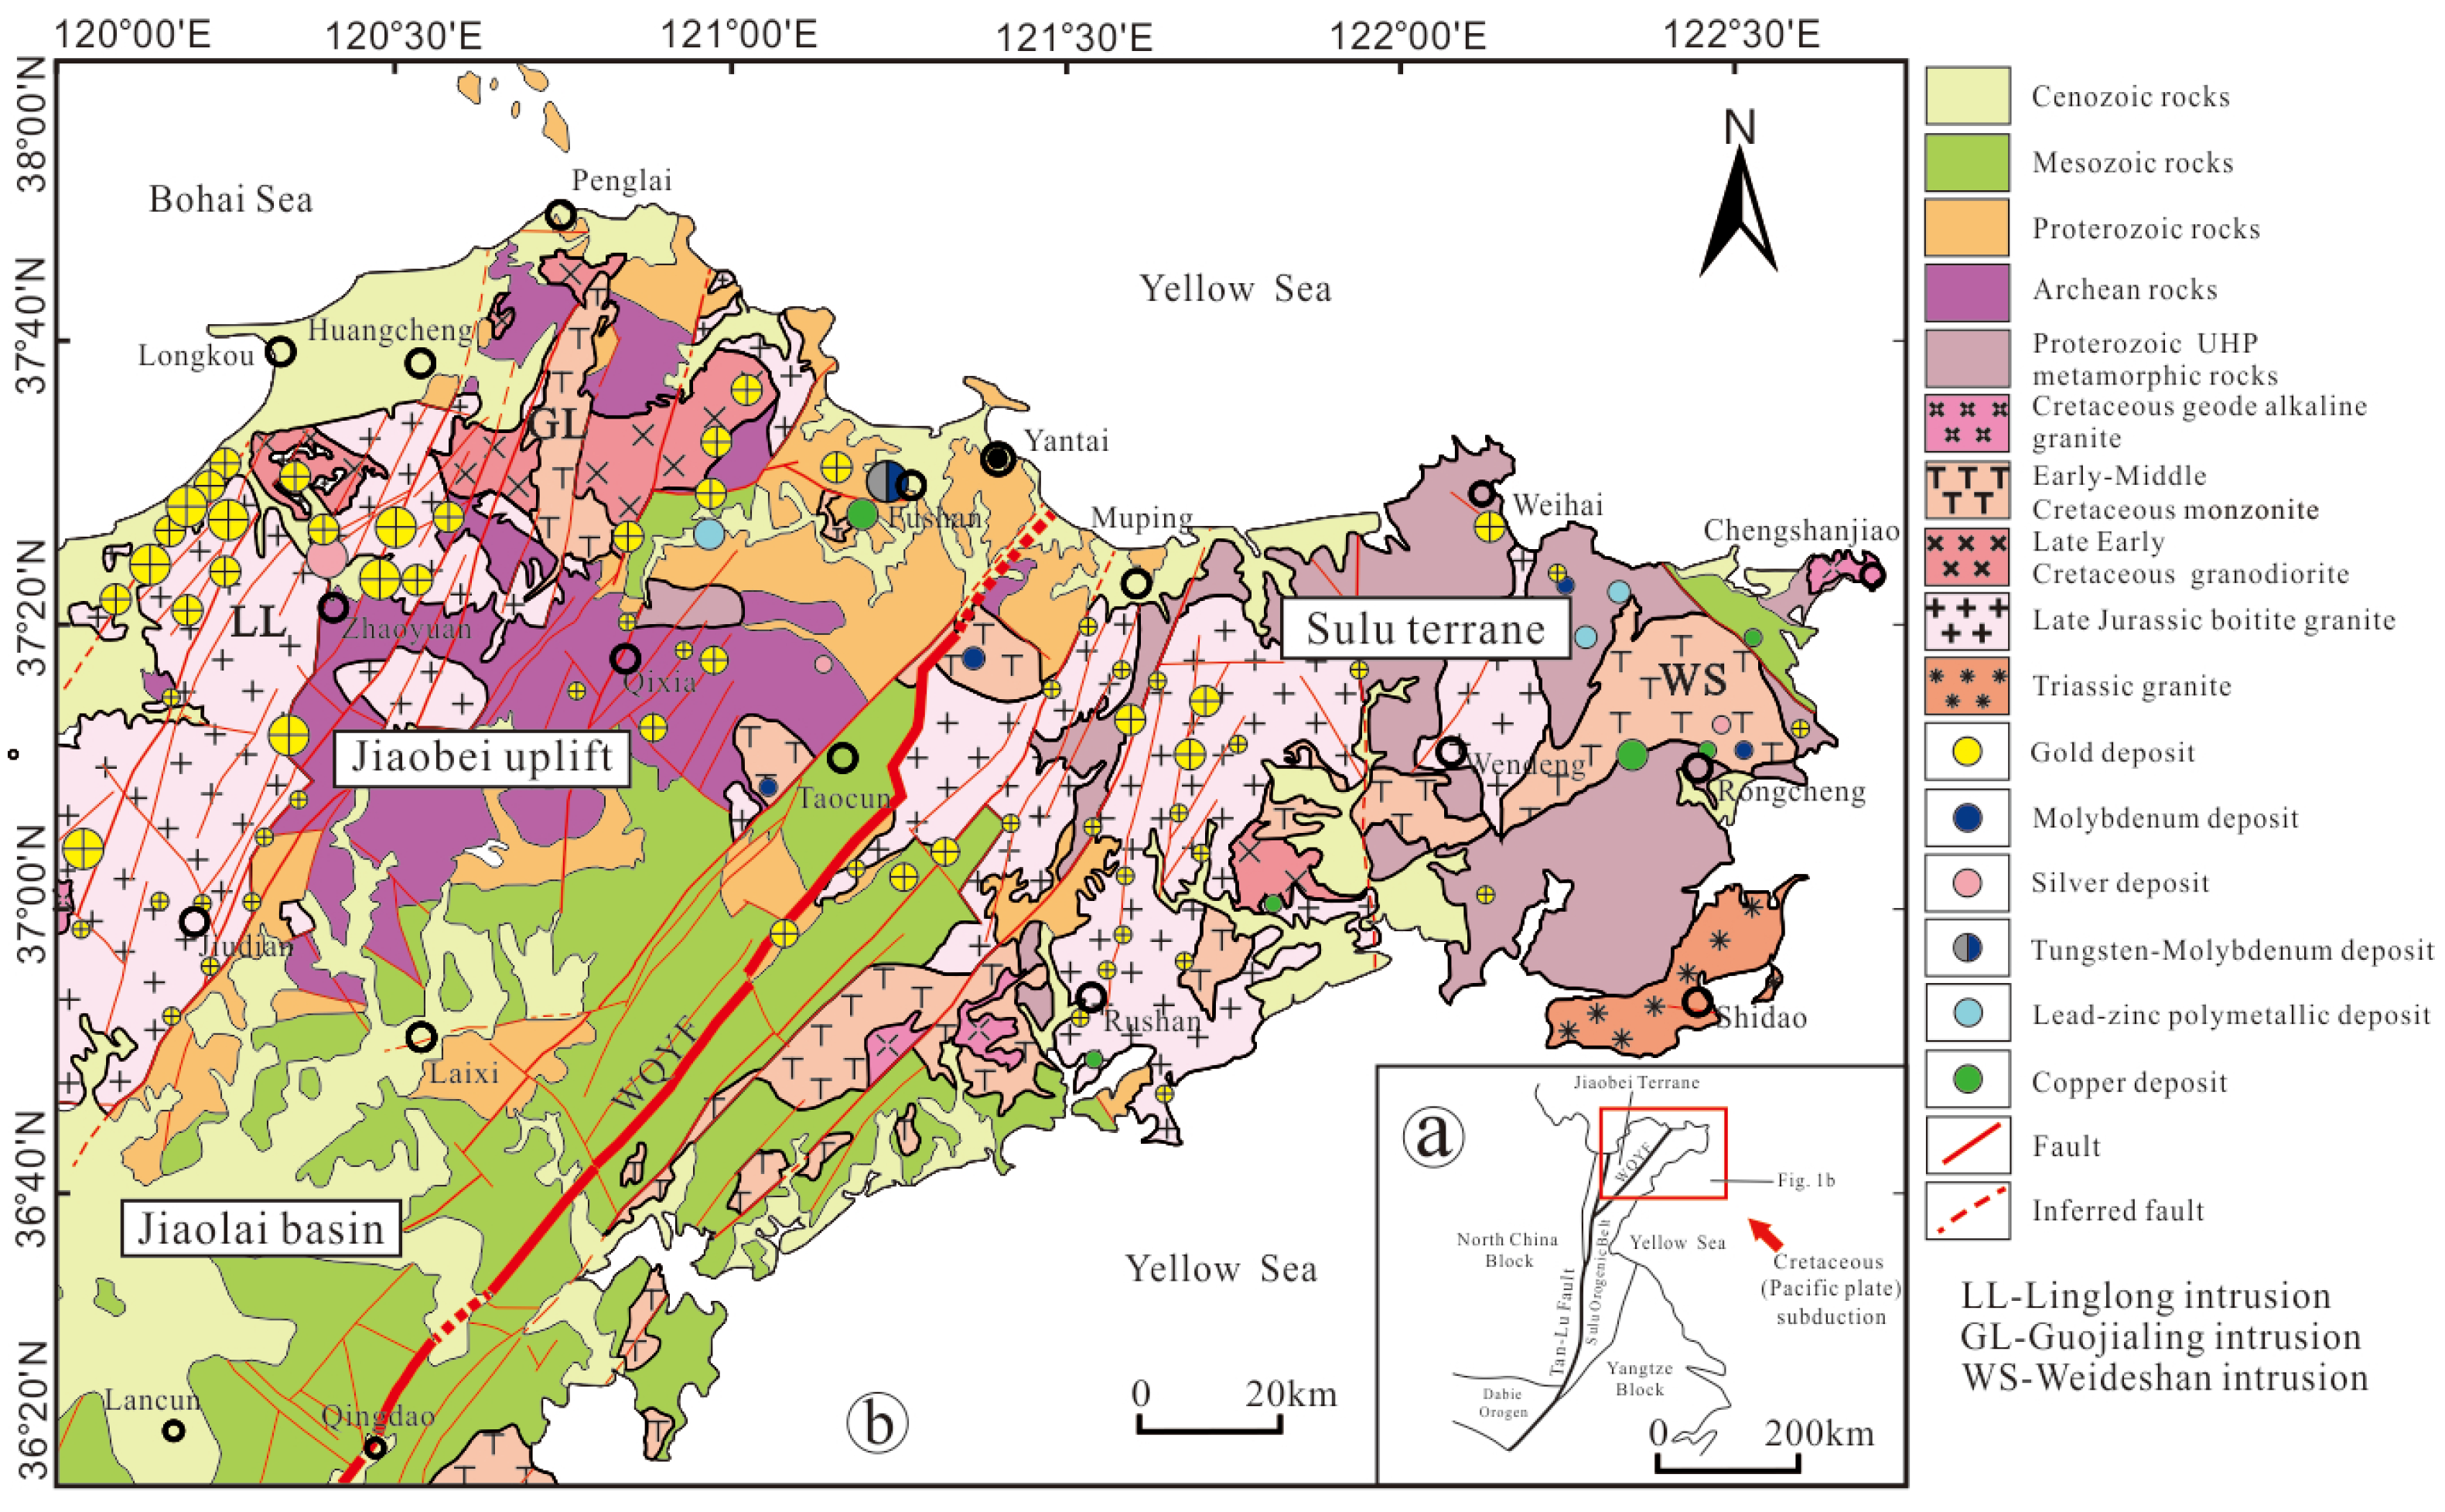
Figure 1. ⓐ Regional Tectonic Sketch Map; ⓑ Simplified geology and mineral resources map showing the main tectonic units, gold, and non-ferrous metal deposits of the Jiaodong gold cluster area (modified from [10,11,12]).
Minerals 15 01159 g001
Figure 2. Sifting procedure of BEMD (from [21]).
Minerals 15 01159 g002
Figure 3. Original gravity image surveyed at a scale of 1:200,000 for the Jiaodong gold ore cluster area. The line A-B indicates the location of the northwestern geophysical profile used for 1D decomposition.
Minerals 15 01159 g003
Figure 4. IMF components of 1D gravity data for the NW-trending section AB shown in Figure 3.
Minerals 15 01159 g004
Figure 5. Gravity component (BIMF1) image showing that most gold deposits cluster around exposed Late Jurassic biotite granites and the Late Early Cretaceous granodiorites, which exhibit with negative gravity anomalies across the study area. (The legends illustrating geology and mineralization see Figure 1).
Minerals 15 01159 g005
Figure 6. BIMF2 gravity image showing the middle- to shallow-level geological architecture of the study area (see the text for detail). (The legends illustrating geology and mineralization see Figure 1).
Minerals 15 01159 g006
Figure 7. BIMF3 gravity image illustrating the middle- to lower-level geological architecture of the study area. (The legends illustrating geology and mineralization see Figure 1).
Minerals 15 01159 g007
Figure 8. Gravity component BIMF4 image of the lower geological architecture within the study area. (The legends illustrating geology and mineralization see Figure 1).
Minerals 15 01159 g008
Figure 9. Residual gravity component Res(m, n) image showing the lowest geological architecture within the study area.
Minerals 15 01159 g009
Figure 10. Gravity component images for BIMF1 (a), BIMF2 (b), BIMF3 (c), BIMF4 (d), and Res(m, n) (e), decomposed from the original gravity image with the corresponding approximate depths, the legends for geology, and ore deposits (cf. Figure 1).
Minerals 15 01159 g010
Figure 11. The model for ore fluid derived from subducted oceanic crust and overlying sedimentary wedge or metasomatized lithosphere for the orogenic gold deposits of Jiaodong Province, China (modified after [8,12,28]).
Minerals 15 01159 g011
Table 1. Orthogonality assessment of section AB.
IO12IO13IO14IO23IO24IO34
0.0330.0930.0650.0330.0320.084
Disclaimer/Publisher’s Note: The statements, opinions and data contained in all publications are solely those of the individual author(s) and contributor(s) and not of MDPI and/or the editor(s). MDPI and/or the editor(s) disclaim responsibility for any injury to people or property resulting from any ideas, methods, instructions or products referred to in the content.