Article

Distribution, Source Identification, and Assessment of Potentially Toxic Elements in the Sediment Core from the Estuarine Region of the Golmud River to the Qarhan Salt Lake, Qinghai, China

1
Key Laboratory of Comprehensive and Highly Efficient Utilization of Salt Lake Resources, Qinghai Institute of Salt Lakes, Chinese Academy of Sciences, Xining 810008, China
2
Key Laboratory of Salt Lake Geology and Environment of Qinghai Province, Qinghai Institute of Salt Lakes, Chinese Academy of Sciences, Xining 810008, China
3
University of Chinese Academy of Sciences, Beijing 100049, China
4
State Key Laboratory of Nuclear Resources and Environment, East China University of Technology, Nanchang 330013, China
*
Author to whom correspondence should be addressed.
Minerals 2019, 9(9), 506; https://doi.org/10.3390/min9090506
Submission received: 15 July 2019 / Revised: 10 August 2019 / Accepted: 20 August 2019 / Published: 22 August 2019
(This article belongs to the Special Issue Metallic Elements in Sediments)

Abstract

:
The Qarhan Salt Lake has attracted increasing attention due to its significant national economic status and increased human activity, especially mining. Therefore, a sediment core collected from the confluence of the Golmud River to the Qarhan Salt Lake was chosen to investigate the concentrations, pollution levels, and ecological assessment of nine targeted elements (Al, As, Cd, Cr, Cu, Ni, P, Pb, and Zn). The excess 210Pb activities were calculated and a sedimentation rate of approximately 0.041 cm/y was estimated. Elements sources were identified, and the results show that Al, As, Cu, Ni, Pb, and Zn were mainly from natural sources, Cd and P were mainly from human input, and Cr appeared to have both sources. For Cd and P there was an increasing trend from 1987 and 1975, respectively, coinciding with the Chinese economic reform, Qarhan Salt Lake development and utilization, and also with the gross domestic product of Haixi State, Qinghai Province. Though the pollution and ecological assessment showed that there was nil to very low contamination and ecological risk, which is different from previous assumptions, the obviously increasing trend of Cd and P in the surface is still a concern. More attention should be paid to Cd and P in the further development of the Qarhan Salt Lake and the Golmud City.

1. Introduction

Estuaries are usually complex environments, which mean that estuarine sediments are usually from different sources. Both natural sources and anthropogenic sources (usually main contributors), along with the development of industrialization processes, affect the enrichment of elements in sediments [1,2]. Due to their accumulation over time, sediment cores are useful archives to reconstruct environmental changes (e.g., by analyses of major and trace elements, organic contaminant profiles in undisturbed sediment cores) [3,4,5] and provide valuable information regarding the impacts of human activities [6]. Contaminant profiles in well-dated sediment cores represent extremely valuable natural archives of environmental contamination, from which contaminant sources, history, and cycling may be determined, and contaminant concentrations in surface sediments may be projected into the future [7]. Much research in recent years has focused on elements concentrations and their distribution, sources, and fate in the environment [8,9,10].
In undisturbed sediment cores, 210Pb dating has frequently been used to study ecosystem changes during the last 100 years [11].The Constant Sedimentation model (CS) [12], Constant Initial Concentration (CIC, or named Constant Activity model; CA) [13], Constant Flux (CF, or named Constant Rate of Supply model; CRS) [12] and Constant Flux Constant Sedimentation model (CFCS) [14] are commonly used to calculate accumulation rates.
A number of methods have been used to determine elements sources, pollution, and ecological risk [15,16,17,18]. Multivariate statistical approaches (e.g., principal component analysis [PCA], factor analysis [FA], cluster analysis [CA], and correlation coefficient analysis) have been commonly used [19,20,21] to distinguish the natural or artificial origins and apportion natural and anthropogenic fractions. Among these, PCA/FA and CA are the most common multivariate statistical methods used in environmental studies [22]. Several methods such as the contamination factor (CF), geo-accumulation index (Igeo), enrichment factor (EF), pollution load index (PLI), modified degree of contamination (mCd), and potential ecological risk index (RI) are widely employed to evaluate contamination and ecological risks of elements in soils and sediments [23,24]. The integrated use of these methods is more appropriate than a single tool, which may not reflect the true degree of pollution.
Elements contamination in soils [25,26], sediments [27,28], dust [22,29,30], water [31,32], and plants [33,34] have been widely studied. In addition to their distribution and pollution, attention has increasingly been given to the ecological and human health risks [26].
The Qarhan Salt Lake in the eastern Qaidam Basin, Qinghai-Tibet Plateau, has an extremely arid desert climate with mean annual precipitation and evaporation of approximately 24 mm and 3564 mm, respectively [35]. It is the largest salt lake and largest potash and magnesium deposit production base in China. The Golmud River is the major supply to the Dabuxun Lake, which is the largest saline lake in the Qarhan Salt Lake. As the salt lake develops and industrial production increases, the environment and ecosystems are attracting increased attention. A large amount of work on pollution and ecological assessment in the Qinghai-Tibet Plateau has been conducted, mainly in the Qinghai Lake area [5,36]. Previous studies near the Qarhan Salt Lake have mainly focused on soil pollution and ecological and human health assessment. For example, Wu et al. [26] concluded that there was serious pollution in soils from the northeastern Qinghai-Tibet Plateau which exerted high potential ecological and health risks. Li et al. [37] found that the soils in the salt-lake area presented considerable ecological risks in the northeastern Qinghai-Tibet Plateau. The environmental changes due to industrial mining activities of the salt lake and urbanization of the Golmud are still not well understood. The objectives of the present work are to: (i) Evaluate the sedimentation rates around the salt lake; (ii) identify possible sources of nine targeted potentially toxic elements, and; (iii) evaluate the pollution statuses and potential ecological risks of potentially toxic elements using the EF, mCd, and RI. The results of this work are expected to provide necessary guidelines for the further development of environmental policies and legislation.

2. Materials and Methods

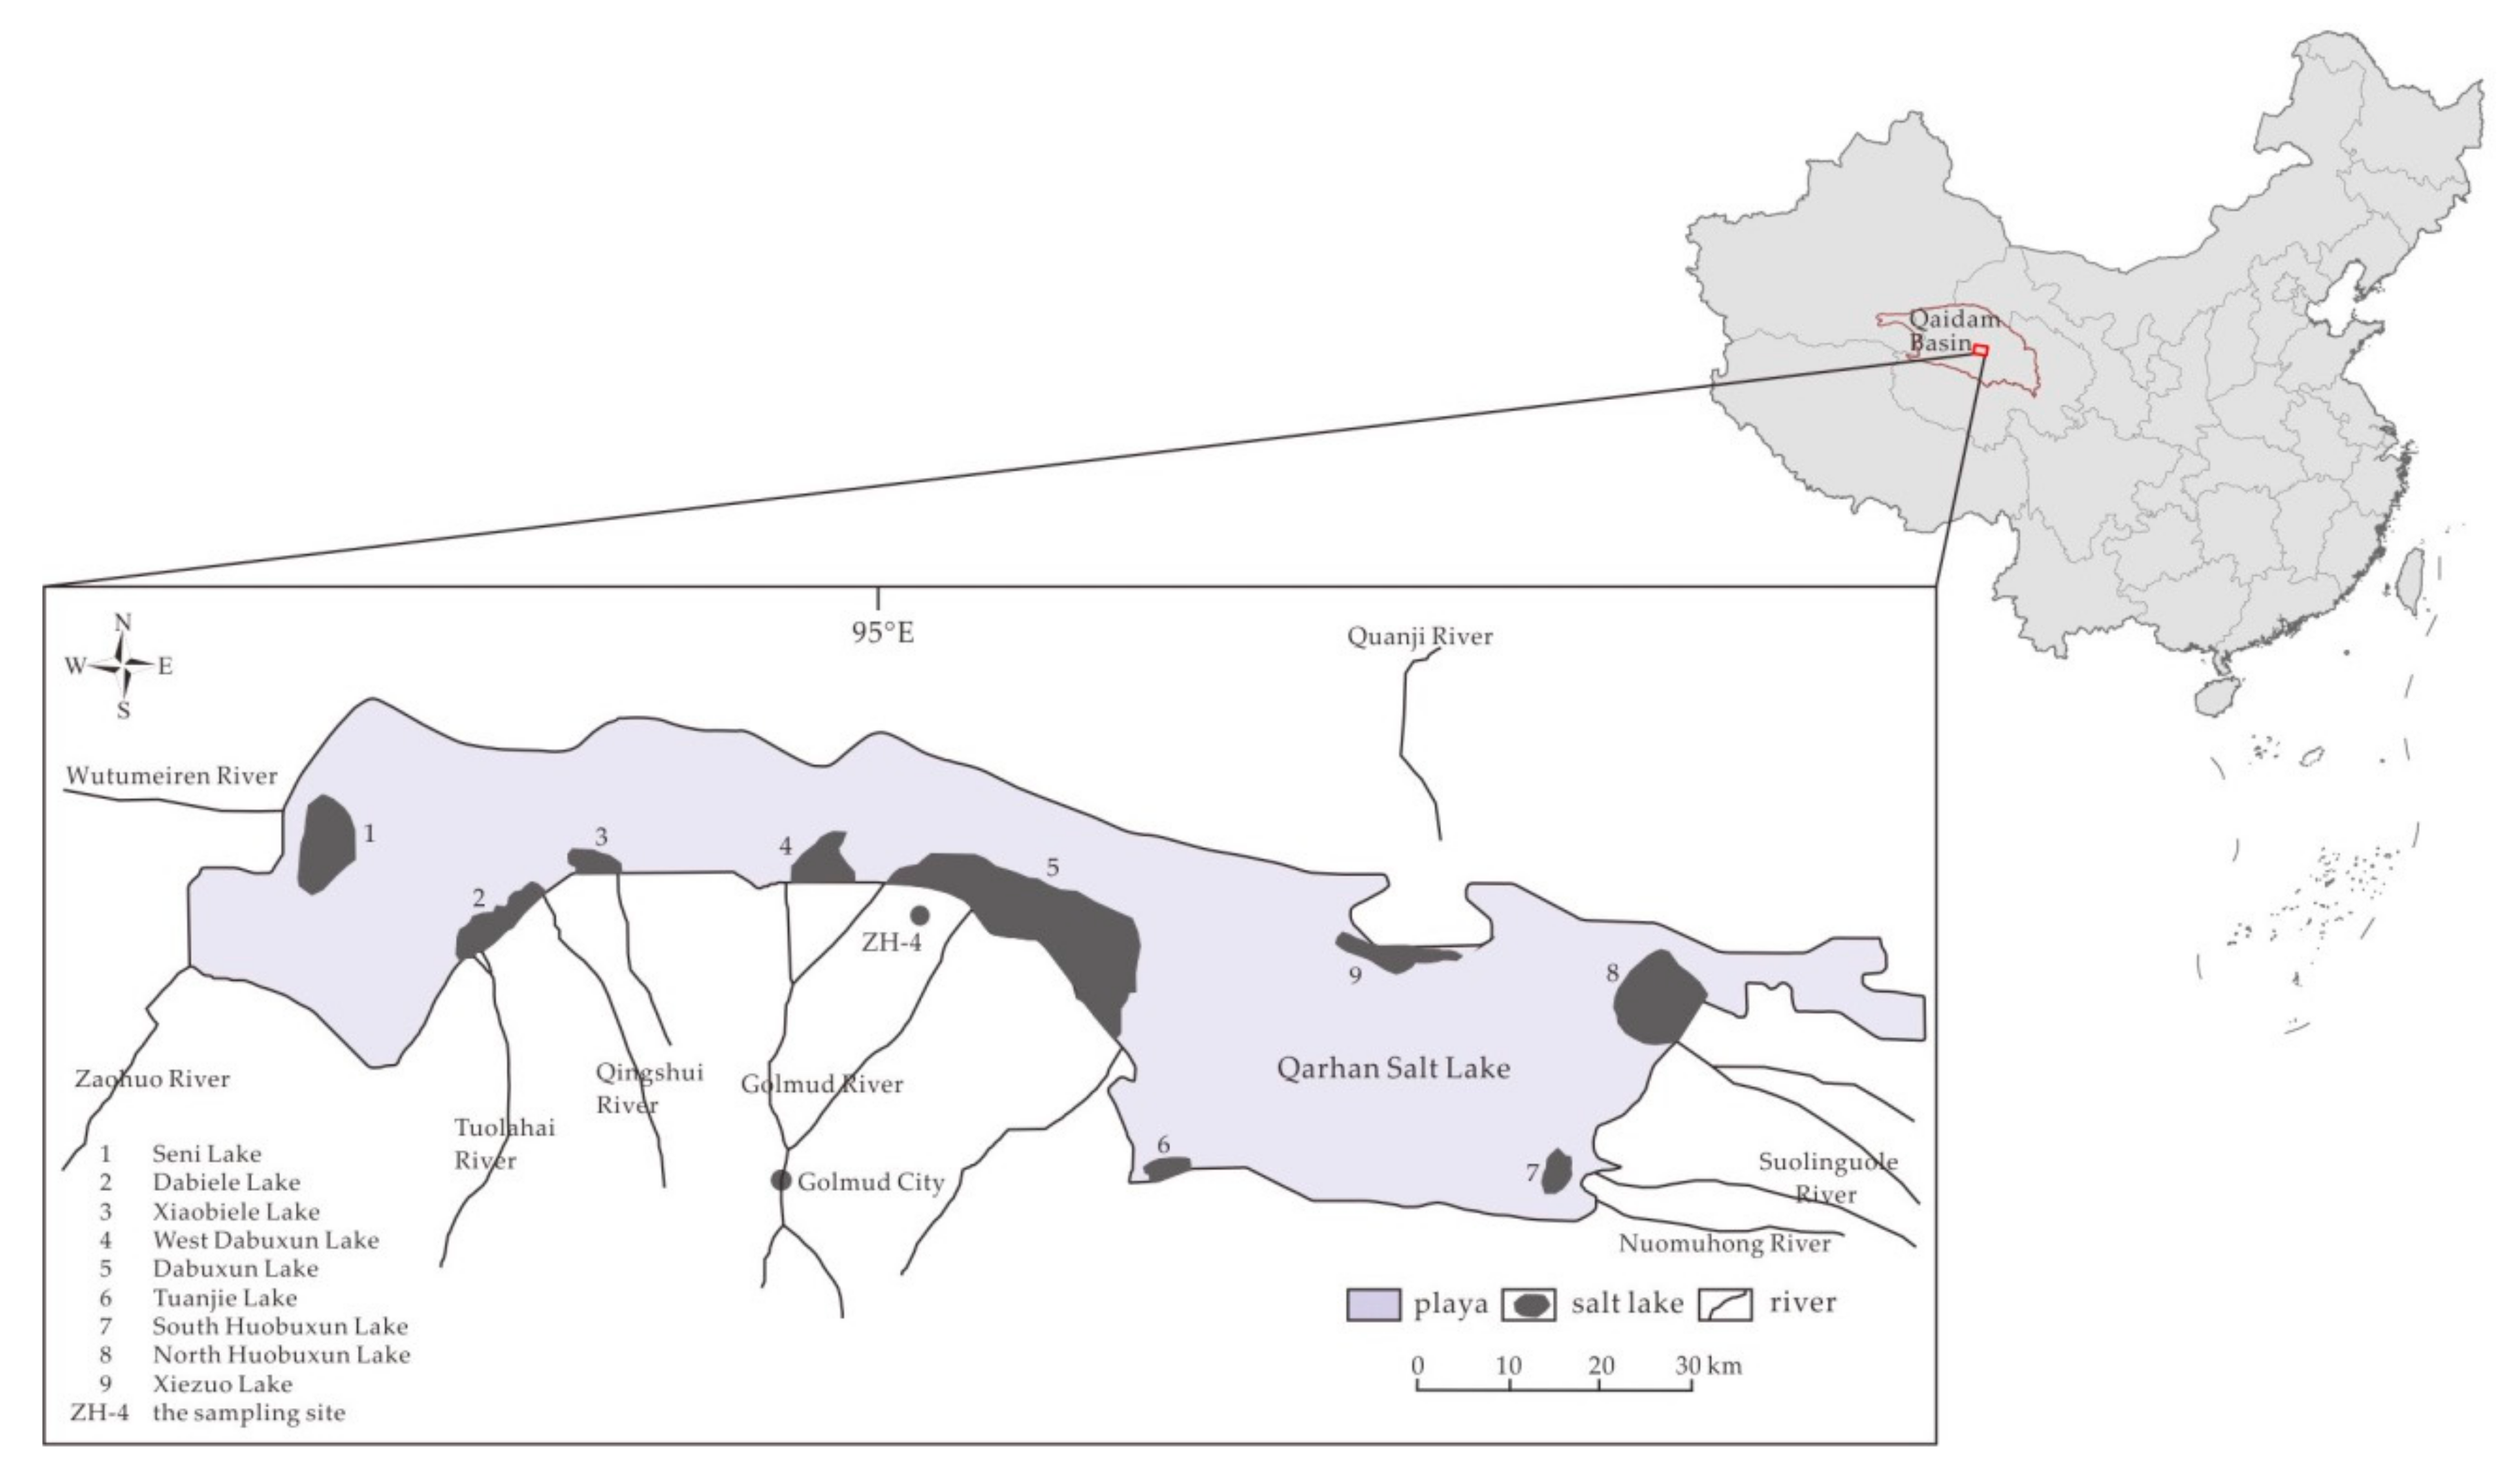
2.1. Sample Collection

In August 2018, a sediment core (36°54′16″ N, 95°4′41″ E) was taken by pressing a 10 cm diameter PVC pipe from the area in the confluence of the Golmud river and Qarhan Salt Lake, which is the largest playa in the eastern Qaidam Basin and is mainly influenced by inputs from the Golmud River (Figure 1). The site was chosen to reconstruct the environmental impact of human activities mainly characterized by salt lake mining activities, as it was minimally affected by human disturbance.
The 10 cm sediment core was sliced at 0.5 cm intervals, and 20 samples were stored in re-sealable plastic bags and transferred to the laboratory. Sediment samples were freeze-dried with lyophilizer and mechanically homogenized. Samples were sieved through 20 mesh, sealed in test tubes, and sent to the Key Laboratory of the Ministry of Education, Qinghai Normal University, Xining, China for measurement of 210Pb activities. Remaining samples were sieved to 200 mesh and sent to the ALS Chemex (Guangzhou) Co. Ltd. for the concentration analysis of 9 targeted potentially toxic elements (Al, As, Cd, Cr, Cu, Ni, P, Pb, and Zn).

2.2. Analyses

2.2.1. Elements and 210Pb

The samples for the analysis of the 9 targeted elemental concentration were digested by HNO3–HClO4–HF, steamed until nearly dry, diluted by HCl to a constant volume, and analyzed by inductively coupled plasma-atomic emission spectroscopy (ICP-AES; Agilent VISTA, California, CA, USA) and inductively coupled plasma mass spectrometry (ICP-MS; Agilent 7700x, California, CA, USA). The quality was controlled by inserting blank samples, standard samples (GBM908-10, MRGeo08, OGGeo08, and OREAS-45e) and duplicate samples to maintain both the relative deviation of precision control and the relative error of accuracy control below 10%.
The spectrum was obtained by a high-purity germanium gamma spectrometer (HPGe-γ; GCW3523, CANBERRA, Connecticut, CT, USA) and was analyzed by Genie-2000 software. The detection efficiency of the instrument was obtained by measuring a mixture of the standard mineral powder (RGU-N-3 and RGTh-N-3), seaweed powder with standard 137Cs (IAEA-2012-SAMPLE4), and natural sediments (Site 14 of the Chongming Dongtan, 31°30′36″ N, 121°58′12″ E), which was made into standard sources of different heights (5 mm, 10 mm, 20 mm, 30 mm, and 40 mm). The method was validated by testing the comparison samples of the International Atomic Energy Agency (IAEA), and the results agreed with the IAEA standard values [38]. Each sample was kept sealed for 22 days and was then tested for 12‒24 h to maintain the relative error below 5%. The total 210Pb was determined through the peak energy of 46.5 kev, while the supported 210Pb (226Ra) was through the 351.92 kev line of 214Pb in equilibrium [11]. The activities of excess 210Pb were then calculated by the total 210Pb activity minus the supported 210Pb activities.

2.2.2. Multivariate Statistical Analysis

The natural occurrence and chemical speciation of the elements can complicate the evaluation of potentially polluted aquatic sediments [39]. Hence, to identify pollution sources and distinguish natural and anthropic contributions, PCA/FA, CA and correlation coefficient analysis by Pearson correlation coefficients were performed using IBM 25.0 statistical software for windows in this study.
The PCA/FA was widely used to extract a small number of latent factors (principal components, PCs) when analyzing relationships among the observed variables [40]. Kaiser-Meyer-Olkin (KMO) and Bartlett’s sphericity tests were performed to examine the suitability of the data for FA [41]. To make the results more easily interpreted, the varimax normalized rotation of PCA was applied to maximize the variances of the factor loadings across the variables for each factor [36]. When the varimax normalized rotation of PCA was performed, each PC score contained information for all of the elements within a single number, while the loadings showed the relative contribution of each element to that score. To confirm results, CA is often coupled to PCA/FA to provide groupings of individual parameters and variables [42] and further classify elements with different sources on the basis of the similarities of their chemical properties. Therefore, CA was applied to the standardized data by factor scores, and the Pearson correlation was used as the criterion for the forming of clusters of elements.

2.2.3. Methods for Estimating Pollutant Impact and Ecological Risks

A crucial first step in evaluating the impact of sediment pollution and the level of contamination affecting a given area was to establish a reference background or baseline sample of known metal composition [43]. Average crustal values, average continental shale [44], average continental crust [45], or analyzing comparable local sediment unaffected by anthropogenic activity (e.g., samples from the area or reach the depth with minimal human disturbance) can be used as reference concentrations.
Elements pollution and ecological assessments were conducted using 3 enrichment indexes: Environmental factors (EF), modified the degree of contamination (mCd), and potential ecological risk index (RI); EF is mainly used to quantify anthropogenic influences on elements pollution [46] and is defined as follows:
EF = ( C x i R x ) / ( C b i R b )
where C x i and C b i are the measured concentration and background concentration of the element i in sediments, respectively; R x and R b are the measured concentration of the reference element and background concentration of the reference element in sediments, respectively. According to Sakan et al. [47]., an EF < 1 indicates no enrichment; 1 ≤ EF < 3 means minor enrichment; 3 ≤ EF < 5 is moderate enrichment; 5 ≤ EF < 10 is moderately severe enrichment; 10 ≤ EF < 25 is severe enrichment; 25 ≤ EF < 50 is very severe enrichment; and EF ≥ 50 is extremely severe enrichment.
Abrahim [48] presented a modified and generalized form of the Hakanson [16] equation:
m C d = i = 1 n C x i C b i n
where n refers to the number of analyzed elements. Abrahim and Parker [43] proposed the gradations as follows: m C d < 1.5 means a nil to very low degree of contamination; 1.5‒2 refers to a low degree of contamination; 2–4 represents a moderate degree of contamination; 4‒8 is a high degree of contamination; 8‒16 is a very high degree of contamination; 16‒32 is an extremely high degree of contamination; and ≥32 shows an ultra-high degree of contamination. The RI [16] was calculated as follows:
R I = i = 1 n T x i × C x i C b i
where T x i is the toxic factor of the ith target element [16]. When RI ≤ 150, it means low potential ecological risk; 150 < RI ≤ 300 refers to a moderate ecological risk; 300 < RI ≤ 600 represents a considerable ecological risk, and RI > 600 indicates that there is a very high ecological risk.

3. Results and Discussion

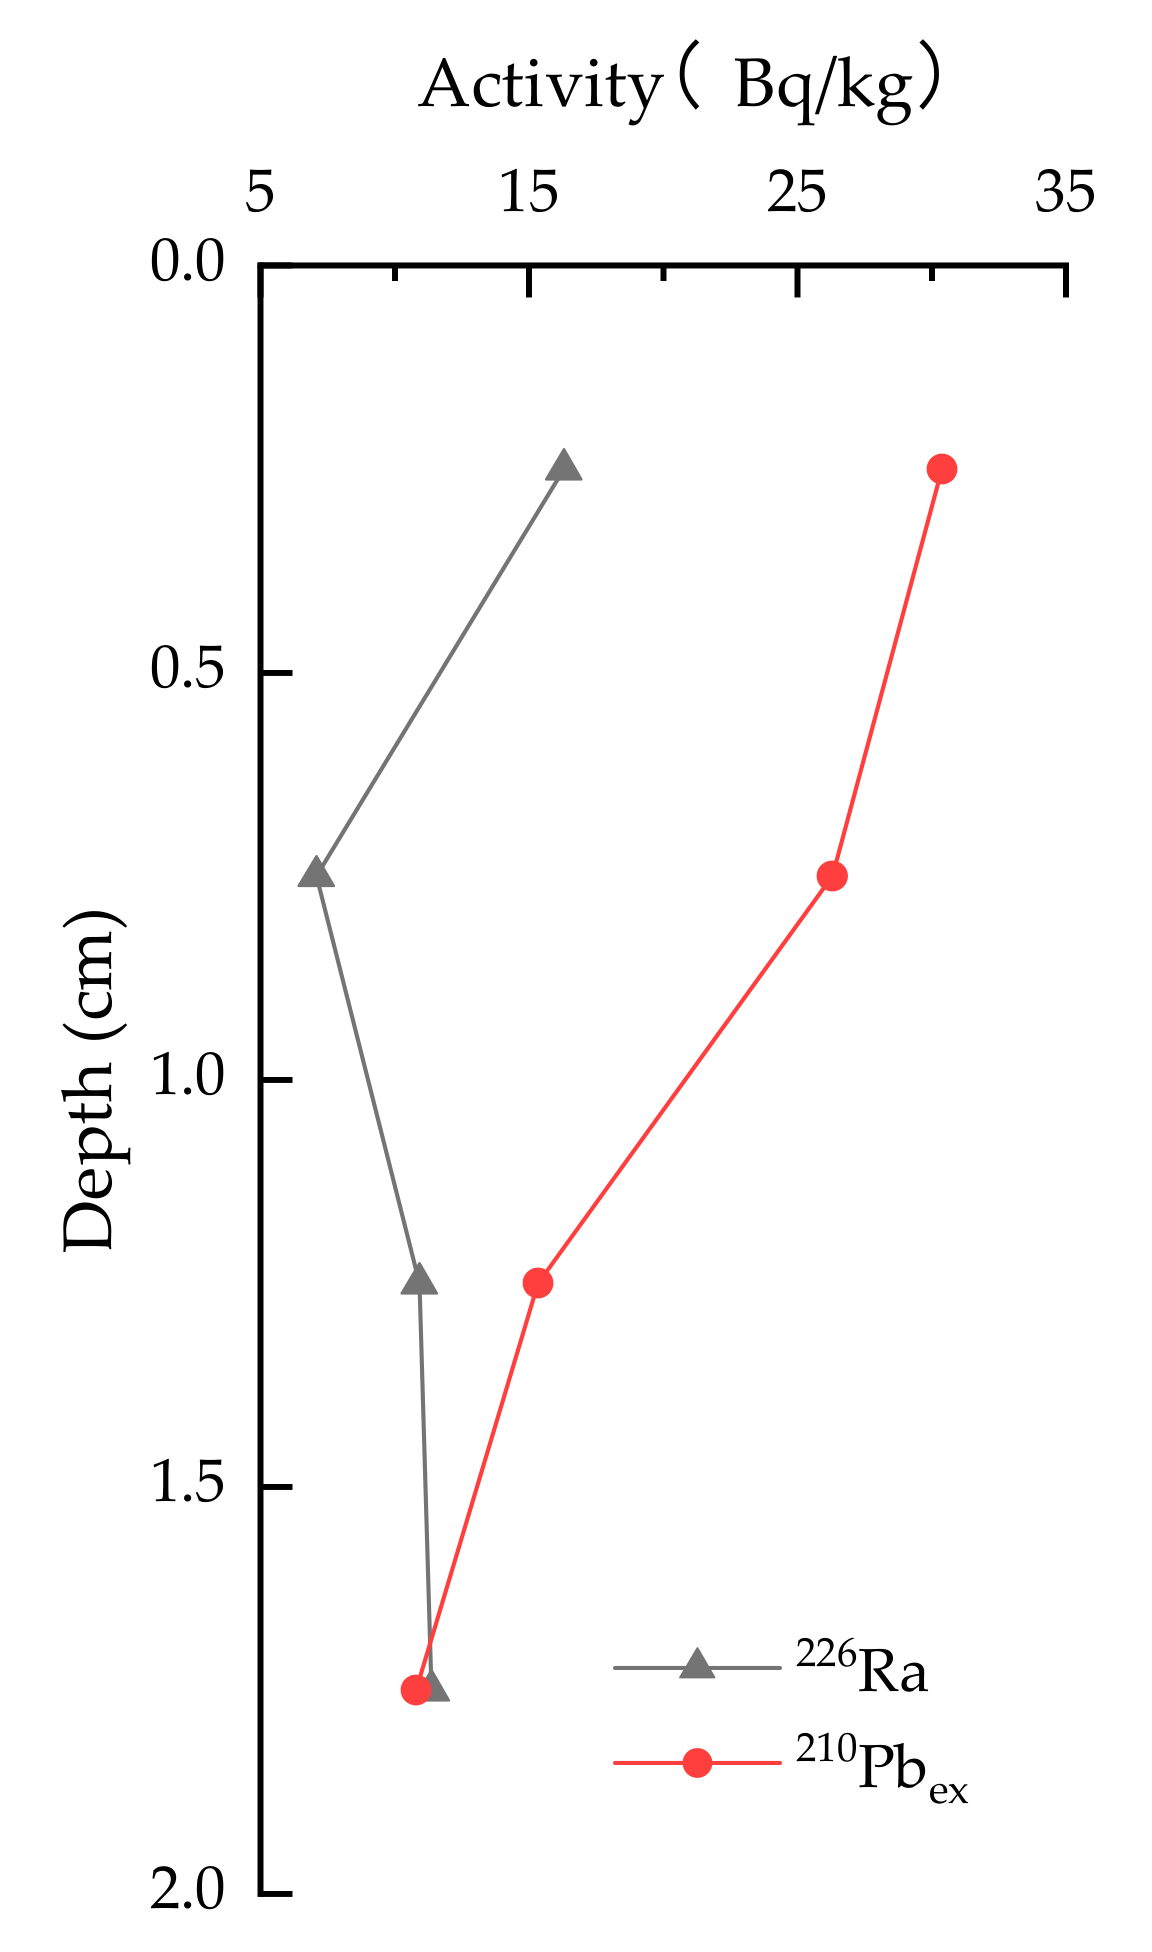
3.1. Sedimentation Rate

The 226Ra activity (Figure 2), with the mean value of 11.42 Bq/kg in the sediment core, can be considered to be in a steady state due to its small variation. This means that the excess 210Pb (210Pbex) activity (Figure 2; ranging from 10.79–30.38 Bq/kg with a median of 20.71 Bq/kg) is expected to decay exponentially following the radioactive decay law. Therefore the CIC model [11,13] was used to estimate the sedimentation rate. Unlike the constant rate of the 210Pb supply model, in the CIC model, it is not necessary to have precise knowledge of the total unsupported 210Pb inventory in the sediment core [49]. The equation of the CIC model is as follows:
D = v λ l n A 0 v λ l n A t
where v is the sedimentation rate; λ is the decay constant of 210Pb; A0 (Bq/kg) is the initial 210Pbex activity at the sediment–water interface; At (Bq/kg) is the 210Pbex activity at the depth D (cm). The absolute value of the slope after linear fitting is 1.3172 (coefficient of determination; R2 = 0.8996) and the sedimentation rate can be calculated as 0.041 cm/y.
Determination of the background levels of trace metals in soils and sediments is important for the proper assessment of the degree of pollution [50]. According to the sedimentation rate calculated in this study, the core reached the depth with little human disturbance, where, therefore, can be used as the reference concentration.

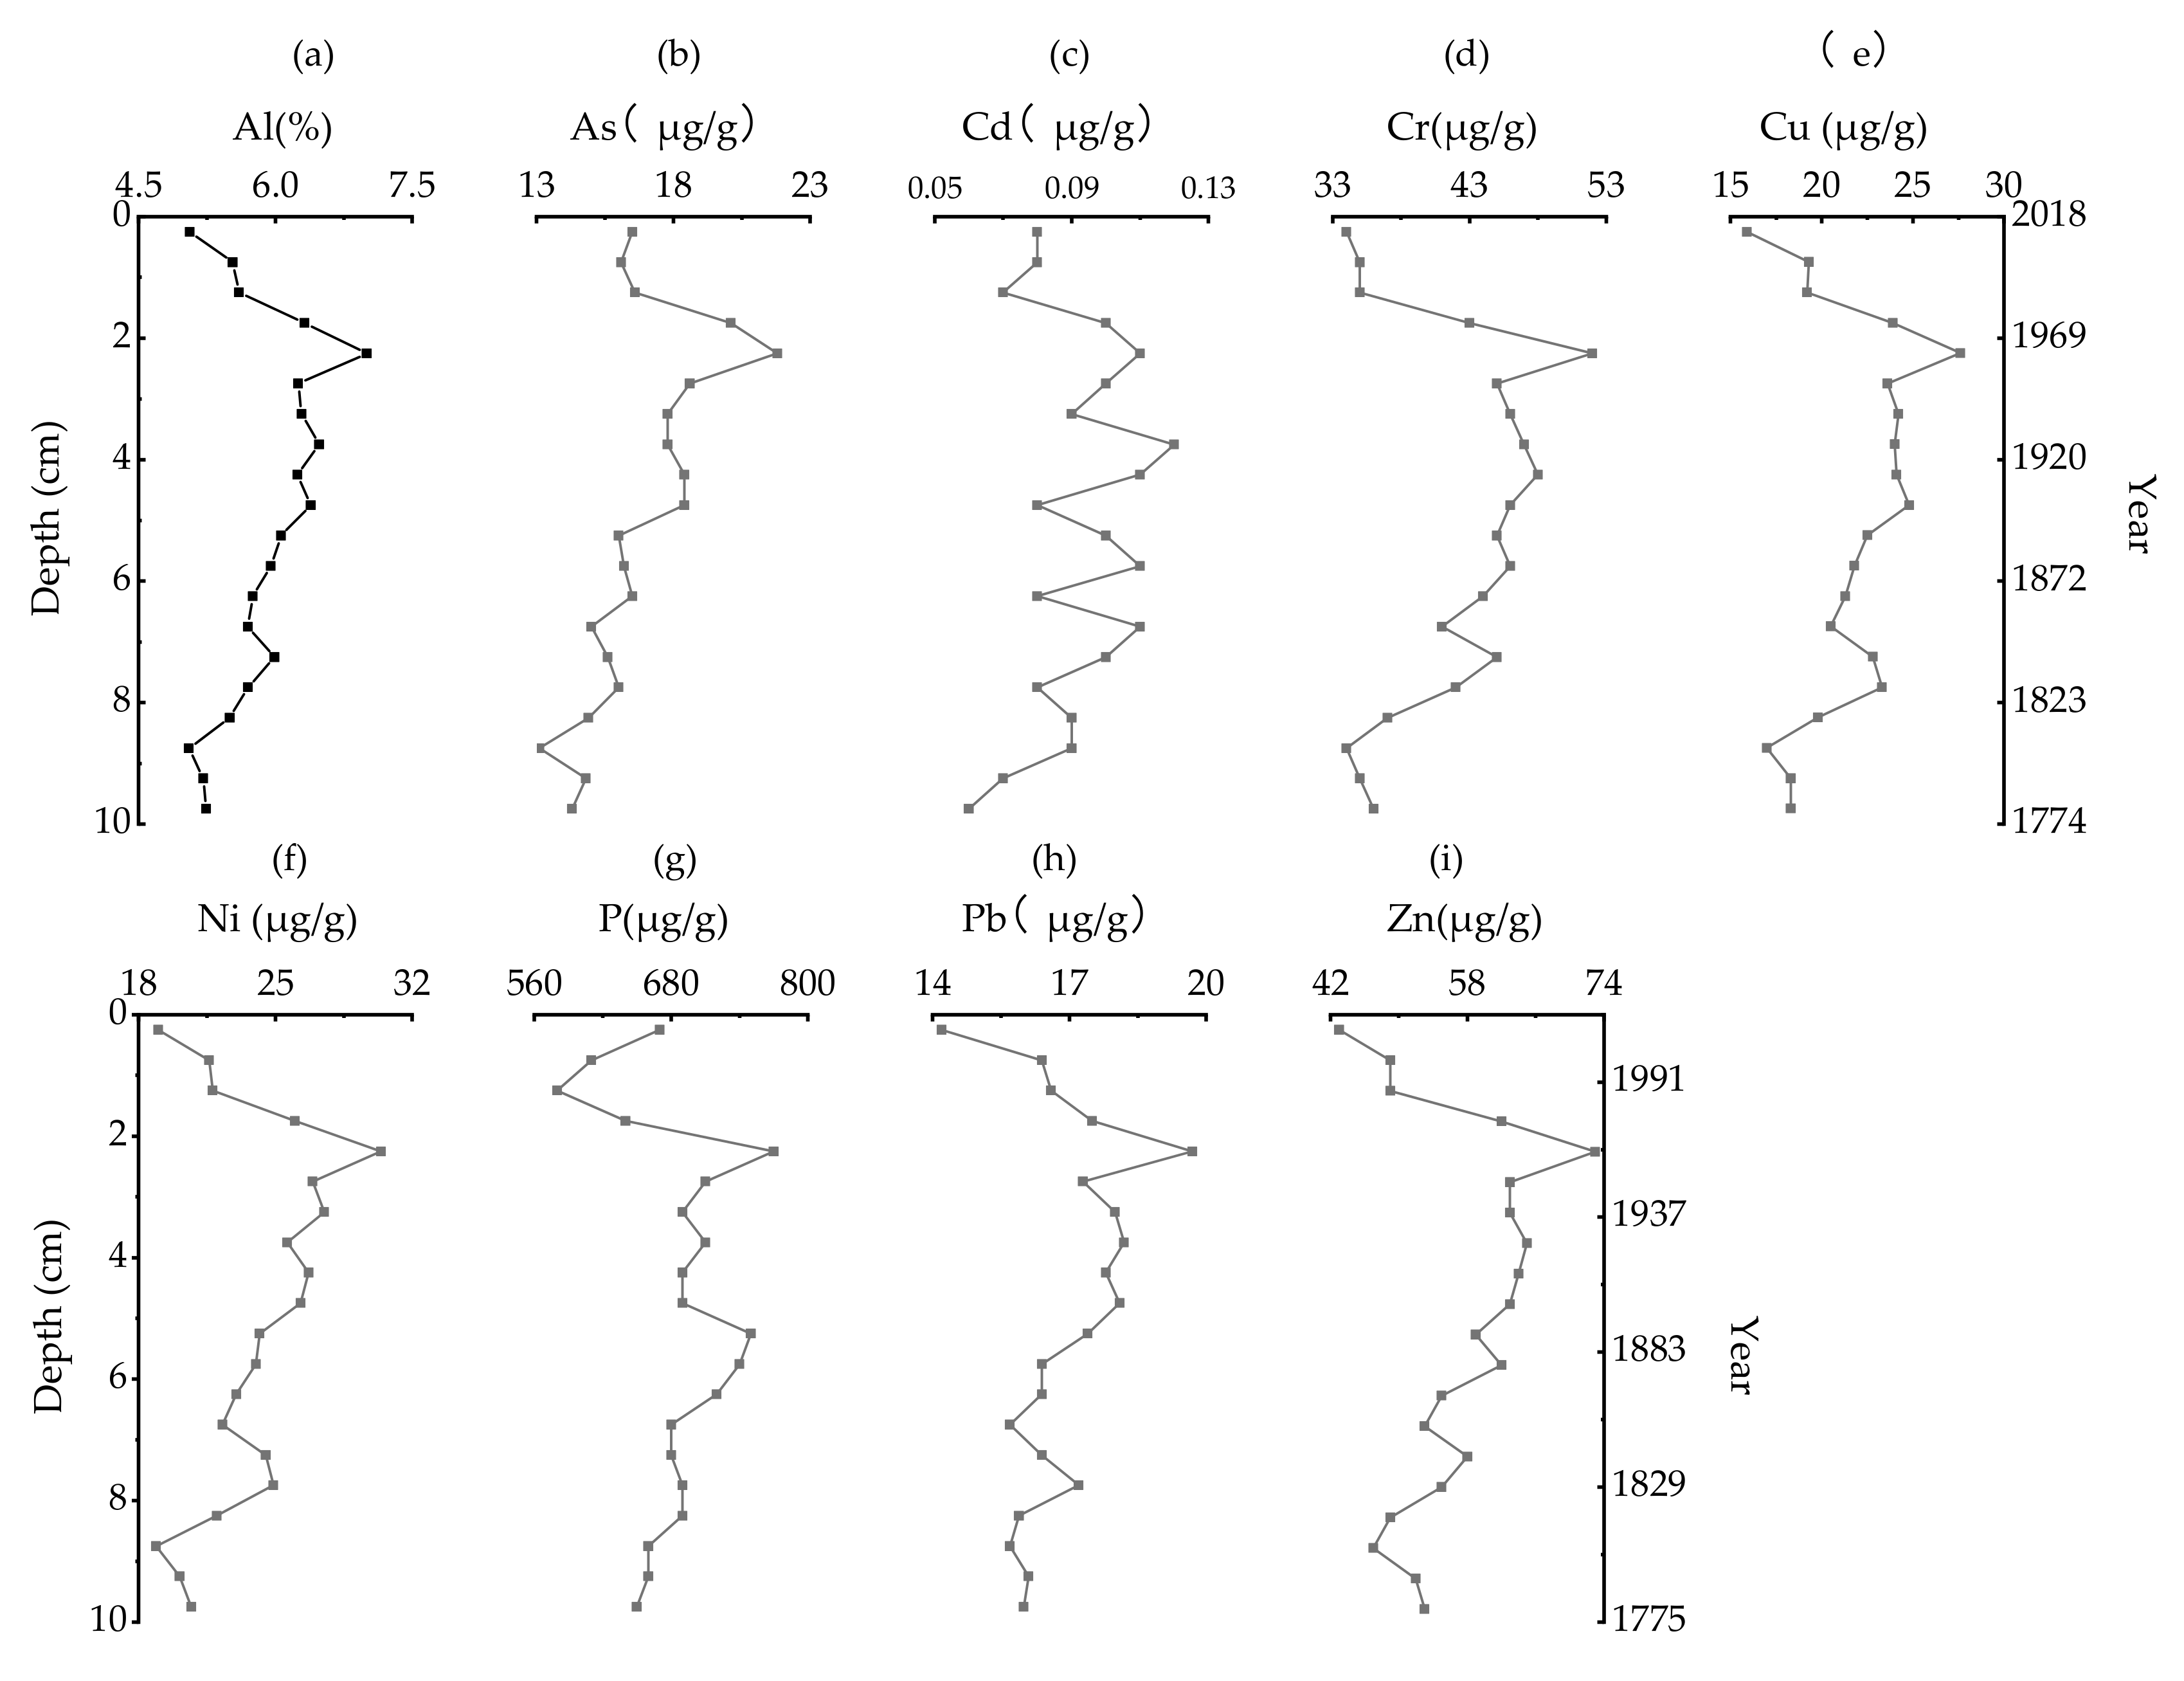
3.2. General Features of Elements

The basic statistical parameters for the potentially toxic elements contents are summarized in Table 1. The concentrations of Al, As, Cd, Cr, Cu, Ni, P, Pb, and Zn in the core ZH4 ranged from 5.05–7.00%, 13.10–21.80 µg/g, 0.06–0.12 µg/g, 34.00–52.00 µg/g, 15.90–27.60 µg/g, 18.90–30.40 µg/g, 580.00–770.00 µg/g, 14.20–19.70 µg/g and 43.00–73.00 µg/g, respectively, with mean concentrations of 5.87%, 6.73 µg/g, 0.09 µg/g, 41.80 µg/g, 21.11 µg/g, 23.82 µg/g, 684 µg/g, 16.85 µg/g, and 56.85 µg/g, respectively. Therefore, the total elements concentrations followed the decreasing order: P > Al > Zn > Cr > Ni > Cu > Pb > As > Cd. Similar variation trends were evident for Al, As, Cr, Cu, Ni, Pb and Zn, which slowly increased until approximately 1963 when they reached peak values and then decreased until 2018. The coefficients of variance (CV) of Al, As, Cr, Cu, Ni, P, Pb, and Z were 8.69%, 12.01%, 12.85%, 13.51%, 12.48%, 6.41%, 6.96%, and 12.95%, respectively, which indicated small variation (CV < 15% [51]); while the CV of Cr (17.37%) indicated moderate variations, denoting a heterogeneous distribution.
The vertical distributions of the concentrations of Al, As, Cd, Cr, Cu, Ni, P, Pb, and Zn are showed in Figure 3. The peak value was around 1.75 cm to 2.75 cm, according to the sedimentation rate calculated above, which showed increasing human or natural metal input in the region from 1950 to 1975, when China was undergoing economic reform and the Qarhan Salt Lake began to be exploited and mined. Moreover, the peak of Pb coincided with the massive use of Pb as an additive in petrol from 1950 [52]. The Qarhan Salt Lake had only the potash industry during this period and far away from the city and other industry areas. Therefore, the anthropogenic Pb source may be related to the introduction of leaded petrol on transport from the adjacent road.

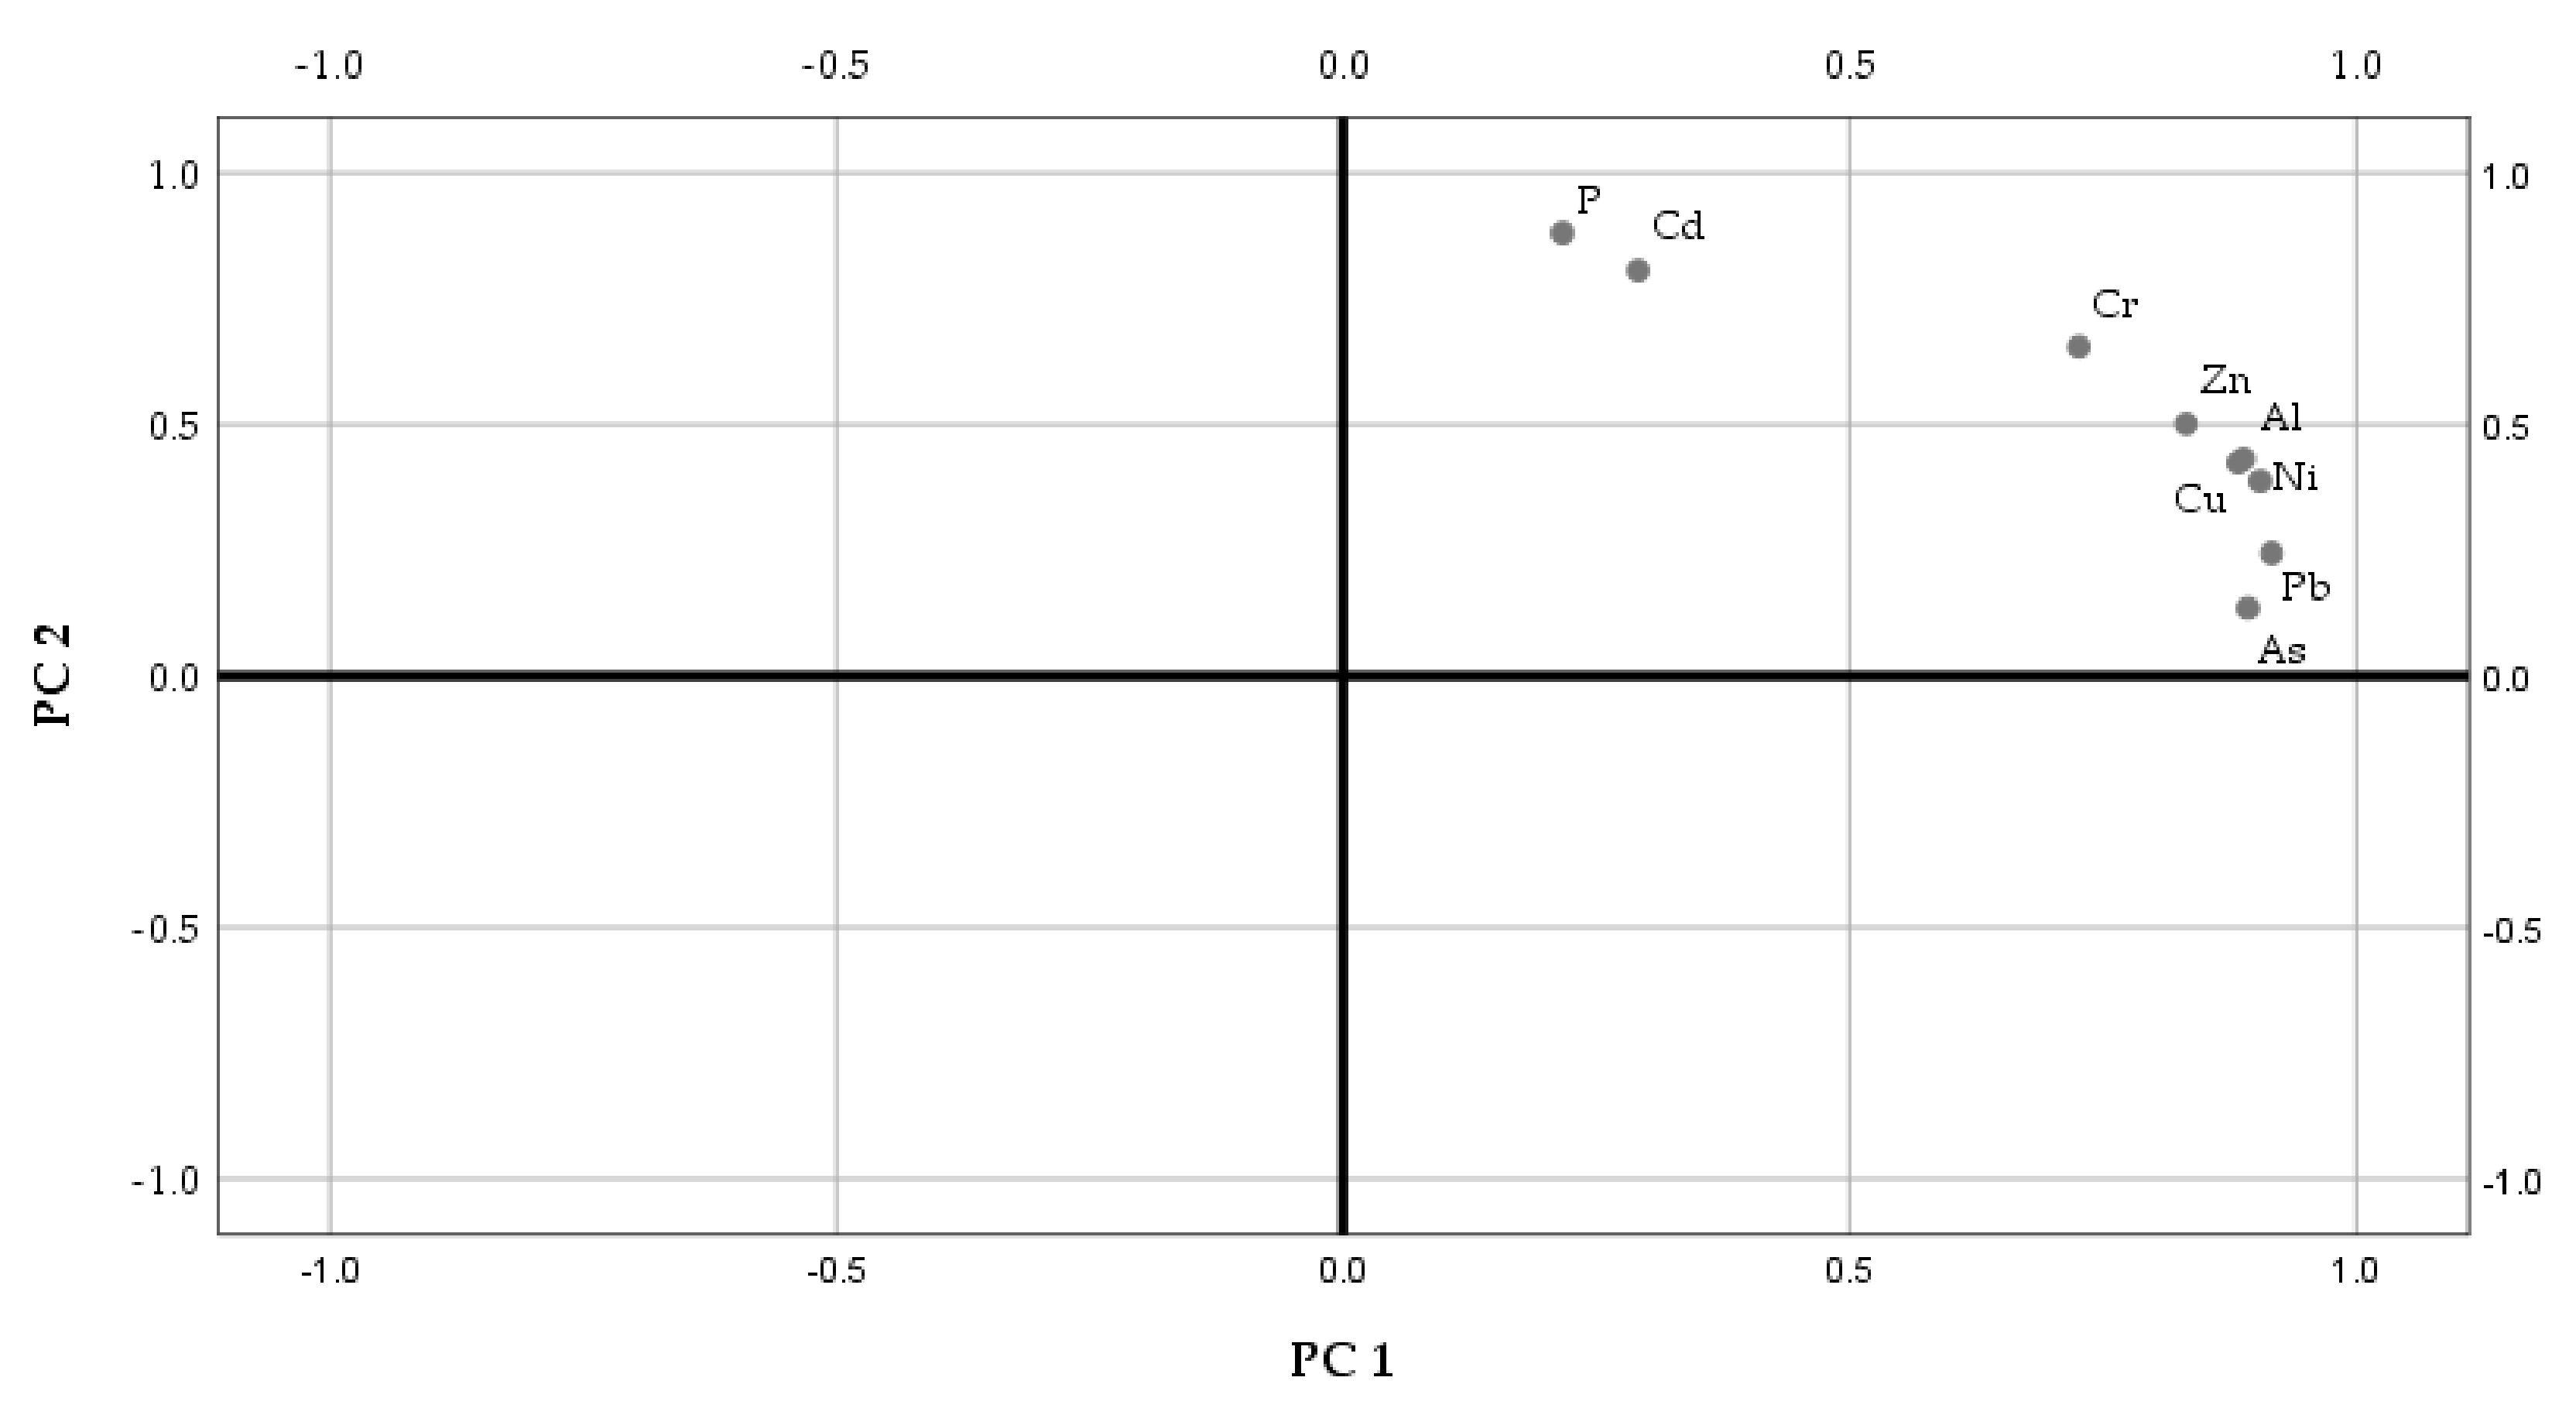
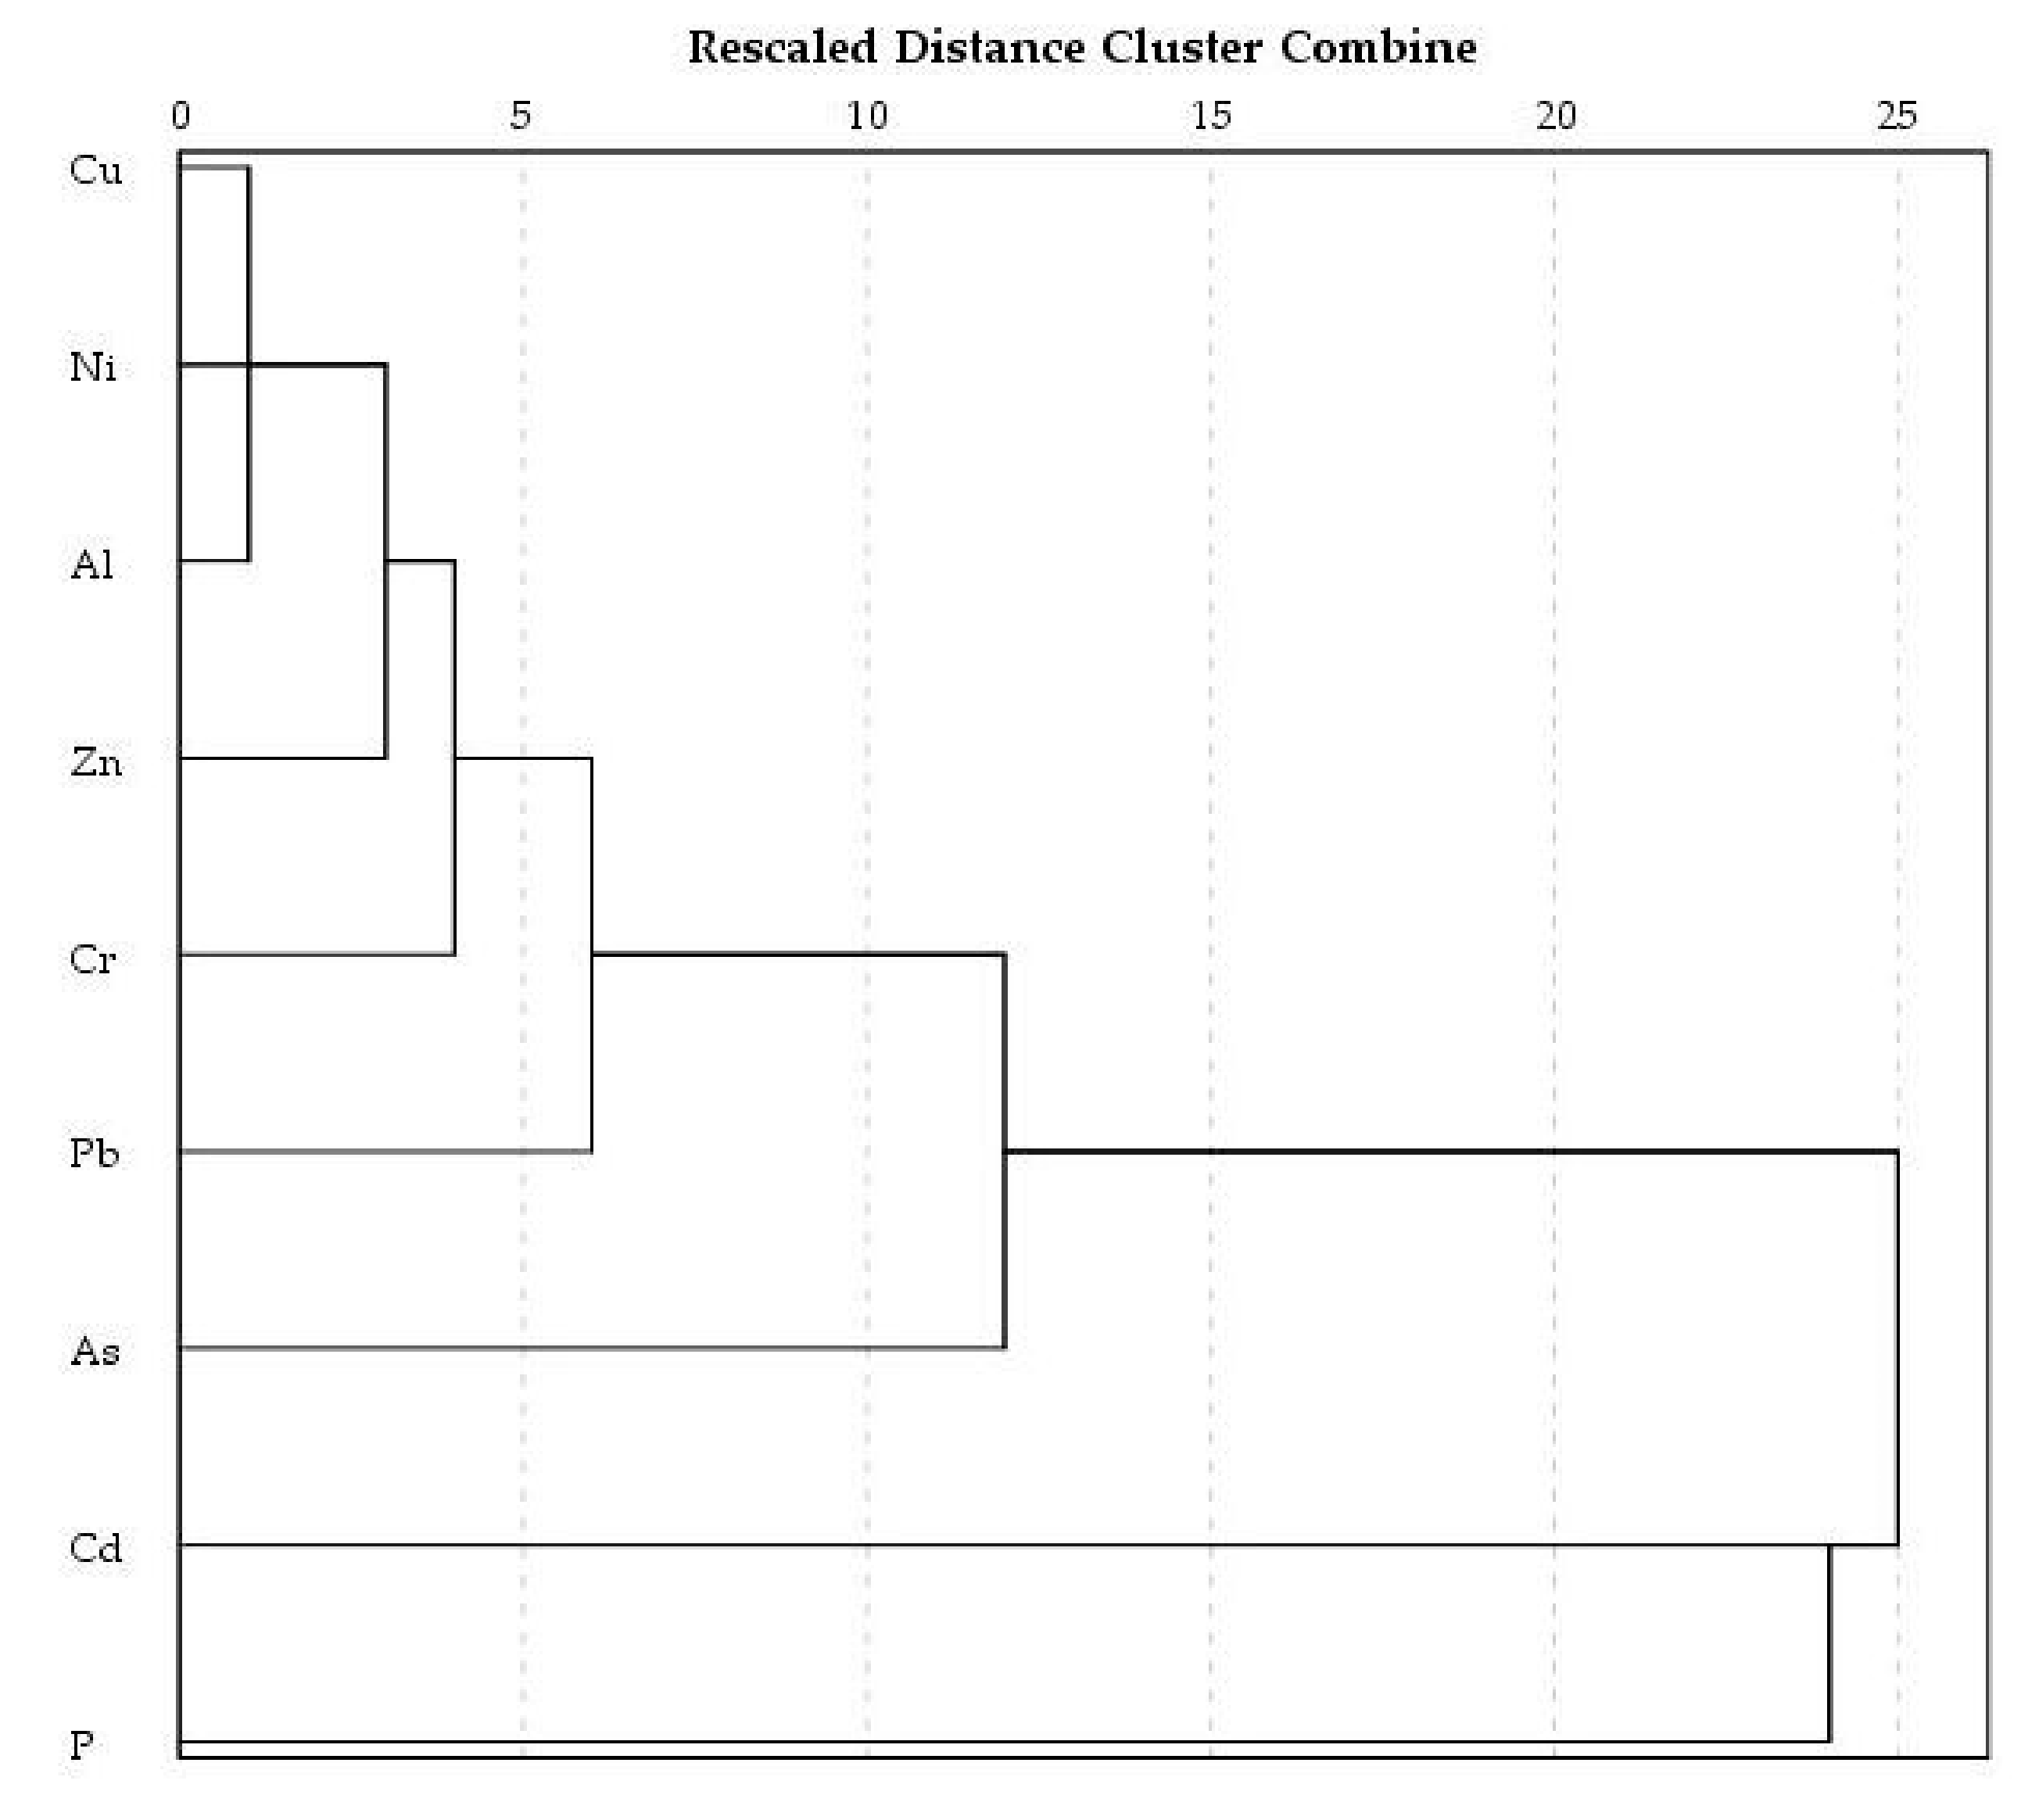
3.3. Multivariate Statistical Analysis

In this study, two PCs could be extracted after varimax rotation, which accounted for 89.798% of the total variance. The first PC1 showed 59.796% of the total variance, with the eigenvalue of 7.120. The second PC2 showed 30.001% of the total variance, with the eigenvalue of 0.961. The communalities of variables varied from 0.734 to 0.977. The factor loadings and component plot in rotated space are shown in Table 2 and Figure 4, respectively. The loading of rotated component >0.70 was considered significant for potentially toxic elements [53,54]. In this study, the PC1 was dominated with Al, As, Cd, Ni, Pb, and Zn, which relate to the natural sources of Al as a lithophile element, which was less disturbed by human activities during sedimentary [55]; the PC2 with Cd and P represents anthropogenic sources. The factor loadings of Cr in PC1 and PC2 were 0.726 and 0.655, indicating that Cr may be derived from both natural and anthropogenic sources. Cr stability exists in nature in two valence states, i.e., trivalency and pentavalency. Trivalent chromium is relatively insoluble and has almost no toxicity and is mainly derived from the weathering of the basin, while pentavalent chromium, with high solubility and high toxicity, is usually derived from wastewater [56].
The CA was performed to group the analyzed elements; the dendrogram (Figure 5) showed two statistically significant clusters. Cluster 1 included Al, As, Cu, Cr, Ni, Pb, and Zn, and Cluster 2 included P and Cd, which was consistent with the PCA/FA.
The correlation matrix (Table 3) was calculated for elements in the sediments to establish relationships among them and determine the common source of elements. Among the nine elements, Al, a lithogenic element, was considered to be conservative, unreactive, and insoluble under most sedimentary conditions; hence, its geochemical characteristics could be the main contribution for the concentration of Al [57], which indicates that Al is controlled mainly by the weathering process, rather than anthropogenic disturbance. Moreover, Al is mainly derived from alumina-silicates, and it dominates the carrier phase for absorbed trace elements [58,59]. Significant positive correlations were found between Al, As, Cu, Ni, Pb, and Zn, which may suggest that these elements originated from similar sources, or that the occurrence of these metals in the core was controlled by similar geochemical processes. This suggests that compared to natural sources, anthropogenic sources of Pb was minor. Further research for the possible source apportionment and contamination history of Pb can be confirmed by the combination of the stable Pb isotope ratio analysis and 210Pb dating technology [52,60,61]. Correlations between Cd and Ni, P and Al, and P and Ni were significant at P < 0.01, while Cd and P had low associations with Pb and As. The results also coincided with that of CA and PCA, which showed Cd and P had a different (possibly anthropogenic) source than Al, As, Cu, Ni, Pb, and Zn. Cd is toxic, relatively soluble, and can easily accumulate in aquatic organisms; Cd in soils is mainly from the use of agricultural phosphate fertilizers [62]. High concentrations of P may be caused by the increased intensity of human activities (e.g., urban sewage and industrial discharge, agricultural activities, and tourism) [63].

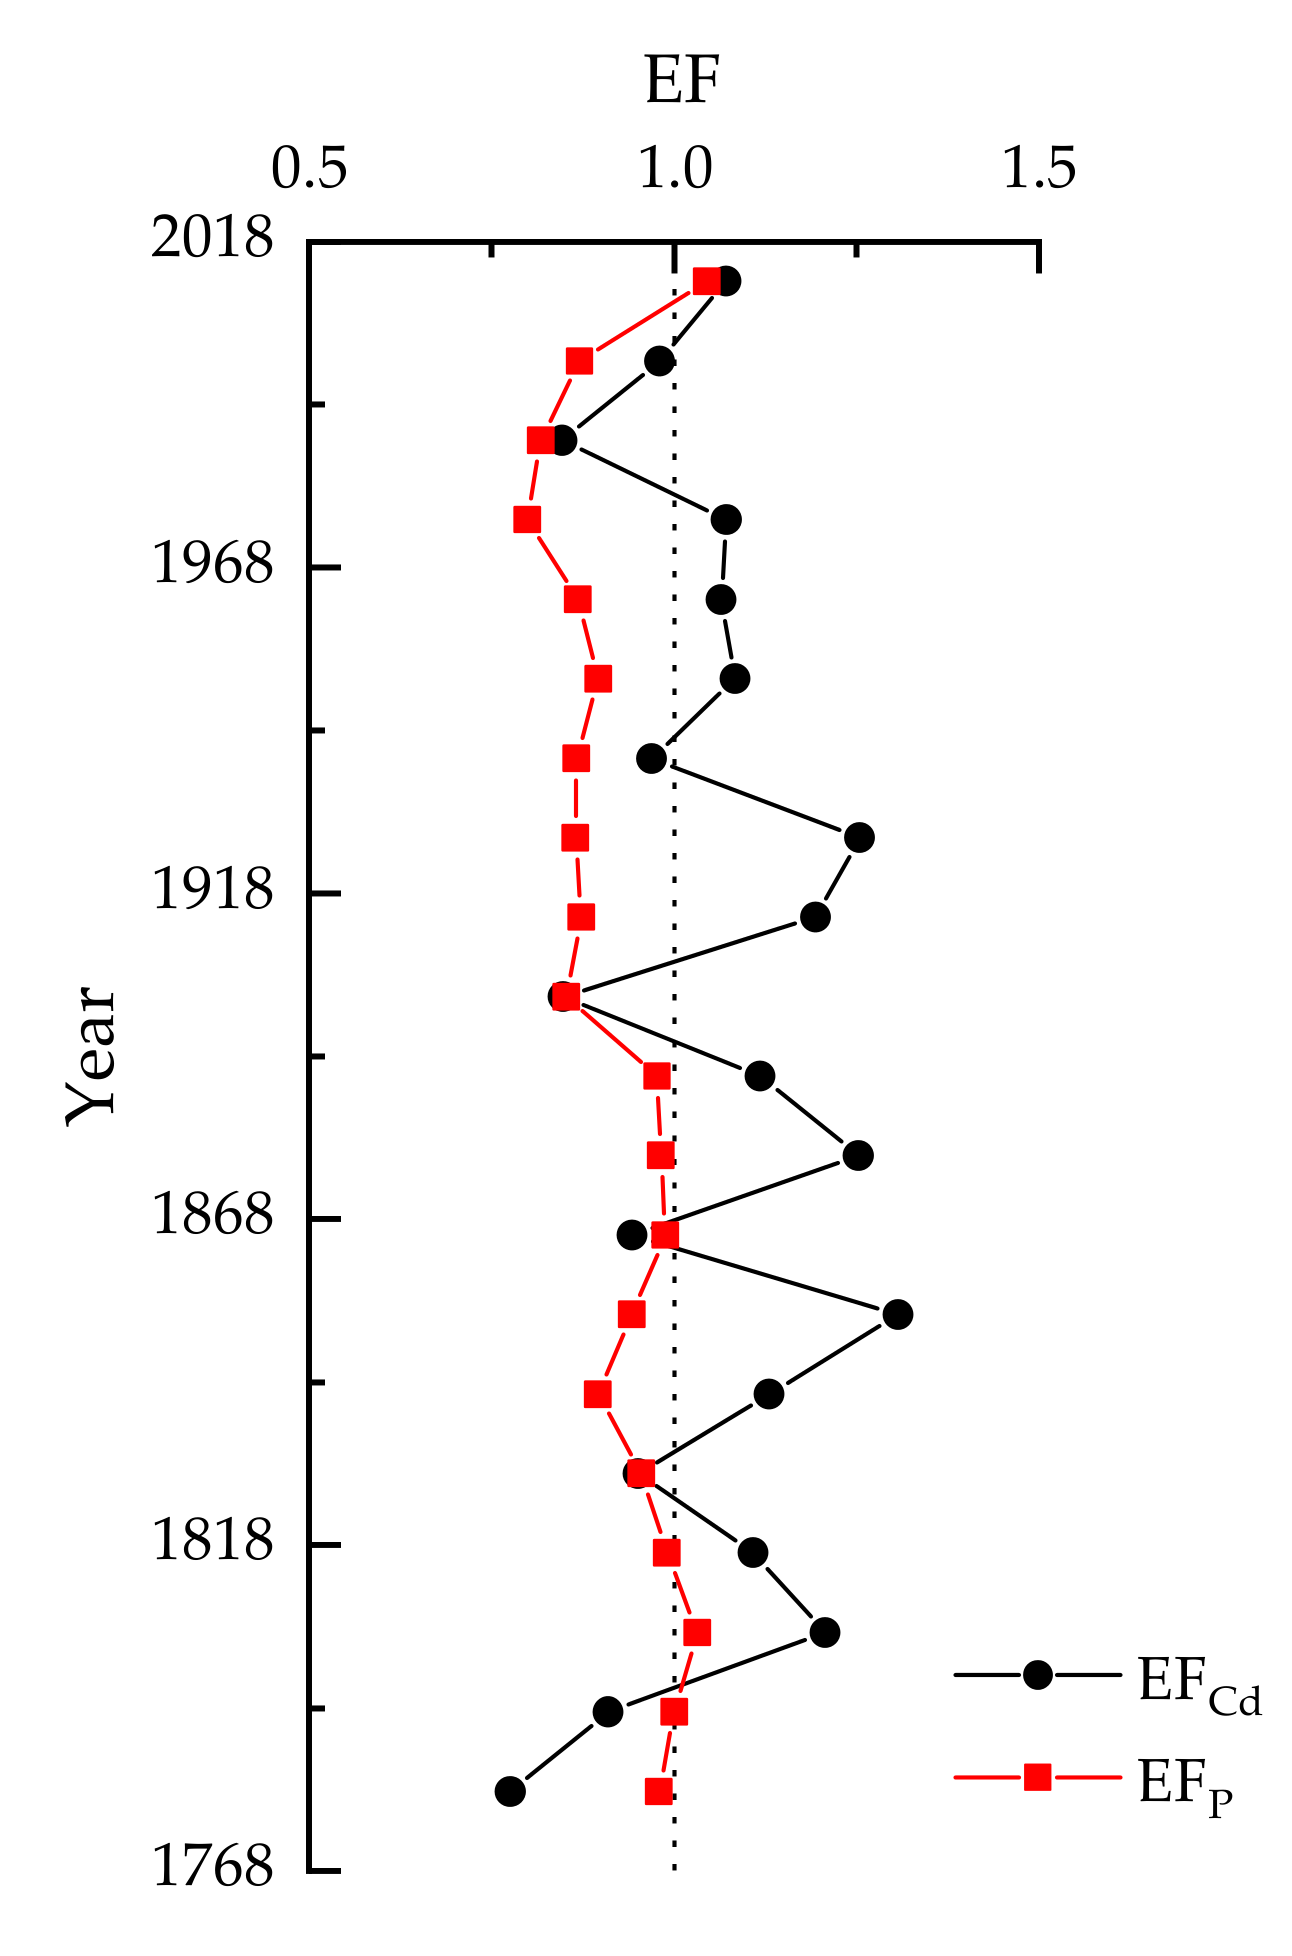
3.4. Pollution and Ecological Assessment

The background concentrations for trace metals can be determined by the core sediment, which reached unpolluted layers that were deposited prior to the industrial development of the surrounding area [64]. In this study, we took the mean of the bottom concentrations as the background values and calculated the EF.
The elements Al, Mn, Fe, Ti, or Ca can generally serve as reference elements for the calculation of EF values [65]. In this study, Al was used as a reference element to reduce the influence of the sediment texture on trace element pollution due to its main conservative lithogenic sources [66]. The values of EF were 0.64–1.43, and the median was 1.08, which shows that there was nil to minor enrichment in the core. The EF values of Cd and P (EFCd and EFP) should be key considerations for their anthropogenic origin.
The values of EFCd and EFP changed with time and were showed in Figure 6; the EFP after 1975 and the EFCd after 1987 in the surface layer had increasing tendencies corresponding to the time of Chinese economic reform and Qarhan Salt Lake development and utilization. Figure 7 shows the gross domestic product of Haixi state, gross industrial production of Haixi state, and gross industrial production of Qinghai Salt Lake Industry Group Co., located in the Qarhan Salt Lake, which is the biggest potash fertilizer industrial production base in China. Clearly, the growing trend of the GDP of Haixi state (or gross industrial production of Haixi state and gross industrial production of Qinghai Salt Lake Industry Group Co.) can be seen in recent decades, which imply that industrial manufacturing and human activities were the principal factors in the inputs of Cd and P.
The mCd and RI values and statistical parameters are shown in Table 4. The mCd values ranged from 0.96 to 1.40; as they were all <1.5, this indicates that the sediments all had the status of nil to very low contamination degree [43]. The RI values in sediments ranged from 51.40 to 83.38 with a median of 67.63. Based on a RI ranking criterion [17], thus far all the samples exhibited low ecological risk. Because of river transport and sedimentation, the elemental concentration in the sediments was diluted compared to that in soils as reported by Wu et al. [26] and Li et al. [37], whose results showed high potential and considerable ecological and health risks near our research area. Moreover, Wang [68] also found low ecological risk and increasing trend of RI in the Lake Qinghai, which is in the northeastern Qinghai-Tibet Plateau, as well as having more anthropogenic disturbances because of tourism. Though the contamination degree and ecological risk are low, the rising tendencies of mCd and RI in the surface layer should also be of concern, which could be attributed to human activity and economic growth.

4. Conclusions

The sedimentation rate of the study area was calculated by the CIC model with the result of 0.041 cm/y. The concentrations of Al, As, Cd, Cr, Cu, Ni, P, Pb, and Zn in the core ZH4 ranged from 5.05–7.00%, 13.10–21.80 µg/g, 0.06–0.12 µg/g, 34.00–52.00 µg/g, 15.90–27.60 µg/g, 18.90–30.40 µg/g, 580.00–770.00 µg/g, 14.20–19.70 µg/g, and 43.00–73.00 µg/g, respectively, with mean concentrations of 5.87%, 6.73 µg/g, 0.09 µg/g, 41.80 µg/g, 21.11 µg/g, 23.82 µg/g, 684 µg/g, 16.85 µg/g, and 56.85 µg/g, respectively. Through the CA, PCA, and Pearson correlation coefficients analyses, it was determined that Al, As, Cu, Ni, Pb, and Zn were mainly derived from natural sources, whereas Cd and P were mainly from anthropogenic input and Cr may have been derived from both sources. The potentially toxic elements pollution and ecological risk assessment by EF, mCd, and RI showed that there was no enrichment to minor enrichment, the studied area had the status of nil to very low contamination degree, and it exhibited a low ecological risk, respectively. The EFCd and EFP showed an increasing trend in the surface from 1987 and 1975, respectively, which coincided with the time of Chinese economic reform and the Qarhan Salt Lake development and utilization. In addition, the increasing trend of the gross domestic product of Haixi state, the gross industrial production of Haixi state, and the gross industrial production of Qinghai Salt Lake Industry Group Co. proved that the Cd and P were related to anthropogenic industrial and economic activities. Emphasis should be given to Cd and P contamination in further developments, and the data obtained in this study can be used to suggest a comparison and reference for elements assessments in the future.

Author Contributions

Conceptualization, J.W., J.X.; methodology, formal analysis, data curation, writing—original draft preparation, J.X.; visualization J.X., J.H.; investigation, J.X., L.C., Q.W., J.H., Q.L., and Z.L.; writing—review and editing, J.W., J.X. and Q.W.; supervision, project administration, funding acquisition J.W.

Funding

This research was funded by the National Natural Science Foundation of China, grant number 41671521, the National Key Research and Development Program of China, grant number 2018YFC0406605 and the Science and Technology Plan of Qinghai Province of China, grant number 2018-ZJ-T03.

Conflicts of Interest

The authors declare no conflict of interest. The funders had no role in the design of the study; in the collection, analyses, or interpretation of data; in the writing of the manuscript, or in the decision to publish the results.

References

  1. Lee, K.; Hur, S.D.; Hou, S.; Burn-Nunes, L.J.; Hong, S.; Barbante, C.; Boutron, C.F.; Rosman, K.J.R. Isotopic signatures for natural versus anthropogenic Pb in high-altitude Mt. Everest ice cores during the past 800 years. Sci. Total. Environ. 2011, 412–413, 194–202. [Google Scholar] [CrossRef] [PubMed]
  2. Nriagu, J.O. A history of global metal pollution. Science 1996, 272, 223–224. [Google Scholar] [CrossRef]
  3. Bennion, H.; Battarbee, R. The European Union water framework directive: Opportunities for palaeolimnology. J. Paleolimnol. 2007, 38, 285–295. [Google Scholar] [CrossRef]
  4. Wu, J.; Duan, D.; Jian, L.; Luo, Y.; Wen, X.; Guo, X.; Boman, B.J. Inorganic pollution around the Qinghai-Tibet Plateau: An overview of the current observations. Sci. Total. Environ. 2016, 550, 628–636. [Google Scholar] [CrossRef] [PubMed]
  5. Sha, Z.J.; Wang, Q.; Wang, J.; Du, J.; Hu, J.; Ma, Y.; Kong, F.; Wang, Z. Regional environmental change and human activity over the past hundred years recorded in the sedimentary record of Lake Qinghai, China. Environ. Sci. Pollut. Res. Int. 2017, 24, 9662. [Google Scholar] [CrossRef] [PubMed]
  6. Wan, D.; Mao, X.; Jin, Z.; Song, L.; Yang, J.; Yang, H. Sedimentary biogeochemical record in Lake Gonghai: Implications for recent lake changes in relatively remote areas of China. Sci. Total. Environ. 2019, 649, 929–937. [Google Scholar] [CrossRef] [PubMed]
  7. Kuzyk, Z.Z.A.; McDonald, R.W.; Johannessen, S.C. Calculating rates and dates and interpreting contaminant profiles in biomixed sediments. In Environmental Contaminants; Jules, M.B., Michael, R.R., Eds.; Springer: Dordrecht, The Netherlands, 2015; pp. 61–87. [Google Scholar]
  8. Marchand, C.; Allenbach, M. Redox conditions and heavy metals distribution in mangrove forests receiving effluents from shrimp farms (Teremba Bay, New Caledonia). J. Soils Sediments 2011, 11, 529–541. [Google Scholar] [CrossRef]
  9. Li, X.; Wang, Y.; Li, B.; Feng, C.; Chen, Y.; Shen, Z. Distribution and speciation of heavy metals in surface sediments from the Yangtze estuary and coastal areas. Environ. Earth Sci. 2013, 69, 1537–1547. [Google Scholar] [CrossRef]
  10. Costa-Böddeker, S.; Hoelzmann, P.; de Stigter, H.C.; van Gaever, P.; Huy, H.; Schwalb, A. The hidden threat of heavy metal pollution in high sedimentation and highly dynamic environment: Assessment of metal accumulation rates in the Thi Vai Estuary, Southern Vietnam. Environ. Pollut. 2018, 242, 348–356. [Google Scholar] [CrossRef]
  11. Sanchez-Cabeza, J.A.; Ruiz-Fernández, A.C. 210Pb sediment radiochronology: An integrated formulation and classification of dating models. Geochim. Et Cosmochim. Acta 2012, 82, 183–200. [Google Scholar] [CrossRef]
  12. Robbins, J.A. Geochemical and geophysical applications of radioactive lead isotopes. Biochem. Lead Environ. 1978, 1978, 285–393. [Google Scholar]
  13. Robbins, J.A.; Edgington, D.N. Determination of recent sedimentation rates in Lake Michigan using Pb-210 and Cs-137. Geochim. Et Cosmochim. Acta 1975, 39, 285–304. [Google Scholar] [CrossRef] [Green Version]
  14. Crozaz, G.; Picciotto, E.; de Breuck, W. Antarctic snow chronology with Pb210. Geophys 1964, 69, 2597–2604. [Google Scholar] [CrossRef]
  15. Muller, G. Index of geoaccumulation in sediments of the Rhine River. Geojournal 1969, 2, 108–118. [Google Scholar]
  16. Hakanson, L. An ecological risk index for aquatic pollution control; a sedimentological approach. Water Res. 1980, 14, 975–1001. [Google Scholar] [CrossRef]
  17. Salomons, W.; Forstner, U. Metals in the Hydrocycle; Springer: Berlin/Heidelberg, Germany, 1984; pp. 79–84. [Google Scholar]
  18. Ramachandra, T.V.; Sudarshan, P.B.; Mahesh, M.K.; Vinay, S. Spatial patterns of heavy metal accumulation in sediments and macrophytes of Bellandur wetland, Bangalore. J. Environ. Manag. 2018, 206, 1204–1210. [Google Scholar] [CrossRef] [PubMed]
  19. Reimann, C.; Filzmoser, P.; Fabian, K.; Hron, K.; Birke, M.; Demetriades, A.; Dinelli, E.; Ladenberger, A.; The GEMAS Project Team. The concept of compositional data analysis in practice—Total major element concentrations in agricultural and grazing land soils of Europe. Sci. Total. Environ. 2012, 426, 166–210. [Google Scholar] [CrossRef] [PubMed]
  20. de Caritat, P.; Grunsky, E.C. Defining element associations and inferring geological processes from total element concentrations in Australian catchment outlet sediments: Multivariate analysis of continental-scale geochemical data. Appl. Geochem. 2013, 33, 104–126. [Google Scholar] [CrossRef]
  21. Mueller, U.A.; Grunsky, E.C. Multivariate spatial analysis of lake sediment geochemical data; Melville Peninsula, Nunavut, Canada. Appl. Geochem. 2016, 75, 247–262. [Google Scholar] [CrossRef]
  22. Yongming, H.; Peixuan, D.; Junji, C.; Posmentier, E.S. Multivariate analysis of heavy metal contamination in urban dusts of Xi’an, Central China. Sci. Total. Environ. 2006, 355, 176–186. [Google Scholar] [CrossRef]
  23. Wang, J.; Liu, R.; Zhang, P.; Yu, W.; Shen, Z.; Feng, C. Spatial variation, environmental assessment and source identification of heavy metals in sediments of the Yangtze River Estuary. Mar. Pollut. Bull. 2014, 1–2, 364–373. [Google Scholar] [CrossRef] [PubMed]
  24. Liu, J.J.; Ni, Z.X.; Diao, Z.H.; Hu, Y.X.; Xu, X.R. Contamination level, chemical fraction and ecological risk of heavy metals in sediments from Daya Bay, South Chixiuna Sea. Mar. Pollut. Bull. 2018, 128, 132–139. [Google Scholar] [CrossRef] [PubMed]
  25. Tepanosyan, G.; Sahakyan, L.; Belyaeva, O.; Maghakyan, N.; Saghatelyan, A. Human health risk assessment and riskiest heavy metal origin identification in urban soils of Yerevan, Armenia. Chemosphere 2017, 184, 1230–1240. [Google Scholar] [CrossRef] [PubMed]
  26. Wu, J.; Lu, J.; Li, L.; Min, X.; Luo, Y. Pollution, ecological-health risks, and sources of heavy metals in soil of the northeastern Qinghai-Tibet Plateau. Chemosphere 2018, 20, 12–34. [Google Scholar] [CrossRef] [PubMed]
  27. Rubio, B.; Nombela, M.A.; Vilas, F. Geochemistry of major and trace elements in sediments of the Ria de Vigo (NW Spain): An assessment of metal pollution. Mar. Pollut. Bull. 2000, 40, 968–980. [Google Scholar] [CrossRef]
  28. Xia, F.; Qu, L.; Wang, T.; Luo, L.; Chen, H.; Dahlgren, R.A.; Zhang, M.; Mei, K.; Huang, H. Distribution and source analysis of heavy metal pollutants in sediments of a rapid developing urban river system. Chemosphere 2018, 207, 218–228. [Google Scholar] [CrossRef] [PubMed] [Green Version]
  29. Adachi, K.; Tainosho, Y. Characterization of heavy metal particles embedded in tire dust. Environ. Int. 2004, 30, 1009–1017. [Google Scholar] [CrossRef]
  30. Hou, S.; Zheng, N.; Tang, L.; Ji, X.; Li, Y.; Hua, X. Pollution characteristics, sources, and health risk assessment of human exposure to Cu, Zn, Cd and Pb pollution in urban street dust across China between 2009 and 2018. Environ. Int. 2019, 128, 430–437. [Google Scholar] [CrossRef]
  31. Kar, D.; Sur, P.; Mandai, S.K.; Saha, T.; Kole, R.K. Assessment of heavy metal pollution in surface water. Int. J. Environ. Sci. Technol. 2008, 1, 119–124. [Google Scholar] [CrossRef]
  32. Rahman, Z.; Singh, V.P. Assessment of heavy metal contamination and Hg-resistant bacteria in surface water from different regions of Delhi, India. Saudi J. Biol. Sci. 2018, 25, 1687–1695. [Google Scholar] [CrossRef]
  33. Dahmani-Muller, H.; van Oort, F.; Gélie, B.; Balabane, M. Strategies of heavy metal uptake by three plant species growing near a metal smelter. Environ. Pollut. 2000, 109, 231–238. [Google Scholar] [CrossRef]
  34. Rai, P.K.; Lee, S.S.; Zhang, M.; Tsang, Y.F.; Kim, K. Heavy metals in food crops: Health risks, fate, mechanisms, and management. Environ. Int. 2019, 125, 365–385. [Google Scholar] [CrossRef] [PubMed]
  35. Du, Y.; Fan, Q.; Gao, D.; Wei, H.; Shan, F.; Li, B.; Zhang, X.; Yuan, Q.; Qin, Z.; Ren, Q. Evaluation of boron isotopes in halite as an indicator of the salinity of Qarhan paleolake water in the eastern Qaidam Basin, western China. Geosci. Front. 2019, 1, 253–262. [Google Scholar] [CrossRef]
  36. Wang, P.; Cao, J.; Han, Y.; Jin, Z.; Wu, F.; Zhang, F. Elemental distribution in the topsoil of the Lake Qinghai catchment, NE Tibetan Plateau, and the implications for weathering in semi-arid areas. J. Geochem. Explor. 2015, 152, 1–9. [Google Scholar] [CrossRef]
  37. Li, L.; Wu, J.; Lu, J.; Min, X.; Xu, J.; Yang, L. Distribution, pollution, bioaccumulation, and ecological risks of trace elements in soils of the northeastern Qinghai-Tibet Plateau. Ecotoxicol. Environ. Saf. 2018, 166, 345–353. [Google Scholar] [CrossRef]
  38. Wang, J.L. Using Multi-Tracers Technique to Understand the Transport of Sediment in the East China Sea. Ph.D. Thesis, East China Normal Univerisity, Shanghai, China, 2016. [Google Scholar]
  39. Liu, W.X.; Li, X.D.; Shen, Z.G.; Wang, D.C.; Wai, O.W.H.; Li, Y.S. Multivariate statistical study of heavy metal enrichment in sediments of the Pearl River Estuary. Environ. Pollut. 2003, 121, 377–388. [Google Scholar] [CrossRef]
  40. Loska, K.; Wiechula, D. Application of principal component analysis for the estimation of source of heavy metal contamination in surface sediments from the Rybnik Reservoir. Chemosphere 2003, 51, 723–733. [Google Scholar] [CrossRef]
  41. Kaiser, H.F. The application of electronic computers to factor analysis. Educ. Psychol. Meas. 1960, 1, 141–151. [Google Scholar] [CrossRef]
  42. Facchinelli, A.; Sacchi, E.; Mallen, L. Multivariate statistical and GIS-based approach to identify heavy metal sources in soils. Environ. Pollut. 2001, 114, 313–324. [Google Scholar] [CrossRef]
  43. Abrahim, G.M.S.; Parker, R.J. Assessment of heavy metal enrichment factors and the degree of contamination in marine sediments from Tamaki Estuary, Auckland, New Zealand. Environ. Monit. Assess. 2008, 136, 227–238. [Google Scholar] [CrossRef]
  44. Turekian, K.K.; Wedepohl, K.H. Distribution of the elements in some major units of the earth’s crust. Geol. Soc. Am. Bull. 1961, 72, 175. [Google Scholar] [CrossRef]
  45. Taylor, S.R. Abundance of chemical elements in the continental crust: A new table. Geochim. Et Cosmochim. Acta 1964, 28, 1273–1285. [Google Scholar] [CrossRef]
  46. Chester, R.; Stoner, J.H. Pb in Particulates from the lower atmosphere of the Eastern Atlantic. Nature 1973, 245, 27–28. [Google Scholar] [CrossRef]
  47. Sakan, S.M.; Djordjevic, D.S.; Manojlovic, D.D.; Polic, P.S. Assessment of heavy metal pollutants accumulation in the Tisza river sediments. J. of Environmental Management 2009, 90, 3382–3390. [Google Scholar] [CrossRef] [PubMed]
  48. Abrahim, G.M.S. Holocene Sediments of Tamaki Estuary: Characterisation and Impact of Recent Human Activity on an Urban Estuary in Auckland, New Zealand. Ph.D. Thesis, The University of Auckland, Auckland, New Zealand, 2005. [Google Scholar]
  49. Shukla, B.S.; Joshi, S.R. An evaluation of the CIC model of 210Pb dating of sediments. Environ. Geol. Water Sci. 1989, 14, 73–76. [Google Scholar] [CrossRef]
  50. Hernández-Crespo, C.; Martin, M. Determination of background levels and pollution assessment for seven metals (Cd, Cu, Ni, Pb, Zn, Fe, Mn) in sediments of a Mediterranean coastal lagoon. Catena 2015, 133, 206–214. [Google Scholar] [CrossRef]
  51. Zhang, Z.Y.; Abuduwaili, J.; Jinag, F.Q. Sources, pollution statue and potential ecological risk of heavy metals in surface sediments of Aibi Lake. Northwest China Env. 2015, 2, 490–496. [Google Scholar]
  52. Rodríguez-Seijo, A.; Arenas-Lago, D.; Andrade, M.L.; Vega, F.A. Identifying sources of Pb pollution in urban soils by means of MC-ICP-MS and TOF-SIMS. Environ. Sci. Pollut. Res. 2015, 22, 7859–7872. [Google Scholar] [CrossRef]
  53. Sinha, S.; Singh, K.P.; Malik, A.; Mohan, D. Multivariate statistical techniques for the evaluation of spatial and temporal variations in water quality of Gomti River (India): A case study. Water Res. J. Int. Water Assoc. 2004, 38, 3980–3992. [Google Scholar]
  54. Varol, M. Assessment of heavy metal contamination in sediments of the Tigris River (Turkey) using pollution indices and multivariate statistical techniques. J. Hazard. Mater. 2011, 195, 355–364. [Google Scholar] [CrossRef]
  55. Li, C.; Yu, H.; Tabassum, S.; Li, L.; Wu, D.; Zhang, Z.; Kong, H.; Xu, P. Effect of calcium silicate hydrates (CSH) on phosphorus immobilization and speciation in shallow lake sediment. Chem. Eng. J. 2017, 317, 844–853. [Google Scholar] [CrossRef]
  56. Costa, M. Potential hazards of hexavalent chromate in our drinking water. Toxicol. Appl. Pharmacol. 2003, 188, 1–5. [Google Scholar] [CrossRef]
  57. Baudo, R.; Barbero, P.; Beltrami, M.; Rossi, D. Chemical composition of the sediment from Lake 20 (Antarctica). J. Limnol. 2000, 59, 55–60. [Google Scholar] [CrossRef]
  58. Swarazenski, P.W.; Baskaran, M.; Rosenbauer, R.J.; Orem, W.H. Histrorical trace element distribution in sediments from the Mississippi River delta. Estuaries Coasts 2006, 29, 1094–1107. [Google Scholar] [CrossRef]
  59. Wang, Q.Q.; Sha, Z.J.; Wang, J.J.; Du, J.Z.; Hu, J.F.; Ma, Y.J. Historical changes in the major and trace elements in the sedimentary records of Lake Qinghai, Qinghai-Tibet Plateau: Implications for anthropogenic activities. Environ. Geochem. Health 2009, 2009, 1–19. [Google Scholar] [CrossRef] [PubMed]
  60. Álvarez-Iglesias, P.; Rubio, B.; Millos, J. Isotopic identification of natural vs. anthropogenic lead sources in marine sediments from the inner Ría de Vigo (NW Spain). Sci. Total. Environ. 2012, 437, 22–35. [Google Scholar] [CrossRef] [PubMed]
  61. Li, H.B.; Yu, S.; Li, G.L.; Deng, H. Lead contanmination and source in Shanghai in the past century using dated sediment cores from urban park lakes. Chemosphere 2012, 88, 1161–1169. [Google Scholar] [CrossRef]
  62. Moulis, J.M.; Frank, T. New perspectives in cadmium toxicity: An introduction. Biometals 2010, 23, 763–768. [Google Scholar] [CrossRef]
  63. Varol, M. Temporal and spatial dynamics of nitrogen and phosphorus in surface water and sediments of a transboundary river located in the semi-arid region of Turkey. Catena 2013, 100, 1–9. [Google Scholar] [CrossRef]
  64. Carmen, H.C.; Miguel, M. Mid-term variation of vertical distribution of acid volatile sulphide and simultaneously extracted metals in sediment cores from Lake Albufera (Valencia, Spain). Arch. Environ. Contam. Toxicol. 2013, 65, 654–664. [Google Scholar]
  65. Maanan, M.; Zourarah, B.; Carruesco, C.; Aajjane, A.; Naud, J. The distribution of heavy metals in the Sidi Moussa lagoon sediments (Atlantic Moroccan Coast). J. Afr. Earth Sci. 2004, 39, 473–483. [Google Scholar] [CrossRef]
  66. Muller, J.; Wüst, R.A.J.; Weiss, D.; Hu, Y. Geochemical and stratigraphic evidence of environmental change at Lynch’s Crater, Queensland, Australia. Glob. Planet. Chang. 2006, 53, 269–277. [Google Scholar] [CrossRef]
  67. Haixi Statistical Bureau. The Statistical Yearbook of Haibei State of Qinghai Province 1975–2017; Haixi Statistical Bureau: Haixi, China. (In Chinese)
  68. Wang, Q.Q. Sedimentary Environmental Record over Past Hundred Years and Effected by the Anthropogenic Activity of Lake Qinghai, China. Ph.D. Thesis, Qinghai Institute of Salt Lakes, Chinese Academy of Science, Xining, China, 2019. [Google Scholar]
Figure 1. Location of the sampling site (modified from Du et al. [35]).
Minerals 09 00506 g001
Figure 2. Vertical variation of 226Ra activity and 210Pbex activity with depth in the ZH-4 core.
Minerals 09 00506 g002
Figure 3. The vertical distribution of the elements of (a) Al, (b) As, (c) Cd, (d) Cr, (e) Cu, (f) Ni, (g) P, (h) Pb, and (i) Zn.
Minerals 09 00506 g003
Figure 4. Loading Plots of the two PCs obtained for the data set.
Minerals 09 00506 g004
Figure 5. Dendrogram showing clustering of the targeted nine potentially toxic elements.
Minerals 09 00506 g005
Figure 6. The values of the environmental factor (EF)Cd and EFP changed with chronology.
Minerals 09 00506 g006
Figure 7. The gross domestic product of Haixi state, gross industrial production of Haixi state, and gross industrial production of Qinghai Salt Lake Industry Group Co. [67].
Minerals 09 00506 g007
Table 1. The basic statistical parameters of element concentrations in the core ZH4 (n = 20).
ElementMean (µg/g)Range (µg/g)CV (%)
Al58.750.5–70.08.69
As16.7313.10–21.8012.01
Cd0.090.06–0.1217.37
Cr41.8034.00–52.0012.85
Cu21.6115.90–27.6013.51
Ni23.8218.90–30.4012.48
P684.00580.00–770.006.41
Pb16.8514.20–19.706.96
Zn56.8543.00–73.0012.95
CV: Coefficient of Variance.
Table 2. The factor loadings of components and that after rotated 1.
ElementComponent MatrixRotated Component Matrix
PC1PC2PC1PC2
Al0.983−0.1060.8890.432
As0.828−0.3600.8930.135
Cd0.6750.5280.2910.806
Cr0.9630.1690.7260.655
Cu0.974−0.1100.8840.424
Ni0.973−0.1530.9050.387
P0.6520.6310.2160.881
Pb0.906−0.2800.9170.244
Zn0.971−0.0180.8320.501
1 Extraction method: Principal Component Analysis. Rotation method: Varimax with Kaiser normalization.
Table 3. Pearson correlation matrix for the metal concentrations.
ElementAsCdCrCuNiPPbZn
Al0.858 **0.646 **0.925 **0.965 **0.965 **0.542 *0.911 **0.947 **
As0.4250.709 **0.791 **0.844 **0.3290.772 **0.774 **
Cd0.694 **0.576 **0.561 *0.579 **0.4330.617 **
Cr0.935 **0.918 **0.740 **0.807 **0.941 **
Cu0.982 **0.562 **0.920 **0.940 **
Ni0.541 *0.910 **0.937 **
P0.4390.626 **
Pb0.901 **
** correlation is significant at P < 0.05 (2-tailed), * correlation is significant at P < 0.01 (2-tailed).
Table 4. The basic statistical parameters of the modified degree of contamination (mCd) and potential ecological risk index (RI).
IndexMin.Max.MedianCV (%)
mCd0.961.401.1310.27
RI51.4083.3867.6312.72

